Page 1
- 1 -
Bank Capital, Liquidity Creation and Deposit
Insurance1
Zuzana Fungáčováa, Laurent Weill
b, , Mingming Zhou
c
a Bank of Finland − Institute for Economies in Transition (BOFIT), Helsinki, Finland b University of Strasbourg & EM Strasbourg Business School, Strasbourg, France
c College of Business and Administration, University of Colorado at Colorado Springs, CO 80918, USA
Current Version: September, 2010
Abstract
This paper examines how the introduction of deposit insurance influences the relationship
between bank capital and liquidity creation. As discussed by Berger and Bouwman (2009),
there are two competing hypotheses on this relationship which can be influenced by the
presence of deposit insurance. The introduction of a deposit insurance scheme in an emerging
market, Russia, provides a natural experiment to investigate this issue. We study three
alternative measures of bank liquidity creation and perform estimations on a large set of
Russian banks. Our findings suggest that the introduction of the deposit insurance scheme
exerts a limited impact on the relationship between bank capital and liquidity creation and does
not change the negative sign of the relationship. The implication is that better capitalized banks
tend to create less liquidity, which supports the “financial fragility/crowding-out” hypothesis.
This conclusion has important policy implications for emerging countries as it suggests that
bank capital requirements implemented to support financial stability may harm liquidity
creation.
JEL classification: G21; G28; G38; P30; P50
Keywords: Bank Capital, Liquidity Creation, Deposit Insurance, Russia
1 We are grateful to Veronika Belousova and Alexei Karas for their valuable comments and suggestions.
Email addresses: [email protected] (Z. Fungáčová), [email protected] (L. Weill),
[email protected] (M. Zhou).
Page 2
- 2 -
1. Introduction
The recent financial crisis provides a stark reminder of the substantial role banks play
in liquidity creation. Yet, while the literature deals extensively with banks as risk
transformers, their function in liquidity creation has largely been neglected.2 A recent
paper by Berger and Bouwman (2009) attempts to correct this situation by offering a
new method for measuring liquidity created by banks and investigating the role of bank
capital in liquidity creation for US banks. This issue is of great interest, particularly
with respect to policy in setting of bank capital requirements. The role of capital in
minimizing the impact of losses has received considerable attention. However, how
bank capital impacts liquidity creation should also be taken into account when
assessing the role of capital on financial stability.
Berger and Bouwman (2009) observe that two hypotheses largely frame the
current discussion of the relationship between bank capital and liquidity creation. The
“risk absorption” hypothesis predicts that higher capital enhances the ability of banks to
create liquidity. This hypothesis comes out of two strands of literature dealing with the
role of banks as risk transformers. Liquidity creation increases the bank’s exposure to
risk as its losses increase with the level of illiquid assets to satisfy the liquidity
demands of customers (e.g. Allen and Gale, 2004), while bank capital allows the bank
to absorb greater risk (e.g. Repullo, 2004).
In contrast, the “financial fragility/crowding-out” hypothesis predicts that greater
capital hampers liquidity creation. This hypothesis brings together two distinct effects:
a higher capital ratio crowds out deposits, thereby reducing liquidity creation, while
financial fragility, characterized by lower capital, tends to favor liquidity creation
(Diamond and Rajan, 2000, 2001).
Roughly described, the financial fragility effect is the outcome of a following
process. The bank collects funds from depositors and lends them to borrowers. Once
the loan is issued, the bank’s job is to monitor the borrower and collect loan payments.
This helps the bank obtain private information on its borrowers that gives it an
advantage in assessing the profitability of its borrowers. This informational advantage,
however, creates an agency problem, whereby the bank may be tempted to extort rents
2 According to standard liquidity creation theory, a bank creates liquidity by transforming illiquid assets
into liquid liabilities. Diamond and Rajan (2000) however point out that liquidity is also created by
simply changing banks’ funding mix on their liability side. Berger and Bouwman (2009) consider
changes in the mixes on both sides of banks’ balance sheets and also off-balance sheet activities.
Page 3
- 3 -
from its depositors by demanding a greater share of the loan income. If depositors
refuse to pay the higher costs, the bank threatens to curtail its monitoring or loan
collecting efforts. As depositors know that the bank may abuse their trust, they become
leery about depositing their money with the bank. The bank is thus forced to
demonstrate its commitment to depositors by adopting a fragile financial structure with
a large share of liquid deposits. The consequence of this fragile financial structure is
that the bank runs the risk of losing funding if it attempts to withhold depositors. As
such, the threat of bank runs mitigates the holdup problem which arises after depositors
have put their funds to the bank. Consequently, by allowing the bank to receive more
deposits and finance more loans, financial fragility favors liquidity creation. As greater
capital reduces financial fragility, it enhances the bargaining power of the bank and
hampers the credibility of its commitment to the depositors. Thus, greater capital works
to diminish liquidity creation.
A key issue here is how a deposit insurance scheme might influence this
relationship. With deposit insurance, depositors have no incentive to withdraw their
money, so deposit contracts do nothing to mitigate the holdup problem. As a result,
greater capital does not reduce liquidity creation.
Our aim is to probe the relationship between bank capital and liquidity creation
by analyzing how introduction of a deposit insurance scheme influences this linkage.
We examine the case of Russia as it provides a unique natural experiment to investigate
this issue. Russia implemented its deposit insurance scheme in 2004.
This study contributes to research investigating how bank capital influences
financial stability and also sheds light on some of the neglected effects of deposit
insurance schemes. The detrimental incentives for moral hazard behavior for banks
promoted through deposit insurance schemes are well understood (e.g. Demirgüc-Kunt
and Detragiache, 2002), but we only vaguely grasp how implementation of a deposit
insurance scheme might contribute to the reduction of the negative link between bank
capital and liquidity creation in ways that promote the benefits of bank capital for the
economy. Of course, bank regulators frequently look to see how well banks are meeting
their capital requirements as it is received dictum that bank capital contributes to
financial stability. What they may ignore is the fact that capital requirements might also
be detrimental for liquidity creation as the negative effects of bank capital on liquidity
creation can overwhelm the benefits in some instances. The introduction of deposit
insurance scheme may reduce the negative effects, solving the dilemma for
Page 4
- 4 -
policymakers in favor of financial stability through higher bank capital or liquidity
creation with lower bank capital.
This analysis also contributes to the literature on liquidity creation by banks. We
provide the first investigation of the role bank capital plays in liquidity creation in
emerging markets, which contributes to a better understanding of financial stability in
emerging countries and the implications of bank capital requirements there. We also
consider whether the relationship between bank capital and liquidity creation differs
depending on the form of bank ownership. Berger and Bouwman (2009) show that this
relationship may vary depending on the size of the bank as the underlying arguments
may play different roles depending on the type of bank. In the same vein, we ask
whether private or foreign ownership influences this relationship. As major debates
about the banking industry in emerging economies focus on the benefits of
privatization and the presence of foreign investors, we examine how ownership
interacts with bank capital and liquidity creation in Russia. Russia’s banking sector is
characterized by the coexistence of three types of banks (state-controlled banks,
domestic private banks, and foreign-owned banks), which provides a broad spectrum of
ownership arrangements to investigate.
We use a rich panel dataset on all banks in Russia covering the periods before
and after the introduction of the deposit insurance scheme. Following Berger and
Bouwman (2009), we measure liquidity created by Russian banks by classifying all
bank assets and liabilities as liquid, semi-liquid or illiquid. We then assign weights to
these categories and compute the amount of liquidity created by each bank.
Our empirical strategy is based on two complementary methodologies. First, we
adopt the difference-in-difference approach to analyze the impact of the deposit
insurance scheme on the relationship between bank capital and liquidity creation. This
approach controls for the changing economic conditions. We apply it by using a unique
feature of deposit insurance in Russia: the implicit deposit insurance of state-controlled
banks during the entire observation period. We thus assume that state-controlled banks
were unaffected by the deposit insurance scheme and compare changes in liquidity
creation around the time of deposit insurance introduction for banks affected by the
scheme against changes for state-controlled banks, which had essentially enjoyed
implied deposit insurance earlier. Second, we test whether the nature of the relationship
between bank capital and liquidity creation changes with the implementation of the
deposit insurance scheme. Regressing liquidity creation measures on bank capital
Page 5
- 5 -
before and after its implementation allows us to check whether the introduction of the
deposit insurance scheme contributed to change in the sign of this relationship. We
report the sign of this relationship for all banks in Russia, accounting in terms of both
bank ownership and size.
The remainder of the paper is structured as follows. In section 2, we present data
and liquidity creation measures. Section 3 describes the difference-in-difference
approach and section 4 presents the separate regressions before and after the
implementation of the deposit insurance scheme. We conclude in section 5.
2. Data and Measures
2.1 Data
Our main dataset consists of the quarterly balance sheet and income statement
information of Russian banks provided by the financial information agency Interfax,
which collects and organizes this data from the Central Bank of Russia (CBR).3 The
original data feature an unbalanced panel containing over 41,000 bank-quarter
observations for 1,593 credit institutions from the first quarter of 1999 to the first
quarter of 2007. To make sure our tests are based on deposit-taking banking institutions
only, we drop observations that fulfill at least one of the following criteria. First, we
exclude observations where the average total-loans-to-total-assets ratio is less than or
equal to 5%. Second, we drop those observations where the sum of deposits equals
zero. Third, the capital-to-assets ratio should not be larger than 100%. To avoid the
potential distortion of the results by deeply financial troubled banks or banks that have
had their licenses pulled by Russian regulators, we further drop the observations that
show a capital-to-assets ratio less than or equal to 2%.4 Finally, since banks that were
not admitted to the deposit insurance scheme are prohibited from collecting household
deposits, we only consider banks participating in the scheme in our analysis.
In our estimations, we use information on bank branches by regions collected from
the CBR website. Regional data come from the Russian Federal State Statistics Service
(Rosstat). Table 1 provides descriptive statistics for all the variables used.
Foreign-owned banks are defined based on the CBR data as those with foreign
ownership shares in excess of 50%. State-controlled banks are identified using the
3 For a more detailed description of the dataset, see Karas and Schoors (2005).
4 Russian regulations require withdrawal of a bank’s license if its capital ratio falls below 2%.
Page 6
- 6 -
classification by Vernikov (2009). These include banks owned by the government or
central bank, as well as banks owned by state-controlled companies. In addition to
ownership type, we also classify banks by size. Large, or systemic, banks are those
ranked 1−50 in terms of total assets. Following the CBR, banks ranked 51−200 in terms
of total assets are classed as medium-sized banks. The remaining small banks on
average accounted for about 10% of banking sector assets during our observation
period.
2.2 Measures of bank liquidity creation
Berger and Bouwman (2009) provide a detailed description of measuring bank liquidity
creation based on the US bank financial statement data. Following their methodology,
we construct the liquidity creation measures for Russian banks with the necessary
customization based on Russian financial data.
We start by classifying balance sheet items as liquid, semi-liquid, or illiquid. This
applies to all itemized terms for assets, liabilities, and equity.5 We then assign weights
to all the items, and calculate the measures of liquidity creation. Below we give our
three measures of liquidity creation and describe in detail how we classify financial
items based on liquidity.
The functional form of measuring liquidity creation (eq. 1) remains the same
throughout the paper while the definitions of each of the right-hand-side terms in the
equation change for different measures.
Liquidity Creation (LC)
= { ½ × illiquid assets + 0 × semi-liquid assets – ½ × liquid assets } +
+ { ½ × liquid liabilities + 0 × semi-liquid liabilities – ½ × illiquid liabilities } (1)
We construct three measures of liquidity creation. The first is a gross measure
meant to provide an overall picture of liquidity creation. The second is based on
category classification of balance sheet items. The last is a liquidity measure based on
maturity (see Appendix for detailed description of items used here to calculate the
liquidity creation measures).
5 We do not consider off-balance sheet activities; they were not significant for most of the investigated
period.
Page 7
- 7 -
The first liquidity creation measure (LC1), a gross indicator in line with Deep and
Schaefer (2004), has the advantage of less strict assumptions than our other two
indicators. We do not use detailed category or maturity classification of different
balance sheet items here. The underlying assumption in LC1 calculation is that we
account for the most important categories of assets and liabilities that might be classed
liquid or illiquid. Total deposits are regarded as liquid liabilities and equity as illiquid
liabilities. On the asset side, we assume total loans are illiquid assets and current
account and securities investment are liquid assets.
As noted, the risk of not imposing a sufficient number of assumptions in
specification of each balance sheet item in LC1 is that we might lose our chance at
creating a clear picture of how banks in our sample create liquidity across time or
cross-sectionally if the structure within each gross term makes a difference. To capture
such differences and achieve better precision, we closely inspect different items within
broad categories in terms of their liquidity assumptions. From this, we construct our
second measure of liquidity creation (LC2), which is based on category classification of
balance sheet items. In defining different categories of liquid, semi-liquid, and illiquid
assets and liabilities we follow the classification of Berger and Bouwman (2009) based
on the ease, cost, and time necessary for banks to turn their obligations into liquid
funds, and the ease, cost, and time customers need to withdraw liquid funds from their
bank. We also take country-specific issues into account.
The liquid assets category in liquidity creation measure LC2 consists of (a)
correspondent account with other banks (i.e. central bank, domestic, and foreign banks)
(b) investments in government securities, and (c) investments in promissory notes.
Investments in non-government securities are not included as their values were quite
low for most of the observation period. The selection of such instruments was rather
limited and Russia’s capital markets were still not liquid. Moreover, banks had little
incentive to hold these securities as, unlike government securities, it was not possible to
use them as collateral when borrowing from the CBR.
In classification of loans, we follow the literature and classify corporate loans as
illiquid assets as banks generally lack the option of selling them to meet their liquidity
needs. The other categories of loans that include consumer loans, loans to government
and interbank loans are classified as semi-liquid assets. Due to the fact that mortgage
loans started to emerge in Russia only in recent years, the majority of consumer loans
are short-term loans used to buy consumer goods. Thus, even though securitization of
Page 8
- 8 -
loans is still rare in Russia, we can classify consumer loans as semi-liquid by applying
the rule that items with shorter maturity tend to be more liquid than longer term items.
Finally, we calculate other assets by subtracting all loans and liquid assets from the
total assets. Other assets include fixed assets, which we classify as illiquid.
On the liability side, we distinguish between two types of claims of the non-
banking sector. The first category includes the settlement accounts of different clients:
domestic and foreign firms, government and households. These are classified as liquid
as they can be quickly withdrawn by customers without penalty. The same holds true
for the claims of banks, so they also fall into the liquid liabilities category. The second
category of claims of non-banking sector contains term deposits. Since their withdrawal
is in general more difficult and costly, we consider them to be semi-liquid.
Debt securities issued by banks include promissory notes, deposit and saving
certificates, and bonds. Russia has liquid markets for promissory notes, the most
significant of these instruments, so we classify promissory notes as liquid liabilities.
Deposit and saving certificates and bonds have gained importance only in the recent
years. During our sample period, their issuance was not significant and the markets for
these instruments were just emerging. For this reason, these securities are categorized
as semi-liquid liabilities.
Following the same logic as on the side of assets, we calculate other liabilities by
subtracting all of the above mentioned claims of banks and non-banking sector and the
amount of debt securities issued by a bank from total liabilities. Other liabilities such as
bank capital are considered illiquid liabilities.
In general, the category-based measure of liquidity creation (LC2) can be expected
to be reasonably accurate under the assumption that the categories of assets and
liabilities outlined above are good indicators of the liquidity of bank activities. Based
on a careful examination of the balance sheet information of all the Russian banks in
the sample, however, we find a more detailed breakdown reporting based on maturity
for some items. Such maturity-based information provides us with important additional
information to define the liquidity creation in a more precise manner. Furthermore,
Berger and Bouwman (2009) conclude that maturity-based liquidity creation measures
are better.
We use the maturity information to construct our third liquidity creation measure
(LC3). On the asset side, we only have available the data on maturity of interbank
loans. Thus, the classification of assets is similar to the one we employ for the second
Page 9
- 9 -
liquidity creation measure. However, all interbank loans are not included in the semi-
liquid category anymore. Part of them, that has maturity lower than one week, is
considered in the category of liquid assets. Interbank loans with maturity higher than
one year together with nonperforming interbank loans are classified as illiquid. The rest
of interbank loans belong to semi-liquid assets.
Classification of liabilities for the LC3 calculation is solely based on maturity. We
apply the general principle, whereby items that have shorter maturity are more liquid as
they self-liquidate sooner. Term deposits and debt securities that have maturities
shorter than 90 days are classified as liquid liabilities. We consider current and
correspondent accounts to be liquid liabilities as well. Liabilities with maturity between
90 days and one year belong to the semi-liquid category. Finally, liabilities that have
maturities over one year, overdue liabilities, and liabilities with uncertain terms to
maturity are classified as illiquid. Again, similar to the category liquidity creation
measure LC2, bank capital is treated as illiquid.
We consider liquidity creation measures normalized to total assets to make them
comparable across banks and to avoid giving excessive weight to large banks.
2.3 Other variables
Explanatory variables that we use in the estimations can be divided into two groups.
The first contains bank-specific variables, while the second consists of variables
describing local market economic environment. The most important explanatory
variable here is the capital-assets ratio (CAP), defined as the ratio of capital to total
assets. This variable helps us uncover the relationship between bank capital and bank
liquidity creation.
At the bank’s level, we control for bank size and bank risk. Size is taken into
account by using the variable logarithm of total assets. We also split the sample into
three subsamples based on the size (large, medium, and small banks) to examine
differences in the relationship of bank liquidity creation and bank capital.
We use nonperforming loans ratio, defined as the total amount of nonperforming
loans divided by total assets, to control for bank risk. As argued under the “risk
absorption” hypothesis (e.g. Bhattacharya and Thakor 1993, Repullo 2004, Von
Thadden 2004, Coval and Thakor 2005), it is important to appropriately control for
bank risk as the main reason for banks to hold capital is to be able to absorb risk.
Page 10
- 10 -
Further, Berger and Bouwman (2009) suggest that inclusion of risk measures in the
analysis could help isolate the role of capital in the liquidity creation function from its
role in supporting risk transformation functions of banks. We follow the standard
practice in the literature of entering one risk measure at a time in the regressions (see
e.g. Acharya, Bharath and Srinivasan, 2007).6
The second group of control variables takes into account the local economic
environment of a bank. We include a Herfindahl index (HFDL) based on banking
assets to control for local market competition. The local market is defined as the region
where bank headquarters and/or branches are located. Given that we do not have
information regarding the assets or loans or deposits associated with each branch of the
banks, we assume that a bank’s assets are equally distributed across its branches (we
thus treat the headquarters as a branch). We use distribution of branch offices as a
proxy for banking output by region when calculating the Herfindahl index for a given
region. The Herfindahl index for a bank here measures the concentration of the markets
in which the bank operates, using as weights the distribution of its branch networks in
the regions. Concentration can influence liquidity creation as it notably influences the
availability of credit (Beck, Demirgüc-Kunt and Maksimovic, 2004). We also control
for other aspects of the local market by including the Household income growth and
Small business growth in our estimations.7 Both variables account for trends in the
macroeconomic environment.
3. Difference-in-difference estimations
3.1 Methodology
We apply the difference-in-difference approach to control for the changing economic
conditions that might coincide with the implementation of deposit insurance. This
approach enables us to exploit a unique feature of deposit insurance in Russia; i.e. even
if deposit insurance was intended to cover all deposit-taking banks, state-controlled
banks enjoyed an umbrella of implicit deposit insurance throughout the whole
6 In addition to the non-performing loans ratio, we also use loan loss provisions, volatility of returns and
Z-score to account for risk. 7 Household income is defined as regional household income per capita and small enterprise business
variable is calculated as number of small and medium-sized enterprises (SMEs) in a given region
multiplied by the average number of employees SMEs have in that region. Both household income
growth and small business growth variables are calculated as weighted averages of regions in which a
bank has its operations. We use weights based on the distribution of branch offices in regions.
Page 11
- 11 -
observation period. Therefore, state-controlled banks can be considered as the control
group in this study. To infer the effect of deposit insurance on the bank-level liquidity
creation, we simply compare changes in liquidity creation around the time of deposit
insurance introduction for banks affected by the scheme (treatment group) to changes
for banks unaffected by the scheme (control group). The difference-in-difference
approach, of course, does not provide information about the change in the sign of the
relationship between bank capital and liquidity creation, which is key to answering our
main research question. What it does provide is information about the change in the
magnitude of this relationship.
The fixed effects panel-data estimators allow for heterogeneity across panel units,
and produce consistent and efficient estimators as long as the unobserved time-
invariant individual effects are not strictly orthogonal to the regressors in the
regression. However, if the observed association between the treatment dummy
variable (deposit insurance) and the dependent variable (liquidity creation) is driven by
other incidents occurring at the time of treatment, they could lead to biased results. To
control for this potential problem, we use a difference-in-difference approach which
compares the difference between the treatment group and the control group in their
changes of before and after the implementation of deposit insurance. This provides
results that are robust to the potential bias that the observed effect of the deposit
insurance implementation on liquidity creation was contaminated by some other
concurrent or temporal policy shift.
For a simple illustration of our methodology, consider two banks in Russia. One
belongs to the treatment group (i.e. enrolled in the deposit insurance in 2004), and the
other belongs to the control group (i.e. covered by implicit deposit insurance during the
entire period). Implementation of the deposit insurance scheme in 2004 enables us to
compare the changes in the outcomes for these two banks. Since both the treatment
group and control group banks are chartered in Russia, they are affected by roughly
similar economic, regulatory and political shocks, but only banks in the treatment
group are affected by the change in the deposit insurance implementation. Hence, we
can control for any economic, business, or regulatory factors that may have coincided
with or led to the initiatives of deposit insurance scheme.
We estimate the following model:
Page 12
- 12 -
tiititiiti capitaltreatmentsizecapitaltreatmenty ,,,,
tititii zsizetreatment ,,, (2)
where ∆yi,t measures the changes in the bank-level liquidity creation to assets
(LC/assets) after the deposit insurance was implemented from its level prior to the
implementation. We define 2004 as the implementation year. The last quarter before
2004 is denoted as Q-1, and the first quarter after year 2004 is denoted as Q+1, and so
on. Given that it might have taken some time before the banks adjusted their balance
sheet and operating activities to the deposit insurance, we omit 2004 and the three
quarters around 2004 in the estimation and extend the event window to eight quarters
before and after 2004.8 Treatment is a dummy variable that equals 1 if the bank was
enrolled in the deposit insurance scheme in 2004, and 0 if the bank was state-controlled
throughout our sample period. ∆capitali,t and ∆sizei,t are defined as the changes in the
capital-to-assets ratio, and the changes in bank size after the deposit insurance from its
level before the deposit insurance was implemented, respectively. All control variables
are defined as the changes over the same period.
In equation (2), β captures the differences in the mean levels of increases (or
decreases) of liquidity creation after deposit insurance from its previous level between
the treatment group and the control group. γ measures the average differences in
changes of the effects of capital ratio (δ for bank size) on the liquidity creation for all
the banks after the deposit insurance was implemented.
Two interaction terms are included, namely, interactions between treatment
dummy variable and changes in capital ratio, and treatment dummy variable and
changes in bank size. calibrates the mean differences in changes of the effects of
capital ratio on the liquidity creation for the banks after the deposit insurance between
the treatment group and the control group. If the estimations of equation (2) yield
positive it suggests that the effects of capital ratio (bank size) on liquidity creation
increase more (or decrease less) after the deposit insurance was implemented,
compared to the banks that do not receive the treatment of deposit insurance, and vice
versa. Similarly, informs on the mean differences in changes of the effects of bank
size.
8 Therefore, we include Q-8, Q-7, Q-6, Q-5, Q-4, Q+4, Q+5, Q+6, Q+7, Q+8. Our robustness tests that are based
on alternative windows show qualitatively similar results. The results are available upon request.
Page 13
- 13 -
We are also curious whether the impact of deposit insurance treatment on the
effects of the capital ratio on liquidity creation depends on bank size. To answer this,
we test the following model:
tiititiiti capitaltreatmentsizecapitaltreatmenty ,,,,
titititiitii zsizecapitaltreatmentsizetreatment ,,,,, (3)
In equation (3), η is the coefficient of three-way interaction terms between
treatment dummy variable, changes in capital ratio, and changes in bank size. A
positive η would indicate that with the increase of bank size, on average, the effects of
capital ratio on liquidity creation of treatment group banks increased after the deposit
insurance was implemented relative to the control group banks.
3.2 Results
The results of difference-in-difference estimations are presented in Table 2. Within
each measure of liquidity creation, two models are used based on equations (2) and (3).
We note that the coefficients on the interactions between treatment dummy and
difference in capital ratio are positive in all estimations, as well as significant for the
LC2/assets measure. These findings provide limited evidence that the impact of capital
ratio on liquidity creation is less negative for banks participating in the deposit
insurance program after it was implemented relative to banks in our control group.
Furthermore, the coefficients on the three-way interaction term between treatment
dummy variable, difference in capital ratio, and difference in bank size are positive and
significant, except when LC1/assets is used. After taking out the effects of other
contemporary variables on liquidity creation, we are left with an implication that
changes in the effects of capital ratio on liquidity creation after the deposit insurance
implementation are positively and linearly associated with bank size.
Thus, we find limited evidence confirming that the impact of capital ratio on
liquidity creation grows stronger with the implementation of the deposit insurance
scheme. Nevertheless, the difference-in-difference approach does not uncover whether
the sign of the relationship between bank capital and liquidity creation changes after the
introduction of deposit insurance scheme. This information is necessary to analyze the
implications of deposit insurance implementation in terms of financial stability.
Page 14
- 14 -
4. Separate Estimations
4.1 Methodology
The difference-in-difference approach provides evidence as to whether the introduction
of the deposit insurance scheme impacts the relationship between bank capital and
liquidity creation. We are however interested in the sign of this relationship and
whether it changes after the introduction of deposit insurance. We also want to see how
this sign varies with ownership and size. Indeed, key banking policy questions in
emerging countries concern foreign bank entry and the privatization of banks, as well
as the consolidation of the banking industry through mergers and acquisitions.
Therefore, it is reasonable to ask whether such policies influence the impact bank
capital has on liquidity creation.
To answer these questions, we perform regressions of the ratio of liquidity
creation to assets on a set of variables including the capital-assets ratio and the set of
control variables. We estimate separate regressions before and after the introduction of
DIS in 2004, considering the periods from the first quarter of 2001 to the fourth quarter
of 2003 and from the first quarter of 2005 to the first quarter of 2007. Regressions are
estimated with robust standard errors clustered by bank.
Following Berger and Bouwman (2009), we use lagged values of all explanatory
variables to mitigate the potential endogeneity problem. Furthermore, we can
reasonably consider that bank capital influences liquidity creation with a lag. As we
have a limited number of quarters for each sub-period of our analysis, we consider a lag
of one quarter to limit the reduction of the number of observations for each sub-sample.
We consider alternatively three liquidity creation measures.
4.2 General results
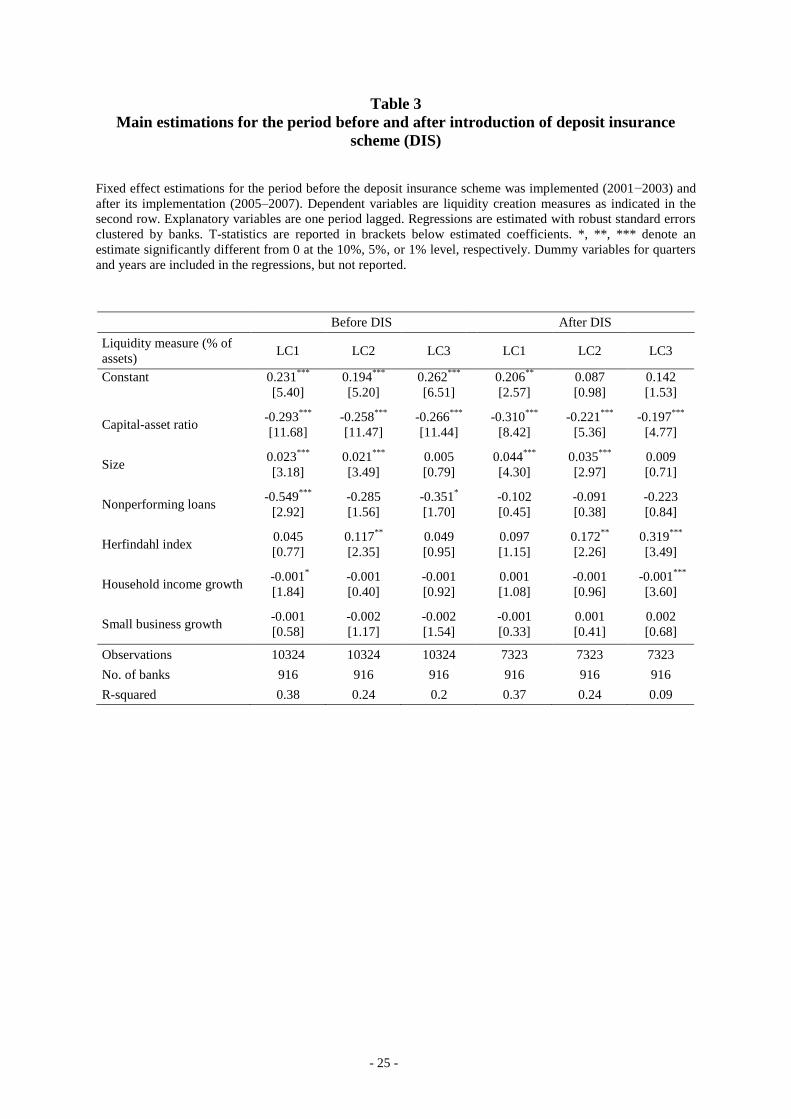
We present the results observed for each sample before and after the implementation of
the DIS. Table 3 reports the results for each sub-period. The major finding is the
negative coefficient of the bank capital variable, which is significant at the 1% level in
all regressions before and after the implementation of the DIS. This result suggests that
in the case of Russian banks the “financial fragility/crowding out” hypothesis is
stronger than the “risk absorption” hypothesis. The general implication of such a
finding is that policies aimed at increasing bank capital in emerging countries may
hamper liquidity creation.
Page 15
- 15 -
However, for our investigation, the main implication of this result is the fact that
the implementation of the DIS does not change the relationship between bank capital
and liquidity creation. Indeed, as the “financial fragility/crowding out” hypothesis is
more prominent in the absence of deposit insurance scheme, we should expect that the
introduction of such scheme would diminish the influence of this channel. Yet we
observe no such thing, indicating that the introduction of deposit insurance does not
influence the relationship between bank capital and liquidity creation. All conclusions
are very robust in the sense that they are observed with the three different liquidity
creation measures. The results do not change if we use different variables to assess risk
(loan loss provisions, volatility of earnings, or Z-score).9
We briefly turn to the analysis of control variables. We observe non-significant
coefficients in the majority of cases. Similarly, Berger and Bouwman (2009) report
many non-significant control variables in their estimations. In our case, a notable
exception is the significantly positive coefficient for size at least for two liquidity
creation measures, which suggests that greater banks may create more liquidity. Risk
measures are significantly negative in several cases, suggesting that greater risk
hampers liquidity creation.
The difference-in-difference estimations on the impact of the implementation of
the deposit insurance scheme described above are thus complemented by these results.
The limited effect of deposit insurance introduction on the relationship between bank
capital and liquidity creation was not strong enough to influence the sign of this
relationship, which remains negative throughout the observation period.
The implications of these results are twofold. First, they suggest that by imposing
capital requirements on banks for safety reasons regulators may hamper liquidity
creation, and thereby cause economic harm. In other words, a trade-off would exist
between the benefits of financial stability and the costs of diminished liquidity creation.
Second, the introduction of deposit insurance scheme does not provide a solution to this
dilemma. Indeed, the relationship between bank capital and liquidity creation is still
negative after the implementation of the DIS.
We next ask whether our main findings might differ among size classes and types
of ownership. Indeed, Berger and Bouwman (2009) find different relationship between
bank capital and liquidity creation for US banks depending on the size of the bank. If
9 These results are available upon request.
Page 16
- 16 -
the results differ with size and with ownership, then the role of bank capital on liquidity
creation can be modified through policies promoting changes of size (policies favoring
mergers) or privatization and foreign bank entry. We therefore continue our analysis
with the estimations by size and by ownership.
4.3 Results by size
Berger and Bouwman (2009) argue that the relationship between bank capital and
liquidity creation can vary with bank size, as hypotheses on this link are not similarly
applicable for all banks. They claim the “risk absorption” hypothesis, which expects a
positive impact of bank capital, is most applicable to large banks. This hypothesis
posits that as liquidity creation enhances the likelihood of losses for banks, bank capital
becomes more important in absorbing losses. Large banks are in this respect more
concerned as they are more exposed to regulatory scrutiny and market discipline from
uninsured providers of funds. They also mention that the “financial fragility/crowding
out” hypothesis suggests a negative relationship more applicable to small banks. Small
banks tend to raise more funds locally than large banks. Consequently, there is larger
overlap between those who invest in equity and those who provide deposits, resulting
in greater crowding-out of deposits by equity. In their study on US banks, Berger and
Bouwman (2009) find empirical support for these expectations, as the relationship
between bank capital and liquidity creation is significantly positive for large banks,
significantly negative for small banks, and not significant for medium-sized banks.
Here, we aim to check whether similar findings are applicable for an emerging country
like Russia. Indeed, emerging markets may have different characteristics that modify
the relationship observed on the US market. The Russian banking industry is
characterized by an impressive number of banks and there are pressures to implement a
consolidation process to reduce their number. Thus, if we find that the relationship
between bank capital and liquidity creation is significantly positive for large banks as it
is the case for US banks, this would provide an additional argument to favor
consolidation in the Russian banking industry. Indeed, it would then contribute to
reduction of the detrimental effects of bank capital requirements on liquidity creation.
Moreover, as the introduction of the deposit insurance may have exerted a different
impact on different banks, we want to check whether our finding regarding the absence
of impact of this introduction on the relationship between bank capital and liquidity
creation is valid for all size categories.
Page 17
- 17 -
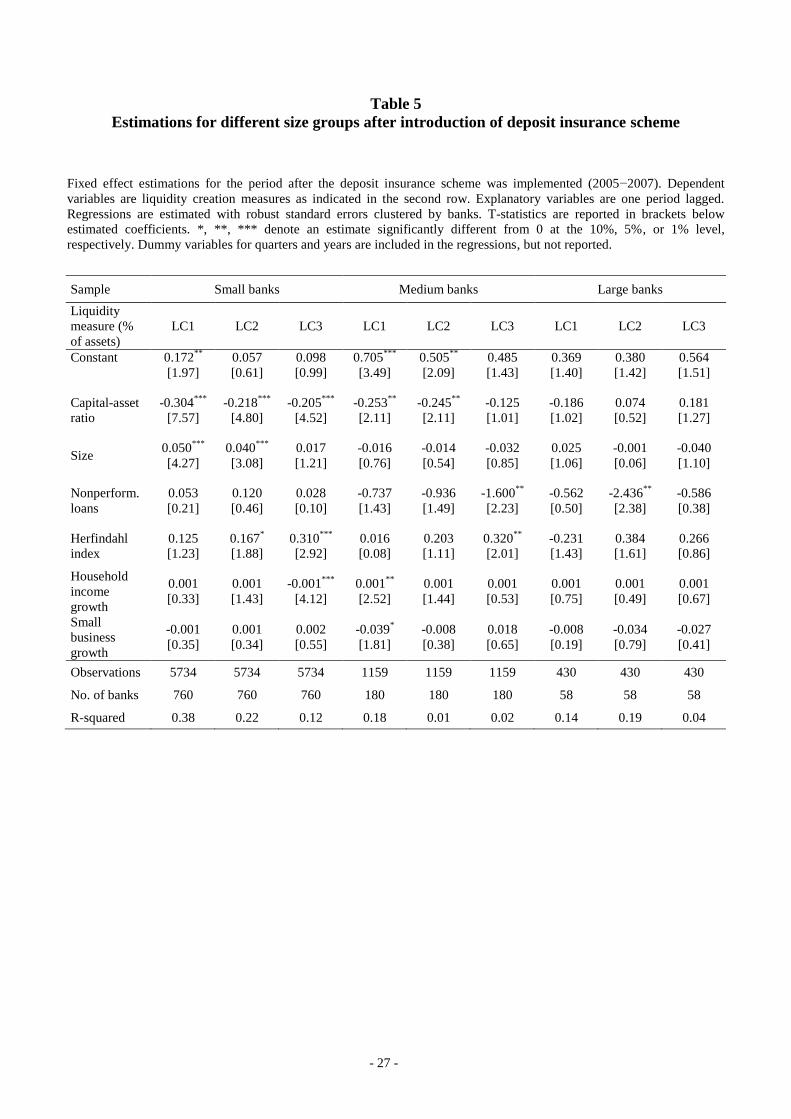
To examine the relationship between bank capital and liquidity creation by size,
we separate Russian banks into three samples based on size: large banks (top 50),
medium-sized banks (top 51-200), and small banks. Tables 4 and 5 display the results
for each category of banks before and after the introduction of the DIS, respectively.
The results can be summarized as follows. Before the introduction of the DIS, the
relationship between bank capital and liquidity creation is significantly negative for
small and medium banks and all liquidity creation measures. After the introduction of
the DIS, the relationship is significantly negative for small banks, and not significant
for big banks with all liquidity creation measures. For medium-sized banks, the
relationship is significantly negative with LC1/assets and LC2/assets, but not
significant with LC3/assets.
All in all, these results suggest two major conclusions. First, the comparison of
size classes shows some differences in the link between bank capital and liquidity
creation across these subgroups. In other words, the relationship is significantly
negative for small and medium-sized banks, but not significant for large banks. To
some extent, these results are in line with those from Berger and Bouwman (2009).
Similarly, we find that the “risk absorption” hypothesis according to which the
relationship would be positive is more applicable to large banks as it offsets the
negative effect from the “financial fragility-crowding out” hypothesis. We do not
observe a significantly positive relationship for large banks like in the case for US
banks. This finding supports a policy aiming to increase the size of Russian banks.
Greater bank size might reduce the negative impact of bank capital on liquidity
creation, and could consequently diminish the detrimental effects of bank capital
requirements applied to promote financial stability.
Second, our main finding for all banks that the introduction of the deposit
insurance scheme does not change the relationship of bank capital and liquidity
creation is now corroborated in the estimations by bank size. Indeed, in most cases, the
sign and significance of the coefficient for bank capital remains the same before and
after DIS. The only exceptions are medium banks with LC3/assets for which the
negative sign loses its significance after the DIS. Thus, even for small banks for which
the “financial fragility/crowding out” effect plays a stronger role, the introduction of
the deposit insurance scheme which is expected to reduce the dominance of this effect
does not have a significant impact.
Page 18
- 18 -
4.4 Results by ownership
We now turn to estimations by ownership − a major issue in many emerging markets,
including Russia. Three types of banks coexist in Russia: state-controlled banks,
foreign-owned banks, and domestic private banks. This coexistence leads to major
debates with notably the relevance of foreign bank entry and privatization. While the
effects of foreign and private ownership on efficiency and competition in emerging
markets have been widely investigated,10
we are unaware of investigations dealing with
the role ownership plays in the relationship of bank capital and liquidity creation. In
Russia’s case, one must therefore ask whether the relationship, which is negative at the
general level, differs by ownership format. If we find a non-negative relationship for a
specific group, it would suggest promoting the importance of such group in the banking
industry to diminish the negative impact of bank capital requirements.
We estimate regressions by considering separately state-controlled, foreign and
private domestic banks. Results for before and after the introduction of the DIS are
presented in Tables 6 and 7. Two findings clearly emerge. First, the relationship
between bank capital and liquidity creation is significantly negative for private
domestic banks, whereas it is not significant for state-controlled and foreign banks.
Second, this relationship was not influenced by the introduction of the DIS in any
group. This is in line with our former results.
Significance of our results for different ownership groups is not surprising since
banks that are mostly affected by deposit insurance are private domestic banks. On the
other hand, state-controlled banks have benefited from the implicit deposit insurance
even before the introduction of the official DIS (Karas, Pyle and Schoors, 2009), and
foreign banks can be perceived as less sensitive to bank runs owing to the presence of a
foreign shareholder. Therefore, if DIS influences the relationship between bank capital
and liquidity creation, one would particularly anticipate these changes for private
domestic banks.
Our first finding that the relationship between bank capital and liquidity creation
is not significant for state-controlled and foreign banks could be interpreted as evidence
of a cancelling out of both main effects even if the “financial fragility/crowding out”
effect seems to dominate for private domestic banks. In other words, the “risk
10
For Russian banks, see Karas, Schoors and Weill (2010) for the role of ownership on efficiency and
Fungáčová, Solanko and Weill (2010) for the link between ownership and competition. For a more
global view of the impact of private ownership on performance, see Estrin et al. (2009).
Page 19
- 19 -
absorption” effect plays a stronger role for foreign banks and state-controlled banks. In
the case of foreign banks, the greater scrutiny of foreign shareholders might ascribe a
higher importance of bank capital in absorbing potential losses associated with greater
liquidity creation. This finding suggests that authorities should consider promoting
foreign bank entry or preserving state ownership if they wish to limit the detrimental
effects of the bank capital requirements on liquidity creation.
5. Conclusions
This paper examines how the introduction of deposit insurance affects the relationship
between bank capital and liquidity creation. Following Berger and Bouwman (2009),
this issue appears to have value in addressing the normative implications of bank
capital requirements. Indeed, financial authorities today encourage banks to increase
their bank capital in the name of financial stability, while neglecting the role of banks
in liquidity creation (which, as the relevant literature suggests, can be influenced by
bank capital).
Introduction of the deposit insurance scheme in Russia in 2004 serves as a natural
experiment that permits testing the relationship between bank capital and liquidity
creation. It also allows investigating this relationship in the context of a major
emerging economy.
We find limited evidence that the post-insurance impact of bank capital on
liquidity creation is less negative. Nonetheless, the introduction of a deposit insurance
scheme did not change the sign of this impact, which is negative both before and after
implementation. This negative relationship between bank capital and liquidity creation
has important policy implications as it suggests that bank capital requirements
implemented for safety reasons may actually harm liquidity creation, and thereby harm
performance of the economy. There appears to be a trade-off between the benefits of
financial stability and the costs of lower liquidity creation for greater bank capital.
Additional estimations confirm that relationship between bank capital and
liquidity creation vary with size and type of ownership. This relationship is not
significant for large banks, foreign banks, and state-controlled banks, but is
significantly negative for small and medium-sized banks, as well as for private
domestic banks. These findings point to a number of ways policymakers might mitigate
the detrimental effects of greater bank capital for liquidity creation. Most notably,
Page 20
- 20 -
policies that promote consolidation of Russian banks to boost their size and the opening
up of the banking sector to foreign banks appear to have diminished the negative
impacts of bank capital on liquidity creation.
Page 21
- 21 -
References
Acharya, V., S. Bharath, and A. Srinivasan, 2007. Does Industry-Wide Distress Affect
Defaulted Firms? Journal of Financial Economics 85, 787-821.
Allen, F., and D. Gale. 2004. Financial Intermediaries and Markets. Econometrica 72,
1023-1061.
Beck, T., A. Demirgüc-Kunt, and V. Maksimovic, 2004. Bank Competition and Access
to Finance: International Evidence. Journal of Money, Credit and Banking 36, 3,
627-654.
Berger, A., and C. Bouwman, 2009. Bank Liquidity Creation. Review of Financial
Studies 22, 3779-3837.
Bhattacharya, S., and A. Thakor, 1993. Contemporary Banking Theory. Journal of
Financial Intermediation 3, 2-50.
Coval, J., and A. Thakor, 2005. Financial Intermediation as a Beliefs-Bridge between
Optimists and Pessimists. Journal of Financial Economics 75, 535-569.
Deep, A., and G. Schaefer, 2004. Are Bank Liquidity Transformers? Working Paper,
Harvard University.
Demirgüc-Kunt, A., and E. Detragiache, 2002. Does Deposit Insurance Increase Banking
System Stability? Journal of Monetary Economics 49, 7, 1373-1406.
Diamond, D., and R. Rajan. 2000. A Theory of Bank Capital. Journal of Finance 55,
2431-65.
Diamond, D., and R. Rajan. 2001. Liquidity Risk, Liquidity Creation, and Financial
Fragility: A Theory of Banking. Journal of Political Economy 109, 287-327.
Estrin, S., J. Hanousek, E. Kočenda, and J. Svejnar, 2009. Effects of Privatization and
Ownership in Transition Economies. Journal of Economic Literature, 47, 3, 699-
728.
Fungáčová, Z., L. Solanko, and L. Weill, 2010. Market Power in the Russian Banking
Industry. BOFIT Discussion Papers 3/2010, Bank of Finland.
Karas, A., W. Pyle, and K. Schoors, 2009. The Effect of Deposit Insurance on Market
Discipline: Evidence from a Natural Experiment on Deposit Flows. Middlebury
College Economics Discussion Paper No. 09-05.
Karas, A., and K. Schoors, 2005, Heracles or Sisyphus? Finding, Cleaning and
Reconstructing a Database of Russian Banks, Ghent University Working Paper
05/327.
Karas, A., K. Schoors, and L. Weill, 2010. Are Private Banks More Efficient than Public
Banks: Evidence from Russia, Economics of Transition 18, 1, 209-244.
Repullo, R., 2004. Capital Requirements, Market Power and Risk-Taking in Banking.
Journal of Financial Intermediation 13, 156-182.
Vernikov, A., 2009. Russian Banking: The State Makes a Comeback. BOFIT Discussion
Papers 24/2009, Bank of Finland.
Von Thadden, E.-L., 2004. Bank Capital Adequacy Regulation and the New Basel
Accord. Journal of Financial Intermediation 13, 90-95.
Page 22
- 22 -
Appendix
Definitions of liquidity creation measures (LC1, LC2, and LC3)
The following are definitions of the balance sheet items in terms of their liquidity, which is the basis for calculation
of the liquidity creation measures. The general functional form to calculate liquidity creation is given by Equation
(1) and the weights of different items are reported in the parentheses. LC1 is a gross measure of liquidity creation,
based on the rough liquidity characteristics of broad categories of financial terms. In constructing the second
liquidity creation measure (LC2), we classify the bank activities based on the categories. LC3 is based on the
category as well as the maturity that is nested in some of the categories of the financial terms.
LC
1:
GR
OS
S
ME
AS
UR
E Illiquid assets (1/2) Liquid assets (-1/2)
Total loans Correspondent accounts with other banks
Securities investments
Liquid liabilities (1/2) Illiquid liabilities (-1/2)
Total deposits Capital
LC
2:
CA
TE
GO
RY
ME
AS
UR
E
Illiquid assets (1/2) Semi-liquid assets (0) Liquid assets (-1/2)
Loans to firms Interbank loans Correspondent accounts with other
banks
Other assets Loans to government Government securities (incl. securities
issued by regions and municipalities)
Loans to individuals Investments to promissory notes
Liquid liabilities (1/2) Semi-liquid liabilities (0) Illiquid liabilities (-1/2)
Debt securities issued
(promissory notes)
Debt securities issued
(deposit and saving
certificates, bonds)
Other liabilities
Claims of non-bank sector :
settlement accounts (firms,
households, government)
Claims of non-bank sector :
term deposits accounts
(firms, households,
government)
Capital
Claims of banks
LC
3:
MA
TU
RIT
Y M
EA
SU
RE
Illiquid assets (1/2) Semi-liquid assets (0) Liquid assets (-1/2)
Interbank loans (maturity
more than 1 year,
nonperforming interbank
loans)
Interbank loans (maturity
more than a week and less
than 1 year)
Interbank loans (maturity less than a
week)
Loans to firms Loans to government Correspondent accounts with other
banks
Other assets Loans to individuals Government securities (incl. securities
issued by regions and municipalities)
Investments into prom. notes
Liquid liabilities (1/2) Semi-liquid liabilities (0) Illiquid liabilities (-1/2)
Liabilities with maturity
lower than 90 days
Liabilities (term deposits and
debt securities) with maturity
less than 1 year
Liabilities (term deposits, debt
securities) with maturity more than 1
year and overdue liabilities and
liabilities with uncertain term to
maturity
Current and corresponding
accounts
Capital
Page 23
- 23 -
Table 1
Descriptive statistics for the main variables
This table provides the descriptive statistics of the main variables for the period before the introduction of the
deposit insurance scheme (DIS) from 2001 to 2003 and after its introduction from 2005 to 2007.
Before DIS After DIS
Obs. Mean
Std.
deviation Obs. Mean
Std.
deviation
LC1 (in proportion of assets) 10542 0.32 0.20 7541 0.47 0.19
LC2 (in proportion of assets) 10542 0.27 0.18 7541 0.30 0.16
LC3 (in proportion of assets) 10542 0.22 0.18 7541 0.20 0.16
Size (ln of assets) 10542 5.86 1.83 7541 7.10 1.80
Nonperf. loans ratio 10542 0.01 0.02 7541 0.01 0.02
Capital-asset ratio 10542 0.29 0.18 7541 0.21 0.15
Herfindahl index 10542 0.18 0.17 7541 0.14 0.12
Household income growth 10542 33.27 11.39 7541 22.39 10.23
Small business growth 10542 0.07 0.46 7541 0.18 0.83
Page 24
- 24 -
Table 2
Difference-in-difference estimations
This table presents the results based on the difference-in-difference approach. Dependent variables are the three liquidity creation (LC1, LC2, and LC3
normalized by total assets), respectively. Treatment is a dummy variable that equals to 1 if the bank was enrolled in the deposit insurance scheme around
2004, and 0 otherwise (i.e. state-controlled banks). All variables are defined as the changes between corresponding quarters before and after 2004, a year in
which deposit insurance was implemented. Absolute values of t-statistics are reported in brackets. *, **, *** denote an estimate significantly different from 0
at the 10%, 5%, or 1% level, respectively.
Liquidity creation measure (% of
assets) LC1 (difference) LC2 (difference) LC3 (difference)
Constant -0.182
*** -0.182
*** -0.100
** -0.100
** -0.067 -0.068
[7.91] [7.90] [2.11] [2.12] [1.22] [1.24]
Treatment dummy variable 0.129
*** 0.131
*** 0.129
*** 0.125
*** 0.107
* 0.100
*
[5.23] [5.29] [2.68] [2.59] [1.91] [1.81]
Capital asset ratio (difference) -0.621
*** -0.621
*** -1.288
*** -1.290
*** -0.433 -0.435
*
[6.65] [6.64] [4.02] [4.03] [1.64] [1.65]
Size (difference) -0.044
*** -0.044
*** -0.115
*** -0.115
*** -0.096
** -0.097
**
[3.01] [2.99] [2.77] [2.79] [2.45] [2.48]
Treatment × capital assets ratio
(difference)
0.036 0.002 0.829**
0.894***
0.008 0.105
[0.36] [0.02] [2.58] [2.77] [0.03] [0.39]
Treatment × size (difference) 0.076
*** 0.079
*** 0.126
*** 0.121
*** 0.081
** 0.073
*
[4.84] [4.95] [3.00] [2.89] [2.02] [1.84]
Treatment × capital assets ratio
difference × size (difference)
-0.022 0.042**
0.063***
[1.12] [2.47] [2.93]
Nonperf. loans (difference) 0.394 0.400 -0.082 -0.094 -0.556
* -0.574
**
[1.39] [1.42] [0.30] [0.35] [1.94] [2.02]
Herfindahl index (difference) -0.130
** -0.126
** 0.137
*** 0.131
** 0.281
*** 0.271
***
[2.40] [2.32] [2.63] [2.51] [5.05] [4.89]
Household income growth (difference) 0.001 0.001 -0.001
** -0.001
** -0.001
*** -0.001
***
[0.26] [0.33] [2.30] [2.18] [3.24] [3.10]
Small business growth (difference) -0.002 -0.002 -0.006 -0.005 -0.011
* -0.010
*
[0.72] [0.80] [1.12] [1.04] [1.92] [1.83]
Observations 19011 19011 19011 19011 19011 19011
F-statistics 73.87 67.77 42.55 43.74 27.13 28.00
R-squared 0.34 0.34 0.22 0.22 0.13 0.14
Page 25
- 25 -
Table 3
Main estimations for the period before and after introduction of deposit insurance
scheme (DIS)
Fixed effect estimations for the period before the deposit insurance scheme was implemented (2001−2003) and
after its implementation (2005–2007). Dependent variables are liquidity creation measures as indicated in the
second row. Explanatory variables are one period lagged. Regressions are estimated with robust standard errors
clustered by banks. T-statistics are reported in brackets below estimated coefficients. *, **, *** denote an
estimate significantly different from 0 at the 10%, 5%, or 1% level, respectively. Dummy variables for quarters
and years are included in the regressions, but not reported.
Before DIS After DIS
Liquidity measure (% of
assets) LC1 LC2 LC3 LC1 LC2 LC3
Constant 0.231***
0.194***
0.262***
0.206**
0.087 0.142
[5.40] [5.20] [6.51] [2.57] [0.98] [1.53]
Capital-asset ratio -0.293
*** -0.258
*** -0.266
*** -0.310
*** -0.221
*** -0.197
***
[11.68] [11.47] [11.44] [8.42] [5.36] [4.77]
Size 0.023
*** 0.021
*** 0.005 0.044
*** 0.035
*** 0.009
[3.18] [3.49] [0.79] [4.30] [2.97] [0.71]
Nonperforming loans -0.549
*** -0.285 -0.351
* -0.102 -0.091 -0.223
[2.92] [1.56] [1.70] [0.45] [0.38] [0.84]
Herfindahl index 0.045 0.117
** 0.049 0.097 0.172
** 0.319
***
[0.77] [2.35] [0.95] [1.15] [2.26] [3.49]
Household income growth -0.001
* -0.001 -0.001 0.001 -0.001 -0.001
***
[1.84] [0.40] [0.92] [1.08] [0.96] [3.60]
Small business growth -0.001 -0.002 -0.002 -0.001 0.001 0.002
[0.58] [1.17] [1.54] [0.33] [0.41] [0.68]
Observations 10324 10324 10324 7323 7323 7323
No. of banks 916 916 916 916 916 916
R-squared 0.38 0.24 0.2 0.37 0.24 0.09
Page 26
- 26 -
Table 4
Estimations for different size groups before introduction of deposit insurance scheme
Fixed effect estimations for the period before the deposit insurance scheme was implemented (2001−2003). Dependent
variables are liquidity creation measures as indicated in the second row. Explanatory variables are one period lagged.
Regressions are estimated with robust standard errors clustered by banks. T-statistics are reported in brackets below
estimated coefficients. *, **, *** denote an estimate significantly different from 0 at the 10%, 5%, or 1% level,
respectively. Dummy variables for quarters and years are included in the regressions, but not reported.
Sample Small banks Medium banks Large banks
Liquidity
measure (%
of assets)
LC1 LC2 LC3 LC1 LC2 LC3 LC1 LC2 LC3
Constant 0.210***
0.203***
0.271***
0.362**
0.159 0.22 0.530* 0.388 0.279
[4.82] [5.37] [6.81] [2.29] [1.26] [1.28] [1.80] [1.38] [0.94]
Capital-asset
ratio
-0.294***
-0.262***
-0.265***
-0.172* -0.162
** -0.227
*** -0.239 -0.055 -0.169
[11.02] [11.08] [10.93] [1.77] [2.13] [2.74] [1.51] [0.35] [0.90]
Size 0.025
*** 0.021
*** 0.005 0.004 0.022 0.004 -0.019 -0.013 -0.005
[3.16] [3.16] [0.73] [0.20] [1.42] [0.18] [0.60] [0.42] [0.15]
Nonperform.
loans
-0.493**
-0.337* -0.396
* -0.209 0.508 0.223 -1.331
* -0.038 0.202
[2.43] [1.75] [1.88] [0.50] [1.05] [0.29] [1.75] [0.03] [0.17]
Herfindahl
index
0.059 0.106**
0.031 -0.055 0.047 0.191 0.843**
0.422 0.285
[0.97] [2.03] [0.60] [0.32] [0.34] [0.94] [2.09] [1.06] [0.55]
Household
income
growth
-0.001* 0.001 0.001 0.001 0.001 0.001 0.001 0.001 -0.001
[1.91] [0.38] [0.52] [0.23] [0.13] [0.59] [0.07] [0.30] [1.33]
Small
business
growth
-0.001 -0.002 -0.002 -0.008 0.001 -0.005 0.005 -0.018 -0.034
[0.46] [1.10] [1.36] [0.43] [0.03] [0.33] [0.18] [0.73] [0.93]
Observations 8483 8483 8483 1337 1337 1337 504 504 504
No. of banks 792 792 792 175 175 175 56 56 56
R-squared 0.36 0.25 0.22 0.17 0.11 0.13 0.06 0.08 0.1
Page 27
- 27 -
Table 5
Estimations for different size groups after introduction of deposit insurance scheme
Fixed effect estimations for the period after the deposit insurance scheme was implemented (2005−2007). Dependent
variables are liquidity creation measures as indicated in the second row. Explanatory variables are one period lagged.
Regressions are estimated with robust standard errors clustered by banks. T-statistics are reported in brackets below
estimated coefficients. *, **, *** denote an estimate significantly different from 0 at the 10%, 5%, or 1% level,
respectively. Dummy variables for quarters and years are included in the regressions, but not reported.
Sample Small banks Medium banks Large banks
Liquidity
measure (%
of assets)
LC1 LC2 LC3 LC1 LC2 LC3 LC1 LC2 LC3
Constant 0.172**
0.057 0.098 0.705***
0.505**
0.485 0.369 0.380 0.564
[1.97] [0.61] [0.99] [3.49] [2.09] [1.43] [1.40] [1.42] [1.51]
Capital-asset
ratio
-0.304***
-0.218***
-0.205***
-0.253**
-0.245**
-0.125 -0.186 0.074 0.181
[7.57] [4.80] [4.52] [2.11] [2.11] [1.01] [1.02] [0.52] [1.27]
Size 0.050
*** 0.040
*** 0.017 -0.016 -0.014 -0.032 0.025 -0.001 -0.040
[4.27] [3.08] [1.21] [0.76] [0.54] [0.85] [1.06] [0.06] [1.10]
Nonperform.
loans
0.053 0.120 0.028 -0.737 -0.936 -1.600**
-0.562 -2.436**
-0.586
[0.21] [0.46] [0.10] [1.43] [1.49] [2.23] [0.50] [2.38] [0.38]
Herfindahl
index
0.125 0.167* 0.310
*** 0.016 0.203 0.320
** -0.231 0.384 0.266
[1.23] [1.88] [2.92] [0.08] [1.11] [2.01] [1.43] [1.61] [0.86]
Household
income
growth
0.001 0.001 -0.001***
0.001**
0.001 0.001 0.001 0.001 0.001
[0.33] [1.43] [4.12] [2.52] [1.44] [0.53] [0.75] [0.49] [0.67]
Small
business
growth
-0.001 0.001 0.002 -0.039* -0.008 0.018 -0.008 -0.034 -0.027
[0.35] [0.34] [0.55] [1.81] [0.38] [0.65] [0.19] [0.79] [0.41]
Observations 5734 5734 5734 1159 1159 1159 430 430 430
No. of banks 760 760 760 180 180 180 58 58 58
R-squared 0.38 0.22 0.12 0.18 0.01 0.02 0.14 0.19 0.04
Page 28
- 28 -
Table 6
Estimations for different ownership groups before introduction of deposit insurance scheme
Fixed effect estimations for the period before the deposit insurance scheme was implemented (2001−2003). Dependent
variables are liquidity creation measures as indicated in the second row. Explanatory variables are one period lagged.
Regressions are estimated with robust standard errors clustered by banks. T-statistics are reported in brackets below
estimated coefficients. *, **, *** denote an estimate significantly different from 0 at the 10%, 5%, or 1% level,
respectively. Dummy variables for quarters and years are included in the regressions, but not reported.
Sample Private domestic banks State-controlled banks Foreign-owned banks
Liquidity
measure (%
of assets)
LC1 LC2 LC3 LC1 LC2 LC3 LC1 LC2 LC3
Constant 0.223***
0.183***
0.252***
-0.004 0.076 0.287 -0.506 0.080 0.701
[5.19] [4.86] [6.26] [0.01] [0.20] [0.99] [0.76] [0.26] [1.54]
Capital-asset
ratio
-0.291***
-0.252***
-0.260***
-0.290 -0.304 -0.501**
-0.001 -0.12 -0.077
[11.35] [10.93] [10.92] [1.27] [1.44] [2.35] [0.00] [0.77] [0.25]
Size 0.024
*** 0.024
*** 0.008 0.043 0.032 0.007 0.113 0.018 -0.077
[3.26] [3.78] [1.17] [0.79] [0.68] [0.18] [1.47] [0.48] [1.52]
Nonperf.
loans
-0.621***
-0.395**
-0.458**
2.037 2.362 1.702 1.043 1.942***
1.997**
[3.22] [2.13] [2.19] [1.67] [1.49] [1.13] [1.09] [4.34] [2.20]
Herfindahl
index
0.043 0.117**
0.037 0.166 0.081 0.139 0.049 0.134 0.425
[0.71] [2.25] [0.72] [1.04] [0.50] [0.63] [0.02] [0.07] [0.22]
Household
income
growth
0.001 0.001 0.001 0.001 -0.001 -0.001 0.001 0.001 -0.001
[1.57] [0.16] [0.65] [0.18] [1.05] [0.81] [0.32] [0.08] [1.11]
Small
business
growth
-0.001 -0.002 -0.002 -0.003 -0.008 -0.018 -0.024 0.030 -0.051
[0.71] [1.24] [1.55] [0.05] [0.20] [0.56] [0.30] [0.68] [0.95]
Observations 9817 9817 9817 231 231 231 276 276 276
No. of banks 871 871 871 20 20 20 33 33 33
R-squared 0.37 0.26 0.21 0.07 0.01 0.04 0.19 0.18 0.06
Page 29
- 29 -
Table 7
Estimations for different ownership groups after introduction of deposit insurance scheme
Fixed effect estimations for the period after the deposit insurance scheme was implemented (2005−2007). Dependent
variables are liquidity creation measures as indicated in the second row. Explanatory variables are one period lagged.
Regressions are estimated with robust standard errors clustered by banks. T-statistics are reported in brackets below
estimated coefficients. *, **, *** denote an estimate significantly different from 0 at the 10%, 5%, or 1% level,
respectively. Dummy variables for quarters and years are included in the regressions, but not reported.
Sample Private domestic banks State-controlled banks Foreign-owned banks
Liquidity
measure (%
of assets)
LC1 LC2 LC3 LC1 LC2 LC3 LC1 LC2 LC3
Constant 0.252***
0.128 0.132 0.214 0.173 1.190***
-0.198 -0.299 0.292
[3.63] [1.61] [1.37] [0.45] [0.43] [3.27] [0.41] [0.60] [0.68]
Capital-asset
ratio
-0.325***
-0.224***
-0.201***
-0.251 0.171 0.128 -0.103 -0.139 -0.095
[9.74] [6.05] [4.73] [0.66] [0.65] [0.32] [0.65] [0.68] [0.68]
Size 0.038
*** 0.030
*** 0.010 0.036 0.010 -0.098
** 0.085 0.074 -0.012
[4.37] [2.82] [0.81] [0.75] [0.24] [2.71] [1.57] [1.42] [0.24]
Nonperf.
loans
-0.143 -0.213 -0.172 1.113 0.800 -0.988 0.880 1.468 -0.710
[0.60] [0.85] [0.62] [0.73] [0.84] [0.91] [0.56] [0.93] [0.74]
Herfindahl
index
0.083 0.152* 0.337
*** -0.036 0.109 -0.258 0.235 0.061 -0.817
[0.92] [1.88] [3.45] [0.26] [0.55] [1.03] [0.41] [0.08] [1.20]
Household
income
growth
0.001 0.001 -0.001***
0.001* 0.001
** 0.001 0.001 0.001 0.001
[0.79] [1.26] [4.03] [1.79] [2.55] [0.43] [0.91] [0.62] [1.07]
Small
business
growth
-0.001 0.001 0.002 -0.060 -0.090 -0.130* -0.170
* -0.160 -0.144
**
[0.27] [0.48] [0.71] [1.04] [1.67] [1.91] [1.75] [1.55] [2.19]
Observations 6849 6849 6849 173 173 173 301 301 301
No. of banks 866 866 866 20 20 20 49 49 49
R-squared 0.39 0.27 0.09 0.14 0.15 0.18 0.32 0.06 0.05