26
Bank Credit During the 2008 Financial Crisis: A Cross-Country Comparison Ari Aisen and Michael Franken WP/10/47

Bank Credit During the 2008 Financial Crisis: A Cross-Country Comparison
Ari Aisen and Michael Franken
WP/10/47

© 2010 International Monetary Fund WP/10/47 IMF Working Paper Asia and Pacific Department
Bank Credit During the 2008 Financial Crisis: A Cross-Country Comparison
Prepared by Ari Aisen and Michael Franken1,2
Authorized for distribution by Roberto Cardarelli
February 2010
Abstract
This Working Paper should not be reported as representing the views of the IMF. The views expressed in this Working Paper are those of the author(s) and do not necessarily represent those of the IMF or IMF policy. Working Papers describe research in progress by the author(s) and are published to elicit comments and to further debate.
This paper empirically estimates the main determinants of bank credit growth during the 2008 financial crisis. Using a sample covering over 80 countries, this paper finds that larger bank credit booms prior to the crisis and lower GDP growth of trading partners are among the most important determinants of the post-crisis bank credit slowdown. Structural variables such as financial depth and integration were also relevant. Finally, countercyclical monetary policy and liquidity played a critical role in alleviating bank credit contraction after the 2008 financial crisis, suggesting that countries should pursue appropriate institutional and macroeconomic frameworks conducive to countercyclical monetary policies.
JEL Classification Numbers: E32, E52, G21
Keywords: Bank credit, credit boom, bust cycles, monetary policy
Authors’ E-Mail Addresses: [email protected] and [email protected]
1 The views expressed in this paper are those of the authors and do not necessarily represent those of the Central Bank of Chile and the IMF. The authors are grateful for the valuable comments from Carlos Végh, Marta Ruiz Arranz, Sebastián Claro, Blaise Gadanecz, and Runchana Pongsaparn. We are also grateful to Kevin Cowan, Luis Opazo, Roberto Alvarez, Rodrigo Cifuentes, Miguel Fuentes, and other participants at the seminar series on financial stability at the Central Bank of Chile. All errors are ours. 2 Corresponding author: Ari Aisen, Financial Stability Division, Central Bank of Chile. Tel.: +562-6702802.
2
Contents Page I. Introduction ..........................................................................................................................3 II. Data and Empirical Model ...................................................................................................6 III. Empirical Results ...............................................................................................................10
A. Main Determinants of Credit Growth After Crisis ......................................................10 B. Results Using Dummy Interactions for Regions and Other Variables ........................13 C. Sensitivity Analysis .....................................................................................................14
IV. Conclusions ........................................................................................................................15 References ................................................................................................................................23 Figures 1. Conditions in the Three-Month Interbank Market ...............................................................4 2. Real bank Credit Growth .....................................................................................................4 Tables 1. Growth of Real Bank Credit to Domestic Private Sector, Per Country .............................16 2. Descriptive Statistics ..........................................................................................................17 3. Baseline Regressions .........................................................................................................18 4. Instrumental Variable Regressions for Explanatory Variable: Percentage Change
in Monetary Market Rate .............................................................................................19 5. Interactions with Regions ..................................................................................................20 6. Other Interactions...............................................................................................................21 7. Sensitivity Analysis ...........................................................................................................22

3
I. INTRODUCTION
Rarely an episode of financial turmoil―at least in the post–World War II era―generated such economic havoc as the 2008 financial crisis. The crisis was unique in terms of the wealth destruction, estimated at US$ 50 trillion equivalent to one year of world GDP,3 associated with the plunge in the value of stocks, bonds, property, and other assets. Moreover, the crisis was unprecedented in its global scale and severity, hindering credit access to businesses, households and banks, and choking economic activity.
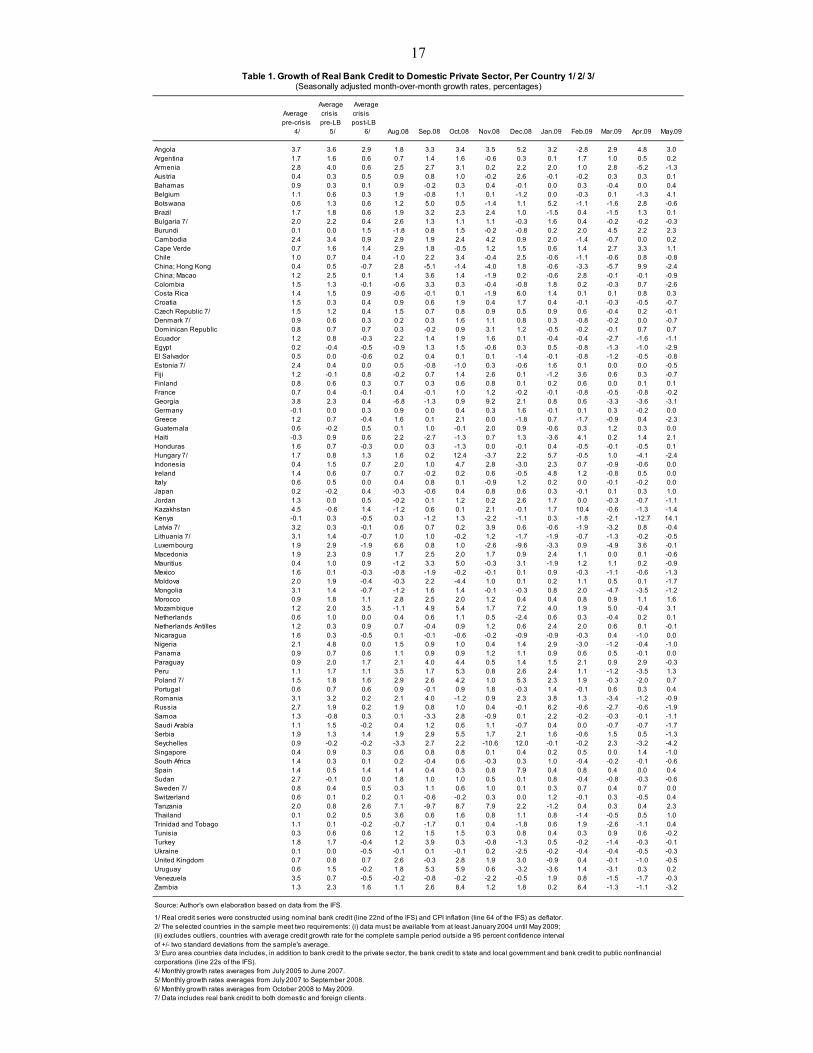
Banks, in particular, faced unparalleled liquidity stress hurting their ability to lend. Libor-OIS spreads, a conventional measure of liquidity stress and confidence between banks, hit an all time high of 366 basis points (in U.S. dollar rates) in October 2008, soon after Lehman Brothers bankruptcy on September 15, 2008. Libor-OIS spreads in other currencies showed similar interbank market strains (Figure 1). The damage on global bank balance sheets in advanced countries―with losses projected by the IMF reaching over US$ 4 trillion in the period 2009–10―provoked a strong credit slowdown.4 Bank credit decelerated significantly in several regions, with Emerging Europe presenting the lowest average growth rate in the period post crisis. Bank credit in OECD countries also slowed down especially in countries where banks received public support in the form of capital injections (Figure 2). Displaying high synchronicity, bank credit contracted in 95 percent of all countries, at least in one of the eight months after September 2008 (Table 1). This credit crunch is still ongoing and may persist for some time despite nascent recovery in several countries. In others, bank credit may not grow for quite a while at the same rates it used to before September 2008.
The purpose of this paper is to study the evolution of bank credit throughout the 2008 financial crisis using a dataset covering over 80 countries. In this context, this paper aims to provide answers to four relevant questions of interest to the profession (a) which countries were able to maintain healthy5 bank credit growth despite the crisis? (b) which were the main determinants of performance among countries with respect to the ability of their banking systems to maintain credit flows to the economy? (c) to what extent is this performance dependent on what happened to bank credit growth during the period previous to the crisis?6 and (d) has monetary policy played a role in attenuating the
1 The estimates of wealth destruction are from Loser (2009). Reinhart and Rogoff (2009) assert that the current financial crisis is, beyond contention, extremely severe by any metric.
4 Estimates presented in the May 2009 issue of the IMF, Global Financial Stability Report.
5 Bank credit growth could be inefficient if misdirected to unfit sectors of the economy and, therefore, credit quality (health) could be jeopardized. This paper does not focus on credit quality, limiting itself to the study of credit growth determinants. Thus, whenever the paper refers to credit performance, the reference is valid for measures of credit flows growth rather than credit quality improvements.
6 Schularik and Taylor (2009) show that credit growth is a powerful predictor of financial crises in the history of 12 developed countries, suggesting that crises are “credit booms gone wrong.”

4
Source: Bloomberg.
Figure 1. Conditions in the Three-Month Interbank Market(Basis points)
0
100
200
300
400
Jan-03 Jan-04 Jan-05 Jan-06 Jan-07 Jan-08 Jan-09
Euro Libor - EONIA spread
US$ Libor - OIS spread
UK Libor - SONIA spread
Yen Libor - OIS spread
Subprimecrisis starts
LehmanBrothersbankruptcy
Figure 2. Real Bank Credit Growth(Percentage points)
2/ OECD with public capital support: Germany, Austria, Belgium, Denmark, France, Greece, Hungary, Ireland, Italy, Luxembourg, Netherlands, United Kingdom, Sweden, and Switzerland. Emerging Asia: Indonesia, Kazakhstan and Thailand. Emerging Europe: Bulgaria, Croatia, Estonia, Latvia, Lithuania, Macedonia, Moldova, Romania, Russia, Serbia, Turkey, and Ukraine. Latin America: Argentina, Brasil, Colombia, Costa Rica, Ecuador, El Salvador, Guatemala, Haiti, Honduras, Mexico, Nicaragua, Panama, Paraguay, Peru, Dominican Republic, Uruguay, and Venezuela.
1/ OECD with banks not receiving public capital support: Spain, Finland, Japan, Mexico, Turkey, Poland, Portugal and Czech Republic.
Source: Authors’ calculations based on IFS data.
-2
-1
0
1
2
3
4
-1 0 1 2 3 4 5
Mo
nth
ly a
ve
rag
e g
row
th r
ate
s
be
twe
en
Oc
tob
er
20
08
an
d M
ay
20
09
Monthly average growth rates between July 2005 and June 2007
45° line
Latin America
Emerging Europe
Emerging AsiaOECD 1/
OECD (2)

5
severity of the slump in credit? Answers to these questions will help assess the quality of the banking system, comparing its performance among countries in its utmost important task of granting loans to businesses and households,7 an essential element in the process of economic growth.
The choice of bank credit growth as measure of bank performance8 is justified by a large literature emphasizing the role credit plays on the process of economic growth.9 Rajan and Zingales (1998), for example, show that external financing-dependent industries in the United States expanded faster than less dependent industries. A clear-cut general interpretation of this finding is that countries with more developed financial systems (including more banking) could grow more than countries with less developed systems. Similarly, Levine and Zervos (1998) use data on 47 countries to show that bank lending has a strong independent effect on growth. Surprisingly, while the literature is ample on papers investigating the effects of financial development on economic growth, articles researching the determinants of credit growth are less abundant.10 Thus, by focusing on the determinants of bank credit growth, this paper clearly contributes to the existing literature. Moreover, this contribution is especially relevant and timely in the context of the 2008 financial crisis.
The findings of the paper are remarkably robust and consistent with the basic intuition regarding the drivers of bank credit growth. Estimates of standard cross-section econometric techniques on a dataset covering 83 advanced, emerging, and developing economies find that countries with (a) high bank credit growth prior to the crisis, (b) suffering stronger demand contraction after the Lehman Brothers shock, (c) with high financial integration with respect to the rest of the world, and (d) with weaker counter-cyclical monetary policy response, presented, on average, lower growth rates of bank credit in the period after the Lehman Brothers collapse. This last result is of special importance from a policy perspective and constitutes a major contribution of this paper. It suggests that countries can be better off developing a macroeconomic and institutional
7 One could classify banking functions into four main categories in line with contemporary banking theory (Freixas and Rochet, 2008) (i) offering liquidity and payment services; (ii) transforming assets; (iii) managing risks; and (iv) processing information and monitoring borrowers. Clearly, these tasks are all related in one way or another to the general role of financial intermediation, which in simple terms means taking deposits from the public and allocating them as loans (credits) to different users.
8 In principle, one could use other indicators to measure bank performance based on bank profitability or the evolution of bank stock market prices (a market-based view). Our choice of performance based on bank credit relies on the fact that credit allocation is perhaps one of the most welfare-enhancing activities with a well-documented relationship with economic growth.
9 Bernanke and Gertler (1995) is a classical example in the family of financial accelerator models where banks can amplify shocks (monetary and others) to the economy through the credit channel. Thus, banks behavior is of particular relevance during crisis, where their action can severely amplify shocks hurting economic activity.
10 The exception being several articles estimating vector autoregressive models that include credit (e.g., Hofmann, 2001). But they do not focus on econometric identification and cannot address questions raised in our study.

6
framework enabling them to display a counter-cyclical monetary policy to attenuate credit contraction when times turn rough.
The paper continues as follows: section two describes the data and the econometric methodology, section three presents estimation results including some robustness exercises, and section four concludes the paper.
II. DATA AND EMPIRICAL MODEL
The dataset is composed of monthly, quarterly, and annual data on macroeconomic, structural, and banking variables within the period from January 2002 to May 2009. Although we collected data for 116 countries, missing values for several variables reduced the number of countries in our estimations to 83. The sources of the macroeconomic data are the IMF’s International Financial Statistics (IFS) and Direction of Trade Statistics (DOTS); the World Bank’s World Development Indicators (WDI); and the United Nation’s International Merchandise Trade Statistics (IMTS). Structural data was collected from the IMF’s IFS; World Bank (WB); Chinn and Ito (2006); and Calvo, Mejia, and Izquierdo (2008). Banking data sources are the Financial Soundness Indicators (FSI) of the IMF’s Global Financial Stability Report; A New Database on Financial Development and Structure from Beck, Demirgüç-Kunt, and Levine (2000); Raddatz (2009); and Micco, Panizza, and Yañez (2004).
To investigate the main macroeconomic, structural, and banking determinants of bank credit growth post Lehman Brothers bankruptcy (the dependent variable), we estimated cross-country models, controlling for the growth rate of bank credit in the two years previous to the crisis and for the macroeconomic demand shock after the crisis. The dependent variable is the deviation from trend of the monthly growth rate of real bank credit in the post-Lehman bankruptcy period (average of October 2008 to May 2009), which we consider to be an accurate measure of bank performance of different countries during the 2008 financial crisis. To construct this variable we used nominal bank credit series from the IFS (line 22d), and the CPI inflation (IFS line 64), which we used as deflator for the levels. The real credit series were seasonally adjusted, and then, we estimated the trend of these series using Hodrick-Prescott filters with monthly data from January 2002 until May 2009. Finally, the month-over-month growth rates were calculated, both for the deflated series and for the trends, which were then subtracted to obtain the finally used deviation from trend variable.
The decision to calculate the dependent variable with monthly instead of quarterly data is partially due to data availability. The post-Lehman Brothers bankruptcy period is only about a year long and therefore only a few quarters could be used (depending on the data availability in the IFS). Hence, using monthly data allowed having at least eight observations for each country of the sample.
The initial aim was to have a sample of countries as large as possible, so we consider all countries for which the nominal credit and CPI inflation series were available (line 22d and line 64 of the IFS, respectively) for at least May 2009, excluding sample outliers with average real bank credit growth falling outside a 95 percent confidence interval.

7
Therefore, we have 83 country observations for the dependent variable, and an ample range of country observations for the independent variables.
We hypothesize that growth in real bank credit post-Lehman Brothers bankruptcy depends on the following explanatory variables:
Real credit growth (September 2006 to August 2008) (IFS) is a variable that controls for the credit boom in the two years previous to September 2008, the month in which the Lehman Brothers bankruptcy took place. The decision to take the two years before the crisis, instead of, for example, one or five years, is discussed in detail later in the paper. In line with the credit boom and bust cycles literature (e.g., Tornell and Westermann, 2002) we expect this variable to have a negative coefficient.
A set of variables accounting for economic performance, external shocks and policy stance after the Lehman Brothers collapse:
o Real GDP growth (average between the fourth quarter of 2008 and first quarter of 2009) (IFS). A positive coefficient is expected, as stronger economic activity should lead to higher bank credit;
o Trading partners’ GDP growth (average between the fourth quarter of 2008 and first quarter of 2009) (IFS and DOTS). Averages for each country are weighted by the participation of all other countries in its total exports in 2007. Higher growth of a country’s trading partners suggests more demand for that country’s exports and, therefore, stronger economic activity, leading to more bank credit. Thus, we expected a positive coefficient;
o Percentage change in Terms of Trade in the fourth quarter of 2008 (IMTS). A more favorable evolution of the terms of trade positively affects GDP growth, and hence bank credit (positive coefficient expected);
o Percentage change in money market rate between September 2008 and May 2009 (IFS). The evolution of the money market rate depends on liquidity conditions of the economy and the monetary policy rate. A larger reduction in the monetary policy rate would lower the money market rate, favoring credit expansion (negative coefficient expected);
o Government expenditures growth in 2009 (Moody's Country Credit Statistical Handbook - November 2009). Countercyclical government expenditures should benefit economic activity attenuating the slowdown in bank credit. Nevertheless, Mishkin (2009) argues that monetary policy is especially effective during a financial crisis compared to fiscal policy, which generally need parliament approval. This, together with Ricardian considerations, leads us to believe that the sign and significance of this coefficient is uncertain. In addition, recognizing the endogeneity of government expenditures, we instrument public debt to GDP ratio before the crisis (2008).

8
o Exchange rate regime (Calderon and Smith-Hebbel, 2008). This variable takes the value of 1 if the exchange rate regime is floating, 3 if fixed, and 2 if it is an intermediate regime. A negative coefficient is expected, as floating regimes insulate countries from the external shock as it allows the exchange rate to depreciate, giving central banks more room to pursue an independent monetary policy;
A set of structural variables that reflect characteristics of the countries that may affect the development of local credit:
o Credit over GDP in 2007 (IFS). A positive coefficient is expected, as deeper financial markets would facilitate credit expansion, for example, through offering financing at lower rates (Rajan and Zingales, 1998);
o Nominal GDP level and GDP per capita in 2007 (IFS). Being a richer economy should make credit more available for several reasons; hence, we expect a positive coefficient;
o Real GDP growth in 2007 (IFS). Countries that experienced lower growth in the year previous to the crisis, should have a smaller credit boom prior to the crisis and potentially smaller credit contraction in its aftermath (negative coefficient expected);
o International financial integration in 2007 (Index of Chinn and Ito, 2006). Higher financial integration facilitates a country’s financing, but it also makes it more vulnerable to international shocks. Thus, in the context of a crisis a negative coefficient is expected;
o Trade openness in 2007 (WB). Measured by exports plus imports over GDP. Higher trade openness may contribute to banks credit, but in the event of a global credit crisis, more open countries may suffer more from trade credit contraction resulting from international liquidity constraints (a negative coefficient is expected);
o External debt in 2007 (percent of GDP, IMF and WB). A negative coefficient is expected, as higher international liabilities could be seen as higher risk, and hence limiting access to new funding;
o Current account balance in 2007 (percent of GDP, IFS). A higher current account deficit could signal a country’s vulnerability, raising risks and limiting the ability of a country’s banking system to receive new loans, so the expected coefficient’s sign is positive;
o Domestic liabilities dollarization in 2004 (Calvo, Mejía, and Izquierdo, 2008). A higher share of liabilities in foreign currency makes a country more exposed to currency mismatches which could affect bank credit if exchange rate varies; hence we expect a negative coefficient (Calvo, Mejia, and Izquierdo, 2008);
9
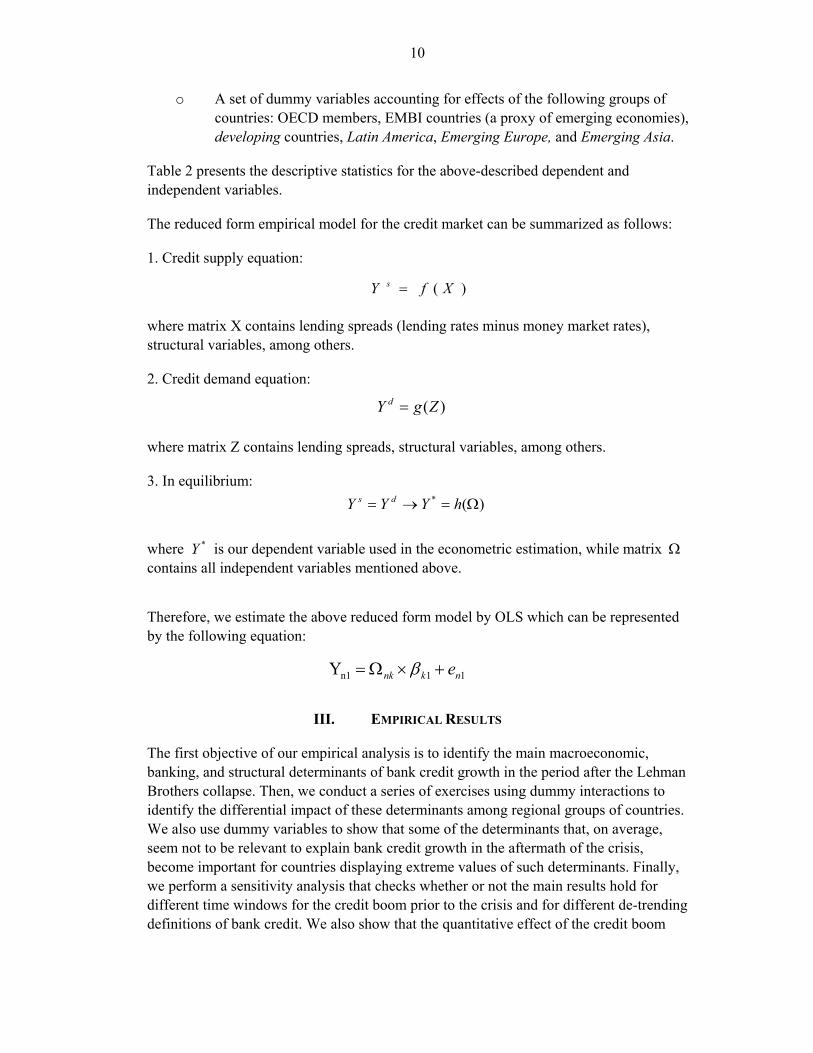
A set of variables that account for the characteristics of the countries’ banking systems that could affect the evolution of domestic bank credit:
o Share of public ownership of the banking system in 2002 (Micco, Panizza, and Yañez, 2004). We expect a positive relationship with the dependent variable as public banks behave more counter cyclically, responding less to external shocks than private banks, positively affecting total bank credit (Micco, Panizza, and Yañez, 2004);
o Share of foreign ownership of the banking system in 2002 (Micco, Panizza, and Yañez, 2004). Rojas-Suárez and Wiesbrod (1996) find that a higher presence of foreign banks brings more stability to total bank credit (positive coefficient expected);
o Bank leverage in 2007 (FSI). Higher leverage may signal risks turning banks more vulnerable in the event of a crisis. Therefore, we expect a negative coefficient;
o Bank return on equity and bank return on assets in 2007 (FSI). A bank with sound profitability will most likely have great access to financing (+), but it could also indicate that banks have taken riskier positions (-) (the sign of this coefficient is an empirical question);
o Bank concentration in 2007 (Beck, Demirgüç-Kunt, and Levine, 2000). Concentration is defined as total assets of the three largest banks as a percentage of total assets of the banking system. A more concentrated banking system could signal a strong market position and higher profits increasing its resilience against external shocks; hence, we expect a positive sign for the coefficient;
o Banks’ dependence on wholesale funding prior to the crisis (Raddatz, 2009). A negative coefficient is expected, as higher dependence on wholesale funding reflects more vulnerability, as this sort of financing is more volatile than retail funding;
o Bank regulatory capital to risk-weighted assets in 2007 (FSI). Having a higher capital buffer to absorb losses in the context of a crisis helps banks to expand credit (positive coefficient expected);
o Bank nonperforming loans to total loans in 2007 (FSI). A negative coefficient is expected, as banking systems with higher shares of nonperforming loans are riskier.
o Bank provisions to nonperforming loans in 2007 (FSI). No clear expectation for the coefficient’s sign as lower provision could reflect better assets (+), but with the risk of an unrealistically optimistic evaluation of banks’ portfolio that could catch banks unguarded in the face of higher than expected losses (-).
10
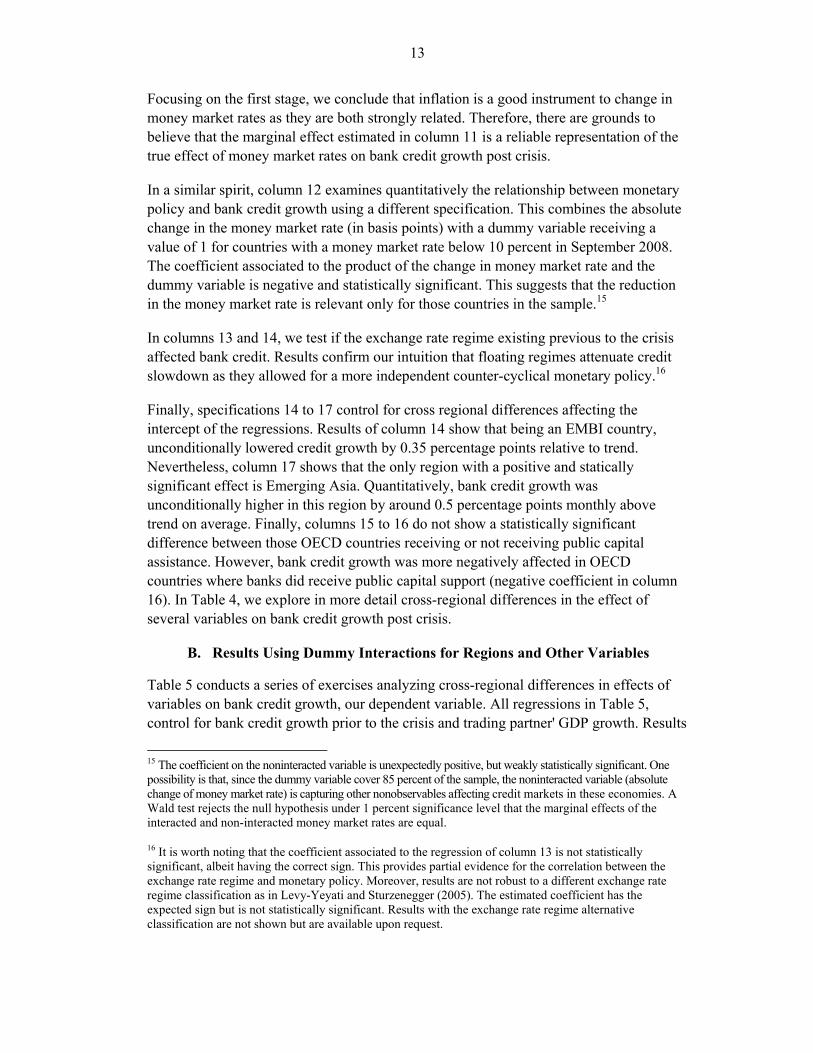
o A set of dummy variables accounting for effects of the following groups of countries: OECD members, EMBI countries (a proxy of emerging economies), developing countries, Latin America, Emerging Europe, and Emerging Asia.
Table 2 presents the descriptive statistics for the above-described dependent and independent variables.
The reduced form empirical model for the credit market can be summarized as follows:
1. Credit supply equation:
where matrix X contains lending spreads (lending rates minus money market rates), structural variables, among others.
2. Credit demand equation:
where matrix Z contains lending spreads, structural variables, among others.
3. In equilibrium:
where is our dependent variable used in the econometric estimation, while matrix contains all independent variables mentioned above.
Therefore, we estimate the above reduced form model by OLS which can be represented by the following equation:
III. EMPIRICAL RESULTS
The first objective of our empirical analysis is to identify the main macroeconomic, banking, and structural determinants of bank credit growth in the period after the Lehman Brothers collapse. Then, we conduct a series of exercises using dummy interactions to identify the differential impact of these determinants among regional groups of countries. We also use dummy variables to show that some of the determinants that, on average, seem not to be relevant to explain bank credit growth in the aftermath of the crisis, become important for countries displaying extreme values of such determinants. Finally, we perform a sensitivity analysis that checks whether or not the main results hold for different time windows for the credit boom prior to the crisis and for different de-trending definitions of bank credit. We also show that the quantitative effect of the credit boom
)( XfY s
)(ZgY d
)(* hYYY ds
*Y
11n1Y nknk e

11
previous to the crisis is much larger than in other episodes (subprime crisis) and normal times.
A. Main Determinants of Credit Growth after Crisis
The estimation results of the model described in the previous section are shown in Table 3. The dependent variable is the deviation from trend of the monthly average seasonally adjusted real bank credit growth post Lehman Brothers bankruptcy. The independent variables are those included in the matrix discussed in the previous section. The main determinant of credit growth post crisis is credit growth prior to the crisis. In column 1, a simple regression taking the boom in credit 24 months prior to the crisis as the single independent variable can explain 45 percent―as measured by the R-squared of the regression―of the evolution of bank credit after the crisis. This evidence strongly supports the existence of lending booms and busts, a stylized fact typical of several financial crisis episodes as suggested by Tornell and Westerman (2002). Moreover, this effect is strikingly robust among different specifications and is of quantitative relevance. In particular, an extra monthly increase of credit growth above the trend of one percentage point in the 24 months prior to the crisis leads to a reduction of around 2 percentage points relative to trend in the growth rate of credit after the crisis.
Another important determinant of credit growth after the crisis is the size of the external shock affecting demand across countries, which is included in three different forms in Table 3. Column 2 uses the deviation from trend growth rate of real GDP, column 3 represents the shock through the growth rate of countries’ terms of trade and column 4 uses growth of trading partners. In all measures, the coefficients are statistically significant and have the expected positive signs. Countries with higher real GDP growth after the crisis presented higher growth of real bank credit. But among the three measures, the real GDP growth of trading partners is the most suitable, since it has the highest coverage of countries. Moreover, real growth of trading partners is exogenous compared to other measures such as real GDP growth, which are clearly affected by real credit growth, our dependent variable. The coefficient of real GDP growth of trading partners is quantitatively important. A one percentage point increase in main trading partners’ GDP raises real bank credit growth by a monthly 0.1 percentage point above trend for the period after the crisis.
With the equation in column 4 as our first benchmark, we turned to columns 5 to 9 where structural and banking variables are included as determinants of bank credit growth. They all come out with the expected signs but are mostly not statistically significant, possibly due to high collinearity among variables. Bank concentration is the sole exception. Countries with a more concentrated banking industry displayed higher growth rates of bank credit, confirming our intuition and suggesting that the banking sector in these

12
countries may have been more profitable (nonetheless, measures such as return on equity are not statistically significant at standard significance levels).11
In columns 10 to 12 we considered the role played by monetary policy and liquidity effects on bank credit growth after the crisis using two measure of monetary policy. In columns 10 and 11, we used the percentage change in the money market rate in the period after the crisis as an independent variable.12 The coefficient is highly statistically significant and has the expected negative sign. Countries where the money market rate dropped the most after the crisis presented higher growth rates of bank credit. This is an important result since it shows that those countries which recovered more quickly from the liquidity freeze in the interbank market (money market) could extend more credit to the economy. This also has a strong policy content as it suggests that real bank credit grew more in countries where counter-cyclical monetary policy was more aggressive, assuming that the transmission mechanism was operating properly helping reduce money market rates.13
One problem of the estimation in column 10 is that the change in money market rate is endogenous. For example, policy rates may have been strongly reduced reacting to the bank credit crunch in several countries. In column 11, therefore, we instrument money market rates with average inflation in the last three months prior to the crisis. Results are encouraging as the marginal effect increased indicating a stronger effect of monetary policy (and liquidity) on bank credit growth.14 In particular, a 10 percentage point reduction in the rate of growth of money market rate post crisis increased the average monthly growth rate of bank credit by 0.04 percentage points. This result is quantitatively significant. Taking the case of Chile, one of the highest drops of money market rates since September 2008 (76 percent through May 2009), this reduction, ceteris paribus, contributed to an increase in bank credit of around 0.3 percent per month on average above trend in the period after the crisis. Table 4 shows results for a 2SLS regression.
11 Several additional variables were considered in the regressions but were left out of Table 3 because they were not statistically significant. These variables are 2007 nominal GDP level in US dollars, GDP per capita in 2007, real GDP growth in 2007, government expenditures growth in 2009 (both directly and instrumented using the 2008 public debt-to-GDP ratio), trade openness, external debt, current account balance, bank domestic liabilities dollarization, share of public ownership of the banking system, share of foreign ownership of the banking system, bank dependence on wholesale funding, bank regulatory capital to risk-weighted assets, bank nonperforming loans to total loans, bank provisions to nonperforming loans, and bank return on assets. Results are available upon request.
12 This measure helps us normalize the absolute change in the money market rate (in basis points) by the level of the money market rate in September 2008.
13 To better assess the extent which counter-cyclical monetary policy played a role, data on the policy rates used by central banks is needed. Unfortunately, this is not readily available. We use money market rates as proxy for central bank policy rates, a reasonable assumption during normal times. This is hardly so in turbulent times.
14 The increase in the size of the coefficient of the money market rate in the regression of column 11 (instrumented) compared to 10 (not instrumented) is associated with the endogeneity bias. This bias is positive, attenuating the negative causal effect of money market rates on credit growth, as the reaction of monetary policy to the credit slowdown was not accounted for in the noninstrumented regression in column 10.
13
Focusing on the first stage, we conclude that inflation is a good instrument to change in money market rates as they are both strongly related. Therefore, there are grounds to believe that the marginal effect estimated in column 11 is a reliable representation of the true effect of money market rates on bank credit growth post crisis.
In a similar spirit, column 12 examines quantitatively the relationship between monetary policy and bank credit growth using a different specification. This combines the absolute change in the money market rate (in basis points) with a dummy variable receiving a value of 1 for countries with a money market rate below 10 percent in September 2008. The coefficient associated to the product of the change in money market rate and the dummy variable is negative and statistically significant. This suggests that the reduction in the money market rate is relevant only for those countries in the sample.15
In columns 13 and 14, we test if the exchange rate regime existing previous to the crisis affected bank credit. Results confirm our intuition that floating regimes attenuate credit slowdown as they allowed for a more independent counter-cyclical monetary policy.16
Finally, specifications 14 to 17 control for cross regional differences affecting the intercept of the regressions. Results of column 14 show that being an EMBI country, unconditionally lowered credit growth by 0.35 percentage points relative to trend. Nevertheless, column 17 shows that the only region with a positive and statically significant effect is Emerging Asia. Quantitatively, bank credit growth was unconditionally higher in this region by around 0.5 percentage points monthly above trend on average. Finally, columns 15 to 16 do not show a statistically significant difference between those OECD countries receiving or not receiving public capital assistance. However, bank credit growth was more negatively affected in OECD countries where banks did receive public capital support (negative coefficient in column 16). In Table 4, we explore in more detail cross-regional differences in the effect of several variables on bank credit growth post crisis.
B. Results Using Dummy Interactions for Regions and Other Variables
Table 5 conducts a series of exercises analyzing cross-regional differences in effects of variables on bank credit growth, our dependent variable. All regressions in Table 5, control for bank credit growth prior to the crisis and trading partner' GDP growth. Results
15 The coefficient on the noninteracted variable is unexpectedly positive, but weakly statistically significant. One possibility is that, since the dummy variable cover 85 percent of the sample, the noninteracted variable (absolute change of money market rate) is capturing other nonobservables affecting credit markets in these economies. A Wald test rejects the null hypothesis under 1 percent significance level that the marginal effects of the interacted and non-interacted money market rates are equal.
16 It is worth noting that the coefficient associated to the regression of column 13 is not statistically significant, albeit having the correct sign. This provides partial evidence for the correlation between the exchange rate regime and monetary policy. Moreover, results are not robust to a different exchange rate regime classification as in Levy-Yeyati and Sturzenegger (2005). The estimated coefficient has the expected sign but is not statistically significant. Results with the exchange rate regime alternative classification are not shown but are available upon request.

14
for columns 1 and 2 indicate that the effect of bank credit boom prior to the crisis on credit growth after the crisis is stronger for OECD countries than in emerging or developing countries (the effect is twice as high as the average effect shown for a typical specification in Table 3). Among all emerging regions, Asia had the strongest marginal effect for the credit boom prior to the crisis. These are regions less likely to have the largest credit booms prior to the crisis, so the size of the marginal coefficients explaining any credit bust in OECD and Emerging Asia need to be larger than in other regions of the world for a bust of similar magnitude after the crisis. In columns 3 and 4 we examine if the external shock affected credit differently across regions. Our results show that Emerging Asia is the region that suffered the most, possibly reflecting the stronger deceleration in GDP growth of its partners located in other regions of the world where the crisis was more severe. Column 5 shows differences across regions of the effect of monetary policy on credit growth. Money market rates seem important in OECD countries reflecting both major drops in liquidity premiums after the crisis as well as aggressive counter-cyclical monetary policies in member countries.
Table 6 presents results of several regression specifications that include interaction terms. In column 1, we examine if the credit boom before the crisis has a nonlinear effect on credit growth after the crisis. To accomplish that, we use an interaction term equal to the product between the variable credit boom and a dummy variable that receives 1 if the credit boom prior to the crisis is above the 75th percentile of the distribution of credit booms, and zero otherwise. Results suggest that the effect of the credit boom prior to the crisis is similar for countries having high or low credit booms. Similarly, we examine nonlinear effects in growth of main trading partners. The evidence does not show significant differences of effect among high and low levels for this variable. Using the same methodology in columns 3 to 7, we examine five additional variables where effects may be different depending where the country is located on the statistical distribution of the specific variable. Two results are worth mentioning. Firstly, financial depth seems to contribute to credit growth, but countries with low financial depth (using credit/GDP as proxy) were marginally better off compared to countries with high financial depth, against our initial intuition.17 Secondly, and more importantly, countries with low financial integration have performed better in terms of bank credit growth than those highly integrated. This is an important result as it suggests that in a financial crisis episode of global proportions, being less financially integrated insulates the banking system in particular, and the economy as a whole, from external financing disruptions.
C. Sensitivity Analysis
Table 7 presents results for three different sensitivity tests to check for the robustness of our results. All regressions in the table present results controlling for growth of trading partners’ GDP. In columns 1 to 5, we define credit booms for four different time windows for credit growth prior to the crisis, contrasting with the window of 24 months used in
17 The marginal effect is 0.32 compared to 0.20. This is very small difference given the standard errors of these parameters.
15
Tables 3 to 6. Results are statistically significant for all definitions. Interestingly, the size of the marginal effect of the boom prior to the crisis is increasing with the timeframe defined for the boom. This may reflect the fact that booms of longer periods are consistent with higher larger credit reversals. This result is in line with those highlighted in the literature of crisis prevention. According to Biggs, Meyer, and Pick (2009) five-year lending booms are good predictors of financial distress. Results in column 2, which use our main definition of boom (24 months), show the highest R-squared among all measures, an extra reason for the selection of this time window for our baseline regressions.
Column 6 changes the definition of trend for the calculation of the dependent and independent variables maintaining the window of 24 months. Instead of using the last data point (May 2009), we excluded the months after the crisis in the trend calculation, assuming simply that the trend would continue its evolution as there was no crisis. It is worth noting that this is a very conservative assumption as the crisis may or may not be viewed as a structural break in the country series looking forward. The effect of the credit boom is still statistically significant, at 10 percent significance level, albeit of smaller size.
Finally, columns 7 and 8 show results for credit booms taken for different periods using the same dataset. In column 7, we use the subprime crisis episode and in column 8, a small correction in 2006. In both cases, for consistency, we maintained the window of 24 months for bank credit growth before the crisis and the eight month average period (since Lehmann Brothers collapse) that we apply in our exercises. In both cases, the effects are still statistically significant, but the size of the coefficients are less than half of those presented in Table 3. This shows that the credit booms before the 2008 financial crisis is of much large importance in explaining the bust thereafter than in other periods, giving preeminence to the 2008 financial crisis.
IV. CONCLUSIONS
The main purpose of this paper was to identify the main determinants of bank credit growth after the 2008 financial crisis. Using a dataset covering about 80 countries for the period January 2002 to May 2009, and applying standard cross-section econometric techniques, we found that credit booms prior to the crisis is an important determinant of credit contraction observed in the aftermath of the crisis. This result is in line with the literature of lending booms and busts cycles as in Tornell and Westerman (2002) among others. We also found that the external shock affected countries differently depending on the growth performance of their main trading partners. Additionally, we found that bank credit responded very differently among world regions, which can be partially explained by the diversity in countries’ structural characteristics including, for example, financial depth and international financial integration. Finally, the role of counter-cyclical monetary policy and liquidity was extremely important, alleviating the credit crunch in the period after the crisis.
Our main contribution to the literature is to document the behavior of banks in their most essential task as financial intermediaries, namely extend credit. This paper is timely as the

16
world recovers from the major post–World War II financial turmoil. We believe that this is a contribution of high policy content to all countries. Developing nations have benefited from their low financial integration in the context of this global crisis, but this does not necessarily mean that they should avoid pursuing financial integration with the rest of the world. To be sure, navigating in a volatile financial world demands an institutional framework conducive to counter-cyclical monetary policies. The results in this paper suggest that they may at least alleviate the effects of the crisis on bank credit.
17
Average AverageAverage crisis crisis pre-crisis pre-LB post-LB
4/ 5/ 6/ Aug.08 Sep.08 Oct.08 Nov.08 Dec.08 Jan.09 Feb.09 Mar.09 Apr.09 May.09
Angola 3.7 3.6 2.9 1.8 3.3 3.4 3.5 5.2 3.2 -2.8 2.9 4.8 3.0Argentina 1.7 1.6 0.6 0.7 1.4 1.6 -0.6 0.3 0.1 1.7 1.0 0.5 0.2Armenia 2.8 4.0 0.6 2.5 2.7 3.1 0.2 2.2 2.0 1.0 2.8 -5.2 -1.3Austria 0.4 0.3 0.5 0.9 0.8 1.0 -0.2 2.6 -0.1 -0.2 0.3 0.3 0.1Bahamas 0.9 0.3 0.1 0.9 -0.2 0.3 0.4 -0.1 0.0 0.3 -0.4 0.0 0.4Belgium 1.1 0.6 0.3 1.9 -0.8 1.1 0.1 -1.2 0.0 -0.3 0.1 -1.3 4.1Botswana 0.6 1.3 0.6 1.2 5.0 0.5 -1.4 1.1 5.2 -1.1 -1.6 2.8 -0.6Brazil 1.7 1.8 0.6 1.9 3.2 2.3 2.4 1.0 -1.5 0.4 -1.5 1.3 0.1Bulgaria 7/ 2.0 2.2 0.4 2.6 1.3 1.1 1.1 -0.3 1.6 0.4 -0.2 -0.2 -0.3Burundi 0.1 0.0 1.5 -1.8 0.8 1.5 -0.2 -0.8 0.2 2.0 4.5 2.2 2.3Cambodia 2.4 3.4 0.9 2.9 1.9 2.4 4.2 0.9 2.0 -1.4 -0.7 0.0 0.2Cape Verde 0.7 1.6 1.4 2.9 1.8 -0.5 1.2 1.5 0.6 1.4 2.7 3.3 1.1Chile 1.0 0.7 0.4 -1.0 2.2 3.4 -0.4 2.5 -0.6 -1.1 -0.6 0.8 -0.8China; Hong Kong 0.4 0.5 -0.7 2.8 -5.1 -1.4 -4.0 1.8 -0.6 -3.3 -5.7 9.9 -2.4China; Macao 1.2 2.5 0.1 1.4 3.6 1.4 -1.9 0.2 -0.6 2.8 -0.1 -0.1 -0.9Colombia 1.5 1.3 -0.1 -0.6 3.3 0.3 -0.4 -0.8 1.8 0.2 -0.3 0.7 -2.6Costa Rica 1.4 1.5 0.9 -0.6 -0.1 0.1 -1.9 6.0 1.4 0.1 0.1 0.8 0.3Croatia 1.5 0.3 0.4 0.9 0.6 1.9 0.4 1.7 0.4 -0.1 -0.3 -0.5 -0.7Czech Republic 7/ 1.5 1.2 0.4 1.5 0.7 0.8 0.9 0.5 0.9 0.6 -0.4 0.2 -0.1Denmark 7/ 0.9 0.6 0.3 0.2 0.3 1.6 1.1 0.8 0.3 -0.8 -0.2 0.0 -0.7Dominican Republic 0.8 0.7 0.7 0.3 -0.2 0.9 3.1 1.2 -0.5 -0.2 -0.1 0.7 0.7Ecuador 1.2 0.8 -0.3 2.2 1.4 1.9 1.6 0.1 -0.4 -0.4 -2.7 -1.6 -1.1Egypt 0.2 -0.4 -0.5 -0.9 1.3 1.5 -0.6 0.3 0.5 -0.8 -1.3 -1.0 -2.9El Salvador 0.5 0.0 -0.6 0.2 0.4 0.1 0.1 -1.4 -0.1 -0.8 -1.2 -0.5 -0.8Estonia 7/ 2.4 0.4 0.0 0.5 -0.8 -1.0 0.3 -0.6 1.6 0.1 0.0 0.0 -0.5Fiji 1.2 -0.1 0.8 -0.2 0.7 1.4 2.6 0.1 -1.2 3.6 0.6 0.3 -0.7Finland 0.8 0.6 0.3 0.7 0.3 0.6 0.8 0.1 0.2 0.6 0.0 0.1 0.1France 0.7 0.4 -0.1 0.4 -0.1 1.0 1.2 -0.2 -0.1 -0.8 -0.5 -0.8 -0.2Georgia 3.8 2.3 0.4 -6.8 -1.3 0.9 9.2 2.1 0.8 0.6 -3.3 -3.6 -3.1Germany -0.1 0.0 0.3 0.9 0.0 0.4 0.3 1.6 -0.1 0.1 0.3 -0.2 0.0Greece 1.2 0.7 -0.4 1.6 0.1 2.1 0.0 -1.8 0.7 -1.7 -0.9 0.4 -2.3Guatemala 0.6 -0.2 0.5 0.1 1.0 -0.1 2.0 0.9 -0.6 0.3 1.2 0.3 0.0Haiti -0.3 0.9 0.6 2.2 -2.7 -1.3 0.7 1.3 -3.6 4.1 0.2 1.4 2.1Honduras 1.6 0.7 -0.3 0.0 0.3 -1.3 0.0 -0.1 0.4 -0.5 -0.1 -0.5 0.1Hungary 7/ 1.7 0.8 1.3 1.6 0.2 12.4 -3.7 2.2 5.7 -0.5 1.0 -4.1 -2.4Indonesia 0.4 1.5 0.7 2.0 1.0 4.7 2.8 -3.0 2.3 0.7 -0.9 -0.6 0.0Ireland 1.4 0.6 0.7 0.7 -0.2 0.2 0.6 -0.5 4.8 1.2 -0.8 0.5 0.0Italy 0.6 0.5 0.0 0.4 0.8 0.1 -0.9 1.2 0.2 0.0 -0.1 -0.2 0.0Japan 0.2 -0.2 0.4 -0.3 -0.6 0.4 0.8 0.6 0.3 -0.1 0.1 0.3 1.0Jordan 1.3 0.0 0.5 -0.2 0.1 1.2 0.2 2.6 1.7 0.0 -0.3 -0.7 -1.1Kazakhstan 4.5 -0.6 1.4 -1.2 0.6 0.1 2.1 -0.1 1.7 10.4 -0.6 -1.3 -1.4Kenya -0.1 0.3 -0.5 0.3 -1.2 1.3 -2.2 -1.1 0.3 -1.8 -2.1 -12.7 14.1Latvia 7/ 3.2 0.3 -0.1 0.6 0.7 0.2 3.9 0.6 -0.6 -1.9 -3.2 0.8 -0.4Lithuania 7/ 3.1 1.4 -0.7 1.0 1.0 -0.2 1.2 -1.7 -1.9 -0.7 -1.3 -0.2 -0.5Luxembourg 1.9 2.9 -1.9 6.6 0.8 1.0 -2.6 -9.6 -3.3 0.9 -4.9 3.6 -0.1Macedonia 1.9 2.3 0.9 1.7 2.5 2.0 1.7 0.9 2.4 1.1 0.0 0.1 -0.6Mauritius 0.4 1.0 0.9 -1.2 3.3 5.0 -0.3 3.1 -1.9 1.2 1.1 0.2 -0.9Mexico 1.6 0.1 -0.3 -0.8 -1.9 -0.2 -0.1 0.1 0.9 -0.3 -1.1 -0.6 -1.3Moldova 2.0 1.9 -0.4 -0.3 2.2 -4.4 1.0 0.1 0.2 1.1 0.5 0.1 -1.7Mongolia 3.1 1.4 -0.7 -1.2 1.6 1.4 -0.1 -0.3 0.8 2.0 -4.7 -3.5 -1.2Morocco 0.9 1.8 1.1 2.8 2.5 2.0 1.2 0.4 0.4 0.8 0.9 1.1 1.6Mozambique 1.2 2.0 3.5 -1.1 4.9 5.4 1.7 7.2 4.0 1.9 5.0 -0.4 3.1Netherlands 0.6 1.0 0.0 0.4 0.6 1.1 0.5 -2.4 0.6 0.3 -0.4 0.2 0.1Netherlands Antilles 1.2 0.3 0.9 0.7 -0.4 0.9 1.2 0.6 2.4 2.0 0.6 0.1 -0.1Nicaragua 1.6 0.3 -0.5 0.1 -0.1 -0.6 -0.2 -0.9 -0.9 -0.3 0.4 -1.0 0.0Nigeria 2.1 4.8 0.0 1.5 0.9 1.0 0.4 1.4 2.9 -3.0 -1.2 -0.4 -1.0Panama 0.9 0.7 0.6 1.1 0.9 0.9 1.2 1.1 0.9 0.6 0.5 -0.1 0.0Paraguay 0.9 2.0 1.7 2.1 4.0 4.4 0.5 1.4 1.5 2.1 0.9 2.9 -0.3Peru 1.1 1.7 1.1 3.5 1.7 5.3 0.8 2.6 2.4 1.1 -1.2 -3.5 1.3Poland 7/ 1.5 1.8 1.6 2.9 2.6 4.2 1.0 5.3 2.3 1.9 -0.3 -2.0 0.7Portugal 0.6 0.7 0.6 0.9 -0.1 0.9 1.8 -0.3 1.4 -0.1 0.6 0.3 0.4Romania 3.1 3.2 0.2 2.1 4.0 -1.2 0.9 2.3 3.8 1.3 -3.4 -1.2 -0.9Russia 2.7 1.9 0.2 1.9 0.8 1.0 0.4 -0.1 6.2 -0.6 -2.7 -0.6 -1.9Samoa 1.3 -0.8 0.3 0.1 -3.3 2.8 -0.9 0.1 2.2 -0.2 -0.3 -0.1 -1.1Saudi Arabia 1.1 1.5 -0.2 0.4 1.2 0.6 1.1 -0.7 0.4 0.0 -0.7 -0.7 -1.7Serbia 1.9 1.3 1.4 1.9 2.9 5.5 1.7 2.1 1.6 -0.6 1.5 0.5 -1.3Seychelles 0.9 -0.2 -0.2 -3.3 2.7 2.2 -10.6 12.0 -0.1 -0.2 2.3 -3.2 -4.2Singapore 0.4 0.9 0.3 0.6 0.8 0.8 0.1 0.4 0.2 0.5 0.0 1.4 -1.0South Africa 1.4 0.3 0.1 0.2 -0.4 0.6 -0.3 0.3 1.0 -0.4 -0.2 -0.1 -0.6Spain 1.4 0.5 1.4 1.4 0.4 0.3 0.8 7.9 0.4 0.8 0.4 0.0 0.4Sudan 2.7 -0.1 0.0 1.8 1.0 1.0 0.5 0.1 0.8 -0.4 -0.8 -0.3 -0.6Sweden 7/ 0.8 0.4 0.5 0.3 1.1 0.6 1.0 0.1 0.3 0.7 0.4 0.7 0.0Switzerland 0.6 0.1 0.2 0.1 -0.6 -0.2 0.3 0.0 1.2 -0.1 0.3 -0.5 0.4Tanzania 2.0 0.8 2.6 7.1 -9.7 8.7 7.9 2.2 -1.2 0.4 0.3 0.4 2.3Thailand 0.1 0.2 0.5 3.6 0.6 1.6 0.8 1.1 0.8 -1.4 -0.5 0.5 1.0Trinidad and Tobago 1.1 0.1 -0.2 -0.7 -1.7 0.1 0.4 -1.8 0.6 1.9 -2.6 -1.1 0.4Tunisia 0.3 0.6 0.6 1.2 1.5 1.5 0.3 0.8 0.4 0.3 0.9 0.6 -0.2Turkey 1.8 1.7 -0.4 1.2 3.9 0.3 -0.8 -1.3 0.5 -0.2 -1.4 -0.3 -0.1Ukraine 0.1 0.0 -0.5 -0.1 0.1 -0.1 0.2 -2.5 -0.2 -0.4 -0.4 -0.5 -0.3United Kingdom 0.7 0.8 0.7 2.6 -0.3 2.8 1.9 3.0 -0.9 0.4 -0.1 -1.0 -0.5Uruguay 0.6 1.5 -0.2 1.8 5.3 5.9 0.6 -3.2 -3.6 1.4 -3.1 0.3 0.2Venezuela 3.5 0.7 -0.5 -0.2 -0.8 -0.2 -2.2 -0.5 1.9 0.8 -1.5 -1.7 -0.3Zambia 1.3 2.3 1.6 1.1 2.6 8.4 1.2 1.8 0.2 6.4 -1.3 -1.1 -3.2
Source: Author's own elaboration based on data from the IFS.
1/ Real credit series were constructed using nominal bank credit (line 22nd of the IFS) and CPI inflation (line 64 of the IFS) as deflator.2/ The selected countries in the sample meet two requirements: (i) data must be available from at least January 2004 until May 2009; (ii) excludes outliers, countries with average credit growth rate for the complete sample period outside a 95 percent confidence interval of +/- two standard deviations from the sample's average.
4/ Monthly growth rates averages from July 2005 to June 2007.5/ Monthly growth rates averages from July 2007 to September 2008.6/ Monthly growth rates averages from October 2008 to May 2009.7/ Data includes real bank credit to both domestic and foreign clients.
3/ Euro area countries data includes, in addition to bank credit to the private sector, the bank credit to state and local government and bank credit to public nonfinancial corporations (line 22s of the IFS).
Table 1. Growth of Real Bank Credit to Domestic Private Sector, Per Country 1/ 2/ 3/(Seasonally adjusted month-over-month growth rates, percentages)

18
Std. Variable Mean Dev. Min Max
Real credit growth post LB bankruptcy (October 2008–May 2009) -0.39 0.76 -2.88 1.54Real credit growth pre LB bankruptcy (September 06–August 2008) 0.09 0.32 -0.78 1.26Real GDP growth (Q4:2008–Q1:2009) -3.98 4.23 -14.90 1.40Trading partners' GDP growth (Q4:2008–Q1:2009) -2.55 1.06 -6.20 -0.26Percentage change in terms of trade (Q4.08) 0.98 13.6 -16.0 72.2Percentage change in money market rate (September 2008–May 2009) -30 80 -97 497Credit over GDP (2007) 60 48 2 253Nominal GDP level (2007) 438 1,466 1 14,078GDP per capita (2007) 13,180 18,058 125 103,591Real GDP growth (2007) 5.50 3.33 -6.60 20.3Real GDP growth - deviation from trend (2007) 1.79 2.43 -2.40 16.3Financial integration index (2007) 0.72 1.59 -1.81 2.54Trade openness (2007) 104 67 26 433External debt (percent of GDP, 2007) 43 35 3 221Current account balance (percent of GDP, 2007) -2.7 10.4 -25.2 25.7Bank domestic liabilities dollarization (2004) 0.21 0.41 0.00 3.08Share of public ownership of the banking system (2002) 0.14 0.18 0.00 0.86Share of foreign ownership of the banking system (2002) 0.34 0.28 0.00 0.96Bank leverage (2007) 12.8 5.22 4.40 30.3Bank return on equity (2007) 19.0 8.34 4.7 47.7Bank return on assets (2007) 1.73 0.92 0.10 3.90Bank concentration (2007) 0.69 0.20 0.16 1.00Bank dependence on wholesale funding 0.44 0.13 0.19 0.65Bank regulatory capital to risk-weighted assets (2007) 14.6 4.08 10.0 30.1Bank nonperforming loans to total loans (2007) 3.9 4.11 0.2 19.3Bank provisions to nonperforming loans (2007) 97.1 51.35 25.7 214.6Exchange rate regime (2005) 1.90 0.98 1 3
Table 2. Descriptive Statistics

19
(1) (2) (3) (4) (5) (6) (7) (8) (9) (10) (11) (12) (13) (14) (15) (16) (17)
Credit boom and bustReal credit growth -1.8587*** -2.4440*** -1.9566*** -1.8176*** -2.0104*** -1.6334*** -1.6459*** -2.1739*** -2.2477*** -2.2243*** -2.4184*** -2.1139*** -1.6192*** -2.1200*** -1.8382*** -1.8365*** -1.8118***(September 2006–August 2008) 4/ (0.2801) (0.6485) (0.4284) (0.2731) (0.2718) (0.2546) (0.2818) (0.3490) (0.3461) (0.3251) (0.3715) (0.3081) (0.3286) (0.3702) (0.3009) (0.3010) (0.3008)
Demand shock controlsGDP growth 4/ 0.0379***(Q4:2008–Q1:2009) (0.0131)Percentage change in terms of trade 0.0249**(Q4:2008–Q1:2009) (0.0114)Trading partners' GDP growth 0.0992** 0.0792* 0.1002** 0.0974* 0.0595 0.0493 0.0191 -0.0454 0.0747 0.0724 0.032 0.0881* 0.0870* 0.0926(Q4:2008–Q1:2009) (0.0433) (0.0463) (0.0440) (0.0490) (0.0479) (0.0469) (0.0531) (0.0871) (0.0538) (0.0982) (0.1085) (0.0455) (0.0461) (0.0684)
Structural variablesCredit over GDP 0.0012(2007) (0.0010)Financial integration -0.0521(2007) (0.0471)
Micro-banking variablesConcentration 0.7304*(2007) (0.4041)Leverage -0.0005(2007) (0.0140)Return on equity 0.0025(2007) (0.0092)
Monetary policyPercentage change in money market rate -0.0014*** -0.0039**(September 2008–May 2009) (0.0004) (0.0017)Basis points change in money market rate 0.0568* 0.0638(September 2008–May 2009) (0.0318) (0.0565)Basis points change in money market rate, -0.0907*** -0.1354**for countries with a money market rate below 10 percent in September 2008 (0.0313) (0.0575)(September 2008–May 2009)
Exchange rate regime -0.0039 -0.1347*(2005) (0.0559) (0.0727)
Country dummies 5/OECD -0.1091 -0.0694 -0.079
(0.1951) (0.1613) (0.1701)OECD with banks receiving public capital support -0.1174
(0.1919)OECD with banks not receiving public capital support 0.0094
(0.2112)EMBI -0.3489** -0.1549 -0.1669
(0.1647) (0.1330) (0.1319)Latin America -0.2293
0.1521Emerging Europe -0.1792
0.2565Emerging Asia 0.4954**
0.191Constant -0.2266*** 0.0346 -0.3198*** 0.0314 -0.1055 0.1039 -0.4701 -0.0792 -0.1516 -0.2218 -0.4546* -0.0098 -0.1131 0.3071 0.0697 0.071 0.0976
(0.0676) (0.0976) (0.0790) (0.1373) (0.1859) (0.1512) (0.3583) (0.2601) (0.2071) (0.1615) (0.2613) (0.1771) (0.2500) (0.3039) (0.1557) (0.1566) (0.1880)Observations 83 37 35 82 67 79 73 59 60 47 47 46 35 57 82 82 82R^2 0.45 0.54 0.61 0.47 0.61 0.49 0.47 0.58 0.58 0.63 0.52 0.68 0.63 0.49 0.48 0.48 0.51Ajusted R^2 0.44 0.52 0.58 0.46 0.59 0.47 0.45 0.55 0.56 0.60 0.48 0.65 0.57 0.44 0.46 0.45 0.47
1/ Deviation from trend, monthly average October 2008–May 2009, seasonally adjusted rates.2/ ***Statistical significance at 1%, ** 5%, and * 10%. 3/ Standard errors in parenthesis.4/ Deviation from trend.5/ OECD: Austria, Belgium, Czech Republic, Denmark, Finland, France, Germany, Greece, Hungary, Ireland, Italy, Japan, Luxembourg, Mexico, Netherlands, Poland, Portugal, Spain, Sweden, Switzerland, Turkey, and United Kingdom. EMBI: Argentina, Brazil, Bulgaria, Chile, Colombia, Dominican Republic, Ecuador, Egypt, El Salvador, Georgia, Hungary, Indonesia, Kazakhstan, Mexico, Panama, Peru, Poland, Russia, Serbia, South Africa, Tunisia, Turkey, Ukraine, Uruguay, and Venezuela. Latin America: Argentina, Brasil, Chile, Colombia, Costa Rica, Ecuador, El Salvador, Guatemala, Haiti, Honduras, Mexico, Nicaragua, Panama, Paraguay, Peru, Dominican Republic, Uruguay, and Venezuela. Emeging Europe: Bulgaria, Croacia, Estonia, Latvia, Lithuania, Macedonia, Moldova, Romania, Russia, Serbia, Turkey, and Ukraine. Emerging Asia: Indonesia, Kazakhstan, and Thailand.
Table 3. Baseline Regressions
Dependent Variable: Real credit growth post-Lehman Brothers bankruptcy 1/ 2/ 3/

20
First-stage regressions
Source SS df MS Number of obs = 47Model 91584.086 3 30528.0287 F( 3, 43) = 4.180
Residual 313899.881 43 7299.99723 Prob > F = 0.011Total 405483.967 46 8814.86884 R-squared = 0.2259
Adj R-squared = 0.1719Root MSE = 85.44
Coef. Std. Err. t P>t [95% Conf. Interval]
Real credit growth -83.379 55.539 -1.50 0.141 -195.4 28.63(September 2006–August 2008) 1/Trading partners' GDP growth -17.733 11.125 -1.59 0.118 -40.17 4.703(Q4:2008–Q1:2009)YoY inflation rate 5.5700 2.2913 2.43 0.019 0.949 10.19(June-August 2008)Constant -123.08 34.045 -3.62 0.001 -191.74 -54.43
Instrumental variables (2SLS) regression Number of obs = 47F( 3, 43) = 17.73Prob > F = 0.000R-squared = 0.5153Root MSE = 0.480
Coef. t P>t [95% Conf. Interval]
Percentage change in money -0.0039 0.0017 -2.28 0.028 -0.007 0.000market rate (September 2008–May 2009)Real credit growth -2.4184 0.3715 -6.51 0.000 -3.167 -1.669(September 2006–August 2008) 1/Trading partners' GDP growth -0.0454 0.0871 -0.52 0.605 -0.221 0.130(Q4:2008–Q1:2009)Constant -0.4546 0.2613 -1.74 0.089 -0.982 0.072
1/ Deviation from trend.
Percentage change in money market rate (September 2008–May 2009)
Real credit growth (October 2008–May 2009) 1/
Robust Std. Err.
Table 4. Instrumental Variable Regressions for Explanatory Variable: Percentage Change in Money Market Rate (September 2008-May 2009)
Instruments: Real credit growth (September 2006–August 2008), 1/ trading partners' GDP growth (Q4:2008–Q1:2009), year-on-year inflation rate (June–August 2008).
Instrumented: Percentage change in money market rate (September 2008-May 2009).

21
(1) (2) (3) (4) (5)Real credit growth * OECD -4.0138*** -4.0160***(September 2006–August 2008) 4/ (1.1188) (1.1233)Real credit growth * developing countries 1.5710*** -1.4666***(September 2006–August 2008) 4/ (0.2914) (0.2907)Real credit growth * EMBI -1.6672***(September 2006–August 2008) 4/ (0.4283)Real credit growth * Latin America -0.601(September 2006–August 2008) 4/ (1.2659)Real credit growth * Emerging Europe -1.0350*(September 2006–August 2008) 4/ (0.5321)Real credit growth * Emerging Asia -1.9867**(September 2006–August 2008) 4/ (0.8634)
Trading partners' GDP growth * OECD -0.0509 -0.0532(Q4:2008–Q1:2009) (0.1927) (0.1947)Trading partners' GDP growth * developing countries 0.0687 0.0145(Q4:2008–Q1:2009) (0.0838) (0.0442)Trading partners' GDP growth * EMBI 0.0648(Q4:2008–Q1:2009) (0.0714)Trading partners' GDP growth * Latin America -0.0887(Q4:2008–Q1:2009) (0.2318)Trading partners' GDP growth * Emerging Europe -0.0511(Q4:2008–Q1:2009) (0.0766)Trading partners' GDP growth * Emerging Asia -0.4668***(Q4:2008–Q1:2009) (0.1432)
Percentage change in money market rate * OECD -0.0273*(September 2008–May 2009) (0.0143)Percentage change in money market rate * developing countries -0.0002(September 2008–May 2009) (0.0054)Percentage change in money market rate * EMBI -0.0023(September 2008–May 2009) (0.0020)
Real credit growth -1.8307*** -1.8298*** -1.9543**(September 2006–August 2008) 4/ (0.3057) (0.3172) (0.7765)
Trading partners' GDP growth 0.071 0.115 -0.0044(Q4:2008–Q1:2009) (0.0722) (0.0746) (0.1527)
OECD -0.024 -0.0137 -0.3575 -0.2436 -1.8742*(0.1556) (0.1471) (0.4934) (0.5082) (0.9582)
Latin America -0.2320 -0.2814 -0.2001 -0.3911 -0.1609(0.1575) (0.1727) (0.1596) (0.5413) (0.2236)
Emerging Europe -0.298 -0.1431 -0.1923 -0.5673 -0.292(0.2843) (0.3136) (0.2676) (0.3977) (0.3698)
Emerging Asia 0.4677** 0.5426** 0.4823** -1.0917** 0.3349(0.1991) (0.2666) (0.1876) (0.4927) (0.2432)
Constant 0.0405 0.1318 0.027 -0.0957 -0.2101(0.1958) (0.2002) (0.1848) (0.1269) (0.4167)
Observations 82 82 82 82 47R^2 0.55 0.53 0.51 0.50 0.65Adjusted R^2 0.50 0.46 0.45 0.43 0.56
1/ Deviation from trend, monthly average October 2008–May 2009, seasonally adjusted rates.2/ ***Statistical significance at 1 percent, ** 5 percent, and * 10percent. 3/ Standard errors in parenthesis.4/ Deviation from trend.
Table 5. Interactions with Regions
Dependent Variable: Real credit growth post-Lehman Brothers bankruptcy 1/ 2/ 3/

22
(1) (2) (3) (4) (5) (6) (7)Real credit growth * High real credit growth -1.8556***(September 2006–August 2008) 5/ (0.2735)Real credit growth * Low real credit growth -1.8220**(September 2006–August 2008) 5/ (0.8104)
Trading partners' GDP growth * High trading partners' GDP growth -0.1207(Q4:2008–Q1:2009) (0.1111)Trading partners' GDP growth * Low trading partners' GDP growth 0.0351(Q:2008–Q1:2009) (0.0293)
High credit over GDP 0.2056*(2007) (0.1074)Low credit over GDP 0.3252*(2007) (0.1653)
High financial integration 0.0152(2007) (0.1152)Low financial integration 0.3999*(2007) (0.2136)
High concentration 0.1458(2007) (0.1417)Low concentration -0.1771(2007) (0.1717)
High leverage -0.0072(2007) (0.1855)Low leverage -0.1755(2007) (0.1416)
High return on equity -0.074(2007) (0.1744)High return on equity -0.0008(2007) (0.1222)
Real credit growth -1.8044*** -1.7974*** -1.6999*** -1.7442*** -1.7601*** -1.8036***(September 2006–August 2008) 5/ (0.2674) (0.2592) (0.2664) (0.2685) (0.2995) (0.2845)Trading partners' GDP growth 0.1100** 0.0846* 0.0775* 0.0924** 0.0927** 0.0952**(Q4:2008-Q1:2009) (0.0449) (0.0451) (0.0431) (0.0435) (0.0436) (0.0454)Constant -0.0043 -0.2312*** -0.0977 -0.1195 0.0318 0.0532 0.0342
(0.1505) (0.0871) (0.1586) (0.1503) (0.1311) (0.1462) (0.1400)
Observations 82 82 82 82 82 82 82R^2 0.48 0.47 0.50 0.51 0.49 0.48 0.47Adjusted R^2 0.46 0.45 0.47 0.49 0.47 0.46 0.45
1/ Deviation from trend, monthly average October 2008-May 2009, seasonally adjusted rates.2/ ***Statistical significance at 1 percent, ** 5 percent, and * 10 percent. 3/ Standard errors in parenthesis.4/ "High" refers to the observations above the 75th percentile, and "Low" to the observations below the 25th percentile.5/ Deviation from trend.
Table 6. Other Interactions
Dependent Variable: Real credit growth post-Lehman Brothers bankruptcy 1/ 2/ 3/ 4/

23
(1) (2) (3) (4) (5) (6) (7) (8)Dependent Variable
Oct.08-May.09
Oct.08-May.09
Oct.08-May.09
Oct.08-May.09
Oct.08-May.09
Oct.08-May.09 4/
Aug.07-Mar.08
Mar.06-Oct.06
Real credit growth -0.5818***(September 2007–August 2008) 5/ (0.1539)Real credit growth -1.8176***(September 2006–August 2008) 5/ (0.2731)Real credit growth -2.3357***(September 2005–August 2008) 5/ (0.5698)Real credit growth -3.2952***(September 2004–August 2008) 5/ (0.9200)Real credit growth -3.5624***(September 2003–August 2008) 5/ (0.8148)
Real credit growth - different trend 4/ -0.5758*(September 2006–August 2008) 5/ (0.3390)
Real credit growth -0.8998***(August 2005–July 2007) 5/ (0.2068)Real credit growth -0.7709***(March 2004–February 2006) 5/ (0.1959)
Trading partners' GDP growth 0.1613*** 0.0992** 0.1001** 0.0907 0.1512** 0.1733** -0.0275 -0.0159(Q4:2008-Q1:2009) (0.0601) (0.0433) (0.0483) (0.0559) (0.0608) (0.0823) (0.0551) (0.0540)Constant 0.005 0.0314 0.112 0.0488 0.1387 -0.075 0.1137 -0.0104
(0.1976) (0.1373) (0.1568) (0.1831) (0.1919) (0.2624) (0.1603) (0.1587)
Observations 82 82 82 82 82 82 109 109R^2 0.24 0.47 0.32 0.27 0.29 0.08 0.23 0.17Adjusted R^2 0.23 0.46 0.31 0.25 0.27 0.06 0.21 0.15
1/ Deviation from trend, monthly average, seasonally adjusted rates.2/ ***Statistical significance at 1 percent, ** 5 percent, and * 10 percent.3/ Standard errors in parenthesis.4/ The trend is calculated using HP filters and data from January 2002 until August 2008. For the other variables of this table the data used to calculate the trend was from January 2002 until the last available month.5/ Deviation from trend.
Real credit growth post-Lehman Brothers bankruptcy (1)-(6) Real credit growth in other periods (7)-(8)
Table 7. Sensitivity Analysis
Dependent Variable: Real credit growth 1/ 2/ 3/

24
REFERENCES
Beck, T., A. Demirgüç-Kunt, and R. Levine, 2000, “A New Database on Financial Development and Structure,” World Bank Economic Review, Vol. 14, pp. 597–605.
Bernanke, B., and M. Gertler, 1995, “Inside the Black Box: The Credit Channel of Monetary Policy Transmission,” The Journal of Economic Perspectives, Vol. 9, No. 4, pp. 27–48.
Biggs, M., T. Meyer, and A. Pick, 2009, “Credit and Economic Recovery,” DNB Working Papers 218 (Netherlands Central Bank, Research Department).
Calderon, C., and K. Smith-Hebbel, 2008, “What Drives Inflation in the World?” Central Bank of Chile Working Paper, No. 491.
Calvo, G., L. F. Mejía, and A. Izquierdo, 2008, “Systemic Sudden Stops: The Relevance of Balance-Sheet Effects and Financial Integration,” National Bureau of Economic Research, NBER Working Paper, No. 14026 (Cambridge, Massachusetts: MIT Press).
Chinn, M., and H. Ito, 2006, “What Matters for Financial Development? Capital Controls, Institutions, and Interactions," Journal of Development Economics, Vol. 61, pp. 163–192.
Eichengreen, B., and K. Mitchener, 2003, “The Great Depression as a Credit Boom Gone Wrong,” BIS Working Paper, No.137.
Freixas, X., and J. C. Rochet, 2008, Microeconomics of Banking, (Cambridge, Massachusetts: MIT Press, 2nd ed.).
Hofman, B., 2001, “The Determinants of Private Sector Credit in Industrialized Countries: Do Property Prices Matter?” BIS Working Papers, No. 108.
International Monetary Fund, May 2009, Global Financial Stability Report (Washington).
Levine, R., and S. Zervos, 1998, “Stock Markets and Economic Growth,” The American Economic Review, Vol.88, No.3, pp.537–558.
Levy-Yeyati, E., and F. Sturzenegger, 2005, “Classifying Exchange Rate Regimes: Deeds vs. Words,” European Economic Review, Vol. 49, pp. 1603–1635.
Loser, C., 2009, “Global Financial Turmoil and Emerging Market Economies: Major Contagion and a Shocking Loss of Wealth?” (Centennial Group Latin America, Prepared for the Asian Development Bank).
Micco, A., U. Panizza, and M. Yañez, 2004, “Bank Ownership and Performance,” Research Department Working Papers; No. 518 (Inter-American Development Bank).

25
Mishkin, F., 2009, “Is Monetary Policy Effective During Financial Crisis?” National Bureau of Economic Research, NBER Working Paper, No. 14678 (Cambridge, Massachusetts: MIT Press).
Raddatz, C., 2009, “When the Rivers Run Dry: Liquidity and the Use of Wholesale
Funds in the Transmission of the U.S. Subprime Crisis,” mimeo, (World Bank: Washington)
Rajan, R., and L. Zingales, 1998, “Financial Dependence and Growth,” The American
Economic Review, Vol.88, No.3, pp.559–586.
Reinhart, C., and K. Rogoff, 2009, “The Aftermath of Financial Crises,” American Economic Review: Papers & Proceedings, Vol.99:2, pp. 466–472.
Rojas-Suárez, L., and S. Wiesbrod, 1996, “Building Stability in Latin American Financial Markets,” Working Paper 320, Inter-American Development Bank.
Schularik, M., and A. Taylor, 2009, “Credit Booms Gone Bust: Monetary Policy, Leverage Cycles and Financial Crises, 1870–2008,” National Bureau of Economic Research, NBER Working Paper, No. 15512 (Cambridge, Massachusetts: MIT Press).
Tornell, A., and F. Westermann, 2002, “Boom-Bust Cycles in Middle Income Countries: Facts and Explanation,” IMF Staff Papers, Vol. 49, IMF Annual Research Conference (2002), pp. 111–155 (International Monetary Fund: Washington).


