BANK CREDIT RATINGS Bank credit ratings: What determines their quality? Harald Hau, Sam Langfield and David Marques-Ibanez Université de Genève, Swiss Finance Institute and CEPR; European Systemic Risk Board Secretariat and UK Financial Services Authority; European Central Bank, Financial Research Division PRELIMINARY VERSION OF A PAPER PREPARED FOR THE 56th PANEL MEETING OF ECONOMIC POLICY, OCTOBER 2012 ABSTRACT Bank credit ratings play a key role in the financial system, but determinants of their quality are poorly understood. This paper examines the quality credit ratings assigned to banks in the U.S. and Europe by the three largest rating agencies over the past two decades. Based on a new non-parametric method which interprets credit ratings as relative assessments of creditworthiness, we show that credit ratings become more informative during financial crisis ̶ contrary to popular perception. We also find evidence that larger and more leveraged banks receive systematically more favourable credit ratings, which amounts to an economically significant competitive distortion. Moreover, the risk weights for investment grade bank credit recommended by the Basel accords are shown to bear no relationship to empirical default probabilities. We are indebted to Thomas Drechsel for superlative research assistance and to Artus Galiay, Jose Geli Manzano, Johannes Micheler and Antonia Simeonova for providing data and code. Allen Berger, Oliver Burkart, Matthias Efing, Simone Manganelli, John Muellbauer, Steven Ongena, Alex Popov and Andrei Sarychev provided helpful comments. Any errors are the fault of the authors. Opinions expressed herein are those of the authors and do not necessarily reflect those of the institutions to which they are affiliated. The Managing Editor in charge of this paper was Philip Lane.
Transcript
BANK CREDIT RATINGS
Bank credit ratings: What determines their quality?
Harald Hau, Sam Langfield and David Marques-Ibanez Université de Genève, Swiss Finance Institute and CEPR; European Systemic Risk Board Secretariat and UK Financial Services Authority; European Central Bank, Financial Research Division
PRELIMINARY VERSION OF A PAPER PREPARED FOR THE 56th PANEL MEETING OF ECONOMIC POLICY, OCTOBER 2012
ABSTRACT
Bank credit ratings play a key role in the financial system, but determinants of their quality are poorly understood. This paper examines the quality credit ratings assigned to banks in the U.S. and Europe by the three largest rating agencies over the past two decades. Based on a new non-parametric method which interprets credit ratings as relative assessments of creditworthiness, we show that credit ratings become more informative during financial crisis ̶ contrary to popular perception. We also find evidence that larger and more leveraged banks receive systematically more favourable credit ratings, which amounts to an economically significant competitive distortion. Moreover, the risk weights for investment grade bank credit recommended by the Basel accords are shown to bear no relationship to empirical default probabilities.
We are indebted to Thomas Drechsel for superlative research assistance and to Artus Galiay, Jose Geli Manzano, Johannes Micheler and Antonia Simeonova for providing data and code. Allen Berger, Oliver Burkart, Matthias Efing, Simone Manganelli, John Muellbauer, Steven Ongena, Alex Popov and Andrei Sarychev provided helpful comments. Any errors are the fault of the authors. Opinions expressed herein are those of the authors and do not necessarily reflect those of the institutions to which they are affiliated. The Managing Editor in charge of this paper was Philip Lane.
HARALD HAU, SAM LANGFIELD AND DAVID MARQUES-IBANEZ
2
1. INTRODUCTION
In the aftermath of the 2007/8 financial crisis, public indignation often focused on bank credit ratings which granted investment grade status right up to the default event. Such rating failures conveyed the impression that the rating system dominated by the three major rating agencies is broken along with the entire prudential framework which so heavily relies on credit ratings. In this paper, we pursue three objectives: First, we provide a comprehensive empirical measurement of the bank rating quality over the last 20 years based on a new non-parametric analysis of rating quality. Our methodology interprets bank credit ratings in a strictly ordinal manner: Banks are ranked by their credit rating; this ranking is then compared to a second ranking of expected default frequencies two years later and the rank difference is defined as the Ordinary Rating Quality Shortfall (ORQS). Such an ordinal rating quality measure is most appropriate given the non-predictability of a financial crisis and its dramatic effect on cardinal measures of default probability. Second, we use this non-parametric rating quality measure for a structural analysis into the determinants of rating quality. In particular, we examine the role of various bank characteristics on low rating quality and rating bias in order to unveil their causes. Third, we discuss the policy conclusion of our evidence and outline the most promising policy option on how bank rating quality can be improved. Any analysis of rating quality faces the question: What is the meaning of a credit rating? The extant literature by the rating agencies itself is testimony to considerable confusion. Moody’s Rating Methodology (1999) states that ‘one of Moody’s goals is to achieve stable expected default rates across rating categories’, suggesting that ratings are absolute or cardinal measures of future default. By contrast, other documents characterize its credit ratings as ‘ordinal measures of expected loss’ (Moody’s, 2006). Statements by other rating agencies are no less contradictory about the very meaning of credit ratings. A cardinal rating for banks requires rating agencies to predict a banking crisis, whereas ordinal ratings only assess how well a bank should fair relative to other banks in a crisis. An analogy to car safety ratings might illustrates the point: A large Mercedes limousine may be deemed safer than a small Renault Clio based on the determinants of passenger safety in a car accident. Yet this does not inform us which of the two cars is more likely to be involved in an accident. Car safety ratings are relative ratings of passenger safety (conditional on a standard car accident), not predictions about the incidence of future car accidents. Similarly, a credit rating may be informative about the relative crisis performance of a bank, even if it is uninformative about the occurrence of a banking crisis and the quantity of bank credit risk.
Three aspects strongly favour an ordinal interpretation of the existing bank credit ratings. First, the intensity and timing of financial crisis are hard to predict by anyone – including rating agencies. Yet their occurrence fundamentally alters the probabilities of
BANK CREDIT RATINGS
3
default and financial distress for all financial institutions. Second, most ratings agencies do not incorporate systemic risk into the rating process. For example, bank ratings often ignore the systemic factors of solvency deterioration related to a generalized financial crisis. Third, while the credit and economic cycle tend to be major determinants of the level of credit risk of financial institutions, the rating agencies generally aim to provide ‘through the cycle’ rather than ‘point in time’ analyses of creditworthiness.
A key contribution of our paper is to measure rating quality in accordance with the ordinal nature of existing bank ratings. For this we build on a large and comprehensive dataset of bank ratings from all three major rating agencies. The data on credit ratings is combined with yearly accounting data on rated banks and monthly expected defaults frequencies (EDFs) obtained from Moody’s KMV. In total, our dataset has 38,753 bank-rating observations at quarterly frequency on more than 369 banks over 1990 to 2011.
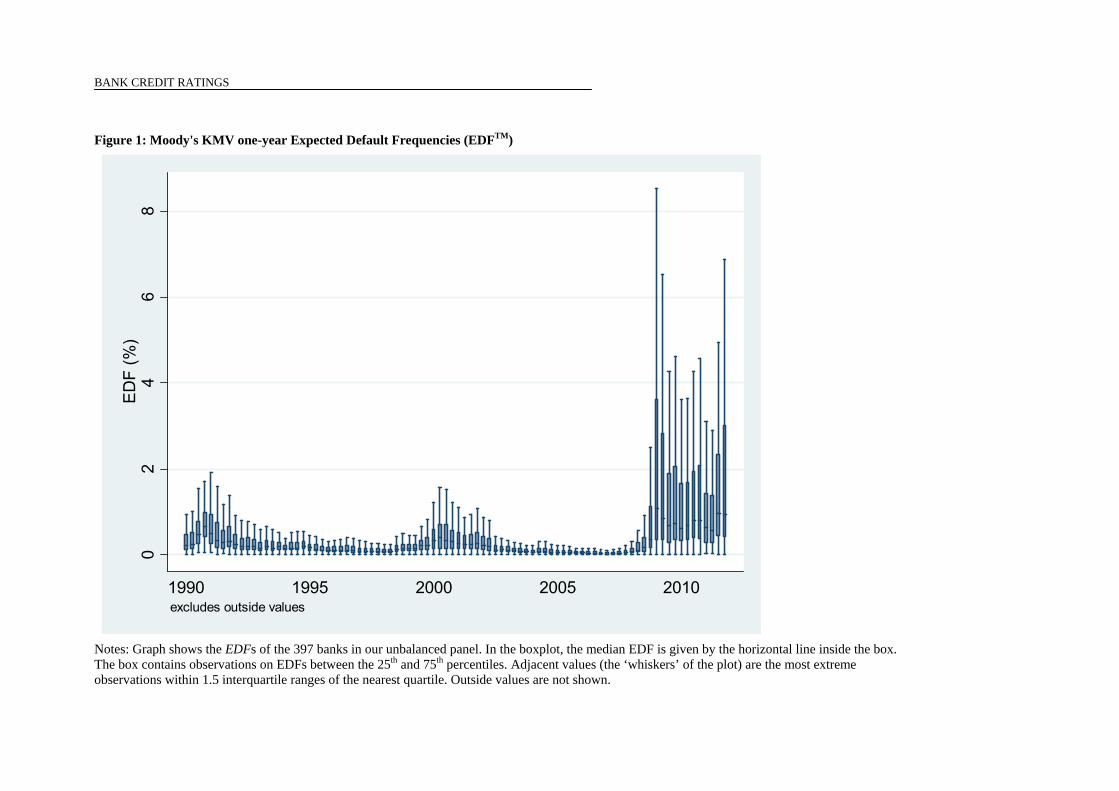
To illustrate the advantage of an ordinal (non-parametric) analysis, consider the evolution of expected default frequencies depicted in Figure 1 for our sample banks. The left-skewed distribution shows a spike at the high quantiles of bank credit risk from 2008. Short of predicting the financial crisis, credit ratings are unlikely to capture such enormous fluctuations in the quantity of bank credit risk. Any cardinal measure of rating quality would therefore be strongly tainted by the unpredictability of the crisis itself. By contrast, our strictly rank based measure of rating quality is not altered by a shift of the distribution of expected defaults frequencies as long as the rank ordering is unchanged.
[Insert Figure 1 here]
Our analysis opens a new window on the factors influencing credit rating quality.
First, we find that ordinal rating quality is countercyclical. With the onset of a banking crisis, the (ordinal) information content of credit ratings increases. In normal times, bank credit ratings are informative about future expected default probabilities only for the 25% lowest rated banks with ratings of BBB+ and below, but not for the investment grades better than BBB+. Unconditionally, an A- rated bank is as likely to become distressed as an AAA rated institution.
Second, bank characteristics significantly influence bank rating quality. Traditional banks with a large loan share feature a smaller rating error. Surprisingly, bank revenues from financial market trading also correlate with more rating precision. Particularly, we find no evidence that market making significantly increases the tail risk for a large positive rating error. More importantly, there is strong evidence that large and more leveraged banks receive more favourable credit ratings. This rating discrimination is economically significant. A bank size increase of two standard deviations implies that the credit rating rank relative to the EDF rank is inflated by 22 positions for every 100 banks in the sample, which corresponds for example to undeserved rating improvement from BBB to A- or a financing cost decrease of 122 basis points on average.
Third, agency problems between banks and rating agencies appear to explain rating biases: For example, S&P ratings are more favourable to banks with large commission and
HARALD HAU, SAM LANGFIELD AND DAVID MARQUES-IBANEZ
4
fee income possibly related to securitization business. Competition among the rating agencies measured by the decrease of Herfindahl-Hirschmann index (in the market for bank ratings) is found to correlate positively with rating quality. Particularly small rating errors decrease significantly along with the increasing market share of Fitch after 2001.
Fourth, public bank disclosure is negative correlated with the directional rating error. Underrated banks might extend their public disclosure in order to counterbalance the effect of a negative rating, while overrated banks show the opposite evidence of decreased public disclosure of basic accounting data. The latter finding suggests that bank ratings and public disclosure might be information substitutes.
This rich set of empirical insights into the bank rating process and its quality determinants allows a number of policy conclusion discussed at the end of the paper. But we can briefly highlight four key aspects as follows: 1. The strong discrimination of credit risk within the investment grade category (as
maintained under Basel II and proposed for Basel III) cannot be reconciled with our evidence on empirical bank default probabilities. All investment grade bank ratings above A- deserve the same risk weight.
2. Systematically more favourable ratings for large banks and those with high fee income suggest conflicts of interest corrupting the quality of bank ratings. But such a rating discrimination also generates severe competitive distortion in favour of large banks ̶ thus re-enforcing the ‘too big to fail’ problem. Discriminatory capital regulation and taxation designed to counterbalance this effect is therefore justified not only from a prudential viewpoint of reducing systemic risk, but also from a competitive perspective.
3. The generally low information content of bank ratings implies that punitive measures for (ex-post) rating failures cannot be translated into a workable policy framework. The hope that the incentives of rating agencies will changes if investors pay directly for ratings seems similarly misplaced given evidence for the buy-side (investor) collusion in the pre-crisis rating inflation (Calomiris, 2011).
4. The most promising policy route for a better evaluation of bank risk is a substantial extension of public disclosure for banks. Evidence that the most underrated banks feature better disclosure is indicative that better public information may reduce the reliance on bank ratings. We suspect that much better bank ratings could be produced at low costs if the frequent collusion between national bank regulators and banks in mutual pursuit of (accounting) data secrecy and unaccountability could be overcome.
The paper is organised as follows. The next section motivates our focus on bank ratings. Section 3 describes the literature on credit ratings, while Section 4 explains the data sources. Section 5 presents the methodology and Section 6 discusses the main hypotheses, before Section 7 explains the regression results and robustness issues. The last section summarizes the main conclusions and policy implications.
BANK CREDIT RATINGS
5
2. WHY DO CREDIT RATINGS MATTER?
Investors’ reliance on credit ratings has increased over the past 20 years. Financial transactions have grown in volume and complexity and finance has shifted from banks to capital markets, particularly in the US (Boot and Thakor, 2010). Acquiring information is costly, so investors seek to outsource creditworthiness assessments to ratings agencies. More than half of corporate bonds are held by institutions subject to ratings-based investment restrictions (Bongaerts et al, 2011).
Compared to other corporations, banks pose a particular challenge for external rating agencies. Banks are inherently opaque and exposed to a multiplicity of risks. Bank business is characterised to a significant extent by asymmetries of information and actual (and potential) regulatory interventions.1 We may therefore consider that bank ratings provide a lower bound (or worst case setting) for the quality of external ratings compared to other corporate ratings (Morgan, 2002).
At the same time, banks’ supply of credit intermediation and insurance is important for efficient allocation of capital and risk, and thus for activity in the real economy. The collapse in credit supply during the financial crisis of 2008-09 led to permanent reduction in the level of output relative to the pre-crisis trend (Reinhart and Rogoff, 2009; Campello et al, 2010). Recapitalisation and guarantees on deposits and debt put pressure on the credibility of sovereigns’ signatures. These considerations compound the economic importance of unbiased and efficient assessments of bank creditworthiness.
Moreover, the particular role of credit ratings in the financial system is enshrined in policy. From 1936 in the US, regulatory authorities have in many cases delegated oversight of banks’ asset quality to ratings agencies (White, 2010). The Basel II accord increased regulatory reliance on credit ratings. Under this agreement, minimum capital levels are specified as a proportion of risk-weighted assets, where risk-weights may be calculated using credit ratings. Even banks’ internal models, the results of which may substitute for credit ratings, tend to heavily rely on agencies’ methodologies. The Basel III agreement expresses an intention to mitigate reliance on ratings of securitised loans, but introduces an additional role for credit ratings with respect to counterparty credit risk from over-the-counter derivatives (BCBS, 2010). In exchange for liquidity, central banks require a minimum quality of collateral, defined in many cases by reference to credit ratings. The performance of credit ratings agencies has faced heightened scrutiny since the onset of the financial crisis in 2007. The model of the credit ratings agency industry – to take private information, and a fee, from an issuer, and publish a summary judgement in a rating, with special status conferred by public policy – has been heavily criticised (Pagano and Volpin, 2010; Financial Stability Board, 2010). High reliance on ratings agencies increases the exposure of the financial system to the accuracy of ratings. Mistakes and
1 This is best illustrated by the spectacular bankruptcies of Enron and WorldCom -- both of which failed as ‘financial conglomerates’ rather than ordinary energy or telephone companies.
HARALD HAU, SAM LANGFIELD AND DAVID MARQUES-IBANEZ
6
biased forecasts have the potential to cause or exacerbate crises, rendering the financial system more vulnerable to cliff effects (Manso, 2011).2
3. LITERATURE
Despite their central role, there is scant literature on bank credit ratings and the quality of such ratings. This is surprising, since credit ratings potentially contain information on banks’ riskiness through the cycle not otherwise available to the market. Compared with other industries, banks are particularly opaque and of crucial importance to the real economy. Opacity makes it harder to predict financial distress for banks than for non-bank institutions: rating disagreements across agencies occurs more often for banks’ ratings than for other industries (Morgan, 2002). Credit ratings agencies’ access to non-public information could in principle give their ratings predictive power over that of public data.3 However, recent evidence shows simple corporate credit models based on only public data can outperform ratings as predictors of credit risk (Bloechlinger et al., 2012). Agency problems are a central theme in the literature on credit ratings. In 1975, credit ratings agencies shifted from an ‘investor pays’ to an ‘issuer pays’ model (White, 2010; Pagano and Volpin, 2010). Under the latter model, issuers may credibly threaten to switch to a competing agency, potentially lending positive bias to solicited ratings through ‘rating shopping’. Griffin and Tang, (2011) find that contacts between ratings agencies and their clients might augments rating mistakes: forecasts of the creditworthiness of collateralised debt obligations by one credit rating agency’s surveillance team, which has no interaction with clients (issuers), consistently beat those of ratings teams, which interact with clients. There is also evidence suggesting that positive bias increases with the value of the asset (and therefore the size of the agency’s fee) (He et al., 2011). By contrast, a negative ratings bias may follow from agencies’ ability to issue downside-biased unsolicited ratings (where no fee is charged), which permits agencies to credibly threaten issuers which do not solicit ratings (Partnoy, 2002; Fulghieri et al, 2010). Covitz and Harrison (2003) provide empirical evidence that reputation effects dominate conflicts of interest in the rating industry. The information content of ratings might also be related to a financial crisis which brings underlying risks to light. There is some evidence that in periods of systemic risk, credit ratings are a particular good indicator of credit risk (Hilscher and Wilson, 2011). There is also a rich theoretical literature on rating cyclicality, rating accuracy, reputational concerns and rating competition. Bar-Isaac and Shapiro (2011a) argue that the quality of credit ratings is likely to be counter-cyclical (i.e. quality increases during periods of crisis) as reputational concerns make it more profitable to issue less accurate ratings in
2 In the case of AIG, over-the-counter derivatives contracts provided for margin calls in the event of a rating downgrade of the underwriter, precipitating a vicious circle. 3 In support of this thesis, several papers have found that market prices move in response to ratings surprises, particularly on the downside. See Cantor and Packer (1995); Kliger and Sarig (2000); Norden and Weber (2004); Hull et al (2004).
BANK CREDIT RATINGS
7
boom times (due to fees, default probabilities and competition in the labour market)4 than in crises periods. The presence of “naïve investors” (more unlikely during a crisis) would also strengthen the countercyclical nature of ratings’ accuracy.5 Costly observability of creditworthiness decreases market participants’ ability to screen noisy ratings and increases the cost to a rating agency of issuing informative forecasts (Bar-Isaac and Shapiro, 2011b). Overall, the conclusion is that agencies face increasing incentives to issue noisy ratings as complexity increases (Mathis et al, 2009; Skreta and Veldkamp, 2009; Opp et al, 2010). Cantor and Packer (1995) see reputational capital as the principal mechanism which keeps positive bias in check.
Competition among rating agencies could affect rating agencies’ decision to spend or accumulate reputational capital. Higher competition could reduce expected net present value of reputation, leading to lower rating quality (Camanho, Deb and Liu, 2010). Similarly, competition among rating agencies might reduce the quality of ratings if there is rating shopping by issuers (Bolton, Freixas and Shapiro, 2012). There is some evidence suggesting that the bulk entry of Fitch on the competitive ratings market in 1997 led to a deterioration of ratings quality (Becker and Milbourn, 2010). On the other hand, competition might enhance the impact of reputation and therefore increase the quality of ratings (Hörner, 2002). The latter would occur if competition gives investors the outside option to select another rating agency, thereby increasing agencies’ incentive to invest in assessments of creditworthiness.
Structural changes in the banking sector may have rendered assessment of bank creditworthiness more costly. Financial innovations increased complexity in banking; more direct funding from financial markets and securitization activity formed part of a wider trend of innovation that intensified the transference of credit risk between intermediaries. As a result, banks became more integrated with financial markets and increased their share of non-interest income derived from proprietary trading, brokerage and investment banking activities (Boot and Thakor, 2010). In light of these structural changes, a number of studies have focused on the impact of bank business models on bank risk and performance during the recent crisis. Beltratti and Stulz (2011), for example, found that banks with more Tier I capital and a higher loan to total assets ratio performed better in the initial stages of the crisis. Berger and Bouwman (2011) show that during banking crises higher capital levels improve banks’ performance, while a larger deposit base and more liquid assets were associated with higher returns. Cole and White (2012) show that bank capital and stronger CAMEL ratings lowers the likelihood of bank failure. Altunbas et al (2011) find that institutions with banks with higher risk were larger and had less capital, greater reliance on short-term market funding and aggressive credit growth.
4 Booms are defined as periods with lower average default probabilities, tighter labour markets and larger revenues for rating agencies. In this setting, there is a stronger incentive to ‘milk’ (extract value from) reputational capital. 5 In other words ‘ratings are more likely to be inflated when there is a larger fraction of naïve investors in the market who take ratings at face value’ (Bolton et al., 2012).
HARALD HAU, SAM LANGFIELD AND DAVID MARQUES-IBANEZ
8
4. DATA
We construct a comprehensive panel of banks’ ratings from January 1990 to December 2011 based on (all-in) rating data from Standard and Poor's, Moody’s and Fitch. The ratings datasets record whenever a rating is changed, affirmed or withdrawn. We extract a time series by recording for each bank the most recent rating observation at the end of each quarter. Retained are all banks headquartered in the US or EU15. To avoid double-counting ratings within a single institution, we discard any bank which is junior in the organisational structure – for example, HSBC France is discarded; HSBC Holdings plc is retained.6
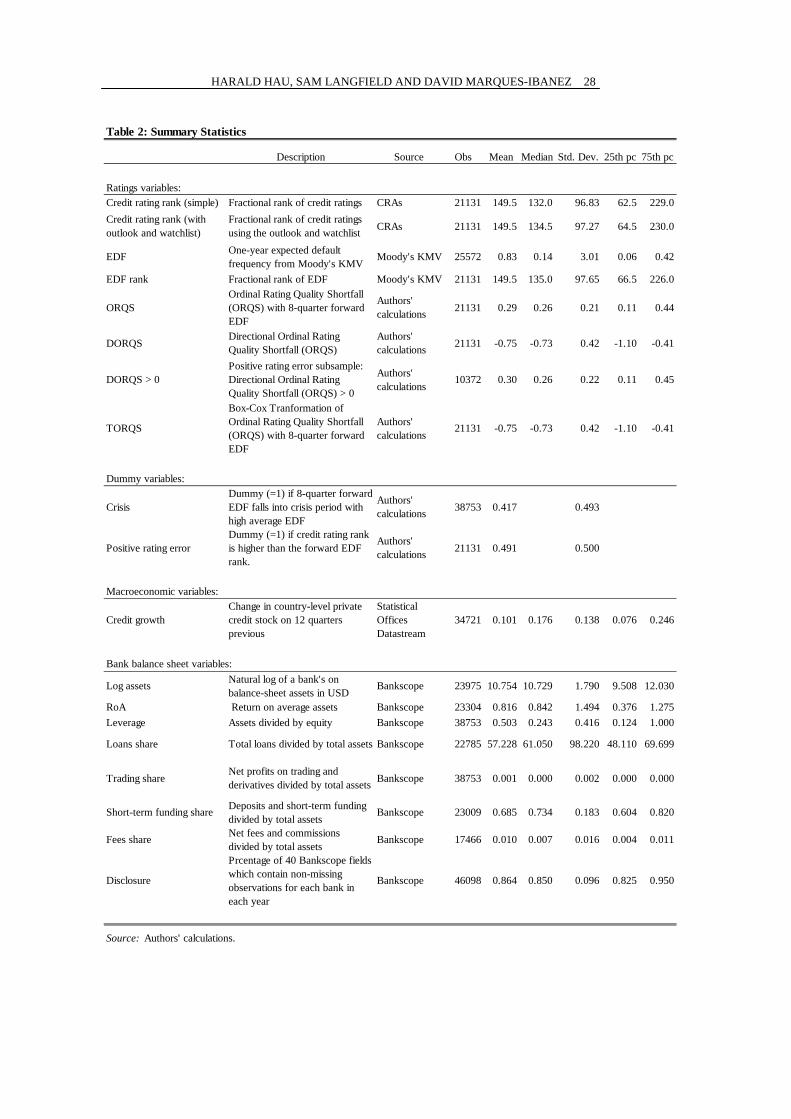
[Insert Table 1 here] Ratings by the three rating agencies are translated into a numerical value from 1 to 24 according to Table 1, where a lowest rank number corresponds to highest credit ranking. Summary statistics for the quarterly ratings data are provided in Table 2. We obtain an unbalanced panel with 38,753 quarterly bank ratings. Ratings are assigned to 369 unique banks, which are each rated by between one and three agencies. Standard and Poor's provides the most complete coverage with 16,928 bank ratings at quarterly frequency, followed by Moody's with 12,715 and Fitch with 9,110. The rating coverage is relatively incomplete in the early 1990s: 75% of all panel observations concern the second decade after January 2000.
[Insert Table 2 here] The rating data are matched with annual accounting data from Bankscope. The matching process employs bank identifiers, a text-string matching algorithm (Winkler, 2006) and manual work. Most accounting data is available only after 1994 and features varying degrees of reporting coverage. To account for data errors, we undertake some windsorising of extreme observations on balance-sheet variables. For example, we impose that observations on leverage must lie between 0 and 1. Table 2 provides the definitions of the accounting variables we retain and their summary statistics. Finally, we match the above panel with data on expected default frequencies (EDFs) as a measure of bank distress. EDFs are obtained from a structural model of corporate default and widely used to price corporate bond debt (Merton, 1974 and Longstaff and Schwartz, 1995).7 The main model inputs are the volatility of asset returns (which aims to capture business risk) and the difference between the market value of a bank’s assets and the book value of its liabilities (accounting for leverage). Increases in volatility or leverage translate into higher EDF levels. Our analysis draws on EDFs calculated by the rating
6 Data processing limitations do not allow us to extend the analysis to the bank subsidiary level. 7 More specifically the calculation of EDF builds on Vasicek and Kealhofer’s extension of the Black-Scholes-Merton option-pricing framework to make it suitable for practical analysis.
BANK CREDIT RATINGS
9
agency Moody's, contemporaneously to the rating process. Moody's calculations are undertaken on a monthly frequency and draw on a large proprietary default database owned by KMV (Dwyer and Qu, 2007). It is possible to reconstruct proxy EDFs using only public data (Bloechlinger et al, 2012). But drawing on existing EDF data has the advantage that we do not need to make any parameter or calibration choices. Our measurement of rating errors is thus immune to any model selection or back-fitting criticism.
We use the EDF measure (as calculated by Moody’s KMV) for a number of reasons. First, it is an indicator of bank risk widely used by researchers, central banks, regulators, supervisors, financial institutions and investors (Garlappi et al., 2007, and IMF, 2009). Second, the use of an equity-based measure of bank risk (derived from a structural model) accounts for many of the dimensions inherent in bank risk as perceived by financial markets (Altunbas et al, 2011). Compared with structural measures of credit risk such as CreditMetrics (created by JP Morgan), the EDF measure does not assume that all issuers are homogeneous within the same rating class. Third, EDFs perform relatively well as a predictor of default (Munves et al, 2009, and Harada et al, 2010).8 Even though defaults occurred very suddenly in the recent crisis, EDF measures do a good job in an ordinal sense: financial institutions that subsequently defaulted had high EDF measures relative to those of their peers.
5. METHODOLOGY
A very narrow definition of rating quality could focus on their ability to discriminate between banks which experience defaults and those which do not. But such an approach is problematic because outright corporate default is rare – especially for banks which typically benefit from implicit government guarantees of senior debtholders’ claims. It is therefore more appropriate to consider bank ratings as a general assessment as to whether a bank is likely to experience financial distress in the future.9 We therefore compare the credit ratings to EDFs measured k months forward in time. The latter approach moves the statistical problem away from predicting a very small default tail and broadens the analysis. A second important issue concerns the interpretation of credit ratings. We prefer to interpret ratings as solely ordinal measures of default probabilities or financial distress. Moreover, long-term issuer ratings represent opinions on creditworthiness through the cycle, rather than short-term fluctuations in macroeconomic conditions (Moody’s, 2006). Our own methodology accounts for this aspect by adopting a strictly ordinal interpretation of credit ratings by assigning a rank order to all credit ratings.
8 From a historical perspective, KMV analysed more than 2000 companies that have defaulted or entered into bankruptcy over a 25 year period out of a comprehensive sample of listed companies as provided by the database Compustat. The results overwhelmingly showed a sharp increase in the slope of the EDF between 1 and 2 years prior to default (Crouhy et al., 2000). 9 Financial distress can be defined as the expected default frequency (EDFs) at a future point in time.
HARALD HAU, SAM LANGFIELD AND DAVID MARQUES-IBANEZ
10
We jointly rank-order the bank ratings of all three rating agencies in any given quarter. Banks rated AAA by an agency are given the lowest rank; AA the next lowest; etc. Rating agencies use 21-24 distinct rating buckets (see Table 1), resulting in some ties in our panel of 369 banks. In order to reduce the number of rating ties, we further subdivide the credit rating rank by the rating outlook as a second sorting criterion. Within a given credit rating category, banks with a positive outlook are given the lower rank; negative outlooks are given the higher rank.10 A third and final sorting criterion is the watchlist. If more than one bank features the same credit rating and the same outlook, the banks ‘on watch’ receive a higher (lower) credit rating rank if the outlook is negative (positive).11 Specifically, outlooks indicate the credit rating agency’s opinion regarding the likely direction of an issuer’s rating over the medium-term; watchlist indicates that a rating is under review for possible change in the short-term.
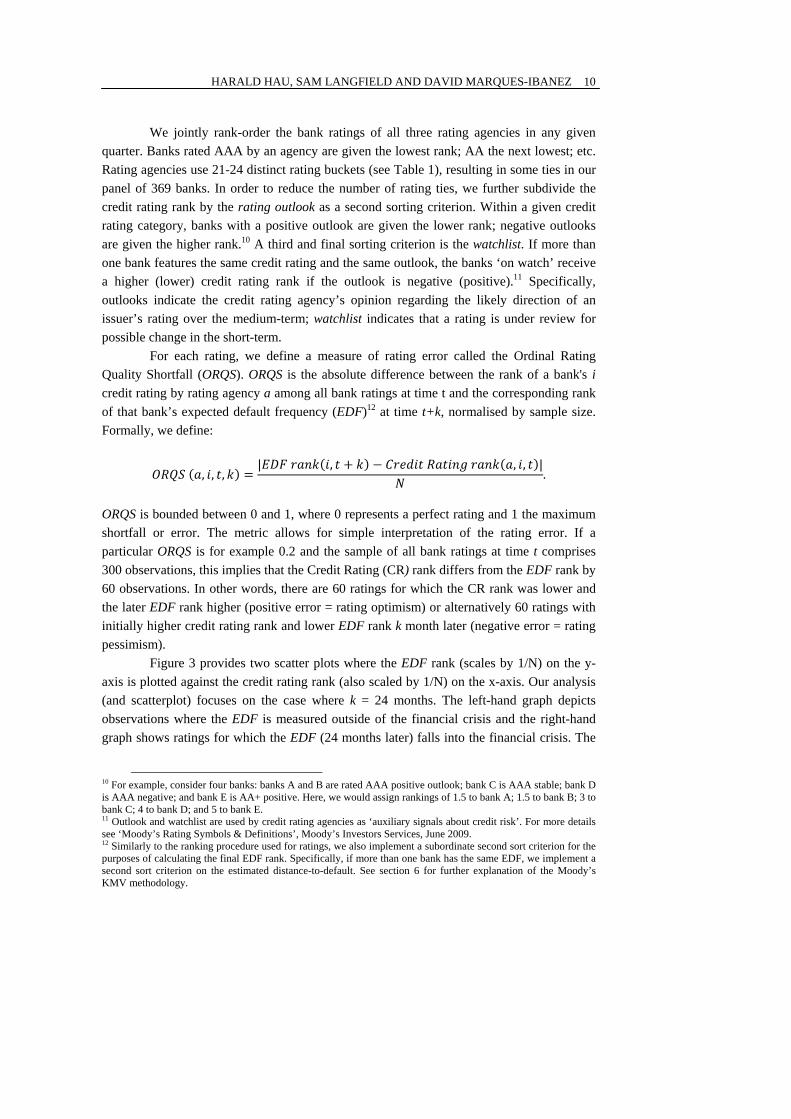
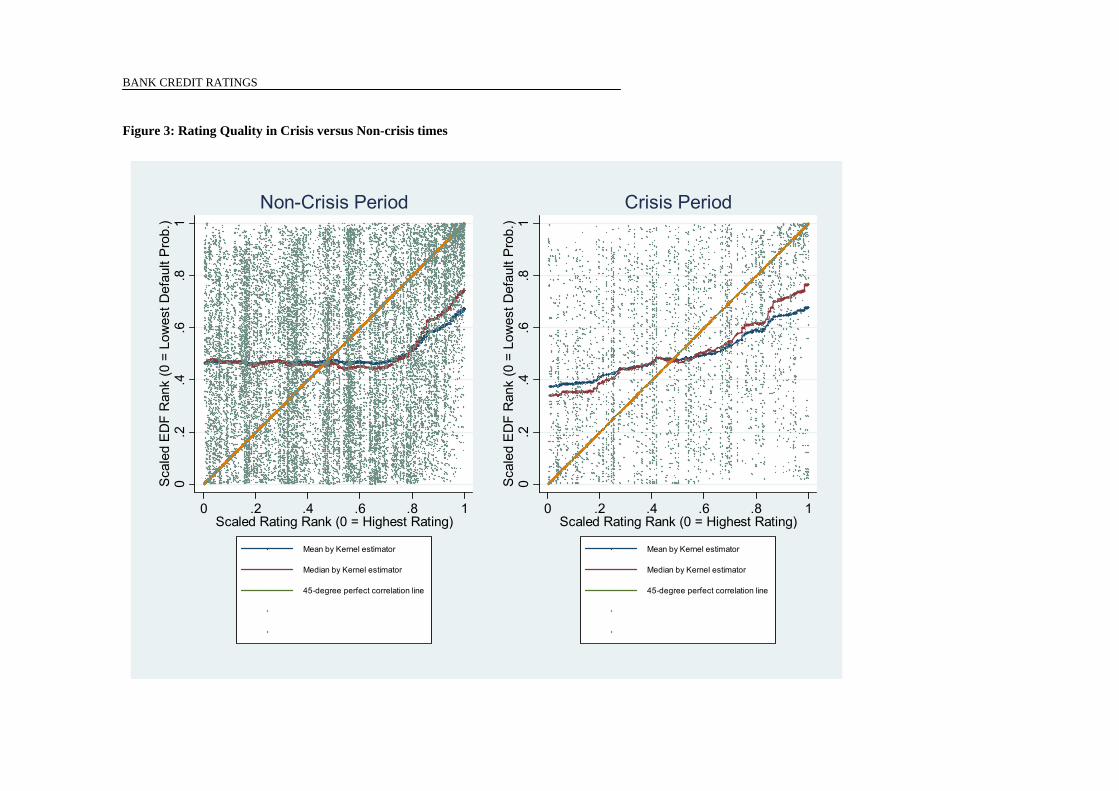
For each rating, we define a measure of rating error called the Ordinal Rating Quality Shortfall (ORQS). ORQS is the absolute difference between the rank of a bank's i credit rating by rating agency a among all bank ratings at time t and the corresponding rank of that bank’s expected default frequency (EDF)12 at time t+k, normalised by sample size. Formally, we define: ( , , , ) = | ( , + ) − ( , , )|. ORQS is bounded between 0 and 1, where 0 represents a perfect rating and 1 the maximum shortfall or error. The metric allows for simple interpretation of the rating error. If a particular ORQS is for example 0.2 and the sample of all bank ratings at time t comprises 300 observations, this implies that the Credit Rating (CR) rank differs from the EDF rank by 60 observations. In other words, there are 60 ratings for which the CR rank was lower and the later EDF rank higher (positive error = rating optimism) or alternatively 60 ratings with initially higher credit rating rank and lower EDF rank k month later (negative error = rating pessimism). Figure 3 provides two scatter plots where the EDF rank (scales by 1/N) on the y-axis is plotted against the credit rating rank (also scaled by 1/N) on the x-axis. Our analysis (and scatterplot) focuses on the case where k = 24 months. The left-hand graph depicts observations where the EDF is measured outside of the financial crisis and the right-hand graph shows ratings for which the EDF (24 months later) falls into the financial crisis. The
10 For example, consider four banks: banks A and B are rated AAA positive outlook; bank C is AAA stable; bank D is AAA negative; and bank E is AA+ positive. Here, we would assign rankings of 1.5 to bank A; 1.5 to bank B; 3 to bank C; 4 to bank D; and 5 to bank E. 11 Outlook and watchlist are used by credit rating agencies as ‘auxiliary signals about credit risk’. For more details see ‘Moody’s Rating Symbols & Definitions’, Moody’s Investors Services, June 2009. 12 Similarly to the ranking procedure used for ratings, we also implement a subordinate second sort criterion for the purposes of calculating the final EDF rank. Specifically, if more than one bank has the same EDF, we implement a second sort criterion on the estimated distance-to-default. See section 6 for further explanation of the Moody’s KMV methodology.
BANK CREDIT RATINGS
11
red and blue lines represent a kernel estimation of the mean and median of the scaled EDF rank, respectively. Full information in credit ratings would imply that the observations cluster along the 45 degree line. In this case the ranking of credit ratings would perfectly correspond to the ranking of EDFs 24 months later. The scatter plots show instead a more uniform dispersion of the observations over the entire quadrant, indicating low correlation between the credit rating and EDF ranks. For the non-crisis period (depicted in the left graph), the mean and median of the scaled EDF rank are approximately 0.5 for all of the 75% best rated banks (AAA to A-). Only for the crisis period (depicted in the right graph) do a small positive relationship between rating rank of the 75% best rated banks and the subsequent EDF rank.
[Insert Figure 3 here] Table 3 reports the Spearman (rank) correlation between both variables at different horizons for the EDF measurement (k={0, 12, 24, 36} months) for the full sample (Panel A), the pre-crisis (Panel B) and crisis (Panel C) periods. The Spearman correlation coefficient in the full sample moderately decreases from 0.283 to 0.176 as the horizon increases from k=0 to k=36 months. At 0.352, the Spearman correlation coefficient at k=24 is much larger in the bottom third of credit ratings than in the two other sample tiers. This suggests that investment grade rating generally contain little information for future expected default frequencies. Such evidence is difficult to reconcile with current bank regulation, which stipulates large differences in risk weights between a 20% weight for grades AAA to AA- and a much larger 50% risk weight for credit risk in the A+ to A- range.
For EDFs calculated during the financial crisis this is visibly different as the positive correlation between EDF rank and credit rating rank extends to banks with a top tier rating (Figure 3, right-hand graph). The overall Spearman correlation for the crisis period rises to 0.321 for k=24 compared to only 0.178 outside the crisis. Credit ratings are therefore considerably more informative for bank distress within a financial crisis than outside.
[Insert Table 3 here] An important part of our analysis consists of explaining the determinants of rating errors, where ORQS becomes the dependent variable in a linear regression analysis. Its distribution is strongly positively skewed as shown in Figure 2. We therefore apply a Box-Cox transformation to ORQS. A Box-Cox parameter of -0.224 brings its skewness to zero.13 The obtained Transformed Ordinary Rating Quality Shortfall (TORQS) features reduced kurtosis of 1.95 (relative to 2.55 for ORQS) and serves as the dependent variable for all subsequent analysis. Its panel structure allows us to explore the determinants of rating quality also in the cross-section (across banks and ratings agencies) in a linear framework:
13 A Box-Cox parameter of -1 corresponds to the log transformation. The latter scales down large ratings errors more strongly and is more discriminating for small rating errors.
HARALD HAU, SAM LANGFIELD AND DAVID MARQUES-IBANEZ
12
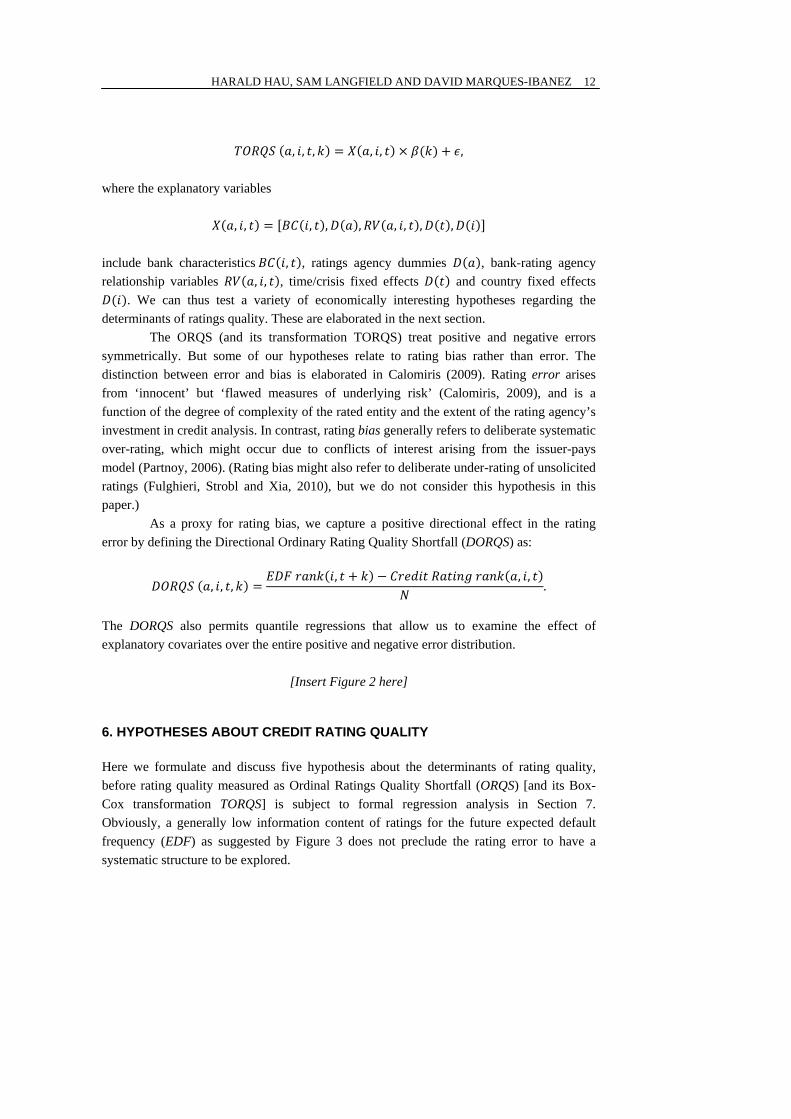
( , , , ) = ( , , ) × ( ) + , where the explanatory variables ( , , ) = ( , ), ( ), ( , , ), ( ), ( ) include bank characteristics ( , ), ratings agency dummies ( ), bank-rating agency relationship variables ( , , ), time/crisis fixed effects ( ) and country fixed effects ( ). We can thus test a variety of economically interesting hypotheses regarding the determinants of ratings quality. These are elaborated in the next section.
The ORQS (and its transformation TORQS) treat positive and negative errors symmetrically. But some of our hypotheses relate to rating bias rather than error. The distinction between error and bias is elaborated in Calomiris (2009). Rating error arises from ‘innocent’ but ‘flawed measures of underlying risk’ (Calomiris, 2009), and is a function of the degree of complexity of the rated entity and the extent of the rating agency’s investment in credit analysis. In contrast, rating bias generally refers to deliberate systematic over-rating, which might occur due to conflicts of interest arising from the issuer-pays model (Partnoy, 2006). (Rating bias might also refer to deliberate under-rating of unsolicited ratings (Fulghieri, Strobl and Xia, 2010), but we do not consider this hypothesis in this paper.)
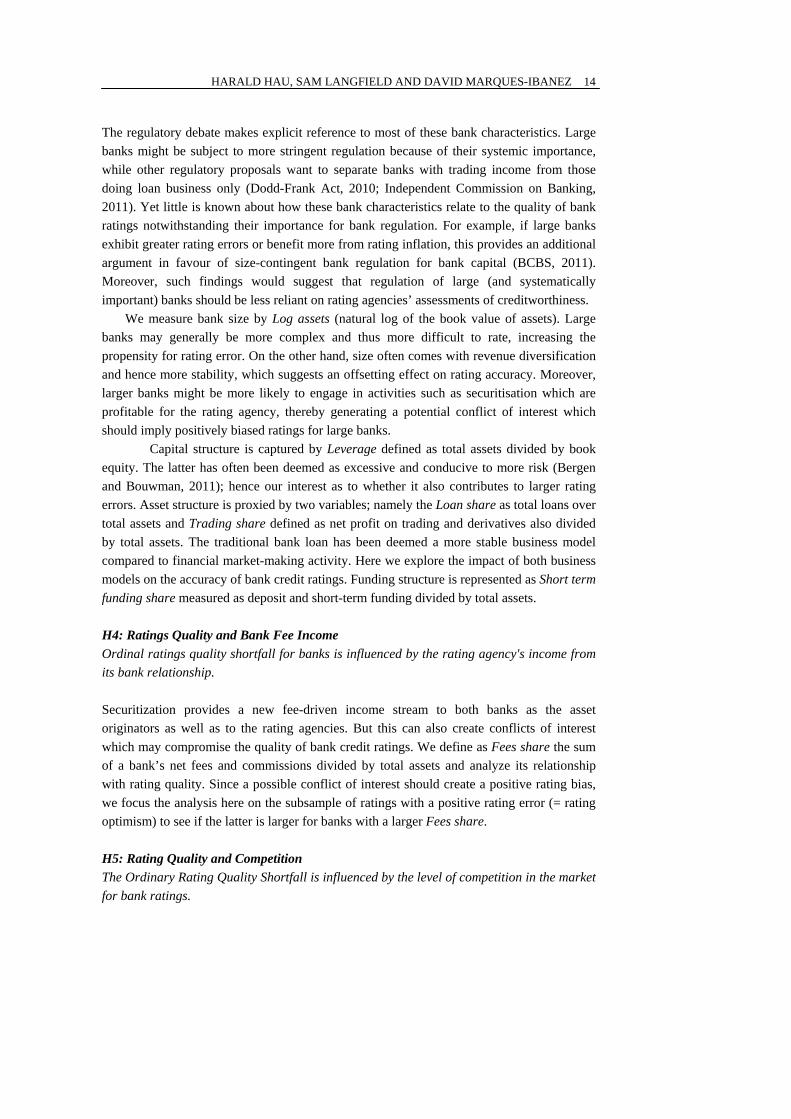
As a proxy for rating bias, we capture a positive directional effect in the rating error by defining the Directional Ordinary Rating Quality Shortfall (DORQS) as: ( , , , ) = ( , + ) − ( , , ). The DORQS also permits quantile regressions that allow us to examine the effect of explanatory covariates over the entire positive and negative error distribution.
[Insert Figure 2 here]
6. HYPOTHESES ABOUT CREDIT RATING QUALITY
Here we formulate and discuss five hypothesis about the determinants of rating quality, before rating quality measured as Ordinal Ratings Quality Shortfall (ORQS) [and its Box-Cox transformation TORQS] is subject to formal regression analysis in Section 7. Obviously, a generally low information content of ratings for the future expected default frequency (EDF) as suggested by Figure 3 does not preclude the rating error to have a systematic structure to be explored.
BANK CREDIT RATINGS
13
H1: Ratings Quality during the Crisis and after Credit Booms Ordinal ratings quality shortfall depends on the state of the financial system and the credit cycle. Bank credit ratings are more informative (in an ordinal sense) about bank distress when distress occurs during periods of financial crisis. The Lehman bankruptcy and other prominent ratings failures have conveyed the misleading impression that bank ratings become more inaccurate during a financial crisis. However, this is at odds with the summary statistics presented in the previous section. The Spearman rank correlation between EDF rank and the CR rank dramatically increases as the bank system entered the crisis. This suggests that ORQS has a cyclical component, particularly for the majority of banks rated A- or better. Expansionary credit cycles may also affect rating accuracy as they foreshadow later bank distress (Bar-Isaac and Shapiro, 2011a). For the empirical part, we define a global financial crisis dummy. The dummy takes on the value of one when the mean EDF is greater than 2%. In our sample of banks, this occurs from 2008Q3 to 2010Q4, and again in 2011Q2 and 2011Q3. Importantly, our crisis dummy is contemporaneous with the observation on the EDF variable. For example, when ORQS is defined over two years, the crisis dummy will equal one when the credit rating is measured two years prior to crisis (i.e., 2006Q3 to 2008Q4 and 2009Q2-2009Q3). As a measure of the credit cycle, we use private credit growth over the previous three years at country level. This second measure adds cross-sectional variation (across the sixteen countries in our panel) unlike the crisis dummy which features only time variation. H2: Ratings Quality Across Agencies Ordinal ratings quality shortfall varies across ratings agency. First, rating agencies may differ in their rating methodology and in the quality of their credit analysts. Differences between the ability of equity analysts have been documented by Bradshaw (2011) and Fang and Yasuda (2009). Second, rating agencies may also differ in their access to non-public bank information. Unfortunately, the incidence of unsolicited bank ratings is low, precluding exploration of the latter aspect in more detail. Third, agency and incentive problems may also differ across rating agencies and manifest themselves in certain rating biases. Agency problems are examined in more detail in hypothesis H5 in relationship to bank fee income. Here we test more narrowly for the existence of a significant fixed effect for any of the three main rating agencies. For this purpose we define dummy variables called Moody's and S&P which capture the average agency-specific rating shortfall relative to Fitch ratings. H3: Ratings Quality and Bank Characteristics Ordinal ratings quality shortfall depends on key bank characteristics including size, capital structure, asset structure and funding structures.
HARALD HAU, SAM LANGFIELD AND DAVID MARQUES-IBANEZ
14
The regulatory debate makes explicit reference to most of these bank characteristics. Large banks might be subject to more stringent regulation because of their systemic importance, while other regulatory proposals want to separate banks with trading income from those doing loan business only (Dodd-Frank Act, 2010; Independent Commission on Banking, 2011). Yet little is known about how these bank characteristics relate to the quality of bank ratings notwithstanding their importance for bank regulation. For example, if large banks exhibit greater rating errors or benefit more from rating inflation, this provides an additional argument in favour of size-contingent bank regulation for bank capital (BCBS, 2011). Moreover, such findings would suggest that regulation of large (and systematically important) banks should be less reliant on rating agencies’ assessments of creditworthiness. We measure bank size by Log assets (natural log of the book value of assets). Large banks may generally be more complex and thus more difficult to rate, increasing the propensity for rating error. On the other hand, size often comes with revenue diversification and hence more stability, which suggests an offsetting effect on rating accuracy. Moreover, larger banks might be more likely to engage in activities such as securitisation which are profitable for the rating agency, thereby generating a potential conflict of interest which should imply positively biased ratings for large banks.
Capital structure is captured by Leverage defined as total assets divided by book equity. The latter has often been deemed as excessive and conducive to more risk (Bergen and Bouwman, 2011); hence our interest as to whether it also contributes to larger rating errors. Asset structure is proxied by two variables; namely the Loan share as total loans over total assets and Trading share defined as net profit on trading and derivatives also divided by total assets. The traditional bank loan has been deemed a more stable business model compared to financial market-making activity. Here we explore the impact of both business models on the accuracy of bank credit ratings. Funding structure is represented as Short term funding share measured as deposit and short-term funding divided by total assets. H4: Ratings Quality and Bank Fee Income Ordinal ratings quality shortfall for banks is influenced by the rating agency's income from its bank relationship. Securitization provides a new fee-driven income stream to both banks as the asset originators as well as to the rating agencies. But this can also create conflicts of interest which may compromise the quality of bank credit ratings. We define as Fees share the sum of a bank’s net fees and commissions divided by total assets and analyze its relationship with rating quality. Since a possible conflict of interest should create a positive rating bias, we focus the analysis here on the subsample of ratings with a positive rating error (= rating optimism) to see if the latter is larger for banks with a larger Fees share. H5: Rating Quality and Competition The Ordinary Rating Quality Shortfall is influenced by the level of competition in the market for bank ratings.
BANK CREDIT RATINGS
15
Rating competition may provide the rating agencies with incentives to improve their rating process and methodology in order to acquire a reputation for the most accurate ratings. For example, reputational effects appear to matter for equity analysts (Fang and Yasuda, 2009). But competition may also compromise the independence of the rating process if corporations can "shop" for the best available rating (Becker and Milbourn, 2010). The increasing market share of Fitch after 2001 reduced the market concentration as measured by a traditional Herfindahl-Hirschmann index (HH index). How does this change in market power for the ratings agencies correlate with bank rating quality? Finally, we investigate the relationship between bank ratings and public disclosure measured by the availability of accounting data. Public bank disclosure might partially counterbalance a negative rating error. On the other hand, an overrated bank might have a reason to decrease public disclosure if such information might co-determine the bank's re-financing costs. H6: Rating Quality and Public Disclosure Underrated bank increase their public disclosure of accounting data and overrated banks decrease their public disclosure. We expect therefore a negative correlation between public disclosure and the directional rating error over the entire range of rating errors. We measure public disclosure of each bank by the percentage of non-missing fields among the 40 accounting variables provided by Bankscope. This is a rather crude measure, but is readily available.
7. EMPIRICAL ANALYSIS
7.1. Rating Quality during the Crisis and after Credit Booms
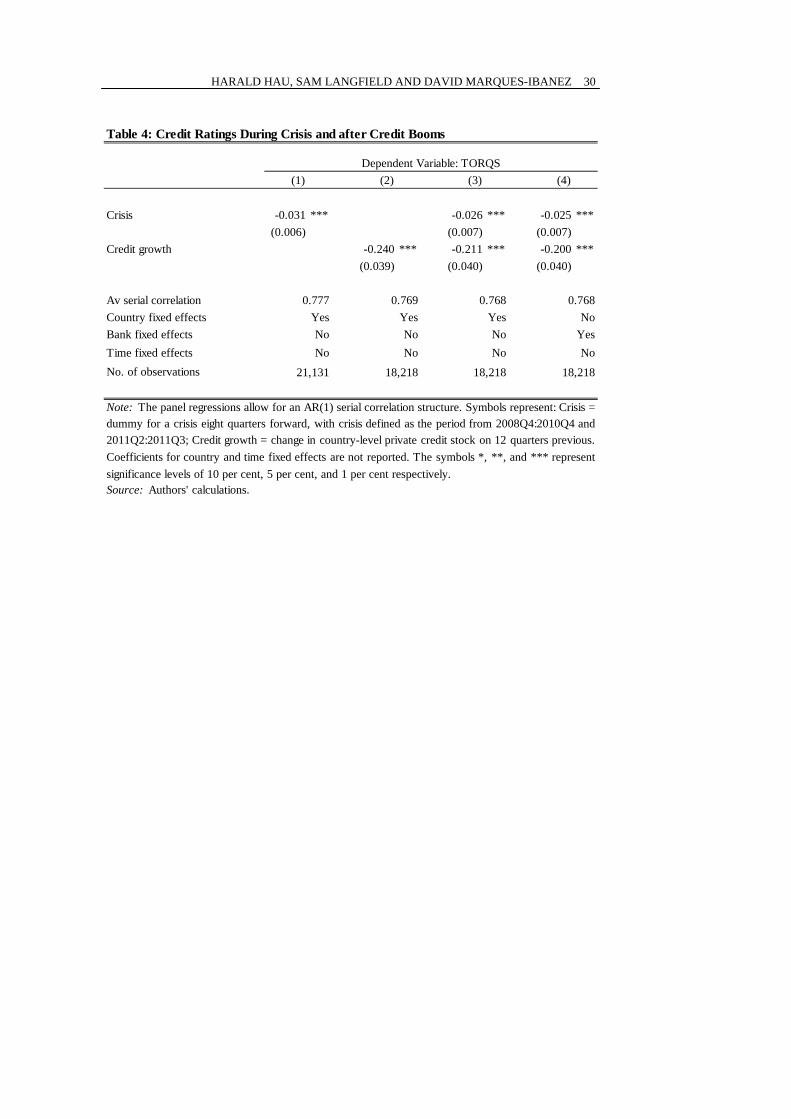
The distributional evidence in Figure 3 and the corresponding Spearman correlations in Table 3, Panel B suggests that in normal times (when the EDF is observed outside a systemic financial crisis) bank credit ratings contain information about future default risk only for speculative investment grades. For all investment grade ratings (corresponding approximately to a rating rank below the 66% percentile), the mean and median EDF rank do not vary with the credit rating rank. The Spearman correlation between both variables is even slightly negative. This pattern changes if we restrict the sample to EDFs observed during the financial crisis. Here, we find a positive Spearman correlation over the entire rating scale, with an overall rank correlation of 0.321 at the two-year horizon (k =24). Table 4 confirms this finding in panel regressions with TORQS as the dependent variable. We use a Crisis dummy to mark all ratings for which the EDF is reported at a moment of high global bank distress, namely for the quarters 2008Q4 to 2010Q4 and again
HARALD HAU, SAM LANGFIELD AND DAVID MARQUES-IBANEZ
16
2011Q2 to 2011Q3. The coefficient estimate of -0.031 in column (1) implies that a financial crisis reduced the TORQS by 7.4% relative to its unconditional standard deviation of 0.4205. Columns (2) to (4) also include Credit growth over a three year period prior to the rating as additional controls for credit booms. At the end of a credit boom and in a financial crisis, the ordinal rating error significantly decreases. Hence ratings quality is counter-cyclical: Bank ratings become more accurate in tough times. This finding contradicts the frequently voiced critique that bank ratings become less reliable when a financial crisis occurs. The specification in Table 4, columns (1) to (3), uses country fixed effects and random effects at the bank level, while column (4) reports coefficient estimates for bank fixed effects. Coefficients show little variation across the specifications. Given that ratings are measured at quarterly frequency, we expected considerable serial correlation in the error structure. The estimated serial correlation is indeed high at around 0.77. The reported standard errors are adjusted for this serial correlation.
[Insert Table 4 here]
7.2. Rating Quality across Rating Agencies and Countries
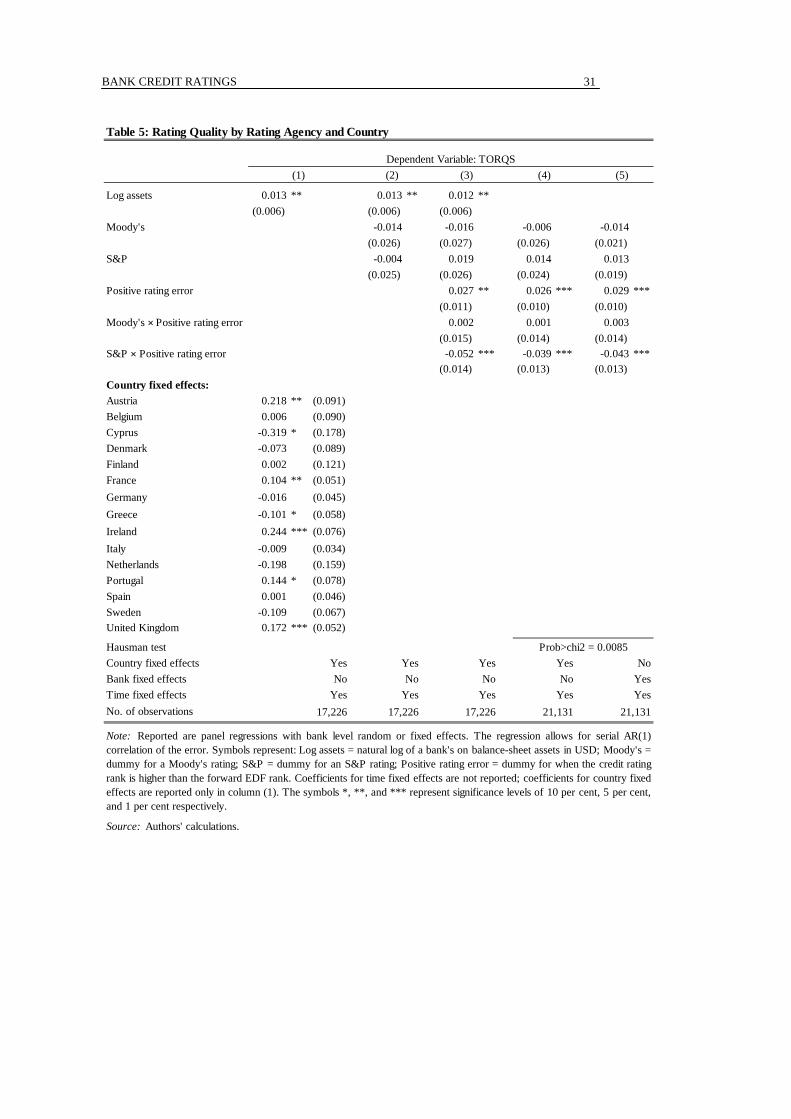
Rating agencies may differ in their rating technology and the degree to which they have conflicts of interest with respect to revenue sources. As our data cover the three largest rating agencies, it is interesting to explore agency-specific differences in ratings’ accuracy. Here we also report and control for country fixed effects as cross-country differences in accounting standards and regulatory supervision may also co-determine the rating precision. Table 5 reports panel regressions for a variety of fixed effects. The baseline specification in column (1) controls for bank size measured by Log assets and reports all country fixed effects. The regression specification allows for serial correlation of the regression error and reports the adjusted standard errors. Bank size is revealed to have a positive effect on TORQS. Banks headquartered in Austria, Ireland and the United Kingdom feature significantly higher ratings errors. The country coefficient for Ireland of 0.244 implies that Irish banks have on average 58% higher TORQS relative to its unconditional standard deviation of 0.4205. Column (2) reports fixed effects for the rating agencies Moody's and S&P. Neither coefficient shows any significant cross-agency difference in rating accuracy. The panel regression again includes country fixed effects, which are qualitatively similar to column (1) and therefore not reported in this and the following specifications. Agency conflicts may not so much increase the average absolute rating error, but rather bias ratings towards some more optimistic ratings. To capture such asymmetry in the rating error, we define a dummy variable Positive rating error; which is equal to one whenever the rating error is positive and zero otherwise. By positive rating error, we mean instances where the CR rank is lower (that is, more ‘optimistic’) than the rank of the forward EDF. The definition of the ORQS (or TORQS) measure constrains the Positive rating error
BANK CREDIT RATINGS
17
dummy to be zero on average. But the Positive rating error dummy can capture directional bias within a subsample of ratings issued by a particular rating agency. We therefore interact the Positive rating error dummy with the rating agency dummies Moody's and S&P. Table 5, column (3) reports statistically significant differences across agencies with respect to rating bias. S&P shows a negative rating bias (with less optimistic credit ratings) relative to Moody's and Fitch. This conclusion is robust if random fixed effects at the bank level (column (4)) are replaced with bank fixed effects (column (5)). The regression with bank fixed effects compares rating accuracy for banks with ratings by multiple agencies and therefore eliminates any selection effects with respect to the agency's portfolio of bank ratings. We can therefore confirm that rating agencies have different rating biases in credit ratings. Moreover, the difference in rating bias is also economically large. A coefficient of -0.0434 in column (5) for the dummy interaction term S&P × Positive rating error implies that S&P's rating bias was lower to the tune of 10.3% of TORQS's unconditional standard deviation.14
[Insert Table 5 here]
7.3. Rating Quality and Bank Characteristics
Banks differ considerable in their (i) size; (ii) profitability; (iii) capital structure; (iv) asset structure or business model and (v) funding structure. How do these bank characteristics influence rating accuracy? The following analysis takes bank characteristics as exogenous to rating quality and thus adopts a causal interpretation from the former to the latter. Reverse causality is plausible from the level of ratings to some bank characteristics such as profitability or funding structure. For example, banks with low ratings may face higher financing costs, seek shorter maturities on the liability side of their balance sheet or experience lower profitability. However, the dependent variable in our analysis is not the rating level, but rather the ordinal TORQS measure. We assume that ordinal rating errors do not influence any of the above bank characteristics, which is a more plausible assumption. Table 6 presents the panel regressions which account for country and time fixed effects, random effect at the bank level and report standard errors adjusted for serial AR(1) error correlation. Columns (1) to (5) report coefficients for individual regressors and column (6) the joint effect of all controls. As before, bank size measured as Log assets is positively related to the rating error and significant in most specifications. However, in the full specification (column (6)), the coefficient on Log assets is not significant at the 10% level of confidence. As we will show, bank size correlates more with rating bias than rating error.
The Loan share variable is statistically significant (columns (3) and (6)) with a negative coefficient estimate. This suggests that a traditional lending-based banking model
14 In 2012, Moody's finally undertook a general review of bank ratings and downgraded its ratings for a large group of banks with a 6 month delay on its rivals Fitch and S&P (Economist, June 16, 2012).
HARALD HAU, SAM LANGFIELD AND DAVID MARQUES-IBANEZ
18
is associated with higher rating accuracy. Surprisingly, a high Trading share does not contribute to the rating error and reveals instead a weak negative effect which is statistically significant in the full specification of column (6). This could be explained by the strong countercyclical nature of trading revenues. The average correlation of bank trading revenue with the VIX index of equity market volatility is relatively high at 0.18. Market-making and proprietary trading therefore delivers revenue stabilizing income in times of financial crisis when market volatility is high. Our finding of a significant negative coefficient on the Trading share variable implies that credit rating agencies systematically underestimate the countercyclical effect of trading activity on bank creditworthiness.
The Short-term funding share variable correlates with smaller ratings error. This variable not only measures the degree of maturity transformation, but also the size of the deposit base of a bank.
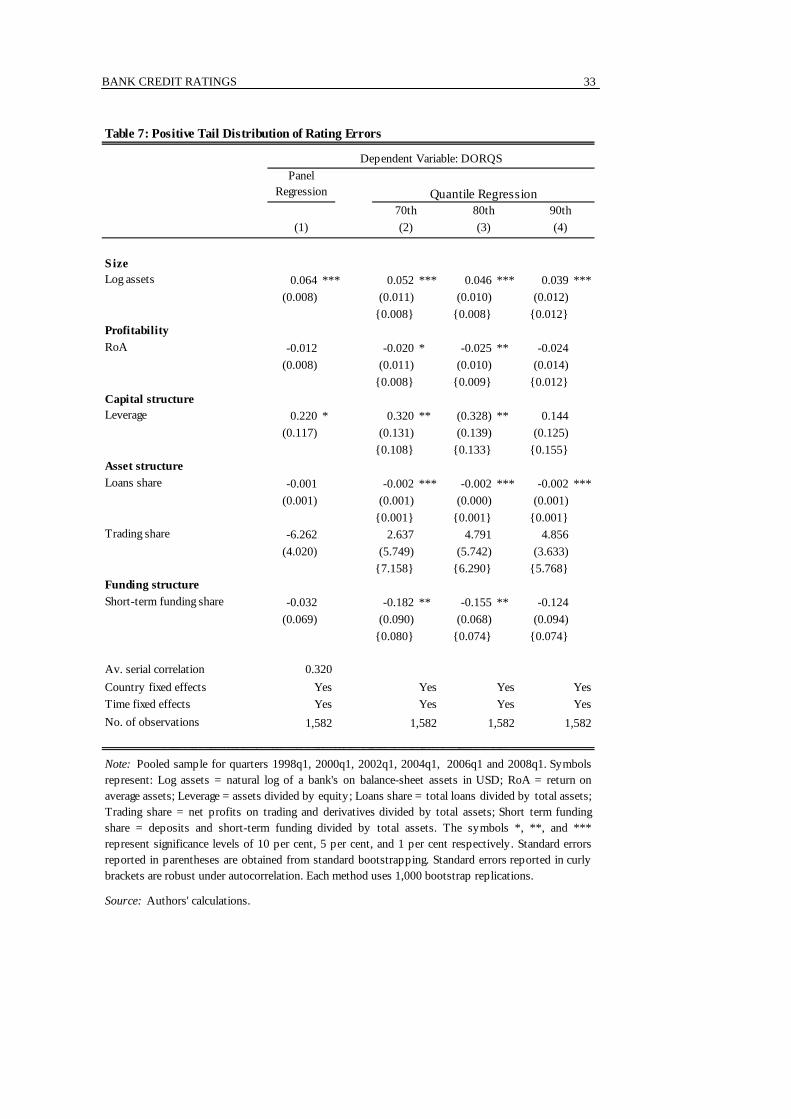
[Insert Table 6 here] The panel regressions discussed so far analyze the average absolute rating error measured by TORQS. But of particular policy concern are large positive rating errors, where a bank with a high credit rating suddenly experiences financial distress. Quantile regressions provide a useful tool to concentrate on such large positive rating errors. Accordingly, Table 7 uses the same explanatory variables as Table 6, but focuses on their influence on the right (i.e., positive) tail of the DORQS distribution given by the 70th, 80th and 90th quantiles. The reported quantile coefficients indicate the marginal effects of the given explanatory variables at these different points in the DORQS distribution. As quantile regressions do not allow for any simple correction for serial correlation, we pool a sample of credit ratings. In the table presented here, we pool six quarters separated by two years intervals: 1998Q1, 2000Q1, 2002Q1, 2004Q1, 2006Q1 and 2008Q1. The sampling distance of eight quarters should largely eliminate the serial correlation pattern apparent at the quarterly frequency. Our results are robust to the choice of sample choice; other subsamples drawn at 2 year intervals give quantitatively very similar results. All regressions include country and time fixed effects.
[Insert Table 7 here] In Table 7, columns (2) to (4) provide the quantile estimates at the 70th, 80th and 90th quantile, respectively. For comparison, column (1) reports panel regression which conveys the average rating bias over the entire DORQS distribution. The quantile regressions generate statistically stronger results for more variables than the panel regressions reported in Table 6.15 In particular, the coefficient on Log assets is statistically significant at the 1% level of confidence and economically large across all quantiles
15 Our findings are generally robust to autocorrelation; standard errors reported in curly brackets allow for autocorrelation.
BANK CREDIT RATINGS
19
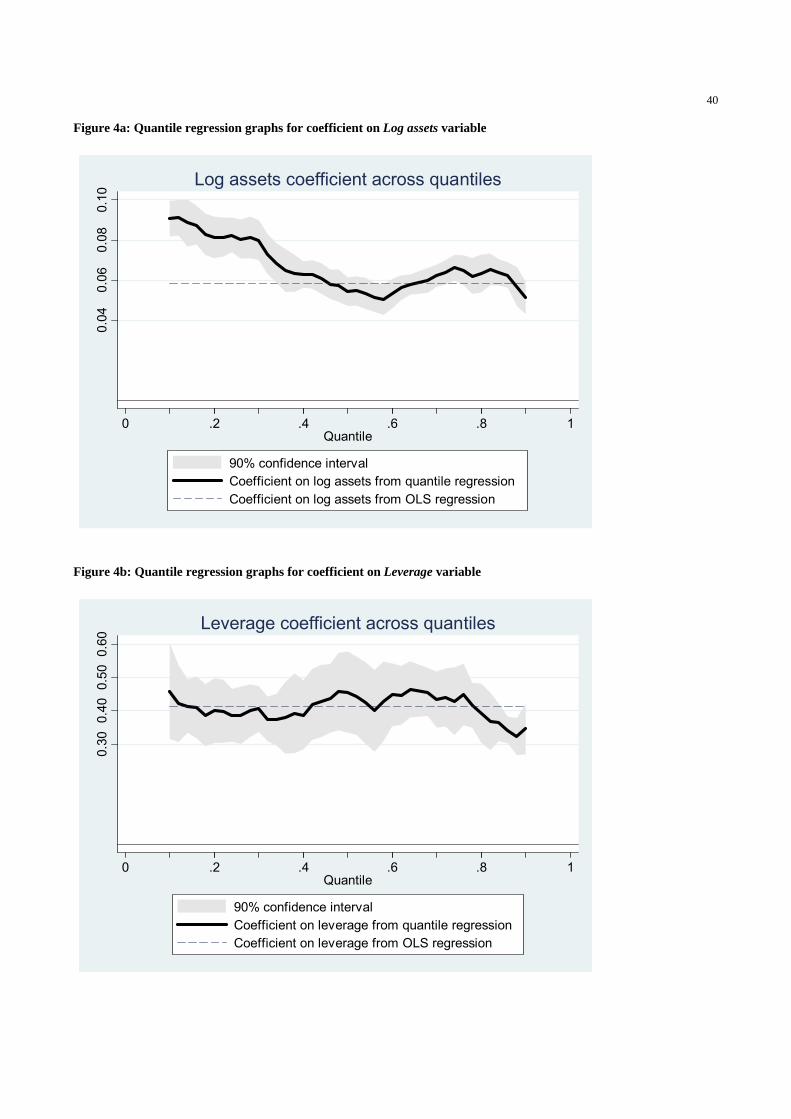
reported in the table. Additionally, Figure 4a plots coefficients on Log assets across all quantiles. We observe that the coefficient is positive and statistically strong across all quantiles, which is evidence for a general rating bias in favour of large banks. This evidence conflicts with the hypothesis that large banks have lower rating accuracy just because of greater complexity. If the latter were true, we would expect to find a negative quantile coefficient for negative rating errors below the 0.5 (median) quantile. Instead, we find the opposite. Our analysis is based on "all-in" ratings, which means that the rating agencies account for the ability of different sovereigns to bail out banks. Cross-country differences in the bank bail-out ability are captured by country fixed effects and should not influence our results. Moreover, within countries large banks might plausibly be more likely to profit from government support. Yet such implicit size-contingent government support should also be reflected in equity prices and improve the EDF rank in parallel to the CR rank with possibly no effect on the rating error.16 Finally, even if the rating bias in favour of large banks is related to the "too big to fail" effect of implicit government support, this makes our finding no less policy relevant. In the latter case, bank credit ratings are the transmission channel through which a "too big to fail policy" creates competitive distortions in the banking sector. We can also quantify the magnitude of this distortion. A regression coefficient of 0.064 for log assets in Table 7, column (1), implies that a bank size increase by two standard deviations translates into an inflated credit rating rank (relative to the EDF rank) by 22 positions for every 100 banks in the sample. This corresponds to undeserved rating improvement from BBB to A-. Based on yields to maturity on banks’ bonds and medium-term notes issued to the primary market over 2002-2012, a rating improvement from BBB to A- equates to a considerable reduction in funding costs of 122 basis points on average. The coefficient for Leverage also becomes statistically significant in Table 7. Like bank size, it has a positive directional (bias) effect on the rating error which extends over the entire distribution of rating errors given by DORQS. Figure 4b plots the influence of Leverage from the 10th to the 90th quantile, which is positive throughout. Rating agencies do not generally underestimate the risk posed by leverage. Instead, they attribute systematically better credit ratings to highly leveraged banks relative to what they merit based on expected default frequencies two years later.
[Insert Figures 4a and 4b here]
7.4. Ratings Quality and Bank Fee Income
At the core of the agency conflict of rating agencies is the pay for ratings model, where the issuer or originator of an asset securitization pays for a rating. Revenue from securitizations
16 This is at least the case if the bailout spares the equity holder from full dilution as was the case with bank support in Germany and France.
HARALD HAU, SAM LANGFIELD AND DAVID MARQUES-IBANEZ
20
had become an increasing share of the revenue of rating agencies over the 2000s. Similarly, asset securitization provided banks with substantial fee income based on a business model of origination and distribution. We use the Fees share (= net fees and commission divided by total assets) as a proxy for possible collusion between the rating agencies and the bank. Did banks with a high Fees share obtain more favourable ratings? Table 8 reports panel regressions for all ratings with a positive rating error. This subsample focuses on the banks which have obtained the most optimistic ratings and may therefore be best suited to identify the bank characteristics generating positive rating bias. Column (1) reports the results for all rating agencies. As in Table 5, columns (3) and (4), S&P ratings show a negative bias relative to the two other rating agencies. The coefficient for Fees share is positive and (weakly) significant at the 10% level of confidence. Columns (2), (3) and (4) report separate regressions for subsamples of Moody's, S&P and Fitch ratings, respectively. For S&P ratings, the coefficient Fees share is large at 1.755 and statistically significant at the 5% level. S&P ratings therefore feature more favourable ratings for banks with high fee income: A two standard deviation increase in the fees share (=2×0.016) implies a DORQS increase for S&P ratings of 0.056, or 13% of the unconditional standard deviation in DORQS.
In all specifications, bank size measured by Log assets is highly significant. Large banks benefited from the most favourable ratings by all three rating agencies. Bias in favour of big banks is large: A two standard deviation increase in size (=2×1.79) implies a point estimate of 0.097 for the change in DORQS, which amount to 23% of the unconditional standard deviation in DORQS.
[Insert Table 8 here]
7.5. Ratings Quality and Competition
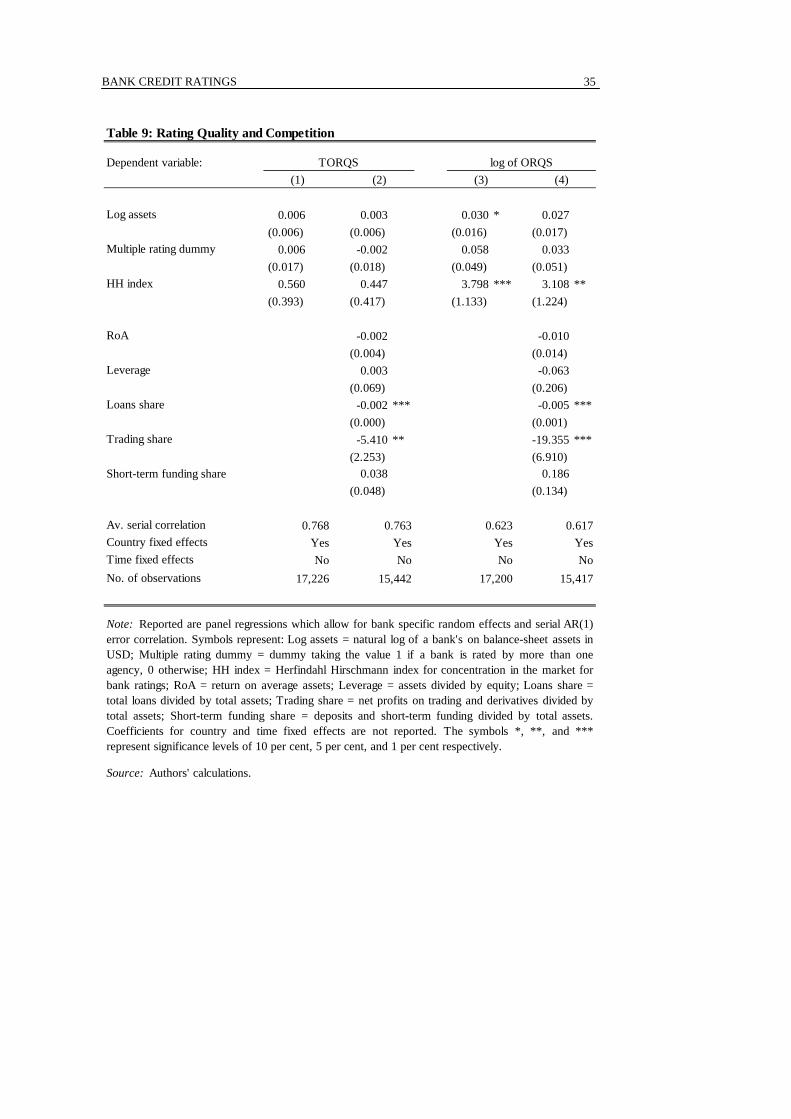
Lastly, we explore the role of competition in the market for bank ratings. After 2000, competition in the rating market increased as Fitch became a more important competitor through acquisitions of smaller rating agencies and a general expansion of its rating business (Becker and Milbourn, 2010). Based on the number of bank ratings generated by the three major rating agencies, we construct a Herfindahl-Hirschmann index (HH index) of industry concentration, which shows decreasing industry concentration after 2000. Table 9 reports panel regressions which include the HH index as an explanatory variable. Columns (1) and (2) use TORQS (the Box-Cox transformation of the ORQS) as the dependent variable. It is characterized by zero skewness. In addition, we use the Log of ORQS as an alternative dependent variable; the corresponding results are in columns (3) and (4). Such a log transformation reduces the importance of large rating errors more than the Box-Cox transformation such that the regression results become more sensitive to small rating errors. We include a Multiple rating dummy in all regressions. Variations in rating competition may simultaneously change the sample of banks with multiple ratings; such
BANK CREDIT RATINGS
21
sample composition effects are captured by this dummy. In columns (1) and (2) the HH index is positive, but statistically insignificant. It becomes statistically significant at the 5% level in column (4). Less industry concentration correlates positively with rating precision and particularly so for small rating errors. However, one shortcoming of the evidence presented here is that the HH index concerns only one industry (global bank ratings); its lack of lack of cross-sectional variation implies that the results should be interpreted with caution.
[Insert Table 9 here]
7.6. Ratings Quality and Disclosure
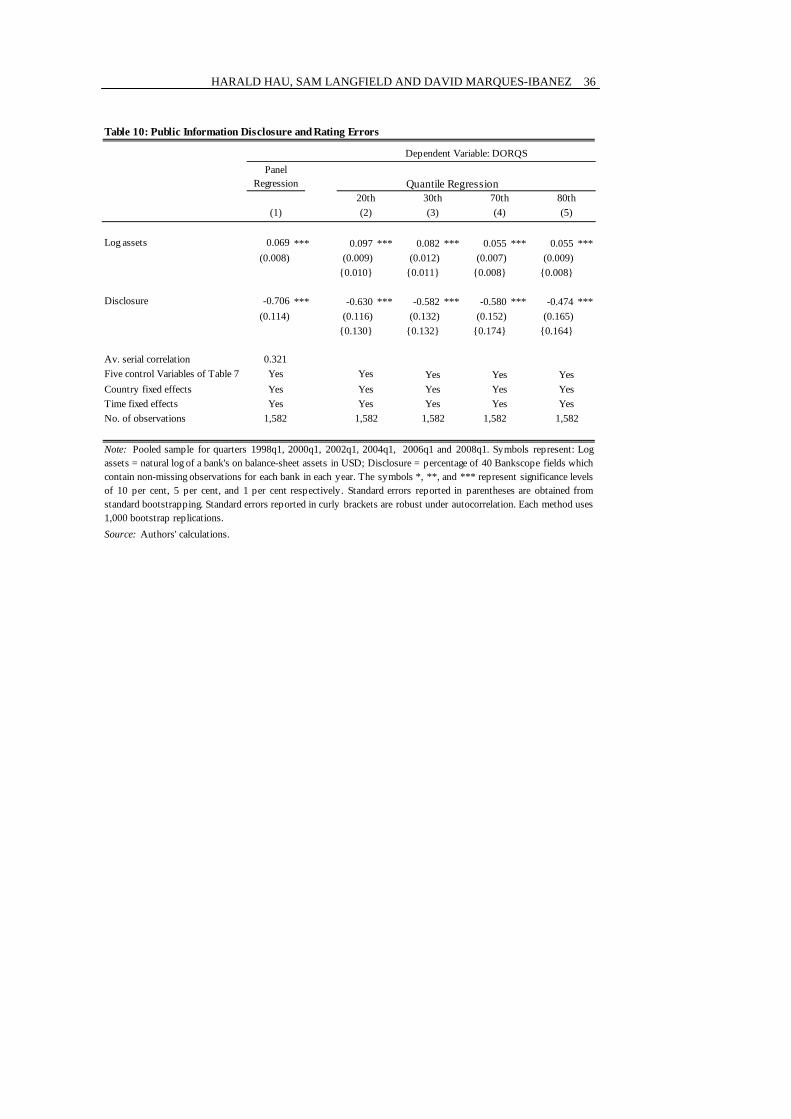
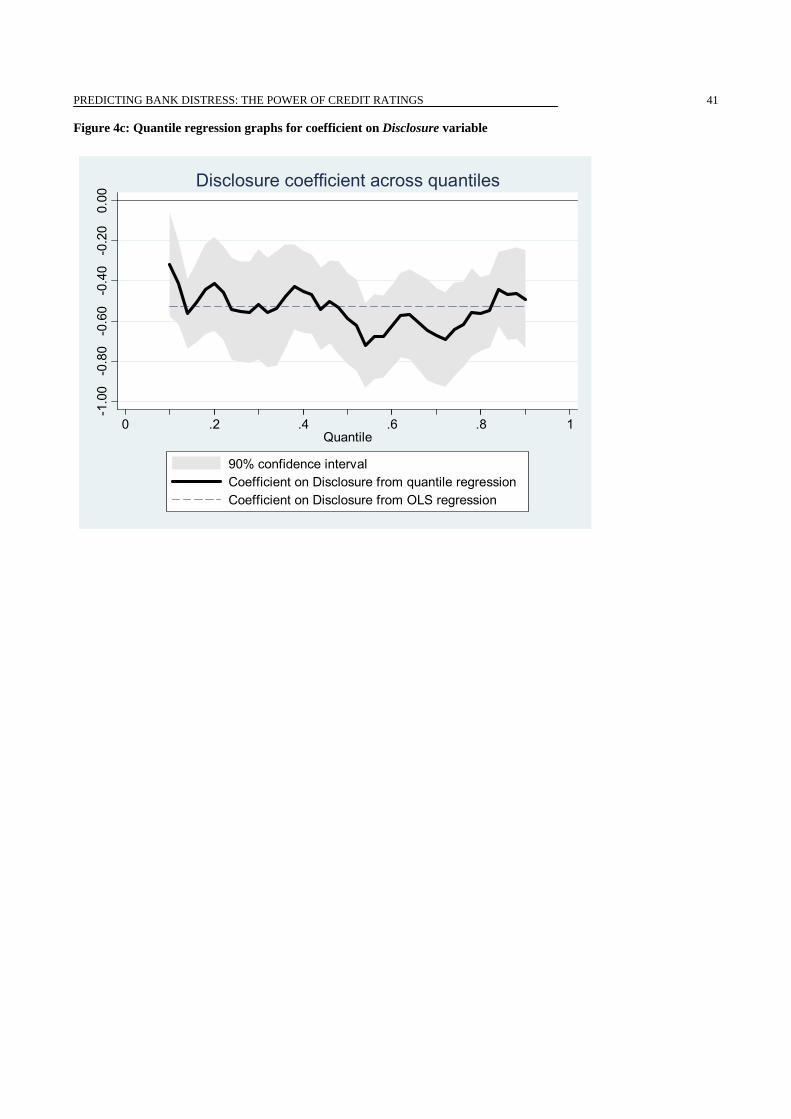
Rating information summarizes financial data in a single credit risk measure. Direct public disclosure of accounting data may therefore substitute for rating information. Sophisticated market participants may find that the information content of such accounting data may even exceed that of the rating itself. Partial substitutability of disclosure and ratings may also drive the disclosure process itself: The more a bank is overrated (underrated) the lower (higher) its incentive to disclose more information. Table 10 expands the quantile regression in Table 7 and adds Disclosure as a new regressor. The panel regression results are provided in column (1), whereas the quantile regressions at the 20th, 30th, 70th and 80th quantiles are stated in columns (2) to (5), respectively. We report regression coefficients only for Log assets and Disclosure. The correlation between rating errors and disclosure is statistically strongly negative both at the low 20th and 30th quantile capturing underrated banks as well as for the higher 70th and 80th quantile with overrated banks. The relationship between the directional rating error and disclosure appears also economically significant: An increase of the DORQS by two standard deviations is linked to a disclosure increase by 0.031 or 32% of its standard deviation of 0.0959. We interpret this as suggestive evidence that banks' accounting disclosure reacts to rating errors ̶ presumably because more public disclosure can supersede rating information.
[Insert Table 10 here]
8. CONCLUSIONS AND POLICY IMPLICATIONS
The 2007-09 financial and banking crises have shifted rating agencies and the quality of their opinions into the centre of the policy debate. The issue of rating quality is closely connected to a larger debate about bank regulation, which is founded on rating-contingent bank capital requirements. To inform this debate, the current paper contributes a number of stylized empirical facts about the quality of bank ratings.
HARALD HAU, SAM LANGFIELD AND DAVID MARQUES-IBANEZ
22
We ground our analysis on the premise that it is inherently difficult to predict the timing and intensity of a systemic banking crisis. This insight informs our strictly ordinal definition of rating quality. In our analysis, it is not the absolute (cardinal) level of default risk that matters, but rather the rank-order of default risk among all banks. We then apply this ordinal approach to a large database on bank ratings issued by the three major ratings agencies over the period 1990 to 2011. The corresponding measure of bank distress is the expected default frequency (EDF) measured by the widely used Merton model of corporate default. We draw our EDF measures directly from Moody's in order to avoid any parameter choices which might bias the rating quality metric against a finding high rating quality.
Our first insight concerns the overall quality of ratings. We show that bank ratings in the upper investment grade range bear no ordinal relationship to expected default probabilities two years later. The Spearman rank correlation between the credit rating rank and the EDF rank is even slightly negative when EDFs are measured outside of crisis periods. This finding runs contrary to the risk-weights applied in the standardized approach to credit risk under the first pillar of the Basel II accord. Under the recommendations of this accord, exposures to financial institutions are signed a 20% risk-weight if the external credit rating is between AAA to AA-; a 50% risk-weight if the external rating is between A+ to A-; and a 100% risk-weight for the lowest investment grades rating from BBB+ to BBB-. These risk-weights are used by national bank regulators to determine whether banks meet minimum regulatory capital requirements. But such a large step-change in risk weights cannot be reconciled with our evidence that the AAA to AA- bucket is statistically indistinguishable from the A+ to A- bucket in terms of rankings of EDFs. This discrepancy is likely to generate important market distortions. To the extent that minimum regulatory capital requirements bind, we expect banks to hold more exposure to other banks rated AAA to AA- compared with banks rated A+ to A-. These Basel II risk-weights thus distort the market for interbank lending and entrenches the market position of banks rated AA- and above.
We also highlight the countercyclical nature of rating quality. The information content of ratings increases during a financial crisis. If the expected default risk is measured during a crisis period, even bank ratings in the investment grade range become somewhat informative. The Spearman correlation between the credit rating rank and EDF rank is 14% for the top third of rating observations. In an ordinal (rather than cardinal) sense, credit ratings become more meaningful at the onset of a financial crisis. This might also explain why they simultaneously become more politically controversial, as seen during the recent crisis of European sovereign debt market.
Secondly, our analysis reveals systematic relationships between the direction (bias) of the rating error and certain characteristics of banks’ balance sheets. In particular, we find that large banks obtain systematically more favourable credit ratings relative to their expected default risk measured two years later. We argue that implicit government support for large banks is unlikely to explain this bias since such guarantees might just inflate the EFD rank and CR rank symmetrically without generating a rating error. More likely, the rating bias reflects the economic power of large banks with respect to the rating agency,
BANK CREDIT RATINGS
23
which depends on fees not only from bank ratings but also from ratings of structured products. At the extreme, large banks with economic power become ‘too big to downgrade’ for the rating agency. Further analysis on bank fee income as a proxy for a securitization business (which became increasingly important for the rating agencies) supports this conjecture. Banks with more fee income also tend to benefit from a positive rating bias.
Our evidence of a substantial rating bias in favour of the largest banks also matters from the perspective of competition in the market for banking services and the too-big-to-fail problem. Higher credit ratings translate directly into lower financing costs; systematic rating bias therefore hampers open competition. Economic power over rating agencies exercised by a group of banks is particularly concerning. These same institutions could also give rise to political-economy problems between banks, supervisors and government.
In light of the shortcomings in the current rating process, public policy should encourage alternative sources of credit rating information. Recent work by Bloechlinger, Leippold and Maire (2012) shows that one can produce corporate credit rating measures at par or superior to that of the credit ratings agencies at almost no cost using public information only. The latter suggests that the three largest rating agencies owe their predominance in the market for corporate ratings more to regulatory privilege than information advantage. With the Dodd-Frank Act in the US, which aims to reduce regulatory reliance on rating agencies, some segments of the rating market might become low-cost commodities in the near future dominated by non-profit organizations.
In order to reduce the cost of processing bank accounting information, banks’ public reporting requirements should be vastly enhanced to facilitate cheaper and better credit analysis. Those reporting requirements are still very heterogeneous across countries. A number of countries do not require quarterly financial statements for non-listed banks and provide significant room for manoeuvre to allocate certain items to the trading or banking book (Huizinga and Laeven, 2010). In most countries, bank regulators protect their privileged data access, and do not share crucial bank data publically (or even with other bank regulators) in a narrow pursuit of their own agency power and to shield themselves from accountability. Future bank regulation therefore needs to create an entirely new information environment for external credit analysis. Better public information and more bank reporting is the best strategy to reduce the power and exorbitant influence of rating agencies in the current system.
HARALD HAU, SAM LANGFIELD AND DAVID MARQUES-IBANEZ
24
REFERENCES
Altunbas, Y., S. Manganelli and D. Marques-Ibanez (2011). ‘Bank risk during the financial crisis do business models matter’, European Central Bank Working Paper 1394.
Bar-Isaac, H. and J. Shapiro (2011a). ‘Ratings quality over the business cycle’, working paper. Bar-Isaac, H. and J. Shapiro (2011b). ‘Credit ratings accuracy and analyst incentives’, The
American Economic Review: Papers and Proceedings, 101(3), 120-124. Basel Committee on Banking Supervision (BCBS) (2010). ‘Basel III: A global regulatory
framework for more resilient banks and banking systems’, Bank for International Settlements. Basel Committee on Banking Supervision (BCBS) (2011). ‘Global systemically important banks:
assessment methodology and the additional loss absorbency requirement’, Bank for International Settlements.
Becker, B., and T. Milbourn (2010). ‘How did increased competition affect credit ratings?’, Harvard Business School Finance Working Paper 09-051.
Beltratti, A. and R.M. Stultz (2011). ‘Why did some banks perform better during the credit crisis? A cross-country study of the impact of governance and regulation’, Journal of Financial Economics, forthcoming.
Benmelech, E. and J. Dlugosz (2009). ‘The credit rating crisis’, NBER Macro Annual, 161-207 Berger, A. and C. Bouwman (2011), ‘How does capital affect bank performance during financial
crises?’, Wharton Financial Institutions Center Working Paper 11-22. Bloechlinger, A., M. Leippold and M. Basile (2012), ‘Are ratings the worst form of credit
assessment apart from all the others?’, Swiss Finance Institute Research Paper 12-09. Bolton, P., X. Freixas and J. Shapiro (2012). ‘The credit ratings game’, Journal of Finance, volume
67, issue 1, pp.85-112. Bongaerts, D., K.J. Martijn Cremers and W. Goetzmann (2011). ‘Tiebreaker: certification and
multiple credit ratings’, National Bureau of Economic Research Working Paper 15331. Boot, A. and A.V. Thakor (2010). ‘The accelerating integration of banks and markets and its
implications for regulation’, in A. Berger, P. Molyneux and J. Wilson (eds.), The Oxford Handbook of Banking, pp. 58-90.
Bradshaw, M. T. (2011). ‘Analysts’ forecasts: what do we know after decades of work?’, mimeo. Camanho, N., P. Deb and Z. Liu (2010). ‘Credit rating and competition’, working paper, mimeo. Campello, M., J. Graham and C. Harvey (2010). ‘The real effects of financial constraints: Evidence
from a financial crisis’, Journal of Financial Economics, 470-487. Cantor, R. and F. Packer (1995). ‘The credit rating industry’, Journal of Fixed Income, 5(3), 10-34. Cole, R.A. and L.J. White (2012). ‘Déjà vu all over again: The causes of U.S. commercial bank
failures this time around’, Journal of Financial Services Research, Forthcoming. Covitz, D., and P. Harrison (2003). ‘Testing conflicts of interest at bond Rating agencies with
market anticipation: evidence that reputation incentives dominate,’ Board of Governors of the Federal Reserve System Finance and Economics Discussion Series 2003-68.
Crouhy, M., D. Galai and M. Robert (2000). ‘A comparative analysis of current credit risk models’, Journal of Banking and Finance, 241, 59-117.
DeYoung, R. (2008). “Safety, soundness, and the evolution of the U.S. banking industry”. In A. Boot and A. Thakor (eds.). Corporate Finance: Financial Intermediation and Banking, Amsterdam: North Holland, 347-374.
Dodd-Frank Wall Street Reform and Consumer Protection Act (2010). Dwyer D. and Qu S. (2007), “EDF™ 8.0 Model Enhancements”, Moody’s KMV. European Central Bank (2009), Financial Stability Review, June, Frankfurt. Fahlenbrach, R., R. Prilmeier, R. Stulz (2011). ‘This time is the same: using bank performance in
1998 to explain bank performance during the recent financial crisis’, Fisher College of Business working paper 2011-03-010.
Fitch (2012), Fitch Ratings – Definitions of Ratings and Other Forms of Opinion – April 2012. Financial Stability Board (2010). ‘Principles for reducing reliance on CRA ratings’. Fulghieri, P., G. Strobl and H. Xia (2010). ‘The economics of unsolicited credit ratings’, working
paper.
BANK CREDIT RATINGS
25
Garlappi L., Uppal, R. and Wang, T. (2007), ‘Portfolio Selection with Parameter and Model Uncertainty: A Multi-Prior Approach’, Review of Financial Studies, Vol. 20, No 1, pp. 41-81.
Griffin, J. and D. Tang (2011). ‘Did credit rating agencies make unbiased assumptions on CDOs?’, American Economic Review: Papers & Proceedings, 101(3), 125-130.
Fang, L. and A. Yasuda (2009). ‘The effectiveness of reputation as a disciplinary mechanism in sell-side research’ , Review of Financial Studies, 22(9), 3735-3777.
Fulghieri, P., G. Strobl and H. Xia (2010). ‘The economics of solicited and unsolicited credit ratings’. Unpublished manuscript.
He, J., J. Qian, P.E. Strahan (2011). ‘Credit ratings and the evolution of the mortgage-backed securities market’, American Economic Review: Papers & Proceedings, 101(3), 131-135.
Hilscher, J. and M. Wilson (2011). ‘Credit ratings and credit risk’, working paper, mimeo. Hörner, J. (2002), ‘Reputation and competition’, The American Economic Review 92:3, 644-663. Huizinga, H. and L. Laeven (2009). ‘Accounting Discretion of Banks During a Financial Crisis’
IMF Working Papers 09/207. Hull, J., M. Predescu and A. White (2004). ‘The relationship between credit default swap spreads,
bond yields, and credit rating announcements’, Journal of Banking and Finance 28, 2789-2811. Independent Commission on Banking (2011). Final Report Recommendations. International Monetary Fund (2009), Global Financial Stability Review, April. Kiff,, J., M. Kisser, and L. Schumacher (2012). ‘An inspection of the through-the-cycle rating
methodology,’ IMF Working Paper, forthcoming. Kliger, D. and O. Sarig (2000). ‘The information value of bond ratings’, Journal of Finance, 56(6),
2879-2902. Lando, D. and T. Skodeberg (2002). ‘Analyzing rating transitions and rating drift with continuous
observations’, Journal of Banking and Finance 26: 423-444. Longstaff, F. and E. Schwartz, (1995). ‘Valuing risky debt: A new approach’, Journal of Finance
50: 789–820. Manso, Gustavo (2011). ‘Feedback effects of credit ratings’, working paper. Mathis, J., J. McAndrews and J.-C.Rochet (2009). ‘Rating the raters: Are reputation concerns
powerful enough to discipline rating agencies?’ Journal of Monetary Economics 56, 657-74. Merton, R. (1974). ‘On the pricing of corporate debt: the risk structure of interest rates’, The
Journal of Finance, vol.29, no.2, pp.449-470. Moody’s Investors Services (1999). ‘Rating methodology: The evolving meanings of Moody’s bond
ratings’. Moody’s (2006). Moody’s credit rating prediction model, Special Note. Morgan, D. (2002). ‘Rating banks: risk and uncertainty in an opaque industry’, The American
Economic Review 92, 874-888. Munves, D., Hamilton D. and Gokbayrak O. (2009). ‘The Performance of EDFs since the Start of
the Credit Crisis’, Moody’s Analytics, June. Munves, D., Hamilton D. and Smith A. (2010). ‘Banks and their EDF measures now and through
the credit crisis: Too high, too low, or just about right?, Moody’s Analytics, June. Norden, L. and M. Weber (2004). ‘Informational efficiency of credit default swap and stock
markets: The impact of credit rating announcements’, Journal of Banking & Finance 28, 2813-2843.
Opp, C., M. Marcus and M. Harris (2012). ‘Rating agencies in the face of regulation’, mimeo. Packer, F. and N. Tarashev (2011). ‘Rating methodologies for banks’, BIS Quarterly Review. Pagano, M. and P. Volpin (2010). ‘Credit ratings failures and policy options’, Economic Policy 62,
401-431. Partnoy, F. (2002). ‘The paradox of credit ratings’, in Ratings, Rating Agencies, and the Global
Financial System, ed. R. Levich, C. Reinhart, and G. Majnoni, Boston: Kluwer 65-84. Partnoy, F. (2006). ‘How and why credit rating agencies are not like other gatekeepers’, in
Financial Gatekeepers: Can They Protect Investors?, ed. Y. Fuchita and R. Litan, Brookings Institution Press and Nomura Institute of Capital Markets Research, pp.59-102.
Reinhart, C. and K. Rogoff (2009). ‘The aftermath of financial crises’, American Economic Review, 99:2, 466-472.
Skreta, V. and L. Veldkamp (2009). ‘Ratings shopping and asset complexity: A theory of ratings inflation’, Journal of Monetary Economics 56, 678-695.
HARALD HAU, SAM LANGFIELD AND DAVID MARQUES-IBANEZ
26
Standard and Poor’s (2009). ‘Understanding Standard & Poor’s rating definitions’, Standard & Poor’s Ratings Direct, June 3.
White, L. (2010). ‘Markets: The credit rating agencies’, Journal of Economic Perspectives, 24(2), 211-26.
Winkler, W. (2006). ‘Overview of record linkage and current research directions’, Statistical Research Division, US Census Bureau.
19 1.000 9 99.57% CCC- 8 Caa3 1 CCC- 020 0.988 31 99.65% CC 11 Ca 4 CC 1621 0.990 48 99.78% C 0 C 41 C 722 0 99.78% R 023 0 99.78% SD 0 RD 024 0.997 87 100.00% D 86 D 1
Table 1: Transformation of credit ratings data
In default
Upper medium grade
Lower medium grade
Non-investment grade speculative
Highly speculative
In default with little prospect of recovery
S&P Moody's Fitch
High grade
All
ikttktiktktMktM
iktktiktkiktZXiCiC
XCYCloansCloans εκψψφφ δδββααμ+ΓΘ++Δ++Δ++
+++++Δ++=Δ
−−−−
−−−
1111
111 )*()*(
)*( )*()ln()*()ln(
HARALD HAU, SAM LANGFIELD AND DAVID MARQUES-IBANEZ
28
Description Source Obs Mean Median Std. Dev. 25th pc 75th pc
Ratings variables:Credit rating rank (simple) Fractional rank of credit ratings CRAs 21131 149.5 132.0 96.83 62.5 229.0Credit rating rank (with outlook and watchlist)
Fractional rank of credit ratings using the outlook and watchlist CRAs 21131 149.5 134.5 97.27 64.5 230.0
EDF One-year expected default frequency from Moody's KMV
Note: Parameter k denotes the time lag (in months) for the EDF measurement. The symbols *, **, and ***represent significance levels of 10%, 5%, and 1%, respectively. Top tier ratings comprise (mostly) ratings fromAAA to AA-, middle tier ratings those from A+ to A-, and bottom tier ratings those from BBB+ to C.
Panel C: Crisis PeriodSubsamples Full sample
Top Tier Middle Tier Bottom Tier
HARALD HAU, SAM LANGFIELD AND DAVID MARQUES-IBANEZ
Av serial correlationCountry fixed effectsBank fixed effectsTime fixed effectsNo. of observations
No
Dependent Variable: TORQS
Table 4: Credit Ratings During Crisis and after Credit Booms
Source: Authors' calculations.
21,131 18,218 18,218 18,218
No No YesNo No
Note: The panel regressions allow for an AR(1) serial correlation structure. Symbols represent: Crisis = dummy for a crisis eight quarters forward, with crisis defined as the period from 2008Q4:2010Q4 and2011Q2:2011Q3; Credit growth = change in country-level private credit stock on 12 quarters previous.Coefficients for country and time fixed effects are not reported. The symbols *, **, and *** representsignificance levels of 10 per cent, 5 per cent, and 1 per cent respectively.
Hausman testCountry fixed effectsBank fixed effectsTime fixed effectsNo. of observations
Table 5: Rating Quality by Rating Agency and Country
NoYesNo No No
Yes Yes YesNo
Prob>chi2 = 0.0085
Dependent Variable: TORQS
21,131Yes
(2) (3) (4) (5)
Yes
Yes
(1)
Yes Yes Yes
Source: Authors' calculations.
17,226 17,226 17,226
Note: Reported are panel regressions with bank level random or fixed effects. The regression allows for serial AR(1)correlation of the error. Symbols represent: Log assets = natural log of a bank's on balance-sheet assets in USD; Moody's =dummy for a Moody's rating; S&P = dummy for an S&P rating; Positive rating error = dummy for when the credit ratingrank is higher than the forward EDF rank. Coefficients for time fixed effects are not reported; coefficients for country fixedeffects are reported only in column (1). The symbols *, **, and *** represent significance levels of 10 per cent, 5 per cent,and 1 per cent respectively.
21,131
HARALD HAU, SAM LANGFIELD AND DAVID MARQUES-IBANEZ
Av. serial correlationCountry fixed effectsTime fixed effectsNo. of observations
Table 6: Rating Quality and Bank Characteristics
Dependent Variable: TORQS(1) (2) (3) (4) (5) (6)
Source: Authors' calculations.
YesYes
15,442Yes
16,556 17,226Yes Yes Yes
16,217 17,226
Yes
Note: Symbols represent: Log assets = natural log of a bank's on balance-sheet assets in USD; RoA = return onaverage assets; Leverage = assets divided by equity; Loans share = total loans divided by total assets; Tradingshare = net profits on trading and derivatives divided by total assets; Short term funding share = deposits and short-term funding divided by total assets. Coefficients for country and time fixed effects are not reported. The symbols*, **, and *** represent significance levels of 10 per cent, 5 per cent, and 1 per cent respectively.
Av. serial correlationCountry fixed effectsTime fixed effectsNo. of observations
YesYes Yes
0.320YesYes Yes Yes
Yes
Table 7: Positive Tail Distribution of Rating Errors
Quantile RegressionPanel
Regression
Dependent Variable: DORQS
70th 80th 90th (1) (2) (3) (4)
Note: Pooled sample for quarters 1998q1, 2000q1, 2002q1, 2004q1, 2006q1 and 2008q1. Symbolsrepresent: Log assets = natural log of a bank's on balance-sheet assets in USD; RoA = return onaverage assets; Leverage = assets divided by equity; Loans share = total loans divided by total assets;Trading share = net profits on trading and derivatives divided by total assets; Short term fundingshare = deposits and short-term funding divided by total assets. The symbols *, **, and ***represent significance levels of 10 per cent, 5 per cent, and 1 per cent respectively. Standard errorsreported in parentheses are obtained from standard bootstrapping. Standard errors reported in curlybrackets are robust under autocorrelation. Each method uses 1,000 bootstrap replications.
Source: Authors' calculations.
1,582 1,5821,582 1,582
ikttktiktktMktM
iktktiktkiktZXiCiC
XCYCloansCloans εκψψφφ δδββααμ+ΓΘ++Δ++Δ++
+++++Δ++=Δ
−−−−
−−−
1111
111 )*()*(
)*( )*()ln()*()ln(
HARALD HAU, SAM LANGFIELD AND DAVID MARQUES-IBANEZ
Note: The DORQS is examined in panel regressions which allow for bank level random effects and serialAR(1) correlation of the error. Symbols represent: Log assets = natural log of a bank's on balance-sheetassets in USD; Fees share = net fees and commissions divided by total assets. Coefficients for country andtime fixed effects are not reported. The symbols *, **, and *** represent significance levels of 10 per cent,5 per cent, and 1 per cent respectively.
Av. serial correlationCountry fixed effectsTime fixed effectsNo. of observations
Source: Authors' calculations.
Note: Reported are panel regressions which allow for bank specific random effects and serial AR(1)error correlation. Symbols represent: Log assets = natural log of a bank's on balance-sheet assets inUSD; Multiple rating dummy = dummy taking the value 1 if a bank is rated by more than oneagency, 0 otherwise; HH index = Herfindahl Hirschmann index for concentration in the market forbank ratings; RoA = return on average assets; Leverage = assets divided by equity; Loans share =total loans divided by total assets; Trading share = net profits on trading and derivatives divided bytotal assets; Short-term funding share = deposits and short-term funding divided by total assets.Coefficients for country and time fixed effects are not reported. The symbols *, **, and ***represent significance levels of 10 per cent, 5 per cent, and 1 per cent respectively.
No17,226 15,442 17,200 15,417
No No NoYes Yes Yes Yes
TORQS log of ORQS(4)(1) (2) (3)
0.6170.6230.7630.768
HARALD HAU, SAM LANGFIELD AND DAVID MARQUES-IBANEZ
Av. serial correlationFive control Variables of Table 7Country fixed effectsTime fixed effectsNo. of observations
Dependent Variable: DORQS
0.321Yes Yes
Table 10: Public Information Disclosure and Rating Errors
Panel Regression
30th 70th 80th (2) (3) (4) (5)
20th
Note: Pooled sample for quarters 1998q1, 2000q1, 2002q1, 2004q1, 2006q1 and 2008q1. Symbols represent: Logassets = natural log of a bank's on balance-sheet assets in USD; Disclosure = percentage of 40 Bankscope fields whichcontain non-missing observations for each bank in each year. The symbols *, **, and *** represent significance levelsof 10 per cent, 5 per cent, and 1 per cent respectively. Standard errors reported in parentheses are obtained fromstandard bootstrapping. Standard errors reported in curly brackets are robust under autocorrelation. Each method uses1,000 bootstrap replications.Source: Authors' calculations.
Notes: Graph shows the EDFs of the 397 banks in our unbalanced panel. In the boxplot, the median EDF is given by the horizontal line inside the box. The box contains observations on EDFs between the 25th and 75th percentiles. Adjacent values (the ‘whiskers’ of the plot) are the most extreme observations within 1.5 interquartile ranges of the nearest quartile. Outside values are not shown.
02
46
8E
DF
(%)
1990 1995 2000 2005 2010 excludes outside values
BANK CREDIT RATINGS
Figure 2: Distribution of ORQS and its Box-Cox transformation
0.5
11.
52
Perc
ent
0 .2 .4 .6 .8 1ORQS
Frequency distributionNormal approximation
Ordinal Rating Quality Shortfall
0.2
.4.6
.8Pe
rcen
t
-1.5 -1 -.5 0 .5TORQS
Frequency distributionNormal approximation
Box-Cox Transformation of ORQS
BANK CREDIT RATINGS
Figure 3: Rating Quality in Crisis versus Non-crisis times