1 Bank of America 2005 A key part of how we grow at Bank of America is our associates’ commitment to customer satisfaction and sales at our more than 5,800 banking centers nationwide, including the Clark & Madison Banking Center in the heart of Chicago’s financial district, managed by Sandy Pierce and her team. 2005 Summary Annual Report How We Grow
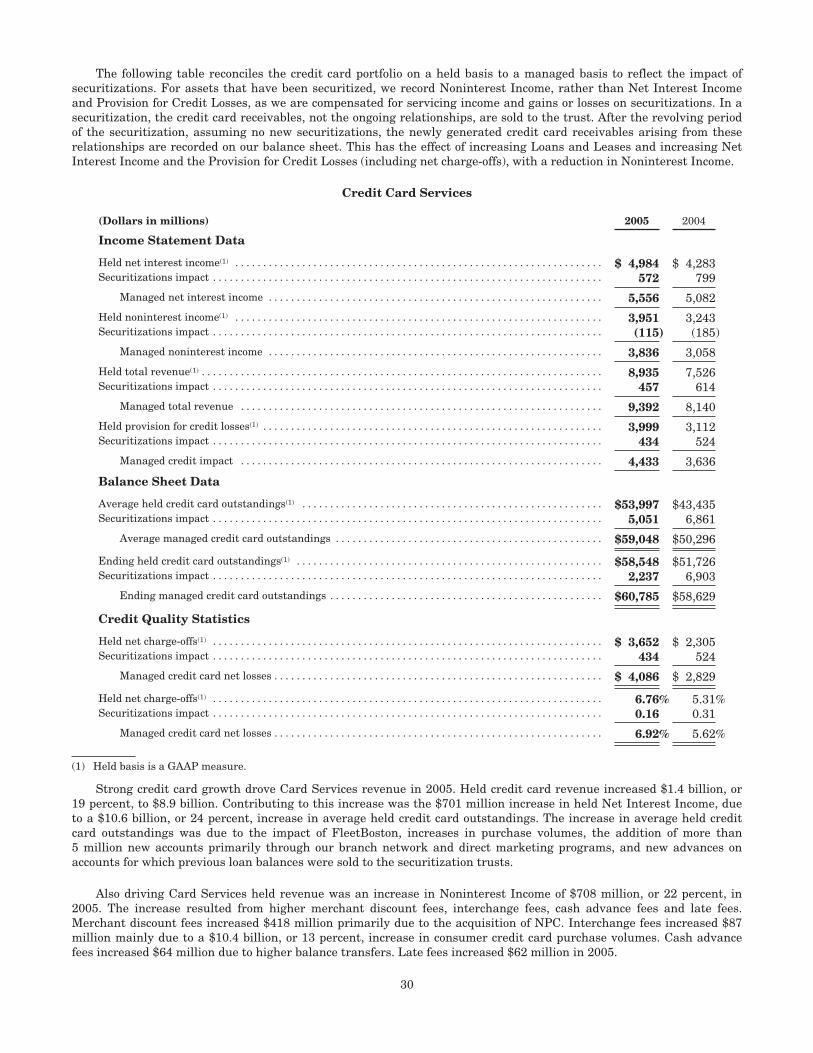
Transcript
1 Bank of America 2005
A key part of how we grow at Bank of America is our associates’ commitment to customersatisfaction and sales at our more than 5,800 banking centersnationwide, including the Clark & Madison Banking Center inthe heart of Chicago’s fi nancialdistrict, managed by Sandy Pierce and her team.
A key part of how we grow at Bank of America is our associates’ commitment to customersatisfaction and sales at our more than 5,800 banking centersnationwide, including the Clark & Madison Banking Center inthe heart of Chicago’s fi nancialdistrict, managed by Sandy Pierce and her team.
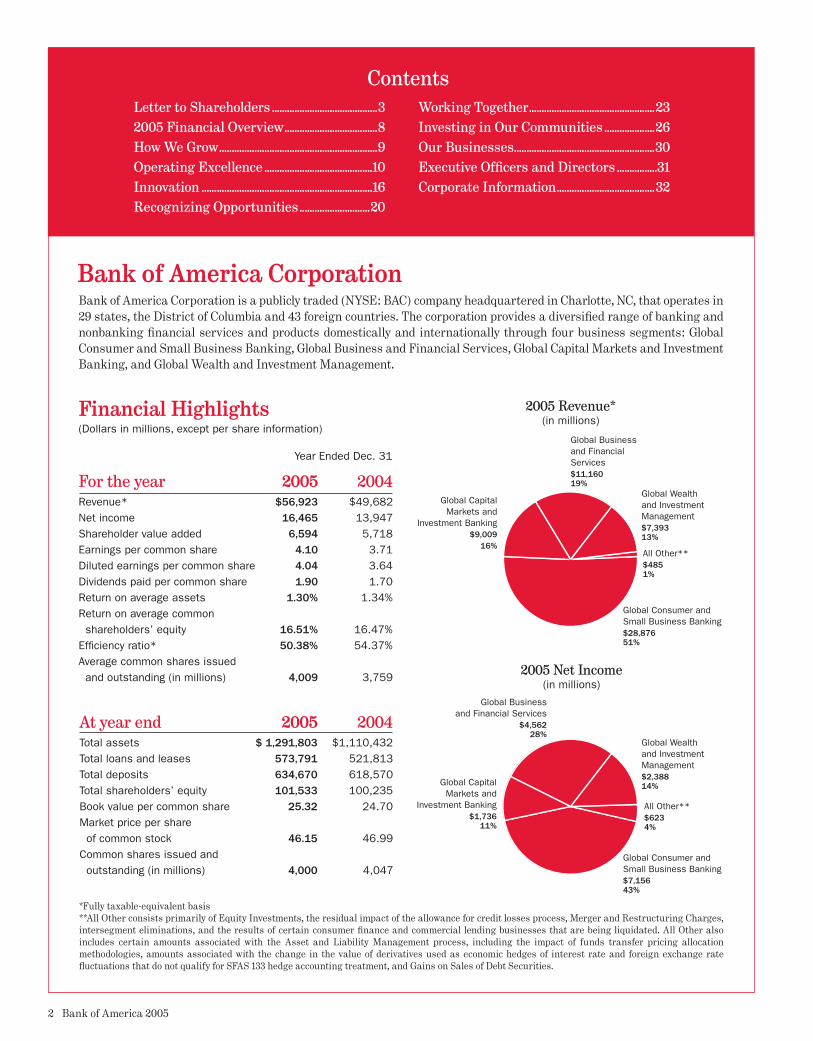
Financial Highlights(Dollars in millions, except per share information)
Year Ended Dec. 31
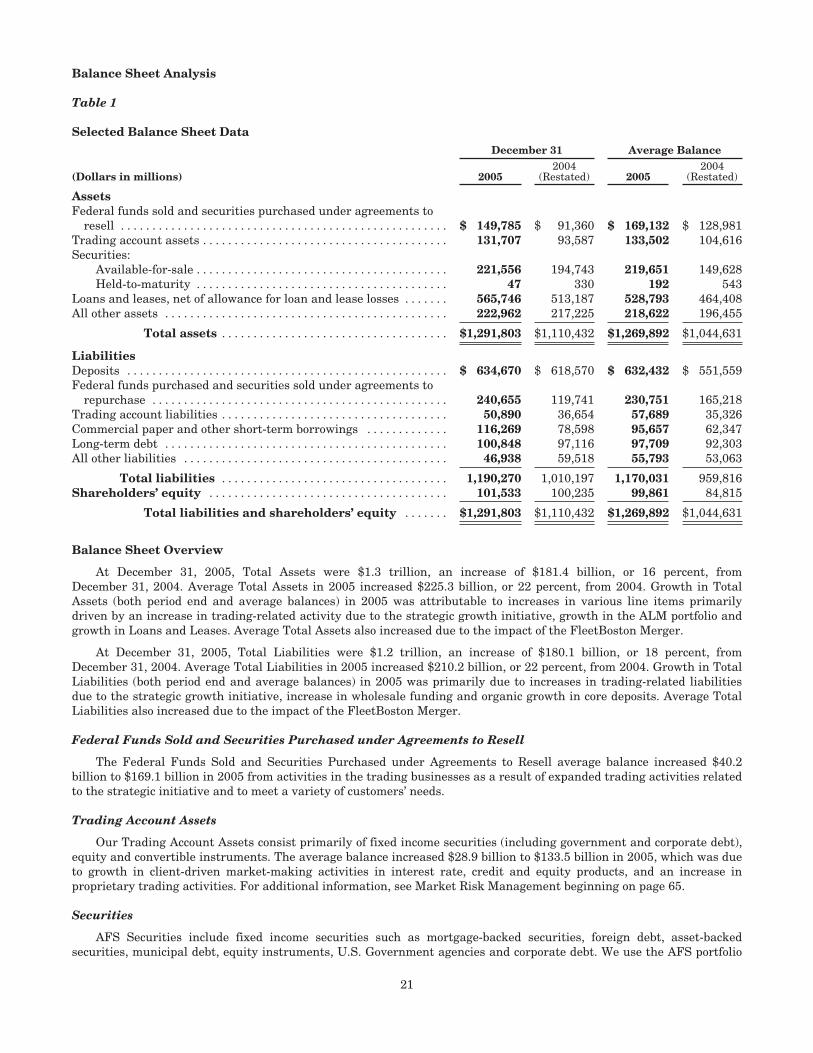
For the year 2005 2004Revenue* $56,923 $49,682Net income 16,465 13,947Shareholder value added 6,594 5,718Earnings per common share 4.10 3.71Diluted earnings per common share 4.04 3.64Dividends paid per common share 1.90 1.70Return on average assets 1.30% 1.34%Return on average common shareholders’ equity 16.51% 16.47%Efficiency ratio* 50.38% 54.37%Average common shares issued and outstanding (in millions) 4,009 3,759
At year end 2005 2004Total assets $ 1,291,803 $1,110,432Total loans and leases 573,791 521,813Total deposits 634,670 618,570Total shareholders’ equity 101,533 100,235Book value per common share 25.32 24.70 Market price per share of common stock 46.15 46.99Common shares issued and outstanding (in millions) 4,000 4,047
ContentsLetter to Shareholders ..........................................3 2005 Financial Overview .....................................8 How We Grow ...............................................................9Operating Excellence ...........................................10Innovation ....................................................................16 Recognizing Opportunities ............................20
Working Together ..................................................23Investing in Our Communities ....................26Our Businesses ........................................................30Executive Officers and Directors ................31 Corporate Information .......................................32
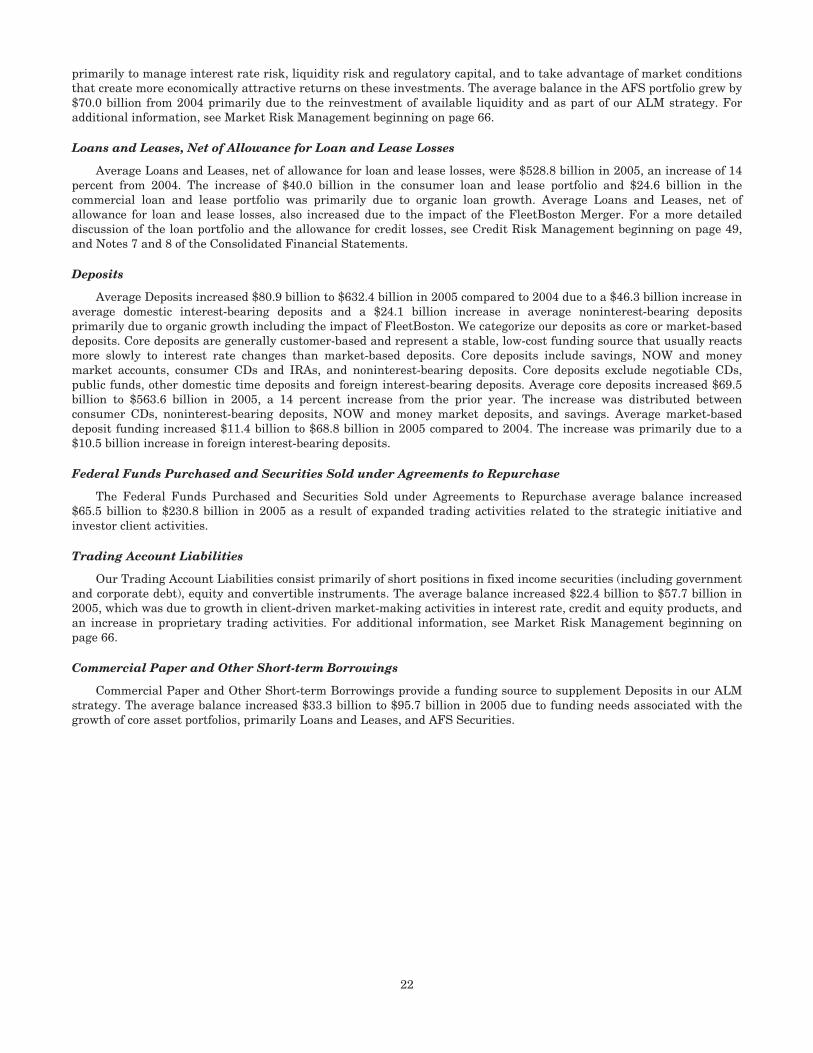
2005 Revenue*(in millions)
Global Consumer and Small Business Banking$28,876 51%
All Other**$485 1%
Global Wealth and Investment Management$7,393 13%
Global Business and Financial Services $11,160 19%
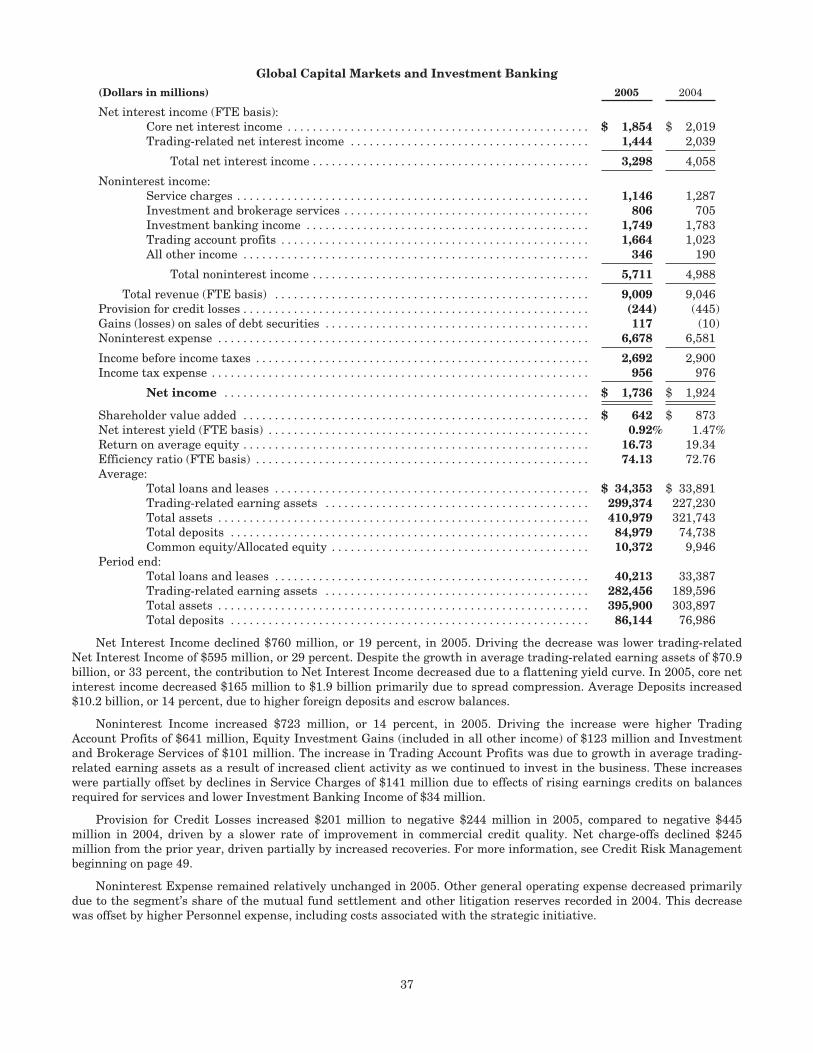
Global Capital Markets and
Investment Banking $9,009
16%
Bank of America Corporation
2 Bank of America 2005
Bank of America Corporation is a publicly traded (NYSE: BAC) company headquartered in Charlotte, NC, that operates in 29 states, the District of Columbia and 43 foreign countries. The corporation provides a diversified range of banking and nonbanking financial services and products domestically and internationally through four business segments: Global Consumer and Small Business Banking, Global Business and Financial Services, Global Capital Markets and Investment Banking, and Global Wealth and Investment Management.
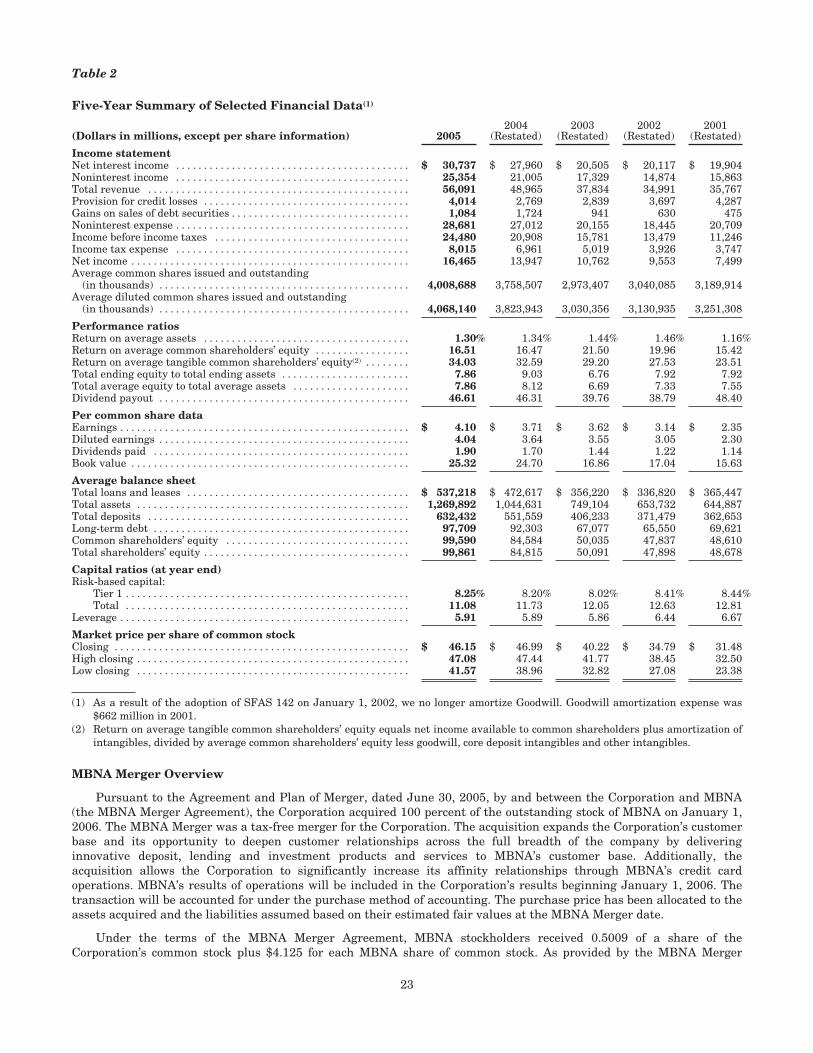
2005 Net Income(in millions)
Global Consumer and Small Business Banking$7,156 43%
All Other**$6234%
Global Wealth and Investment Management$2,38814%
Global Business and Financial Services
$4,56228%
Global Capital Markets and
Investment Banking $1,736
11%
*Fully taxable-equivalent basis**All Other consists primarily of Equity Investments, the residual impact of the allowance for credit losses process, Merger and Restructuring Charges, intersegment eliminations, and the results of certain consumer finance and commercial lending businesses that are being liquidated. All Other also includes certain amounts associated with the Asset and Liability Management process, including the impact of funds transfer pricing allocation methodologies, amounts associated with the change in the value of derivatives used as economic hedges of interest rate and foreign exchange rate fluctuations that do not qualify for SFAS 133 hedge accounting treatment, and Gains on Sales of Debt Securities.
To our shareholders:
n 2005, your company demonstrated its ability to grow in a number of ways.
We accelerated growth by attracting, retaining and deepening more customer
relationships in the markets we serve. We launched a number of initiatives that will
create value by integrating our capabilities across the company. We completed our
FleetBoston Financial merger transition in the Northeast, exceeding what we promised in
almost every category. We became the fi rst U.S. bank to invest directly in a major Chinese bank.
And, our acquisition of MBNA Corp. closed on Jan. 1, 2006, making Bank of America the top
provider of debit and credit cards in the United States.
Our view is that there are many paths to growth, and the best companies pursue
multiple strategies as market conditions change and opportunities arise. I will discuss our most
important paths to growth in this letter. I invite you to read more about the work we’re doing
KENNETH D. LEWISCHAIRMAN, CHIEF EXECUTIVE OFFICER AND PRESIDENT
for customers and shareholders in the articles that follow.
First, a review of our key 2005 fi nancial accomplishments.
Strong fi nancial performance. In 2005, we again set
new records for revenue on a fully taxable-equivalent basis,
$56.9 billion, and net income, $16.5 billion, representing
growth of 15 percent and 18 percent, respectively, over last
year. Diluted earnings per share increased to $4.04, an
11 percent rise over 2004. Return on average common share-
holders’ equity rose to 16.51 percent from 16.47 percent.
Our greatest fi nancial challenge in 2005 was the con-
tinuing fl attening of the yield curve, which is the difference
between long- and short-term interest rates. As that differ-
ence shrank, banks, which tend to price deposits based on
short-term rates, were adversely affected. In essence, profi t
margins were compressed. We expect the yield curve to
remain relatively fl at in 2006, providing an opportunity for
well-managed banks to differentiate themselves.
Our strong performance has enabled us to continue our
record of returning capital to shareholders. 2005 was our 28th
consecutive year of raising our quarterly dividend, which in-
creased by 11 percent to $0.50. Over that time, our dividend has
increased at a compound annual growth rate of 13 percent.
As I have always said, the bottom line on our performance
is our stock price. While our total shareholder returns,
which include our dividend, were in line with our peers,
our stock price fell slightly this year as other stocks in our
industry remained fl at. I believe the two factors that weighed
most heavily on our stock were the impact of the yield curve,
which affects all banks, and our acquisition strategy, which
has created uncertainty for some investors.
On the fi rst point, the yield curve is cyclical. It will steepen
again, and net interest yields will rise accordingly. In the
meantime, we have one of the best teams in the business at
managing interest rate risk, and I believe we will continue
to perform well relative to our peers regardless of the interest
rate environment.
The second point raises questions about acquisition
selection, price and risk. We look at companies that can
strengthen our position in a given market, which can be
defi ned by customers, geography or product. We look to
acquire products, technologies, skills or capabilities that
will enhance our value proposition with both customers and
shareholders. Of the many opportunities we have evaluated
over the past several years, we believe that both Fleet and
MBNA met our standards.
Regarding price, we start with a sound financial
analysis, requiring that identifi able cost savings and
projected revenue gains will offset the proposed premium.
From left, Brian T. Moynihan, president, Global Wealth and Investment Management; Liam E. McGee, president, Global Consumer and Small Business Banking; and R. Eugene Taylor, president, Global Corporate and Investment Banking, at the Bank of America Corporate Center in Charlotte.
ate-income neighbor hoods across the country spur economic
development and refl ect our commitment to neighborhood
excellence. This initiative took on new meaning in the wake
of Hurricanes Katrina and Rita, when we committed up to
$100 million to rebuild neighborhoods along the Gulf Coast.
Philanthropic investment comes in two forms: money
and time. Our charitable donations in 2005 exceeded
$130 million, making us one of the most generous corpo-
rations in America. And our associates, all of whom are
encouraged to volunteer up to two hours a week in their
communities on company time, spent hundreds of thou-
sands of hours strengthening the communities in which
they live. Most important, we are deploying these resources
in conjunction with our foundation’s Neighborhood Excellence
Initiative, which relies on the knowledge of local leaders to
direct volunteer time and money to the organizations most
critical to the success of individual communities.
It is through the leadership of our associates that we
are able to achieve higher standards of performance for our
customers, shareholders and communities. One of our key
leaders retired from the company in 2005—Marc Oken, who
served as our chief fi nancial offi cer. Marc’s contributions
to our company’s success over the past 17 years have been
great. I personally appreciate his commitment and leader-
ship and wish him all the best.
Stepping into the role of CFO is Alvaro de Molina, a
17-year executive who most
recently led our corporate
and investment banking
team in 2004–2005. Al’s
sharp fi nancial mind,
communication skills and
leadership ability will
serve us well as he takes
on his new role.
We also welcome two
new directors to our
company. Joining us is
Frank Bramble, former
executive offi cer, MBNA,
and the former chairman
and CEO of Maryland
National Corp. And, re-
cently retired from the
United States Army,
General Tommy Franks joined our board in January. Frank
and Tommy bring rich and diverse leadership experience to
our team, and I look forward to their contributions.
Retiring from our board are Charles Coker, former
chairman and CEO of Sonoco Products of Hartsville, SC,
and Edward Romero, former ambassador to Spain. Charlie
joined the board in 1969, the same year I joined the company.
His leadership, guidance and service have been a great
benefi t to the company for 37 years, and to me personally
during my time as chairman. Ed also has made important
contributions to our board in his two years of service.
I appreciate all that Charlie and Ed have done for us, and I
wish them the best in their future endeavors.
In a year marked by challenge, opportunity and growth,
I would like to thank our customers for their business, our
investors for their trust and all our associates and direc-
tors for the work they do for our company. I look forward to
even greater achievements in the year ahead and, as always,
I welcome your thoughts and suggestions.
Barbara J. Desoer, Global Technology, Service and Fulfi llment executive, and Milton H. Jones, Jr., Global Quality and Productivity executive, at the Bank of America Command Center.
Earning a record $16.5 billionDouble-digit year-over-year growth in net income, earnings per share and revenue
In 2005 Bank of America earned a record $16.5 billion, as revenue growth accompanied by strong operating
leverage drove an 1� percent increase in profit over 2004. Diluted earnings per share rose 11 percent to $4.04. Return on average common equity for the year was 17 percent.
Revenue: Fully taxable-equivalent revenue grew 15 percent to $56.9 billion from $49.7 billion in 2004. Revenue growth was driven by a 21 percent increase in noninterest income to $25.4 billion, including higher equity investment gains, card income and trading account profits and the addition of Fleet, which was acquired on April 1, 2004.
Net interest income on a fully taxable-equivalent basis increased 10 percent to $31.6 billion from $2�.7 billion in 2004. The increase was driven by the addition of Fleet, consumer and middle market business loan growth, higher domestic deposit levels and a larger securities portfolio partially offset by the effects of a flattening yield curve and a lower trading-related contribution.
Gains on sales of debt securities were $1.1 billion in 2005, compared to $1.7 billion in 2004.
Efficiency: Noninterest expense increased 6 percent to $2�.7 billion from $27.0 billion a year ago, primarily due to the addition of Fleet and an investment in the capital markets business. Included in 2005 expenses were $412 million in pre-tax merger and restructuring charges related to the Fleet merger. Full-year 2005 cost savings from the merger with Fleet were $1.�5 billion. The efficiency ratio for 2005 was 50.4 per-cent, reaching the company’s long-term target of 50 percent.
Credit Quality: Credit costs increased. Provision expense was $4.0 billion in 2005, a 45 percent increase from 2004. Net charge-offs totaled $4.6 billion, or 0.�5 percent of loans and leases, compared to $3.1 billion, or 0.66 percent of loans and leases in 2004. The increase in credit costs was primar-ily driven by the credit card portfolio, including increased bankruptcy filings, and a lower provision benefit from the commercial portfolio as the rate of improvement in credit quality slowed.
Capital Management: For 2005, Bank of America paid $7.7 billion in cash dividends to common shareholders. The company also issued 79.6 million common shares, primarily
related to associate stock options and ownership plans, and repurchased 126.4 million common shares for $5.� billion, re-sulting in a net decrease of 46.9 million common shares.
Business Segment Results: Global Consumer and Small Business Banking earned $7.2 billion in 2005, a 20 percent increase from 2004. Revenue grew 15 percent to $2�.9 billion, primarily due to continued strong growth in the card busi-ness, ongoing deposit account growth, balance growth and increased activity, which generated increased service charge income. Also contributing were significantly higher corporate mortgage banking income, primarily due to a writedown of mortgage servicing rights in 2004, and the addition of Fleet.
Global Business and Financial Services earned $4.6 bil-lion, a 19 percent increase from 2004. Results were driven by strong loan growth across all business lines, which included the purchase of loans from General Motors Acceptance Corp. as well as the addition of Fleet. Loan growth was especially robust in the Northeast. Revenue grew 21 percent to $11.2 billion.
Average loans and leases grew by $2�.� billion, countering the effects of continued spread compression. Strong deposit growth was fueled by increases in Commercial Real Estate and Business Banking.
Global Capital Markets and Investment Banking net income declined 10 percent to $1.7 billion in 2005, primarily due to a decline in the provision benefit as a result of slowing improvement in credit quality. Revenue was essentially unchanged at $9.0 billion in 2005 and 2004. Noninterest income increased 14 percent, led by trading profits and equity commissions that more than offset the decline in trading- related net interest income. Investment banking revenue was down slightly, as were service charges.
Global Wealth and Investment Management increased its net income by 49 percent, driven by the addition of Fleet, higher asset management fees, higher loan volume and higher deposit-related revenue due in part to the migration of Premier Banking relationships from Global Consumer and Small Business Banking. Asset management fees increased 21 percent from 2004 due to the addition of Fleet and the growth of $30.9 billion, or 7 percent, in assets under manage-ment from Dec. 31, 2004. Revenue increased 25 percent to $7.4 billion due in part to the migration of relationships from Global Consumer and Small Business Banking.
Bank of America 2005 9
How we grows we build on our long history of growth, Bank of America is
positioned to continue growing. Growing through operating
excellence—the relentless pursuit of flawless execution to serve
our customers better. Growing through innovation—with new
products and technology. Growing through recognizing opportunities—in new
markets and deeper customer relationships. Growing by working together to
create value across divisions and businesses. Growing through serving our
communities—investing and giving to build stronger neighborhoods.
This annual report contains stories of how we grow. And of how we plan
to keep growing.
A
t Bank of America, developing current leaders and planning for future talent
needs are essential components of how we grow. Strengthening our emerging
talent with solid leadership and management skills is critical to the execution of
our profitable growth strategies in the rapidly evolving global economy.
Talent planning drives executive development at Bank of America, and that focus keeps a
steady influx of exceptional candidates flowing to our leadership team. On a daily basis, senior
A
How We Grow: Operating Excellence
Developing world-class leadersRecruiting and training best-in-class talent keeps our competitive advantage strong
executives manage assignments, deliver candid feedback and coaching, and arrange opportunities such as member-ship on cross-organizational teams focused on critical business issues. Five principles guide our talent planning and leadership development:
• Attract, develop, retain and reward the best talent • Regularly recruit top talent from all industries• Ensure that leaders give all associates candid
feedback• Monitor leadership performance to ensure that
top performers are in business-critical roles • Execute processes and programs that encourage
diversity in leadershipMore than 1,000 of our top performers annually partici-
pate in Leadership Forums designed to address some of our most critical business issues. Bank of America chairman, CEO and president Ken Lewis and his senior management team lead these important development opportunities and use them to identify and assess emerging talent.
What does it take to be a leader at Bank of America? We look for and develop leaders who have the ability to be cata-lysts of change. We expect all leaders to grow our businesses, lead our associates to perform, drive consistent execution and sustain intensity and optimism. When top performers possess these core skills, it creates an essential consistency among our leadership team while also providing the flexibility in leadership styles that is required for different businesses.
We also respect and value diversity not only in race, gen-der, ethnicity, age, disability and sexual orientation, but also in viewpoints, experiences, talents and ideas. We strive to empower all associates to excel on the job and reach their full potential. We reward and recognize associates based on performance and the results they achieve for customers, shareholders and the communities where we do business.
Strategy alone doesn’t win in the marketplace. Top leaders executing sound strategy with outstanding man-agement skills do. It’s a competitive advantage we have—and intend to keep.
10 Bank of America 2005
How we grow through operating excellenceOperating excellence is at the core of our
strengths and is a key part of our growth.
At Bank of America, operating excellence
means continuously striving to flawlessly
and efficiently execute our business plans
in order to create shareholder value.
Setting and reaching new standards
for excellence helps us deliver consistent,
stable and profitable long-term growth in
an increasingly competitive global market-
place. This is key to our ability to rapidly
develop and market new products to meet
our customers’ changing needs and mea-
sure their satisfaction with our offerings—
like the online collections Web site and the
Keep the Change™ program we developed
in response to customer feedback, both of
which have proven to be clear successes.
Our operating excellence also allows
full, efficient use of our unique national
footprint and gives us the ability to
integrate new enterprises seamlessly, as
evidenced by our near flawless execution
of the Fleet merger.
J. Steele Alphin, Global Human Resources executive (second from left), discusses leadership at the company’s Knowledge Channel broadcast facilities. Joining him are, from left, Fung Der, chair of the bank’s Asian American Leadership Network for Southern California; Freda C. Brazle, co-chair, the bank’s Black Professionals Group; and Jose L. Garcia, national committee member of the bank’s Hispanic/Latino Organization for Leadership and Advancement. Bank of America values a diversity of ideas and talent as part of its training and leadership development processes.
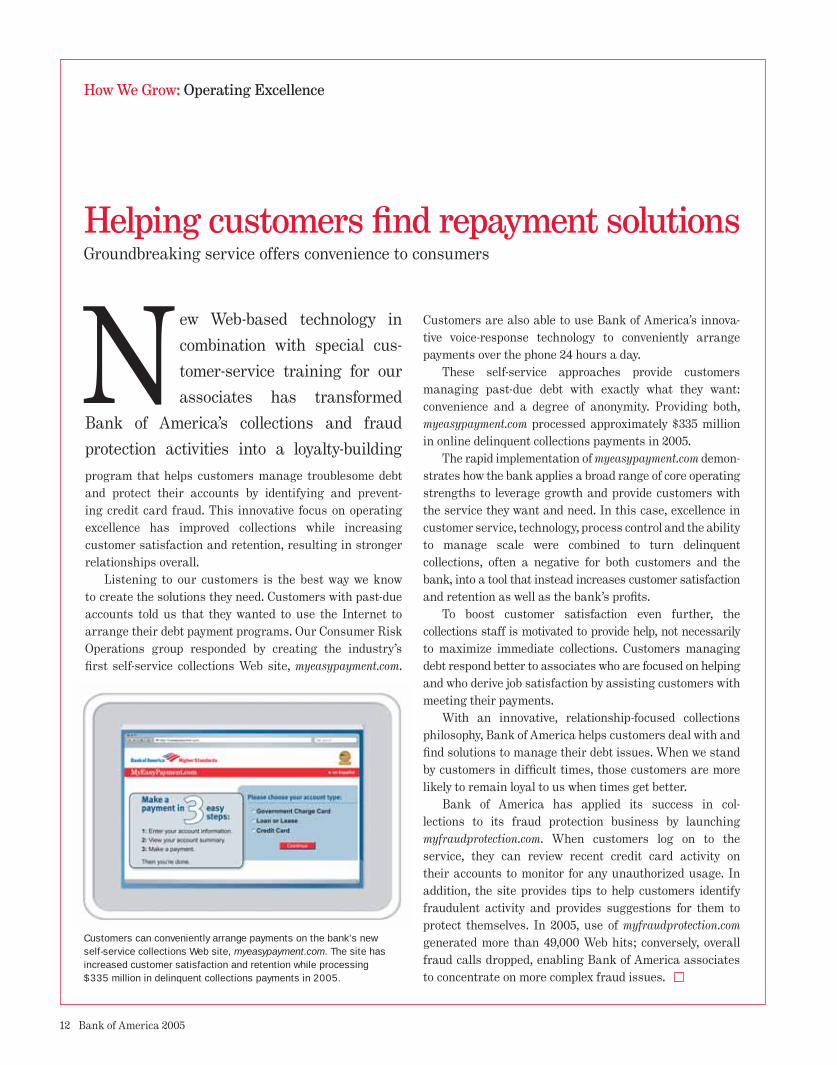
NHelping customers fi nd repayment solutionsGroundbreaking service offers convenience to consumers
ew Web-based technology in
combination with special cus-
tomer-service training for our
associates has transformed
Bank of America’s collections and fraud
protection activities into a loyalty-building
Customers are also able to use Bank of America’s innova-tive voice-response technology to conveniently arrange payments over the phone 24 hours a day.
These self-service approaches provide customers managing past-due debt with exactly what they want: convenience and a degree of anonymity. Providing both, myeasypayment.com processed approximately $335 million in online delinquent collections payments in 2005.
The rapid implementation of myeasypayment.com demon-strates how the bank applies a broad range of core operating strengths to leverage growth and provide customers with the service they want and need. In this case, excellence in customer service, technology, process control and the ability to manage scale were combined to turn delinquent collections, often a negative for both customers and the bank, into a tool that instead increases customer satisfaction and retention as well as the bank’s profi ts.
To boost customer satisfaction even further, the collections staff is motivated to provide help, not necessarily to maximize immediate collections. Customers managing debt respond better to associates who are focused on helping and who derive job satisfaction by assisting customers with meeting their payments.
With an innovative, relationship-focused collections philosophy, Bank of America helps customers deal with and fi nd solutions to manage their debt issues. When we stand by customers in diffi cult times, those customers are more likely to remain loyal to us when times get better.
Bank of America has applied its success in col-lections to its fraud protection business by launching myfraudprotection.com. When customers log on to the service, they can review recent credit card activity on their accounts to monitor for any unauthorized usage. In addition, the site provides tips to help customers identify fraudulent activity and provides suggestions for them to protect themselves. In 2005, use of myfraudprotection.com generated more than 49,000 Web hits; conversely, overall fraud calls dropped, enabling Bank of America associates to concentrate on more complex fraud issues.
Customers can conveniently arrange payments on the bank’s new self-service collections Web site, myeasypayment.com. The site has increased customer satisfaction and retention while processing $335 million in delinquent collections payments in 2005.
program that helps customers manage troublesome debt and protect their accounts by identifying and prevent-ing credit card fraud. This innovative focus on operating excellence has improved collections while increasing customer satisfaction and retention, resulting in stronger relationships overall.
Listening to our customers is the best way we know to create the solutions they need. Customers with past-due accounts told us that they wanted to use the Internet to arrange their debt payment programs. Our Consumer Risk Operations group responded by creating the industry’s fi rst self-service collections Web site, myeasypayment.com.
Cin the world—nearly 15 million customers—the bank has more than 34 percent of all online banking customers in the country. Our 7.3 million online bill payers represent more than 58 percent of all U.S. online banking bill payers.
Associates from marketing, technology, product groups, sales and e-commerce worked together to generate a 161 percent increase in online sales over 2004. Successes included checking, savings and debit cards from the Keep the Change™ program (see “Helping People Grow Their Savings” on page 18).
Bank of America has a history of online innovation, having pioneered free bill pay in 2002. Online customers have higher balances, higher retention rates and a lower cost to serve. Today, we’ve created more advances like text chat so customers can learn about buying products during real-time, online discussions with our associates. Ultimately, we want customers to be just as comfortable purchasing online as they are in a banking center.
One example of the bank’s success in expanding products and services to online customers is the experience of Dr. Andrew Bertagnolli, a psychologist for a health-care provider in Northern California. Soon after signing up to pay bills online in 2005 to save time, Bertagnolli joined the Keep the Change program and also opened a savings account online.
Each online customer is a candidate for buying a new product. With 1.6 billion site visits annually and a ranking among the top 50 U.S.-based sites for unique visitors—more than Dell, Capital One or Citigroup—bankofamerica.com is a prime source for sales leads.
From left, Sanjay Gupta, e-Commerce and ATM executive; Diane E. Morais, Deposits and Debit Products executive; and James C. Jackson, East Division executive, Global Consumer and Small Business Banking, work closely to constantly improve customers’ online experience and increase sales.
Doing business around the clockCustomer-focused enhancements drive growth for bankofamerica.com
Buying products online is faster and easier for customers because of the bank’s innovative solutions:
• Streamlined applications and faster processing for personal and small business accounts, reducing deposit account decisions from two days or more to less than a minute
• New page designs with a retail approach and testimonial-style layouts to direct customers to the fi nancial solutions they’re looking for
• Guided selling to offer customers the products and services that are the best fi t
• Preapproved products for online banking customers
With all these efforts—developing, diversifying and offering more products; cross-selling; and Internet adver-tising, along with quick and easy-to-use applications and fast fulfi llment—bankofamerica.com is adding shareholder value with every transaction. The result is higher sales through a convenient, cost-effi cient channel.
ank of America in 2005 effi ciently executed the integration of Fleet, exceeding
the goals set when the merger was announced in 2003. We delivered on the
pre-merger promise to expand into desirable Northeast markets and improve
customer satisfaction and sales in the new markets, all while capturing greater
cost savings than were projected at the merger’s outset.
Bank of America associates smoothly converted the accounts of approximately 5 million Fleet
customers to its retail platform in 2005. During the fi rst seven months of the year, as business
BEffectively integrating FleetMerger creates new opportunities, boosts customer satisfaction and improves sales
How We Grow: Operating Excellence
From left, in Boston, Anne M. Finucane, president, Northeast; Mark J. Hogan, Northeast Consumer Division executive; and William R. Lorenz, Middle Market Banking executive, Northeast Commercial Banking, are part of the Bank of America team that is growing sales and customer satisfaction in the Northeast.
systems at former Fleet op-erations were being converted to Bank of America systems, the bank added 181,000 net new checking accounts in the new markets, increased middle market loans by 8 percent and deposits by 5 percent, and tallied more than 2.5 million product sales in banking centers.
In addition, our customer delight scores in the former Fleet markets had risen approximately 13 percent as of December 2005 from the baseline established at the out-set of the merger. “Delighted customers” are those who rank us at 9 or 10 on a 10-point scale when asked, “Overall, how satisfied are you with Bank of America?”
Bank of America boosted customer satisfaction and sales while reducing annual costs by $1.85 billion pre-tax. This significantly surpassed the estimated annual cost savings of $1.6 billion pre-tax that we projected when the Fleet merger was announced in October 2003. The success of the Fleet merger was due to many factors, including thorough market research that identified customer expecta-tions, constant monitoring of customer delight, a judicious systems-conversion strategy that minimized impacts to our customers and our Six Sigma discipline focused on product and service excellence and the elimination of errors.
As part of our commitment to the Northeast, we located the headquarters of our Global Wealth and Investment Management division in Boston, MA, and opened a new, state-of-the-art customer contact center in
East Providence, RI.When we announced this
merger in 2003, we said our combined company would deliver more financial ser-vice capabilities to more Americans than any bank in our nation’s history. Making good on that promise ranks as one of our company’s great accomplishments. Our cus-tomers in the Northeast have access to the broadest bank-ing franchise in the nation with a wide range of prod-ucts and services under the same roof. Our coast-to-coast presence provides them with access to more than 5,800 retail banking offices, more than 16,700 ATMs and award-
winning online banking with nearly 15 million active users. In all, our associates accomplished one of the largest
business integrations and systems conversions in his-tory. The bank’s operational excellence—the ability to execute operations flawlessly—made this dramatic growth possible.
We are proud that every associate contributed to this success—whether it was by working on one of the many merger teams or in other areas of the company, continu-ing their focus on serving and delighting our customers and clients. From the announcement of the merger, to our exciting brand introduction in new Northeast markets, to our unprecedented product and systems conversions in 2004 and 2005, Bank of America associates throughout the company worked together to build a shared future as the world’s premier financial services company.
• Converted 21 million retail customer records• Reissued 11.2 million credit cards and
2.4 million debit cards• Consolidated 455 deposit products into
a simpler offering of 55 products• Converted more than 800,000 small
business accounts• Installed 20,866 signs in nearly 2,200
locations and recycled 140 tons of removed sign material
• Logged more than 750,000 associate training hours
• Devoted more than 5,600 associates to its systems-conversion efforts, which included 5 million programming hours
• Completed one of the largest personal trust conversions in U.S. banking history
• Converted more than 900,000 brokerage accounts
For the Bank of America–Fleet merger, the company:
How We Grow: Innovation
very year, Hispanic residents in the United States transmit billions of dollars to
family and loved ones in their native countries—an estimated $20 billion to
Mexico alone. According to the Pew Hispanic Center, in 2005 nearly half of all
adult Mexican immigrants living in the United States sent money to relatives in
Mexico, often paying fees of up to 10 percent.
In September 2005, Bank of America changed the game completely by offering a free, secure
Building relationships with SafeSend®
Service helps Mexican-American customers assist family and loved ones
Eand easy alternative. Because we simplified and relaunched the SafeSend® service, any Bank of America customer with a checking account can send cash to anyone in Mexico— immediately and free of charge.
The SafeSend service provides cash in Mexican pesos, at competitive exchange rates, to recipients in Mexico through more than 3,600 locations. In 2006, the bank will add 900 more locations. No fees, cards or unfamiliar procedures are required, only proper identification. A patent is pending on this new remittance process.
This innovation allows Bank of America to attract many new customers who have never dealt with a bank. An estimated 50 percent of Hispanics have no banking experience or relationship with a financial institution. The SafeSend service provides these customers with a compelling
reason to do business with Bank of America. With more than 40 million Hispanics in the United States,
the SafeSend service plays an important part in growing our business in a segment that will account for 60 percent of the population growth in the bank’s markets over the next decade. Hispanic purchasing power alone would rank among the top 10 economies of the world and is growing faster than that of the population as a whole, according to research cited by the Hispanic Association on Corporate Responsibility.
The SafeSend service is a strategic investment that attracts and grows customer relationships, and therefore it is not a stand-alone product but rather a feature of the bank’s basic checking accounts. Checking accounts with these added features are free with direct deposit, and they are proven relationship starters.
16 Bank of America 2005
How we grow through innovationAn essential part of Bank of America’s
long-term growth strategy is the spirit
of innovation in everything we do. At the
heart of our inventiveness are two criti-
cal strands that are consistently woven
together: listening carefully to customers’
needs and desires and building on our
core strengths, such as product diversity,
risk management and technology.
In this section are examples of how
Bank of America is using innovation
to build value for the bank and our
customers. Whether the bank is
leading the way in making online
banking more secure and worry-free
or creating programs to attract and
retain diverse customers, innovation
is key to our efforts.
Business owners Juan and Maria Cuarenta, pictured here with some of their children and grandchildren, use SafeSend regularly to transfer funds to relatives in Mexico.
arly in 2005, Bank of America researchers went into the fi eld looking for a fresh
idea, something with a “you’ve got to be kidding” quality that would inspire
consumers to put a little money into savings on a regular basis.
The result was the Keep the Change™ program, an innovative save-while-you-spend
program that was chronicled nationally both on television and in many publications in the fourth
quarter of 2005. And within three months of its October 2005 media launch, the program
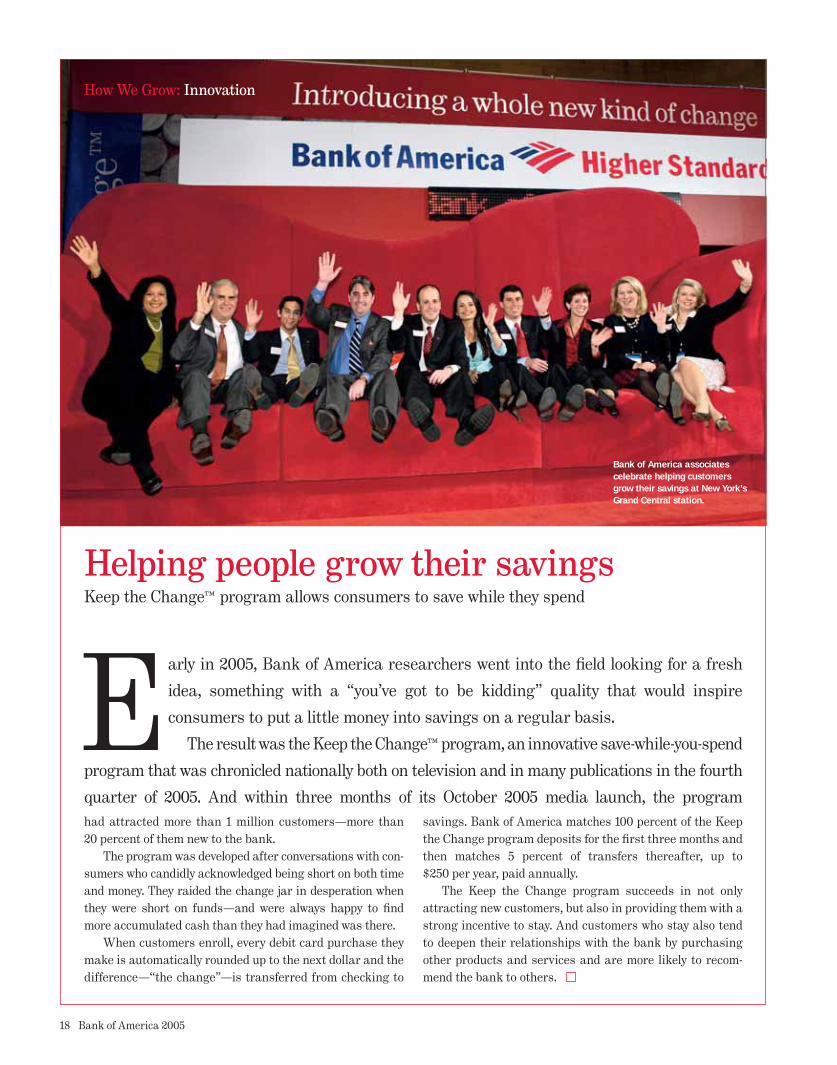
Helping people grow their savingsKeep the Change™ program allows consumers to save while they spend
Ehad attracted more than 1 million customers—more than 20 percent of them new to the bank.
The program was developed after conversations with con-sumers who candidly acknowledged being short on both time and money. They raided the change jar in desperation when they were short on funds—and were always happy to fi nd more accumulated cash than they had imagined was there.
When customers enroll, every debit card purchase they make is automatically rounded up to the next dollar and the difference—“the change”—is transferred from checking to
savings. Bank of America matches 100 percent of the Keep the Change program deposits for the fi rst three months and then matches 5 percent of transfers thereafter, up to $250 per year, paid annually.
The Keep the Change program succeeds in not only attracting new customers, but also in providing them with a strong incentive to stay. And customers who stay also tend to deepen their relationships with the bank by purchasing other products and services and are more likely to recom-mend the bank to others.
Bank of America associates celebrate helping customers grow their savings at New York’s Grand Central station.
Bon SiteKey as a leading solution in the fi ght against online fraud, with BusinessWeek naming it one of the best products of 2005—a year in which phishing, pharming and other forms of online fi nancial fraud hit record numbers. Javelin Strategy and Research ranked Bank of America best overall in its Online Banking Safety Scorecard as well as No. 1 for prevention and resolution of identity theft.
The SiteKey security feature is the latest benefi t of what has been widely recognized as the top online banking service. It is just one example of our discipline and effective-ness in managing risk for customers and shareholders.
Maintaining customer confi dence in e-commerce is a top priority. Online customers generally keep higher balances and are more likely to stay with Bank of America. In 2005, the number of online banking subscribers grew from 12.4 million to 14.7 million, making it one of our fastest-growing sales and service channels and a critical element of our broader growth strategy.
We pulled together a cross-functional team of our best minds to combat online fi nancial fraud. The team fi rst focused on phishing, in which consumers are duped into revealing personal fi nancial information through spam e-mail that directs them to fake Web sites. The second area of focus was pharming, in which consumers’ attempts to reach legitimate Web sites are redirected without their knowledge to look-alike sites, where they may unwittingly provide fraudsters with personal information.
The free SiteKey feature defeats these types of fraud by providing an additional layer of authentication that is personal and convenient. At most Web sites, customers prove their identity only by providing a username and password and often can’t confi rm that the site is legitimate.
The SiteKey security feature, however, provides two-way
Named one of the best products in 2005 by BusinessWeek, SiteKey provides customers with peace of mind when banking online.
confi rmation. Customers sign up by picking an image, writing a unique phrase and answering three chal-lenge questions. From then on, signing in takes only a few easy steps: the customer types the username, Bank of America shows the customer’s specifi ed image and phrase to confi rm the customer reached bankofamerica.com,and then the customer knows it’s safe to enter his or her secret code. If our system identifi es something unusual, for example that the customer is using a different computer, we ask a challenge question for further confi rmation.
After the SiteKey feature debuted in 2005, ahead of the Federal Financial Institutions Examination Council’s announcement of recommendations for online authentica-tion, industry watchers such as the Tower Group praised us for our proactive steps in enhancing security, calling the advancement a “watershed” and “unique.”
In addition to SiteKey confi rmation, we’ve launched an online toolbar with EarthLink Inc. that alerts consumers to potentially dangerous Web sites, including those used by phishers. We’ve also enhanced our privacy and security Web site to inform customers about our initiatives to protect them and let them know what they can do to protect themselves.
Our online fraud detection and resolution teams avoided millions of dollars in losses during the year, and we continue to look for ways to enhance security and share proven solutions across our businesses.
s part of a long-term strategic investment in one of the world’s fastest-growing
economies, Bank of America finalized an innovative partnership with China
Construction Bank in 2005. Under the agreement, Bank of America became a
significant shareholder in, and long-term strategic partner of, China Construction
Bank. Bank of America associates will work with China Construction Bank to provide advice
and assistance to the Beijing-based bank.
Investing in China’s growthChina Construction Bank investment opens doors in one of the world’s fastest-growing economies
A
How We Grow: Recognizing Opportunities
China Construction Bank has built a leading fran-chise in China, the world’s fourth-largest economy. Both partners see significant added value in combining China Construction Bank’s local knowledge and distribution with Bank of America’s product expertise, technology and experi-ence in managing growth and scale.
The partnership with China Construction Bank will enable Bank of America to better serve our multinational clients who do business in China. We also expect to find opportunities in China’s consumer market, which currently includes a growing population of more than 1.3 billion people. In 2006, we hope to establish a joint venture between China Construction Bank and Bank of America to provide credit cards in China.
China Construction Bank is the third-largest com-mercial bank in China, with $522 billion in assets and $467 billion in deposits. It has 146 million active retail deposit account relationships, a national network of 14,250 branches concentrated in the more economically developed areas of the country, and relationships with 97 of the top 100 enter-prises in China. It is China’s largest mortgage lender and has leading positions in credit cards and infrastructure loans.
Bank of America bought approximately 9 percent of China Construction Bank stock for $3 billion. Under the terms of the seven-year agreement, it has the option of increasing that stake to 19.9 percent in the future.
This is just one example of how we are recognizing opportunities to expand our business.
20 Bank of America 2005
How we grow by recognizing opportunitiesOne part of Bank of America’s growth
strategy is to identify, invest in and
acquire businesses that combine with
the bank’s core strengths to create
greater organic growth opportunities.
With credit cards becoming increas-
ingly important, partly due to online
purchasing, Bank of America’s MBNA
acquisition positions us as a dominant
player in payments. The value of such
positioning becomes even clearer as we
help our new partner, China Construc-
tion Bank, leverage its strong market
position to become a leader in credit
cards and other diverse consumer
products in one of the world’s fastest-
growing economies.
These investments demonstrate
the power of growing by recognizing
important strategic opportunities.
21 Bank of America 2005
Bank of America Global Corporate Planning and Strategy executive Gregory L. Curl, left, with China Construction Bank chairman Guo Shuqing in Hangzhou, China. The two leaders are exploring new joint venture opportunities that support the companies’ mutual business interests.
n a move that makes Bank of America the industry leader in credit cards by adding
20 million customer accounts, we acquired MBNA in 2006. The acquisition brings us
expertise in affi nity marketing and electronic transaction processing and provides new
opportunities to cross-sell Bank of America products and services to MBNA customers
as well as to sell MBNA products in our banking centers.
MBNA, formed in 1982, has an attractive customer base built on affi nity programs and
Becoming the leader in payments MBNA acquisition brings new expertise, products and value
Ithrough multichannel direct marketing. MBNA has a history of customer focus, having been the fi rst credit card issuer to offer 24-hour service. To this we add our leading online banking capabilities, dominant distribution channels and effi cient lending processes.
The MBNA acquisition makes Bank of America the largest credit card issuer in the United States as mea-sured by balances—offering the bank unique competitive advantages. Along with the ability to drive revenue growth through the new customer accounts, we now have affi nity relationships with more than 5,000 partner organizations, including such famous sports organizations as the National Football League and NASCAR.
Bank of America can deliver innovative deposit, lending and investment products and services to MBNA customers and offer MBNA products to our customers. We also have access to a broader selection of loan portfolios that can be bundled for sale to our investment banking clients.
The combined business will have in excess of 40 million active credit card accounts in the United States and nearly $143 billion in managed balances—more than 20 percent of the market. We are also the leader in debit card transactions, with a 16 percent market share. In addition, the acquisition provides us with a credit card offering in Canada, the United Kingdom, Spain and Ireland, representing an established international business with more than $27 billion in loans.
Bruce L. Hammonds, president, Bank of America Card Services (far right) with John A. Mitas III, M.D., chief operating offi cer of the American College of Physicians (ACP). With the acquisition of MBNA, Bank of America now has more than 5,000 affi nity relationships with organizations such as the ACP.
BManagement division alone generated more than $25 billion in loans, deposits and investments last year, and Global Wealth and Investment Management associates helped close more than 200,000 referrals of clients from one part of the bank to another.
Whether in wealth and investment management or small business or corporate investment banking, our strategy is the same: intensify internal teamwork to raise awareness of our capabilities and serve clients in more holistic ways to develop comprehensive banking relationships.
Most referrals originate from Global Consumer and Small Business Banking, which had relationships with more than 38 million U.S. consumers and small businesses as of Dec. 31, 2005. When new customers visit any one of 5,873 banking centers in the United States to open a new account, affluent clients are referred to Premier Banking and Investments, which serves clients with investable assets between $100,000 and $3 million, or The Private Bank, for those with assets above $3 million. Once these clients obtain access to integrated banking and investment services—in-cluding financial and retirement planning and wealth trans-fer and estate planning—they generally do more business
In 2005, Bank of America began to extend its wealth transfer and estate planning services to clients of Premier Banking and Investments, such as Dr. Arthur and Carla Silver, of Atlanta.
with us as their account balances tend to rise.One example of how the initiative is working involves a
commercial banking client who was about to sell his busi-ness for more than $50 million. To provide this client with an end-to-end solution, his banker brought in mergers and acquisition specialists from the Global Capital Markets and Investment Banking division, who helped facilitate the sale. He then tapped the expertise of The Private Bank for presale tax planning and wealth management strategies. Upon selling his business, the client deposited assets from the sale into his Private Bank account.
We offer clients a compelling value proposition: Give us the opportunity and we will provide unmatched convenience and expertise, high-quality service, and a full set of financial products and services delivered as a single relationship.
How We Grow: Working Together
Increasing client referrals Meeting customers’ needs across divisions with customized end-to-end service
How we grow by working togetherIn 2005, by collaborating across lines of
business, our associates created new growth
opportunities beyond those available to
our individual units. Working together, we
presented customers integrated financial
services solutions composed of products
from across the entire bank.
Collaborating across separate lines of
business to deliver more financial services
not only increases revenue opportunities,
it also increases customer convenience
and satisfaction. We have a large and
diversified portfolio of products for the
consumer, small business, commercial,
investment and capital markets, among
others. Deployed efficiently, our vast
product offering, combined with the conve-
nience, efficiency and competitive pricing
provided by our coast-to-coast franchise,
allows customers to turn to us as a single
source for diversified financial services.
24 Bank of America 2005
How We Grow: Working Together
n 2005, several transactions completed with the collaboration of formerly siloed business
units proved that Bank of America’s new focus on working together produces results—
for customers and shareholders.
These deals are merely the most visible examples of how Bank of America is
leveraging its expertise across divisions to say “yes” to more customers more often. Work-
ing together, the bank’s units will soon be able to match consumers who need higher-risk
Collaborating to create more valueWorking together, business units close high-profile transactions
Ifinancing with institutional clients who want to invest in that level of risk. As a result, we will reap increased profits and shareholder value while serving the needs of many customers, both consumers and investors.
In one example, Banc of America Securities provided MetLife with an integrated solution for the acquisition of Citigroup’s Travelers Life and Annuity and essentially all of Citigroup’s international insurance business. As a financial advisor to MetLife, we also served as joint global book-running coordinator on multiple securities offerings totaling $6.9 billion to finance the $11.8 billion deal.
This acquisition financing was one of the largest ever when it was announced in June. Launched and concluded in a three-week period, it accessed multiple markets to optimize the financing sources—the perpetual preferred market, mandatory convertible market, U.S. high-grade market and sterling market. Various teams worked together to develop this highly complex financing plan to minimize the cost for the client and maximize both earnings per share and return on equity. The success of the MetLife deal highlights the effectiveness of the bank’s ability to provide
clients with cost-effective, multiproduct solutions.Another example of how strong teamwork differentiates
Bank of America was the leveraged buyout (LBO) of Toys “R” Us by Bain Capital, Vornado Realty Trust and KKR. In serving as both debt provider and financial advisor to the financial sponsors, the bank was instrumental in the completion of the LBO. When announced in March, this deal ($6.6 billion plus the assumption of debt) was the largest retail LBO in U.S. history and the third-largest LBO of any kind. The transaction was named Euromoney magazine’s 2005 “Financing Package of the Year” and Investment Dealers’ Digest’s “Real Estate Deal of the Year.”
Closing the transaction required partnerships from around the globe, including several U.S. and European industry groups from the Investment Banking team; the Leveraged Finance and High-Yield Capital Markets teams; Commercial Mortgage-Backed Securities; Commercial Banking; the Derivatives product group; and Real Estate Syndications.
These transactions show how our diverse capabilities, when combined with our innovation, hard work and cooperation, accelerate our growth.
25 Bank of America 2005
When it was announced, the Toys “R” Us deal was the largest retail leveraged buyout in U.S. history and the third-largest of any kind. From left, dealmakers Karim Assef, managing director, Banc of America Securities; Matthew Levin, managing director, Bain Capital Partners, LLC; and Michael Fascitelli, president, Vornado Realty Trust, at Toys “R” Us at Times Square in New York.
ising from a once-abandoned hospital site in East Tampa, FL, the newly completed
Centro Place Apartments illustrate the strengths of Bank of America’s Community
Development Banking group. This restoration opened in 2005 to provide much-
needed affordable housing for low- to moderate-income seniors.
Banc of America Community Development Corp. renovated the remains of the historic
Centro Asturiano Hospital, originally built in 1928 to serve the Ybor City section of East
Restoring a community landmarkBank provides much-needed affordable housing for seniors in Tampa
RTampa. Founded in 1886, Ybor City once flourished with world-famous cigar factories and other trades employ-ing Cuban, Italian, Spanish and other immigrants. The 144-bed Centro Asturiano Hospital—where generations of neighborhood residents were born—eventually closed in 1990, becoming a vacant eyesore.
Bank of America served as developer, investor and lender in the redevelopment project, providing more than $14 million through direct capital investment and guarantees. Today, Centro Place stands as a faithful restoration of the historic hospital site. Four new residential buildings reflecting the design of the original landmark provide 160 units of multifam-ily apartments. The original hospital building that serves as a clubhouse features a theater, multimedia room, computer cen-ter, meeting space, exercise facility and library. Bank of America partnered with The Home Association of Tampa, which guides the center’s programming with their decades-long experience in helping neighborhood seniors. The development is located
near public transit, as well as medical and consumer services.To make Centro Place financially feasible and self-
supporting, a team of associates led a public-private partner-ship that includes the City of Tampa, Florida Housing Finance Corp., federal agencies and local nonprofit groups.
Since the early 1900s, Bank of America has been a leader and community partner in the development of decent, affordable housing and strong local business economies. The cornerstone of our leadership is a 10-year lending and investment goal of $750 billion that provides more than $205 million every day for community development activi-ties. This goal and similar Bank of America initiatives are the inspiration for an industry-leading array of traditional and innovative financial products, along with the expertise to find answers to the most complex priorities facing our communities. We recognize that creating neighborhood excellence and economic opportunity in low- and moderate-income communities is simply good business.
26 Bank of America 2005
Bank of America is the nation’s leading
provider of grants and loans in support
of neighborhood development. Investing
in the health and growth of our commu-
nities is not only the right thing to do, it
is also an important part of the bank’s
overall growth strategy. That is why the
bank is committed to philanthropic gifts
totaling $1.5 billion over the coming
decade. That is why the bank is pursuing
a 10-year goal of loaning and investing
$750 billion to support community
development.
Bank of America grows in partnership
with the communities we serve.
How we grow by investing in our communities
Bank of America 2005 27
Centro Place Apartments residents Myrtle Mitchell, left, and Joyce Primus tend geraniums as behind them, from left, Oscar Morales, Richard Yaderia and Bernard Silver look on. The Centro Place Apartments in Tampa, FL, were restored in partnership with Banc of America Community Development Corp.
28 Bank of America 2005
ank of America’s transaction processing center in Tempe, AZ, regularly hires
temporary employees from the Marc Center, a nonprofi t organization that helps
people with disabilities fi nd meaningful work.
Trainees from the Marc Center assist with the monthly preparation of more
than 1.7 million statements, gaining practical experience. These individuals inspire our Tempe-
based check processing associates every day by proving that anyone can overcome a challenge
and be successful in a company that values merit.
Helping others grow as we growMarc Center trainees learn new skills and inspire others
B
How We Grow: Investing in Our Communities
Marc Center trainee Sara Rose Calvert, left, who is hearing impaired and has cerebral palsy, works with Bank of America associate Amy Kries, Associate Operations representative, to collate statements for the monthly mailing.
BAs part of this 10-year goal, the company will donate
$200 million in 2006. The bank will meet this goal through a national strategy called “neighborhood excellence,” under which the bank works with local community leaders to iden-tify and meet the most pressing needs in each neighborhood. Our emphasis on community building is the catalyst for the Neighborhood Excellence Initiative—the bank’s signature philanthropic program. In 2005 the bank committed more than $30 million to the program in 38 markets nationwide.
The Neighborhood Excellence Initiative consists of three components: Student Leaders, Local Heroes and Neighborhood Builders. Student Leaders are exemplary high school students with an interest in improving their neighborhoods. Bank of America provides funding for each student to participate in a paid, eight-week summer intern-ship with a community-based organization as well as a customized mentoring relationship with a Bank of America associate. Kayla Drozd, an exceptional high school student from Portland, OR, recently completed her internship with Mount Hood Habitat for Humanity. “Working closely with my Bank of America mentor, I gained hands-on experience—not only benefi ting my community, but bettering myself through valuable professional experience,” says Ms. Drozd.
The bank also recognizes Local Heroes for their achieve-ments and leadership on issues that contribute signifi cantly to neighborhood vitality. The bank funds a $5,000 contri-bution to an eligible nonprofi t of the Local Hero’s choice. Michael Lesparre of Washington, DC, is one such hero.
Known as Maitre d’Lesparre, the 82-year-old World War II veteran arrives at Miriam’s Kitchen before 6 a.m. to help serve breakfast to more than 200 homeless guests. “Volunteering is a wonderful, eye-opening experience, and I truly can’t think of anything more rewarding than
Jesus Garcia, executive director of the Little Village Community Development Corp. in Chicago, watches neighborhood children participate in a martial arts class sponsored by Little Village.
How We Grow: Investing in Our Communities
Making a difference in our neighborhoodsThe Neighborhood Excellence Initiative provides opportunity and sustains vibrant communities
giving back to the people who come here looking for a sec-ond chance at life,” says Lesparre. Lesparre directed his $5,000 grant from Bank of America to Miriam’s Kitchen.
The program also provides grants to Neighborhood Builders—nonprofi ts working to promote vibrant neighbor-hoods. Each organization receives a $200,000 grant over two years, which can be used for operating expenses and capacity building. Leaders from each organization also participate in an innovative leadership training program.
This year, nonprofi t leaders from our inaugural Neighborhood Excellence Initiative participated in sessions in San Francisco, Chicago, Boston and Washington, DC. Among the participants was Jesus Garcia, executive director of Little Village Community Development Corp., an organi-zation dedicated to violence prevention, education and eco-nomic development on Chicago’s Southwest Side. “The Bank of America Neighborhood Excellence Initiative is open-minded, takes chances with newer organizations and invests capital and other resources at critical points during development using nonconventional criteria,” says Garcia.
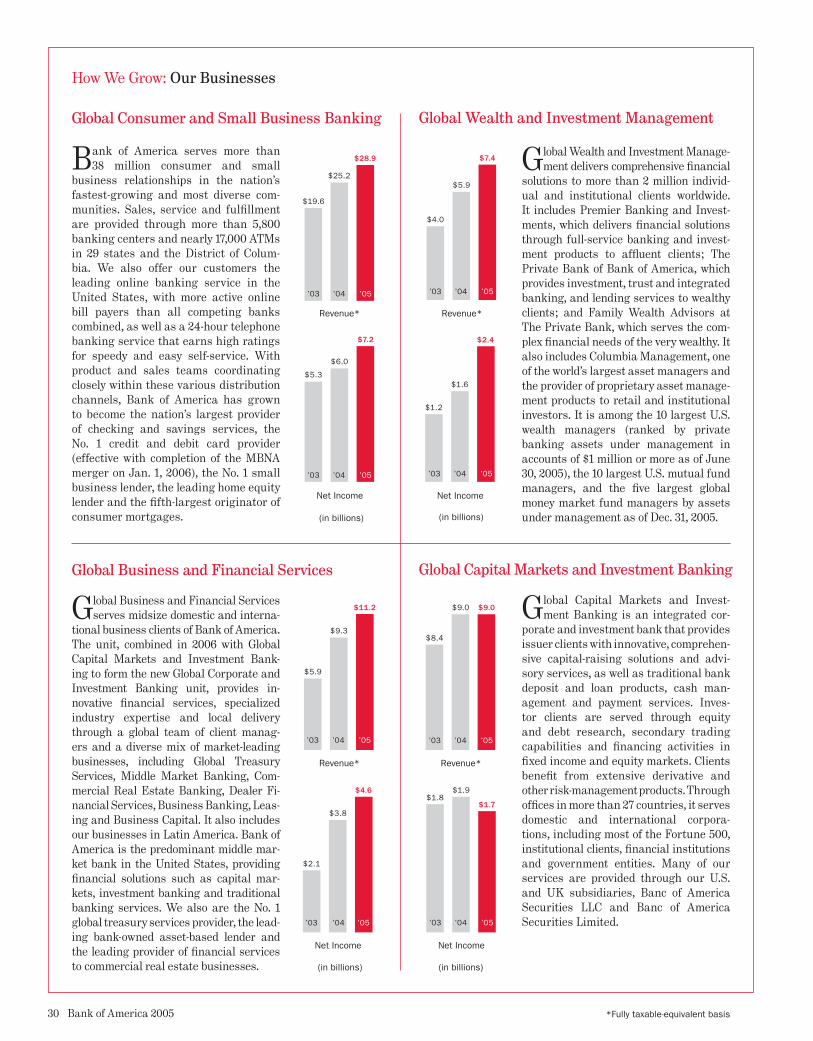
Bank of America serves more than 38 million consumer and small
business relationships in the nation’s fastest-growing and most diverse com-munities. Sales, service and fulfillment are provided through more than 5,800 banking centers and nearly 17,000 ATMs in 29 states and the District of Colum-bia. We also offer our customers the leading online banking service in the United States, with more active online bill payers than all competing banks combined, as well as a 24-hour telephone banking service that earns high ratings for speedy and easy self-service. With product and sales teams coordinating closely within these various distribution channels, Bank of America has grown to become the nation’s largest provider of checking and savings services, the No. 1 credit and debit card provider (effective with completion of the MBNA merger on Jan. 1, 2006), the No. 1 small business lender, the leading home equity lender and the fifth-largest originator of consumer mortgages.
Global Consumer and Small Business Banking
(in billions)
Global Business and Financial Services
Global Wealth and Investment Manage-ment delivers comprehensive financial
solutions to more than 2 million individ-ual and institutional clients worldwide. It includes Premier Banking and Invest-ments, which delivers financial solutions through full-service banking and invest-ment products to affluent clients; The Private Bank of Bank of America, which provides investment, trust and integrated banking, and lending services to wealthy clients; and Family Wealth Advisors at The Private Bank, which serves the com-plex financial needs of the very wealthy. It also includes Columbia Management, one of the world’s largest asset managers and the provider of proprietary asset manage-ment products to retail and institutional investors. It is among the 10 largest U.S. wealth managers (ranked by private banking assets under management in accounts of $1 million or more as of June 30, 2005), the 10 largest U.S. mutual fund managers, and the five largest global money market fund managers by assets under management as of Dec. 31, 2005.
Global Wealth and Investment Management
Global Capital Markets and Invest-ment Banking is an integrated cor-
porate and investment bank that provides issuer clients with innovative, comprehen-sive capital-raising solutions and advi-sory services, as well as traditional bank deposit and loan products, cash man-agement and payment services. Inves-tor clients are served through equity and debt research, secondary trading capabilities and financing activities in fixed income and equity markets. Clients benefit from extensive derivative and other risk-management products. Through offices in more than 27 countries, it serves domestic and international corpora-tions, including most of the Fortune 500, institutional clients, financial institutions and government entities. Many of our services are provided through our U.S. and UK subsidiaries, Banc of America Securities LLC and Banc of America Securities Limited.
Global Capital Markets and Investment Banking
*Fully taxable-equivalent basis30 Bank of America 2005
Global Business and Financial Services serves midsize domestic and interna-
tional business clients of Bank of America. The unit, combined in 2006 with Global Capital Markets and Investment Bank-ing to form the new Global Corporate and Investment Banking unit, provides in-novative financial services, specialized industry expertise and local delivery through a global team of client manag-ers and a diverse mix of market-leading businesses, including Global Treasury Services, Middle Market Banking, Com-mercial Real Estate Banking, Dealer Fi-nancial Services, Business Banking, Leas-ing and Business Capital. It also includes our businesses in Latin America. Bank of America is the predominant middle mar-ket bank in the United States, providing financial solutions such as capital mar-kets, investment banking and traditional banking services. We also are the No. 1 global treasury services provider, the lead-ing bank-owned asset-based lender and the leading provider of financial services to commercial real estate businesses.
(in billions)
Revenue*
$19.6
$25.2
’03
$28.9
’04 ’05
Net Income
$5.3
$6.0
$7.2
’03 ’04 ’05
Revenue*
$5.9
$9.3
$11.2
’03 ’04 ’05
$2.1
$3.8
Net Income
$4.6
’03 ’04 ’05
Revenue*
$4.0
$5.9
$7.4
’03 ’04 ’05
Net Income
$1.2
$1.6
$2.4
’03 ’04 ’05
(in billions)
Revenue*
$9.0
$8.4
$9.0
’03 ’04 ’05
Net Income
$1.9$1.8
$1.7
’03 ’04 ’05
(in billions)
Bank of America 2005 31
Executive Officers
Executive Officers and DirectorsBank of America Corporation and Subsidiaries
William Barnet, III Chairman, President and Chief Executive OfficerThe Barnet CompanySpartanburg, SC
Frank P. Bramble, Sr.Former Executive Officer MBNA CorporationWilmington, DE
Charles W. Coker Former ChairmanSonoco Products CompanyHartsville, SC
John T. CollinsChief Executive OfficerThe Collins Group, Inc.Boston, MA
Gary L. CountrymanChairman EmeritusLiberty Mutual GroupBoston, MA
Tommy R. FranksRetired GeneralUnited States Army Tampa, FL
Paul Fulton ChairmanBassett Furniture Industries, Inc.Winston-Salem, NC
Charles K. Gifford Former ChairmanBank of America CorporationBoston, MA
W. Steven Jones DeanKenan-Flagler Business SchoolUniversity of North Carolina at Chapel HillChapel Hill, NC
Kenneth D. LewisChairman, Chief Executive Officer and PresidentBank of America CorporationCharlotte, NC
Walter E. Massey PresidentMorehouse CollegeAtlanta, GA
Thomas J. MayChairman, President and Chief Executive OfficerNSTARBoston, MA
Patricia E. MitchellPresident and Chief Executive OfficerThe Museum of Television & RadioNew York, NY
Edward L. RomeroFormer Ambassador to SpainAlbuquerque, NM
Thomas M. RyanChairman, President and Chief Executive OfficerCVS CorporationWoonsocket, RI
O. Temple Sloan, Jr.ChairmanThe International Group, Inc.Raleigh, NC
Meredith R. Spangler Trustee and Board MemberC.D. Spangler Construction CompanyCharlotte, NC
Robert L. TillmanChairman and CEO EmeritusLowe’s Companies, Inc.Mooresville, NC
Jackie M. Ward Outside Managing DirectorIntec Telecom Systems PLCAtlanta, GA
Kenneth D. LewisChairman, Chief Executive Officer and President
Amy Woods BrinkleyGlobal Risk Executive
Alvaro G. de MolinaChief Financial Officer
Barbara J. DesoerGlobal Technology, Service and Fulfillment Executive
Liam E. McGeePresident, Global Consumer andSmall Business Banking
Brian T. MoynihanPresident, Global Wealth andInvestment Management
R. Eugene TaylorVice Chairman andPresident, Global Corporate and Investment Banking
Board of Directors
HeadquartersThe principal executive offices of Bank of America Corporation (the Corporation) are located in the Bank of America Corporate Center, Charlotte, NC 28255.
ShareholdersThe Corporation’s common stock is listed on the New York Stock Exchange and the Pacific Stock Exchange under the symbol BAC. The Corporation’s common stock is also listed on the London Stock Exchange, and certain shares are listed on the Tokyo Stock Exchange. The stock is typically listed as BankAm in newspapers. As of March 3, 2006, there were 279,724 record holders of the Corporation’s common stock.
The Corporation’s annual meeting of shareholders will be held at 10 a.m. local time on April 26, 2006, in the Belk Theater of the North Carolina Blumenthal Performing Arts Center, 130 North Tryon Street, Charlotte, NC.
For general shareholder information, call Jane Smith, shareholder relations manager, at 1.800.521.3984. For inquiries concerning dividend checks, dividend reinvestment plan, electronic deposit of dividends, tax information, transferring ownership, address changes or lost or stolen stock certificates, contact Bank of America Shareholder Services at Computershare Trust Company, N.A., via our Internet access at www.computershare.com/bankofamerica; or call 1.800.642.9855; or write toP.O. Box 43095, Providence, RI 02940-3095.
Analysts, portfolio managers and other investors seeking additional information should contact Kevin Stitt, Investor Relations executive, at 1.704.386.5667 or Lee McEntire, senior manager, Investor Relations, at 1.704.388.6780.
Visit the Investor Relations area of the Bank of America Web site, http://investor.bankofamerica.com, for stock and dividend information, financial news releases, links to Bank of America SEC filings, electronic versions of our annual reports and other material of interest to the Corporation’s shareholders.
Annual Report on Form 10-KThe Corporation’s 2005 Annual Report on Form 10-K is available at http://investor.bankofamerica.com. The Corporation also will provide a copy of the 2005 Annual Report on Form 10-K (without exhibits) upon written request addressed to:
Bank of America CorporationShareholder Relations DepartmentNC1-007-23-02100 North Tryon StreetCharlotte, NC 28255
CustomersFor assistance with Bank of America products and services, call 1.800.900.9000, or visit the Bank of America Web site at www.bankofamerica.com.
News MediaNews media seeking information should visit the Newsroom area of the Bank of America Web site for news releases, speeches and other material relating to the Corporation, including a complete list of the Corporation’s media relations specialists grouped by business specialty or geography. To do so, go to www.bankofamerica.com/newsroom.
NYSE and SEC CertificationsThe Corporation filed with the New York Stock Exchange (“NYSE”) on May 16, 2005, the Annual CEO Certification as required by the NYSE corporate governance listing standards. The Corporation has also filed as exhibits to its 2005 Annual Report on Form 10-K the CEO and CFO certifications as required by Section 302 of the Sarbanes-Oxley Act.
Corporate InformationBank of America Corporation and Subsidiaries
A key part of how we grow at Bank of America is our associates’ commitment to customersatisfaction and sales at our more than 5,800 banking centersnationwide, including the Clark & Madison Banking Center inthe heart of Chicago’s fi nancialdistrict, managed by Sandy Pierce and her team.
PURSUANT TO SECTIONS 13 OR 15(d)OF THE SECURITIES EXCHANGE ACT OF 1934
(Mark One)
È ANNUAL REPORT PURSUANT TO SECTION 13 OR 15(d) OF THESECURITIES EXCHANGE ACT OF 1934For the fiscal year ended December 31, 2005
OR
‘ TRANSITION REPORT PURSUANT TO SECTION 13 OR 15(d) OF THESECURITIES EXCHANGE ACT OF 1934For the transition period from to
Commission file number 1-6523
Bank of America Corporation(Exact name of registrant as specified in its charter)
Delaware 56-0906609(State or other jurisdiction
of incorporation or organization)(IRS Employer
Identification No.)
Bank of America Corporate Center100 N. Tryon Street
Charlotte, North Carolina 28255(Address of Principal Executive Offices) (Zip Code)
Registrant’s telephone number, including area code (704) 386-5681
SECURITIES REGISTERED PURSUANT TO SECTION 12(b) OF THE ACT:Title of each class Name of each exchange on which registered
Common Stock New York Stock ExchangeLondon Stock ExchangePacific Stock ExchangeTokyo Stock Exchange
Depositary Shares each representing a one-fifth interest in a share of:6.75% Perpetual Preferred Stock New York Stock ExchangeFixed/Adjustable Cumulative Preferred Stock New York Stock Exchange
S&P 500® Index Return Linked Notes, due July 2, 2007 American Stock ExchangeMinimum Return Index EAGLESSM, due June 1, 2010, Linked to the
Nasdaq-100 Index® American Stock ExchangeMinimum Return Index EAGLES®, due June 28, 2010, Linked to the
S&P 500® Index American Stock ExchangeMinimum Return—Return Linked Notes, due June 24, 2010, Linked to
the Nikkei 225 Index American Stock ExchangeMinimum Return Basket EAGLESSM, due August 2, 2010, Linked to a
Basket of Energy Stocks American Stock ExchangeMinimum Return Index EAGLES®, due August 28, 2009, Linked to the
Russell 2000® Index American Stock ExchangeMinimum Return Index EAGLES®, due September 25, 2009, Linked to
the Dow Jones Industrial AverageSM American Stock ExchangeMinimum Return Index EAGLES®, due October 29, 2010, Linked to the
Nasdaq-100 Index® American Stock Exchange1.50% Index CYCLESTM, due November 26, 2010, Linked to the S&P
500® Index American Stock Exchange1.00% Index CYCLESTM, due December 28, 2010, Linked to the S&P
MidCap 400 Index American Stock ExchangeReturn Linked Notes due June 28, 2010, Linked to the Nikkei 225 Index American Stock Exchange1.00% Index CYCLESTM, due January 28, 2011, Linked to a Basket of
Health Care Stocks American Stock ExchangeMinimum Return Index EAGLES®, due January 28, 2011, Linked to the
Russell 2000® Index American Stock Exchange0.25% Cash-Settled Exchangeable Notes, due January 26, 2010, Linked
to the Nasdaq-100 Index® American Stock Exchange1.25% Index CYCLESTM, due February 24, 2010, Linked to the S&P 500®
Index American Stock ExchangeMinimum Return Index EAGLES®, due March 27, 2009, Linked to the
Nasdaq-100 Index® American Stock Exchange1.75% Basket CYCLESTM, due April 30, 2009, Linked to a Basket of
Three Indices American Stock Exchange
Title of each class Name of each exchange on which registered1.00% Basket CYCLESTM, due May 27, 2010, Linked to a "70/30" Basket
of Four Indices and an Exchange Traded Fund American Stock ExchangeMinimum Return Index EAGLES®, due June 25, 2010, Linked to the
Dow Jones Industrial AverageSM American Stock Exchange1.50% Basket CYCLESTM, due July 29, 2011, Linked to an "80/20"
Basket of Four Indices and an Exchange Traded Fund American Stock ExchangeMinimum Return Index EAGLES®, due August 28, 2009, Linked to the
AMEX Biotechnology IndexSM American Stock Exchange1.25% Index CYCLESTM, due August 25, 2010, Linked to the Dow Jones
Industrial AverageSM American Stock Exchange1.25% Basket CYCLESTM, due September 27, 2011, Linked to a Basket of
Four Indices American Stock ExchangeMinimum Return Basket EAGLESSM, due September 29, 2010, Linked to
a Basket of Energy Stocks American Stock ExchangeMinimum Return Index EAGLES®, due October 29, 2010, Linked to the
S&P 500® Index American Stock ExchangeMinimum Return Index EAGLES®, due November 23, 2010, Linked to
the Nasdaq-100 Index® American Stock ExchangeMinimum Return Index EAGLES®, due November 24, 2010, Linked to
the CBOE China Index American Stock Exchange1.25% Basket CYCLESTM, due December 27, 2010, Linked to a "70/30"
Basket of Four Indices and an Exchange Traded Fund American Stock Exchange1.50% Index CYCLESTM, due December 28, 2011, Linked to a Basket of
Health Care Stocks American Stock Exchange6 1⁄2% Subordinated InterNotesSM, due 2032 New York Stock Exchange5 1⁄2% Subordinated InterNotesSM, due 2033 New York Stock Exchange5 7⁄8% Subordinated InterNotesSM, due 2033 New York Stock Exchange6% Subordinated InterNotesSM, due 2034 New York Stock Exchange8 1⁄2% Subordinated Notes, due 2007 New York Stock ExchangeNASDAQ® 100 EAGLESSM, due 2010 American Stock ExchangeS&P 500® EAGLESSM, due 2010 American Stock ExchangeNikkei 225 Return Linked Note, due 2010 American Stock ExchangeBasket of Energy Stocks EAGLESSM, due 2010 American Stock ExchangeRussell 2000® EAGLES®, due 2009 American Stock ExchangeDJIA® EAGLES®, due 2009 American Stock ExchangeNasdaq 100® EAGLES®, due 2010 American Stock ExchangeS&P 500® Index CYCLES™, due 2010 American Stock ExchangeS&P 400 MidCap Index CYCLES™, due 2010 American Stock ExchangeNikkei 225 Return Linked Note, due 2010 American Stock Exchange
Securities registered pursuant to Section 12(g) of the Act: NoneIndicate by check mark if the registrant is a well-known seasoned issuer, as defined in Rule 405 of the Securities Act.
Yes È No ‘
Indicate by check mark if the registrant is not required to file reports pursuant to Section 13 or Section 15(d) of the Act.Yes ‘ No È
Indicate by check mark whether the registrant: (1) has filed all reports required to be filed by Section 13 or 15(d) of the SecuritiesExchange Act of 1934 during the preceding 12 months (or for such shorter period that the registrant was required to file such reports),and (2) has been subject to such filing requirements for the past 90 days. Yes È No ‘
Indicate by check mark if disclosure of delinquent filers pursuant to Item 405 of Regulation S-K is not contained herein, and willnot be contained, to the best of registrant’s knowledge, in definitive proxy or information statements incorporated by reference in PartIII of this Form 10-K or any amendment to this Form 10-K. ‘
Indicate by check mark whether the registrant is a large accelerated filer, an accelerated filer, or a non-accelerated filer. Seedefinition of “accelerated filer” and “large accelerated filer” in Rule 12b-2 of the Exchange Act.
È Large accelerated filer ‘ Accelerated filer ‘ Non-accelerated filerIndicate by check mark whether the registrant is a shell company (as defined in Rule 12b-2 of the Exchange Act). Yes ‘ No È
The aggregate market value of the registrant’s common stock (“Common Stock”) held by non-affiliates is approximately$210,310,308,584 (based on the June 30, 2005 closing price of Common Stock of $45.61 per share as reported on the New York StockExchange). As of March 13, 2006, there were 4,648,802,068 shares of Common Stock outstanding.
DOCUMENTS INCORPORATED BY REFERENCEDocument of the Registrant Form 10-K Reference Locations
Portions of the 2006 Proxy Statement PART III
Restatement
Overview
Bank of America Corporation (the “Corporation”) is restating its historical financial statements for the quartersended March 31, 2005, June 30, 2005 and September 30, 2005, the year ended December 31, 2004, including thequarters ended March 31, 2004, June 30, 2004 and September 30, 2004, the year ended December 31, 2003, and otherselected financial data for the years ended December 31, 2002 and 2001. These restatements and revisions relate to theaccounting treatment for certain derivative transactions under the Statement of Financial Accounting Standards No.133, Accounting for Derivative Instruments and Hedging Activities, as amended (SFAS 133). The Corporation ispresenting this restatement in its 2005 Annual Report on Form 10-K.
The restatement has the following impact on Net Income and Diluted Earnings Per Common Share (EPS) by period:
Impact by Periods(1)
(Dollars in millions, except per share information)Net IncomeAdjustment
(1) For presentation purposes, certain numbers have been rounded.
For additional information relating to the effect of the restatement, see the following items:
Part II:
Item 6 – Selected Financial DataItem 7 – Management’s Discussion and Analysis of Results of Operations and Financial ConditionItem 7A – Quantitative and Qualitative Disclosure about Market RiskItem 8 – Financial Statements and Supplementary DataItem 9A – Controls and Procedures
Part IV:
Item 15 – Exhibits and Financial Statements Schedule
1
PART IItem 1. BUSINESS
General
Bank of America Corporation (the “Corporation”) is a Delaware corporation, a bank holding company and a financialholding company under the Gramm-Leach-Bliley Act. The Corporation was incorporated in 1998 as part of the merger ofBankAmerica Corporation with NationsBank Corporation. The principal executive offices of the Corporation are locatedin the Bank of America Corporate Center, Charlotte, North Carolina 28255.
Additional information relating to our businesses and our subsidiaries is included in the information set forth inpages 26 through 42 of Item 7, Management’s Discussion and Analysis of Financial Condition and Results of Operationsand Note 20 of the Notes to the Consolidated Financial Statements in Item 8 of this report.
Primary Market Areas
Through its banking subsidiaries (the “Banks”) and various nonbanking subsidiaries, the Corporation provides adiversified range of banking and nonbanking financial services and products, primarily throughout the Northeast(Connecticut, Maine, Massachusetts, New Hampshire and Rhode Island), the Mid-Atlantic (Maryland, New Jersey, NewYork, Pennsylvania, Virginia and the District of Columbia), the Midwest (Illinois, Iowa, Kansas and Missouri), theSoutheast (Florida, Georgia, North Carolina, South Carolina and Tennessee), the Southwest (Arizona, Arkansas, NewMexico, Oklahoma and Texas), the Northwest (Oregon, Idaho and Washington) and the West (California, Idaho andNevada) regions of the United States and in selected international markets. Management believes that these aredesirable regions in which to be located. Based on the most recent available data, personal income in the states in theseregions as a whole rose 6.6 percent year-to-year through the third quarter of 2005, compared to growth of 3.3 percent inthe rest of the United States. In addition, the population in these states as a whole rose an estimated 1.3 percentbetween 2004 and 2005, compared to growth of 0.4 percent in the rest of the United States. Through December 2005, theaverage rate of unemployment in these states was 4.8 percent, ranging from 3.3 percent in Florida and Virginia to 7.0percent in South Carolina, compared to a rate of unemployment of 5.1 percent in the rest of the United States. Thenumber of housing permits authorized in 2005 was nearly 9 percent higher than in 2004 in these states as a whole.
The Corporation has the leading bank deposit market share position in California, Connecticut, Florida, Maryland,Massachusetts, Nevada, New Jersey and Washington. In addition, the Corporation ranks second in terms of bankdeposit market share in Arizona, Delaware, Kansas, Missouri, New Mexico, North Carolina, Rhode Island, SouthCarolina and Texas; third in Arkansas, District of Columbia, Georgia and Maine; fourth in Idaho, New Hampshire,Oklahoma, Oregon and Virginia; fifth in Tennessee; sixth in New York; eighth in Iowa; tenth in Pennsylvania; andfourteenth in Illinois.
Acquisition and Disposition Activity
As part of its operations, the Corporation regularly evaluates the potential acquisition of, and holds discussionswith, various financial institutions and other businesses of a type eligible for financial holding company ownership orcontrol. In addition, the Corporation regularly analyzes the values of, and submits bids for, the acquisition of customer-based funds and other liabilities and assets of such financial institutions and other businesses. The Corporation alsoregularly considers the potential disposition of certain of its assets, branches, subsidiaries or lines of businesses. As ageneral rule, the Corporation publicly announces any material acquisitions or dispositions when a definitive agreementhas been reached.
On April 1, 2004, the Corporation completed its merger with FleetBoston Financial Corporation, and, on June 13,2005, Bank of America, N.A. completed its merger with Fleet National Bank. On January 1, 2006, the Corporationcompleted its merger with MBNA Corporation. Additional information on these mergers and the Corporation’s otheracquisition activity is included under Notes 2 and 3 of the Notes to the Consolidated Financial Statements in Item 8which are incorporated herein by reference.
Government Supervision and Regulation
The following discussion describes elements of an extensive regulatory framework applicable to bank holdingcompanies, financial holding companies and banks and specific information about the Corporation and its subsidiaries.Federal regulation of banks, bank holding companies and financial holding companies is intended primarily for theprotection of depositors and the Bank Insurance Fund rather than for the protection of stockholders and creditors.
General
As a registered bank holding company and financial holding company, the Corporation is subject to the supervisionof, and regular inspection by, the Board of Governors of the Federal Reserve System (the “Federal Reserve Board”). The
2
Banks are organized as national banking associations, which are subject to regulation, supervision and examination bythe Office of the Comptroller of the Currency (the “Comptroller” or “OCC”), the Federal Deposit Insurance Corporation(the “FDIC”), the Federal Reserve Board and other federal and state regulatory agencies. In addition to banking laws,regulations and regulatory agencies, the Corporation and its subsidiaries and affiliates are subject to various other lawsand regulations and supervision and examination by other regulatory agencies, all of which directly or indirectly affectthe operations and management of the Corporation and its ability to make distributions to stockholders.
A financial holding company, and the companies under its control, are permitted to engage in activities considered“financial in nature” as defined by the Gramm-Leach-Bliley Act and Federal Reserve Board interpretations (including,without limitation, insurance and securities activities), and therefore may engage in a broader range of activities thanpermitted for bank holding companies and their subsidiaries. A financial holding company may engage directly orindirectly in activities considered financial in nature, either de novo or by acquisition, provided the financial holdingcompany gives the Federal Reserve Board after-the-fact notice of the new activities. The Gramm-Leach-Bliley Act alsopermits national banks, such as the Banks, to engage in activities considered financial in nature through a financialsubsidiary, subject to certain conditions and limitations and with the approval of the Comptroller.
Bank holding companies (including bank holding companies that also are financial holding companies) also arerequired to obtain the prior approval of the Federal Reserve Board before acquiring more than five percent of any class ofvoting stock of any non-affiliated bank. Pursuant to the Riegle-Neal Interstate Banking and Branching Efficiency Act of1994 (the “Interstate Banking and Branching Act”), a bank holding company may acquire banks located in states otherthan its home state without regard to the permissibility of such acquisitions under state law, but subject to any staterequirement that the bank has been organized and operating for a minimum period of time, not to exceed five years, andthe requirement that the bank holding company, after the proposed acquisition, controls no more than 10 percent of thetotal amount of deposits of insured depository institutions in the United States and no more than 30 percent or suchlesser or greater amount set by state law of such deposits in that state. Subject to certain restrictions, the InterstateBanking and Branching Act also authorizes banks to merge across state lines to create interstate banks. The InterstateBanking and Branching Act also permits a bank to open new branches in a state in which it does not already havebanking operations if such state enacts a law permitting de novo branching.
Changes in Regulations
Proposals to change the laws and regulations governing the banking industry are frequently introduced in Congress,in the state legislatures and before the various bank regulatory agencies. The likelihood and timing of any proposals orlegislation and the impact they might have on the Corporation and its subsidiaries cannot be determined at this time.
Capital and Operational Requirements
The Federal Reserve Board, the Comptroller and the FDIC have issued substantially similar risk-based andleverage capital guidelines applicable to United States banking organizations. In addition, these regulatory agenciesmay from time to time require that a banking organization maintain capital above the minimum levels, whether becauseof its financial condition or actual or anticipated growth. The Federal Reserve Board risk-based guidelines define athree-tier capital framework. Tier 1 capital includes common shareholders’ equity, trust preferred securities, minorityinterests and qualifying preferred stock, less goodwill and other adjustments. Tier 2 capital consists of preferred stocknot qualifying as Tier 1 capital, mandatory convertible debt, limited amounts of subordinated debt, other qualifying termdebt and the allowance for credit losses up to 1.25 percent of risk-weighted assets and other adjustments. Tier 3 capitalincludes subordinated debt that is unsecured, fully paid, has an original maturity of at least two years, is not redeemablebefore maturity without prior approval by the Federal Reserve Board and includes a lock-in clause precluding paymentof either interest or principal if the payment would cause the issuing bank’s risk-based capital ratio to fall or remainbelow the required minimum. The sum of Tier 1 and Tier 2 capital less investments in unconsolidated subsidiariesrepresents the Corporation’s qualifying total capital. Risk-based capital ratios are calculated by dividing Tier 1 and totalcapital by risk-weighted assets. Assets and off-balance sheet exposures are assigned to one of four categories of risk-weights, based primarily on relative credit risk. The minimum Tier 1 capital ratio is four percent and the minimum totalcapital ratio is eight percent. The Corporation’s Tier 1 and total risk-based capital ratios under these guidelines atDecember 31, 2005 were 8.25 percent and 11.08 percent, respectively. At December 31, 2005, the Corporation had nosubordinated debt that qualified as Tier 3 capital.
The leverage ratio is determined by dividing Tier 1 capital by adjusted average total assets. Although the statedminimum ratio is 100 to 200 basis points above three percent, banking organizations are required to maintain a ratio ofat least five percent to be classified as well capitalized. The Corporation’s leverage ratio at December 31, 2005 was 5.91percent. The Corporation meets its leverage ratio requirement.
The Federal Deposit Insurance Corporation Improvement Act of 1991 (“FDICIA”), among other things, identifies fivecapital categories for insured depository institutions (well capitalized, adequately capitalized, undercapitalized,
3
significantly undercapitalized and critically undercapitalized) and requires the respective federal regulatory agencies toimplement systems for “prompt corrective action” for insured depository institutions that do not meet minimum capitalrequirements within such categories. FDICIA imposes progressively more restrictive constraints on operations,management and capital distributions, depending on the category in which an institution is classified. Failure to meetthe capital guidelines could also subject a banking institution to capital raising requirements. An “undercapitalized”bank must develop a capital restoration plan and its parent holding company must guarantee that bank’s compliancewith the plan. The liability of the parent holding company under any such guarantee is limited to the lesser of fivepercent of the bank’s assets at the time it became “undercapitalized” or the amount needed to comply with the plan.Furthermore, in the event of the bankruptcy of the parent holding company, such guarantee would take priority over theparent’s general unsecured creditors. In addition, FDICIA requires the various regulatory agencies to prescribe certainnon-capital standards for safety and soundness relating generally to operations and management, asset quality andexecutive compensation and permits regulatory action against a financial institution that does not meet such standards.
The various regulatory agencies have adopted substantially similar regulations that define the five capitalcategories identified by FDICIA, using the total risk-based capital, Tier 1 risk-based capital and leverage capital ratiosas the relevant capital measures. Such regulations establish various degrees of corrective action to be taken when aninstitution is considered undercapitalized. Under the regulations, a “well capitalized” institution must have a Tier 1 risk-based capital ratio of at least six percent, a total risk-based capital ratio of at least ten percent and a leverage ratio of atleast five percent and not be subject to a capital directive order. Under these guidelines, each of the Banks wasconsidered well capitalized as of December 31, 2005.
Regulators also must take into consideration: (a) concentrations of credit risk; (b) interest rate risk (when theinterest rate sensitivity of an institution’s assets does not match the sensitivity of its liabilities or its off-balance-sheetposition); and (c) risks from non-traditional activities, as well as an institution’s ability to manage those risks, whendetermining the adequacy of an institution’s capital. This evaluation will be made as a part of the institution’s regularsafety and soundness examination. In addition, the Corporation, and any Bank with significant trading activity, mustincorporate a measure for market risk in their regulatory capital calculations.
Distributions
The Corporation’s funds for cash distributions to its stockholders are derived from a variety of sources, includingcash and temporary investments. The primary source of such funds, and funds used to pay principal and interest on itsindebtedness, is dividends received from the Banks. Each of the Banks is subject to various regulatory policies andrequirements relating to the payment of dividends, including requirements to maintain capital above regulatoryminimums. The appropriate federal regulatory authority is authorized to determine under certain circumstancesrelating to the financial condition of a bank or bank holding company that the payment of dividends would be an unsafeor unsound practice and to prohibit payment thereof.
In addition, the ability of the Corporation and the Banks to pay dividends may be affected by the various minimumcapital requirements and the capital and non-capital standards established under FDICIA, as described above. The rightof the Corporation, its stockholders and its creditors to participate in any distribution of the assets or earnings of itssubsidiaries is further subject to the prior claims of creditors of the respective subsidiaries.
Source of Strength
According to Federal Reserve Board policy, bank holding companies are expected to act as a source of financialstrength to each subsidiary bank and to commit resources to support each such subsidiary. This support may be requiredat times when a bank holding company may not be able to provide such support. Similarly, under the cross-guaranteeprovisions of the Federal Deposit Insurance Act, in the event of a loss suffered or anticipated by the FDIC – either as aresult of default of a banking subsidiary or related to FDIC assistance provided to a subsidiary in danger of default – theother Banks may be assessed for the FDIC’s loss, subject to certain exceptions.
Competition
In 2005, the Corporation had four business segments: Global Consumer and Small Business Banking, GlobalBusiness and Financial Services, Global Capital Markets and Investment Banking, and Global Wealth and InvestmentManagement. The activities in which the Corporation and its business segments engage are highly competitive.Generally, the lines of activity and markets served involve competition with other banks, thrifts, credit unions and othernonbank financial institutions, such as investment banking firms, investment advisory firms, brokerage firms,investment companies and insurance companies. The Corporation also competes against banks and thrifts owned bynonregulated diversified corporations and other entities which offer financial services, located both domestically andinternationally and through alternative delivery channels such as the Internet. The methods of competition centeraround various factors, such as customer services, interest rates on loans and deposits, lending limits and customerconvenience, such as location of offices.
4
The commercial banking business in the various local markets served by the Corporation’s business segments ishighly competitive. The four business segments compete with other banks, thrifts, finance companies and otherbusinesses which provide similar services. The business segments actively compete in commercial lending activities withlocal, regional and international banks and nonbank financial organizations, some of which are larger than certain of theCorporation’s nonbanking subsidiaries and the Banks. In its consumer lending operations, the competitors of thebusiness segments include other banks, thrifts, credit unions, finance companies and other nonbank organizationsoffering financial services. In the investment banking, investment advisory and brokerage business, the Corporation’snonbanking subsidiaries compete with other banking and investment banking firms, investment advisory firms,brokerage firms, investment companies, other organizations offering similar services and other investment alternativesavailable to investors. The Corporation’s mortgage banking units compete with banks, thrifts, government agencies,mortgage brokers and other nonbank organizations offering mortgage banking services. The Corporation’s card businesscompetes with other banks, as well as monoline and retail card product companies. In the trust business, the Bankscompete with other banks, investment counselors and insurance companies in national markets for institutional fundsand insurance agents, thrifts, financial counselors and other fiduciaries for personal trust business. The Corporation andits four business segments also actively compete for funds. A primary source of funds for the Banks is deposits, andcompetition for deposits includes other deposit-taking organizations, such as banks, thrifts, and credit unions, as well asmoney market mutual funds.
The Corporation’s ability to expand into additional states remains subject to various federal and state laws. See“Government Supervision and Regulation – General” for a more detailed discussion of interstate banking and branchinglegislation and certain state legislation.
Employees
As of December 31, 2005, there were 176,638 full-time equivalent employees within the Corporation and itssubsidiaries. Of the foregoing employees, 75,202 were employed within Global Consumer and Small Business Banking,22,957 were employed within Global Business and Financial Services, 7,765 were employed within Global CapitalMarkets and Investment Banking and 12,338 were employed within Global Wealth and Investment Management. Theremainder were employed elsewhere within the Corporation and its subsidiaries.
None of the domestic employees within the Corporation is subject to a collective bargaining agreement. Managementconsiders its employee relations to be good.
Additional Information
See also the following additional information which is incorporated herein by reference: Business SegmentOperations (under the caption “Business Segment Operations” in Item 7, Management’s Discussion and Analysis ofFinancial Condition and Results of Operations (the “MD&A”) and in Note 20 of the Notes to Consolidated FinancialStatements in Item 8, Financial Statements and Supplementary Data (the “Notes”)); Net Interest Income (under thecaptions “Financial Highlights—Net Interest Income” and “Supplemental Financial Data” in the MD&A and Tables Iand II of the Statistical Financial Information); Securities (under the caption “Interest Rate RiskManagement—Securities” in the MD&A and Notes 1 and 6 of the Notes); Outstanding Loans and Leases (under thecaption “Credit Risk Management” in the MD&A, Table III of the Statistical Financial Information, and Notes 1 and 7 ofthe Notes); Deposits (under the caption “Liquidity Risk Management—Deposits and Other Funding Sources” in theMD&A and Note 11 of the Notes); Short-Term Borrowings (under the caption “Liquidity Risk and Capital Management”in the MD&A and Note 12 of the Notes); Trading Account Liabilities (in Note 4 of the Notes); Market Risk Management(under the caption “Market Risk Management” in the MD&A); Liquidity Risk Management (under the caption “LiquidityRisk and Capital Management” in the MD&A); Operational Risk Management (under the caption “Operational RiskManagement” in the MD&A); and Performance by Geographic Area (under Note 22 of the Notes).
The Corporation’s Annual Report on Form 10-K, Quarterly Reports on Form 10-Q, Current Reports on Form 8-K andamendments to those reports filed or furnished pursuant to Section 13(a) or 15(d) of the Securities Exchange Act of 1934are available on the Corporation’s website at http://investor.bankofamerica.com under the heading Complete SECFilings as soon as reasonably practicable after the Corporation electronically files such material with, or furnishes it tothe Securities and Exchange Commission (the “SEC”). In addition, the Corporation makes available on its website athttp://investor.bankofamerica.com under the heading Corporate Governance its: (i) Code of Ethics and Insider TradingPolicy; (ii) Corporate Governance Guidelines; and (iii) the charters of each of Bank of America’s Board committees, andalso intends to disclose any amendments to its Code of Ethics, or waivers of the Code of Ethics on behalf of its ChiefExecutive Officer, Chief Financial Officer and Chief Accounting Officer, on its website. These corporate governancematerials are also available free of charge in print to stockholders who request them in writing to: Bank of AmericaCorporation, Attention: Shareholder Relations Department, 101 South Tryon Street, NC1-002-29-01, Charlotte, NorthCarolina 28255.
5
The Corporation’s Annual Report on Form 10-K is being distributed to stockholders in lieu of a separate annualreport containing financial statements of the Corporation and its consolidated subsidiaries.
Item 1A. RISK FACTORS
This report contains certain statements that are forward-looking within the meaning of the Private SecuritiesLitigation Reform Act of 1995. These statements are not guarantees of future performance and involve certain risks,uncertainties and assumptions that are difficult to predict. Actual outcomes and results may differ materially from thoseexpressed in, or implied by, our forward-looking statements. Words such as “expects,” “anticipates,” “believes,”“estimates” and other similar expressions or future or conditional verbs such as “will,” “should,” “would” and “could” areintended to identify such forward-looking statements. Readers of this annual report of the Corporation (also referred toas we, us or our) should not rely solely on the forward-looking statements and should consider all uncertainties and risksthroughout this report. The statements are representative only as of the date they are made, and we undertake noobligation to update any forward-looking statement.
All forward-looking statements, by their nature, are subject to risks and uncertainties. Our actual future resultsmay differ materially from those set forth in our forward-looking statements. As a large, international financial servicescompany, we face risks that are inherent in the businesses and the market places in which we operate. Factors thatmight cause our future financial performance to vary from that described in our forward-looking statements include themarket, credit, operational, regulatory, strategic, liquidity, capital, economic and sovereign risks, among others, asdiscussed in the MD&A and in other periodic reports filed with the SEC. In addition, the following discussion sets forthcertain risks and uncertainties that we believe could cause actual future results to differ materially from expectedresults. However, other factors besides those listed below or discussed in our reports to the SEC also could adverselyaffect our results, and the reader should not consider any such list of factors to be a complete set of all potential risks oruncertainties.
General business, economic and political conditions. Our businesses and earnings are affected by generalbusiness, economic and political conditions in the United States and abroad. Given the concentration of our businessactivities in the United States, we are particularly exposed to downturns in the United States economy. For example, ina poor economic environment there is a greater likelihood that more of our customers or counterparties could becomedelinquent on their loans or other obligations to us, which, in turn, could result in a higher level of charge-offs andprovision for credit losses, all of which would adversely affect our earnings. General business and economic conditionsthat could affect us include short-term and long-term interest rates, inflation, monetary supply, fluctuations in both debtand equity capital markets, and the strength of the Unites States economy and the local economies in which we operate.Geopolitical conditions can also affect our earnings. Acts or threats of terrorism, actions taken by the United States orother governments in response to acts or threats of terrorism and/or military conflicts, could affect business andeconomic conditions in the United States and abroad.
Access to funds from subsidiaries. The Corporation is a separate and distinct legal entity from our banking andnonbanking subsidiaries. We therefore depend on dividends, distributions and other payments from our banking andnonbanking subsidiaries to fund dividend payments on the common stock and to fund all payments on our otherobligations, including debt obligations. Many of our subsidiaries are subject to laws that authorize regulatory bodies toblock or reduce the flow of funds from those subsidiaries to the Corporation. Regulatory action of that kind could impedeaccess to funds we need to make payments on our obligations or dividend payments. In addition, the Corporation’s rightto participate in a distribution of assets upon a subsidiary’s liquidation or reorganization is subject to the prior claims ofthe subsidiary’s creditors.
Changes in accounting standards. Our accounting policies and methods are fundamental to how we record andreport our financial condition and results of operations. From time to time the Financial Accounting Standards Board(“FASB”) changes the financial accounting and reporting standards that govern the preparation of our financialstatements. These changes can be hard to predict and can materially impact how we record and report our financialcondition and results of operations. In some cases, we could be required to apply a new or revised standard retroactively,resulting in our restating prior period financial statements.
Competition. We operate in a highly competitive environment that could experience intensified competition ascontinued merger activity in the financial services industry produces larger, better-capitalized companies that arecapable of offering a wider array of financial products and services, and at more competitive prices. In addition,technological advances and the growth of e-commerce have made it possible for non-depository institutions to offerproducts and services that traditionally were banking products, and for financial institutions to compete with technologycompanies in providing electronic and Internet-based financial solutions. Many of our competitors have fewer regulatoryconstraints and some have lower cost structures.
Credit Risk. When we loan money, commit to loan money or enter into a contract with a counterparty, we incurcredit risk, or the risk of losses if our borrowers do not repay their loans or our counterparties fail to perform accordingto the terms of their contract. A number of our products expose us to credit risk, including loans, leases and lending
6
commitments, derivatives, trading account assets and assets held-for-sale. As one of the nation’s largest lenders, thecredit quality of our portfolio can have a significant impact on our earnings. We allow for and reserve against credit risksbased on our assessment of credit losses inherent in our loan portfolio (including unfunded credit commitments). Thisprocess, which is critical to our financial results and condition, requires difficult, subjective and complex judgments,including forecasts of economic conditions and how these economic predictions might impair the ability of our borrowersto repay their loans. As is the case with any such assessments, there is always the chance that we will fail to identify theproper factors or that we will fail to accurately estimate the impacts of factors that we identify.
For a further discussion of credit risk and our credit risk management policies and procedures, see “Credit RiskManagement” in the MD&A.
Federal and state regulation. The Corporation, the Banks and many of our nonbank subsidiaries are heavilyregulated by bank regulatory agencies at the federal and state levels. This regulation is to protect depositors, federaldeposit insurance funds and the banking system as a whole, not security holders. The Corporation and its nonbankingsubsidiaries are also heavily regulated by securities regulators, domestically and internationally. This regulation isdesigned to protect investors in securities we sell or underwrite. Congress and state legislatures and foreign, federal andstate regulatory agencies continually review laws, regulations and policies for possible changes. Changes to statutes,regulations or regulatory policies, including interpretation or implementation of statutes, regulations or policies, couldaffect us in substantial and unpredictable ways including limiting the types of financial services and products we mayoffer and increasing the ability of nonbanks to offer competing financial services and products.
Governmental fiscal and monetary policy. Our businesses and earnings are affected by domestic andinternational monetary policy. For example, the Board of Governors of the Federal Reserve System regulates the supplyof money and credit in the United States and its policies determine in large part our cost of funds for lending andinvesting and the return we earn on those loans and investments, both of which affect our net interest margin. Theactions of the Federal Reserve Board also can materially affect the value of financial instruments we hold, such as debtsecurities and mortgage servicing rights and its policies also can affect our borrowers, potentially increasing the riskthat they may fail to repay their loans. Our businesses and earnings also are affected by the fiscal or other policies thatare adopted by various regulatory authorities of the United States, non-U.S. governments and international agencies.Changes in domestic and international monetary policy are beyond our control and hard to predict.
Liquidity. Liquidity is essential to our businesses. Our liquidity could be impaired by an inability to access thecapital markets or unforeseen outflows of cash. This situation may arise due to circumstances that we may be unable tocontrol, such as a general market disruption or an operational problem that affects third parties or us. Our credit ratingsare important to our liquidity. A reduction in our credit ratings could adversely affect our liquidity and competitiveposition, increase our borrowing costs, limit our access to the capital markets or trigger unfavorable contractualobligations.
For a further discussion of our liquidity picture and the policies and procedures we use to manage our liquidityrisks, see “Liquidity Risk and Capital Management” in the MD&A.
Litigation risks. We face significant legal risks in our businesses, and the volume of claims and amount ofdamages and penalties claimed in litigation and regulatory proceedings against financial institutions remain high.Substantial legal liability or significant regulatory action against the Corporation could have material adverse financialeffects or cause significant reputational harm to the Corporation, which in turn could seriously harm our businessprospects.
For a further discussion of litigation risks, see “Litigation and Regulatory Matters” in Note 13 of the Notes.Market risk. We are directly and indirectly affected by changes in market conditions. Market risk generally
represents the risk that values of assets and liabilities or revenues will be adversely affected by changes in marketconditions. For example, changes in interest rates could adversely affect our net interest margin—the difference betweenthe yield we earn on our assets and the interest rate we pay for deposits and other sources of funding—which could inturn affect our net interest income and earnings. Market risk is inherent in the financial instruments associated withmany of our operations and activities including loans, deposits, securities, short-term borrowings, long-term debt,trading account assets and liabilities, and derivatives. Just a few of the market conditions that may shift from time totime, thereby exposing us to market risk, include fluctuations in interest and currency exchange rates, equity andfutures prices, changes in the implied volatility of interest rates, foreign exchange rates, equity and futures prices, andprice deterioration or changes in value due to changes in market perception or actual credit quality of either the issueror its country of origin. Accordingly, depending on the instruments or activities impacted, market risks can have wideranging, complex adverse affects on our results from operations and our overall financial condition.
For a further discussion of market risk and our market risk management policies and procedures, see “Market RiskManagement” in the MD&A.
Merger risks. There are significant risks and uncertainties associated with mergers, such as our merger withMBNA. For example, we may fail to realize the growth opportunities and cost savings anticipated to be derived from themerger. In addition, it is possible that the integration process could result in the loss of key employees, or that thedisruption of ongoing business from the merger could adversely affect our ability to maintain relationships with clients
7
or suppliers. We have an active acquisition program and there is a risk that integration difficulties may cause us not torealize expected benefits from the transactions We will be subject to similar risks and difficulties in connection withfuture acquisitions, as well as decisions to downsize, sell or close units or otherwise change the business mix of theCorporation.
Non-U.S. operations; trading in non-U.S. securities. We do business throughout the world, including indeveloping regions of the world commonly known as emerging markets. Our businesses and revenues derived from non-U.S. operations are subject to risk of loss from currency fluctuations, social instability, changes in governmental policiesor policies of central banks, expropriation, nationalization, confiscation of assets, unfavorable political and diplomaticdevelopments and changes in legislation relating to non-U.S. ownership. We also invest in the securities of corporationslocated in non-U.S. jurisdictions, including emerging markets. Revenues from the trading of non-U.S. securities also maybe subject to negative fluctuations as a result of the above factors. The impact of these fluctuations could be accentuated,because generally, non-U.S. trading markets, particularly in emerging market countries, are smaller, less liquid andmore volatile than U.S. trading markets.
Operational risks. The potential for operational risk exposure exists throughout our organization. Integral to ourperformance is the continued efficacy of our technical systems, operational infrastructure, relationships with thirdparties and the vast array of associates and key executives in our day-to-day and ongoing operations. Failure by any orall of these resources subjects us to risks that may vary in size, scale and scope. This includes but is not limited tooperational or technical failures, ineffectiveness or exposure due to interruption in third party support as expected, aswell as, the loss of key individuals or failure on the part of the key individuals to perform properly.
For further discussion of operating risks, see “Operational Risk Management” in the MD&A.
Our reputation is important. Our ability to attract and retain customers and employees could be adverselyaffected to the extent our reputation is damaged. Our failure to address, or to appear to fail to address various issuesthat could give rise to reputational risk could cause harm to the Corporation and its business prospects. These issuesinclude, but are not limited to, appropriately addressing potential conflicts of interest; legal and regulatoryrequirements; ethical issues; money-laundering; privacy; properly maintaining customer and associate personalinformation; record keeping; sales and trading practices; and the proper identification of the legal, reputational, credit,liquidity and market risks inherent in our products. Failure to address appropriately these issues could also give rise toadditional legal risks, which, in turn, could increase the size and number of litigation claims and damages asserted orsubject us to enforcement actions, fines and penalties and cause us to incur related costs and expenses.
Products and services. Our business model is based on a diversified mix of businesses that provide a broad rangeof financial products and services, delivered through multiple distribution channels. Our success depends, in part, on ourability to adapt our products and services to evolving industry standards. There is increasing pressure to provideproducts and services at lower prices. This can reduce our net interest margin and revenues from our fee-based productsand services. In addition, the widespread adoption of new technologies, including internet services, could require us tomake substantial expenditures to modify or adapt our existing products and services. We might not be successful inintroducing new products and services, responding or adapting to changes in consumer spending and saving habits,achieving market acceptance of our products and services, or developing and maintaining loyal customers.
Risk management processes and strategies. We seek to monitor and control our risk exposure through a varietyof separate but complementary financial, credit, operational, compliance and legal reporting systems. While we employ abroad and diversified set of risk monitoring and risk mitigation techniques, those techniques and the judgments thataccompany their application cannot anticipate every economic and financial outcome or the specifics and timing of suchoutcomes. Accordingly, our ability to successfully identify and manage risks facing us is an important factor that cansignificantly impact our results. For a further discussion of our risk management policies and procedures, see “ManagingRisk” in the MD&A.
We operate many different businesses. We are a diversified financial services company. In addition to banking,we provide investment, mortgage, investment banking, credit card and consumer finance services. Although we believeour diversity helps lessen the effect when downturns affect any one segment of our industry, it also means our earningscould be subject to different risks and uncertainties than the ones discussed in herein. If any of the risks that we faceactually occur, irrespective of whether those risks are described in this section or elsewhere in this report, our business,financial condition and operating results could be materially adversely affected.
Item 1B. UNRESOLVED STAFF COMMENTS
There are no material unresolved written comments that were received from the Securities and ExchangeCommission’s staff 180 days or more before the end of the Corporation’s fiscal year relating to the Corporation’s periodicor current reports filed under the Securities Exchange Act of 1934.
8
Item 2. PROPERTIES
As of December 31, 2005, the principal offices of the Corporation and primarily all of its business segments werelocated in the 60-story Bank of America Corporate Center in Charlotte, North Carolina, which is owned by a subsidiaryof the Corporation. The Corporation occupies approximately 612,000 square feet and leases approximately 588,000square feet to third parties at market rates, which represents substantially all of the space in this facility. TheCorporation occupies approximately 822,000 square feet of space at 100 Federal Street in Boston, which is theheadquarters for one of the Corporation’s primary business segments, the Global Wealth and Investment ManagementGroup. The 37-story building is owned by a subsidiary of the Corporation which also leases approximately 388,000square feet to third parties. The Corporation also leases or owns a significant amount of space worldwide. As ofDecember 31, 2005, the Corporation and its subsidiaries owned or leased approximately 24,000 locations in all 50 states,the District of Columbia and 34 foreign countries.
Item 3. LEGAL PROCEEDINGS
See “Litigation and Regulatory Matters” in Note 13 of the Consolidated Financial Statements beginning on page 127for the Corporation’s litigation disclosure which is incorporated herein by reference.
Item 4. SUBMISSION OF MATTERS TO A VOTE OF SECURITY HOLDERS
There were no matters submitted to a vote of stockholders during the quarter ended December 31, 2005.
Item 4A. EXECUTIVE OFFICERS OF THE REGISTRANT
Pursuant to the Instructions to Form 10-K and Item 401(b) of Regulation S-K, the name, age and position of eachcurrent executive officer of the Corporation are listed below along with such officer’s business experience during the pastfive years. Officers are appointed annually by the Board of Directors at the meeting of directors immediately followingthe annual meeting of stockholders.
Amy Woods Brinkley, age 50, Global Risk Executive. Ms. Brinkley was named to her present position in April 2002.From July 2001 to April 2002, she served as Chairman, Credit Policy and Deputy Corporate Risk ManagementExecutive; and from August 1999 to July 2001, she served as President, Consumer Products. She first became an officerin 1979. She also serves as Global Risk Executive and a director of Bank of America, N.A., MBNA America Bank, N.A.,MBNA America (Delaware), N.A. and Bank of America, N.A. (USA).
Alvaro G. de Molina, age 48, Chief Financial Officer. Mr. de Molina was named to his present position in September2005. From April 2004 to September 2005, he served as President, Global Capital Markets and Investment Banking;from 2000 to April 2004, he served as Treasurer; and from 1998 to 2000, he served as Deputy Treasurer. He first becamean officer in 1989. He also serves as Chief Financial Officer and a director of Bank of America, N.A., MBNA AmericaBank, N.A., MBNA America (Delaware), N.A. and Bank of America, N.A. (USA).
Barbara J. Desoer, age 53, Global Technology, Service and Fulfillment Executive. Ms Desoer was named to herpresent position in August 2004. From July 2001 to August 2004, she served as President, Consumer Products; and fromSeptember 1999 to July 2001, she served as Director of Marketing. She first became an officer in 1977. She also serves asGlobal Technology, Service and Fulfillment Executive and a director of Bank of America, N.A., MBNA America Bank,N.A., MBNA America (Delaware), N.A. and Bank of America, N.A. (USA).
Kenneth D. Lewis, age 58, Chairman, Chief Executive Officer and President. Mr. Lewis was named Chief ExecutiveOfficer in April 2001, President in July 2004 and Chairman in February 2005. From April 2001 to April 2004, he servedas Chairman; from January 1999 to April 2004, he served as President; and from October 1999 to April 2001, he servedas Chief Operating Officer. He first became an officer in 1971. Mr. Lewis also serves as a director of the Corporation andas Chairman, Chief Executive Officer, President and a director of Bank of America, N.A., MBNA America Bank, N.A.,MBNA America (Delaware), N.A. and Bank of America, N.A. (USA).
Liam E. McGee, age 51, President, Global Consumer and Small Business Banking. Mr. McGee was named to hispresent position in August 2004. From August 2001 to August 2004, he served as President, Global Consumer Banking;from August 2000 to August 2001, he served as President, California; and from August 1998 to August 2000, he servedas President, Southern California. He first became an officer in 1990. He also serves as President, Global Consumer andSmall Business Banking and a director of Bank of America, N.A., MBNA America Bank, N.A., MBNA America(Delaware), N.A. and Bank of America, N.A. (USA).
Brian T. Moynihan, age 46, President, Global Wealth and Investment Management. Mr. Moynihan was named tohis present position in April 2004. Previously he held the following positions at FleetBoston Financial Corporation: from
9
1999 to April 2004, he served as Executive Vice President with responsibility for Brokerage and Wealth Managementfrom 2000, and Regional Commercial Financial Services and Investment Management from May 2003. He first becamean officer in 1993. He also serves as President, Global Wealth and Investment Management and a director of Bank ofAmerica, N.A., MBNA America Bank, N.A., MBNA America (Delaware), N.A. and Bank of America, N.A. (USA).
R. Eugene Taylor, age 58, Vice Chairman and President, Global Corporate and Investment Banking. Mr. Taylor wasnamed to his present position in July, 2005. From February 2005 to July 2005, he served as President, Global Businessand Financial Services; from August 2004 to February 2005, he served as President, Commercial Banking; from June2000 to August 2004, he served as President, Consumer and Commercial Banking; from February 2000 to June 2000, heserved as President, Central Region; and from October 1998 to June 2000, he served as President, West Region. He firstbecame an officer in 1970. He also serves as Vice-Chairman and President, Global Corporate and Investment Bankingand a director of Bank of America, N.A., MBNA America Bank, N.A., MBNA America (Delaware), N.A. and Bank ofAmerica, N.A. (USA).
10
PART II
Item 5. MARKET FOR REGISTRANT’S COMMON EQUITY AND RELATEDSTOCK HOLDER MATTERS
The principal market on which the Common Stock is traded is the New York Stock Exchange. The Common Stock isalso listed on the London Stock Exchange and the Pacific Stock Exchange, and certain shares are listed on the TokyoStock Exchange. The following table sets forth the high and low closing sales prices of the Common Stock on the NewYork Stock Exchange for the periods indicated:
Quarter High Low
Bank of America Corporation2004 first $41.38 $39.15
second 42.72 38.96third 44.98 41.81fourth 47.44 43.62
2005 first 47.08 43.66second 47.08 44.01third 45.98 41.60fourth 46.99 41.57
The above table has been adjusted to reflect the August 27, 2004 2-for-1 stock split.
As of March 13, 2006, there were 279,463 record holders of Common Stock. During 2004 and 2005, the Corporationpaid dividends on the Common Stock on a quarterly basis. The following table sets forth dividends paid per share ofCommon Stock for the periods indicated:
Quarter Dividend
2004 first $.40second .40third .45fourth .45
2005 first .45second .45third .50fourth .50
The above table has been adjusted to reflect the August 27, 2004 2-for-1 stock split.
For additional information regarding the Corporation’s ability to pay dividends, see “Government Supervision andRegulation – Distributions” and Note 15 of the Consolidated Financial Statements on page 136 which is incorporatedherein by reference.
For information on the Corporation’s equity compensation plans, see Note 17 of the Consolidated FinancialStatements on page 144 which is incorporated herein by reference.
See Note 14 of the Consolidated Financial Statements on page 134 for information on the monthly sharerepurchases activity for the three and twelve months ended December 31, 2005, 2004 and 2003, including total commonshares repurchased and announced programs, weighted average per share price and the remaining buy back authorityunder announced programs which is incorporated herein by reference.
The Corporation did not have any unregistered sales of its equity securities in fiscal year 2005.
Item 6. SELECTED FINANCIAL DATA
See Table 2 in the MD&A on page 23 and Table VII of the Statistical Financial Information on page 84 which areincorporated herein by reference.
11
Item 7. MANAGEMENT’S DISCUSSION AND ANALYSIS OF FINANCIAL CONDITION ANDRESULTS OF OPERATIONS
This Management’s Discussion and Analysis of Financial Condition and Results of Operations includes forward-looking statements. We have based these forward-looking statements on our current plans, expectations and beliefs aboutfuture events. In light of the risks, uncertainties and assumptions discussed under Item 1A. “Risk Factors” of this AnnualReport on Form 10-K and other factors discussed in this section, there are risks that our actual experience will differmaterially from the expectations and beliefs reflected in the forward-looking statements in this section and throughout thisreport. For more information regarding what constitutes a forward-looking statement, please refer to Item 1A. “RiskFactors.”
The Corporation, headquartered in Charlotte, North Carolina, operates in 29 states, the District of Columbia and 44foreign countries. The Corporation provides a diversified range of banking and nonbanking financial services andproducts domestically and internationally through four business segments: Global Consumer and Small BusinessBanking, Global Business and Financial Services, Global Capital Markets and Investment Banking, and Global Wealthand Investment Management.
At December 31, 2005, we had $1.3 trillion in assets and approximately 177,000 full-time equivalent employees.Notes to Consolidated Financial Statements referred to in Management’s Discussion and Analysis of Results ofOperations and Financial Condition are incorporated by reference into Management’s Discussion and Analysis of Resultsof Operations and Financial Condition. Certain prior period amounts have been reclassified to conform to current periodpresentation.
Restatement
As discussed in Notes 1 and 23 of the Consolidated Financial Statements, we are restating our historical financialstatements for the years 2004 and 2003, for the quarters in 2005 and 2004, and other selected financial data for theyears 2002 and 2001 (see Tables 2 and 3 on pages 23 and 25 for the restatements of Five-Year Summary of SelectedFinancial Data, and Supplemental Financial Data and Reconciliations to GAAP Financial Measures). Theserestatements and resulting revisions relate to the accounting treatment for certain derivative transactions under theStatement of Financial Accounting Standards (SFAS) No. 133, “Accounting for Derivative Instruments and HedgingActivities, as amended” (SFAS 133). The Corporation is presenting this restatement in its 2005 Annual Report on Form10-K.
The Corporation uses interest rate contracts and foreign exchange contracts in its Asset and Liability Management(ALM) process. Use of such derivatives enables us to minimize significant fluctuations in earnings caused by interestrate and currency rate volatility. The Corporation had applied hedge accounting for certain derivative transactions thatwe believe met the requirements of SFAS 133. The application of hedge accounting produced financial statement resultsthat were consistent with the economics of these transactions and our risk management activities. Hedge accountingreduces volatility in earnings by counterbalancing the changes in the hedged item and the derivative. As a result of arecent interpretation on the “shortcut” method for derivative instruments under SFAS 133, the Corporation undertook areview of all hedge accounting transactions, which was completed in the first quarter of 2006. Based on the review, wedetermined that certain hedges did not meet the requirements of SFAS 133. Since we could not apply hedge accountingfor those transactions, the derivative transactions have been marked to market through our Consolidated Statement ofIncome with no related offset for hedge accounting. Accordingly, changes in interest rates and currency rates whichimpact the fair value of derivative instruments have had a direct impact on our Net Income.
12
The following tables set forth the effect of the adjustments described above on Net Income for the years endedDecember 31, 2005, 2004, 2003, 2002 and 2001 and for the quarterly periods in 2005 and 2004. Although the year andfourth quarter of 2005 are not restated, this information was previously provided in the Corporation’s current report onForm 8-K filed on January 23, 2006, and therefore, is included as part of the restatement information.
Increase (Decrease) in Net Income(1)
Year Ended December 31(Dollars in millions) 2005(2) 2004 2003 2002 2001
(1) For presentation purposes, certain numbers have been rounded.(2) The Corporation provided unaudited financial information relating to 2005 in its current report on Form 8-K filed on January 23,
2006.
Increase (Decrease) in Quarterly Net Income(1, 2)
2005 2004(Dollars in millions) Fourth(3) Third Second First Fourth Third Second First
As Previously Reported Net income . . . . . . . . . . . $3,768 $4,127 $4,296 $4,695 $3,849 $3,764 $3,849 $2,681
(1) See Note 23 of the Consolidated Financial Statements for Restatement of Quarterly Financial Statements (unaudited).(2) For presentation purposes, certain numbers have been rounded.(3) The Corporation provided unaudited financial information relating to the fourth quarter of 2005 in its current report on Form 8-K
filed on January 23, 2006.
During the first quarter of 2006, the Corporation terminated certain derivatives used as economic hedges as part ofthe ALM process that did not qualify for SFAS 133 hedge accounting and entered into new derivative contracts to hedgecertain of its exposures to changes in interest rates and foreign currency rates. These new contracts are designated inhedging relationships and meet the requirement for SFAS 133 hedge accounting. Prior to the termination of theeconomic hedges noted above, the changes in fair value of such contracts were recorded in Other Income and had a directimpact on Net Income. As a result, we estimate that Net Income will be reduced by approximately $0.03 per share in thefirst quarter of 2006.
13
Effects of the Restatement
The following tables set forth the effects of the restatement relating to derivative transactions on major captionitems within our Consolidated Statement of Income for the years 2004 and 2003, and our Consolidated Balance Sheet asof December 31, 2004. Although the year and fourth quarter of 2005 are not restated, this information was previouslyprovided in the Corporation’s current report on Form 8-K filed on January 23, 2006, and therefore, is included as part ofthe restatement information.
Bank of America Corporation and Subsidiaries
Consolidated Statement of Income
Year Ended December 312005 2004 2003
(Dollars in millions, except per shareinformation)
(1) The Corporation provided unaudited financial information relating to 2005 in its current report on Form 8-K filed on January 23,2006.
The impact of the restatement on our Consolidated Statement of Income was to reverse previously applied hedgeaccounting for affected hedging relationships in the relevant periods. For derivative instruments previously accountedfor as fair value hedges, the net accruals for the derivatives were recorded to Net Interest Income, and net changes infair values of the derivative instruments as a result of changes in rates were recorded as basis adjustments to the hedgeditems, such as Loans and Leases, and Long-term Debt. As a result of the restatement, the previous accounting treatmentwas reversed (i.e., the net accruals recorded to Net Interest Income were reversed and there was no basis adjustment forthe hedged items), and the total changes in the fair values of the derivative instruments including interest accrualsettlements were recorded directly to Other Income. In addition, for derivative instruments that were previouslyaccounted for as cash flow hedges, the Corporation recorded accruals from the derivative instruments to Net InterestIncome and recorded net changes in the fair values of the derivatives, net-of-tax, to Accumulated Other ComprehensiveIncome (OCI). As a result of the restatement, the cash flow hedge effects were reversed from Accumulated OCI and NetInterest Income, and recorded in Other Income. Accordingly, Net Interest Income decreased $419 million, $834 millionand $959 million for 2005, 2004 and 2003, respectively. Other Income decreased $256 million in 2005, and increased$920 million and $879 million in 2004 and 2003.
The change in Other Income (included in Total Noninterest Income) after the restatement adjustments wasprimarily due to the effects of changes in rates in each respective year on the fair values of derivative instruments usedin the ALM process. These derivative instruments were primarily comprised of receive fixed interest rate swaps, longfutures and forward contracts, which generally increase in value when interest rates fall, and decrease in value wheninterest rates rise.
Gains on Sales of Debt Securities declined from the previously reported results by $399 million in the third quarterof 2004. The previously reported results did not recognize cash flow hedge losses upon sale of the underlying hedgedsecurities. This cash flow hedge utilized a forward purchase agreement to hedge the variability in cash flows from theanticipated purchase of securities. The Corporation subsequently sold the related securities and did not previouslyreclassify the loss on the forward purchase agreement from Accumulated OCI into income.
(1) The Corporation provided unaudited financial information relating to 2005 in its current report on Form 8-K filed on January 23,2006.
The impact of the restatement on our Consolidated Balance Sheet was to reverse fair value basis adjustments toitems that previously qualified as fair value hedged items such as Loans and Leases, and Long-term Debt. Additionally,changes in the fair value of derivative instruments that previously qualified for cash flow hedge accounting werereversed from Accumulated OCI and recorded in income. Tax effects of these adjustments impacted Accrued Expensesand Other Liabilities. Accordingly, as of December 31, 2005 and 2004, this resulted in an increase of $9 million and adecrease of $24 million in Loans and Leases, an increase in Accrued Expenses and Other Liabilities of $189 million and$347 million, a decrease in Long-term Debt of $490 million and $962 million, an increase in Retained Earnings of $347million and $767 million, and a decrease in Accumulated OCI of $38 million and $177 million.
The following tables set forth the effects of the restatement relating to derivative transactions on major captionitems within our Consolidated Statement of Income and our Consolidated Balance Sheet for the quarters in 2005 and2004. Although the year and fourth quarter of 2005 are not restated, this information was previously provided in theCorporation’s current report on Form 8-K filed on January 23, 2006, and therefore, is included as part of the restatementinformation.
See Note 23 of the Consolidated Financial Statements for restated quarterly financial statements.
Bank of America Corporation and Subsidiaries
Consolidated Statement of Income2005 Quarters
Fourth Third Second First
(Dollars in millions, except pershare information)
(1) The Corporation provided unaudited financial information relating to the fourth quarter of 2005 in its current report on Form 8-Kfiled on January 23, 2006.
15
Bank of America Corporation and Subsidiaries
Consolidated Statement of Income
2004 QuartersFourth Third Second First
(Dollars in millions, except pershare information)
Net Income volatility from the third quarter of 2004 to the second quarter of 2005 was primarily driven by theimpact of changes in interest rates on the fair value of derivative instruments which did not qualify for SFAS 133 hedgeaccounting treatment. As rates decreased in the third quarter of 2004 and the second quarter of 2005, the Corporation’sNet Income increased driven by increases in the fair value of these derivative instruments. As rates increased in the firstquarter of 2005, the Corporation’s Net Income decreased as the rise in rates adversely impacted the fair value of thederivative instruments.
(1) The Corporation provided unaudited financial information relating to the fourth quarter of 2005 in its current report on Form 8-Kfiled on January 23, 2006.
16
Bank of America Corporation and Subsidiaries
Consolidated Balance Sheet2004 Quarters
Fourth Third Second First
(Dollars in millions)
AsPreviouslyReported Restated
AsPreviouslyReported Restated
AsPreviouslyReported Restated
AsPreviouslyReported Restated
Loans and leases, net of allowancefor loan and lease losses . . . . . . . . . $ 513,211 $ 513,187 $ 502,916 $ 502,890 $ 489,714 $ 489,685 $369,888 $369,858
On June 30, 2005, we announced a definitive agreement to acquire all outstanding shares of MBNA Corporation(MBNA Merger), a leading provider of credit card and payment products, for approximately $35.0 billion in stock (85percent) and cash (15 percent). This transaction closed on January 1, 2006. Under the terms of the agreement, MBNAstockholders received 0.5009 of a share of our common stock plus $4.125 for each MBNA share of common stock.
On June 17, 2005, we announced a definitive agreement to purchase approximately nine percent of the stock ofChina Construction Bank (CCB) for $3.0 billion. Under this agreement, we made an initial purchase of CCB shares for$2.5 billion in August 2005 and an additional purchase of $500 million in October 2005, during CCB’s initial publicoffering. These shares are non-transferable until the third anniversary of the initial public offering. We also hold anoption that allows us to increase our interest in CCB to 19.9 percent over the next five years. CCB is the third largestcommercial bank in China based on total assets.
Effective for the third quarter dividend, our Board of Directors (the Board) increased the quarterly cash dividend 11percent from $0.45 to $0.50 per common share. In October 2005, the Board declared a fourth quarter cash dividendwhich was paid on December 23, 2005 to common shareholders of record on December 2, 2005. In January 2006, theBoard declared a quarterly cash dividend of $0.50 per common share payable on March 24, 2006 to shareholders ofrecord on March 3, 2006.
On October 15, 2004, we acquired 100 percent of National Processing, Inc. (NPC), for $1.4 billion in cash, creatingthe second largest merchant processor in the United States.
On April 1, 2004, we closed our merger with FleetBoston Financial Corporation (FleetBoston Merger). The mergerwas accounted for under the purchase method of accounting. Accordingly, results for 2004 include the impact ofFleetBoston for nine months of combined company results.
Economic Overview
In 2005, economic performance was strong, despite a near doubling in energy prices, persistent hikes in the FederalFunds rate and the destructive hurricanes in the second half of 2005. In the United States, real Gross Domestic Productrose a solid 3.6 percent. Global economic expansion was healthy, as robust growth in Asian nations was offset by weakeractivity in core European nations. In the U.S., consumer spending was particularly resilient to the higher energy pricesthat reduced real purchasing power. Rising employment and wages lifted personal income and financial wealth reachedan all-time high, while the rate of personal savings fell again. Following several years of robust increases in real estateactivity and housing values, real estate softened in the second half of 2005 and the volume of mortgage refinancingreceded. Heightened efficiencies generated sustained productivity gains that constrained costs of production andcontributed to record-breaking operating profits and cash flows. While business investment spending was strong andemployment gains firm, inventories remained lean. The strong business performance generated growth in businesslending and supported healthy credit quality. Although the higher energy prices pushed up headline inflation, coreinflation, which excludes the volatile food and energy prices, remained low. The Federal Reserve raised rates at everyFederal Open Market Committee meeting in 2005, lifting the Federal Funds rate to 4.25 percent at year-end. However,these rate hikes were widely anticipated, contributing to very low bond yields and a significantly flatter yield curve.
17
Performance Overview
Net Income totaled $16.5 billion, or $4.04 per diluted common share in 2005, increases of 18 percent and 11 percentfrom $13.9 billion, or $3.64 per diluted common share in 2004.
(1) Total revenue for the segments and All Other is on a fully taxable-equivalent (FTE) basis. For more information on a FTE basis, seeSupplemental Financial Data beginning on page 24.
Global Consumer and Small Business Banking
Net Income increased $1.2 billion, or 20 percent, to $7.2 billion in 2005. Driving the increase was the impact ofFleetBoston, which contributed to increases in Net Interest Income, Card Income and Service Charges. Also impactingthe increase in Net Income was higher Mortgage Banking Income driven by lower MSR impairment charges. Partiallyoffsetting these increases was higher Provision for Credit Losses and Noninterest Expense. For more information onGlobal Consumer and Small Business Banking, see page 28.
Global Business and Financial Services
Net Income increased $718 million, or 19 percent, to $4.6 billion in 2005. The increase was primarily due to higherNet Interest Income as Average Loans and Leases, and Average Deposits increased. Also driving the increase in NetIncome was higher other noninterest income, Service Charges and the impact of FleetBoston. Offsetting these increaseswere higher Noninterest Expense and a reduced benefit from Provision for Credit Losses. For more information onGlobal Business and Financial Services, see page 34.
Global Capital Markets and Investment Banking
Net Income decreased $188 million, or 10 percent, to $1.7 billion in 2005. The decrease was driven by lower trading-related Net Interest Income and Service Charges, and a reduced benefit from Provision for Credit Losses partially offsetby higher Trading Account Profits, Equity Investment Gains, and Investment and Brokerage Services Income. For moreinformation on Global Capital Markets and Investment Banking, see page 35.
Global Wealth and Investment Management
Net Income increased $783 million, or 49 percent, to $2.4 billion in 2005. The increase was due to higher NetInterest Income as we experienced increases in Average Deposits, and Average Loans and Leases driven by the impact ofFleetBoston. Also impacting the increase in Net Income was higher Investment and Brokerage Services Income.Partially offsetting these increases was higher Personnel Expense. Total assets under management increased $30.9billion to $482.4 billion at December 31, 2005. For more information on Global Wealth and Investment Management, seepage 38.
All Other
Net Income increased $20 million, or three percent, to $623 million in 2005. This increase was primarily a result ofan increase in Equity Investment Gains offset by a decrease in Gains on Sales of Debt Securities and Other Income.Other Income decreased primarily as a result of negative changes in the fair value of derivative instruments, which donot qualify for SFAS 133 hedge accounting, due to increasing rates during 2005. For more information on All Other, seepage 40.
18
Financial Highlights
Net Interest Income
Net Interest Income on a FTE basis increased $2.9 billion to $31.6 billion in 2005 compared to 2004. The primarydrivers of the increase were the FleetBoston Merger, organic growth in consumer (primarily credit card and homeequity) and commercial loans, higher domestic deposit levels and a larger ALM portfolio (primarily securities). Partiallyoffsetting these increases was the adverse impact of spread compression due to the flattening of the yield curve, whichcontributed to lower Net Interest Income. The net interest yield on a FTE basis declined 33 basis points (bps) to 2.84percent in 2005. This was primarily due to the adverse impact of an increase in lower-yielding, trading-related balancesand spread compression, which was partially offset by growth in core deposit and consumer loans. For more informationon Net Interest Income on a FTE basis, see Table I on page 80.
Noninterest Income increased $4.3 billion to $25.4 billion for 2005 compared to 2004, due to the following whichincludes the impact of FleetBoston:
• Service Charges grew $715 million driven by organic account growth.
• Investment and Brokerage Services increased $570 million due to increases in asset management fees and mutualfund fees.
• Mortgage Banking Income increased $391 million due to lower MSR impairment charges which were partiallyoffset by lower production income.
• Equity Investment Gains increased $1.2 billion, primarily in Principal Investing, as liquidity in the private equitymarkets increased.
• Card Income increased $1.2 billion due to increased interchange income and merchant discount fees driven bygrowth in debit and credit purchase volumes and the acquisition of NPC.
• Trading Account Profits increased $943 million due to increased customer activity driven by our strategicinitiative in Global Capital Markets and Investment Banking to expand business capabilities and opportunities,and the absence of a writedown of the Excess Spread Certificates (the Certificates) that occurred in the prior year.For more information on the Certificates, see Note 1 of the Consolidated Financial Statements.
• Other Income decreased $578 million primarily related to losses on derivative instruments used as economichedges in the ALM process that did not qualify for SFAS 133 hedge accounting.
Provision for Credit Losses
The Provision for Credit Losses increased $1.2 billion to $4.0 billion in 2005 with credit card being the primarydriver of the increase. Consumer credit card net charge-offs increased $1.3 billion from 2004 to $3.7 billion with anestimated $578 million related to the increase in bankruptcy filings prior to the effective date of the new bankruptcylegislation enacted in the fourth quarter of 2005. We estimate that approximately 70 percent of these bankruptcy-relatedcharge-offs represent acceleration from 2006 and were provided for previously. Also impacting credit card net charge-offsand the Provision for Credit Losses were organic growth and seasoning of the portfolio, the impact of the FleetBostonportfolio and new advances on accounts for which previous loan balances were sold to the securitization trusts. Theprovision also increased as the rate of credit quality improvement slowed in the commercial portfolio and a $50 millionreserve was established for estimated losses associated with Hurricane Katrina. Partially offsetting these increases wasa reduction in the reserves of $250 million due to reduced uncertainties resulting from the completion of credit-relatedintegration activities for FleetBoston.
19
For more information on credit quality, see Credit Risk Management beginning on page 49.
Gains on Sales of Debt Securities
Gains on Sales of Debt Securities in 2005 were $1.1 billion compared to $1.7 billion in 2004. For more information onGains on Sales of Debt Securities, see Market Risk Management beginning on page 65.
Noninterest Expense increased $1.7 billion to $28.7 billion in 2005 compared to 2004, primarily due to the impact ofFleetBoston and increases in personnel-related costs. Pre-tax cost savings from the FleetBoston Merger included in theabove were $909 million in 2004 and $1.9 billion in 2005, which exceeded the $1.6 billion estimate in the October 2003FleetBoston Merger announcement.
Income Tax Expense
Income Tax Expense was $8.0 billion in 2005, reflecting an effective tax rate of 32.7 percent. The effective tax ratewas lower than 2004 primarily as a result of a tax benefit of $70 million related to the special one-time deductionassociated with the repatriation of certain foreign earnings under the American Jobs Creation Act of 2004. In 2004,Income Tax Expense was $7.0 billion, reflecting an effective tax rate of 33.3 percent. For more information on IncomeTax Expense, see Note 18 of the Consolidated Financial Statements.
20
Balance Sheet Analysis
Table 1
Selected Balance Sheet DataDecember 31 Average Balance
(Dollars in millions) 20052004
(Restated) 20052004
(Restated)
AssetsFederal funds sold and securities purchased under agreements to
Total liabilities and shareholders’ equity . . . . . . . $1,291,803 $1,110,432 $1,269,892 $1,044,631
Balance Sheet Overview
At December 31, 2005, Total Assets were $1.3 trillion, an increase of $181.4 billion, or 16 percent, fromDecember 31, 2004. Average Total Assets in 2005 increased $225.3 billion, or 22 percent, from 2004. Growth in TotalAssets (both period end and average balances) in 2005 was attributable to increases in various line items primarilydriven by an increase in trading-related activity due to the strategic growth initiative, growth in the ALM portfolio andgrowth in Loans and Leases. Average Total Assets also increased due to the impact of the FleetBoston Merger.
At December 31, 2005, Total Liabilities were $1.2 trillion, an increase of $180.1 billion, or 18 percent, fromDecember 31, 2004. Average Total Liabilities in 2005 increased $210.2 billion, or 22 percent, from 2004. Growth in TotalLiabilities (both period end and average balances) in 2005 was primarily due to increases in trading-related liabilitiesdue to the strategic growth initiative, increase in wholesale funding and organic growth in core deposits. Average TotalLiabilities also increased due to the impact of the FleetBoston Merger.
Federal Funds Sold and Securities Purchased under Agreements to Resell
The Federal Funds Sold and Securities Purchased under Agreements to Resell average balance increased $40.2billion to $169.1 billion in 2005 from activities in the trading businesses as a result of expanded trading activities relatedto the strategic initiative and to meet a variety of customers’ needs.
Trading Account Assets
Our Trading Account Assets consist primarily of fixed income securities (including government and corporate debt),equity and convertible instruments. The average balance increased $28.9 billion to $133.5 billion in 2005, which was dueto growth in client-driven market-making activities in interest rate, credit and equity products, and an increase inproprietary trading activities. For additional information, see Market Risk Management beginning on page 65.
Securities
AFS Securities include fixed income securities such as mortgage-backed securities, foreign debt, asset-backedsecurities, municipal debt, equity instruments, U.S. Government agencies and corporate debt. We use the AFS portfolio
21
primarily to manage interest rate risk, liquidity risk and regulatory capital, and to take advantage of market conditionsthat create more economically attractive returns on these investments. The average balance in the AFS portfolio grew by$70.0 billion from 2004 primarily due to the reinvestment of available liquidity and as part of our ALM strategy. Foradditional information, see Market Risk Management beginning on page 66.
Loans and Leases, Net of Allowance for Loan and Lease Losses
Average Loans and Leases, net of allowance for loan and lease losses, were $528.8 billion in 2005, an increase of 14percent from 2004. The increase of $40.0 billion in the consumer loan and lease portfolio and $24.6 billion in thecommercial loan and lease portfolio was primarily due to organic loan growth. Average Loans and Leases, net ofallowance for loan and lease losses, also increased due to the impact of the FleetBoston Merger. For a more detaileddiscussion of the loan portfolio and the allowance for credit losses, see Credit Risk Management beginning on page 49,and Notes 7 and 8 of the Consolidated Financial Statements.
Deposits
Average Deposits increased $80.9 billion to $632.4 billion in 2005 compared to 2004 due to a $46.3 billion increase inaverage domestic interest-bearing deposits and a $24.1 billion increase in average noninterest-bearing depositsprimarily due to organic growth including the impact of FleetBoston. We categorize our deposits as core or market-baseddeposits. Core deposits are generally customer-based and represent a stable, low-cost funding source that usually reactsmore slowly to interest rate changes than market-based deposits. Core deposits include savings, NOW and moneymarket accounts, consumer CDs and IRAs, and noninterest-bearing deposits. Core deposits exclude negotiable CDs,public funds, other domestic time deposits and foreign interest-bearing deposits. Average core deposits increased $69.5billion to $563.6 billion in 2005, a 14 percent increase from the prior year. The increase was distributed betweenconsumer CDs, noninterest-bearing deposits, NOW and money market deposits, and savings. Average market-baseddeposit funding increased $11.4 billion to $68.8 billion in 2005 compared to 2004. The increase was primarily due to a$10.5 billion increase in foreign interest-bearing deposits.
Federal Funds Purchased and Securities Sold under Agreements to Repurchase
The Federal Funds Purchased and Securities Sold under Agreements to Repurchase average balance increased$65.5 billion to $230.8 billion in 2005 as a result of expanded trading activities related to the strategic initiative andinvestor client activities.
Trading Account Liabilities
Our Trading Account Liabilities consist primarily of short positions in fixed income securities (including governmentand corporate debt), equity and convertible instruments. The average balance increased $22.4 billion to $57.7 billion in2005, which was due to growth in client-driven market-making activities in interest rate, credit and equity products, andan increase in proprietary trading activities. For additional information, see Market Risk Management beginning onpage 66.
Commercial Paper and Other Short-term Borrowings
Commercial Paper and Other Short-term Borrowings provide a funding source to supplement Deposits in our ALMstrategy. The average balance increased $33.3 billion to $95.7 billion in 2005 due to funding needs associated with thegrowth of core asset portfolios, primarily Loans and Leases, and AFS Securities.
22
Table 2
Five-Year Summary of Selected Financial Data(1)
(Dollars in millions, except per share information) 20052004
(1) As a result of the adoption of SFAS 142 on January 1, 2002, we no longer amortize Goodwill. Goodwill amortization expense was$662 million in 2001.
(2) Return on average tangible common shareholders’ equity equals net income available to common shareholders plus amortization ofintangibles, divided by average common shareholders’ equity less goodwill, core deposit intangibles and other intangibles.
MBNA Merger Overview
Pursuant to the Agreement and Plan of Merger, dated June 30, 2005, by and between the Corporation and MBNA(the MBNA Merger Agreement), the Corporation acquired 100 percent of the outstanding stock of MBNA on January 1,2006. The MBNA Merger was a tax-free merger for the Corporation. The acquisition expands the Corporation’s customerbase and its opportunity to deepen customer relationships across the full breadth of the company by deliveringinnovative deposit, lending and investment products and services to MBNA’s customer base. Additionally, theacquisition allows the Corporation to significantly increase its affinity relationships through MBNA’s credit cardoperations. MBNA’s results of operations will be included in the Corporation’s results beginning January 1, 2006. Thetransaction will be accounted for under the purchase method of accounting. The purchase price has been allocated to theassets acquired and the liabilities assumed based on their estimated fair values at the MBNA Merger date.
Under the terms of the MBNA Merger Agreement, MBNA stockholders received 0.5009 of a share of theCorporation’s common stock plus $4.125 for each MBNA share of common stock. As provided by the MBNA Merger
23
Agreement, approximately 1.3 billion shares of MBNA common stock were exchanged for approximately 631 millionshares of the Corporation’s common stock. At the date of the MBNA Merger, this represented approximately 16 percentof the Corporation’s outstanding common stock. MBNA shareholders also received cash of $5.2 billion. On November 3,2005, MBNA redeemed all shares of its 71⁄2% Series A Cumulative Preferred Stock and Series B Adjustable RateCumulative Preferred Stock, in accordance with the terms of the MBNA Merger Agreement.
Supplemental Financial Data
Table 3 provides a reconciliation of the supplemental financial data mentioned below with financial measuresdefined by accounting principles generally accepted in the United States (GAAP). Other companies may define orcalculate supplemental financial data differently.
Operating Basis Presentation
In managing our business, we may at times look at performance excluding certain non-recurring items. Forexample, as an alternative to Net Income, we view results on an operating basis, which represents Net Income excludingMerger and Restructuring Charges. The operating basis of presentation is not defined by GAAP. We believe that theexclusion of Merger and Restructuring Charges, which represent events outside our normal operations, provides ameaningful year-to-year comparison and is more reflective of normalized operations.
Net Interest Income—FTE Basis
In addition, we view Net Interest Income and related ratios and analysis (i.e. efficiency ratio, net interest yield andoperating leverage) on a FTE basis. Although this is a non-GAAP measure, we believe managing the business with NetInterest Income on a FTE basis provides a more accurate picture of the interest margin for comparative purposes. Toderive the FTE basis, Net Interest Income is adjusted to reflect tax-exempt income on an equivalent before-tax basiswith a corresponding increase in Income Tax Expense. For purposes of this calculation, we use the federal statutory taxrate of 35 percent. This measure ensures comparability of Net Interest Income arising from taxable and tax-exemptsources.
Performance Measures
As mentioned above, certain performance measures including the efficiency ratio, net interest yield, and operatingleverage utilize Net Interest Income (and thus Total Revenue) on a FTE basis. The efficiency ratio measures the costsexpended to generate a dollar of revenue, and net interest yield evaluates how many basis points we are earning over thecost of funds. Operating leverage measures the total percentage revenue growth minus the total percentage expensegrowth for the corresponding period. During our annual integrated planning process, we set operating leverage andefficiency targets for the Corporation and each line of business. Targets vary by year and by business and are based on avariety of factors, including: maturity of the business, investment appetite, competitive environment, market factors,and other items (e.g. risk appetite). The aforementioned performance measures and ratios, earnings per common share(EPS), return on average assets, return on average common shareholders’ equity and dividend payout ratio, as well asthose measures discussed more fully below, are presented in Table 3.
Return on Average Common Shareholders’ Equity, Return on Average Tangible Common Shareholders’Equity and Shareholder Value Added
We also evaluate our business based upon return on average common shareholders’ equity (ROE), return on averagetangible common shareholders’ equity (ROTE) and shareholder value added (SVA) measures. ROE, ROTE and SVAutilize non-GAAP allocation methodologies. ROE measures the earnings contribution of a unit as a percentage of theShareholders’ Equity allocated to that unit. ROTE measures the earnings contribution of a unit as a percentage of theShareholders’ Equity reduced by Goodwill, Core Deposit Intangibles and Other Intangibles, allocated to that unit. SVAis defined as cash basis earnings on an operating basis less a charge for the use of capital. For more information, seeBasis of Presentation beginning on page 27. These measures are used to evaluate our use of equity (i.e. capital) at theindividual unit level and are integral components in the analytics for resource allocation. Using SVA as a performancemeasure places specific focus on whether incremental investments generate returns in excess of the costs of capitalassociated with those investments. Investments and initiatives are analyzed using SVA during the annual planningprocess for maximizing allocation of corporate resources. In addition, profitability, relationship and investment modelsall use ROE and SVA as key measures to support our overall growth goal.
24
Table 3Supplemental Financial Data and Reconciliations to GAAP Financial Measures
(Dollars in millions, except per share information) 20052004
(1) Operating basis excludes Merger and Restructuring Charges. Merger and Restructuring Charges were $412 million and $618 million in 2005 and2004. Merger and Restructuring Charges in 2001 represented Provision for Credit Losses of $395 million and Noninterest Expense of $1.3 billion, bothof which were related to the exit of certain consumer finance businesses.
(2) As a result of the adoption of SFAS 142 on January 1, 2002, we no longer amortize Goodwill. Goodwill amortization expense was $662 million in 2001.(3) Operating leverage (combined basis) includes the results of FleetBoston for the year ended December 31, 2004 and 2003 on a pro forma basis. In 2004,
operating leverage was impacted by the costs to integrate FleetBoston; however, in 2005, operating leverage benefited from FleetBoston Merger’s costsavings.
n/a = not available
25
Core Net Interest Income—Managed Basis
In managing our business, we review core net interest income on a managed basis, which adjusts reported NetInterest Income on a FTE basis for the impact of trading-related activities and revolving securitizations. As discussed inthe Global Capital Markets and Investment Banking business segment section beginning on page 35, we evaluate ourtrading results and strategies based on total trading-related revenue, calculated by combining trading-related NetInterest Income with Trading Account Profits. We also adjust for loans that we originated and sold into revolving creditcard, home equity line and commercial loan securitizations. Noninterest Income, rather than Net Interest Income andProvision for Credit Losses, is recorded for assets that have been securitized as we are compensated for servicing thesecuritized assets and record servicing income and gains or losses on securitizations, where appropriate. An analysis ofcore net interest income—managed basis, core average earning assets—managed basis and core net interest yield onearning assets—managed basis, which adjusts for the impact of these two non-core items from reported Net InterestIncome on a FTE basis, is shown below.
Core net interest income on a managed basis increased $3.3 billion for 2005. This increase was driven by the impactof the FleetBoston Merger, organic growth in consumer (primarily credit card and home equity) and commercial loans,higher domestic deposit levels and a larger ALM portfolio (primarily securities). Partially offsetting these increases wasthe adverse impact of spread compression due to the flattening of the yield curve.
Core average earning assets on a managed basis increased $132.8 billion primarily due to higher ALM levels(primarily securities) and higher levels of consumer loans (primarily home equity and credit card). The increases in theseassets were due to organic growth as well as the impact of the FleetBoston Merger.
The core net interest yield on a managed basis decreased 24 bps as a result of the impact of spread compression dueto flattening of the yield curve and a larger ALM portfolio partially offset by higher levels of core deposits and consumerloans.
Business Segment Operations
Segment Description
The Corporation reports the results of its operations through four business segments: Global Consumer and SmallBusiness Banking, Global Business and Financial Services, Global Capital Markets and Investment Banking, and GlobalWealth and Investment Management. During the third quarter of 2005, our operations in Mexico were realigned and arenow included in the results of Global Business and Financial Services, rather than Global Capital Markets andInvestment Banking. Also during the third quarter of 2005, we announced the future combination of Global Business andFinancial Services and Global Capital Markets and Investment Banking that was effective on January 1, 2006. This new
26
segment is called Global Corporate and Investment Banking. This new segment will enable us to more effectivelyleverage the universal bank model in servicing our business clients. In the universal bank model, teams of consumer,commercial and investment bankers work together to provide all clients, regardless of size, the right combination ofproducts and services to meet their needs. All Other consists primarily of Equity Investments, the residual impact of theallowance for credit losses process, Merger and Restructuring Charges, intersegment eliminations, and the results ofcertain consumer finance and commercial lending businesses that are being liquidated. All Other also includes certainamounts associated with the ALM process, including the impact of funds transfer pricing allocation methodologies,amounts associated with the change in the value of derivatives used as economic hedges of interest rate and foreignexchange rate fluctuations that do not qualify for SFAS 133 hedge accounting treatment, gains or losses on sales ofwhole mortgage loans, and Gains on Sales of Debt Securities. For more information on All Other, see page 40.
Basis of Presentation
We prepare and evaluate segment results using certain non-GAAP methodologies and performance measures manyof which are discussed in Supplemental Financial Data on page 24. We begin by evaluating the operating results of thebusinesses, which by definition excludes Merger and Restructuring Charges. The segment results also reflect certainrevenue and expense methodologies, which are utilized to determine operating income. The Net Interest Income of thebusiness segments includes the results of a funds transfer pricing process that matches assets and liabilities withsimilar interest rate sensitivity and maturity characteristics. Net Interest Income also reflects an allocation of NetInterest Income generated by assets and liabilities used in our ALM process. The results of the business segments willfluctuate based on the performance of corporate ALM activities. The restatement impact to Net Interest Income,associated with the economic hedges that did not qualify for SFAS 133 hedge accounting, was included in All Other, andwas not allocated to the business segments.
Certain expenses not directly attributable to a specific business segment are allocated to the segments based onpre-determined means. The most significant of these expenses include data processing costs, item processing costs andcertain centralized or shared functions. Data processing costs are allocated to the segments based on equipment usage.Item processing costs are allocated to the segments based on the volume of items processed for each segment. The costsof certain centralized or shared functions are allocated based on methodologies which reflect utilization.
Equity is allocated to the business segments using a risk-adjusted methodology incorporating each unit’s credit,market and operational risk components. The nature of these risks is discussed further beginning on page 49. ROE iscalculated by dividing Net Income by allocated equity. SVA is defined as cash basis earnings on an operating basis less acharge for the use of capital (i.e. equity). Cash basis earnings on an operating basis is defined as Net Income adjusted toexclude Merger and Restructuring Charges, and Amortization of Intangibles. The charge for capital is calculated bymultiplying 11 percent (management’s estimate of the shareholders’ minimum required rate of return on capitalinvested) by average total common shareholders’ equity at the corporate level and by average allocated equity at thebusiness segment level. Average equity is allocated to the business level using a methodology identical to that used inthe ROE calculation. Management reviews the estimate of the rate used to calculate the capital charge annually. TheCapital Asset Pricing Model is used to estimate our cost of capital.
See Note 20 of the Consolidated Financial Statements for additional business segment information, selectedfinancial information for the business segments and reconciliations to consolidated Total Revenue and Net Incomeamounts.
27
Global Consumer and Small Business Banking
The strategy of Global Consumer and Small Business Banking is to attract, retain and deepen customerrelationships. We achieve this strategy through our ability to offer a wide range of products and services through afranchise that stretches coast to coast through 29 states and the District of Columbia. We serve more than 38 millionconsumer and small business relationships utilizing our network of 5,873 banking centers, 16,785 domestic brandedATMs, and telephone and Internet channels. Within Global Consumer and Small Business Banking, our most significantproduct groups are Card Services, Consumer Real Estate and Consumer Deposit and Debit Products.
(1) Includes Credit Card Income of $3,847 million and $3,127 million for 2005 and 2004, and Debit Card Income of $1,629 million and$1,232 million for 2005 and 2004.
In 2005, Net Interest Income increased $1.1 billion, or seven percent. Growth in deposits, a low cost source offunding, positively impacted Net Interest Income. Average Deposits increased $22.6 billion, or eight percent, driven bythe impact of FleetBoston customers, deepening existing relationships and our focus on attracting new customers.Partially offsetting this growth was the migration of account balances of $28.1 billion from Global Consumer and SmallBusiness Banking to Global Wealth and Investment Management. Net Interest Income was also positively impacted bythe $21.9 billion, or 18 percent, increase in Average Loans and Leases. This increase was driven by higher averagebalances on home equity loans and lines of credit and average held credit card outstandings. The growth in held creditcard outstandings was due to the impact of FleetBoston, increases in purchase volumes, the addition of more than5 million new accounts primarily through our branch network and direct marketing programs, and new advances onaccounts for which previous loan balances were sold to the securitization trusts.
Noninterest Income increased $2.6 billion, or 28 percent, in 2005. The increase was primarily due to increases of$1.1 billion, or 26 percent, in Card Income, $667 million, or 15 percent, in Service Charges and $423 million in MortgageBanking Income. Card Income increased mainly due to higher purchase volumes for credit and debit cards, the impact ofthe NPC acquisition in the fourth quarter of 2004, and increases in average managed credit card outstandings. Theincreases in card purchase volumes and average managed credit card outstandings were due to continued growth in ourcard business as we more effectively leveraged our branch network. The increase in Service Charges was due primarily
28
to the growth in new accounts. Mortgage Banking Income increased primarily due to a $400 million decrease in theimpairment of MSRs. Also impacting these increases was the impact of FleetBoston.
The Provision for Credit Losses increased $938 million, or 28 percent, to $4.3 billion in 2005 mainly due to creditcard. For further discussion of the increased Provision for Credit Losses related to credit card, see the following section,Card Services.
Noninterest Expense grew $885 million, or seven percent in 2005. The majority of the increase was due to theimpact of FleetBoston and NPC.
Card Services
Card Services, which excludes debit cards, provides a broad offering of credit cards to an array of customersincluding consumers and small businesses. Our products include traditional credit cards, and a variety of co-brandedand affinity card products. We also provide processing services for merchant card receipts, a business where we are amarket leader, due in part to our acquisition of NPC during the fourth quarter of 2004.
We evaluate our Card Services business on both a held and managed basis (a non-GAAP measure). Managed basistreats securitized loan receivables as if they were still on the balance sheet and presents the earnings on the sold loanreceivables as if they were not sold. We evaluate credit card operations on a managed basis as the receivables that havebeen securitized are subject to the same underwriting standards and ongoing monitoring as the held loans. The creditperformance of the managed portfolio is important to understanding the results of card operations.
29
The following table reconciles the credit card portfolio on a held basis to a managed basis to reflect the impact ofsecuritizations. For assets that have been securitized, we record Noninterest Income, rather than Net Interest Incomeand Provision for Credit Losses, as we are compensated for servicing income and gains or losses on securitizations. In asecuritization, the credit card receivables, not the ongoing relationships, are sold to the trust. After the revolving periodof the securitization, assuming no new securitizations, the newly generated credit card receivables arising from theserelationships are recorded on our balance sheet. This has the effect of increasing Loans and Leases and increasing NetInterest Income and the Provision for Credit Losses (including net charge-offs), with a reduction in Noninterest Income.
Strong credit card growth drove Card Services revenue in 2005. Held credit card revenue increased $1.4 billion, or19 percent, to $8.9 billion. Contributing to this increase was the $701 million increase in held Net Interest Income, dueto a $10.6 billion, or 24 percent, increase in average held credit card outstandings. The increase in average held creditcard outstandings was due to the impact of FleetBoston, increases in purchase volumes, the addition of more than5 million new accounts primarily through our branch network and direct marketing programs, and new advances onaccounts for which previous loan balances were sold to the securitization trusts.
Also driving Card Services held revenue was an increase in Noninterest Income of $708 million, or 22 percent, in2005. The increase resulted from higher merchant discount fees, interchange fees, cash advance fees and late fees.Merchant discount fees increased $418 million primarily due to the acquisition of NPC. Interchange fees increased $87million mainly due to a $10.4 billion, or 13 percent, increase in consumer credit card purchase volumes. Cash advancefees increased $64 million due to higher balance transfers. Late fees increased $62 million in 2005.
30
Held Provision for Credit Losses increased $887 million to $4.0 billion in 2005, driven primarily by higher netcharge-offs. Consumer card net charge-offs were $3.7 billion, or 6.76 percent in 2005 compared to $2.3 billion, or 5.31percent in 2004. Higher credit card net charge-offs were driven by an increase in bankruptcy related charge-offs of $578million as card customers “rushed to file” ahead of the new bankruptcy law. Also impacting net charge-offs were organicportfolio growth and seasoning, increases effective in 2004 in credit card minimum payment requirements, the impact ofFleetBoston and new advances on accounts for which previous loan balances were sold to the securitization trusts. Weestimate that approximately 70 percent of the increased bankruptcy-related charge-offs represent acceleration from2006. Excluding bankruptcy-related charge-offs representing acceleration from 2006 and charge-offs associated with the2004 changes in credit card minimum payment requirements that were provided for in late 2004, the increased netcharge-offs were the primary driver of the higher Provision for Credit Losses. In addition, the Provision for Credit Losseswas impacted by new advances on accounts for which previous loan balances were sold to the securitization trusts, andthe establishment of reserves in 2005 for additional changes made in late 2005 in credit card minimum paymentrequirements.
Managed card revenue increased $1.3 billion, or 15 percent, to $9.4 billion in 2005, driven by a $474 million, or ninepercent, increase in managed Net Interest Income, and a $778 million, or 25 percent increase, in managed NoninterestIncome. Average managed credit card outstandings were $59.0 billion in 2005 compared to $50.3 billion in 2004. Theimpact of FleetBoston and organic growth drove the increases in 2005.
Managed consumer credit card net losses were $4.1 billion, or 6.92 percent of total average managed credit cardloans in 2005, compared to $2.8 billion, or 5.62 percent in 2004. Higher managed credit card net losses were driven by anincrease in bankruptcy net losses resulting from the change in the bankruptcy law, continued growth and seasoning,increases effective in 2004 in credit card minimum payment requirements and the impact of FleetBoston. For moreinformation, see Credit Risk Management beginning on page 49.
Consumer Real Estate
Consumer Real Estate generates revenue by providing an extensive line of mortgage products and services tocustomers nationwide. Consumer Real Estate products are available to our customers through a retail network ofpersonal bankers located in 5,873 banking centers, dedicated sales account executives in over 150 locations and througha dedicated sales force offering our customers direct telephone and online access to our products. Additionally, we serveour customers through a partnership with more than 6,600 mortgage brokers in 49 states. The mortgage productofferings for home purchase and refinancing needs include fixed and adjustable rate loans, and home equity lines ofcredit. To manage this portfolio, these products are either sold into the secondary mortgage market to investors whileretaining Bank of America customer relationships or are held on our balance sheet for ALM purposes.
Consumer Real Estate is managed with a focus on its two primary businesses, first mortgage and home equity. Thefirst mortgage business includes the origination, fulfillment and servicing of first mortgage loan products. Servicingactivities primarily include collecting cash for principal, interest and escrow payments from borrowers, and accountingfor and remitting principal and interest payments to investors. Servicing income includes ancillary income derived inconnection with these activities, such as late fees. The home equity business includes lines of credit and secondmortgages. These two businesses provide us with a business model that meets customer real estate borrowing needs invarious interest rate cycles.
Total revenue for the Consumer Real Estate business increased $558 million to $3.2 billion in 2005. The followingtable shows the Global Consumer and Small Business Banking revenue components of the Consumer Real Estatebusiness.
(1) For more information, see the following Mortgage Banking Income table.
31
Net Interest Income decreased $102 million primarily driven by the impact of spread compression due to flatteningof the yield curve and the $2.3 billion decrease in average residential first mortgage balances. This decrease waspartially offset by higher average balances in the home equity portfolio, which grew $11.2 billion, or 31 percent, to $47.7billion which was attributable to account growth and larger line sizes resulting from enhanced product offerings, theexpanding home equity market and the impact of FleetBoston.
In 2005, home equity average balances across all business lines grew $18.8 billion, or 42 percent, to $63.9 billion andhome equity production improved $15.3 billion, or 27 percent, to $72.0 billion compared to 2004.
In 2005, there were no Trading Account Profits compared to a loss of $349 million in 2004, related to theCertificates. Effective June 1, 2004, the Certificates were converted to MSRs. Prior to the conversion, changes in thevalue of the Certificates, MSRs and derivatives used for risk management were recognized as Trading Account Profits.In 2004, Trading Account Profits included $342 million of downward adjustments for changes to valuation assumptionsand prepayment adjustments.
Mortgage Banking Income increased $423 million to $1.0 billion in 2005. The following summarizes the componentsof Mortgage Banking Income which include production income from loans sold in the secondary market and servicingincome that reflects the performance of the servicing portfolio.
(1) Includes $(14) million and $2 million related to hedge ineffectiveness of cash flow hedges on our mortgage warehouse for 2005 and2004.
(2) Represents derivative hedge losses of $124 million under SFAS 133, offset by an increase in the value of the MSRs of $291 millionfor 2005, and derivative hedge gains of $228 million offset by a decrease in the value of the MSRs of $210 million for 2004. Foradditional information on MSRs, see Note 9 of the Consolidated Financial Statements.
(3) Net losses on derivatives used as economic hedges of MSRs not designated as SFAS 133 hedges.(4) Includes revenue for mortgage services provided to other segments that are eliminated in consolidation (in All Other) of $207
million and $175 million for 2005 and 2004.
Production for residential first mortgages, within Global Consumer and Small Business Banking, was $74.7 billionin 2005 compared to $80.2 billion in 2004, a decrease of seven percent. In 2005, production income decreased $91 millionto $674 million due to lower production volume and margin compression. The volume reduction resulted in lower loansales to the secondary market in 2005 of $65.1 billion, an eight percent decrease from 2004.
Across all segments, residential first mortgage production was $86.8 billion in 2005 compared to $87.5 billion in2004. Of the volume across all segments during 2005, $60.3 billion was originated through retail channels, and $26.5billion was originated through the wholesale channel. This compares to $57.6 billion and $30.0 billion during 2004.Refinance activity in 2005 was approximately 49 percent of the production compared to 57 percent in 2004.
The Consumer Real Estate servicing portfolio includes originated and retained residential mortgages, loans servicedfor others and home equity loans. The servicing portfolio at December 31, 2005 was $368.4 billion, $35.9 billion higherthan December 31, 2004, driven primarily by production, home equity account growth and lower prepayment rates.
Net servicing income rose $514 million in 2005, primarily driven by a $400 million decrease in impairment of MSRs.Impairment charges in 2004 included a $261 million adjustment for changes in valuation assumptions and prepaymentadjustments to align with changing market conditions and customer behavioral trends.
32
As of December 31, 2005, the MSR balance was $2.7 billion, an increase of $300 million, or 13 percent, fromDecember 31, 2004. This value represented 122 bps of the related unpaid principal balance, a three percent increasefrom December 31, 2004. The following table outlines our MSR statistical information:
(1) Excludes MSRs in Global Capital Markets and Investment Banking at December 31, 2005 and 2004 of $148 million and $123million.
(2) Represents the portion of our servicing portfolio for which a MSR asset has been recorded.
MSRs are accounted for at the lower of cost or market with impairment recognized as a reduction to MortgageBanking Income. A combination of derivatives and AFS securities (e.g. mortgage-backed securities) is utilized to hedgethe changes in value associated with the MSRs. At December 31, 2005, $2.3 billion of MSRs were hedged using a SFAS133 strategy and $250 million of MSRs were economically hedged using AFS securities. During 2005, Net InterestIncome included $18 million on these AFS securities. At December 31, 2005, the unrealized loss on AFS securities usedto economically hedge the MSRs was $29 million compared to an unrealized gain of $21 million at December 31, 2004.For more information on MSRs, see Notes 1 and 9 of the Consolidated Financial Statements.
Consumer Deposit and Debit Products
Consumer Deposit and Debit Products provides a comprehensive range of products to consumers and smallbusinesses. Our products include traditional savings accounts, money market savings accounts, CDs and IRAs, regularand interest-checking accounts, debit cards and a variety of business checking options.
In 2005, we added approximately 2.3 million net new retail checking accounts and 1.9 million net new retail savingsaccounts. This growth resulted from continued improvement in sales and service results in the Banking Center Channel,the introduction of new products, the addition of 99 new stores and the impact of FleetBoston. In the FleetBostonfranchise, we opened 431,000 net new retail checking and 348,000 net new retail savings accounts since the FleetBostonMerger on April 1, 2004.
Consumer deposit products provide a relatively stable and inexpensive source of liquidity. We earn net interestspread revenues from investing this liquidity in earning assets through client facing lending activity and our ALMprocess. The revenue streams from these activities are allocated to our deposit products using our funds transfer pricingprocess which takes into account the interest rates and maturity characteristics of the deposits. Deposits also generateaccount fees while debit cards generate interchange income. The following table shows the components of Total Revenuefor Consumer Deposit and Debit Products.
Total deposit and debit revenue grew $2.5 billion, or 20 percent, in 2005. Driving this growth was an increase of $1.4billion, or 20 percent, in Net Interest Income resulting from higher levels of deposits. Also impacting the growth in NetInterest Income was our pricing strategy and the positive impact of the FleetBoston Merger.
Deposit service charges increased $665 million, or 15 percent, in 2005. The increase was primarily due to the growthof new accounts across our franchise and the impact of the FleetBoston Merger.
33
Debit card income, which is included in Card Income on the Consolidated Statement of Income, increased $397million, or 32 percent, in 2005. Driving the increase was growth in transaction activity as purchase volumes increased 29percent due to new accounts, growth in average ticket size and the positive impact of the FleetBoston Merger, as well ashigher interchange rates on debit card transactions.
Global Business and Financial Services
Global Business and Financial Services serves mid-sized domestic and international business clients providingfinancial services, specialized industry expertise and local delivery through a global team of client managers and avariety of businesses including Global Treasury Services, Middle Market Banking, Business Banking, Commercial RealEstate Banking, Leasing, Business Capital, and Dealer Financial Services. It also includes our businesses in LatinAmerica. During the third quarter of 2005, our operations in Mexico were realigned and are now included in the resultsof Global Business and Financial Services, rather than Global Capital Markets and Investment Banking. Also during thethird quarter of 2005, we announced the future combination of Global Business and Financial Services and GlobalCapital Markets and Investment Banking that was effective on January 1, 2006. This new segment is called GlobalCorporate and Investment Banking.
Global Treasury Services provides integrated working capital management and treasury solutions to clients acrossthe U.S. and 50 countries through our network of proprietary offices and clearing arrangements with other financialinstitutions. Our clients include multinationals, middle-market companies, correspondent banks, commercial real estatefirms and governments. Our services include treasury management, trade finance, foreign exchange, short-term creditfacilities and short-term investing. The revenues and operating results are reflected in this segment as well as GlobalConsumer and Small Business Banking and Global Capital Markets and Investment Banking, based upon wherecustomers and clients are serviced.
Middle Market Banking provides commercial lending, treasury management products, investment banking, capitalmarkets, and insurance services to middle-market companies across the U.S.
Business Banking offers our client-managed small business customers a variety of business solutions to grow andmanage their businesses. Products and services include a wide range of credit and treasury management solutions,advisory services such as merchant services, card products, payroll and employee benefits.
Commercial Real Estate Banking, with offices in more than 60 cities across the U.S., provides project financing andtreasury management solutions to private developers, homebuilders and commercial real estate firms. This business alsoincludes community development banking, which provides lending and investing services to low- and moderate-incomecommunities.
Leasing provides leasing solutions to small businesses, middle-market and large corporations in the U.S. andinternationally, offering expertise in the municipal, corporate aircraft, healthcare and vendor markets.
Business Capital provides asset-based lending financing solutions that are customized to meet the capital needs ofour clients by leveraging their assets on a primarily secured basis in the U.S., Canada and European markets.
Dealer Financial Services provides indirect and direct lending and investing services, including floor plan programsand consumer financing for marine, recreational vehicle and auto dealerships through more than 10,000 dealer clientsacross the U.S.
Latin America includes our full-service Latin American operations in Brazil, Chile, Argentina, and Uruguay, andour commercial and wealth and investment management operations in Mexico. These businesses primarily serviceindigenous and multinational corporations, small businesses and affluent consumers. On October 13, 2005, weannounced an agreement to sell our asset management business in Mexico with $1.8 billion of assets under managementto an entity in which we have a 24.9 percent investment. The sale will be completed in 2006. In December 2005, weentered into a definitive agreement for the sale of BankBoston Argentina assets and assumption of liabilities. Thetransaction is subject to obtaining all necessary regulatory approvals. For more information on our Latin Americanoperations, see Foreign Portfolio beginning on page 56.
Net Interest Income increased $1.3 billion, or 19 percent in 2005. The increase was largely due to growth incommercial loans and leases, deposit balances, and the impact of FleetBoston earning assets offset by spreadcompression driven by a flattening yield curve. Average outstanding Loans and Leases increased $28.8 billion, or 19percent, in 2005 due to loan growth in Middle Market Banking, Dealer Financial Services (primarily due to consumerbulk purchases), Commercial Real Estate Banking, Leasing and Business Banking. Average commercial deposits, whichare a lower cost source of funding, increased $13.7 billion, or 15 percent, in 2005, driven by deposit growth in MiddleMarket Banking, Business Banking, Latin America and Commercial Real Estate Banking.
Noninterest Income increased $655 million, or 24 percent, in 2005. The increase was driven by a $420 millionincrease in other noninterest income to $1.7 billion, primarily due to the FleetBoston Merger and gains on early leaseterminations. Higher Service Charges impacted the increase in Noninterest Income, primarily driven by the FleetBostonMerger.
The Provision for Credit Losses increased $393 million to negative $49 million in 2005 compared to negative $442million in 2004. The negative provision reflects continued improvement in commercial credit quality although at aslower rate than experienced in 2004. An improved risk profile in Latin America and reduced uncertainties resultingfrom the completion of credit-related integration activities for FleetBoston also contributed to the negative provision. Formore information, see Credit Risk Management beginning on page 49.
Noninterest Expense increased $564 million, or 16 percent. The increase was primarily due to higher Personnelexpense as a result of increased performance based incentive compensation, higher processing costs and the FleetBostonMerger.
Global Capital Markets and Investment Banking
Our strategy is to align our resources with sectors where we can deliver value-added financial solutions to our issuerand investor clients. This segment provides a broad range of financial services to large corporate domestic andinternational clients, financial institutions, and government entities. It also provides significant resources andcapabilities to our investor clients providing them with financial solutions as well as allowing greater access to marketliquidity and risk management capabilities through various distribution channels. Clients are supported through officesin 27 countries that are divided into three distinct geographic regions: U.S. and Canada; Asia; and Europe, Middle East
35
and Africa. Our products and services include loan originations, mergers and acquisitions advisory, debt and equityunderwriting, distribution and trading, cash management, derivatives, foreign exchange, leveraged finance, structuredfinance and trade services. During the third quarter of 2005, our operations in Mexico were realigned and are nowincluded in the results of Global Business and Financial Services, rather than Global Capital Markets and InvestmentBanking. Also during the third quarter of 2005, we announced the future combination of Global Business and FinancialServices and Global Capital Markets and Investment Banking that was effective on January 1, 2006. This new segmentis called Global Corporate and Investment Banking.
During the fourth quarter of 2004, we announced a strategic initiative to invest approximately $675 million inGlobal Capital Markets and Investment Banking to expand on opportunities in the business’s platform. Theseinvestments were primarily focused on expanding our fixed income activities with both the issuer and investor clientsectors. As of December 31, 2005, approximately 80 percent of this investment had been invested on personnel,technology and other infrastructure costs, which are all in various phases of execution. We remain committed to thebuild out of this business and believe that in time we will be well-positioned in the markets where we choose to compete.
This segment offers clients a comprehensive range of global capabilities through the following three financialservices: Global Investment Banking, Global Credit Products and Global Treasury Services.
Global Investment Banking is comprised of Corporate and Investment Banking, and Global Capital Markets. GlobalInvestment Banking underwrites and makes markets in equity and equity-linked securities, high-grade and high-yieldcorporate debt securities, commercial paper, and mortgage-backed and asset-backed securities. We also provide debt andequity securities research, loan syndications, mergers and acquisitions advisory services, and private placements.Further, we provide risk management solutions for customers using interest rate, equity, credit and commodityderivatives, foreign exchange, fixed income and mortgage-related products. In support of these activities, the businessesmay take positions in these products and participate in market-making activities. The Global Investment Bankingbusiness is a primary dealer in the U.S. and in several international locations.
Global Credit Products provides credit and lending services for our corporate clients and institutional investors.Global Credit Products is also responsible for actively managing loan and counterparty risk in our large corporateportfolio using risk mitigation techniques including credit default swaps (CDS).
Global Treasury Services provides the technology, strategies and integrated solutions to help financial institutions,government agencies and corporate clients manage their cash flows. For additional information on Global TreasuryServices, see Global Business and Financial Services on page 34.
Net Interest Income declined $760 million, or 19 percent, in 2005. Driving the decrease was lower trading-relatedNet Interest Income of $595 million, or 29 percent. Despite the growth in average trading-related earning assets of $70.9billion, or 33 percent, the contribution to Net Interest Income decreased due to a flattening yield curve. In 2005, core netinterest income decreased $165 million to $1.9 billion primarily due to spread compression. Average Deposits increased$10.2 billion, or 14 percent, due to higher foreign deposits and escrow balances.
Noninterest Income increased $723 million, or 14 percent, in 2005. Driving the increase were higher TradingAccount Profits of $641 million, Equity Investment Gains (included in all other income) of $123 million and Investmentand Brokerage Services of $101 million. The increase in Trading Account Profits was due to growth in average trading-related earning assets as a result of increased client activity as we continued to invest in the business. These increaseswere partially offset by declines in Service Charges of $141 million due to effects of rising earnings credits on balancesrequired for services and lower Investment Banking Income of $34 million.
Provision for Credit Losses increased $201 million to negative $244 million in 2005, compared to negative $445million in 2004, driven by a slower rate of improvement in commercial credit quality. Net charge-offs declined $245million from the prior year, driven partially by increased recoveries. For more information, see Credit Risk Managementbeginning on page 49.
Noninterest Expense remained relatively unchanged in 2005. Other general operating expense decreased primarilydue to the segment’s share of the mutual fund settlement and other litigation reserves recorded in 2004. This decreasewas offset by higher Personnel expense, including costs associated with the strategic initiative.
37
Trading-related revenue and equity commissions, both key measures reviewed by management, are presented in thefollowing table.
Trading-related Revenue and Equity Commissions(Dollars in millions) 2005 2004
(1) FTE basis(2) Total corporate Trading Account Profits were $1,812 million and $869 million in 2005 and 2004. Total corporate trading-related
revenue was $3,256 million and $2,908 million in 2005 and 2004.(3) Equity commissions are included in Investment and Brokerage Services in the Consolidated Statement of Income.(4) Includes CDS and related products used for credit risk management. For additional information on CDS, see Concentrations of
Commercial Credit Risk beginning on page 53.
In 2005, market-based trading-related revenue was $3.9 billion, relatively unchanged from the prior year. Fixedincome revenue decreased $493 million due to increased spread volatility in certain industries and lack of investordemand. Offsetting this decline were increases in equities and equity commissions, interest rate-related revenues andcommodities. Trading-related revenue from equities and equity commissions increased $339 million due to highercustomer activity and the absence of net losses on a stock position that occurred in 2004. Interest rate-related revenuesincreased $100 million primarily related to higher sales activity. In 2005, commodities revenue increased $42 million asthe prior year included losses related to positions in gas and jet fuel.
Total trading-related revenue and equity commissions included net gains of $49 million associated with creditportfolio hedges, an improvement of $193 million from 2004. The improvement was primarily due to widening of spreadson CDS in certain industries.
The following table presents the detail of Investment Banking Income within the segment.
Investment Banking Income(Dollars in millions) 2005 2004
(1) Investment Banking Income recorded in other business units in 2005 and 2004 was $107 million and $103 million.
Investment Banking Income decreased $34 million, or two percent, in 2005. The decrease was due primarily to adecline in securities underwriting as the overall market contracted and private placement activity declined. This declinewas partially offset by market share gains in certain debt issuance markets and higher advisory services income due toincreased merger and advisory activity.
Global Wealth and Investment Management
This segment provides tailored investment services to individual and institutional clients in various stages andeconomic cycles. Our clients are offered specific products and services based on their needs through five majorbusinesses: Premier Banking and Investments (PB&I), The Private Bank, Family Wealth Advisors (FWA), ColumbiaManagement Group (Columbia) and Other Services.
38
PB&I includes Banc of America Investments (BAI), our full-service retail brokerage business and our PremierBanking channel. PB&I brings personalized banking and investment expertise through priority service with client-dedicated teams. PB&I provides a high-touch client experience through a network of more than 2,100 client managers toour affluent customers with a personal wealth profile that includes investable assets plus a mortgage that exceeds$250,000 or they have at least $100,000 of investable assets. BAI is the third largest bank-owned brokerage company inthe U.S. with $151 billion in client assets. BAI serves approximately 1.6 million accounts through a network ofapproximately 1,895 financial advisors throughout the U.S.
The Private Bank provides integrated wealth management solutions to high-net-worth individuals, middle marketinstitutions and charitable organizations with investable assets greater than $3 million. Services include investment,trust, banking and lending services as well as specialty asset management services (oil and gas, real estate, farm andranch, timberland, private businesses and tax advisory).
FWA at the Private Bank is designed to serve the needs of ultra high-net-worth individuals and families. This newbusiness provides a higher level of contact and tailored service and wealth management solutions that address thecomplex needs of clients with investable assets greater than $50 million. FWA was rolled out during the first quarter of2005.
Columbia is an asset management organization primarily serving the needs of institutional customers. Columbiaprovides asset management services, liquidity strategies and separate accounts. Columbia also provides mutual fundsoffering a full range of investment styles across an array of products including equities, fixed income (taxable andnontaxable) and cash products (taxable and nontaxable). In addition to servicing institutional clients, Columbiadistributes its products and services to individuals through The Private Bank, PB&I, FWA and nonproprietary channelsincluding other brokerage firms.
Other Services include the Investment Services Group, which provides products and services from traditional capitalmarkets products to alternative investments and Banc of America Specialist, a New York Stock Exchange market-maker.
Global Wealth and Investment Management(Dollars in millions) 2005 2004
Net Interest Income increased $901 million, or 31 percent, in 2005. This increase was due to growth in deposits andloans in PB&I and The Private Bank. Average Deposits increased $32.2 billion, or 39 percent, in 2005 primarily due tothe migration of $28.1 billion of account balances from Global Consumer and Small Business Banking to PB&I, andorganic growth in PB&I and The Private Bank. Average Loans and Leases increased $10.0 billion, or 23 percent, due tohigher loan volume in PB&I and The Private Bank. The secondary driver of the increase in Average Deposits, and Loansand Leases was the impact of the FleetBoston portfolio.
39
Noninterest Income increased $559 million, or 18 percent, in 2005. Noninterest Income consists primarily ofInvestment and Brokerage Services, which represents fees earned on client assets and brokerage commissions. TheInvestment and Brokerage Services revenue increase in 2005, compared to 2004, was mainly due to the impact ofFleetBoston.
Total client assets increased $29.9 billion, or four percent, in 2005. This increase was due to the $30.9 billionincrease in assets under management in 2005, which was driven by net inflows primarily in short-term money marketassets and an increase in overall market valuations. Assets under management generate fees based on a percentage oftheir market value. They consist largely of mutual funds and separate accounts, which are comprised of taxable andnontaxable money market products, equities, and taxable and nontaxable fixed income securities.
Noninterest Expense increased $241 million, or seven percent, in 2005. The increase was due primarily to increasedPersonnel expenses driven by PB&I growth in the Northeast and the impact of FleetBoston. This increase was partiallyoffset by lower other general operating expenses due to the segment’s share of the mutual fund settlement recorded in2004.
All Other
Included in All Other are our Equity Investments businesses, and Other.
Equity Investments include Principal Investing and corporate investments. Principal Investing is comprised of adiversified portfolio of investments in privately-held and publicly-traded companies at all stages of their life cycle fromstart-up to buyout. Corporate investments include CCB, Grupo Financiero Santander Serfin and various otherinvestments.
Other includes the residual impact of the allowance for credit losses process, Merger and Restructuring Charges,intersegment eliminations, and the results of certain consumer finance and commercial lending businesses that arebeing liquidated. Other also includes certain amounts associated with the ALM process, including the impact of fundstransfer pricing allocation methodologies, amounts associated with the change in the value of derivatives used aseconomic hedges of interest rate and foreign exchange rate fluctuations that do not qualify for SFAS 133 hedgeaccounting treatment, gains or losses on sales of whole mortgage loans, and Gains on Sales of Debt Securities. Theobjective of the funds transfer pricing allocation methodology is to neutralize the business segments from changes ininterest rate and foreign exchange fluctuations. Accordingly, for segment reporting purposes, the business segmentsreceive the neutralizing benefit to Net Interest Income related to the economic hedges previously mentioned, with theoffset recorded in Other.
(1) Included in these amounts are impacts related to derivatives designated as economic hedges which do not qualify for SFAS 133hedge accounting treatment of $(419) million and $(834) million in Net Interest Income and $(256) million and $920 million inNoninterest Income. The impact, including $0 and a loss of $(399) million in Gains on Sales of Debt Securities, totaled $(675)million and $(313) million in 2005 and 2004. For additional information, see Note 1 of the Consolidated Financial Statements.
Total Revenue for All Other increased $189 million to $485 million in 2005, primarily driven by an increase inEquity Investment Gains in 2005. Offsetting this increase was the decline in fair value of derivative instruments whichwere used as economic hedges of interest and foreign exchange rates as part of the ALM process. Changes in value ofthese derivative instruments were due to interest rate fluctuations during the year.
Provision for Credit Losses decreased $302 million to $41 million in 2005, resulting from changes to components ofthe formula and other factors effective in 2004, and reduced credit costs in 2005 associated with previously exitedbusinesses. These decreases were offset in part by the establishment of a $50 million reserve for estimated lossesassociated with Hurricane Katrina.
Gains on Sales of Debt Securities decreased $794 million primarily due to lower gains realized in 2005 on mortgage-backed securities and corporate bonds than in 2004. Securities gains are the result of the repositioning of the securitiesportfolio to manage interest rate fluctuations and mortgage prepayment risk. The Corporation utilized a forwardpurchase agreement to hedge the variability of cash flows from the anticipated purchase of securities. The Corporationsubsequently sold the related securities and did not originally reclassify the loss from Accumulated OCI at the time therelated securities were sold.
Merger and Restructuring Charges decreased $206 million in 2005 as the FleetBoston integration is nearingcompletion and the infrastructure initiative was completed in the first quarter of 2005. For more information on Mergerand Restructuring Charges, see Note 2 of the Consolidated Financial Statements.
The Income Tax Expense (Benefit) was a benefit of $85 million in 2005, compared to an expense of $120 million in2004. The change in Income Tax Expense (Benefit) was driven by an increase in tax benefits for low-income housingcredits. These tax benefits are allocated to Global Consumer and Small Business Banking as FTE Noninterest Incomethrough our segment reporting process. All Other includes an offset to this FTE impact.
Equity Investments
Equity Investments reported Net Income of $796 million in 2005, a $594 million improvement compared to 2004.The improvements were primarily due to higher revenues in Principal Investing driven by increasing liquidity in theprivate equity markets. When compared to the prior year, Principal Investing revenue increased $966 million to $1.4billion. The increased revenues were driven by higher realized gains and reduced impairments compared to the prioryear.
41
The following table presents the carrying value of equity investments in the Principal Investing portfolio by majorindustry at December 31, 2005 and 2004:
Equity Investments in the Principal Investing Portfolio
In addition to traditional lending, we also support our customers’ financing needs by facilitating their access to thecommercial paper markets. These markets provide an attractive, lower-cost financing alternative for our customers. Ourcustomers sell assets, such as high-grade trade or other receivables or leases, to a commercial paper financing entity,which in turn issues high-grade short-term commercial paper that is collateralized by the underlying assets.Additionally, some customers receive the benefit of commercial paper financing rates related to certain leasearrangements. We facilitate these transactions and collect fees from the financing entity for the services it providesincluding administration, trust services and marketing the commercial paper.
We receive fees for providing combinations of liquidity, standby letters of credit (SBLCs) or similar loss protectioncommitments, and derivatives to the commercial paper financing entities. These forms of asset support are senior to thefirst layer of asset support provided by customers through over-collateralization or by support provided by third parties.The rating agencies require that a certain percentage of the commercial paper entity’s assets be supported by the seller’sover-collateralization and our SBLC in order to receive their respective investment rating. The SBLC would be drawn ononly when the over-collateralization provided by the seller is not sufficient to cover losses of the related asset. Liquiditycommitments made to the commercial paper entity are designed to fund scheduled redemptions of commercial paper ifthere is a market disruption or the new commercial paper cannot be issued to fund the redemption of the maturingcommercial paper. The liquidity facility has the same legal priority as the commercial paper. We do not enter into anyother form of guarantee with these entities.
We manage our credit risk on these commitments by subjecting them to our normal underwriting and riskmanagement processes. At December 31, 2005 and 2004, we had off-balance sheet liquidity commitments and SBLCs tothese entities of $25.9 billion and $23.8 billion. Substantially all of these liquidity commitments and SBLCs maturewithin one year. These amounts are included in Table 6. Net revenues earned from fees associated with these off-balancesheet financing entities were approximately $71 million and $80 million in 2005 and 2004.
From time to time, we may purchase some of the commercial paper issued by certain of these entities for our ownaccount or acting as a dealer on behalf of third parties. Derivative instruments related to these entities are marked tomarket through the Consolidated Statement of Income. SBLCs are initially recorded at fair value in accordance withFinancial Accounting Standards Board (FASB) Interpretation No. 45, “Guarantor’s Accounting and DisclosureRequirements for Guarantees” (FIN 45). Liquidity commitments and SBLCs subsequent to inception are accounted forpursuant to SFAS No. 5, “Accounting for Contingencies” (SFAS 5), and are discussed further in Note 13 of theConsolidated Financial Statements.
The commercial paper conduits are variable interest entities (VIEs) as defined in FASB Interpretation No. 46(Revised December 2003), “Consolidation of Variable Interest Entities, an interpretation of ARB No. 51” (FIN 46R),which provides a framework for identifying VIEs and determining when a company should include the assets, liabilities,non-controlling interests and results of activities of a VIE in its consolidated financial statements. In accordance withFIN 46R, the primary beneficiary is the party that consolidates a VIE based on its assessment that it will absorb a
42
majority of the expected losses or expected residual returns of the entity, or both. We have determined that we are notthe primary beneficiary of the commercial paper conduits described above and, therefore, have not included the assetsand liabilities or results of operations of these conduits in the Consolidated Financial Statements of the Corporation.
On-balance Sheet Commercial Paper Conduits
In addition to the off-balance sheet financing entities previously described, we also utilize commercial paperconduits that have been consolidated based on our determination that we are the primary beneficiary of the entities inaccordance with FIN 46R. At December 31, 2005 and 2004, the consolidated assets and liabilities of these conduits werereflected in AFS Securities, Other Assets, and Commercial Paper and Other Short-term Borrowings in Global CapitalMarkets and Investment Banking. At December 31, 2005 and 2004, we held $6.6 billion and $7.7 billion of assets of theseentities while our maximum loss exposure associated with these entities, including unfunded lending commitments, wasapproximately $8.0 billion and $9.4 billion. We manage our credit risk on the on-balance sheet commitments bysubjecting them to the same processes as the off-balance sheet commitments.
Qualified Special Purpose Entities
In addition, to control our capital position, diversify funding sources and provide customers with commercial paperinvestments, we will, from time to time, sell assets to off-balance sheet commercial paper entities. The commercial paperentities are Qualified Special Purpose Entities (QSPEs) that have been isolated beyond our reach or that of our creditors,even in the event of bankruptcy or other receivership. The accounting for these entities is governed by SFAS 140,“Accounting for Transfers and Servicing of Financial Assets and Extinguishments of Liabilities—a replacement of FASBStatement No. 125,” (SFAS 140) which provides that QSPEs are not included in the consolidated financial statements ofthe seller. Assets sold to the entities consist of high-grade corporate or municipal bonds, collateralized debt obligationsand asset-backed securities. These entities issue collateralized commercial paper or notes with similar repricingcharacteristics to third party market participants and passive derivative instruments to us. Assets sold to the entitiestypically have an investment rating ranging from Aaa/AAA to Aa/AA. We may provide liquidity, SBLCs or similar lossprotection commitments to the entity, or we may enter into derivatives with the entity in which we assume certain risks.The liquidity facility and derivatives have the same legal standing with the commercial paper.
The derivatives provide interest rate, currency and a pre-specified amount of credit protection to the entity inexchange for the commercial paper rate. These derivatives are provided for in the legal documents and help to alleviateany cash flow mismatches. In some cases, if an asset’s rating declines below a certain investment quality as evidenced byits investment rating or defaults, we are no longer exposed to the risk of loss. At that time, the commercial paper holdersassume the risk of loss. In other cases, we agree to assume all of the credit exposure related to the referenced asset.Legal documents for each entity specify asset quality levels that require the entity to automatically dispose of the assetonce the asset falls below the specified quality rating. At the time the asset is disposed, we are required to reimburse theentity for any credit-related losses depending on the pre-specified level of protection provided.
We manage any credit or market risk on commitments or derivatives through normal underwriting and riskmanagement processes. At December 31, 2005 and 2004, we had off-balance sheet liquidity commitments, SBLCs andother financial guarantees to these entities of $7.1 billion and $7.4 billion. Substantially all of these commitmentsmature within one year and are included in Table 6. Derivative activity related to these entities is included in Note 5 ofthe Consolidated Financial Statements. Net revenues earned from fees associated with these entities were $86 millionand $61 million in 2005 and 2004.
We generally do not purchase any of the commercial paper issued by these types of financing entities other thanduring the underwriting process when we act as issuing agent nor do we purchase any of the commercial paper for ourown account. Derivative instruments related to these entities are marked to market through the Consolidated Statementof Income. SBLCs are initially recorded at fair value in accordance with FIN 45. Liquidity commitments and SBLCssubsequent to inception are accounted for pursuant to SFAS 5 and are discussed further in Note 13 of the ConsolidatedFinancial Statements.
Credit and Liquidity Risks
Because we provide liquidity and credit support to the commercial paper conduits and QSPEs described above, ourcredit ratings and changes thereto will affect the borrowing cost and liquidity of these entities. In addition, significantchanges in counterparty asset valuation and credit standing may also affect the liquidity of the commercial paperissuance. Disruption in the commercial paper markets may result in our having to fund under these commitments andSBLCs discussed above. We seek to manage these risks, along with all other credit and liquidity risks, within ourpolicies and practices. See Notes 1 and 9 of the Consolidated Financial Statements for additional discussion ofoff-balance sheet financing entities.
43
Other Off-balance Sheet Financing Entities
To improve our capital position and diversify funding sources, we also sell assets, primarily loans, to otheroff-balance sheet QSPEs that obtain financing primarily by issuing term notes. We may retain a portion of theinvestment grade notes issued by these entities, and we may also retain subordinated interests in the entities whichreduce the credit risk of the senior investors. We may provide liquidity support in the form of foreign exchange orinterest rate swaps. We generally do not provide other forms of credit support to these entities, which are described morefully in Note 9 of the Consolidated Financial Statements. In addition to the above, we had significant involvement withvariable interest entities (VIEs) other than the commercial paper conduits. These VIEs were not consolidated because wewill not absorb a majority of the expected losses or expected residual returns and are therefore not the primarybeneficiary of the VIEs. These entities are described more fully in Note 9 of the Consolidated Financial Statements.
Obligations and Commitments
We have contractual obligations to make future payments on debt and lease agreements. Additionally, in the normalcourse of business, we enter into contractual arrangements whereby we commit to future purchases of products orservices from unaffiliated parties. Obligations that are legally binding agreements whereby we agree to purchaseproducts or services with a specific minimum quantity defined at a fixed, minimum or variable price over a specifiedperiod of time are defined as purchase obligations. Included in purchase obligations are vendor contracts of $4.0 billion,commitments to purchase securities of $34.2 billion and commitments to purchase loans of $51.7 billion. The mostsignificant of our vendor contracts include communication services, processing services and software contracts. Otherlong-term liabilities include our obligations related to the Qualified Pension Plans, Nonqualified Pension Plans andPostretirement Health and Life Plans (the Plans). Obligations to the Plans are based on the current and projectedobligations of the Plans, performance of the Plans’ assets and any participant contributions, if applicable. During 2005and 2004, we contributed $1.1 billion and $303 million to the Plans, and we expect to make at least $134 million ofcontributions during 2006. Management believes the effect of the Plans on liquidity is not significant to our overallfinancial condition. Debt, lease and other obligations are more fully discussed in Notes 12 and 13 of the ConsolidatedFinancial Statements.
Table 5 presents total long-term debt and other obligations at December 31, 2005.
(1) Includes principal payments and capital lease obligations of $40 million.(2) Obligations that are legally binding agreements whereby we agree to purchase products or services with a specific minimum
quantity defined at a fixed, minimum or variable price over a specified period of time are defined as purchase obligations.
Many of our lending relationships contain funded and unfunded elements. The funded portion is reflected on ourbalance sheet. The unfunded component of these commitments is not recorded on our balance sheet until a draw is madeunder the loan facility; however, a reserve is established for probable losses. These commitments, as well as guarantees,are more fully discussed in Note 13 of the Consolidated Financial Statements.
44
The following table summarizes the total unfunded, or off-balance sheet, credit extension commitment amounts byexpiration date. At December 31, 2005, charge cards (nonrevolving card lines) to individuals and government entitiesguaranteed by the U.S. government in the amount of $9.4 billion (related outstandings of $171 million) were notincluded in credit card line commitments in the table below.
(1) At December 31, 2005, there were equity commitments of $1.4 billion related to obligations to further fund Principal Investingequity investments.
Managing Risk
Overview
Our management governance structure enables us to manage all major aspects of our business through anintegrated planning and review process that includes strategic, financial, associate, customer and risk planning. Wederive much of our revenue from managing risk from customer transactions for profit. In addition to qualitative factors,we utilize quantitative measures to optimize risk and reward trade offs in order to achieve growth targets and financialobjectives while reducing the variability of earnings and minimizing unexpected losses. Risk metrics that allow us tomeasure performance include economic capital targets, SVA targets and corporate risk limits. By allocating capital to abusiness unit, we effectively define that unit’s ability to take on risk. Country, trading, asset allocation and other limitssupplement the allocation of economic capital. These limits are based on an analysis of risk and reward in each businessunit and management is responsible for tracking and reporting performance measurements as well as any exceptions toguidelines or limits. Our risk management process continually evaluates risk and appropriate metrics needed tomeasure it. Our business exposes us to the following major risks: strategic, liquidity, credit, market and operational.
Strategic Risk is the risk that adverse business decisions, ineffective or inappropriate business plans or failure torespond to changes in the competitive environment, business cycles, customer preferences, product obsolescence,execution and/or other intrinsic risks of business will impact our ability to meet our objectives. Liquidity risk is theinability to accommodate liability maturities and deposit withdrawals, fund asset growth and meet contractualobligations through unconstrained access to funding at reasonable market rates. Credit risk is the risk of loss arisingfrom a borrower’s or counterparty’s inability to meet its obligations. Market risk is the risk that values of assets andliabilities or revenues will be adversely affected by changes in market conditions, such as interest rate movements.Operational risk is the risk of loss resulting from inadequate or failed internal processes, people and systems or externalevents.
Risk Management Processes and Methods
We have established control processes and use various methods to align risk-taking and risk managementthroughout our organization. These control processes and methods are designed around “three lines of defense”: lines ofbusiness; support units (including Risk Management, Compliance, Finance, Human Resources and Legal); andCorporate Audit.
Management is responsible for identifying, quantifying, mitigating and managing all risks within their lines ofbusiness, while certain enterprise-wide risks are managed centrally. For example, except for trading-related businessactivities, interest rate risk associated with our business activities is managed in the Corporate Treasury and CorporateInvestment functions. Line of business management makes and executes the business plan and is closest to the changingnature of risks and, therefore, we believe is best able to take actions to manage and mitigate those risks. Our lines ofbusiness prepare quarterly self-assessment reports to identify the status of risk issues, including mitigation plans, if
45
appropriate. These reports roll up to executive management to ensure appropriate risk management and oversight, andto identify enterprise-wide issues. Our management processes, structures and policies aid us in complying with laws andregulations and provide clear lines for decision-making and accountability. Wherever practical, we attempt to housedecision-making authority as close to the transaction as possible while retaining supervisory control functions from bothin and outside of the lines of business.
The Risk Management organization translates approved business plans into approved limits, approves requests forchanges to those limits, approves transactions as appropriate, and works closely with lines of business to establish andmonitor risk parameters. Risk Management has assigned a Risk Executive to each of the lines of business who isresponsible for the oversight of all risks associated with that line of business. In addition, Risk Management hasassigned Risk Executives to monitor enterprise-wide credit, market and operational risks.
Corporate Audit provides an independent assessment of our management and internal control systems. CorporateAudit activities are designed to provide reasonable assurance that resources are adequately protected; significantfinancial, managerial and operating information is materially complete, accurate and reliable; and employees’ actionsare in compliance with corporate policies, standards, procedures, and applicable laws and regulations.
We use various methods to manage risks at the line of business levels and corporate-wide. Examples of thesemethods include planning and forecasting, risk committees and forums, limits, models, and hedging strategies. Planningand forecasting facilitates analysis of actual versus planned results and provides an indication of unanticipated risklevels. Generally, risk committees and forums are comprised of lines of business, risk management, treasury,compliance, legal and finance personnel, among others, who actively monitor performance against plan, limits, potentialissues, and introduction of new products. Limits, the amount of exposure that may be taken in a product, relationship,region or industry, seek to align risk goals with those of each line of business and are part of our overall riskmanagement process to help reduce the volatility of market, credit and operational losses. Models are used to estimatemarket value and net interest income sensitivity, and to estimate expected and unexpected losses for each product andline of business, where appropriate. Hedging strategies are used to manage the risk of borrower or counterpartyconcentration risk and to manage market risk in the portfolio.
The formal processes used to manage risk represent only one portion of our overall risk management process.Corporate culture and the actions of our associates are also critical to effective risk management. Through our Code ofEthics, we set a high standard for our associates. The Code of Ethics provides a framework for all of our associates toconduct themselves with the highest integrity in the delivery of our products or services to our customers. We instill arisk-conscious culture through communications, training, policies, procedures, and organizational roles andresponsibilities. Additionally, we continue to strengthen the linkage between the associate performance managementprocess and individual compensation to encourage associates to work toward corporate-wide risk goals.
Oversight
The Board evaluates risk through the Chief Executive Officer (CEO) and three committees. The Finance Committee,a committee appointed by the Board, establishes policies and strategies for managing the strategic, liquidity, credit,market and operational risks to corporate earnings and capital. The Asset Quality Committee, a Board committee,reviews credit and selected market risks; and the Audit Committee, a Board committee, provides direct oversight of thecorporate audit function and the independent registered public accounting firm. Additionally, senior managementoversight of our risk-taking and risk management activities is conducted through four senior management committees:the Risk and Capital Committee (RCC), the Asset and Liability Committee (ALCO), the Compliance and OperationalRisk Committee (CORC) and the Credit Risk Committee (CRC). The RCC, a senior management committee, reviewscorporate strategies and corporate objectives, evaluates business performance, and reviews business plans, includingcapital allocation, for the Corporation and for major businesses. The ALCO, a subcommittee of the Finance Committee,provides oversight for Corporate Treasury’s and Corporate Investment’s process of managing interest rate risk,otherwise known as the ALM process, and reviews ALM and credit hedging activities. ALCO also approves limits fortrading activities and manages the risk of loss of value and related Net Interest Income of our trading activities. TheCORC, a subcommittee of the Finance Committee, provides oversight and consistent communication of operational andcompliance issues. The CRC, a subcommittee of the Finance Committee, establishes corporate credit practices andlimits, including industry and country concentration limits and approval requirements. The CRC also reviews assetquality results versus plan, portfolio management, and the adequacy of the allowance for credit losses. Each committeeand subcommittee has the ability to delegate authority to officers of subcommittees to manage specific risks.
Management continues to direct corporate-wide efforts to address the Basel Committee on Banking Supervision’snew risk-based capital standards (Basel II). The Finance Committee and the Audit Committee provide oversight ofmanagement’s plans including the Corporation’s preparedness and compliance with Basel II. For additional information,see Basel II on page 49 and Note 15 of the Consolidated Financial Statements.
The following sections, Strategic Risk Management, Liquidity Risk and Capital Management, Credit RiskManagement beginning on page 49, Market Risk Management beginning on page 65 and Operational Risk Management
46
beginning on page 73, address in more detail the specific procedures, measures and analyses of the major categories ofrisk that we manage.
Strategic Risk Management
The Board provides oversight for strategic risk through the CEO and the Finance Committee. We use an integratedbusiness planning process to help manage strategic risk. A key component of the planning process aligns strategies,goals, tactics and resources. The process begins with an assessment that creates a plan for the Corporation, setting thecorporate strategic direction. The planning process then cascades through the business units, creating business unitplans that are aligned with the Corporation’s direction. Tactics and metrics are monitored to ensure adherence to theplans. As part of this monitoring, business units perform a quarterly self-assessment further described in theOperational Risk Management section beginning on page 73. This assessment looks at changing market and businessconditions, and the overall risk in meeting objectives. Corporate Audit in turn monitors, and independently reviews andevaluates, the plans and self-assessments.
One of the key tools for managing strategic risk is capital allocation. Through allocating capital, we effectivelymanage each business segment’s ability to take on risk. Review and approval of business plans incorporates approval ofcapital allocation, and economic capital usage is monitored through financial and risk reporting.
Liquidity Risk and Capital Management
Liquidity Risk
Liquidity is the ongoing ability to accommodate liability maturities and deposit withdrawals, fund asset growth andbusiness operations, and meet contractual obligations through unconstrained access to funding at reasonable marketrates. Liquidity management involves forecasting funding requirements and maintaining sufficient capacity to meet theneeds and accommodate fluctuations in asset and liability levels due to changes in our business operations orunanticipated events. Sources of liquidity include deposits and other customer-based funding, wholesale market-basedfunding, and liquidity provided by the sale or securitization of assets.
We manage liquidity at two levels. The first is the liquidity of the parent company, which is the holding companythat owns the banking and nonbanking subsidiaries. The second is the liquidity of the banking subsidiaries. Themanagement of liquidity at both levels is essential because the parent company and banking subsidiaries each havedifferent funding needs and sources, and each are subject to certain regulatory guidelines and requirements. ThroughALCO, the Finance Committee is responsible for establishing our liquidity policy as well as approving operating andcontingency procedures, and monitoring liquidity on an ongoing basis. Corporate Treasury is responsible for planningand executing our funding activities and strategy.
In order to ensure adequate liquidity through the full range of potential operating environments and marketconditions, we conduct our liquidity management and business activities in a manner that will preserve and enhancefunding stability, flexibility, and diversity. Key components of this operating strategy include a strong focus oncustomer-based funding, maintaining direct relationships with wholesale market funding providers, and maintainingthe ability to liquefy certain assets when, and if, requirements warrant.
We develop and maintain contingency funding plans for both the parent company and bank liquidity positions.These plans evaluate our liquidity position under various operating circumstances and allow us to ensure that we wouldbe able to operate though a period of stress when access to normal sources of funding is constrained. The plans projectfunding requirements during a potential period of stress, specify and quantify sources of liquidity, outline actions andprocedures for effectively managing through the problem period, and define roles and responsibilities. They are reviewedand approved annually by ALCO.
Our borrowing costs and ability to raise funds are directly impacted by our credit ratings. The credit ratings of Bankof America Corporation and Bank of America, National Association (Bank of America, N.A.) are reflected in the tablebelow.
Table 7
Credit RatingsDecember 31, 2005
Bank of America Corporation Bank of America, N.A.SeniorDebt
Under normal business conditions, primary sources of funding for the parent company include dividends receivedfrom its banking and nonbanking subsidiaries, and proceeds from the issuance of senior and subordinated debt, as wellas commercial paper and equity. Primary uses of funds for the parent company include repayment of maturing debt andcommercial paper, share repurchases, dividends paid to shareholders, and subsidiary funding through capital or debt.
The parent company maintains a cushion of excess liquidity that would be sufficient to fully fund holding companyand nonbank affiliate operations for an extended period during which funding from normal sources is disrupted. Theprimary measure used to assess the parent company’s liquidity is the “Time to Required Funding” during such a periodof liquidity disruption. This measure assumes that the parent company is unable to generate funds from debt or equityissuance, receives no dividend income from subsidiaries, and no longer pays dividends to shareholders while continuingto meet nondiscretionary uses needed to maintain bank operations and repayment of contractual principal and interestpayments owed by the parent company and affiliated companies. Under this scenario, the amount of time the parentcompany and its nonbank subsidiaries can operate and meet all obligations before the current liquid assets areexhausted is considered the “Time to Required Funding”. ALCO approves the target range set for this metric, in months,and monitors adherence to the target. Maintaining excess parent company cash that ensures that “Time to RequiredFunding” remains in the target range is the primary driver of the timing and amount of the Corporation’s debtissuances. As of December 31, 2005 “Time to Required Funding” was 29 months.
The primary sources of funding for our banking subsidiaries include customer deposits, wholesale market–basedfunding, and asset securitizations. Primary uses of funds for the banking subsidiaries include growth in the core assetportfolios, including loan demand, and in the ALM portfolio. We use the ALM portfolio primarily to manage interest raterisk and liquidity risk.
The strength of our balance sheet is a result of rigorous financial and risk discipline. Our excess deposits, which area low cost of funding source, fund the purchase of additional securities and result in a lower loan to deposit ratio.Mortgage-backed securities and mortgage loans have prepayment risk which has to be actively managed. Repricing ofdeposits is a key variable in this process. The capital generated in excess of capital adequacy targets and to supportbusiness growth, is available for the payment of dividends and share repurchases.
ALCO determines prudent parameters for wholesale market-based borrowing and regularly reviews the fundingplan for the bank subsidiaries to ensure compliance with these parameters. The contingency funding plan for thebanking subsidiaries evaluates liquidity over a 12-month period in a variety of business environment scenarios assumingdifferent levels of earnings performance and credit ratings as well as public and investor relations factors. Fundingexposure related to our role as liquidity provider to certain off-balance sheet financing entities is also measured under astress scenario. In this analysis, ratings are downgraded such that the off-balance sheet financing entities are not able toissue commercial paper and backup facilities that we provide are drawn upon. In addition, potential draws on creditfacilities to issuers with ratings below a certain level are analyzed to assess potential funding exposure.
One ratio used to monitor the stability of our funding composition is the “loan to domestic deposit” (LTD) ratio. Thisratio reflects the percent of Loans and Leases that are funded by domestic customer deposits, a relatively stable fundingsource. A ratio below 100 percent indicates that our loan portfolio is completely funded by domestic customer deposits.The ratio was 102 percent at December 31, 2005 compared to 93 percent at December 31, 2004. The increase wasprimarily attributable to organic growth in the loan and lease portfolio.
We originate loans for retention on our balance sheet and for distribution. As part of our “originate to distribute”strategy, commercial loan originations are distributed through syndication structures, and residential mortgagesoriginated by Consumer Real Estate are frequently distributed in the secondary market. In connection with our balancesheet management activities, we may retain mortgage loans originated as well as purchase and sell loans based on ourassessment of market conditions.
Regulatory Capital
As a regulated financial services company, we are governed by certain regulatory capital requirements. Presented inNote 15 of the Consolidated Financial Statements are the regulatory capital ratios, actual capital amounts andminimum required capital amounts for the Corporation, Bank of America, N.A., Fleet National Bank and Bank ofAmerica, N.A. (USA) at December 31, 2005 and 2004. On June 13, 2005, Fleet National Bank merged with and intoBank of America, N.A., with Bank of America, N.A. as the surviving entity. As of December 31, 2005, the entities wereclassified as “well-capitalized” for regulatory purposes, the highest classification.
Certain corporate sponsored trust companies which issue trust preferred securities (Trust Securities) aredeconsolidated under FIN 46R. As a result, the Trust Securities are not included on our Consolidated Balance Sheets.On March 1, 2005, the FRB issued Risk-Based Capital Standards: Trust Preferred Securities and the Definition ofCapital (the Final Rule) which allows Trust Securities to continue to qualify as Tier 1 Capital with revised quantitativelimits that would be effective after a five-year transition period. As a result, we continue to include Trust Securities inTier 1 Capital.
48
The FRB’s Final Rule limits restricted core capital elements to 15 percent for internationally active bank holdingcompanies. In addition, the FRB revised the qualitative standards for capital instruments included in regulatory capital.Internationally active bank holding companies are those with consolidated assets greater than $250 billion or on-balancesheet exposure greater than $10 billion. At December 31, 2005, our restricted core capital elements comprised 16.6percent of total core capital elements. We expect to be fully compliant with the revised limits prior to the implementationdate of March 31, 2009.
Basel II
In June 2004, Basel II was published with the intent of more closely aligning regulatory capital requirements withunderlying risks. Similar to economic capital measures, Basel II seeks to address credit risk, market risk andoperational risk.
While economic capital is measured to cover unexpected losses, we also maintain a certain threshold in terms ofregulatory capital to adhere to legal standards of capital adequacy. With recent updates to the U.S. implementation,these thresholds or leverage ratios, will continue to be utilized for the foreseeable future. Maintaining capital adequacywith our regulatory capital under Basel II, does not impact internal profitability or pricing.
In the U.S., Basel II will not be implemented until January 1, 2008, which will serve as our parallel test year,followed by full implementation in 2009. The impact on our capital management processes and capital requirementscontinues to be evaluated. As Basel II is an international regulation, U.S. regulatory agencies are drafting a U.S.oriented measure which follows the Basel II construct.
Recently, an assessment of the potential effect on regulatory capital known as Quantitative Impact Study 4 wascompleted, which generated disparate results among participants. In order to address the potential changes in capitallevels, regulators have established floors or limits as to how much capital can decrease from period to period after fullimplementation through at least 2011. We are committed to working with the regulators and continue to proactivelymonitor their efforts towards achieving a successful implementation of Basel II.
Implementation of Basel II requires a significant enterprise-wide effort. During 2005, our dedicated Basel IIProgram Management Office, supported by a number of business segment specialists and technologists, completed majorplanning activities required to achieve Basel II preparedness. During 2006, we are aggressively moving forward withpolicy, process and technology changes required to achieve full compliance by the start of parallel processing in 2008. Wecontinue to work closely with the regulatory agencies in this process.
Dividends
Effective for the third quarter 2005 dividend, the Board increased the quarterly cash dividend 11 percent from $0.45to $0.50 per common share. In October 2005, the Board declared a fourth quarter cash dividend which was paid onDecember 23, 2005 to common shareholders of record on December 2, 2005. In January 2006, the Board declared aquarterly cash dividend of $0.50 per common share payable on March 24, 2006 to shareholders of record on March 3,2006.
Share Repurchases
We will continue to repurchase shares, from time to time, in the open market or in private transactions through ourapproved repurchase programs. We repurchased 126.4 million shares of common stock in 2005, which more than offsetthe 79.6 million shares issued under our company’s employee stock plans. During 2006 we expect to use available excesscapital to repurchase shares in excess of shares issued under our employee stock plans. For additional information oncommon share repurchases, see Note 14 of the Consolidated Financial Statements.
Credit Risk Management
Credit risk is the risk of loss arising from a borrower’s or counterparty’s inability to meet its obligations. Credit riskcan also arise from operational failures that result in an advance, commitment or investment of funds. We define thecredit exposure to a borrower or counterparty as the loss potential arising from all product classifications, includingloans and leases, derivatives, trading account assets, assets held-for-sale, and unfunded lending commitments thatinclude loan commitments, letters of credit and financial guarantees. For derivative positions, our credit risk ismeasured as the net replacement cost in the event the counterparties with contracts in a gain position to us completelyfail to perform under the terms of those contracts. We use the current mark-to-market value to represent credit exposurewithout giving consideration to future mark-to-market changes. The credit risk amounts take into consideration theeffects of legally enforceable master netting agreements. Our consumer and commercial credit extension and reviewprocedures take into account credit exposures that are funded or unfunded. For additional information on derivativesand credit extension commitments, see Notes 5 and 13 of the Consolidated Financial Statements.
49
We manage credit risk based on the risk profile of the borrower or counterparty, repayment sources, the nature ofunderlying collateral, and other support given current events, conditions and expectations. We classify our Loans andLeases as either consumer or commercial and monitor their credit risk separately as discussed below.
Consumer Portfolio Credit Risk Management
Credit risk management for the consumer portfolio begins with initial underwriting and continues throughout aborrower’s credit cycle. Statistical techniques are used to establish product pricing, risk appetite, operating processesand metrics to balance risks and returns. Consumer exposure is grouped by product and other attributes for purposes ofevaluating credit risk. Statistical models are built using detailed behavioral information from external sources such ascredit bureaus as well as internal historical experience. These models are essential to our consumer credit riskmanagement process and are used in the determination of credit decisions, collections management strategies, portfoliomanagement decisions, determination of the allowance for consumer loan and lease losses, and economic capitalallocations for credit risk.
Table 8 presents outstanding consumer loans and leases for each year in the five-year period ending at December 31,2005.
(1) Includes consumer finance of $2,849 million, $3,395 million, $3,905 million, $4,438 million, and $5,331 million at December 31,2005, 2004, 2003, 2002, and 2001, respectively; foreign consumer of $3,841 million, $3,563 million, $1,969 million, $1,970 million,and $2,092 million at December 31, 2005, 2004, 2003, 2002, and 2001, respectively; and consumer lease financing of $35 million,$481 million, $1,684 million, $3,947 million, and $7,321 million at December 31, 2005, 2004, 2003, 2002, and 2001, respectively.
Concentrations of Consumer Credit Risk
Our consumer credit risk is diversified both geographically and through our various product offerings. In addition,credit decisions are statistically based with tolerances set to decrease the percentage of approvals as the risk profileincreases.
From time to time, we purchase credit protection on certain portions of our consumer portfolio. This protection isdesigned to enhance our overall risk management strategy. At December 31, 2005 and 2004, we have mitigated a portionof our credit risk on approximately $110.4 billion and $88.7 billion of residential mortgage and indirect automobile loansthrough the purchase of credit protection. Our regulatory risk-weighted assets were reduced as a result of thesetransactions because we transferred a portion of our credit risk to unaffiliated parties. These transactions had thecumulative effect of reducing our risk-weighted assets by $30.6 billion and $25.5 billion at December 31, 2005 and 2004,and resulted in 28 bp and 26 bp increases in our Tier 1 Capital ratio.
Consumer Portfolio Credit Quality Performance
Credit quality continued to be strong and consistent with performance from a year ago with the exception of thecredit card portfolio.
Managed credit card performance was impacted by increased bankruptcy filings prior to legislation which becameeffective October 17, 2005, continued growth and seasoning of the portfolio, and increased minimum paymentrequirements implemented in April 2004. The year 2005 compared to 2004 was also impacted by the FleetBoston creditcard portfolio.
The entire balance of an account is contractually delinquent if the minimum payment is not received by the specifieddate on the customer’s billing statement. Interest and fees continue to accrue on our past due loans until the date theloan goes into nonaccrual status, if applicable. Delinquency is reported on accruing loans that are 30 days or more pastdue.
50
Credit card loans are generally charged off at 180 days past due or 60 days from notification of bankruptcy filing andare not classified as nonperforming. Unsecured consumer loans and deficiencies in non-real estate secured loans andleases are charged off at 120 days past due and are generally not classified as nonperforming. Real estate securedconsumer loans are placed on nonaccrual and are classified as nonperforming no later than 90 days past due. Theamount deemed uncollectible on real estate secured loans is charged off at 180 days past due.
Table 9 presents consumer net charge-offs and net charge-off ratios on the held portfolio for 2005 and 2004.
Table 9
Consumer Net Charge-offs and Net Charge-off Ratios(1)
20052004
(Restated)(Dollars in millions) Amount Percent Amount Percent
(1) Percentage amounts are calculated as net charge-offs divided by average outstanding loans and leases during the year for each loancategory.
As presented in Table 9, consumer net charge-offs from on-balance sheet loans increased $1.5 billion to $4.2 billionin 2005. Of these increased amounts, $1.3 billion was related to credit card net charge-offs. Higher credit card netcharge-offs were driven by an increase in bankruptcy net charge-offs of $578 million resulting from changes inbankruptcy legislation, organic portfolio growth and seasoning, increases effective in 2004 in credit card minimumpayment requirements, the impact of the FleetBoston portfolio and new advances on accounts for which previous loanbalances were sold to the securitization trusts. The increase in direct/indirect consumer charge-offs was driven primarilyby the growth and seasoning of the auto loan portfolio. The increase in other consumer charge-offs was primarily drivenby an increase in charge-offs for checking account overdraft balances due to deposit growth and a change in the fourthquarter of 2005 in our charge-off policy for overdraft balances from 120 days to 60 days.
Net losses for the managed credit card portfolio increased $1.3 billion to $4.1 billion, or 6.92 percent of total averagemanaged credit card loans in 2005, compared to 5.62 percent of total average managed credit card loans in 2004. Highermanaged credit card net losses were driven by an increase in bankruptcy net losses resulting from the change inbankruptcy law, continued portfolio growth and seasoning, increases effective in 2004 in credit card minimum paymentrequirements and the impact of the FleetBoston portfolio.
As presented in Table 10, nonperforming consumer assets increased $39 million from December 31, 2004 to $846million at December 31, 2005. The increase was due to a $47 million increase in nonperforming consumer loans andleases to $785 million, representing 0.22 percent of outstanding consumer loans and leases at December 31, 2005compared to $738 million, representing 0.23 percent of outstanding consumer loans and leases at December 31, 2004.Nonperforming residential mortgages increased $16 million primarily due to modest portfolio growth, partially offset bysales of $112 million in 2005. Nonperforming home equity lines increased $51 million due to the seasoning of theportfolio. Other consumer nonperforming loans and leases fell $24 million due to the continued liquidation of theportfolios in our previously exited consumer businesses and a decline in foreign nonperforming loans and leases. Broad-based loan growth offset the increase in nonperforming consumer loans resulting in an improvement in thenonperforming ratios.
51
Table 10Nonperforming Consumer Assets
December 31(Dollars in millions) 2005 2004 2003 2002 2001
(1) In 2005, $50 million in Interest Income was estimated to be contractually due on nonperforming consumer loans and leasesclassified as nonperforming at December 31, 2005 provided that these loans and leases had been paid according to their terms andconditions. Of this amount, approximately $9 million was received and included in Net Income for 2005.
(2) Balances do not include $5 million, $28 million, $16 million, $41 million, and $646 million of nonperforming consumer loans held-for-sale, included in Other Assets at December 31, 2005, 2004, 2003, 2002, and 2001, respectively.
Table 11 presents the additions and reductions to nonperforming assets in the consumer portfolio during 2005 and2004. Net additions to nonperforming loans and leases in 2005 were $47 million compared to $100 million in 2004.Table 11Nonperforming Consumer Assets Activity(Dollars in millions) 2005 2004
(1) Consumer loans are generally returned to performing status when principal or interest is less than 90 days past due.(2) Our policy is not to classify consumer credit card and consumer non-real estate loans and leases as nonperforming; therefore, the
charge-offs on these loans are not included above.
52
On-balance sheet consumer loans and leases 90 days or more past due and still accruing interest totaled $1.3 billionat December 31, 2005, and were up $131 million from December 31, 2004, primarily driven by a $122 million increase incredit card past due loans due to continued seasoning and growth.
Commercial Portfolio Credit Risk Management
Credit risk management for the commercial portfolio begins with an assessment of the credit risk profile of theborrower or counterparty based on an analysis of the borrower’s or counterparty’s financial position. As part of theoverall credit risk assessment of a borrower or counterparty, each commercial credit exposure or transaction is assigneda risk rating and is subject to approval based on defined credit approval standards. Subsequent to loan origination, riskratings are monitored on an ongoing basis. If necessary, risk ratings are adjusted to reflect changes in the borrower’s orcounterparty’s financial condition, cash flow or financial situation. We use risk rating aggregations to measure andevaluate concentrations within portfolios. Risk ratings are a factor in determining the level of assigned economic capitaland the allowance for credit losses. In making decisions regarding credit, we consider risk rating, collateral, country,industry and single name concentration limits while also balancing the total borrower or counterparty relationship andSVA.
Our lines of business and Risk Management personnel use a variety of tools to continuously monitor a borrower’s orcounterparty’s ability to perform under its obligations. Additionally, we utilize syndication of exposure to other entities,loan sales and other risk mitigation techniques to manage the size and risk profile of the loan portfolio.
Table 12 presents outstanding commercial loans and leases for each year in the five-year period endingDecember 31, 2005.
(1) Includes domestic commercial real estate loans of $35,181 million, $31,879 million, $19,043 million, $19,910 million, and $22,272million at December 31, 2005, 2004, 2003, 2002, and 2001, respectively; and foreign commercial real estate loans of $585 million,$440 million, $324 million, $295 million, and $383 million at December 31, 2005, 2004, 2003, 2002, and 2001, respectively.
Concentrations of Commercial Credit Risk
Portfolio credit risk is evaluated and managed with a goal that concentrations of credit exposure do not result inundesirable levels of risk. We review, measure, and manage concentrations of credit exposure by industry, product,geography and customer relationship. Distribution of loans and leases by loan size is an additional measure of theportfolio risk diversification. We also review, measure, and manage commercial real estate loans by geographic locationand property type. In addition, within our international portfolio, we evaluate borrowings by region and by country.Tables 13 through 19 summarize these concentrations.
From the perspective of portfolio risk management, customer concentration management is most relevant in GlobalCapital Markets and Investment Banking. Within that portfolio, concentrations are actively managed through theunderwriting and ongoing monitoring processes, the established strategy of “originate to distribute”, and partly throughthe purchase of credit protection through credit derivatives. We utilize various risk mitigation tools to economicallyhedge our risk to certain credit counterparties. Credit derivatives are financial instruments that we purchase forprotection against the deterioration of credit quality. Earnings volatility increases due to accounting asymmetry as wemark to market the CDS, as required by SFAS 133, while the loans are recorded at historical cost less an allowance forcredit losses or, if held-for-sale, at the lower of cost or market.
53
At December 31, 2005 and 2004, we had a net notional amount of credit default protection purchased in our creditderivatives portfolio of $14.7 billion and $10.8 billion. Our credit portfolio hedges, including the impact ofmark-to-market, resulted in net gains of $49 million in 2005 and net losses of $144 million in 2004. Gains for 2005primarily reflected the impact of spread widening in certain industries in the first half of the year.
Table 13 shows commercial utilized credit exposure by industry based on Standard & Poor’s industry classificationsand includes commercial loans and leases, SBLCs and financial guarantees, derivative assets, assets held-for-sale, andcommercial letters of credit. These amounts exclude the impact of our credit hedging activities, which are separatelyincluded in the table. To lessen the cost of obtaining our desired credit protection levels, credit exposure may be addedwithin an industry, borrower or counterparty group by selling protection. A negative notional amount indicates a netamount of protection purchased in a particular industry; conversely, a positive notional amount indicates a net amountof protection sold in a particular industry. Credit protection is purchased to cover the funded portion as well as theunfunded portion of credit exposure. As shown in the table below, commercial utilized credit exposure is diversifiedacross a range of industries.
Table 13
Commercial Utilized Credit Exposure and Net Credit Default Protection by Industry
Commercial Utilized Credit Exposure(1) Net Credit Default Protection(2)
December 31 December 31(Dollars in millions) 2005 2004 2005 2004
(1) Derivative assets are reported on a mark-to-market basis and have not been reduced by the amount of collateral applied. Derivativeasset collateral totaled $17.1 billion and $17.7 billion at December 31, 2005 and 2004.
(2) Represents notional amounts at December 31, 2005 and 2004.(3) Industries are viewed from a variety of perspectives to best isolate the perceived risks. For purposes of this table, the real estate
industry is defined based upon the borrowers’ or counterparties’ primary business activity using operating cash flow and primarysource of repayment as key factors.
(4) Represents net CDS index positions, which were principally investment grade. Indices are comprised of corporate credit derivativesthat trade as an aggregate index value. Generally, they are grouped into portfolios based on specific ratings of credit quality orglobal geographic location. As of December 31, 2005, CDS index positions were sold to reflect a short-term positive view of the creditmarkets.
54
Table 14 shows the maturity profile of the net credit default protection portfolio at December 31, 2005 and 2004.
(1) In addition to unrated names, “NR” includes $1,677 million in net CDS index positions. While index positions are principallyinvestment grade, CDS indices include names in and across each of the ratings categories.
55
Table 16 presents outstanding commercial real estate loans and the geographic region and property typediversification. The amounts outstanding exclude commercial loans and leases secured by owner-occupied real estate.Commercial loans and leases secured by owner-occupied real estate are made on the general creditworthiness of theborrower where real estate is obtained as additional security and the ultimate repayment of the credit is not dependenton the sale, lease and rental, or refinancing of the real estate. For purposes of this table, commercial real estate reflectsloans dependent on the sale, lease and rental, or refinancing of the real estate as the primary source of repayment.
Table 16
Outstanding Commercial Real Estate LoansDecember 31
(1) Distribution is based on geographic location of collateral. Geographic regions are in the U.S. unless otherwise noted.(2) The geographically diversified category is comprised primarily of unsecured outstandings to real estate investment trusts and
national homebuilders whose portfolios of properties span multiple geographic regions.(3) Represents loans to borrowers whose primary business is commercial real estate, but the exposure is not secured by the listed
property types.
Foreign Portfolio
Table 17 sets forth total foreign exposure broken out by region at December 31, 2005 and 2004. Total foreignexposure is defined to include credit exposure, net of local liabilities, plus securities and other investments for allexposure with a country of risk other than the United States.
(1) Reflects the subtraction of local funding or liabilities from local exposures as allowed by the Federal Financial InstitutionsExamination Council (FFIEC).
(2) Includes Australia and New Zealand.(3) Includes Bermuda and Cayman Islands.(4) Other includes Canada and supranational entities.
56
Our total foreign exposure was $92.2 billion at December 31, 2005, an increase of $2.0 billion from December 31,2004. Our foreign exposure was concentrated in Europe, which accounted for $62.0 billion, or 67 percent, of total foreignexposure. The European exposure was mostly in Western Europe and was distributed across a variety of industries withthe largest concentration in the banking sector that accounted for 47 percent of the total exposure in Europe. AtDecember 31, 2005, the United Kingdom and Germany were the only countries whose total cross-border outstandingsexceeded 0.75 percent of our total assets.
Our second largest foreign exposure of $14.1 billion, or 15 percent, was in Asia Pacific as growth in the total foreignexposure during 2005 was concentrated in that region. Our $3.0 billion equity investment in CCB was the mostsignificant driver of the growth. Latin America accounted for $10.7 billion, or 12 percent, of total foreign exposure. Thedecline in exposure in Latin America during 2005 was primarily due to the sales of branch assets in Peru, Colombia andPanama as well as the reduction of exposure in Argentina, partially offset by an increase in Mexico. For moreinformation on our Asia Pacific and Latin America exposure, see discussion in the foreign exposure to selected countriesdefined as emerging markets on page 58.
As shown in Table 18, at December 31, 2005 and 2004, the United Kingdom had total cross-border exposure of $22.9billion and $11.9 billion, representing 1.78 percent and 1.07 percent of total assets. At December 31, 2005 and 2004,Germany had total cross-border exposure of $12.5 billion and $12.0 billion, representing 0.97 percent and 1.08 percent oftotal assets. At December 31, 2005, the largest concentration of the exposure to these countries was in the private sector.
Table 18
Total Cross-border Exposure Exceeding One Percent of Total Assets(1,2)
(Dollars in millions) December 31PublicSector Banks
(1) Exposure includes cross-border claims by our foreign offices as follows: loans, accrued interest receivable, acceptances, time depositsplaced, trading account assets, securities, derivative assets, other interest-earning investments and other monetary assets.Amounts also include unused commitments, SBLCs, commercial letters of credit and formal guarantees. Sector definitions arebased on the FFIEC instructions for preparing the Country Exposure Report.
(2) The total cross-border exposure for the United Kingdom and Germany at December 31, 2005 includes derivatives exposure of $2.3billion and $3.4 billion, against which we hold collateral totaling $1.9 billion and $2.6 billion.
As shown in Table 19, at December 31, 2005, foreign exposure to borrowers or counterparties in emerging marketsincreased by $1.6 billion to $17.2 billion compared to $15.6 billion at December 31, 2004, and represented 19 percent and17 percent of total foreign exposure at December 31, 2005 and 2004.
At December 31, 2005, 51 percent of the emerging markets exposure was in Asia Pacific, compared to 40 percent atDecember 31, 2004. Asia Pacific emerging markets exposure increased by $2.4 billion due to our $3.0 billion equityinvestment in CCB partially offset by declines in other countries.
At December 31, 2005, 48 percent of the emerging markets exposure was in Latin America compared to 58 percentat December 31, 2004. Driving the decrease in Latin America were mostly lower exposures in Other Latin America andArgentina, partially offset by an increase in Mexico. Lower exposures in Other Latin America were attributable to thesales of branch assets in Peru, Colombia and Panama, as well as lower securities trading exposure in Venezuela. Thereduction in Argentina was mostly in cross-border exposure. Our 24.9 percent investment in Grupo FinancieroSantander Serfin accounted for $2.1 billion and $1.9 billion of reported exposure in Mexico at December 31, 2005 and2004.
Our largest exposure in Latin America was in Brazil. Our exposure in Brazil at December 31, 2005 and 2004included $1.2 billion and $1.6 billion of traditional cross-border credit exposure (Loans and Leases, letters of credit, etc.),and $2.2 billion and $1.8 billion of local country exposure net of local liabilities.
We had risk mitigation instruments associated with certain exposures in Brazil, including structured trade relatedtransfer risk mitigation of $830 million and $950 million, third party funding of $313 million and $286 million, and
57
linked certificates of deposit of $59 million and $125 million at December 31, 2005 and 2004. The resulting total foreignexposure net of risk mitigation for Brazil was $2.3 billion and $2.2 billion at December 31, 2005 and 2004.
On October 13, 2005, we announced an agreement to sell our asset management business in Mexico with $1.8 billionof assets under management to an entity in which we have a 24.9 percent investment. The sale will be completed in2006.
In December 2005, we entered into a definitive agreement with a consortium led by Johannesburg-based StandardBank Group Ltd for the sale of BankBoston Argentina assets and the assumption of liabilities. The transaction is subjectto obtaining all necessary regulatory approvals.
Table 19 sets forth regional foreign exposure to selected countries defined as emerging markets.
(1) There is no generally accepted definition of emerging markets. The definition that we use includes all countries in Latin Americaexcluding Cayman Islands and Bermuda; all countries in Asia Pacific excluding Japan, Australia and New Zealand; and allcountries in Central and Eastern Europe excluding Greece.
(2) Includes acceptances, SBLCs, commercial letters of credit and formal guarantees.(3) Derivative assets are reported on a mark-to-market basis and have not been reduced by the amount of collateral applied. Derivative
asset collateral totaled $58 million and $361 million at December 31, 2005 and 2004.(4) Generally, cross-border resale agreements are presented based on the domicile of the counterparty because the counterparty has
the legal obligation for repayment except where the underlying securities are U.S. Treasuries, in which case the domicile is theU.S., and therefore, excluded from this presentation. For regulatory reporting under FFIEC guidelines, cross-border resaleagreements are presented based on the domicile of the issuer of the securities that are held as collateral.
(5) Cross-border exposure includes amounts payable to us by borrowers or counterparties with a country of residence other than theone in which the credit is booked, regardless of the currency in which the claim is denominated, consistent with FFIEC reportingrules.
(6) Local country exposure includes amounts payable to us by borrowers with a country of residence in which the credit is booked,regardless of the currency in which the claim is denominated. Management subtracts local funding or liabilities from localexposures as allowed by the FFIEC. Total amount of available local liabilities funding local country exposure at December 31, 2005was $24.2 billion compared to $17.2 billion at December 31, 2004. Local liabilities at December 31, 2005 in Asia Pacific and LatinAmerica were $13.6 billion and $10.6 billion of which $8.4 billion were in Hong Kong, $5.3 billion in Brazil, $3.1 billion inSingapore, $1.7 billion in Argentina, $1.6 billion in Chile, $1.2 billion in Mexico, $782 million in India and $718 million in Uruguay.There were no other countries with available local liabilities funding local country exposure greater than $500 million.
(7) Securities/Other Investments includes equity investment of $3.0 billion in CCB.(8) Other Asia Pacific, Other Latin America, and Central and Eastern Europe include countries each with total foreign exposure of less
than $300 million.
58
Commercial Portfolio Credit Quality Performance
Overall commercial credit quality continued to improve in 2005; however, the rate of improvement slowed in thesecond half of the year.
Table 20 presents commercial net charge-offs and net charge-off ratios for 2005 and 2004.
Table 20
Commercial Net Charge-offs and Net Charge-off Ratios(1)
2005 2004(Dollars in millions) Amount Percent Amount Percent
(1) Percentage amounts are calculated as net charge-offs divided by average outstanding loans and leases during the year for each loancategory.
Commercial net charge-offs were $329 million for 2005 compared to $356 million for 2004. Commercial leasefinancing net charge-offs increased $222 million in 2005 compared to 2004 primarily due to the domestic airlineindustry. Commercial—foreign net recoveries were $72 million in 2005 compared to net charge-offs of $173 million in2004. Recoveries were centered in Bermuda, Latin America, India and the United Kingdom. Commercial—foreign netcharge-offs of $173 million in 2004 were primarily related to one borrower in the food products industry.
As presented in Table 21, commercial criticized credit exposure decreased $2.7 billion, or 27 percent, to $7.5 billionat December 31, 2005. The net decrease was driven by $9.9 billion of paydowns, payoffs, credit quality improvements,charge-offs principally related to the domestic airline industry, and loan sales. Reductions were distributed across manyindustries of which the largest were airlines, utilities and media. These decreases were partially offset by $7.2 billion ofnewly criticized exposure. Global Business and Financial Services accounted for 54 percent, or $1.5 billion, of thedecrease in commercial criticized exposure centered in Commercial Aviation, Latin America and Middle MarketBanking, which comprised 20 percent, 15 percent and 9 percent of the total decrease. Global Capital Markets andInvestment Banking accounted for 33 percent, or $896 million, of the decrease in criticized exposure.
Table 21
Commercial Criticized Exposure(1)
December 312005 2004
(Dollars in millions) Amount Percent(2) Amount Percent(2)
(1) Criticized exposure corresponds to the Special Mention, Substandard and Doubtful asset categories defined by regulatoryauthorities. Exposure amounts include loans and leases, SBLCs and financial guarantees, derivative assets, assets held-for-saleand commercial letters of credit.
(2) Commercial criticized exposure is taken as a percentage of total commercial utilized exposure.
We routinely review the loan and lease portfolio to determine if any credit exposure should be placed onnonperforming status. An asset is placed on nonperforming status when it is determined that full collection of principaland/or interest in accordance with its contractual terms is not probable. As presented in Table 22, nonperformingcommercial assets decreased $891 million to $757 million at December 31, 2005 due primarily to the $749 milliondecrease in nonperforming commercial loans and leases.
The decrease in total nonperforming commercial loans and leases primarily resulted from paydowns and payoffs of$686 million, gross charge-offs of $669 million, returns to performing status of $152 million and loan sales of $108million. These decreases were partially offset by new nonaccrual loans of $929 million.
59
Nonperforming commercial—domestic loans and leases decreased by $274 million and represented 0.41 percent ofcommercial—domestic loans and leases at December 31, 2005 compared to 0.70 percent at December 31, 2004. Theimprovement in the percentage of nonperforming commercial—domestic to total commercial—domestic was driven by abroad-based decrease in nonperforming loans and leases across several industries, the largest of which were utilities,and metals and mining. Nonperforming commercial lease financing decreased $204 million primarily due to thepreviously mentioned charge-offs associated with the domestic airline industry, and represented 0.30 percent ofcommercial lease financing at December 31, 2005 compared to 1.26 percent at December 31, 2004. Nonperformingcommercial—foreign decreased $233 million and represented 0.16 percent of commercial—foreign at December 31, 2005compared to 1.45 percent at December 31, 2004. The improvement in the percentage of nonperforming commercial—foreign to total commercial—foreign was attributable to Latin America.
The $140 million decrease in nonperforming securities from December 31, 2004 was primarily driven by anexchange of nonperforming securities for performing securities in Argentina that resulted from the completion of agovernment mandated securities exchange program.
Table 22 presents nonperforming commercial assets for each year in the five-year period ending December 31, 2005.
Table 22
Nonperforming Commercial Assets
December 31(Dollars in millions) 2005 2004 2003 2002 2001
(1) In 2005, $51 million in Interest Income was estimated to be contractually due on nonperforming commercial loans and leasesclassified as nonperforming at December 31, 2005, including troubled debt restructured loans of which $31 million were performingat December 31, 2005 and not included in the table above. Approximately $15 million of the estimated $51 million in contractualinterest was received and included in net income for 2005.
(2) Primarily related to international securities held in the AFS portfolio.(3) Balances do not include $45 million, $123 million, $186 million, $73 million, and $289 million of nonperforming commercial assets,
primarily commercial loans held-for-sale, included in Other Assets at December 31, 2005, 2004, 2003, 2002, and 2001, respectively.
60
Table 23 presents the additions and reductions to nonperforming assets in the commercial portfolio during 2005 and2004.
(1) Commercial loans and leases may be restored to performing status when all principal and interest is current and full repayment ofthe remaining contractual principal and interest is expected, or when the loan otherwise becomes well secured and is in the processof collection.
(2) Certain loan and lease products, including commercial credit card, are not classified as nonperforming; therefore, the charge-offs onthese loans are not included above.
61
At December 31, 2005, Other Assets included commercial loans held-for-sale of $7.3 billion, of which $45 million wasnonperforming, and leveraged lease partnership interests of $183 million. At December 31, 2005, there were nononperforming leveraged lease partnership interests. At December 31, 2004, Other Assets included $1.3 billion and $198million of commercial loans held-for-sale and leveraged lease partnership interests, of which, $100 million and $23million were nonperforming.
Commercial loans and leases 90 days or more past due and still accruing interest, were $168 million atDecember 31, 2005, an increase of $30 million compared to December 31, 2004. The increase was driven by commercial—foreign loans in the U.K. See Note 1 of the Consolidated Financial Statements for additional information on past duecommercial loans and leases.
Provision for Credit Losses
The Provision for Credit Losses was $4.0 billion, a 45 percent increase over 2004.
The consumer portion of the Provision for Credit Losses increased $992 million to $4.4 billion in 2005, primarilydriven by consumer net charge-offs of $4.2 billion. Credit card net charge-offs increased $1.3 billion from 2004 to $3.7billion with an estimated $578 million related to the increase in bankruptcy filings as customers rushed to file ahead ofthe new law. Also contributing to the increase in credit card net charge-offs were organic growth and seasoning of theportfolio, increases effective in 2004 in credit card minimum payment requirements, the impact of the FleetBostonportfolio and the impact of new advances on accounts for which previous loan balances were sold to the securitizationtrusts. We estimate that approximately 70 percent of the bankruptcy-related charge-offs represent acceleration ofcharge-offs from 2006. Excluding bankruptcy-related charge-offs representing acceleration from 2006 and charge-offsassociated with the 2004 changes in credit card minimum payment requirements that were provided for in late 2004, theincreased credit card net charge-offs were the primary driver of higher Provision for Credit Losses. In addition, theProvision for Credit Losses was impacted by new advances on accounts for which previous loan balances were sold to thesecuritization trusts, and the establishment of reserves in 2005 for additional changes made in late 2005 in credit cardminimum payment requirements. The establishment of a $50 million reserve associated with Hurricane Katrina forestimated losses on residential mortgage, home equity and indirect automobile products also contributed to the provisionincrease.
The commercial portion of the Provision for Credit Losses increased $161 million to negative $370 million. Thenegative provision in 2005 reflects continued improvement in commercial credit quality, although at a slower pace thanexperienced in 2004. An improved risk profile in Latin America and reduced uncertainties resulting from the completionof credit-related integration activities for FleetBoston also drove the negative provision.
The Provision for Credit Losses related to unfunded lending commitments increased $92 million to negative $7million as the rate of improvement in commercial credit quality slowed.
Allowance for Credit Losses
Allowance for Loan and Lease Losses
The Allowance for Loan and Lease Losses is allocated based on two components. We evaluate the adequacy of theAllowance for Loan and Lease Losses based on the combined total of these two components.
The first component of the Allowance for Loan and Lease Losses covers those commercial loans that are eithernonperforming or impaired. An allowance is allocated when the discounted cash flows (or collateral value or observablemarket price) are lower than the carrying value of that loan. For purposes of computing the specific loss component ofthe allowance, larger impaired loans are evaluated individually and smaller impaired loans are evaluated as a pool usinghistorical loss experience for the respective product type and risk rating of the loans.
The second component of the Allowance for Loan and Lease Losses covers performing commercial loans and leases,and consumer loans. The allowance for commercial loan and lease losses is established by product type after analyzinghistorical loss experience by internal risk rating, current economic conditions, industry performance trends, geographicor obligor concentrations within each portfolio segment, and any other pertinent information. The commercial historicalloss experience is updated quarterly to incorporate the most recent data reflective of the current economic environment.As of December 31, 2005, quarterly updating of historical loss experience did not have a material impact to the allowancefor commercial loan and lease losses. The allowance for consumer loan and lease losses is based on aggregated portfoliosegment evaluations, generally by product type. Loss forecast models are utilized for consumer products that consider avariety of factors including, but not limited to, historical loss experience, estimated defaults or foreclosures based onportfolio trends, delinquencies, economic trends and credit scores. These consumer loss forecast models are updated on aquarterly basis in order to incorporate information reflective of the current economic environment. As of December 31,2005, quarterly updating of the loss forecast models to reflect estimated bankruptcy-related net charge-offs acceleratedfrom 2006 resulted in a decrease in the allowance for consumer loan and lease losses.
62
Included within the second component of the Allowance for Loan and Lease Losses are previously unallocatedreserves maintained to cover uncertainties that affect our estimate of probable losses including the imprecision inherentin the forecasting methodologies, domestic and global economic uncertainty, large single name defaults and event risk.In the fourth quarter of 2005, we assigned these reserves to our individual products to better reflect our view of risk inthese portfolios.
We monitor differences between estimated and actual incurred loan and lease losses. This monitoring processincludes periodic assessments by senior management of loan and lease portfolios and the models used to estimateincurred losses in those portfolios.
Additions to the Allowance for Loan and Lease Losses are made by charges to the Provision for Credit Losses. Creditexposures deemed to be uncollectible are charged against the Allowance for Loan and Lease Losses. Recoveries ofpreviously charged off amounts are credited to the Allowance for Loan and Lease Losses.
The Allowance for Loan and Lease Losses for the consumer portfolio as presented in Table 25 increased $137 millionfrom December 31, 2004 to $4.5 billion at December 31, 2005. Credit card accounted for $153 million of this increase andwas primarily driven by new advances on accounts for which previous loan balances were sold to the securitizationtrusts, organic growth and continued seasoning which resulted in higher loss expectations. These increases were mostlyoffset by the use of reserves to absorb the estimated bankruptcy net charge-off acceleration from 2006. Increases in theallowance for non-credit card consumer products were driven by broad-based loan growth and seasoning, with theexception of the other consumer product category which decreased as a result of the run-off portfolios from ourpreviously exited consumer businesses.
The allowance for commercial loan and lease losses was $3.5 billion at December 31, 2005, a $718 million decreasefrom December 31, 2004. This decrease resulted from continued improvement in commercial credit quality, includingreduced exposure and an improved risk profile in Latin America, the use of reserves to absorb a portion of domesticairline charge-offs and a reduction of reserves due to reduced uncertainties resulting from the completion of credit-related integration activities for FleetBoston during 2005.
Reserve for Unfunded Lending Commitments
In addition to the Allowance for Loan and Lease Losses, we also estimate probable losses related to unfundedlending commitments, such as letters of credit and financial guarantees, and binding unfunded loan commitments.Unfunded lending commitments are subject to individual reviews, and are analyzed and segregated by risk according toour internal risk rating scale. These risk classifications, in conjunction with an analysis of historical loss experience,current economic conditions and performance trends within specific portfolio segments, and any other pertinentinformation result in the estimation of the reserve for unfunded lending commitments. The reserve for unfunded lendingcommitments is included in Accrued Expenses and Other Liabilities on the Consolidated Balance Sheet.
We monitor differences between estimated and actual incurred credit losses upon draws of the commitments. Thismonitoring process includes periodic assessments by senior management of credit portfolios and the models used toestimate incurred losses in those portfolios.
Changes to the reserve for unfunded lending commitments are made through the Provision for Credit Losses. Thereserve for unfunded lending commitments at December 31, 2005 was $395 million, a decrease of $7 million fromDecember 31, 2004.
63
Table 24 presents a rollforward of the allowance for credit losses for five years ending December 31, 2005.
Loans and leases outstanding at December 31 (Restated) . . . . . . . . . . . . . . . . . . $573,791 $521,813 $371,433 $342,890 $329,153Allowance for loan and lease losses as a percentage of loans and leases
outstanding at December 31 (Restated) . . . . . . . . . . . . . . . . . . . . . . . . . . . . . . . 1.40% 1.65% 1.66% 1.85% 1.91%Consumer allowance for loan and lease losses as a percentage of consumer
loans and leases outstanding at December 31 (Restated) (3) . . . . . . . . . . . . . . 1.27 1.34 1.25 0.95 1.12Commercial allowance for loan and lease losses as a percentage of
commercial loans and leases outstanding at December 31(3) . . . . . . . . . . . . . . 1.62 2.19 2.40 2.43 2.16Average loans and leases outstanding during the year (Restated) . . . . . . . . . . . $537,218 $472,617 $356,220 $336,820 $365,447Net charge-offs as a percentage of average loans and leases outstanding
during the year (Restated) . . . . . . . . . . . . . . . . . . . . . . . . . . . . . . . . . . . . . . . . . . 0.85% 0.66% 0.87% 1.10% 1.16%Allowance for loan and lease losses as a percentage of nonperforming loans
and leases at December 31 . . . . . . . . . . . . . . . . . . . . . . . . . . . . . . . . . . . . . . . . . . 532 390 215 126 139Ratio of the allowance for loan and lease losses at December 31 to net charge-
(1) Includes $635 million related to the exit of the subprime real estate lending business in 2001.(2) Includes $395 million related to the exit of the subprime real estate lending business in 2001.(3) The 2004 and 2003 data presented in the table have been reclassified to reflect the assignment of general reserves to individual
products.
64
For reporting purposes, we allocate the allowance for credit losses across products. However, the allowance isavailable to absorb any credit losses without restriction. Table 25 presents our allocation by product type.
Table 25
Allocation of the Allowance for Credit Losses by Product Type
(1) Includes allowance for loan and lease losses of commercial impaired loans of $55 million, $202 million, $391 million, $919 million,and $763 million at December 31, 2005, 2004, 2003, 2002, and 2001, respectively.
(2) At December 31, 2005, general reserves were assigned to individual product types to better reflect our view of risk in theseportfolios. The 2004 and 2003 data presented in the table have been reclassified to reflect the assignment of general reserves.Information was not available to assign general reserves by product types prior to 2003.
n/a = Not available; included in commercial—domestic at December 31, 2002 and 2001.
Market Risk Management
Market risk is the risk that values of assets and liabilities or revenues will be adversely affected by changes inmarket conditions such as market movements. This risk is inherent in the financial instruments associated with ouroperations and/or activities including loans, deposits, securities, short-term borrowings, long-term debt, trading accountassets and liabilities, and derivatives. Market-sensitive assets and liabilities are generated through loans and depositsassociated with our traditional banking business, our customer and proprietary trading operations, our ALM process,credit risk mitigation activities, and mortgage banking activities.
Our traditional banking loan and deposit products are nontrading positions and are reported at amortized cost forassets or the amount owed for liabilities (historical cost). While the accounting rules require a historical cost view oftraditional banking assets and liabilities, these positions are still subject to changes in economic value based on varyingmarket conditions. Interest rate risk is the effect of changes in the economic value of our loans and deposits, as well asour other interest rate sensitive instruments, and is reflected in the levels of future income and expense produced bythese positions versus levels that would be generated by current levels of interest rates. We seek to mitigate interest raterisk as part of the ALM process.
We seek to mitigate trading risk within our prescribed risk appetite using hedging techniques. Trading positions arereported at estimated market value with changes reflected in income. Trading positions are subject to various riskfactors, which include exposures to interest rates and foreign exchange rates, as well as equity, mortgage, commodityand issuer risk factors. We seek to mitigate these risk exposures by utilizing a variety of financial instruments. Thefollowing discusses the key risk components along with respective risk mitigation techniques.
Interest Rate Risk
Interest rate risk represents exposures we have to instruments whose values vary with the level of interest rates.These instruments include, but are not limited to, loans, debt securities, certain trading-related assets and liabilities,deposits, borrowings and derivative instruments. We seek to mitigate risks associated with the exposures in a variety ofways that typically involve taking offsetting positions in cash or derivative markets. The cash and derivative
65
instruments allow us to seek to mitigate risks by reducing the effect of movements in the level of interest rates, changesin the shape of the yield curve as well as changes in interest rate volatility. Hedging instruments used to mitigate theserisks include related derivatives such as options, futures, forwards and swaps.
Foreign Exchange Risk
Foreign exchange risk represents exposures we have to changes in the values of current holdings and future cashflows denominated in other currencies. The types of instruments exposed to this risk include investments in foreignsubsidiaries, foreign currency-denominated loans, foreign currency-denominated securities, future cash flows in foreigncurrencies arising from foreign exchange transactions, and various foreign exchange derivative instruments whosevalues fluctuate with changes in currency exchange rates or foreign interest rates. Instruments used to mitigate thisrisk are foreign exchange options, currency swaps, futures, forwards and deposits. These instruments help insulate usagainst losses that may arise due to volatile movements in foreign exchange rates or interest rates.
Mortgage Risk
Our exposure to mortgage risk takes several forms. First, we trade and engage in market-making activities in avariety of mortgage securities, including whole loans, pass-through certificates, commercial mortgages, andcollateralized mortgage obligations. Second, we originate a variety of asset-backed securities, which involves theaccumulation of mortgage-related loans in anticipation of eventual securitization. Third, we may hold positions inmortgage securities and residential mortgage loans as part of the ALM portfolio. Fourth, we create MSRs as part of ourmortgage activities. See Notes 1 and 9 of the Consolidated Financial Statements for additional information on MSRs.These activities generate market risk since these instruments are sensitive to changes in the level of market interestrates, changes in mortgage prepayments and interest rate volatility. Options, futures, forwards, swaps, swaptions andmortgage-backed securities are used to hedge mortgage risk by seeking to mitigate the effects of changes in interestrates.
Equity Market Risk
Equity market risk arises from exposure to securities that represent an ownership interest in a corporation in theform of common stock or other equity-linked instruments. The instruments held that would lead to this exposureinclude, but are not limited to, the following: common stock, listed equity options (puts and calls), over-the-counterequity options, equity total return swaps, equity index futures and convertible bonds. We seek to mitigate the riskassociated with these securities via hedging on a portfolio or name basis that focuses on reducing volatility from changesin stock prices. Instruments used for risk mitigation include options, futures, swaps, convertible bonds and cashpositions.
Commodity Risk
Commodity risk represents exposures we have to products traded in the petroleum, natural gas, metals and powermarkets. Our principal exposure to these markets emanates from customer-driven transactions. These transactionsconsist primarily of futures, forwards, swaps and options. We seek to mitigate exposure to the commodity markets withinstruments including, but not limited to, options, futures and swaps in the same or similar commodity product, as wellas cash positions.
Issuer Credit Risk
Our portfolio is exposed to issuer credit risk where the value of an asset may be adversely impacted for variousreasons directly related to the issuer, such as management performance, financial leverage or reduced demand for theissuer’s goods or services. Perceived changes in the creditworthiness of a particular debtor or sector can have significanteffects on the replacement costs of cash and derivative positions. We seek to mitigate the impact of credit spreads, creditmigration and default risks on the market value of the trading portfolio with the use of CDS, and credit fixed income andsimilar securities.
Trading Risk Management
Trading-related revenues represent the amount earned from our trading positions, which include trading accountassets and liabilities, as well as derivative positions and, prior to the conversion of the Certificates into MSRs, marketvalue adjustments to the Certificates and the MSRs. Trading positions are taken in a diverse range of financialinstruments and markets. Trading account assets and liabilities, and derivative positions are reported at fair value.MSRs are reported at the lower of cost or market. For more information on fair value, see Complex AccountingEstimates beginning on page 74. For additional information on MSRs, see Notes 1 and 9 of the Consolidated FinancialStatements. Trading Account Profits represent the net amount earned from our trading positions and, as reported in the
66
Consolidated Statement of Income, do not include the Net Interest Income recognized on trading positions, or the relatedfunding charge or benefit. Trading Account Profits can be volatile and are largely driven by general market conditionsand customer demand. Trading Account Profits are dependent on the volume and type of transactions, the level of riskassumed, and the volatility of price and rate movements at any given time within the ever-changing marketenvironment.
The histogram of daily revenue or loss below is a graphic depiction of trading volatility and illustrates the daily levelof trading-related revenue for 2005. Trading-related revenue encompasses proprietary trading and customer-relatedactivities. During 2005, positive trading-related revenue was recorded for 81 percent of the trading days. Furthermore,only six percent of the total trading days had losses greater than $10 million, and the largest loss was $41 million. Thiscan be compared to 2004, where positive trading-related revenue was recorded for 87 percent of the trading days andonly five percent of the total trading days had losses greater than $10 million, and the largest loss was $27 million.
To evaluate risk in our trading activities, we focus on the actual and potential volatility of individual positions aswell as portfolios. At a portfolio and corporate level, we use Value-at-Risk (VAR) modeling and stress testing. VAR is akey statistic used to measure and manage market risk. Trading limits and VAR are used to manage day-to-day risks andare subject to testing where we compare expected performance to actual performance. This testing provides us a view ofour models’ predictive accuracy. All limit excesses are communicated to senior management for review.
A VAR model estimates a range of hypothetical scenarios to calculate a potential loss which is not expected to beexceeded with a specified confidence level. These estimates are impacted by the nature of the positions in the portfolioand the correlation within the portfolio. Within any VAR model, there are significant and numerous assumptions thatwill differ from company to company. Our VAR model assumes a 99 percent confidence level. Statistically, this meansthat losses will exceed VAR, on average, one out of 100 trading days, or two to three times each year. Actual losses didnot exceed VAR in 2005 or 2004.
In addition to reviewing our underlying model assumptions, we seek to mitigate the uncertainties related to theseassumptions and estimates through close monitoring and by updating the assumptions and estimates on an ongoingbasis. If the results of our analysis indicate higher than expected levels of risk, proactive measures are taken to adjustrisk levels.
67
The following graph shows actual losses did not exceed VAR in 2005.
68
Table 26 presents average, high and low daily VAR for 2005 and 2004.
Table 26
Trading Activities Market RiskTwelve Months Ended December 31
2005 2004VAR VAR
(Dollars in millions) Average High(1) Low(1) Average High(1) Low(1)
(1) The high and low for the total portfolio may not equal the sum of the individual components as the highs or lows of the individualportfolios may have occurred on different trading days.
(2) Credit includes credit fixed income and CDS used for credit risk management. Average VAR for CDS was $69.0 million and $23.5million in 2005 and 2004. In 2005, the Credit VAR was less than VAR for CDS used for credit risk management as the positions incredit fixed income typically offset the risk of CDS. The relationship between overall Credit VAR and the VAR for CDS can changeover time as a result of changes in the relative sizes of the credit fixed income and CDS exposures.
(3) Real estate/mortgage includes capital market real estate and the Certificates. Effective June 1, 2004, Real estate/mortgage nolonger includes the Certificates. For additional information on the Certificates, see Note 1 of the Consolidated FinancialStatements.
(4) Total market-based trading portfolio excludes CDS used for credit risk management, net of the effect of diversification.
The increase in average VAR of the trading portfolio for 2005 was primarily due to increases in the average risktaken in credit due to an increase in credit protection purchased to hedge the credit risk in our commercial loan portfolio.
Stress Testing
Because the very nature of a VAR model suggests results can exceed our estimates, we “stress test” our portfolio.Stress testing estimates the value change in our trading portfolio due to abnormal market movements. Various stressscenarios are run regularly against the trading portfolio to verify that, even under extreme market moves, we willpreserve our capital; to determine the effects of significant historical events; and to determine the effects of specific,extreme hypothetical, but plausible events. The results of the stress scenarios are calculated daily and reported to seniormanagement as part of the regular reporting process. The results of certain specific, extreme hypothetical scenarios arepresented to the Asset and Liability Committee.
Interest Rate Risk Management
Interest rate risk represents the most significant market risk exposure to our nontrading financial instruments. Ouroverall goal is to manage interest rate risk so that movements in interest rates do not adversely affect Net InterestIncome. Interest rate risk is measured as the potential volatility in our Net Interest Income caused by changes in marketinterest rates. Client facing activities, primarily lending and deposit-taking, create interest rate sensitive positions onour balance sheet. Interest rate risk from these activities as well as the impact of changing market conditions ismanaged through the ALM process.
Sensitivity simulations are used to estimate the impact on Net Interest Income of numerous interest rate scenarios,balance sheet trends and strategies. These simulations estimate levels of short-term financial instruments, debtsecurities, loans, deposits, borrowings and derivative instruments. In addition, these simulations incorporateassumptions about balance sheet dynamics such as loan and deposit growth and pricing, changes in funding mix, andasset and liability repricing and maturity characteristics. In addition to Net Interest Income sensitivity simulations,market value sensitivity measures are also utilized.
The Balance Sheet Management group maintains a Net Interest Income forecast utilizing different rate scenarios,with the base case utilizing the forward market curve. The Balance Sheet Management group constantly updates theNet Interest Income forecast for changing assumptions and differing outlooks based on economic trends and marketconditions. Thus, we continually monitor our balance sheet position in an effort to maintain an acceptable level ofexposure to volatile interest rate changes.
69
We prepare forward looking forecasts of Net Interest Income. These baseline forecasts take into considerationexpected future business growth, ALM positioning, and the direction of interest rate movements as implied by themarkets’ forward interest rate curve. We then measure and evaluate the impact that alternative interest rate scenarioshave to these static baseline forecasts in order to assess interest rate sensitivity under varied conditions. The spot and12-month forward rates used in our respective baseline forecasts at December 31, 2005 and 2004 were as follows:
The following table reflects the pre-tax dollar impact to forecasted Core Net Interest Income over the next twelvemonths from December 31, 2005 and 2004, resulting from a 100 bp gradual parallel increase, a 100 bp gradual paralleldecrease, a 100 bp gradual curve flattening (increase in short-term rates) and a 100 bp gradual curve steepening(increase in long-tem rates) from the forward curve.
Table 28
Estimated Net Interest Income at Risk(Dollars in millions) December 31
The sensitivity analysis above assumes that we take no action in response to these rate shifts over the indicatedyears.
Beyond what is already implied in the forward curve, we are modestly exposed to rising rates primarily due toincreased funding costs. Conversely, we would benefit from falling rates or a steepening of the yield curve beyond what isalready implied in the forward curve.
As part of the ALM process, we use securities, residential mortgages, and interest rate and foreign exchangederivatives in managing interest rate sensitivity.
Securities
The securities portfolio is integral to our ALM process. The decision to purchase or sell securities is based upon thecurrent assessment of economic and financial conditions, including the interest rate environment, liquidity andregulatory requirements, and the relative mix of our cash and derivative positions. During 2005, we purchased securitiesof $204.5 billion, sold $134.5 billion, and received paydowns of $37.7 billion. During 2004, we purchased securities of$243.6 billion, sold $117.7 billion, and received paydowns of $31.8 billion. During the year, we continuously monitoredour interest rate risk position and effected changes in the securities portfolio in order to manage prepayment risk andinterest rate risk. Through sales in the securities portfolio, we realized $1.1 billion in Gains on Sales of Debt Securitiesduring 2005 and $1.7 billion during 2004. The decrease was primarily due to lower gains realized on mortgage-backedsecurities and corporate bonds.
Residential Mortgage Portfolio
During 2005, we purchased $32.0 billion of residential mortgages related to the ALM process. We had wholemortgage loan sales of $10.1 billion during 2005. During 2004, we purchased $65.9 billion of residential mortgagesrelated to the ALM process and had minimal sales of whole mortgage loans. Additionally, we received paydowns of $35.8billion and $44.4 billion for 2005 and 2004. Through sales of whole mortgage loans, we recognized gains that wererecorded as Other Income of $45 million for 2005, compared to losses of $2 million in 2004.
70
Interest Rate and Foreign Exchange Derivative Contracts
Interest rate and foreign exchange derivative contracts are utilized in our ALM process and serve as an efficient toolto mitigate our risk. We use derivatives to hedge the changes in cash flows or market values of our balance sheet. SeeNote 5 of the Consolidated Financial Statements for additional information on our hedging activities.
Our interest rate contracts are generally nonleveraged generic interest rate and basis swaps, options, futures, andforwards. In addition, we use foreign currency contracts to mitigate the foreign exchange risk associated with foreigncurrency-denominated assets and liabilities, as well as our equity investments in foreign subsidiaries. Table 29 reflectsthe notional amounts, fair value, weighted average receive fixed and pay fixed rates, expected maturity, and estimatedduration of our open ALM derivatives at December 31, 2005 and 2004.
The changes in our swap and option positions reflect actions taken associated with interest rate risk management.The decisions to reposition our derivative portfolio are based upon the current assessment of economic and financialconditions including the interest rate environment, balance sheet composition and trends, and the relative mix of ourcash and derivative positions. The notional amount of our net receive fixed swap position (including foreign exchangecontracts) decreased $328 million to $22.8 billion at December 31, 2005 compared to December 31, 2004. The notionalamount of our net option position decreased $266.6 billion to $57.2 billion at December 31, 2005 compared toDecember 31, 2004. The vast majority of the decrease in the option notional amount was related to terminations andmaturities of short duration options which were hedging short-term repricing risk of our liabilities.
Included in the futures and forward rate contract amounts are $35.0 billion of forward purchase contracts ofmortgage-backed securities and mortgage loans at December 31, 2005 settling from January 2006 to April 2006 with anaverage yield of 5.46 percent and $46.7 billion of forward purchase contracts of mortgage-backed securities and mortgageloans at December 31, 2004 that settled from January 2005 to February 2005 with an average yield of 5.26 percent.There were no forward sale contracts of mortgage-backed securities at December 31, 2005, compared to $25.8 billion atDecember 31, 2004 that settled from January 2005 to February 2005 with an average yield of 5.47 percent.
71
The following table includes derivatives utilized in our ALM process, including those designated as SFAS 133hedges and those used as economic hedges that do not qualify for SFAS 133 hedge accounting treatment. The fair valueof net ALM contracts decreased from $3.4 billion at December 31, 2004 to $(386) million at December 31, 2005. Thedecrease was attributable to decreases in the value of options, foreign exchange contracts and futures and forward ratecontracts, partially offset by increases in the value of interest rate swaps. The decrease in the value of options was due toreduction in outstanding option positions due to terminations, maturities and decreases in the values of remaining openoptions positions. The decrease in the value of foreign exchange contracts was due to the strengthening of the U.S. dollaragainst most foreign currencies during 2005. The decrease in the value of futures and forward rate contracts was due tothe impact of increases in interest rates during 2005 on long futures and forward rate contracts.
Table 29
Asset and Liability Management Interest Rate and Foreign Exchange Contracts
December 31, 2005Expected Maturity Average
EstimatedDuration
(Dollars in millions, averageestimated duration in years)
FairValue Total 2006 2007 2008 2009 2010 Thereafter
(1) At December 31, 2005, $46.6 billion of the receive fixed swap notional amount and $41.9 billion of the pay fixed swap notionalamount represented forward starting swaps that will not be effective until their respective contractual start dates. At December 31,2004, $39.9 billion of the receive fixed swap notional amount and $75.9 billion of the pay fixed swap notional amount representedforward starting swaps that will not be effective until their respective contractual start dates.
(2) Option products include caps, floors, swaptions and exchange-traded options on index futures contracts. These strategies mayinclude option collars or spread strategies, which involve the buying and selling of options on the same underlying security orinterest rate index.
(3) Reflects the net of long and short positions.(4) Futures and forward rate contracts include Eurodollar futures, U.S. Treasury futures, and forward purchase and sale contracts.
72
The Corporation uses interest rate and foreign exchange rate derivative instruments to hedge the variability in thecash flows of its variable rate assets and liabilities, and other forecasted transactions (cash flow hedges). The net losseson both open and closed derivative instruments recorded in Accumulated OCI net-of-tax at December 31, 2005 was $(4.3)billion. These net losses are expected to be reclassified into earnings in the same period when the hedged item affectsearnings and will decrease income or increase expense on the respective hedged items. Assuming no change in open cashflow derivative hedge positions and no changes to interest and foreign exchange rates beyond what is implied in forwardyield curves at December 31, 2005, the net losses are expected to be reclassified into earnings as follows: 9 percentwithin the next year, 57 percent within five years, 82 percent within 10 years, with the remaining 18 percent thereafter.For more information on derivatives designated as cash flow hedges, see Note 5 of the Consolidated FinancialStatements.
The amount included in Accumulated OCI for terminated derivative contracts was a loss of $2.5 billion and a gain of$143 million, net-of-tax, at December 31, 2005 and 2004. The decrease was due primarily to the termination of derivativecontracts with previously unrealized losses caused by interest rate fluctuations.
Mortgage Banking Risk Management
Interest rate lock commitments (IRLCs) on loans intended to be sold are subject to interest rate risk between thedate of the IRLC and the date the loan is funded. Loans held-for-sale are subject to interest rate risk from the date offunding until the loans are sold to the secondary market. To hedge interest rate risk, we utilize forward loan salecommitments and other derivative instruments including purchased options. These instruments are used either as aneconomic hedge of IRLCs and loans held-for-sale, or designated as a cash flow hedge of loans held-for-sale, in which casetheir net-of-tax unrealized gains and losses are included in Accumulated OCI. At December 31, 2005, the notionalamount of derivatives hedging the IRLCs and loans held-for-sale was $26.9 billion. The related net-of-tax unrealized losson the derivatives designated as cash flow hedges included in Accumulated OCI at December 31, 2005 was $3 million.The notional amount of the IRLCs adjusted for fallout in the pipeline at December 31, 2005 was $4.3 billion. The amountof loans held-for-sale at December 31, 2005 was $6.1 billion.
We manage changes in the value of MSRs by entering into derivative financial instruments and by purchasing andselling securities. MSRs are an intangible asset created when the underlying mortgage loan is sold to investors and weretain the right to service the loan. As of December 31, 2005, the MSR balance in Consumer Real Estate was $2.7 billion,or 13 percent higher than December 31, 2004. For more information on Consumer Real Estate MSRs, refer to page 31.
We designate certain derivatives such as purchased options and interest rate swaps as fair value hedges of specifiedMSRs under SFAS 133. At December 31, 2005, the amount of MSRs identified as being hedged by derivatives inaccordance with SFAS 133 was approximately $2.3 billion. The notional amount of the derivative contracts designated asSFAS 133 hedges of MSRs at December 31, 2005 was $33.7 billion. The changes in the fair values of the derivativecontracts are substantially offset by changes in the fair values of the MSRs that are hedged by these derivativecontracts. During 2005, the change in value attributed to SFAS 133 hedged MSRs was $291 million, offset by derivativehedge losses of $124 million.
In addition, we hold additional derivatives and certain securities (i.e. mortgage-backed securities) as economichedges of MSRs, which are not designated as SFAS 133 accounting hedges. During 2005, Interest Income from securitiesused as an economic hedge of MSRs of $18 million was recognized. At December 31, 2005, the amount of MSRs coveredby such economic hedges was $250 million. At December 31, 2005, the unrealized loss on AFS Securities held aseconomic hedges of MSRs was $29 million compared to an unrealized gain of $21 million on December 31, 2004.
See Notes 1 and 9 of the Consolidated Financial Statements for additional information.
Operational Risk Management
Operational risk is the risk of loss resulting from inadequate or failed internal processes, people and systems,including system conversions and integration, and external events. Successful operational risk management isparticularly important to a diversified financial services company like ours because of the very nature, volume andcomplexity of our various businesses.
In keeping with our management governance structure, the lines of business are responsible for all the risks withinthe business including operational risks. Such risks are managed through corporate-wide or line of business specificpolicies and procedures, controls, and monitoring tools. Examples of these include personnel management practices, datareconciliation processes, fraud management units, transaction processing monitoring and analysis, business recoveryplanning, and new product introduction processes.
We approach operational risk from two perspectives, enterprise-wide and line of business-specific. The Complianceand Operational Risk Committee, chartered in 2005 as a subcommittee of the Finance Committee, provides consistentcommunication and oversight of significant operational and compliance issues and oversees the adoption of bestpractices. Two groups within Risk Management, Compliance Risk Management and Enterprise Operational Risk
73
Management, facilitate the consistency of effective policies, industry best practices, controls and monitoring tools formanaging and assessing operational risks across the Corporation. These groups also work with the line of businessexecutives and their Risk Management counterparts to implement appropriate policies, processes and assessments atthe line of business level and support groups. Compliance and operational risk awareness is also driven across theCorporation through training and strategic communication efforts. For selected risks, we establish specialized supportgroups, for example, Information Security and Supply Chain Management. These specialized groups develop corporate-wide risk management practices, such as an information security program and a supplier program to ensure suppliersadopt appropriate policies and procedures when performing work on behalf of the Corporation. These specialized groupsalso assist the lines of business in the development and implementation of risk management practices specific to theneeds of the individual businesses.
At the line of business level, the Line of Business Risk Executives are responsible for adherence to corporatepractices and oversight of all operational risks in the line of business they support. Operational and compliance riskmanagement, working in conjunction with senior line of business executives, have developed key tools to help manage,monitor and summarize operational risk. One tool the businesses and executive management utilize is a corporate-wideself-assessment process, which helps to identify and evaluate the status of risk issues, including mitigation plans, ifappropriate. Its goal is to continuously assess changing market and business conditions and evaluate all operationalrisks impacting the line of business. The self-assessment process assists in identifying emerging operational risk issuesand determining at the line of business or corporate level how they should be managed. In addition to informationgathered from the self-assessment process, key operational risk indicators have been developed and are used to helpidentify trends and issues on both a corporate and a line of business level.
More generally, we mitigate operational risk through a broad-based approach to process management and processimprovement. Improvement efforts are focused on reduction of variation in outputs. We have a dedicated Quality andProductivity team to manage and certify the process management and improvement efforts.
Recent Accounting and Reporting Developments
See Note 1 of the Consolidated Financial Statements for a discussion of recently issued or proposed accountingpronouncements.
Complex Accounting Estimates
Our significant accounting principles as described in Note 1 of the Consolidated Financial Statements, are essentialin understanding Management’s Discussion and Analysis of Results of Operations and Financial Condition. Many of oursignificant accounting principles require complex judgments to estimate values of assets and liabilities. We haveprocedures and processes to facilitate making these judgments.
The more judgmental estimates are summarized below. We have identified and described the development of thevariables most important in the estimation process that, with the exception of accrued taxes, involves mathematicalmodels to derive the estimates. In many cases, there are numerous alternative judgments that could be used in theprocess of determining the inputs to the model. Where alternatives exist, we have used the factors that we believerepresent the most reasonable value in developing the inputs. Actual performance that differs from our estimates of thekey variables could impact Net Income. Separate from the possible future impact to Net Income from input and modelvariables, the value of our lending portfolio and market sensitive assets and liabilities may change subsequent to thebalance sheet measurement, often significantly, due to the nature and magnitude of future credit and market conditions.Such credit and market conditions may change quickly and in unforeseen ways and the resulting volatility could have asignificant, negative effect on future operating results. These fluctuations would not be indicative of deficiencies in ourmodels or inputs.
Allowance for Credit Losses
The allowance for credit losses is our estimate of probable losses in the loans and leases portfolio and within ourunfunded lending commitments. Changes to the allowance for credit losses are reported in the Consolidated Statementof Income in the Provision for Credit Losses. Our process for determining the allowance for credit losses is discussed inthe Credit Risk Management section beginning on page 49 and Note 1 of the Consolidated Financial Statements. Due tothe variability in the drivers of the assumptions made in this process, estimates of the portfolio’s inherent risks andoverall collectibility change with changes in the economy, individual industries, countries and individual borrowers’ orcounterparties’ ability and willingness to repay their obligations. The degree to which any particular assumption affectsthe allowance for credit losses depends on the severity of the change and its relationship to the other assumptions.
Key judgments used in determining the allowance for credit losses include: (i) risk ratings for pools of commercialloans and leases, (ii) market and collateral values and discount rates for individually evaluated loans, (iii) product typeclassifications for consumer and commercial loans and leases, (iv) loss rates used for consumer and commercial loans andleases, (v) adjustments made to assess current events and conditions, (vi) considerations regarding domestic and globaleconomic uncertainty, and (vii) overall credit conditions.
74
Our Allowance for Loan and Lease Losses is sensitive to the risk rating assigned to commercial loans and leases andto the loss rates used for the consumer and commercial portfolios. Assuming a downgrade of one level in the internal riskrating for commercial loans and leases, except loans already risk rated Doubtful as defined by regulatory authorities, theAllowance for Loan and Lease Losses for the commercial portfolio would increase by approximately $894 million atDecember 31, 2005. The Allowance for Loan and Lease Losses as a percentage of loan and lease outstandings atDecember 31, 2005 was 1.40 percent and this hypothetical increase in the allowance would raise the ratio toapproximately 1.56 percent. A 10 percent increase in the loss rates used on the consumer and commercial loan and leaseportfolios would increase the Allowance for Loan and Lease Losses at December 31, 2005 by approximately $348 million,of which $283 million would relate to consumer and $65 million to commercial.
These sensitivity analyses do not represent management’s expectations of the deterioration in risk ratings or theincreases in loss rates but are provided as hypothetical scenarios to assess the sensitivity of the Allowance for Loan andLease Losses to changes in key inputs. We believe the risk ratings and loss severities currently in use are appropriateand that the probability of a downgrade of one level of the internal credit ratings for commercial loans and leases withina short period of time is remote.
The process of determining the level of the allowance for credit losses requires a high degree of judgment. It ispossible that others, given the same information, may at any point in time reach different reasonable conclusions.
Fair Value of Financial Instruments
Trading Account Assets and Liabilities are recorded at fair value, which is primarily based on actively tradedmarkets where prices are based on either direct market quotes or observed transactions. Liquidity is a significant factorin the determination of the fair value of Trading Account Assets or Liabilities. Market price quotes may not be readilyavailable for some positions, or positions within a market sector where trading activity has slowed significantly orceased. Situations of illiquidity generally are triggered by the market’s perception of credit uncertainty regarding asingle company or a specific market sector. In these instances, fair value is determined based on limited availablemarket information and other factors, principally from reviewing the issuer’s financial statements and changes in creditratings made by one or more rating agencies. At December 31, 2005, $4.9 billion, or four percent, of Trading AccountAssets were fair valued using these alternative approaches. An immaterial amount of Trading Account Liabilities werefair valued using these alternative approaches at December 31, 2005.
Trading Account Profits, which represent the net amount earned from our trading positions, can be volatile and arelargely driven by general market conditions and customer demand. Trading Account Profits are dependent on thevolume and type of transactions, the level of risk assumed, and the volatility of price and rate movements at any giventime. To evaluate risk in our trading activities, we focus on the actual and potential volatility of individual positions aswell as portfolios. At a portfolio and corporate level, we use trading limits, stress testing and tools such as VARmodeling, which estimates a potential loss which is not expected to be exceeded with a specified confidence level, tomeasure and manage market risk. At December 31, 2005, the amount of our VAR was $61 million based on a 99 percentconfidence level. For more information on VAR, see pages 67 through 69.
The fair values of Derivative Assets and Liabilities include adjustments for market liquidity, counterparty creditquality, future servicing costs and other deal specific factors, where appropriate. To ensure the prudent application ofestimates and management judgment in determining the fair value of Derivative Assets and Liabilities, variousprocesses and controls have been adopted, which include: a Model Validation Policy that requires a review and approvalof quantitative models used for deal pricing, financial statement fair value determination and risk quantification; aTrading Product Valuation Policy that requires verification of all traded product valuations; and a periodic review andsubstantiation of daily profit and loss reporting for all traded products. These processes and controls are performedindependently of the business segment.
The fair values of Derivative Assets and Liabilities traded in the over-the-counter market are determined usingquantitative models that require the use of multiple market inputs including interest rates, prices, and indices togenerate continuous yield or pricing curves and volatility factors, which are used to value the position. Thepredominance of market inputs are actively quoted and can be validated through external sources, including brokers,market transactions and third-party pricing services. Estimation risk is greater for derivative asset and liabilitypositions that are either option-based or have longer maturity dates where observable market inputs are less readilyavailable or are unobservable, in which case quantitative based extrapolations of rate, price or index scenarios are usedin determining fair values. At December 31, 2005, the fair values of Derivative Assets and Liabilities determined bythese quantitative models were $10.5 billion and $6.4 billion. These amounts reflect the full fair value of the derivativesand do not isolate the discrete value associated with the subjective valuation variable. Further, they represent fourpercent and three percent of Derivative Assets and Liabilities, before the impact of legally enforceable master nettingagreements. For the year ended December 31, 2005, there were no changes to the quantitative models, or uses of suchmodels, that resulted in a material adjustment to the income statement.
75
The Corporation recognizes gains and losses at inception of a derivative contract only if the fair value of the contractis evidenced by a quoted market price in an active market, an observable price or other market transaction, or otherobservable data supporting a valuation model. For those gains and losses not evidenced by the above mentioned marketdata, the transaction price is used as the fair value of the derivative contract. Any difference between the transactionprice and the model fair value is considered an unrecognized gain or loss at inception of the contract. Previouslyunrecognized gains and losses are recorded in income using the straight line method of amortization over the contractuallife of the derivative contract. Earlier recognition of the full unrecognized gain or loss is permitted if the trade isterminated early, subsequent market activity is observed which supports the model fair value of the contract, orsignificant inputs used in the valuation model become observable.
AFS Securities are recorded at fair value, which is generally based on direct market quotes from actively tradedmarkets.
Principal Investing
Principal Investing is included within Equity Investments and is discussed in more detail in Business SegmentOperations beginning on page 26. Principal Investing is comprised of a diversified portfolio of investments in privately-held and publicly-traded companies at all stages, from start-up to buyout. These investments are made either directly ina company or held through a fund. Some of these companies may need access to additional cash to support their long-term business models. Market conditions and company performance may impact whether funding is available fromprivate investors or the capital markets.
Investments with active market quotes are carried at estimated fair value; however, the majority of our investmentsdo not have publicly available price quotations. At December 31, 2005, we had nonpublic investments of $6.1 billion orapproximately 95 percent of the total portfolio. Valuation of these investments requires significant managementjudgment. Management determines values of the underlying investments based on multiple methodologies includingin-depth semi-annual reviews of the investee’s financial statements and financial condition, discounted cash flows, theprospects of the investee’s industry and current overall market conditions for similar investments. In addition, on aquarterly basis as events occur or information comes to the attention of management that indicates a change in thevalue of an investment is warranted, investments are adjusted from their original invested amount to estimated fairvalues at the balance sheet date with changes being recorded in Equity Investment Gains in the Consolidated Statementof Income. Investments are not adjusted above the original amount invested unless there is clear evidence of a fair valuein excess of the original invested amount. This evidence is often in the form of a recent transaction in the investment. Aspart of the valuation process, senior management reviews the portfolio and determines when an impairment needs to berecorded. The Principal Investing portfolio is not material to our Consolidated Balance Sheet, but the impact of thevaluation adjustments may be material to our operating results for any particular quarter.
Accrued Income Taxes
As more fully described in Notes 1 and 18 of the Consolidated Financial Statements, we account for income taxes inaccordance with SFAS No. 109, “Accounting for Income Taxes” (SFAS 109). Accrued income taxes, reported as acomponent of Accrued Expenses and Other Liabilities on our Consolidated Balance Sheet, represents the net amount ofcurrent income taxes we expect to pay to or receive from various taxing jurisdictions attributable to our operations todate. We currently file income tax returns in more than 100 jurisdictions and consider many factors—includingstatutory, judicial and regulatory guidance—in estimating the appropriate accrued income taxes for each jurisdiction.
In applying the principles of SFAS 109, we monitor relevant tax authorities and change our estimate of accruedincome taxes due to changes in income tax laws and their interpretation by the courts and regulatory authorities. Theserevisions of our estimate of accrued income taxes, which also may result from our own income tax planning and from theresolution of income tax controversies, can materially affect our operating results for any given quarter.
Goodwill and Other Intangibles
The nature of and accounting for Goodwill and Other Intangibles is discussed in detail in Notes 1 and 10 of theConsolidated Financial Statements. Goodwill is reviewed for potential impairment at the reporting unit level on anannual basis, or in interim periods if events or circumstances indicate a potential impairment. The reporting unitsutilized for this test were those that are one level below the business segments identified on page 26. The impairmenttest is performed in two steps. The first step of the Goodwill impairment test compares the fair value of the reportingunit with its carrying amount, including Goodwill. If the fair value of the reporting unit exceeds its carrying amount,Goodwill of the reporting unit is considered not impaired; however, if the carrying amount of the reporting unit exceedsits fair value, the second step must be performed. The second step compares the implied fair value of the reporting unit’sGoodwill, as defined in SFAS No. 142, “Goodwill and Other Intangible Assets” (SFAS 142), with the carrying amount ofthat Goodwill. An impairment loss is recorded to the extent that the carrying amount of Goodwill exceeds its implied fairvalue.
76
For Intangible Assets subject to amortization, impairment exists when the carrying amount of the Intangible Assetexceeds its fair value. An impairment loss shall be recognized only if the carrying amount of the Intangible Asset is notrecoverable and exceeds its fair value. The carrying amount of the Intangible Asset is not recoverable if it exceeds thesum of the undiscounted cash flows expected to result from it. An Intangible Asset subject to amortization shall be testedfor recoverability whenever events or changes in circumstances, such as a significant or adverse change in the businessclimate that could affect the value of the Intangible Asset, indicate that its carrying amount may not be recoverable. Animpairment loss shall be measured as the amount by which the carrying amount of the Intangible Asset exceeds its fairvalue.
The fair values of the reporting units were determined using a combination of valuation techniques consistent withthe income approach and the market approach and the fair values of the Intangible Assets were determined using theincome approach. For purposes of the income approach, discounted cash flows were calculated by taking the net presentvalue of estimated cash flows using a combination of historical results, estimated future cash flows and an appropriateprice to earnings multiple. We use our internal forecasts to estimate future cash flows and actual results may differ fromforecasted results. However, these differences have not been material and we believe that this methodology provides areasonable means to determine fair values. Cash flows were discounted using a discount rate based on expected equityreturn rates, which was 11 percent for 2005. Expected rates of equity returns were estimated based on historical marketreturns and risk/return rates for similar industries of the reporting unit. For purposes of the market approach,valuations of reporting units were based on actual comparable market transactions and market earnings multiples forsimilar industries of the reporting unit.
Our evaluations for the year ended December 31, 2005 indicated there was no impairment of Goodwill and OtherIntangibles.
2004 Compared to 2003
The following discussion and analysis provides a comparison of our results of operations for 2004 and 2003. Thisdiscussion should be read in conjunction with the Consolidated Financial Statements and related notes on pages 89through 165. In addition, Tables 2 and 3 contain financial data to supplement this discussion.
Overview
Net Income
Net Income totaled $13.9 billion, or $3.64 per diluted common share, in 2004 compared to $10.8 billion, or $3.55 perdiluted common share, in 2003. The return on average common shareholders’ equity was 16.47 percent in 2004 comparedto 21.50 percent in 2003. These earnings provided sufficient cash flow to allow us to return $8.8 billion and $9.8 billion in2004 and 2003, in capital to shareholders in the form of dividends and share repurchases, net of employee stock optionsexercised.
Net Interest Income
Net Interest Income on a FTE basis increased $7.5 billion to $28.7 billion in 2004. This increase was driven by theimpact of the FleetBoston Merger, higher ALM portfolio levels (primarily consisting of securities and whole loanmortgages), the impact of higher rates, growth in consumer loan levels (primarily credit card and home equity) andhigher core deposit funding levels. Partially offsetting these increases were reductions in the large corporate and foreignloan balances, lower trading-related contributions, lower mortgage warehouse levels and the continued runoff ofpreviously exited consumer businesses. The net interest yield on a FTE basis declined nine bps to 3.17 percent in 2004due to the adverse impact of increased trading-related balances, which have a lower yield than other earning assets.
Noninterest Income
Noninterest Income increased $3.7 billion to $21.0 billion in 2004, due primarily to increases in Card Income of $1.5billion, Service Charges of $1.4 billion, Investment and Brokerage Services of $1.2 billion, Equity Investment Gains of$648 million, and Trading Account Profits of $461 million. Card Income increased due to increased fees and interchangeincome, including the impact of the FleetBoston card portfolio. Investment and Brokerage Services increased due to theimpact of the FleetBoston business as well as market appreciation. Service Charges grew driven by organic accountgrowth and the impact of FleetBoston customers. Offsetting these increases was lower Mortgage Banking Income of $1.5billion due to lower production levels, a decrease in the gains on sales of loans to the secondary market and writedownsof the value of MSRs.
Provision for Credit Losses
The Provision for Credit Losses declined $70 million to $2.8 billion in 2004 driven by lower commercial net charge-offs of $748 million and continued improvements in credit quality in the commercial loan portfolio. Offsetting thesedecreases were increases in the Provision for Credit Losses in our consumer credit card portfolio. These increases
77
reflected higher credit card net charge-offs of $791 million in part due to the impact of the FleetBoston credit cardportfolio, organic growth and continued seasoning of accounts, and new advances on accounts for which previous loanbalances were sold to the securitization trusts. Also contributing to the consumer provision was the establishment ofreserves for changes made to card minimum payment requirements.
Gains on Sales of Debt Securities
Gains on Sales of Debt Securities in 2004 and 2003, were $1.7 billion and $941 million, as we continued to repositionthe ALM portfolio in response to interest rate fluctuations and to manage mortgage prepayment risk.
Noninterest Expense
Noninterest Expense increased $6.9 billion in 2004 from 2003, due primarily to higher Personnel Expense, increasedOther General Operating Expense, and higher Merger and Restructuring Charges. Personnel Expense increased $3.0billion primarily due to the impact of FleetBoston associates. Other General Operating Expense increased $1.5 billionrelated to the impact of FleetBoston, $370 million of litigation expenses incurred during 2004 and the $285 millionrelated to the mutual fund settlement. Merger and Restructuring Charges were $618 million in connection with theintegration of FleetBoston’s operations.
Income Tax Expense
Income Tax Expense was $7.0 billion, reflecting an effective tax rate of 33.3 percent, in 2004 compared to $5.0 billionand 31.8 percent, in 2003. The difference in the effective tax rate between years resulted primarily from the applicationof purchase accounting to certain leveraged leases acquired in the FleetBoston Merger, an increase in state tax expensegenerally related to higher tax rates in the Northeast and the reduction in 2003 of Income Tax Expense resulting from atax settlement with the Internal Revenue Service.
Business Segment Operations
Global Consumer and Small Business Banking
Total Revenue increased $5.6 billion, or 28 percent, in 2004 compared to 2003, primarily due to the impact ofFleetBoston. Overall loan and deposit growth from the impact of FleetBoston customers contributed to the $4.9 billion,or 44 percent, increase in Net Interest Income. This increase was largely due to the net effect of growth in consumerloans and leases, deposit balances and ALM activities. Increases in Card Income of 51 percent, and Service Charges of 26percent drove the $703 million, or eight percent, increase in Noninterest Income. FleetBoston also contributed to theincrease in Noninterest Income. Partially offsetting these increases was a decrease in Mortgage Banking Income of 72percent. Net Income rose $642 million, or 12 percent, due to the increases in Net Interest Income and NoninterestIncome discussed above, offset by increases in the Provision for Credit Losses and Noninterest Expense. Higher creditcard net charge-offs, the impact of the FleetBoston credit card portfolio, organic growth and seasoning of credit cardaccounts, new advances on accounts for which previous loan balances were sold to the securitization trusts, andincreases in card minimum payment requirements resulted in a $1.6 billion, or 97 percent, increase in the Provision forCredit Losses. Noninterest Expense increased $3.0 billion, or 31 percent, due to increases in Processing Costs, PersonnelExpense and Other General Operating Expense related to the impact of FleetBoston.
Global Business and Financial Services
Total Revenue increased $3.4 billion, or 58 percent, in 2004 compared to 2003. Net Interest Income increased $2.3billion, or 54 percent, largely due to the increase in commercial loans and leases, deposit balances driven by the impactof FleetBoston earning assets and the net results of ALM activities. Noninterest Income increased $1.1 billion, or 68percent due to increases in Other Noninterest Income and increases in Service Charges, driven by the impact ofFleetBoston. Noninterest Expense increased $1.5 billion, or 70 percent, due to the impact of FleetBoston. Net Incomerose $1.8 billion, or 85 percent, due to the increases discussed above. Also impacting Net Income was the Provision forCredit Losses which declined $968 million to negative $442 million, driven by a notable improvement in credit qualityand a $395 million decrease in net charge-offs.
Global Capital Markets and Investment Banking
Total Revenue increased $695 million, or eight percent, in 2004 compared to 2003 driven by an increase inNoninterest Income. Net Interest Income decreased $175 million, or four percent, driven by a $196 million, or ninepercent decrease in trading-related Net Interest Income. Noninterest Income increased $870 million, or 21 percent,resulting from increases in Trading Account Profits, Investment Banking Income, and Service Charges. In 2004, NetIncome increased $174 million, or 10 percent, due to the increase in Noninterest Income and lower Provision for Credit
78
Losses offset by an increase in Noninterest Expense. Provision for Credit Losses declined $753 million to negative $445million due to a notable improvement in credit quality in the large corporate portfolio and a $312 million reduction innet charge-offs. Noninterest Expense increased by $1.2 billion, or 22 percent, driven by an increase in litigation-relatedcharges, higher incentive compensation for market-based activities, and this segment’s allocation of the mutual fundsettlement.
Global Wealth and Investment Management
Total Revenue increased $1.9 billion, or 47 percent, in 2004. Net Interest Income increased $915 million, or 47percent, due to growth in Deposits, loan growth and the impact of FleetBoston earning assets to the portfolio.Noninterest Income increased $986 million, or 47 percent, driven by increased Investment and Brokerage Servicesrevenue primarily due to the impact of FleetBoston. Net Income increased $366 million, or 30 percent. This increase wasdue to the increases in Net Interest Income and Noninterest Income offset by higher Noninterest Expense. NoninterestExpense increased $1.3 billion, or 64 percent, related to the impact of FleetBoston and this segment’s allocation of themutual fund settlement.
All Other
In 2004 compared to 2003, Total Revenue decreased $339 million, or 53 percent. Net Interest Income decreased $352million to negative $695 million primarily due to a reduction of capital in Other as more capital was deployed to thebusiness segments. Offsetting this decrease was a $166 million increase in total revenue associated with the change inthe fair value derivatives used as economic hedges of interest and foreign exchange rate fluctuations that do not qualifyfor SFAS 133 hedge accounting. Provision for Credit Losses increased $43 million, or 14 percent. Gains on Sales of DebtSecurities increased $675 million to $1.6 billion in 2004 as we continued to reposition the ALM portfolio in response tochanges in interest rates and to manage mortgage prepayment risk. Other Noninterest Expense decreased $78 millionand included Merger and Restructuring Charges of $618 million in 2004. As a result, Net Income improved $232 million.Total Revenue in Equity Investments increased $704 million in 2004 compared to 2003 due to an improvement in EquityInvestment Gains (Losses). Equity Investments had Net Income of $202 million in 2004 compared to a Net Loss of $246million in 2003. In 2004, Principal Investing revenue increased as a result of increased realized gains compared to theprior year. Noninterest Income primarily consists of Equity Investment Gains.
79
Table I
Average Balances and Interest Rates—FTE Basis
20052004
(Restated)2003
(Restated)
(Dollars in millions)AverageBalance
InterestIncome/Expense
Yield/Rate
AverageBalance
InterestIncome/Expense
Yield/Rate
AverageBalance
InterestIncome/Expense
Yield/Rate
Earning assetsTime deposits placed and other short-term investments . . . . . . . . . . . $ 14,286 $ 472 3.30% $ 14,254 $ 362 2.54% $ 9,056 $ 172 1.90%Federal funds sold and securities purchased under agreements to
(1) Nonperforming loans are included in the respective average loan balances. Income on these nonperforming loans is recognized on a cash basis.(2) Includes consumer finance of $3,137 million, $3,735 million and $4,137 million in 2005, 2004 and 2003, respectively; foreign consumer of $3,565
million, $3,020 million and $1,977 million in 2005, 2004 and 2003, respectively; and consumer lease financing of $206 million, $962 million and $2,751million in 2005, 2004 and 2003, respectively.
(3) Interest income includes the impact of interest rate risk management contracts, which increased interest income on the underlying assets $704million, $2,130 million and $2,581 million in 2005, 2004 and 2003, respectively. Interest expense includes the impact of interest rate risk managementcontracts, which increased interest expense on the underlying liabilities $1,335 million, $1,452 million and $873 million in 2005, 2004 and 2003,respectively. For further information on interest rate contracts, see “Interest Rate Risk Management” beginning on page 69.
(4) Primarily consists of time deposits in denominations of $100,000 or more.
80
Table II
Analysis of Changes in Net Interest Income—FTE Basis
From 2004 to 2005 From 2003 to 2004(Restated) (Restated)
Due to Change in(1)Net
ChangeDue to Change in(1)
NetChange(Dollars in millions) Volume Rate Volume Rate
Increase (decrease) in interest incomeTime deposits placed and other short-term investments . . . . . . . . . $ 1 $ 109 $ 110 $ 99 $ 91 $ 190Federal funds sold and securities purchased under agreements to
Net increase in net interest income . . . $ 2,892 $ 7,528
(1) The changes for each category of interest income and expense are divided between the portion of change attributable to the variancein volume or rate for that category. The unallocated change in rate or volume variance has been allocated between the rate andvolume variances.
(1) Loan maturities are based on the remaining maturities under contractual terms.(2) Loan maturities include other consumer, commercial—foreign and commercial real estate loans.
Table IV
Short-term Borrowings
2005 2004 2003(Restated) (Restated)
(Dollars in millions) Amount Rate Amount Rate Amount Rate
(1) Return on average tangible common shareholders’ equity equals net income available to common shareholders plus amortization ofintangibles, divided by average common shareholders’ equity less goodwill, core deposit intangibles and other intangibles.
(2) The Corporation provided unaudited financial information relating to the fourth quarter of 2005 in the current report on Form 8-Kfiled on January 23, 2006.
84
Table VIII
Quarterly Average Balances and Interest Rates—FTE Basis
Fourth Quarter 2005(5)Third Quarter 2005
(Restated)
(Dollars in millions)AverageBalance
InterestIncome/Expense
Yield/Rate
AverageBalance
InterestIncome/Expense
Yield/Rate
Earning assetsTime deposits placed and other short-term investments . . . . . . . . . . . . . $ 14,619 $ 132 3.59% $ 14,498 $ 125 3.43%Federal funds sold and securities purchased under agreements to
(1) Nonperforming loans are included in the respective average loan balances. Income on these nonperforming loans is recognized on acash basis.
(2) Includes consumer finance of $2,916 million, $3,063 million, $3,212 million and $3,362 million in the fourth, third, second and firstquarters of 2005, respectively, and $3,473 million in the fourth quarter of 2004; foreign consumer of $3,682 million, $3,541 million,$3,505 million and $3,532 million in the fourth, third, second and first quarters of 2005, respectively, and $3,523 million in thefourth quarter of 2004; and consumer lease financing of $55 million, $111 million, $251 million and $411 million in the fourth,third, second and first quarters of 2005, respectively, and $561 million in the fourth quarter of 2004.
85
Second Quarter 2005(Restated)
First Quarter 2005(Restated)
Fourth Quarter 2004(Restated)
(Dollars in millions)AverageBalance
InterestIncome/Expense
Yield/Rate
InterestAverageBalance
Income/Expense
Yield/Rate
AverageBalance
InterestIncome/Expense
Yield/Rate
Earning assetsTime deposits placed and other short-term
(3) Interest income includes the impact of interest rate risk management contracts, which increased interest income on the underlyingassets $29 million, $86 million, $168 million and $421 million in the fourth, third, second and first quarters of 2005, respectively,and $439 million in the fourth quarter of 2004. Interest expense includes the impact of interest rate risk management contracts,which increased interest expense on the underlying liabilities $254 million, $274 million, $303 million and $504 million in thefourth, third, second and first quarters of 2005, respectively, and $295 million in the fourth quarter of 2004. For further informationon interest rate contracts, see “Interest Rate Risk Management” beginning on page 69.
(4) Primarily consists of time deposits in denominations of $100,000 or more.(5) The Corporation provided unaudited financial information relating to the fourth quarter of 2005 in its current report on Form 8-K
filed on January 23, 2006.
86
Item 7A. QUANTITATIVE AND QUALITATIVE DISCLOSURES ABOUT MARKET RISK
See “Market Risk Management” in the MD&A beginning on page 65 which is incorporated herein by reference.
Item 8. FINANCIAL STATEMENTS AND SUPPLEMENTARY DATA
Report of Management on Internal Control Over Financial Reporting
The management of Bank of America Corporation is responsible for establishing and maintaining adequate internalcontrol over financial reporting.
The Corporation’s internal control over financial reporting is a process designed to provide reasonable assuranceregarding the reliability of financial reporting and the preparation of financial statements for external purposes inaccordance with accounting principles generally accepted in the United States of America. The Corporation’s internalcontrol over financial reporting includes those policies and procedures that (i) pertain to the maintenance of records that,in reasonable detail, accurately and fairly reflect the transactions and dispositions of the assets of the company;(ii) provide reasonable assurance that transactions are recorded as necessary to permit preparation of financialstatements in accordance with accounting principles generally accepted in the United States of America, and thatreceipts and expenditures of the company are being made only in accordance with authorizations of management anddirectors of the company; and (iii) provide reasonable assurance regarding prevention or timely detection ofunauthorized acquisition, use, or disposition of the company’s assets that could have a material effect on the financialstatements.
Because of its inherent limitations, internal control over financial reporting may not prevent or detectmisstatements. Also, projections of any evaluation of effectiveness to future periods are subject to the risk that controlsmay become inadequate because of changes in conditions, or that the degree of compliance with the policies orprocedures may deteriorate.
Management assessed the effectiveness of the Corporation’s internal control over financial reporting as ofDecember 31, 2005, based on the framework set forth by the Committee of Sponsoring Organizations of the TreadwayCommission in Internal Control—Integrated Framework. Based on that assessment, management concluded that, as ofDecember 31, 2005, the Corporation’s internal control over financial reporting is effective based on the criteriaestablished in Internal Control—Integrated Framework.
Management’s assessment of the effectiveness of the Corporation’s internal control over financial reporting as ofDecember 31, 2005, has been audited by PricewaterhouseCoopers, LLP, an independent registered public accountingfirm, as stated in their report appearing on page 88.
Kenneth D. LewisChairman, President and Chief Executive Officer
Alvaro G. de MolinaChief Financial Officer
87
Report of Independent Registered Public Accounting FirmTo the Board of Directors and Shareholders of Bank of America Corporation:
We have completed integrated audits of Bank of America Corporation’s 2005 and 2004 Consolidated FinancialStatements and of its internal control over financial reporting as of December 31, 2005, and an audit of its 2003Consolidated Financial Statements in accordance with the standards of the Public Company Accounting OversightBoard (United States). Our opinions, based on our audits, are presented below.
Consolidated Financial Statements
In our opinion, the accompanying Consolidated Balance Sheet and the related Consolidated Statement of Income,Consolidated Statement of Changes in Shareholders’ Equity and Consolidated Statement of Cash Flows present fairly, inall material respects, the financial position of Bank of America Corporation and its subsidiaries at December 31, 2005and 2004, and the results of their operations and their cash flows for each of the three years in the period endedDecember 31, 2005 in conformity with accounting principles generally accepted in the United States of America. TheseConsolidated Financial Statements are the responsibility of the Corporation’s management. Our responsibility is toexpress an opinion on these Consolidated Financial Statements based on our audits. We conducted our audits of theseConsolidated Financial Statements in accordance with the standards of the Public Company Accounting OversightBoard (United States). Those standards require that we plan and perform the audit to obtain reasonable assuranceabout whether the financial statements are free of material misstatement. An audit of financial statements includesexamining, on a test basis, evidence supporting the amounts and disclosures in the financial statements, assessing theaccounting principles used and significant estimates made by management, and evaluating the overall financialstatement presentation. We believe that our audits provide a reasonable basis for our opinion.
As discussed in Note 1 of the Consolidated Financial Statements, the Corporation has restated its 2004 and 2003Consolidated Financial Statements.
Internal Control Over Financial Reporting
Also, in our opinion, management’s assessment, included in the Report of Management on Internal Control OverFinancial Reporting appearing on page 87 of the Annual Report, that the Corporation maintained effective internalcontrol over financial reporting as of December 31, 2005 based on criteria established in Internal Control—IntegratedFramework issued by the Committee of Sponsoring Organizations of the Treadway Commission (COSO), is fairly stated,in all material respects, based on those criteria. Furthermore, in our opinion, the Corporation maintained, in all materialrespects, effective internal control over financial reporting as of December 31, 2005, based on criteria established inInternal Control—Integrated Framework issued by the COSO. The Corporation’s management is responsible formaintaining effective internal control over financial reporting and for its assessment of the effectiveness of internalcontrol over financial reporting. Our responsibility is to express opinions on management’s assessment and on theeffectiveness of the Corporation’s internal control over financial reporting based on our audit. We conducted our audit ofinternal control over financial reporting in accordance with the standards of the Public Company Accounting OversightBoard (United States). Those standards require that we plan and perform the audit to obtain reasonable assuranceabout whether effective internal control over financial reporting was maintained in all material respects. An audit ofinternal control over financial reporting includes obtaining an understanding of internal control over financial reporting,evaluating management’s assessment, testing and evaluating the design and operating effectiveness of internal control,and performing such other procedures as we consider necessary in the circumstances. We believe that our audit providesa reasonable basis for our opinions.
A company’s internal control over financial reporting is a process designed to provide reasonable assuranceregarding the reliability of financial reporting and the preparation of financial statements for external purposes inaccordance with generally accepted accounting principles. A company’s internal control over financial reporting includesthose policies and procedures that (i) pertain to the maintenance of records that, in reasonable detail, accurately andfairly reflect the transactions and dispositions of the assets of the company; (ii) provide reasonable assurance thattransactions are recorded as necessary to permit preparation of financial statements in accordance with generallyaccepted accounting principles, and that receipts and expenditures of the company are being made only in accordancewith authorizations of management and directors of the company; and (iii) provide reasonable assurance regardingprevention or timely detection of unauthorized acquisition, use, or disposition of the company’s assets that could have amaterial effect on the financial statements.
Because of its inherent limitations, internal control over financial reporting may not prevent or detectmisstatements. Also, projections of any evaluation of effectiveness to future periods are subject to the risk that controlsmay become inadequate because of changes in conditions, or that the degree of compliance with the policies orprocedures may deteriorate.
Charlotte, North CarolinaMarch 14, 2006
88
BANK OF AMERICA CORPORATION AND SUBSIDIARIES
Consolidated Statement of Income
Year Ended December 31
(Dollars in millions, except per share information) 20052004
(1) At December 31, 2005, 2004 and 2003, Accumulated Other Comprehensive Income (Loss) includes Net Unrealized Gains (Losses) onAvailable-for-sale (AFS) Debt and Marketable Equity Securities of $(2,978) million, $(197) million and $(70) million, respectively;Net Unrealized Gains (Losses) on Foreign Currency Translation Adjustments of $(122) million, $(155) million and $(168) million,respectively; Net Gains (Losses) on Derivatives of $(4,338) million, $(2,279) million and $(2,094) million, respectively; and Other of$(118) million, $(133) million and $(102) million, respectively.
(2) For additional information on Accumulated OCI, see Note 14 of the Consolidated Financial Statements.(3) For additional information on the restatement adjustments, see Note 1 of the Consolidated Financial Statements.(4) Includes adjustment for the fair value of outstanding FleetBoston Financial Corporation (FleetBoston) stock options of $862 million.
See accompanying Notes to Consolidated Financial Statements.
Assets and liabilities of a certain multi-seller asset-backed commercial paper conduit that was consolidated amounted to $4,350 millionin 2003.
Net transfers of Loans and Leases to loans held-for-sale (included in Other Assets) from the loan portfolio for Asset and LiabilityManagement purposes amounted to $73 million in 2005.
Net transfers of Loans and Leases from loans held-for-sale to the loan portfolio for Asset and Liability Management purposes amountedto $1,106 million and $9,683 million in 2004 and 2003.
In 2004, the fair values of noncash assets acquired and liabilities assumed in the merger with FleetBoston were $224,492 million and$182,862 million.
In 2004, approximately 1.2 billion shares of common stock, valued at approximately $45,622 million, were issued in connection with themerger with FleetBoston.
See accompanying Notes to Consolidated Financial Statements.
92
BANK OF AMERICA CORPORATION AND SUBSIDIARIES
Notes to Consolidated Financial Statements
Bank of America Corporation and its subsidiaries (the Corporation) through its banking and nonbankingsubsidiaries, provide a diverse range of financial services and products throughout the U.S. and in selected internationalmarkets. At December 31, 2005, the Corporation operated its banking activities primarily under two charters: Bank ofAmerica, National Association (Bank of America, N.A.) and Bank of America, N.A. (USA). On June 13, 2005, FleetNational Bank merged with and into Bank of America, N.A., with Bank of America, N.A. as the surviving entity. Thismerger had no impact on the Consolidated Financial Statements of the Corporation. On June 30, 2005, the Corporationannounced a definitive agreement to acquire all outstanding shares of MBNA Corporation (MBNA) (the MBNA Merger).The transaction was effective January 1, 2006. On April 1, 2004, the Corporation acquired all of the outstanding stock ofFleetBoston Financial Corporation (FleetBoston) (the FleetBoston Merger).
Note 1—Summary of Significant Accounting Principles
Restatement
The Corporation is restating its historical financial statements for the years 2004 and 2003, for the quarters in 2005and 2004, and other selected financial data for the years 2002 and 2001. These restatements and resulting revisionsrelate to the accounting treatment for certain derivative transactions under the Statement of Financial AccountingStandards (SFAS) No. 133, “Accounting for Derivative Instruments and Hedging Activities, as amended” (SFAS 133).
As a result of an internal review completed in the first quarter of 2006 of the hedge accounting treatment of certainderivatives, the Corporation concluded that certain hedging relationships did not adhere to the requirements of SFAS133. The derivatives involved were used as hedges principally against changes in interest rates and foreign currencyrates in the Asset and Liability Management (ALM) process.
A number of the transactions included in the restatement did not meet the strict requirements of the “shortcut”method of accounting under SFAS 133. Although these hedging relationships would have qualified for hedge accountingif the “long haul” method had been applied, SFAS 133 does not permit the use of the “long haul” method retroactively.Consequently, the restatement assumes hedge accounting was not applied to these derivatives and the related hedgeditem during the periods under review. A majority of these transactions related to internal interest rate swaps wherebythe Corporation used its centralized trading desk to execute these trades to achieve operational effectiveness and costefficiency. These interest rate swap trades were executed internally between the Corporation’s treasury operations andthe centralized trading desk. It has been the Corporation’s long standing policy to lay these internal swaps off to anexternal party within a three-day period. In almost all cases, cash was exchanged (either paid or received) with theexternal counterparty to compensate for market rate movements between the time that the internal swap and thematching trade with the external counterparty were executed. Although the overall external trade, including the cashexchanged, was transacted at a fair market value of zero, the cash exchanged offset the fair market value of the externalswap which was other than zero. Swaps with a fair market value other than zero at the inception of the hedge cannotqualify for hedge accounting under the shortcut method. Accordingly, the shortcut method was incorrectly applied forsuch derivative instruments.
The Corporation also entered into certain cash flow hedges which utilized the centralized trading desk to lay off theinternal trades with an external party. The key attributes, including interest rates and maturity dates, of the internaland external trades were not properly matched. The Corporation performed the effectiveness assessment and measure ofineffectiveness on the internal trades instead of the external trades. As a result, such tests were not performed inaccordance with the requirements of SFAS 133. Accordingly, hedge accounting was incorrectly applied for suchderivative instruments.
The Corporation used various derivatives in other hedging relationships to hedge changes in fair value or cash flowsattributable to either interest or foreign currency rates. Although these transactions were documented as hedgingrelationships at inception of the hedge, the upfront and ongoing effectiveness testing was either not performed,documented or assessed in accordance with SFAS 133. In addition, for one cash flow hedge transaction relating to theanticipated purchase of securities, which impacted the third quarter of 2004 by $399 million, the timing of an amountreclassified from Accumulated OCI to earnings upon the subsequent sale of such securities was adjusted. Adjustments tocorrect the accounting for those hedging relationships are included in the restated results. We do not believe that theseadjustments are material individually or in the aggregate to our financial results for any reported period.
93
BANK OF AMERICA CORPORATION AND SUBSIDIARIES
Notes to Consolidated Financial Statements—(Continued)
The following table sets forth the effects of the adjustments on Net Income for the years 2004 and 2003. Since wecould not apply hedge accounting for those transactions, the derivative transactions have been marked to marketthrough the Consolidated Statement of Income with no related offset for hedge accounting.
Increase (Decrease) in Net Income (1)
Year Ended December 31(Dollars in millions) 2004 2003
(1) For presentation purposes, certain numbers have been rounded.
The following tables set forth the effects of the restatement adjustments on affected line items within our previouslyreported Consolidated Statement of Income for the years 2004 and 2003, Consolidated Balance Sheet as of December 31,2004, Consolidated Statement of Changes in Shareholders’ Equity for the years 2004 and 2003, and ConsolidatedStatement of Cash Flows for the years 2004 and 2003.
Bank of America Corporation and Subsidiaries
Consolidated Statement of Income
Year Ended December 312004 2003
(Dollars in millions, except per share information)
Notes to Consolidated Financial Statements—(Continued)
Principles of Consolidation and Basis of Presentation
The Consolidated Financial Statements include the accounts of the Corporation and its majority-owned subsidiaries,and those variable interest entities (VIEs) where the Corporation is the primary beneficiary. All significantintercompany accounts and transactions have been eliminated. Results of operations of companies purchased areincluded from the dates of acquisition. Certain prior period amounts have been reclassified to conform to current periodpresentation. Assets held in an agency or fiduciary capacity are not included in the Consolidated Financial Statements.The Corporation accounts for investments in companies in which it owns a voting interest of 20 percent to 50 percentand for which it has the ability to exercise significant influence over operating and financing decisions using the equitymethod of accounting. These investments are included in Other Assets and the Corporation’s proportionate share ofincome or loss is included in Other Income and Accumulated Other Comprehensive Income (OCI), where applicable.
The preparation of the Consolidated Financial Statements in conformity with accounting principles generallyaccepted in the United States requires management to make estimates and assumptions that affect reported amountsand disclosures. Actual results could differ from those estimates and assumptions.
Recently Issued or Proposed Accounting Pronouncements
On February 16, 2006, the Financial Accounting Standards Board (FASB) issued SFAS No. 155, “Accounting forCertain Hybrid Instruments” (SFAS 155), which permits, but does not require, fair value accounting for any hybridfinancial instrument that contains an embedded derivative that would otherwise require bifurcation in accordance withSFAS 133. The statement also subjects beneficial interests issued by securitization vehicles to the requirements of SFAS133. The statement is effective as of January 1, 2007, with earlier adoption permitted. Management is currentlyevaluating the effect of the statement on the Corporation’s results of operations and financial condition.
On August 11, 2005, the FASB issued two exposure drafts which would amend SFAS No. 140, “Accounting forTransfers and Servicing of Financial Assets and Extinguishments of Liabilities—a replacement of FASB StatementNo. 125” (SFAS 140). The exposure draft, “Accounting for Transfers of Financial Assets,” would revise and clarify thecriteria for derecognition of transferred financial assets. It would also place restrictions on the ability of a qualifyingspecial purpose entity to roll over beneficial interests such as short-term commercial paper. The provisions of thisexposure draft are expected to be effective at various dates beginning in 2006. Management is currently evaluating theeffect of the provisions of the exposure draft on the Corporation’s results of operations and financial condition. Thesecond exposure draft, “Accounting for Servicing of Financial Assets,” would permit, but not require, an entity to accountfor one or more classes of servicing rights (i.e., mortgage servicing rights, or MSRs) at fair value, with changes in fairvalue recorded in income. The exposure draft is expected to be issued during the first quarter of 2006, to be effective as ofJanuary 1, 2006. The Corporation expects to utilize the fair value approach for MSRs upon adoption of this standard.The final statement is not expected to have a material impact on the Corporation’s results of operations or financialcondition.
On July 14, 2005, the FASB issued an exposure draft, FASB Staff Position (FSP) No. FAS 13-a, “Accounting for aChange or Projected Change in the Timing of Cash Flows Relating to Income Taxes Generated by a Leveraged LeaseTransaction” (FSP 13-a). The FASB has met recently to discuss modifications to and finalization of FSP 13-a due, inpart, to comment letters received in response to the exposure draft. It is anticipated that FSP 13-a will be effectiveJanuary 1, 2007 and that the impact of adoption should be reflected as a change in the opening balance of retainedearnings in the period of adoption. FSP 13-a’s principal provision is the requirement that a lessor recalculate therecognition of lease income when there is a change in the estimated timing of the cash flows relating to income taxesgenerated by such leveraged lease. This provision is expected to be retained in the final version, which the FASB expectsto complete during the first quarter of 2006.
Management is considering the potential impact of the Internal Revenue Service’s (IRS) stated position on certainleveraged leases and the impact of such position on the Corporation and its predecessors’ federal income tax returns.Depending on the final provisions of FSP 13-a and the final resolution with the IRS, adoption of FSP 13-a may have amaterial impact on the Corporation’s current accounting treatment for leveraged leases. Adoption of the FSP wouldresult in both an adjustment to Goodwill for leveraged leases acquired as part of the FleetBoston Merger and a change inthe opening balance of retained earnings in the period of adoption.
On July 14, 2005, the FASB issued an exposure draft, “Accounting for Uncertain Tax Positions—an interpretation ofFASB Statement No. 109.” The exposure draft, as modified by recent FASB deliberations, requires recognition of a taxbenefit to the extent of management’s best estimate of the impact of a tax position, provided it is more likely than notthat the tax position would be sustained based on its technical merits. The exposure draft is expected to be effective
96
BANK OF AMERICA CORPORATION AND SUBSIDIARIES
Notes to Consolidated Financial Statements—(Continued)
January 1, 2007. Management is currently evaluating the effect of the exposure draft, which is required to be reflectedas a change in the opening balance of retained earnings in the period of adoption.
On December 16, 2004, the FASB issued SFAS No. 123 (revised 2004) “Share-based Payment” (SFAS 123R) whicheliminates the ability to account for share-based compensation transactions, including grants of employee stock options,using Accounting Principles Board (APB) Opinion No. 25, “Accounting for Stock Issued to Employees” (APB 25), andgenerally requires that such transactions be accounted for using a fair value-based method with the resultingcompensation cost recognized over the period that the employee is required to provide service in order to receive theircompensation. SFAS 123R also amends SFAS No. 95, “Statement of Cash Flows,” requiring the benefits of taxdeductions in excess of recognized compensation costs to be reported as financing cash flows, rather than as operatingcash flows as currently required. The Corporation adopted the fair value-based method of accounting for stock-basedemployee compensation prospectively as of January 1, 2003. The Corporation adopted SFAS 123R effective January 1,2006 under the modified-prospective application. Upon adoption of SFAS 123R and as a result of a recent Securities andExchange Commission (SEC) Staff (the Staff) interpretation, the Corporation changed its approach for recognizing stockcompensation cost for employees who meet certain age and service criteria and thus, are retirement eligible as describedin the plan. For any new awards granted, the Corporation will recognize stock compensation cost immediately forawards granted to retirement eligible employees or over the period from the grant date to the date retirement eligibilityis achieved. Prior to adoption of SFAS 123R, awards granted to retirement eligible employees were expensed over thestated vesting period. Accordingly, the Corporation expects that earnings per common share will be reduced byapproximately $0.05 in the first quarter due to the acceleration of stock-based compensation expense. The incrementalimpact of the change is approximately $0.04 for the full year when compared to expensing over the stated vesting period.
Stock-based Compensation
SFAS No. 148, “Accounting for Stock-Based Compensation—Transition and Disclosure—an amendment of FASBStatement No. 123,” (SFAS 148) was adopted prospectively by the Corporation on January 1, 2003. SFAS 148 providesalternative methods of transition for a voluntary change to the fair value-based method of accounting for stock-basedemployee compensation. All stock options granted under plans before the adoption date will continue to be accounted forunder APB 25 unless these stock options are modified or settled subsequent to adoption. SFAS 148 was effective for allstock option awards granted in 2003 and thereafter. Under APB 25, the Corporation accounted for stock options usingthe intrinsic value method and no compensation expense was recognized, as the grant price was equal to the strike price.Under the fair value method, stock option compensation expense is measured on the date of grant using an option-pricing model. The option-pricing model is based on certain assumptions and changes to those assumptions may result indifferent fair value estimates.
In accordance with SFAS 148, the Corporation provides disclosures as if it had adopted the fair value-based methodof measuring all outstanding employee stock options during 2005, 2004 and 2003. The following table presents the effecton Net Income and Earnings per Common Share had the fair value-based method been applied to all outstanding andunvested awards for 2005, 2004 and 2003.
Year Ended December 31
(Dollars in millions, except per share data) 20052004
(1) Includes all awards granted, modified or settled for which the fair value was required to be measured under SFAS 123, exceptrestricted stock. Restricted stock expense (net of taxes), included in Net Income for 2005, 2004 and 2003 was $308 million, $187million and $179 million.
97
BANK OF AMERICA CORPORATION AND SUBSIDIARIES
Notes to Consolidated Financial Statements—(Continued)
In determining the pro forma disclosures in the previous table, the fair value of options granted was estimated onthe date of grant using the Black-Scholes option-pricing model and assumptions appropriate to each plan. The Black-Scholes model was developed to estimate the fair value of traded options, which have different characteristics thanemployee stock options, and changes to the subjective assumptions used in the model can result in materially differentfair value estimates. The weighted average grant date fair values of the options granted during 2005, 2004 and 2003were based on the assumptions below. See Note 17 of the Consolidated Financial Statements for further discussion.
Compensation expense under the fair value-based method is recognized over the vesting period of the related stockoptions. Accordingly, the pro forma results of applying SFAS 123 in 2005, 2004 and 2003 may not be indicative of futureamounts.
Cash and Cash Equivalents
Cash on hand, cash items in the process of collection, and amounts due from correspondent banks and the FederalReserve Bank are included in Cash and Cash Equivalents.
Securities Purchased under Agreements to Resell and Securities Sold under Agreements to Repurchase
Securities Purchased under Agreements to Resell and Securities Sold under Agreements to Repurchase are treatedas collateralized financing transactions and are recorded at the amounts at which the securities were acquired or soldplus accrued interest. The Corporation’s policy is to obtain the use of Securities Purchased under Agreements to Resell.The market value of the underlying securities, which collateralize the related receivable on agreements to resell, ismonitored, including accrued interest. The Corporation may require counterparties to deposit additional collateral orreturn collateral pledged, when appropriate.
Collateral
The Corporation has accepted collateral that it is permitted by contract or custom to sell or repledge. AtDecember 31, 2005, the fair value of this collateral was approximately $179.1 billion of which $112.5 billion was sold orrepledged. At December 31, 2004, the fair value of this collateral was approximately $152.5 billion of which $117.5billion was sold or repledged. The primary source of this collateral is reverse repurchase agreements. The Corporationpledges securities as collateral in transactions that consist of repurchase agreements, public and trust deposits, Treasurytax and loan notes, and other short-term borrowings. This collateral can be sold or repledged by the counterparties to thetransactions.
In addition, the Corporation obtains collateral in connection with its derivative activities. Required collateral levelsvary depending on the credit risk rating and the type of counterparty. Generally, the Corporation accepts collateral inthe form of cash, U.S. Treasury securities and other marketable securities. Based on provisions contained in legalnetting agreements, the Corporation has netted cash collateral against the applicable derivative mark-to-marketexposures. Accordingly, the Corporation offsets its obligation to return or its right to reclaim cash collateral against thefair value of the derivatives being collateralized.
Trading Instruments
Financial instruments utilized in trading activities are stated at fair value. Fair value is generally based on quotedmarket prices. If quoted market prices are not available, fair values are estimated based on dealer quotes, pricing modelsor quoted prices for instruments with similar characteristics. Realized and unrealized gains and losses are recognized inTrading Account Profits.
Derivatives and Hedging Activities
All derivatives are recognized on the Consolidated Balance Sheet at fair value, taking into consideration the effectsof legally enforceable master netting agreements that allow the Corporation to settle positive and negative positions
98
BANK OF AMERICA CORPORATION AND SUBSIDIARIES
Notes to Consolidated Financial Statements—(Continued)
and offset cash collateral held with the same counterparty on a net basis. For exchange-traded contracts, fair value isbased on quoted market prices. For non-exchange traded contracts, fair value is based on dealer quotes, pricing modelsor quoted prices for instruments with similar characteristics.
The Corporation recognizes gains and losses at inception of a contract only if the fair value of the contract is evidencedby a quoted market price in an active market, an observable price or other market transaction, or other observable datasupporting a valuation model in accordance with EITF Issue No. 02-3, “Issues Involved in Accounting for DerivativeContracts Held for Trading Purposes and Contracts Involved in Energy Trading and Risk Management Activities”. For thosegains and losses not evidenced by the above mentioned market data, the transaction price is used as the fair value of thecontract. Any difference between the transaction price and the model fair value is considered an unrecognized gain or loss atinception of the contract. These unrecognized gains and losses are recorded in income using the straight line method ofamortization over the contractual life of the derivative contract. Earlier recognition of the full unrecognized gain or loss ispermitted if the trade is terminated early, subsequent market activity is observed which supports the model fair value of thecontract, or significant inputs used in the valuation model become observable in the market.
The Corporation designates at inception whether the derivative contract is considered hedging or non-hedging forSFAS 133 accounting purposes. Non-hedging derivatives held for trading purposes are included in Derivative Assets orDerivative Liabilities with changes in fair value reflected in Trading Account Profits. Other non-hedging derivatives thatare considered economic hedges, but not designated in a hedging relationship for accounting purposes, are also includedin Derivative Assets or Derivative Liabilities with changes in fair value recorded in Trading Account Profits, MortgageBanking Income or Other Income on the Consolidated Statement of Income. Credit derivatives used by the Corporationdo not qualify for hedge accounting under SFAS 133 despite being effective economic hedges with changes in the fairvalue of these derivatives included in Trading Account Profits. Changes in the fair value of derivatives that serve aseconomic hedges of MSRs are recorded in Mortgage Banking Income, after June 1, 2004. Changes in the fair value ofderivatives that serve as ALM economic hedges, which do not qualify or were not designated as accounting hedges, arerecorded in Other Income.
For SFAS 133 hedges, the Corporation formally documents at inception all relationships between hedginginstruments and hedged items, as well as its risk management objectives and strategies for undertaking variousaccounting hedges. Additionally, the Corporation uses dollar offset or regression analysis at the hedge’s inception and foreach reporting period thereafter to assess whether the derivative used in its hedging transaction is expected to be andhas been highly effective in offsetting changes in the fair value or cash flows of the hedged items. The Corporationdiscontinues hedge accounting when it is determined that a derivative is not expected to be or has ceased to be highlyeffective as a hedge, and then reflects changes in fair value in earnings after termination of the hedge relationship.
The Corporation uses its derivatives designated as hedging for accounting purposes as either fair value hedges, cashflow hedges or hedges of net investments in foreign operations. The Corporation manages interest rate and foreigncurrency exchange rate sensitivity predominantly through the use of derivatives. Fair value hedges are used to limit theCorporation’s exposure to total changes in the fair value of its fixed interest-earning assets or interest-bearing liabilitiesthat are due to interest rate or foreign exchange volatility. Cash flow hedges are used to minimize the variability in cashflows of interest-earning assets or interest-bearing liabilities or forecasted transactions caused by interest rate or foreignexchange fluctuation. The maximum length of time over which forecasted transactions are hedged is 29 years, with asubstantial portion of the hedged transactions being less than 10 years. Changes in the fair value of derivativesdesignated for hedging activities that are highly effective as hedges are recorded in earnings or Accumulated OCI,depending on whether the hedging relationship satisfies the criteria for a fair value or cash flow hedge. Hedgeineffectiveness and gains and losses on the excluded component of a derivative in assessing hedge effectiveness arerecorded in earnings in the same income statement caption that is used to record hedge effectiveness. SFAS 133 retainscertain concepts under SFAS No. 52, “Foreign Currency Translation,” (SFAS 52) for foreign currency exchange hedging.Consistent with SFAS 52, the Corporation records changes in the fair value of derivatives used as hedges of the netinvestment in foreign operations as a component of Accumulated OCI, to the extent effective.
The Corporation, from time to time, purchases or issues financial instruments containing embedded derivatives. Theembedded derivative is separated from the host contract and carried at fair value if the economic characteristics of thederivative are not clearly and closely related to the economic characteristics of the host contract. To the extent that theCorporation cannot reliably identify and measure the embedded derivative, the entire contract is carried at fair value onthe Consolidated Balance Sheet with changes in fair value reflected in earnings.
If a derivative instrument in a fair value hedge is terminated or the hedge designation removed, the previousadjustments of the carrying amount of the hedged asset or liability are subsequently accounted for in the same manneras other components of the carrying amount of that asset or liability. For interest-earning assets and interest-
99
BANK OF AMERICA CORPORATION AND SUBSIDIARIES
Notes to Consolidated Financial Statements—(Continued)
bearing liabilities, such adjustments are amortized to earnings over the remaining life of the respective asset or liability.If a derivative instrument in a cash flow hedge is terminated or the hedge designation is removed, related amounts inAccumulated OCI are reclassified into earnings in the same period or periods during which the hedged forecastedtransaction affects earnings.
Interest Rate Lock Commitments
The Corporation enters into interest rate lock commitments (IRLCs) in connection with its mortgage bankingactivities to fund residential mortgage loans at specified times in the future. IRLCs that relate to the origination ofmortgage loans that will be held for sale are considered derivative instruments under SFAS No. 149, “Amendment ofStatement 133 on Derivative Instruments and Hedging Activities” (SFAS 149). As such, these IRLCs are recognized atfair value with changes in fair value recorded in Mortgage Banking Income.
Consistent with SEC Staff Accounting Bulletin No. 105, “Application of Accounting Principles to LoanCommitments,” the Corporation does not record any unrealized gain or loss at the inception of the loan commitment,which is the time the commitment is issued to the borrower. The initial value of the loan commitment derivative is basedon the consideration exchanged, if any, for entering into the commitment. In estimating the subsequent fair value of anIRLC, the Corporation assigns a probability to the loan commitment based on an expectation that it will be exercisedand the loan will be funded. This probability is commonly referred to as the pull through assumption. The fair value ofthe commitments is derived from the fair value of related mortgage loans, which is based on a highly liquid, readilyobservable market. Changes to the fair value of IRLCs are recognized based on interest rate changes, changes in theprobability that the commitment will be exercised and the passage of time. Changes from the expected future cash flowsrelated to the customer relationship or loan servicing are excluded from the valuation of the IRLCs.
Outstanding IRLCs expose the Corporation to the risk that the price of the loans underlying the commitments mightdecline from inception of the rate lock to funding of the loan due to increases in mortgage interest rates. To protectagainst this risk, the Corporation utilizes forward loan sales commitments and other derivative instruments, includingoptions, to economically hedge the risk of potential changes in the value of the loans that would result from thecommitments. The Corporation expects that the changes in the fair value of these derivative instruments will offsetchanges in the fair value of the IRLCs.
Securities
Debt securities are classified based on management’s intention on the date of purchase and recorded on theConsolidated Balance Sheet as Securities as of the trade date. Debt securities which management has the intent andability to hold to maturity are classified as held-to-maturity and reported at amortized cost. Debt securities that arebought and held principally for the purpose of resale in the near term are classified as trading instruments and arestated at fair value with unrealized gains and losses included in Trading Account Profits. All other debt securities areclassified as available-for-sale (AFS) and carried at fair value with net unrealized gains and losses included inAccumulated OCI on an after-tax basis.
Interest on debt securities, including amortization of premiums and accretion of discounts, are included in InterestIncome. Realized gains and losses from the sales of debt securities, which are included in Gains on Sales of DebtSecurities, are determined using the specific identification method.
Marketable equity securities are classified based on management’s intention on the date of purchase and recordedon the Consolidated Balance Sheet as of the trade date. Marketable equity securities that are bought and heldprincipally for the purpose of resale in the near term are classified as trading instruments and are stated at fair valuewith unrealized gains and losses included in Trading Account Profits. Other marketable equity securities are classifiedas AFS and either recorded as AFS Securities, if they are a component of the ALM portfolio, or otherwise recorded asOther Assets. All AFS marketable equity securities are carried at fair value with net unrealized gains and lossesincluded in Accumulated OCI on an after-tax basis. Dividend income on AFS marketable equity securities is included inInterest Income. Dividend income on marketable equity securities recorded in Other Assets is included in NoninterestIncome. Realized gains and losses on the sale of all AFS marketable equity securities, which are recorded in EquityInvestment Gains, are determined using the weighted average method.
Investments in equity securities without readily determinable market values are recorded in Other Assets, aregenerally accounted for using the cost method and are subject to impairment testing as applicable.
Equity investments held by Principal Investing, a diversified equity investor in companies at all stages of their lifecycle from startup to buyout, are reported at fair value. Equity investments for which there are active market quotes are
100
BANK OF AMERICA CORPORATION AND SUBSIDIARIES
Notes to Consolidated Financial Statements—(Continued)
carried at estimated fair value based on market prices and recorded as Other Assets. Nonpublic and other equityinvestments for which representative market quotes are not readily available are initially valued at cost. Subsequently,these investments are reviewed semi-annually or on a quarterly basis, where appropriate, and adjusted to reflectchanges in value as a result of initial public offerings, market liquidity, the investees’ financial results, sales restrictions,or other than temporary declines in value. Gains and losses on equity investments, both unrealized and realized, arerecorded in Equity Investment Gains.
Loans and Leases
Loans are reported at their outstanding principal balances net of any unearned income, charge-offs, unamortizeddeferred fees and costs on originated loans, and premiums or discounts on purchased loans. Loan origination fees andcertain direct origination costs are deferred and recognized as adjustments to income over the lives of the related loans.Unearned income, discounts and premiums are amortized to income using methods that approximate the interestmethod.
The Corporation provides equipment financing to its customers through a variety of lease arrangements. Directfinancing leases are carried at the aggregate of lease payments receivable plus estimated residual value of the leasedproperty, less unearned income. Leveraged leases, which are a form of financing lease, are carried net of nonrecoursedebt. Unearned income on leveraged and direct financing leases is amortized over the lease terms by methods thatapproximate the interest method.
Allowance for Credit Losses
The allowance for credit losses which includes the Allowance for Loan and Lease Losses and the reserve forunfunded lending commitments, represents management’s estimate of probable losses inherent in the Corporation’slending activities. The Allowance for Loan and Lease Losses represents the estimated probable credit losses in fundedconsumer and commercial loans and leases while the reserve for unfunded lending commitments, including standbyletters of credit (SBLCs) and binding unfunded loan commitments, represents estimated probable credit losses in theseoff-balance sheet credit instruments based on utilization assumptions. Credit exposures, excluding Derivative Assets andTrading Account Assets, deemed to be uncollectible are charged against these accounts. Cash recovered on previouslycharged off amounts are credited to these accounts.
The Corporation performs periodic and systematic detailed reviews of its lending portfolios to identify credit risksand to assess the overall collectibility of those portfolios. The allowance on certain homogeneous loan portfolios, whichgenerally consist of consumer loans, is based on aggregated portfolio segment evaluations generally by product type.Loss forecast models are utilized for these segments which consider a variety of factors including, but not limited to,historical loss experience, estimated defaults or foreclosures based on portfolio trends, delinquencies, economicconditions and credit scores. These consumer loss forecast models are updated on a quarterly basis in order toincorporate information reflective of the current economic environment. The remaining commercial portfolios arereviewed on an individual loan basis. Loans subject to individual reviews are analyzed and segregated by risk accordingto the Corporation’s internal risk rating scale. These risk classifications, in conjunction with an analysis of historical lossexperience, current economic conditions, industry performance trends, geographic or obligor concentrations within eachportfolio segment, and any other pertinent information (including individual valuations on nonperforming loans inaccordance with SFAS No. 114, “Accounting by Creditors for Impairment of a Loan,” (SFAS 114)) result in the estimationof the allowance for credit losses. The historical loss experience is updated quarterly to incorporate the most recent datareflective of the current economic environment.
If necessary, a specific Allowance for Loan and Lease Losses is established for individual impaired commercial loans.A loan is considered impaired when, based on current information and events, it is probable that the Corporation will beunable to collect all amounts due, including principal and interest, according to the contractual terms of the agreement.Once a loan has been identified as individually impaired, management measures impairment in accordance with SFAS114. Individually impaired loans are measured based on the present value of payments expected to be received,observable market prices, or for loans that are solely dependent on the collateral for repayment, the estimated fair valueof the collateral. If the recorded investment in impaired loans exceeds the present value of payments expected to bereceived, a specific allowance is established as a component of the Allowance for Loan and Lease Losses.
Two components of the Allowance for Loan and Lease Losses are allocated to cover the estimated probable losses ineach loan and lease category based on the results of the Corporation’s detailed review process described above. The firstcomponent covers those commercial loans that are either nonperforming or impaired. The second component covers
101
BANK OF AMERICA CORPORATION AND SUBSIDIARIES
Notes to Consolidated Financial Statements—(Continued)
consumer loans and leases, and performing commercial loans and leases. Included within this second component of theAllowance for Loan and Lease Losses and determined separately from the procedures outlined above are reserves whichare maintained to cover uncertainties that affect the Corporation’s estimate of probable losses including the imprecisioninherent in the forecasting methodologies, as well as domestic and global economic uncertainty and large single namedefaults or event risk. Management evaluates the adequacy of the Allowance for Loan and Lease Losses based on thecombined total of these two components.
In addition to the Allowance for Loan and Lease Losses, the Corporation also estimates probable losses related tounfunded lending commitments, such as letters of credit and financial guarantees, and binding unfunded loancommitments. Unfunded lending commitments are subject to individual reviews and are analyzed and segregated byrisk according to the Corporation’s internal risk rating scale. These risk classifications, in conjunction with an analysisof historical loss experience, current economic conditions, performance trends within specific portfolio segments and anyother pertinent information, result in the estimation of the reserve for unfunded lending commitments.
The allowance for credit losses related to the loan and lease portfolio, and the reserve for unfunded lendingcommitments are reported on the Consolidated Balance Sheet in the Allowance for Loan and Lease Losses, and AccruedExpenses and Other Liabilities. Provision for Credit Losses related to the loans and leases portfolio and unfundedlending commitments are reported in the Consolidated Statement of Income in the Provision for Credit Losses.
Nonperforming Loans and Leases
Credit card loans are charged off at 180 days past due or 60 days from notification of bankruptcy filing and are notclassified as nonperforming. Unsecured consumer loans and deficiencies in non-real estate secured loans are charged offat 120 days past due and not classified as nonperforming. Real estate secured consumer loans are placed on nonaccrualstatus and classified as nonperforming at 90 days past due. The amount deemed uncollectible on real estate securedloans is charged off at 180 days past due. Consumer loans are generally returned to performing status when principal orinterest is less than 90 days past due.
Commercial loans and leases that are past due 90 days or more as to principal or interest, or where reasonabledoubt exists as to timely collection, including loans that are individually identified as being impaired, are generallyclassified as nonperforming unless well-secured and in the process of collection. Loans whose contractual terms havebeen restructured in a manner which grants a concession to a borrower experiencing financial difficulties, withoutcompensation on restructured loans, are classified as nonperforming until the loan is performing for an adequate periodof time under the restructured agreement. In situations where the Corporation does not receive adequate compensation,the restructuring is considered a troubled debt restructuring. Interest accrued but not collected is reversed when acommercial loan is classified as nonperforming. Interest collections on commercial nonperforming loans and leases forwhich the ultimate collectibility of principal is uncertain are applied as principal reductions; otherwise, such collectionsare credited to income when received. Commercial loans and leases may be restored to performing status when allprincipal and interest is current and full repayment of the remaining contractual principal and interest is expected, orwhen the loan otherwise becomes well-secured and is in the process of collection.
Loans Held-for-Sale
Loans held-for-sale include residential mortgage, loan syndications, and to a lesser degree, commercial real estate,consumer finance and other loans, and are carried at the lower of aggregate cost or market value. Loans held-for-sale areincluded in Other Assets.
Premises and Equipment
Premises and Equipment are stated at cost less accumulated depreciation and amortization. Depreciation andamortization are recognized using the straight-line method over the estimated useful lives of the assets. Estimated livesrange up to 40 years for buildings, up to 12 years for furniture and equipment, and the shorter of lease term or estimateduseful life for leasehold improvements.
Mortgage Servicing Rights
Pursuant to agreements between the Corporation and its counterparties, $2.2 billion of Excess Spread Certificates(the Certificates) were converted into MSRs on June 1, 2004. Prior to the conversion of the Certificates into MSRs, theCertificates were accounted for on a mark-to-market basis (i.e. fair value) and changes in the value were recognized asTrading Account Profits. On the date of the conversion, the Corporation recorded these MSRs at the Certificates’ fairmarket value, and that value became their new cost basis. Subsequent to the conversion, the Corporation accounts for
102
BANK OF AMERICA CORPORATION AND SUBSIDIARIES
Notes to Consolidated Financial Statements—(Continued)
the MSRs at the lower of cost or market with impairment recognized as a reduction of Mortgage Banking Income. Exceptfor Note 9 of the Consolidated Financial Statements, what are now referred to as MSRs include the Certificates forperiods prior to the conversion.
During 2004, the Corporation discussed with the Staff the accounting treatment for the Certificates and MSRs. As aresult of this discussion, the conclusion was reached that the Certificates lacked sufficient separation from the MSRs tobe accounted for as described above (i.e. fair value). Accordingly, the Corporation should have continued to account forthe Certificates as MSRs (i.e. lower of cost or market). The effect on our previously filed Consolidated FinancialStatements of following lower of cost or market accounting for the Certificates compared to fair value accounting (i.e. theprior accounting) was adjusted and was not material.
When applying SFAS 133 hedge accounting for derivative financial instruments that have been designated to hedgeMSRs, loans underlying the MSRs being hedged are stratified into pools that possess similar interest rate andprepayment risk exposures. The Corporation has designated the hedged risk as the change in the overall fair value ofthese stratified pools within a daily hedge period. The Corporation performs both prospective and retrospective hedgeeffectiveness evaluations, using regression analyses. A prospective test is performed to determine whether the hedge isexpected to be highly effective at the inception of the hedge. A retrospective test is performed at the end of the dailyhedge period to determine whether the hedge was actually effective.
Other derivatives are used as economic hedges of the MSRs, but are not designated as hedges under SFAS 133.These derivatives are marked to market and recognized through Mortgage Banking Income. Securities are also used aseconomic hedges of MSRs, but do not qualify as hedges under SFAS 133 and, therefore, are accounted for as AFSSecurities with realized gains recorded in Gains on Sales of Debt Securities and unrealized gains or losses recorded inAccumulated OCI in Shareholders’ Equity.
Goodwill and Other Intangibles
Net assets of companies acquired in purchase transactions are recorded at fair value at the date of acquisition, assuch, the historical cost basis of individual assets and liabilities are adjusted to reflect their fair value. Identifiedintangibles are amortized on an accelerated or straight-line basis over the period benefited. Goodwill is not amortizedbut is reviewed for potential impairment on an annual basis, or if events or circumstances indicate a potentialimpairment, at the reporting unit level. The impairment test is performed in two phases. The first step of the Goodwillimpairment test compares the fair value of the reporting unit with its carrying amount, including Goodwill. If the fairvalue of the reporting unit exceeds its carrying amount, Goodwill of the reporting unit is considered not impaired;however, if the carrying amount of the reporting unit exceeds its fair value, an additional procedure must be performed.That additional procedure compares the implied fair value of the reporting unit’s Goodwill (as defined in SFAS No. 142,“Goodwill and Other Intangible Assets” (SFAS 142)) with the carrying amount of that Goodwill. An impairment loss isrecorded to the extent that the carrying amount of Goodwill exceeds its implied fair value. In 2005, 2004 and 2003,Goodwill was tested for impairment and no impairment charges were recorded.
Other intangible assets subject to amortization are evaluated for impairment in accordance with SFAS No. 144“Accounting for the Impairment or Disposal of Long-Lived Assets” (SFAS 144). An impairment loss will be recognized ifthe carrying amount of the intangible asset is not recoverable and exceeds fair value. The carrying amount of theintangible is considered not recoverable if it exceeds the sum of the undiscounted cash flows expected to result from theuse of the asset. At December 31, 2005, intangible assets included on the Consolidated Balance Sheet consist of coredeposit intangibles, purchased credit card relationship intangibles and other customer-related intangibles that areamortized on an accelerated or straight-line basis using an estimated range of anticipated lives of 6 to 10 years.
Special Purpose Financing Entities
In the ordinary course of business, the Corporation supports its customers’ financing needs by facilitating thecustomers’ access to different funding sources, assets and risks. In addition, the Corporation utilizes certain financingarrangements to meet its balance sheet management, funding, liquidity, and market or credit risk management needs.These financing entities may be in the form of corporations, partnerships, limited liability companies or trusts, and aregenerally not consolidated on the Corporation’s Consolidated Balance Sheet. The majority of these activities are basicterm or revolving securitization vehicles for mortgages or other types of loans which are generally funded through term-amortizing debt structures. Other special purpose entities finance their activities by issuing short-term commercialpaper. Both types of vehicles are designed to be paid off from the underlying cash flows of the assets held in the vehicle.
103
BANK OF AMERICA CORPORATION AND SUBSIDIARIES
Notes to Consolidated Financial Statements—(Continued)
Securitizations
The Corporation securitizes, sells and services interests in residential mortgage loans, and from time to time,consumer finance, commercial and credit card loans. The accounting for these activities are governed by SFAS 140. Thesecuritization vehicles are Qualified Special Purpose Entities (QSPEs) which, in accordance with SFAS 140, are legallyisolated, bankruptcy remote and beyond the control of the seller. QSPEs are not included in the consolidated financialstatements of the seller. When the Corporation securitizes assets, it may retain interest-only strips, one or moresubordinated tranches and, in some cases, a cash reserve account which are generally considered residual interests inthe securitized assets. The Corporation may also retain senior tranches in these securitizations. Gains and losses uponsale of the assets depend, in part, on the Corporation’s allocation of the previous carrying amount of the assets to theretained interests. Previous carrying amounts are allocated in proportion to the relative fair values of the assets sold andinterests retained.
Quoted market prices are used to obtain fair values of senior retained interests. Generally, quoted market prices forretained residual interests are not available; therefore, the Corporation estimates fair values based upon the presentvalue of the associated expected future cash flows. This may require management to estimate credit losses, prepaymentspeeds, forward yield curves, discount rates and other factors that impact the value of retained interests. See Note 9 ofthe Consolidated Financial Statements for further discussion.
The excess cash flows expected to be received over the amortized cost of the retained interest is recognized asInterest Income using the effective yield method. If the fair value of the retained interest has declined below its carryingamount and there has been an adverse change in estimated contractual cash flows of the underlying assets, then suchdecline is determined to be other-than-temporary and the retained interest is written down to fair value with acorresponding adjustment to earnings.
Other Special Purpose Financing Entities
Other special purpose financing entities are generally funded with short-term commercial paper. These financingentities are usually contractually limited to a narrow range of activities that facilitate the transfer of or access to varioustypes of assets or financial instruments and provide the investors in the transaction protection from creditors of theCorporation in the event of bankruptcy or receivership of the Corporation. In certain situations, the Corporationprovides liquidity commitments and/or loss protection agreements.
The Corporation determines whether these entities should be consolidated by evaluating the degree to which itmaintains control over the financing entity and will receive the risks and rewards of the assets in the financing entity. Inmaking this determination, the Corporation considers whether the entity is a QSPE, which is generally not required tobe consolidated by the seller or investors in the entity. For non-QSPE structures or VIEs, the Corporation assesseswhether it is the primary beneficiary of the entity. In accordance with FASB Interpretation No. 46 (Revised December2003), “Consolidation of Variable Interest Entities, an interpretation of ARB No. 51” (FIN 46R), the primary beneficiaryis the party that consolidates a VIE based on its assessment that it will absorb a majority of the expected losses orexpected residual returns of the entity, or both. For additional information on other special purpose financing entities,see Note 9 of the Consolidated Financial Statements.
Income Taxes
The Corporation accounts for income taxes in accordance with SFAS No. 109, “Accounting for Income Taxes” (SFAS109), resulting in two components of Income Tax Expense: current and deferred. Current income tax expenseapproximates taxes to be paid or refunded for the current period. Deferred income tax expense results from changes indeferred tax assets and liabilities between periods. These gross deferred tax assets and liabilities represent decreases orincreases in taxes expected to be paid in the future because of future reversals of temporary differences in the bases ofassets and liabilities as measured by tax laws and their bases as reported in the financial statements.
Deferred tax assets have also been recognized for net operating loss carryforwards and tax credit carryforwards.Valuation allowances are then recorded to reduce deferred tax assets to the amounts management concludes are morelikely than not to be realized.
Retirement Benefits
The Corporation has established qualified retirement plans covering substantially all full-time and certain part-timeemployees. Pension expense under these plans is charged to current operations and consists of several components of netpension cost based on various actuarial assumptions regarding future experience under the plans.
104
BANK OF AMERICA CORPORATION AND SUBSIDIARIES
Notes to Consolidated Financial Statements—(Continued)
In addition, the Corporation has established unfunded supplemental benefit plans and supplemental executiveretirement plans for selected officers of the Corporation and its subsidiaries that provide benefits that cannot be paid froma qualified retirement plan due to Internal Revenue Code restrictions. These plans are nonqualified under the InternalRevenue Code and assets used to fund benefit payments are not segregated from other assets of the Corporation;therefore, in general, a participant’s or beneficiary’s claim to benefits under these plans is as a general creditor.
In addition, the Corporation has established several postretirement healthcare and life insurance benefit plans.
Other Comprehensive Income
The Corporation records unrealized gains and losses on AFS Securities, foreign currency translation adjustments,related hedges of net investments in foreign operations and gains and losses on cash flow hedges in Accumulated OCI.Gains and losses on AFS Securities are reclassified to Net Income as the gains or losses are realized upon sale of thesecurities. Other-than-temporary impairment charges are reclassified to Net Income at the time of the charge.Translation gains or losses on foreign currency translation adjustments are reclassified to Net Income upon the sale orliquidation of investments in foreign operations. Gains or losses on derivatives accounted for as hedges are reclassified toNet Income when the hedged transaction affects earnings.
Earnings Per Common Share
Earnings per Common Share is computed by dividing Net Income Available to Common Shareholders by theweighted average common shares issued and outstanding. For Diluted Earnings per Common Share, Net IncomeAvailable to Common Shareholders can be affected by the conversion of the registrant’s convertible preferred stock.Where the effect of this conversion would have been dilutive, Net Income Available to Common Shareholders is adjustedby the associated preferred dividends. This adjusted Net Income is divided by the weighted average number of commonshares issued and outstanding for each period plus amounts representing the dilutive effect of stock options outstanding,restricted stock units and the dilution resulting from the conversion of the registrant’s convertible preferred stock, ifapplicable. The effects of convertible preferred stock, restricted stock units and stock options are excluded from thecomputation of diluted earnings per common share in periods in which the effect would be antidilutive. Dilutivepotential common shares are calculated using the treasury stock method.
Foreign Currency Translation
Assets, liabilities and operations of foreign branches and subsidiaries are recorded based on the functional currencyof each entity. For certain of the foreign operations, the functional currency is the local currency, in which case theassets, liabilities and operations are translated, for consolidation purposes, at current exchange rates from the localcurrency to the reporting currency, the U.S. dollar. The resulting unrealized gains or losses are reported as a componentof Accumulated OCI on an after-tax basis. When the foreign entity is not a free-standing operation or is in ahyperinflationary economy, the functional currency used to measure the financial statements of a foreign entity is theU.S. dollar. In these instances, the resulting realized gains or losses are included in Net Income.
Co-Branding Credit Card Arrangements
The Corporation has co-brand arrangements that entitle a cardholder to receive benefits based on purchases madewith the card. These arrangements have remaining terms generally not exceeding five years. The Corporation may payone-time fees which would be deferred ratably over the term of the arrangement. The Corporation makes monthlypayments to the co-brand partners based on the volume of cardholders’ purchases and on the number of points awardedto cardholders. Such payments are expensed as incurred and are recorded as contra-revenue.
Note 2—FleetBoston Merger and Restructuring Activity
Pursuant to the Agreement and Plan of Merger, dated October 27, 2003, by and between the Corporation andFleetBoston (the FleetBoston Merger Agreement), the Corporation acquired 100 percent of the outstanding stock ofFleetBoston on April 1, 2004, in a tax-free merger to the Corporation, in order to expand the Corporation’s presence inthe Northeast. FleetBoston’s results of operations were included in the Corporation’s results beginning April 1, 2004.
As provided by the FleetBoston Merger Agreement, approximately 1.069 billion shares of FleetBoston common stockwere exchanged for approximately 1.187 billion shares of the Corporation’s common stock. At the date of the FleetBostonMerger, this represented approximately 29 percent of the Corporation’s outstanding common stock. FleetBostonshareholders also received cash of $4 million in lieu of any fractional shares of the Corporation’s common stock that
105
BANK OF AMERICA CORPORATION AND SUBSIDIARIES
Notes to Consolidated Financial Statements—(Continued)
would have otherwise been issued on April 1, 2004. Holders of FleetBoston preferred stock received 1.1 million shares ofthe Corporation’s preferred stock. The Corporation’s preferred stock that was exchanged was valued using the bookvalue of FleetBoston preferred stock. The depositary shares underlying the FleetBoston preferred stock, eachrepresenting a one-fifth interest in the FleetBoston preferred stock prior to the FleetBoston Merger, represent a one-fifthinterest in a share of the Corporation’s preferred stock. The purchase price was adjusted to reflect the effect of the15.7 million shares of FleetBoston common stock that the Corporation already owned.
The FleetBoston Merger was accounted for under the purchase method of accounting in accordance with SFASNo. 141, “Business Combinations” (SFAS 141). Accordingly, the final purchase price was allocated to the assets acquiredand the liabilities assumed based on their estimated fair values at the FleetBoston Merger date as summarized below.
(1) The value of the shares of common stock exchanged with FleetBoston shareholders was based upon the average of the closing pricesof the Corporation’s common stock for the period commencing two trading days before, and ending two trading days after,October 27, 2003, the date of the FleetBoston Merger Agreement.
Unaudited Pro Forma Condensed Combined Financial Information
The following unaudited pro forma condensed combined financial information presents the Corporation's results ofoperations had the FleetBoston Merger taken place at the beginning of each year.
2004 2003(Dollars in millions, except per common share information) (Restated) (Restated)
Notes to Consolidated Financial Statements—(Continued)
Merger and Restructuring Charges
Merger and Restructuring Charges are recorded in the Consolidated Statement of Income, and include incrementalcosts to integrate the Corporation’s and FleetBoston’s operations. These charges represent costs associated with theseone-time activities and do not represent on-going costs of the fully integrated combined organization. Systemsintegrations and related charges, and other, as shown in the following table, are expensed as incurred.
In addition, Merger and Restructuring Charges include costs related to an infrastructure initiative that wasinitiated in the third quarter of 2004 to simplify the Corporation’s business model. These costs were solely severancerelated. The Corporation does not expect to incur additional severance costs related to this initiative.
As of December 31, 2004, there were $382 million of exit costs reserves remaining, which included $291 million forseverance, relocation and other employee-related costs, $87 million for contract terminations, and $4 million for othercharges. During 2005, $17 million of reductions to the exit costs reserves were recorded as a result of revised estimates.Cash payments of $306 million were charged against this liability in 2005, including $239 million of severance,relocation and other employee-related costs, and $67 million of contract terminations reducing the balance in theliability to $59 million at December 31, 2005.
As of December 31, 2004, there were $166 million of restructuring reserves remaining related to severance and otheremployee-related charges. Restructuring reserves in 2005 included an additional charge for the legacy Bank of Americaassociate severance and other employee-related charges of $58 million. These charges included $20 million as a result ofrevised estimates to complete relocations to the Northeast. During 2005, cash payments of $151 million for severanceand other employee-related costs have been charged against this liability reducing the balance to $73 million as ofDecember 31, 2005.
Payments under these exit costs and restructuring reserves are expected to be substantially completed in 2006.
Exit Costs and Restructuring ReservesExit Costs Reserves(1) Restructuring Reserves(2)
(1) Exit costs reserves were established in purchase accounting resulting in an increase in Goodwill.(2) Restructuring reserves were established by a charge to income.
Note 3—MBNA Merger
Pursuant to the Agreement and Plan of Merger, dated June 30, 2005, by and between the Corporation and MBNA(the MBNA Merger Agreement), the Corporation acquired 100 percent of the outstanding stock of MBNA on January 1,2006. The MBNA Merger was a tax-free merger for the Corporation. The acquisition expands the Corporation’s customerbase and its opportunity to deepen customer relationships across the full breadth of the company by deliveringinnovative deposit, lending and investment products and services to MBNA’s customer base. Additionally, theacquisition allows the Corporation to significantly increase its affinity relationships through MBNA’s credit cardoperations. MBNA’s results of operations will be included in the Corporation’s results beginning January 1, 2006.
107
BANK OF AMERICA CORPORATION AND SUBSIDIARIES
Notes to Consolidated Financial Statements—(Continued)
Under the terms of the MBNA Merger Agreement, MBNA stockholders received 0.5009 of a share of theCorporation’s common stock plus $4.125 for each MBNA share of common stock. As provided by the MBNA MergerAgreement, approximately 1,260 million shares of MBNA common stock were exchanged for approximately 631 millionshares of the Corporation’s common stock. At the date of the MBNA Merger, this represented approximately 16 percentof the Corporation’s outstanding common stock. MBNA shareholders also received cash of $5.2 billion. On November 3,2005, MBNA redeemed all shares of its 71⁄2% Series A Cumulative Preferred Stock and Series B Adjustable RateCumulative Preferred Stock, in accordance with the terms of the MBNA Merger Agreement.
The MBNA Merger will be accounted for under the purchase method of accounting in accordance with SFAS 141.The purchase price has been allocated to the assets acquired and the liabilities assumed based on their estimated fairvalues at the MBNA Merger date as summarized below. This allocation is based on management’s current estimationand could change as the fair value calculations are finalized and more information becomes available.
(1) The value of the shares of common stock exchanged with MBNA shareholders was based upon the average of the closing prices ofthe Corporation’s common stock for the period commencing two trading days before, and ending two trading days after, June 30,2005, the date of the MBNA Merger Agreement.
(2) Includes core deposit intangibles of $204 million, purchased credit card receivables of $5,468 million, affinity relationships of $2,018million and other intangibles of $390 million. The amortization life for core deposit intangibles is 10 years and purchased creditcard receivables and affinity relationships are 15 years.
(3) No Goodwill is expected to be deductible for tax purposes. Goodwill will be allocated to Global Consumer and Small BusinessBanking.
108
BANK OF AMERICA CORPORATION AND SUBSIDIARIES
Notes to Consolidated Financial Statements—(Continued)
Note 4—Trading Account Assets and Liabilities
The Corporation engages in a variety of trading-related activities that are either for clients or its own account.
The following table presents the fair values of the components of Trading Account Assets and Liabilities atDecember 31, 2005 and 2004.
(1) Includes $22.1 billion and $17.3 billion at December 31, 2005 and 2004 of government-sponsored enterprise obligations that are notbacked by the full faith and credit of the U.S. government.
(2) Includes $1.4 billion and $1.2 billion at December 31, 2005 and 2004 of government-sponsored enterprise obligations that are notbacked by the full faith and credit of the U.S. government.
Note 5—Derivatives
The Corporation designates a derivative as held for trading, an economic hedge not designated as a SFAS 133 hedge,or a qualifying SFAS 133 hedge when it enters into the derivative contract. The designation may change based uponmanagement’s reassessment or changing circumstances. Derivatives utilized by the Corporation include swaps, financialfutures and forward settlement contracts, and option contracts. A swap agreement is a contract between two parties toexchange cash flows based on specified underlying notional amounts, assets and/or indices. Financial futures andforward settlement contracts are agreements to buy or sell a quantity of a financial instrument, index, currency orcommodity at a predetermined future date, and rate or price. An option contract is an agreement that conveys to thepurchaser the right, but not the obligation, to buy or sell a quantity of a financial instrument (including anotherderivative financial instrument), index, currency or commodity at a predetermined rate or price during a period or at atime in the future. Option agreements can be transacted on organized exchanges or directly between parties. TheCorporation also provides credit derivatives to customers who wish to increase or decrease credit exposures. In addition,the Corporation utilizes credit derivatives to manage the credit risk associated with the loan portfolio.
Credit Risk Associated with Derivative Activities
Credit risk associated with derivatives is measured as the net replacement cost in the event the counterparties withcontracts in a gain position to the Corporation completely fail to perform under the terms of those contracts. Inmanaging derivative credit risk, both the current exposure, which is the replacement cost of contracts on themeasurement date, as well as an estimate of the potential change in value of contracts over their remaining lives areconsidered. The Corporation’s derivative activities are primarily with financial institutions and corporations. Tominimize credit risk, the Corporation enters into legally enforceable master netting agreements, which reduce risk bypermitting the closeout and netting of transactions with the same counterparty upon occurrence of certain events. Inaddition, the Corporation reduces credit risk by obtaining collateral from counterparties. The determination of the needfor and the levels of collateral will vary based on an assessment of the credit risk of the counterparty. Generally, theCorporation accepts collateral in the form of cash, U.S. Treasury securities and other marketable securities. TheCorporation held $24.9 billion of collateral on derivative positions, of which $17.1 billion could be applied against creditrisk at December 31, 2005.
109
BANK OF AMERICA CORPORATION AND SUBSIDIARIES
Notes to Consolidated Financial Statements—(Continued)
A portion of the derivative activity involves exchange-traded instruments. Exchange-traded instruments conform tostandard terms and are subject to policies set by the exchange involved, including margin and security depositrequirements. Management believes the credit risk associated with these types of instruments is minimal. The averagefair value of Derivative Assets for 2005 and 2004 was $25.9 billion and $28.0 billion. The average fair value of DerivativeLiabilities for 2005 and 2004 was $16.8 billion and $15.7 billion.
The following table presents the contract/notional amounts and credit risk amounts at December 31, 2005 and 2004of all the Corporation’s derivative positions. These derivative positions are primarily executed in the over-the-countermarket. The credit risk amounts take into consideration the effects of legally enforceable master netting agreements,and on an aggregate basis have been reduced by the cash collateral applied against Derivative Assets. At December 31,2005 and 2004, the cash collateral applied against Derivative Assets on the Consolidated Balance Sheet was $9.3 billionand $9.4 billion. In addition, at December 31, 2005 and 2004, the cash collateral placed against Derivative Liabilitieswas $7.6 billion and $6.0 billion.
(1) Includes long and short derivative positions.(2) The increase in credit derivatives notional amounts reflects structured basket transactions and customer-driven activity.
ALM ProcessInterest rate contracts and foreign exchange contracts are utilized in the Corporation’s ALM process. The
Corporation maintains an overall interest rate risk management strategy that incorporates the use of interest ratecontracts to minimize significant fluctuations in earnings that are caused by interest rate volatility. The Corporation’sgoal is to manage interest rate sensitivity so that movements in interest rates do not significantly adversely affect NetInterest Income. As a result of interest rate fluctuations, hedged fixed-rate assets and liabilities appreciate or depreciatein market value. Gains or losses on the derivative instruments that are linked to the hedged fixed-rate assets andliabilities are expected to substantially offset this unrealized appreciation or depreciation. Interest Income and InterestExpense on hedged variable-rate assets and liabilities increase or decrease as a result of interest rate fluctuations. Gainsand losses on the derivative instruments that are linked to these hedged assets and liabilities are expected tosubstantially offset this variability in earnings.
110
BANK OF AMERICA CORPORATION AND SUBSIDIARIES
Notes to Consolidated Financial Statements—(Continued)
Interest rate contracts, which are generally non-leveraged generic interest rate and basis swaps, options andfutures, allow the Corporation to manage its interest rate risk position. Non-leveraged generic interest rate swapsinvolve the exchange of fixed-rate and variable-rate interest payments based on the contractual underlying notionalamount. Basis swaps involve the exchange of interest payments based on the contractual underlying notional amounts,where both the pay rate and the receive rate are floating rates based on different indices. Option products primarilyconsist of caps, floors, swaptions and options on index futures contracts. Futures contracts used for the ALM process areprimarily index futures providing for cash payments based upon the movements of an underlying rate index.
The Corporation uses foreign currency contracts to manage the foreign exchange risk associated with certain foreigncurrency-denominated assets and liabilities, as well as the Corporation’s equity investments in foreign subsidiaries.Foreign exchange contracts, which include spot, futures and forward contracts, represent agreements to exchange thecurrency of one country for the currency of another country at an agreed-upon price on an agreed-upon settlement date.Foreign exchange option contracts are similar to interest rate option contracts except that they are based on currenciesrather than interest rates. Exposure to loss on these contracts will increase or decrease over their respective lives ascurrency exchange and interest rates fluctuate.
Fair Value and Cash Flow Hedges
The Corporation uses various types of interest rate and foreign currency exchange rate derivative contracts toprotect against changes in the fair value of its fixed-rate assets and liabilities due to fluctuations in interest rates andexchange rates (fair value hedges). The Corporation also uses these types of contracts to protect against changes in thecash flows of its variable-rate assets and liabilities, and other forecasted transactions (cash flow hedges).
For cash flow hedges, gains and losses on derivative contracts reclassified from Accumulated OCI to current periodearnings are included in the line item in the Consolidated Statement of Income in which the hedged item is recorded andin the same period the hedged item affects earnings. During the next 12 months, net losses on derivative instrumentsincluded in Accumulated OCI of approximately $632 million (pre-tax) are expected to be reclassified into earnings. Thesenet losses reclassified into earnings are expected to decrease income or increase expense on the respective hedged items.
The following table summarizes certain information related to the Corporation’s hedging activities for 2005 and2004:
(1) Included $5 million and $(8) million recorded in Net Interest Income, $167 million and $18 million recorded in Mortgage BankingIncome, $(5) million and $0 recorded in Investment Banking Income, and $(1) million and $0 recorded in Trading Account Profits inthe Consolidated Statement of Income for 2005 and 2004.
(2) Included $0 and $(5) million recorded in Net Interest Income and $(15) million and $(1) million recorded in Mortgage BankingIncome, and $2 million and $0 recorded in Investment Banking Income in the Consolidated Statement of Income for 2005 and 2004.
(3) Included $(17) million and $(13) million recorded in Net Interest Income and $(14) million and $2 million recorded in MortgageBanking Income from other cash flow hedges in the Consolidated Statement of Income for 2005 and 2004.
111
BANK OF AMERICA CORPORATION AND SUBSIDIARIES
Notes to Consolidated Financial Statements—(Continued)
Note 6 – Securities
The amortized cost, gross unrealized gains and losses, and fair value of AFS debt and marketable equity securities,and Held-to-maturity securities at December 31, 2005, 2004 and 2003 were:
(1) Includes corporate debt, asset-backed securities and equity instruments.(2) Represents those AFS marketable equity securities that are recorded in Other Assets on the Consolidated Balance Sheet.(3) Includes corporate debt and asset-backed securities.
112
BANK OF AMERICA CORPORATION AND SUBSIDIARIES
Notes to Consolidated Financial Statements—(Continued)
At December 31, 2005, accumulated net unrealized losses on AFS debt and marketable equity securities included inAccumulated OCI were $3.0 billion, net of the related income tax benefit of $1.8 billion. At December 31, 2004,accumulated net unrealized losses on these securities were $196 million, net of the related income tax benefit of $146million.
The following table presents the current fair value and the associated unrealized losses only on investments insecurities with unrealized losses at December 31, 2005 and 2004. The table also discloses whether these securities havehad unrealized losses for less than twelve months, or for twelve months or longer.
December 31, 2005
Less than twelve months Twelve months or longer Total
(1) Unrealized losses less than $500 thousand are shown as zero.
The unrealized losses associated with U.S. Treasury securities and agency debentures, mortgage-backed securities,certain foreign securities, other taxable securities and tax-exempt securities are not considered to be other-than-temporary because their unrealized losses are related to changes in interest rates and do not affect the expected cashflows of the underlying collateral or issuer. The Corporation has the ability and intent to hold these securities for aperiod of time sufficient to recover all unrealized losses. Accordingly, the Corporation has not recognized any other-than-temporary impairments for these securities.
113
BANK OF AMERICA CORPORATION AND SUBSIDIARIES
Notes to Consolidated Financial Statements—(Continued)
The Corporation had investments in securities from the Federal National Mortgage Association (Fannie Mae) andFederal Home Loan Mortgage Corporation (Freddie Mac) that exceeded 10 percent of consolidated Shareholders’ Equityas of December 31, 2005 and 2004. Those investments had market values of $144.1 billion and $46.9 billion atDecember 31, 2005 and $133.6 billion and $35.8 billion at December 31, 2004. In addition, these investments had totalamortized costs of $148.0 billion and $48.3 billion at December 31, 2005 and $132.9 billion and $35.9 billion atDecember 31, 2004.
Pursuant to an agreement dated June 17, 2005, the Corporation committed to purchase approximately nine percentof the stock of China Construction Bank (CCB) for $3.0 billion. Under this agreement, the Corporation made an initialpurchase of CCB shares for $2.5 billion in August 2005 and during CCB’s initial public offering in October 2005, madean additional purchase of $500 million. These shares are non-transferable until the third anniversary of the initialpublic offering. The Corporation also holds an option to increase its ownership interest in CCB to 19.9 percent over thenext five years. At December 31, 2005, this $3.0 billion investment in CCB was included in Other Assets.
Securities are pledged or assigned to secure borrowed funds, government and trust deposits and for other purposes.The carrying value of pledged securities was $116.7 billion and $45.1 billion at December 31, 2005 and 2004.
The expected maturity distribution of the Corporation’s mortgage-backed securities and the contractual maturitydistribution of the Corporation’s other securities, and the yields of the Corporation’s securities portfolio at December 31,2005 are summarized in the following table. Actual maturities may differ from the contractual or expected maturitiesshown below since borrowers may have the right to prepay obligations with or without prepayment penalties.
Due in oneyear or less
Due after oneyear through
five years
Due after fiveyears through
ten yearsDue after
ten years(1) Total(Dollars in millions) Amount Yield(2) Amount Yield(2) Amount Yield(2) Amount Yield(2) Amount Yield(2)
(1) Includes securities with no stated maturity.(2) Yields are calculated based on the amortized cost of the securities.(3) Yield of tax-exempt securities calculated on a FTE basis.
The components of realized gains and losses on sales of debt securities for 2005, 2004 and 2003 were:
Notes to Consolidated Financial Statements—(Continued)
The Income Tax Expense attributable to realized net gains on debt securities sales was $400 million, $640 millionand $329 million in 2005, 2004 and 2003, respectively.
Note 7—Outstanding Loans and Leases
Outstanding loans and leases at December 31, 2005 and 2004 were:
(1) Includes consumer finance of $2,849 million and $3,395 million; foreign consumer of $3,841 million and $3,563 million; andconsumer lease financing of $35 million and $481 million at December 31, 2005 and 2004.
(2) Includes domestic commercial real estate loans of $35,181 million and $31,879 million; and foreign commercial real estate loans of$585 million and $440 million at December 31, 2005 and 2004.
The following table presents the gross recorded investment in specific loans, without consideration to the specificcomponent of the Allowance for Loan and Lease Losses, that were considered individually impaired in accordance withSFAS 114 at December 31, 2005 and 2004. SFAS 114 impairment includes performing troubled debt restructurings, andexcludes all commercial leases.
The average recorded investment in certain impaired loans for 2005, 2004 and 2003 was approximately $852million, $1.6 billion and $3.0 billion, respectively. At December 31, 2005 and 2004, the recorded investment in impairedloans requiring an Allowance for Loan and Lease Losses based on individual analysis per SFAS 114 guidelines was $517million and $926 million, and the related Allowance for Loan and Lease Losses was $55 million and $202 million. For2005, 2004 and 2003, Interest Income recognized on impaired loans totaled $17 million, $21 million and $105 million,respectively, all of which was recognized on a cash basis.
At December 31, 2005 and 2004, nonperforming loans and leases, including impaired loans and nonaccrualconsumer loans, totaled $1.5 billion and $2.2 billion. Nonperforming securities amounted to zero and $140 million atDecember 31, 2005 and 2004. In addition, included in Other Assets were nonperforming loans held for sale andleveraged lease partnership interests of $50 million and $151 million at December 31, 2005 and 2004.
Foreclosed properties amounted to $92 million and $102 million at December 31, 2005 and 2004, and are included inOther Assets on the Consolidated Balance Sheet. The cost of carrying foreclosed properties in 2005, 2004 and 2003amounted to $4 million, $3 million and $3 million, respectively.
115
BANK OF AMERICA CORPORATION AND SUBSIDIARIES
Notes to Consolidated Financial Statements—(Continued)
Note 8—Allowance for Credit Losses
The following table summarizes the changes in the allowance for credit losses for 2005, 2004 and 2003:
The Corporation securitizes assets and may retain a portion or all of the securities, subordinated tranches, interest-only strips and, in some cases, a cash reserve account, all of which are considered retained interests in the securitizedassets. Those assets may be serviced by the Corporation or by third parties. The Corporation also uses other specialpurpose financing entities to access the commercial paper market and for other lending, leasing and real estateactivities.
Mortgage-related Securitizations
The Corporation securitizes the majority of its residential mortgage loan originations in conjunction with or shortlyafter loan closing. In addition, the Corporation may, from time to time, securitize commercial mortgages and firstresidential mortgages that it originates or purchases from other entities. In 2005 and 2004, the Corporation converted atotal of $102.6 billion (including $23.3 billion originated by other entities) and $96.9 billion (including $18.0 billionoriginated by other entities), of residential first mortgages and commercial mortgages into mortgage-backed securitiesissued through Fannie Mae, Freddie Mac, Government National Mortgage Association, Bank of America, N.A. and Bancof America Mortgage Securities. At December 31, 2005 and 2004, the Corporation retained $7.2 billion (including $2.4billion issued prior to 2005) and $9.2 billion (including $1.2 billion issued prior to 2004) of securities. At December 31,2005, these retained interests were valued using quoted market prices.
In 2005, the Corporation reported $577 million in gains on loans converted into securities and sold, of which gains of$592 million were from loans originated by the Corporation and losses of $15 million were from loans originated by otherentities. In 2004, the Corporation reported $952 million in gains on loans converted into securities and sold, of whichgains of $886 million were from loans originated by the Corporation and gains of $66 million were from loans originatedby other entities. At December 31, 2005, the Corporation had recourse obligations of $471 million with varying terms upto seven years on loans that had been securitized and sold.
In 2005 and 2004, the Corporation purchased $19.6 billion and $31.1 billion of mortgage-backed securities fromthird parties and resecuritized them. Net gains, which include net interest income earned during the holding period,totaled $13 million and $55 million. The Corporation did not retain any of the securities issued in these transactions.
116
BANK OF AMERICA CORPORATION AND SUBSIDIARIES
Notes to Consolidated Financial Statements—(Continued)
The Corporation has retained MSRs from the sale or securitization of mortgage loans. Servicing fee and ancillary feeincome on all mortgage loans serviced, including securitizations, was $789 million and $568 million in 2005 and 2004.The following table presents activity in MSRs in 2005 and 2004. Effective June 1, 2004, Excess Spread Certificates (theCertificates) were converted to MSRs.
(1) Includes $2.2 billion of Excess Spread Certificates converted to MSRs on June 1, 2004.(2) For 2005 and 2004, includes $291 million and $(210) million related to change in value attributed to SFAS 133 hedged MSRs and
$63 million and $463 million of impairment.(3) Net of impairment allowance of $257 million and $361 million for 2005 and 2004.
The estimated fair value of MSRs was $2.8 billion and $2.5 billion at December 31, 2005 and 2004.
The key economic assumptions used in valuations of MSRs include modeled prepayment rates and resultantexpected weighted average lives of the MSRs and the option adjusted spread (OAS) levels. An OAS model runs multipleinterest rate scenarios and projects prepayments specific to each one of those interest rate scenarios.
As of December 31, 2005, the modeled weighted average lives of MSRs related to fixed and adjustable rate loans(including hybrid ARMs) were 4.94 years and 3.03 years. A decrease of 10 and 20 percent in modeled prepayments wouldextend the expected weighted average lives for MSRs related to fixed rate loans to 5.26 years and 5.63 years, and wouldextend the expected weighted average lives for MSRs related to adjustable rate loans to 3.30 years and 3.63 years. Theexpected extension of weighted average lives would increase the value of MSRs by a range of $126 million to $269million. An increase of 10 and 20 percent in modeled prepayments would reduce the expected weighted average lives forMSRs related to fixed rate loans to 4.65 years and 4.40 years, and would reduce the expected weighted average lives forMSRs related to adjustable rate loans to 2.81 years and 2.62 years. The expected reduction of weighted average liveswould decrease the value of MSRs by a range of $112 million to $212 million. A decrease of 100 and 200 basis points(bps) in the OAS level would result in an increase in the value of MSRs ranging from $97 million to $202 million, and anincrease of 100 and 200 bps in the OAS level would result in a decrease in the value of MSRs ranging from $90 million to$175 million.
For purposes of evaluating and measuring impairment, the Corporation stratifies the portfolio based on thepredominant risk characteristics of loan type and note rate. Indicated impairment, by risk stratification, is recognized asa reduction in Mortgage Banking Income, through a valuation allowance, for any excess of adjusted carrying value overestimated fair value.
Other Securitizations
As a result of the FleetBoston Merger in 2004, the Corporation acquired an interest in several credit card, homeequity loan and commercial loan securitization vehicles, which had aggregate debt securities outstanding of $4.1 billionas of December 31, 2005.
At December 31, 2005 and 2004, the Corporation retained investment grade securities of $4.4 billion (including $2.6billion issued in 2005) and $2.9 billion, which are valued using quoted market prices, in the AFS securities portfolio. AtDecember 31, 2005 there were no recognized servicing assets associated with these securitization transactions.
The Corporation has provided protection on a subset of one consumer finance securitization in the form of aguarantee with a maximum payment of $220 million that will only be paid if over-collateralization is not sufficient toabsorb losses and certain other conditions are met. The Corporation projects no payments will be due over the remaininglife of the contract, which is less than one year.
117
BANK OF AMERICA CORPORATION AND SUBSIDIARIES
Notes to Consolidated Financial Statements—(Continued)
Key economic assumptions used in measuring the fair value of certain residual interests (included in Other Assets)in securitizations and the sensitivity of the current fair value of residual cash flows to changes in those assumptions areas follows:
(1) The impact of changing residual cash flows discount rates is immaterial.(2) Subprime consumer finance includes subprime real estate loan securitizations, which are serviced by third parties.(3) Residual interests include interest-only strips, one or more subordinated tranches, accrued interest receivable, and in some cases, a cash reserve
account.(4) Before any optional clean-up calls are executed, economic analysis will be performed.(5) Annual rates of expected credit losses are presented for credit card, home equity lines and commercial securitizations. Cumulative lifetime rates of
expected credit losses (incurred plus projected) are presented for subprime consumer finance securitizations and auto securitizations.
The sensitivities in the preceding table are hypothetical and should be used with caution. As the amounts indicate,changes in fair value based on variations in assumptions generally cannot be extrapolated because the relationship ofthe change in assumption to the change in fair value may not be linear. Also, the effect of a variation in a particularassumption on the fair value of the retained interest is calculated without changing any other assumption. In reality,changes in one factor may result in changes in another, which might magnify or counteract the sensitivities.Additionally, the Corporation has the ability to hedge interest rate risk associated with retained residual positions. Theabove sensitivities do not reflect any hedge strategies that may be undertaken to mitigate such risk.
Static pool net credit losses are considered in determining the value of retained interests. Static pool net creditlosses include actual losses incurred plus projected credit losses divided by the original balance of each securitizationpool. For auto loan securitizations, weighted average static pool net credit losses for securitizations entered into in 2005were 1.77 percent for the year ended December 31, 2005. For securitizations entered into in 2004, the weighted averagestatic pool net credit losses were 1.79 percent for the year ended December 31, 2005, and 1.63 percent for the year endedDecember 31, 2004. For the subprime consumer finance securitizations, weighted average static pool net credit losses forsecuritizations entered into in 2001 were 5.50 percent for the year ended December 31, 2005, and 5.93 percent for theyear ended December 31, 2004. For securitizations entered into in 1999, the weighted average static pool net creditlosses were 9.16 percent for the year ended December 31, 2005, and 12.22 percent for the year ended December 31, 2004.
Proceeds from collections reinvested in revolving credit card securitizations were $2.0 billion and $6.8 billion in 2005and 2004. Credit card servicing fee income totaled $97 million and $134 million in 2005 and 2004. Other cash flowsreceived on retained interests, such as cash flows from interest-only strips, were $206 million and $345 million in 2005and 2004, for credit card securitizations. Proceeds from collections reinvested in revolving commercial loansecuritizations were $8.7 billion and $7.5 billion in 2005 and 2004. Servicing fees and other cash flows received onretained interests, such as cash flows from interest-only strips, were $3 million and $34 million in 2005, and $4 millionand $11 million in 2004 for commercial loan securitizations.
The Corporation reviews its loans and leases portfolio on a managed basis. Managed loans and leases are defined ason-balance sheet Loans and Leases as well as loans in revolving securitizations, which include credit cards, home equitylines and commercial loans. New advances on accounts for which previous loan balances were sold to the securitizationtrusts will be recorded on the Corporation’s Consolidated Balance Sheet after the revolving period of the securitization,which has the effect of increasing Loans and Leases on the Corporation’s Consolidated Balance Sheet and increasing Net
118
BANK OF AMERICA CORPORATION AND SUBSIDIARIES
Notes to Consolidated Financial Statements—(Continued)
Interest Income and charge-offs, with a corresponding reduction in Noninterest Income. Portfolio balances, delinquencyand historical loss amounts of the managed loans and leases portfolio for 2005 and 2004 were as follows:
(1) Excludes consumer real estate loans, which are placed on nonperforming status at 90 days past due.(2) The net loss ratio is calculated by dividing managed loans and leases net losses by average managed loans and leases outstanding
for each loan and lease category.
119
BANK OF AMERICA CORPORATION AND SUBSIDIARIES
Notes to Consolidated Financial Statements—(Continued)
Variable Interest Entities
At December 31, 2005, the assets and liabilities of the Corporation’s multi-seller asset-backed commercial paperconduits that have been consolidated in accordance with FASB Interpretation No. 46 (Revised December 2003),“Consolidation of Variable Interest Entities, an interpretation of ARB No. 51” were reflected in AFS Securities, OtherAssets, and Commercial Paper and Other Short-term Borrowings in Global Capital Markets and Investment Banking. Asof December 31, 2005 and 2004, the Corporation held $6.6 billion and $7.7 billion of assets in these entities while theCorporation’s maximum loss exposure associated with these entities including unfunded lending commitments wasapproximately $8.0 billion and $9.4 billion. The Corporation also had contractual relationships with other consolidatedVIEs that engage in leasing or lending activities or real estate joint ventures. As of December 31, 2005 and 2004, theamount of assets of these entities was $750 million and $560 million, and the Corporation’s maximum possible lossexposure was $212 million and $132 million.
Additionally, the Corporation had significant variable interests in other VIEs that it did not consolidate because itwas not deemed to be the primary beneficiary. In such cases, the Corporation does not absorb the majority of the entities’expected losses nor does it receive a majority of the entities’ expected residual returns. These entities typically supportthe financing needs of the Corporation’s customers by facilitating their access to the commercial paper markets. TheCorporation functions as administrator and provides either liquidity and letters of credit, or derivatives to the VIE. TheCorporation also provides asset management and related services to other special purpose vehicles that engage inlending, investing, or real estate activities. Total assets of these entities at December 31, 2005 and 2004 wereapproximately $32.5 billion and $32.9 billion. Revenues associated with administration, liquidity, letters of credit andother services were approximately $121 million and $154 million for the year ended December 31, 2005 and 2004. AtDecember 31, 2005 and 2004, the Corporation’s maximum loss exposure associated with these VIEs was approximately$26.7 billion and $25.0 billion, which is net of amounts syndicated.
Management does not believe losses resulting from its involvement with the entities discussed above will bematerial. See Note 1 of the Consolidated Financial Statements for additional discussion of special purpose financingentities.
Note 10—Goodwill and Other Intangibles
The following table presents allocated Goodwill at December 31, 2005 and 2004 for each business segment and AllOther. The increases from December 31, 2004 were primarily due to the $65 million of goodwill adjustments related toNational Processing, Inc. (NPC) and the acquisitions of Works, Inc., which added approximately $49 million to Goodwill.
The gross carrying value and accumulated amortization related to core deposit intangibles and other intangibles atDecember 31, 2005 and 2004 are presented below:
As a result of the FleetBoston Merger, the Corporation recorded $2.2 billion of core deposit intangibles, $660 millionof purchased credit card relationship intangibles and $409 million of other customer relationship intangibles. Theweighted average amortization period of these intangibles is approximately nine years. As a result of the acquisition ofNPC during 2004, the Corporation allocated $479 million to other intangibles with a weighted average amortizationperiod of approximately 10 years.
120
BANK OF AMERICA CORPORATION AND SUBSIDIARIES
Notes to Consolidated Financial Statements—(Continued)
Amortization expense on core deposit intangibles and other intangibles was $809 million, $664 million and $217million for 2005, 2004, and 2003, respectively. The increase for the year ended December 31, 2005 was primarily due tothe FleetBoston Merger. The Corporation estimates that aggregate amortization expense will be $746 million, $599million, $486 million, $385 million and $311 million for 2006, 2007, 2008, 2009 and 2010, respectively.
Note 11—Deposits
The Corporation had domestic certificates of deposit of $100 thousand or more totaling $47.0 billion and $56.2 billionat December 31, 2005 and 2004. The Corporation had other domestic time deposits of $100 thousand or more totaling$1.4 billion and $1.1 billion at December 31, 2005 and 2004. Foreign certificates of deposit and other foreign timedeposits of $100 thousand or more totaled $38.8 billion and $28.6 billion at December 31, 2005 and 2004.
The following table presents the maturities of domestic and foreign certificates of deposit of $100 thousand or more,and of other domestic time deposits of $100 thousand or more at December 31, 2005.
(Dollars in millions)
Threemonthsor less
Overthree monthsto six months
Oversix months to
twelve months Thereafter Total
Domestic certificates of deposit of $100 thousand or more . . . . . $19,922 $12,271 $8,762 $6,023 $46,978Domestic other time deposits of $100 thousand or more . . . . . . . 99 113 205 991 1,408Foreign certificates of deposit and other time deposits of $100
Bank of America Corporation and certain other subsidiaries issue commercial paper in order to meet short-termfunding needs. Commercial paper outstanding at December 31, 2005 was $25.0 billion compared to $25.4 billion atDecember 31, 2004.
Bank of America, N.A. maintains a domestic program to offer up to a maximum of $60.0 billion, at any one time, ofbank notes with fixed or floating rates and maturities of at least seven days from the date of issue. Short-term banknotes outstanding under this program totaled $22.5 billion at December 31, 2005 compared to $9.6 billion atDecember 31, 2004. These short-term bank notes, along with Treasury tax and loan notes, term federal funds purchasedand commercial paper, are reflected in Commercial Paper and Other Short-term Borrowings on the ConsolidatedBalance Sheet.
121
BANK OF AMERICA CORPORATION AND SUBSIDIARIES
Notes to Consolidated Financial Statements—(Continued)
Long-term Debt
The following table presents Long-term Debt at December 31, 2005 and 2004:
(1) Rates and maturity dates reflect outstanding debt at December 31, 2005.
The majority of the floating rates are based on three- and six-month London InterBank Offered Rates (LIBOR).Bank of America Corporation and Bank of America, N.A. maintain various domestic and international debt programs tooffer both senior and subordinated notes. The notes may be denominated in U.S. dollars or foreign currencies. AtDecember 31, 2005 and 2004, the amount of foreign currency denominated debt translated into U.S. dollars included intotal long-term debt was $23.1 billion and $16.2 billion. Foreign currency contracts are used to convert certain foreigncurrency denominated debt into U.S. dollars.
122
BANK OF AMERICA CORPORATION AND SUBSIDIARIES
Notes to Consolidated Financial Statements—(Continued)
At December 31, 2005 and 2004, Bank of America Corporation was authorized to issue approximately $27.0 billionand $37.1 billion of additional corporate debt and other securities under its existing shelf registration statements. AtDecember 31, 2005 and 2004, Bank of America, N.A. was authorized to issue approximately $9.5 billion and $27.2 billionof bank notes and Euro medium-term notes.
The weighted average effective interest rates for total long-term debt, total fixed-rate debt and total floating-ratedebt (based on the rates in effect at December 31, 2005) were 5.22 percent, 5.53 percent and 4.31 percent, respectively, atDecember 31, 2005 and (based on the rates in effect at December 31, 2004) were 4.97 percent, 5.64 percent and 2.69percent, respectively, at December 31, 2004. These obligations were denominated primarily in U.S. dollars.
Aggregate annual maturities of long-term debt obligations (based on final maturity dates) at December 31, 2005 areas follows:
(Dollars in millions) 2006 2007 2008 2009 2010 Thereafter Total
Trust preferred securities (Trust Securities) are issued by the trust companies (the Trusts) that were deconsolidatedby the Corporation as a result of the adoption of FIN 46R. These Trust Securities are mandatorily redeemable preferredsecurity obligations of the Trusts. The sole assets of the Trusts are Junior Subordinated Deferrable Interest Notes of theCorporation (the Notes). The Trusts are 100 percent owned finance subsidiaries of the Corporation. Obligationsassociated with these securities are included in junior subordinated notes related to Trust Securities in the Long-termDebt table on page 122. See Note 15 of the Consolidated Financial Statements for a discussion regarding the treatmentfor regulatory capital purposes of the Trust Securities.
At December 31, 2005, the Corporation had 32 Trusts which have issued Trust Securities to the public. Certain ofthe Trust Securities were issued at a discount and may be redeemed prior to maturity at the option of the Corporation.The Trusts have invested the proceeds of such Trust Securities in the Notes. Each issue of the Notes has an interest rateequal to the corresponding Trust Securities distribution rate. The Corporation has the right to defer payment of intereston the Notes at any time or from time to time for a period not exceeding five years provided that no extension period mayextend beyond the stated maturity of the relevant Notes. During any such extension period, distributions on the TrustSecurities will also be deferred, and the Corporation’s ability to pay dividends on its common and preferred stock will berestricted.
The Trust Securities are subject to mandatory redemption upon repayment of the related Notes at their statedmaturity dates or their earlier redemption at a redemption price equal to their liquidation amount plus accrueddistributions to the date fixed for redemption and the premium, if any, paid by the Corporation upon concurrentrepayment of the related Notes.
Periodic cash payments and payments upon liquidation or redemption with respect to Trust Securities areguaranteed by the Corporation to the extent of funds held by the Trusts (the Preferred Securities Guarantee). ThePreferred Securities Guarantee, when taken together with the Corporation’s other obligations, including its obligationsunder the Notes, will constitute a full and unconditional guarantee, on a subordinated basis, by the Corporation ofpayments due on the Trust Securities.
123
BANK OF AMERICA CORPORATION AND SUBSIDIARIES
Notes to Consolidated Financial Statements—(Continued)
The following table is a summary of the outstanding Trust Securities and the Notes at December 31,2005 as originated by Bank of America Corporation and the predecessor banks.(Dollars in millions)
Issuer Issuance Date
AggregatePrincipalAmount of
TrustSecurities
AggregatePrincipalAmount
of the Notes
StatedMaturity of the
Notes
Per AnnumInterest Rateof the Notes
InterestPayment
DatesRedemption
Period
Bank of AmericaCapital Trust I December 2001 $ 575 $ 593 December 2031 7.00% 3/15,6/15,9/15,12/15 On or after 12/15/06Capital Trust II January 2002 900 928 February 2032 7.00 2/1, 5/1,8/1,11/1 On or after 2/01/07Capital Trust III August 2002 500 516 August 2032 7.00 2/15, 5/15,8/15,11/15 On or after 8/15/07Capital Trust IV April 2003 375 387 May 2033 5.88 2/1, 5/1,8/1,11/1 On or after 5/01/08Capital Trust V November 2004 518 534 November 2034 6.00 2/3, 5/3,8/3,11/3 On or after 11/03/09Capital Trust VI February 2005 1,000 1,031 March 2035 5.63 3/8,9/8 Any timeCapital Trust VII August 2005 1,461 1,507 August 2035 5.25 2/10,8/10 Any timeCapital Trust VIII August 2005 530 546 August 2035 6.00 2/25,5/25,8/25,11/25 On or after 8/25/10
NationsBankCapital Trust II December 1996 365 376 December 2026 7.83 6/15,12/15 On or after 12/15/06Capital Trust III February 1997 494 509 January 2027 3-mo. LIBOR
+55 bps1/15,4/15,7/15,10/15 On or after 1/15/07
Capital Trust IV April 1997 498 513 April 2027 8.25 4/15,10/15 On or after 4/15/07
BankAmericaInstitutional Capital A November 1996 450 464 December 2026 8.07 6/30,12/31 On or after 12/31/06Institutional Capital B November 1996 300 309 December 2026 7.70 6/30,12/31 On or after 12/31/06Capital II December 1996 450 464 December 2026 8.00 6/15,12/15 On or after 12/15/06Capital III January 1997 400 412 January 2027 3-mo. LIBOR
+57 bps1/15,4/15, 7/15,10/15 On or after 1/15/02
BarnettCapital I November 1996 300 309 December 2026 8.06 6/1,12/1 On or after 12/01/06Capital II December 1996 200 206 December 2026 7.95 6/1,12/1 On or after 12/01/06Capital III January 1997 250 258 February 2027 3-mo. LIBOR
+62.5 bps2/1,5/1,8/1,11/1 On or after 2/01/07
FleetCapital Trust II December 1996 250 258 December 2026 7.92 6/15,12/15 On or after 12/15/06Capital Trust V December 1998 250 258 December 2028 3-mo. LIBOR
+100 bps3/18, 6/18,9/18, 12/18 On or after 12/18/03
Capital Trust VII September 2001 500 515 December 2031 7.20 3/15, 6/15,9/15, 12/15 On or after 9/17/06Capital Trust VIII March 2002 534 551 March 2032 7.20 3/15, 6/15,9/15,12/15 On or after 3/08/07Capital Trust IX July 2003 175 180 August 2033 6.00 2/1, 5/1,8/1,11/1 On or after 7/31/08
BankBostonCapital Trust I November 1996 250 258 December 2026 8.25 6/15,12/15 On or after 12/15/06Capital Trust II December 1996 250 258 December 2026 7.75 6/15,12/15 On or after 12/15/06Capital Trust III June 1997 250 258 June 2027 3-mo. LIBOR
+75 bps3/15, 6/15,9/15,12/15 On or after 6/15/07
Capital Trust IV June 1998 250 258 June 2028 3-mo. LIBOR+60 bps
3/8, 6/8,9/8,12/8 On or after 6/08/03
SummitCapital Trust I March 1997 150 155 March 2027 8.40 3/15,9/15 On or after 3/15/07
ProgressCapital Trust I June 1997 9 9 June 2027 10.50 6/1,12/1 On or after 6/01/07Capital Trust II July 2000 6 6 July 2030 11.45 1/19,7/19 On or after 7/19/10Capital Trust III November 2002 10 10 November 2032 3-mo. LIBOR
+33.5 bps2/15,5/15,8/15,11/15 On or after 11/15/07
Capital Trust IV December 2002 5 5 January 2033 3-mo. LIBOR+33.5 bps
1/7, 4/7,7/7,10/7 On or after 1/07/08
Total $12,455 $12,841
124
BANK OF AMERICA CORPORATION AND SUBSIDIARIES
Notes to Consolidated Financial Statements—(Continued)
Note 13—Commitments and Contingencies
In the normal course of business, the Corporation enters into a number of off-balance sheet commitments. Thesecommitments expose the Corporation to varying degrees of credit and market risk and are subject to the same credit andmarket risk limitation reviews as those instruments recorded on the Corporation’s Consolidated Balance Sheet.
Credit Extension Commitments
The Corporation enters into commitments to extend credit such as loan commitments, SBLCs and commercialletters of credit to meet the financing needs of its customers. The outstanding unfunded lending commitments shown inthe following table have been reduced by amounts participated to other financial institutions of $30.4 billion and $23.4billion at December 31, 2005 and 2004. The carrying amount for these commitments, which represents the liabilityrecorded related to these instruments, at December 31, 2005 and 2004 was $458 million and $520 million. AtDecember 31, 2005, the carrying amount included deferred revenue of $63 million and a reserve for unfunded lendingcommitments of $395 million. At December 31, 2004, the carrying amount included deferred revenue of $118 million anda reserve for unfunded lending commitments of $402 million.
(1) At December 31, 2005 and 2004, there were equity commitments of $1.4 billion and $2.0 billion, related to obligations to furtherfund Principal Investing equity investments.
Legally binding commitments to extend credit generally have specified rates and maturities. Certain of thesecommitments have adverse change clauses that help to protect the Corporation against deterioration in the borrowers’ability to pay.
The Corporation issues SBLCs and financial guarantees to support the obligations of its customers to beneficiaries.Additionally, in many cases, the Corporation holds collateral in various forms against these SBLCs. As part of its riskmanagement activities, the Corporation continuously monitors the creditworthiness of the customer as well as SBLCexposure; however, if the customer fails to perform the specified obligation to the beneficiary, the beneficiary may drawupon the SBLC by presenting documents that are in compliance with the letter of credit terms. In that event, theCorporation either repays the money borrowed or advanced, makes payment on account of the indebtedness of thecustomer or makes payment on account of the default by the customer in the performance of an obligation to thebeneficiary up to the full notional amount of the SBLC. The customer is obligated to reimburse the Corporation for anysuch payment. If the customer fails to pay, the Corporation would, as contractually permitted, liquidate collateral and/orset off accounts.
Commercial letters of credit, issued primarily to facilitate customer trade finance activities, are usuallycollateralized by the underlying goods being shipped to the customer and are generally short-term. Credit card lines areunsecured commitments that are not legally binding. Management reviews credit card lines at least annually, and uponevaluation of the customers’ creditworthiness, the Corporation has the right to terminate or change certain terms of thecredit card lines.
The Corporation uses various techniques to manage risk associated with these types of instruments that includeobtaining collateral and/or adjusting commitment amounts based on the borrower’s financial condition; therefore, thetotal commitment amount does not necessarily represent the actual risk of loss or future cash requirements. For each ofthese types of instruments, the Corporation’s maximum exposure to credit loss is represented by the contractual amountof these instruments.
Other Commitments
At December 31, 2005 and 2004, charge cards (nonrevolving card lines) to individuals and government entitiesguaranteed by the U.S. government in the amount of $9.4 billion and $10.9 billion were not included in credit card
125
BANK OF AMERICA CORPORATION AND SUBSIDIARIES
Notes to Consolidated Financial Statements—(Continued)
line commitments in the previous table. The outstanding balances related to these charge cards were $171 million and$205 million at December 31, 2005 and 2004.
At December 31, 2005, the Corporation had whole mortgage loan purchase commitments of $4.0 billion, all of whichwill settle in the first quarter of 2006. At December 31, 2004, the Corporation had whole mortgage loan purchasecommitments of $3.3 billion, all of which settled in the first quarter of 2005. At December 31, 2005 and 2004, theCorporation had no forward whole mortgage loan sale commitments.
The Corporation has entered into operating leases for certain of its premises and equipment. Commitments underthese leases approximate $1.3 billion in 2006, $1.1 billion in 2007, $1.1 billion in 2008, $799 million in 2009, $650 millionin 2010 and $3.5 billion for all years thereafter.
In 2005, the Corporation entered into an agreement for the committed purchase of retail automotive loans over afive-year period, ending June 30, 2010. In 2005, the Corporation purchased $5.0 billion of such loans and atDecember 31, 2005, the remaining commitment amount was $47.0 billion. Under the agreement, the Corporation iscommitted to purchase up to $7.0 billion of such loans for the period January 1, 2006 through June 30, 2006 and up to$10.0 billion in each of the agreement’s next four fiscal years.
Other Guarantees
The Corporation sells products that offer book value protection primarily to plan sponsors of Employee RetirementIncome Security Act of 1974 (ERISA) governed pension plans, such as 401(k) plans and 457 plans. The book valueprotection is provided on portfolios of intermediate/short-term investment grade fixed income securities and is intendedto cover any shortfall in the event that plan participants withdraw funds when market value is below book value. TheCorporation retains the option to exit the contract at any time. If the Corporation exercises its option, the purchaser canrequire the Corporation to purchase zero coupon bonds with the proceeds of the liquidated assets to assure the return ofprincipal. To manage its exposure, the Corporation imposes significant restrictions and constraints on the timing of thewithdrawals, the manner in which the portfolio is liquidated and the funds are accessed, and the investment parametersof the underlying portfolio. These constraints, combined with structural protections, are designed to provide adequatebuffers and guard against payments even under extreme stress scenarios. These guarantees are booked as derivativesand marked to market in the trading portfolio. At December 31, 2005 and 2004, the notional amount of these guaranteestotaled $34.0 billion and $26.3 billion with estimated maturity dates between 2006 and 2035. As of December 31, 2005and 2004, the Corporation has not made a payment under these products, and management believes that the probabilityof payments under these guarantees is remote.
The Corporation also sells products that guarantee the return of principal to investors at a preset future date. Theseguarantees cover a broad range of underlying asset classes and are designed to cover the shortfall between the marketvalue of the underlying portfolio and the principal amount on the preset future date. To manage its exposure, theCorporation requires that these guarantees be backed by structural and investment constraints and certain pre-definedtriggers that would require the underlying assets or portfolio to be liquidated and invested in zero-coupon bonds thatmature at the preset future date. The Corporation is required to fund any shortfall at the preset future date between theproceeds of the liquidated assets and the purchase price of the zero-coupon bonds. These guarantees are booked asderivatives and marked to market in the trading portfolio. At December 31, 2005 and 2004, the notional amount of theseguarantees totaled $6.5 billion and $8.1 billion. These guarantees have various maturities ranging from 2006 to 2016. AtDecember 31, 2005 and 2004, the Corporation had not made a payment under these products, and management believesthat the probability of payments under these guarantees is remote.
The Corporation also has written put options on highly rated fixed income securities. Its obligation under theseagreements is to buy back the assets at predetermined contractual yields in the event of a severe market disruption inthe short-term funding market. These agreements have various maturities ranging from two to seven years, and thepre-determined yields are based on the quality of the assets and the structural elements pertaining to the marketdisruption. The notional amount of these put options was $803 million and $653 million at December 31, 2005 and 2004.Due to the high quality of the assets and various structural protections, management believes that the probability ofincurring a loss under these agreements is remote.
In the ordinary course of business, the Corporation enters into various agreements that contain indemnifications,such as tax indemnifications, whereupon payment may become due if certain external events occur, such as a change intax law. These agreements typically contain an early termination clause that permits the Corporation to exit theagreement upon these events. The maximum potential future payment under indemnification agreements is difficult toassess for several reasons, including the inability to predict future changes in tax and other laws, the difficulty indetermining how such laws would apply to parties in contracts, the absence of exposure limits contained in standard
126
BANK OF AMERICA CORPORATION AND SUBSIDIARIES
Notes to Consolidated Financial Statements—(Continued)
contract language and the timing of the early termination clause. Historically, any payments made under theseguarantees have been de minimis. Management has assessed the probability of making such payments in the future asremote.
The Corporation has entered into additional guarantee agreements, including lease end obligation agreements,partial credit guarantees on certain leases, real estate joint venture guarantees, sold risk participation swaps and soldput options that require gross settlement. The maximum potential future payment under these agreements wasapproximately $1.8 billion and $2.1 billion at December 31, 2005 and 2004. The estimated maturity dates of theseobligations are between 2006 and 2033. The Corporation has made no material payments under these guarantees.
The Corporation provides credit and debit card processing services to various merchants, processing credit and debitcard transactions on their behalf. In connection with these services, a liability may arise in the event of a billing disputebetween the merchant and a cardholder that is ultimately resolved in the cardholder’s favor and the merchant defaultsupon its obligation to reimburse the cardholder. A cardholder, through its issuing bank, generally has until the later ofup to four months after the date a transaction is processed or the delivery of the product or service to present achargeback to the Corporation as the merchant processor. If the Corporation is unable to collect this amount from themerchant, it bears the loss for the amount paid to the cardholder. In 2005 and 2004, the Corporation processed $352.9billion and $143.1 billion of transactions and recorded losses as a result of these chargebacks of $13 million and $6million.
At December 31, 2005 and 2004, the Corporation held as collateral approximately $248 million and $203 million ofmerchant escrow deposits which the Corporation has the right to set off against amounts due from the individualmerchants. The Corporation also has the right to offset any payments with cash flows otherwise due to the merchant.Accordingly, the Corporation believes that the maximum potential exposure is not representative of the actual potentialloss exposure. The Corporation believes the maximum potential exposure for chargebacks would not exceed the totalamount of merchant transactions processed through Visa and MasterCard for the last four months, which represents theclaim period for the cardholder, plus any outstanding delayed-delivery transactions. As of December 31, 2005 and 2004,the maximum potential exposure totaled approximately $118.2 billion and $93.4 billion.
Within the Corporation’s brokerage business, the Corporation has contracted with a third party to provide clearingservices that include underwriting margin loans to the Corporation’s clients. This contract stipulates that theCorporation will indemnify the third party for any margin loan losses that occur in their issuing margin to theCorporation’s clients. The maximum potential future payment under this indemnification was $1.1 billion and $1.2billion at December 31, 2005 and 2004. Historically, any payments made under this indemnification have beenimmaterial. As these margin loans are highly collateralized by the securities held by the brokerage clients, theCorporation has assessed the probability of making such payments in the future as remote. This indemnification wouldend with the termination of the clearing contract.
For additional information on recourse obligations related to residential mortgage loans sold and other guaranteesrelated to securitizations, see Note 9 of the Consolidated Financial Statements.
Litigation and Regulatory Matters
In the ordinary course of business, the Corporation and its subsidiaries are routinely defendants in or parties to manypending and threatened legal actions and proceedings, including actions brought on behalf of various classes ofclaimants. Certain of these actions and proceedings are based on alleged violations of consumer protection, securities,environmental, banking, employment and other laws. In certain of these actions and proceedings, claims for substantialmonetary damages are asserted against the Corporation and its subsidiaries.
In the ordinary course of business, the Corporation and its subsidiaries are also subject to regulatory examinations,information gathering requests, inquiries and investigations. Certain subsidiaries of the Corporation are registeredbroker/dealers or investment advisors and are subject to regulation by the SEC, the National Association of SecuritiesDealers, the New York Stock Exchange and state securities regulators. In connection with formal and informal inquiriesby those agencies, such subsidiaries receive numerous requests, subpoenas and orders for documents, testimony andinformation in connection with various aspects of their regulated activities.
In view of the inherent difficulty of predicting the outcome of such litigation and regulatory matters, particularlywhere the claimants seek very large or indeterminate damages or where the cases present novel legal theories or involvea large number of parties, the Corporation cannot state with confidence what the eventual outcome of the pendingmatters will be, what the timing of the ultimate resolution of these matters will be, or what the eventual loss, fines orpenalties related to each pending matter may be.
127
BANK OF AMERICA CORPORATION AND SUBSIDIARIES
Notes to Consolidated Financial Statements—(Continued)
In accordance with SFAS No. 5, “Accounting for Contingencies”, the Corporation establishes reserves for litigationand regulatory matters when those matters present loss contingencies that are both probable and estimable. When losscontingencies are not both probable and estimable, the Corporation does not establish reserves. In some of the mattersdescribed below, including but not limited to the Parmalat Finanziaria, S.p.A. matter, loss contingencies are not bothprobable and estimable in the view of management, and, accordingly, reserves have not been established for thosematters. Based on current knowledge, management does not believe that loss contingencies, if any, arising from pendinglitigation and regulatory matters, including the litigation and regulatory matters described below, will have a materialadverse effect on the consolidated financial position or liquidity of the Corporation, but may be material to theCorporation’s operating results for any particular reporting period.
Adelphia Communications Corporation (Adelphia)
Bank of America, N.A. (BANA) and Banc of America Securities LLC (BAS) are defendants, among other defendants,in a putative class action and individual civil actions relating to Adelphia. The first of these actions was filed in June2002; these actions have been consolidated for pre-trial purposes in the U.S. District Court for the Southern District ofNew York. BAS was a member of seven underwriting syndicates of securities issued by Adelphia, and BANA was an agentand/or lender in connection with five credit facilities in which Adelphia subsidiaries were borrowers. Fleet National Bank(FNB) and Fleet Securities, Inc. (FSI) are also named as defendants in certain of the actions. FSI was a member of threeunderwriting syndicates of securities issued by Adelphia, and FNB was a lender in connection with four credit facilities inwhich Adelphia subsidiaries were borrowers. The complaints allege claims under the Securities Act of 1933, the SecuritiesExchange Act of 1934, and various state law theories. The complaints seek damages of unspecified amounts.
The court has granted the motions of BANA, BAS and other bank defendants to dismiss certain class plaintiffs’claims on statute of limitations grounds. The court permitted plaintiffs who purchased bonds in a 2001 $750 millionbond offering, of which BAS underwrote fifty percent, to assert claims against BAS relating to that offering and certainother offerings made under the same registration statement. The court has also granted in part and denied in partdefendants’ motions to dismiss certain of the individual actions. Other motions to dismiss the class action and certain ofthe individual actions remain pending.
BANA, BAS, FNB, and FSI are also defendants in an adversary proceeding brought by the Official Committee ofUnsecured Creditors on behalf of Adelphia and Adelphia as co-plaintiffs that had been pending in the U.S. BankruptcyCourt for the Southern District of New York. The lawsuit names over 400 defendants and asserts over 50 claims underfederal statutes, including the Bank Holding Company Act, state common law, and various provisions of the BankruptcyCode. The plaintiffs seek avoidance and recovery of payments, equitable subordination, disallowance andre-characterization of claims, and recovery of damages in an unspecified amount. The Official Committee of EquitySecurity Holders of Adelphia has intervened in this proceeding and filed its own complaint, which is similar to theunsecured creditors’ committee complaint and also asserts claims under RICO and additional state law theories. BANA,BAS and FSI have filed motions to dismiss both complaints. On February 9, 2006, the U.S. District Court for theSouthern District of New York overseeing the Adelphia securities litigation granted the motions of the adversarydefendants to withdraw the adversary proceeding from the bankruptcy court, except with respect to the pending motionsto dismiss.
Data Treasury
The Corporation and BANA have been named as defendants in an action filed by Data Treasury Corporation in theU.S. District Court for the Eastern District of Texas. Plaintiff alleges that defendants have “provided, sold, installed,utilized, and assisted others to use and utilize image-based banking and archival solutions” in a manner that infringesUnited States Patent Nos. 5,910,988 and 6,032,137. Plaintiff seeks unspecified damages and injunctive relief against thealleged infringement. The court has scheduled a trial of this action for October 2, 2007.
The Corporation and BANA have been named as defendants, along with 54 other defendants, in an action filed byData Treasury Corporation in the U.S. District Court for the Eastern District of Texas. Plaintiff alleges that theCorporation and BANA, among other defendants, are “making, using, selling, offering for sale, and/or importing into theUnited States, directly, contributory, and/or by inducement, without authority, products and services that fall within thescope of the claims of” United States Patent Nos. 5,265,007; 5,583,759; 5,717,868; and 5,930,778. Plaintiff seeksunspecified damages and injunctive relief against the alleged infringement.
In re Initial Public Offering Securities
Beginning in 2001, Robertson Stephens, Inc. (an investment banking subsidiary of FleetBoston that ceasedoperations during 2002), BAS, other underwriters, and various issuers and others, were named as defendants in
128
BANK OF AMERICA CORPORATION AND SUBSIDIARIES
Notes to Consolidated Financial Statements—(Continued)
purported class action lawsuits alleging violations of federal securities laws in connection with the underwriting ofinitial public offerings (IPOs) and seeking unspecified damages. Robertson Stephens, Inc. and BAS were named incertain of the 309 purported class actions that have been consolidated in the U.S. District Court for the Southern Districtof New York as In re Initial Public Offering Securities Litigation. The plaintiffs contend that the defendants failed tomake certain required disclosures and manipulated prices of IPO securities through, among other things, allegedagreements with institutional investors receiving allocations to purchase additional shares in the aftermarket, and falseand misleading analyst reports. On October 13, 2004, the court granted in part and denied in part plaintiffs’ motions tocertify as class actions six of the 309 cases. On June 30, 2005, the U.S. Court of Appeals for the Second Circuit grantedthe underwriter defendants’ petition for permission to appeal the court’s class certification order. The appeal is pending.
The plaintiffs have reached a settlement with 298 of the issuer defendants, in which the issuer defendantsguaranteed that the plaintiffs will receive at least $1.0 billion in the settled actions and assigned to the plaintiffs theissuers’ interest in all claims against the underwriters for “excess compensation.” On February 15, 2005, the U.S.District Court for the Southern District of New York conditionally approved the issuer defendants’ settlement. A fairnesshearing is scheduled for April 24, 2006.
Robertson Stephens, Inc. and other underwriters also have been named as defendants in putative class actionlawsuits filed in the U.S. District Court for the Southern District of New York under the federal antitrust laws allegingthat the underwriters conspired to manipulate the aftermarkets for IPO securities and to extract anticompetitive fees inconnection with IPOs. The complaint seeks declaratory relief and unspecified treble damages. On September 28, 2005,the Court of Appeals for the Second Circuit reversed the district court’s dismissal of the antitrust class actions,remanding the cases to the district court for further proceedings. The defendants have filed a petition for certiorari withthe United States Supreme Court, which is pending.
Interchange Anti-trust Litigation
The Corporation and certain of its subsidiaries are defendants in putative class actions that have been transferredfor coordinated pre-trial proceedings to the U.S. District Court for the Eastern District of New York, under the caption InRe Payment Card Interchange Fee and Merchant Discount Anti-Trust Litigation. Defendants include other financialinstitutions and, among others, Visa and MasterCard. Plaintiffs seek certification of a class of retail merchants andallege, among other claims, that defendants conspired to fix the level of interchange and merchant discount fees and thatcertain practices that prohibit merchants from charging cardholders for fees the merchant pays to the credit cardcompanies violate the federal antitrust laws. Plaintiffs seek unspecified treble damages and injunctive relief.
Miller
On August 13, 1998, a predecessor of BANA was named as a defendant in a class action filed in Superior Court ofCalifornia, County of San Francisco, entitled Paul J. Miller v. Bank of America, N.A., challenging its practice of debitingaccounts that received, by direct deposit, governmental benefits to repay fees incurred in those accounts. The actionalleges fraud, negligent misrepresentation and violations of certain California laws. On October 16, 2001, a class wascertified consisting of more than one million California residents who have, had or will have, at any time afterAugust 13, 1994, a deposit account with BANA into which payments of public benefits are or have been directlydeposited by the government. The case proceeded to trial on January 20, 2004.
On March 4, 2005, the trial court entered a judgment that awards the plaintiff class restitution in the amount of$284 million, plus attorneys’ fees, and provides that class members whose accounts were assessed an insufficient fundsfee in violation of law suffered substantial emotional or economic harm and, therefore, are entitled to an additional$1,000 penalty. The judgment also includes injunctive relief.
On May 13, 2005, BANA filed with the California Court of Appeal, First Appellate District, a notice of appeal and,on May 16, 2005, a writ of supersedeas, seeking a stay of the trial court’s judgment pending appeal. On November 22,2005, the Court of Appeal granted BANA’s writ, staying the judgment, including the injunction, pending appeal. Theappeal remains pending.
Mutual Fund Operations Matters
In early 2005, the Corporation entered into settlement agreements with the New York Attorney General and theSEC relating to late trading and market timing of mutual funds. The Corporation is continuing to respond to inquiriesfrom federal and state regulatory and law enforcement agencies concerning mutual fund related matters.
In addition, lawsuits seeking unspecified damages concerning mutual fund trading were brought against theCorporation and its pre-merger FleetBoston subsidiaries, including putative class actions purportedly brought on behalf
129
BANK OF AMERICA CORPORATION AND SUBSIDIARIES
Notes to Consolidated Financial Statements—(Continued)
of shareholders in Nations Funds mutual funds, derivative actions brought on behalf of one or more Nations Fundsmutual funds by Nations Funds shareholders, putative ERISA class actions brought on behalf of participants in Bank ofAmerica Corporation’s 401(k) plan, derivative actions brought against the Corporation’s directors on behalf of theCorporation by shareholders in the Corporation, class actions and derivative actions brought by shareholders in third-party mutual funds alleging that the Corporation or its subsidiaries facilitated improper trading in those funds, and aprivate attorney general action brought under California law. The lawsuits filed to date with respect to pre-mergerFleetBoston subsidiaries include putative class actions purportedly brought on behalf of shareholders in Columbiamutual funds, derivative actions brought on behalf of one or more Columbia mutual funds or trusts by Columbia mutualfund shareholders, and an individual shareholder action.
All lawsuits pending in federal courts with respect to alleged late trading or market timing in mutual funds havebeen transferred to the U.S. District Court for the District of Maryland for coordinated pre-trial proceedings under thecaption In re Mutual Funds Investment Litigation, other than a putative class action complaint filed on February 22,2006 in the U.S. District Court for the Southern District of New York alleging, among other things, market timing in theNations Funds. Motions to remand to state court remain pending in two of those lawsuits. One lawsuit that originated instate court was removed to the U.S. District Court for the Southern District of Illinois. Pursuant to an order of the U.S.Court of Appeals for the Seventh Circuit, the U.S. District Court for the Southern District of Illinois dismissed thataction. On January 6, 2006, the U.S. Supreme Court granted plaintiff’s petition for review on the issue of whether theCourt of Appeals for the Seventh Circuit had appellate jurisdiction to review the remand order.
On August 25, 2005, the U.S. District Court for the District of Maryland dismissed the state law claims andderivative claims filed by Janus shareholders against the Corporation and certain of its subsidiaries. The claims underSection 10(b) of the Securities Exchange Act of 1934 were not dismissed. On November 3, 2005, the court dismissed thestate law claims and derivative claims filed against the Corporation and certain of its subsidiaries by shareholders invarious third-party mutual funds. The claims under Section 10(b) of the Securities Exchange Act of 1934 were notdismissed. Also on November 3, 2005, the court dismissed the claims under the Securities Act of 1933, the claims underSections 34(b) and 36(a) of the Investment Company Act of 1940 (ICA) and the state law claims against the Corporationand certain of its pre-merger FleetBoston subsidiaries. The claims under Sections 10(b) and 20(a) of the SecuritiesExchange Act of 1934 and Section 36(b) of the ICA were not dismissed.
On December 15, 2005, the Corporation and its named subsidiaries entered into a settlement of the direct andderivative claims brought on behalf of the Nations Funds shareholders and the ERISA claims brought on behalf of Bankof America Corporation’s 401(k) plan participants. Among other conditions, the settlement is contingent upon aminimum threshold amount being received by the Nations Funds shareholders and/or the Nations Funds mutual fundsfrom the previously established regulatory settlement fund consisting of $250 million in disgorgement and $125 millionin civil penalties paid by the Corporation in 2005. The settlement is subject to court approval. If the settlement isapproved, the Corporation and its named subsidiaries would pay settlement administration costs and fees to plaintiffs’counsel as approved by the court.
Parmalat Finanziaria S.p.A.
On December 24, 2003, Parmalat Finanziaria S.p.A. was admitted into insolvency proceedings in Italy, known as“extraordinary administration.” The Corporation, through certain of its subsidiaries, including BANA, provided financialservices and extended credit to Parmalat and its related entities. On June 21, 2004, Extraordinary CommissionerDr. Enrico Bondi filed with the Italian Ministry of Production Activities a plan of reorganization for the restructuring ofthe companies of the Parmalat group that are included in the Italian extraordinary administration proceeding.
In July 2004, the Italian Ministry of Production Activities approved the Extraordinary Commissioner’s restructuringplan, as amended, for the Parmalat group companies that are included in the Italian extraordinary administrationproceeding. This plan was approved by the voting creditors of Parmalat and subsequently, on October 1, 2005, the Courtof Parma, Italy issued its decision approving those claimants who would be recognized as creditors in the proceeding.
Litigation and investigations relating to Parmalat are pending in both Italy and the United States, and theCorporation is responding to inquiries concerning Parmalat from regulatory and law enforcement authorities in Italyand the United States.
Proceedings in Italy
On May 26, 2004, the Public Prosecutor’s Office for the Court of Milan, Italy filed criminal charges against LucaSala, Luis Moncada, and Antonio Luzi, three former employees, alleging the crime of market manipulation in connectionwith a press release issued by Parmalat. The Public Prosecutor’s Office also filed a related charge against the
130
BANK OF AMERICA CORPORATION AND SUBSIDIARIES
Notes to Consolidated Financial Statements—(Continued)
Corporation asserting administrative liability based on an alleged failure to maintain an organizational model sufficientto prevent the alleged criminal activities of its former employees. Preliminary hearings began on this charge onFebruary 22, 2006.
The main trial of the market manipulation charges against Messrs. Luzi, Moncada, and Sala began in the Court ofMilan, Italy on September 28, 2005. Hearing dates in this trial are currently set through June 2006. The Corporation isparticipating in this trial as a party that has been damaged by the alleged actions of defendants other than its formeremployees, including former Parmalat officials. Additionally, pursuant to a December 19, 2005 court ruling, other thirdparties are participating in the trial who claim damages against BANA as a result of the alleged criminal violations ofthe Corporation’s former employees and other defendants.
Separately, The Public Prosecutor’s Office for the Court of Parma, Italy is conducting an investigation into thecollapse of Parmalat. The Corporation has cooperated, and continues to cooperate, with The Public Prosecutor’s Officewith respect to this investigation. The Public Prosecutor’s Office has given notice of its intention to file charges,including a charge of the crime of fraudulent bankruptcy under Italian criminal law, in connection with thisinvestigation against the same three former employees of the Corporation who are named in the Milan criminalproceedings, Messrs. Luzi, Moncada and Sala.
Proceedings in the United States
On March 5, 2004, a First Amended Complaint was filed in a putative securities class action pending in the U.S.District Court for the Southern District of New York entitled Southern Alaska Carpenters Pension Fund et al. v. BonlatFinancing Corporation et al., which names the Corporation as a defendant. The action is brought on behalf of a putativeclass of purchasers of Parmalat securities. The First Amended Complaint alleges causes of action against theCorporation for violations of the federal securities laws based upon the Corporation’s alleged role in the alleged Parmalataccounting fraud. This action was consolidated with several other putative class actions filed against multipledefendants, and on October 18, 2004, an Amended Consolidated Complaint was filed. Unspecified damages are beingsought. On July 13, 2005, the court granted in its entirety the motion to dismiss filed by the Corporation, BANA andBanc of America Securities Limited in the consolidated putative class actions. The court granted the plaintiffs a right tofile a second amended complaint. After the filing of the second amended complaint and the Corporation’s motion todismiss such complaint, on February 9, 2006, the court granted the Corporation’s motion to dismiss in part, allowing theplaintiff to proceed on claims with respect to two transactions entered into between the Corporation and Parmalat. OnFebruary 27, 2006, the Corporation filed its answer to the second amended complaint.
On October 7, 2004, Enrico Bondi filed an action in the U.S. District Court for the Western District of NorthCarolina on behalf of Parmalat and its shareholders and creditors against the Corporation and various related entities,entitled Dr. Enrico Bondi, Extraordinary Commissioner of Parmalat Finanziaria, S.p.A., et al. v. Bank of AmericaCorporation, et al. (the Bondi Action). The complaint alleges federal and state RICO claims and various state law claims,including fraud. The complaint seeks damages in excess of $10.0 billion. The Bondi Action was transferred to the U.S.District Court for the Southern District of New York for coordinated pre-trial purposes with the putative class actionsand other related cases against non-Bank of America defendants under the caption In re Parmalat Securities Litigation.
On August 5, 2005, the U.S. District Court for the Southern District of New York granted the Corporation’s motionto dismiss the Bondi Action in part, dismissing ten of the twelve counts. After the plaintiff’s filing of a First AmendedComplaint on September 9, 2005, and the Corporation’s motion to dismiss such complaint on January 31, 2006, the courtgranted the Corporation’s motion to dismiss in part, allowing the plaintiff to proceed on the previously dismissed claimswith respect to three transactions entered into between the Corporation and Parmalat. On February 10, 2006, theCorporation filed its answer to the First Amended Complaint and also its request to file counterclaims in the BondiAction.
On November 23, 2005, the Official Liquidators of Food Holdings Limited and Dairy Holdings Limited, two entitiesin liquidation proceedings in the Cayman Islands, filed a complaint in the U.S. District Court for the Southern District ofNew York against the Corporation and several related entities, entitled Food Holdings Ltd, et al. v. Bank of AmericaCorp., et al. (the Food Holdings Action). The complaint in the Food Holdings Action alleges that the Corporation andother defendants conspired with Parmalat in carrying out transactions involving the plaintiffs in connection with thefunding of Parmalat’s Brazilian entities, and it asserts claims for fraud, negligent misrepresentation, breach of fiduciaryduty and other related claims. The complaint seeks damages in excess of $400 million. The Food Holdings Action wasconsolidated for pretrial purposes with the other pending actions in the In Re Parmalat Securities Litigation matter.
On November 23, 2005, the Provisional Liquidators of Parmalat Capital Finance Limited (PCFL) (who are also theOfficial Liquidators of Food Holdings Ltd. and Dairy Holdings Ltd.) filed a complaint against the Corporation and
131
BANK OF AMERICA CORPORATION AND SUBSIDIARIES
Notes to Consolidated Financial Statements—(Continued)
several related entities in North Carolina state court for Mecklenburg County, entitled Parmalat Capital FinanceLimited v. Bank of America Corp., et al. (the PCFL Action). PCFL is a Cayman Islands corporation that is in liquidationproceedings in Grand Cayman. The PCFL Action alleges that the Corporation and other defendants conspired withParmalat insiders to loot and divert monies from PCFL, and it asserts claims for breach of fiduciary duty, aiding andabetting breach of fiduciary duty and other related claims. PCFL asserts that it lost hundreds of millions of dollars as adirect result of the Corporation’s activities. The Corporation has filed a notice of removal to the U.S. District Court forthe Western District of North Carolina. The PCFL Action has been transferred to the U.S. District Court for theSouthern District of New York for coordinated pre-trial purposes with the other Parmalat-related proceedings.
On December 15, 2005, certain purchasers of Parmalat-related private placement offerings filed first amendedpetitions against the Corporation and various related entities in state courts in Iowa, entitled Principal Global Investors,LLC, et al. v. Bank of America Corporation, et al. (Principal Global Investors) and Monumental Life Insurance Company,et al. v. Bank of America Corporation, et al. (Monumental Life Insurance Company). The actions allege violations of Iowastate securities law and various state law claims, and seek rescission and unspecified damages based upon theCorporation’s and related entities’ alleged roles in certain private placement offerings issued by Parmalat-relatedcompanies. On January 4 and 5, 2006, respectively, the Principal Global Investors case was removed to the U.S. DistrictCourt for the Southern District of Iowa, and the Monumental Life Insurance Company case was removed to the U.S.District Court for the Northern District of Iowa. On February 13, 2006, the Corporation filed its answers to each of thesecomplaints. On February 15, 2006, these cases were consolidated for pretrial purposes with the In Re ParmalatSecurities Litigation matter.
On January 18, 2006, Gerald K. Smith, in his capacity as Trustee of Farmland Dairies LLC Litigation Trust, filed acomplaint against the Corporation, BANA, BAS, BASL, Bank of America National Trust & Savings Association andBankAmerica International Limited, as well as other financial institutions and accounting firms, in the U.S. DistrictCourt for the Southern District of New York, entitled Gerald K. Smith, Litigation Trustee v. Bank of AmericaCorporation, et al. (the “Farmland Action”). Prior to bankruptcy restructuring, Farmland Dairies LLC was a wholly-owned subsidiary of Parmalat USA Corporation, which was a wholly-owned subsidiary of Parmalat SpA. The FarmlandAction asserts claims of aiding and abetting, breach of fiduciary duty, civil conspiracy and related claims against theBank of America defendants and other defendants. The plaintiff seeks unspecified damages. On February 23, 2006, theplaintiff filed its first amended complaint.
Pension Plan Matters
The Corporation is a defendant in a putative class action entitled William L. Pender, et al. v. Bank of AmericaCorporation, et al. (formerly captioned Anita Pothier, et al. v. Bank of America Corporation, et al.), which was initiallyfiled June 2004 in the U.S. District Court for the Southern District of Illinois and subsequently transferred to the U.S.District Court for the Western District of North Carolina. The action is brought on behalf of participants in orbeneficiaries of The Bank of America Pension Plan (formerly known as the NationsBank Cash Balance Plan) and TheBank of America 401(k) Plan (formerly known as the NationsBank 401(k) Plan). The Third Amended Complaint namesas defendants the Corporation, BANA, The Bank of America Pension Plan, The Bank of America 401(k) Plan, the Bankof America Corporation Corporate Benefits Committee and various members thereof, and PricewaterhouseCoopers LLP.The two named plaintiffs are alleged to be a current and a former participant in The Bank of America Pension Plan and401(k) Plan.
The Third Amended Complaint alleges the defendants violated various provisions of ERISA, including that thedesign of The Bank of America Pension Plan violated ERISA’s defined benefit pension plan standards and that suchplan’s definition of normal retirement age is invalid. In addition, the complaint alleges age discrimination in the designand operation of The Bank of America Pension Plan, unlawful lump sum benefit calculation, violation of ERISA’s “anti-backloading” rule, improper benefit to the Corporation and its predecessor, and various prohibited transactions andfiduciary breaches. The complaint further alleges that certain voluntary transfers of assets by participants in The Bankof America 401(k) Plan to The Bank of America Pension Plan violated ERISA.
The complaint alleges that current and former participants in these plans are entitled to greater benefits and seeksdeclaratory relief, monetary relief in an unspecified amount, equitable relief, including an order reforming The Bank ofAmerica Pension Plan, attorneys’ fees and interest.
The court has scheduled the case for trial in September 2006. On September 25, 2005, defendants moved to dismissthe Third Amended Complaint. The motion is pending.
On December 1, 2005, the named plaintiffs moved to certify classes consisting of, among others, (1) all persons whoaccrued or who are currently accruing benefits under The Bank of America Pension Plan and (2) all persons who elected
132
BANK OF AMERICA CORPORATION AND SUBSIDIARIES
Notes to Consolidated Financial Statements—(Continued)
to have amounts representing their account balances under The Bank of America 401(k) Plan transferred to The Bank ofAmerica Pension Plan. The motion for class certification is pending.
The IRS is conducting an audit of the 1998 and 1999 tax returns of The Bank of America Pension Plan and TheBank of America 401(k) Plan. This audit includes a review of voluntary transfers by participants of 401(k) Plan assets toThe Bank of America Pension Plan and whether such transfers were in accordance with applicable law. In December2005, the Corporation received a Technical Advice Memorandum from the National Office of the IRS that concludes thatthe amendments made to The Bank of America 401(k) Plan in 1998 to permit the voluntary transfers to The Bank ofAmerica Pension Plan violated the anti-cutback rule of Section 411(d)(6) of the Internal Revenue Code. The Corporationcontinues to participate in administrative proceedings with the IRS regarding issues raised in the audit.
On September 29, 2004, a separate putative class action, entitled Donna C. Richards v. FleetBoston Financial Corp.and the FleetBoston Financial Pension Plan (Fleet Pension Plan), was filed in the U.S. District Court for the District ofConnecticut on behalf of all former and current Fleet employees who on December 31, 1996, were not at least age 50with 15 years of vesting service and who participated in the Fleet Pension Plan before January 1, 1997, and who haveparticipated in the Fleet Pension Plan at any time since January 1, 1997.
The complaint alleges that FleetBoston or its predecessor violated ERISA by amending the Fleet Financial Group,Inc. Pension Plan (a predecessor to the Fleet Pension Plan) to add a cash balance benefit formula without notifyingparticipants that the amendment significantly reduced their plan benefits, by conditioning the amount of benefitspayable under the Fleet Pension Plan upon the form of benefit elected, by reducing the rate of benefit accruals onaccount of age, and by failing to inform participants of the correct amount of their pensions and related claims. Thecomplaint also alleges that the Fleet Pension Plan violates the “anti-backloading” rule of ERISA.
The complaint seeks equitable and remedial relief, including a declaration that the cash balance amendment to theFleet Pension Plan was ineffective, additional unspecified benefit payments, attorneys’ fees and interest.
On December 28, 2004, plaintiff filed a motion for class certification. On January 25, 2005, the defendants moved todismiss the action. These motions are pending.
Refco
Beginning in October 2005, BAS was named as a defendant in several federal class action and derivative lawsuitsfiled in the U.S. District Court for the Southern District of New York relating to Refco Inc. The lawsuits variously nameas other defendants Refco’s outside auditors, certain officers and directors of Refco, other financial services companies(including in two cases the Corporation), and other individuals and companies. The actions allege violations of federalsecurities laws and state laws in connection with the sale of Refco securities, including the Refco senior subordinatednotes offering in August 2004 and the Refco initial public offering in August 2005. Customers of Refco have also namedBAS, the Corporation and other underwriters as defendants in a federal class action under the federal securities laws.The complaints seek unspecified damages. BAS is also responding to various regulatory inquiries relating to Refco.
Trading and Research Activities
The SEC has been conducting a formal investigation with respect to certain trading and research-related activitiesof BAS. These matters primarily arose during the period 1999-2001 in BAS’ San Francisco operations. In September2005, the SEC staff advised BAS that it intends to recommend to the SEC an enforcement action against BAS inconnection with these matters. This matter remains pending.
133
BANK OF AMERICA CORPORATION AND SUBSIDIARIES
Notes to Consolidated Financial Statements—(Continued)
Note 14—Shareholders’ Equity and Earnings Per Common Share
The following table presents share repurchase activity for the three months and years ended December 31, 2005,2004 and 2003, including total common shares repurchased under announced programs, weighted average per shareprice and the remaining buyback authority under announced programs.
(Dollars in millions, except per shareinformation; shares in thousands)
Number of CommonShares Repurchased
under AnnouncedPrograms(1)
WeightedAverage
PerShare
Price(1)
Remaining Buyback Authorityunder Announced Programs(2)
(1) Reduced Shareholders’ Equity by $5.8 billion and increased diluted earnings per common share by $0.05 in 2005. These repurchases were partiallyoffset by the issuance of approximately 79.6 million shares of common stock under employee plans, which increased Shareholders’ Equity by $3.1billion, net of $145 million of deferred compensation related to restricted stock awards, and decreased diluted earnings per common share by $0.04 in2005.
(2) On January 28, 2004, the Board authorized a stock repurchase program of up to 180 million shares of the Corporation’s common stock at an aggregatecost not to exceed $9.0 billion. This repurchase plan was completed during the third quarter of 2005. On March 22, 2005, the Board authorized anadditional stock repurchase program of up to 200 million shares of the Corporation’s common stock at an aggregate cost not to exceed $12.0 billion andto be completed within a period of 18 months.
(3) Reduced Shareholders’ Equity by $6.3 billion and increased diluted earnings per common share by $0.06 in 2004. These repurchases were partiallyoffset by the issuance of approximately 121 million shares of common stock under employee plans, which increased Shareholders’ Equity by $3.9billion, net of $127 million of deferred compensation related to restricted stock awards, and decreased diluted earnings per common share by $0.06 in2004.
(4) On January 22, 2003, the Board authorized a stock repurchase program of up to 260 million shares of the Corporation’s common stock at an aggregatecost of $12.5 billion. This repurchase plan was completed during the second quarter of 2004. On January 28, 2004, the Board authorized a stockrepurchase program of up to 180 million shares of the Corporation’s common stock at an aggregate cost not to exceed $9.0 billion. This repurchase planwas completed during the third quarter of 2005.
(5) Reduced Shareholders’ Equity by $9.8 billion and increased diluted earnings per common share by $0.11 in 2003. These repurchases were partiallyoffset by the issuance of approximately 139 million shares of common stock under employee plans, which increased Shareholders’ Equity by $4.2billion, net of $123 million of deferred compensation related to restricted stock awards, and decreased diluted earnings per common share by $0.08 in2003.
(6) On December 11, 2001, the Board authorized a stock repurchase program of up to 260 million shares of the Corporation’s common stock at anaggregate cost of up to $10.0 billion. This repurchase plan was completed during the second quarter of 2003. On January 22, 2003, the Boardauthorized a stock repurchase program of up to 260 million shares of the Corporation’s common stock at an aggregate cost of $12.5 billion. Thisrepurchase plan was completed during the second quarter of 2004.
134
BANK OF AMERICA CORPORATION AND SUBSIDIARIES
Notes to Consolidated Financial Statements—(Continued)
The Corporation will continue to repurchase shares, from time to time, in the open market or in private transactionsthrough the Corporation’s approved repurchase programs. The Corporation expects to continue to repurchase a numberof shares of common stock at least equal to any shares issued under the Corporation’s employee stock plans.
At December 31, 2005, the Corporation had 690,000 shares authorized and 382,450 shares, or $96 million,outstanding of Bank of America 6.75% Perpetual Preferred Stock with a stated value of $250 per share. Ownership isheld in the form of depositary shares paying dividends quarterly at an annual rate of 6.75 percent. On or after April 15,2006, the Corporation may redeem Bank of America 6.75% Perpetual Preferred Stock, in whole or in part, at its option,at $250 per share, plus accrued and unpaid dividends.
The Corporation also had 805,000 shares authorized and 700,000 shares, or $175 million, outstanding of Bank ofAmerica Fixed/Adjustable Rate Cumulative Preferred Stock with a stated value of $250 per share. Ownership is held inthe form of depositary shares paying dividends quarterly at an annual rate of 6.60 percent through April 1, 2006. AfterApril 1, 2006, the dividend rate on Fixed/Adjustable Rate Cumulative Preferred Stock will be a rate per annum equal to0.50 percent plus the highest of the Treasury Bill Rate, the Ten Year Constant Maturity Rate, and the Thirty YearConstant Maturity Rate, as each term is defined in BAC’s Amended and Restated Certificate of Designationsestablishing the Fixed/Adjustable Rate Cumulative Preferred Stock. The applicable rate per annum for any dividendperiod beginning on or after April 1, 2006 will not be less than 7.00 percent nor greater than 13.00 percent. On or afterApril 1, 2006, the Corporation may redeem Bank of America Fixed/Adjustable Rate Cumulative Preferred Stock, inwhole or in part, at its option, at $250 per share, plus accrued and unpaid dividends.
In addition to the preferred stock described above, the Corporation had 35,045 shares authorized and 7,739 shares,or $1 million, outstanding of the Series B Preferred Stock with a stated value of $100 per share paying dividendsquarterly at an annual rate of 7.00 percent. The Corporation may redeem the Series B Preferred Stock, in whole or inpart, at its option, at $100 per share, plus accrued and unpaid dividends.
All preferred stock outstanding has preference over our common stock with respect to the payment of dividends anddistribution of our assets in the event of a liquidation or dissolution. Except in certain circumstances, the holders ofpreferred stock have no voting rights.
The following table presents the changes in Accumulated OCI for 2005 and 2004.
(Dollars in millions)(1) Securities Derivatives(2) Other Total
(2) The amount included in Accumulated OCI for terminated derivative contracts was a loss of $2.5 billion and a gain of $143 million,net-of-tax, at December 31, 2005 and 2004.
(3) Included in this line item are amounts related to derivatives used in cash flow hedge relationships. These amounts are reclassifiedinto earnings in the same period or periods during which the hedged forecasted transaction affects earnings.
135
BANK OF AMERICA CORPORATION AND SUBSIDIARIES
Notes to Consolidated Financial Statements—(Continued)
The calculation of earnings per common share and diluted earnings per common share for 2005, 2004and 2003 is presented below. See Note 1 of the Consolidated Financial Statements for a discussion on thecalculation of earnings per common share.
(Dollars in millions, except per share information; shares in thousands) 20052004
(1) For 2005, 2004 and 2003, average options to purchase 39 million, 62 million and 34 million shares, respectively, were outstandingbut not included in the computation of earnings per common share because they were antidilutive.
(2) Includes incremental shares from assumed conversions of convertible preferred stock, restricted stock units, restricted stock sharesand stock options.
Effective for the third quarter dividend, the Board increased the quarterly cash dividend 11 percent from $0.45 to$0.50 per common share. In October 2005, the Board declared a fourth quarter cash dividend which was paid onDecember 23, 2005 to common shareholders of record on December 2, 2005. In January 2006, the Board declared aquarterly cash dividend of $0.50 per common share payable on March 24, 2006 to shareholders of record on March 3,2006.
Note 15—Regulatory Requirements and Restrictions
The Board of Governors of the Federal Reserve System (FRB) requires the Corporation’s banking subsidiaries tomaintain reserve balances based on a percentage of certain deposits. Average daily reserve balances required by theFRB were $6.4 billion and $6.3 billion for 2005 and 2004. Currency and coin residing in branches and cash vaults (vaultcash) are used to partially satisfy the reserve requirement. The average daily reserve balances, in excess of vault cash,held with the Federal Reserve Bank amounted to $361 million and $627 million for 2005 and 2004.
The primary source of funds for cash distributions by the Corporation to its shareholders is dividends received fromits banking subsidiaries. Bank of America, N.A., Bank of America, N.A. (USA) and Fleet National Bank declared andpaid dividends of $7.4 billion, $1.9 billion and $750 million, respectively, for 2005 to the parent. On June 13, 2005, FleetNational Bank merged with and into Bank of America, N.A., with Bank of America, N.A. as the surviving entity. In2006, Bank of America, N.A. and Bank of America, N.A. (USA) can declare and pay dividends to the parent of $12.1billion and $879 million plus an additional amount equal to its net profits for 2006, as defined by statute, up to the dateof any such dividend declaration. The other subsidiary national banks can initiate aggregate dividend payments in 2006of $44 million plus an additional amount equal to their net profits for 2006, as defined by statute, up to the date of anysuch dividend declaration. The amount of dividends that each subsidiary bank may declare in a calendar year withoutapproval by the OCC is the subsidiary bank’s net profits for that year combined with its net retained profits, as defined,for the preceding two years.
The FRB, the OCC and the Federal Deposit Insurance Corporation (collectively, the Agencies) have issuedregulatory capital guidelines for U.S. banking organizations. Failure to meet the capital requirements can initiatecertain mandatory and discretionary actions by regulators that could have a material effect on the Corporation’sfinancial statements. At December 31, 2005 and 2004, the Corporation, Bank of America, N.A. and Bank of America,
136
BANK OF AMERICA CORPORATION AND SUBSIDIARIES
Notes to Consolidated Financial Statements—(Continued)
N.A. (USA) were classified as well-capitalized under this regulatory framework. There have been no conditions or eventssince December 31, 2005 that management believes have changed the Corporation’s, Bank of America, N.A.’s and Bankof America, N.A. (USA)’s capital classifications.
The regulatory capital guidelines measure capital in relation to the credit and market risks of both on andoff-balance sheet items using various risk weights. Under the regulatory capital guidelines, Total Capital consists ofthree tiers of capital. Tier 1 Capital includes Common Shareholders’ Equity, Trust Securities, minority interests andqualifying Preferred Stock, less Goodwill and other adjustments. Tier 2 Capital consists of Preferred Stock not qualifyingas Tier 1 Capital, mandatory convertible debt, limited amounts of subordinated debt, other qualifying term debt, theallowance for credit losses up to 1.25 percent of risk-weighted assets and other adjustments. Tier 3 Capital includessubordinated debt that is unsecured, fully paid, has an original maturity of at least two years, is not redeemable beforematurity without prior approval by the FRB and includes a lock-in clause precluding payment of either interest orprincipal if the payment would cause the issuing bank’s risk-based capital ratio to fall or remain below the requiredminimum. Tier 3 Capital can only be used to satisfy the Corporation’s market risk capital requirement and may not beused to support its credit risk requirement. At December 31, 2005 and 2004, the Corporation had no subordinated debtthat qualified as Tier 3 Capital.
Certain corporate sponsored trust companies which issue trust preferred securities (Trust Securities) are notconsolidated under FIN 46R. As a result, the Trust Securities are not included on our Consolidated Balance Sheets. OnMarch 1, 2005, the FRB issued Risk-Based Capital Standards: Trust Preferred Securities and the Definition of Capital(the Final Rule) which allows Trust Securities to continue to qualify as Tier 1 Capital with revised quantitative limitsthat would be effective after a five-year transition period. As a result, Trust Securities are included in Tier 1 Capital.
The FRB’s Final Rule limits restricted core capital elements to 15 percent for internationally active bank holdingcompanies. Internationally active bank holding companies are those with consolidated assets greater than $250 billion oron-balance sheet exposure greater than $10 billion. At December 31, 2005, our restricted core capital elements comprised16.6 percent of total core capital elements. In addition, the FRB revised the qualitative standards for capital instrumentsincluded in regulatory capital. We expect to be fully compliant with the revised limits prior to the implementation date ofMarch 31, 2009.
On July 28, 2004, the FRB and other regulatory agencies issued the Final Capital Rule for Consolidated Asset-backed Commercial Paper Program Assets (the Final Rule). The Final Rule allows companies to exclude from risk-weighted assets, the assets of consolidated asset-backed commercial paper (ABCP) conduits when calculating Tier 1 andTotal Risk-based Capital ratios. The Final Rule also requires that liquidity commitments provided by the Corporation toABCP conduits, whether consolidated or not, be included in the capital calculations. The Final Rule was effectiveSeptember 30, 2004. There was no material impact to Tier 1 and Total Risk-based Capital as a result of the adoption ofthis rule.
To meet minimum, adequately-capitalized regulatory requirements, an institution must maintain a Tier 1 Capitalratio of four percent and a Total Capital ratio of eight percent. A well-capitalized institution must generally maintaincapital ratios 200 bps higher than the minimum guidelines. The risk-based capital rules have been furthersupplemented by a leverage ratio, defined as Tier 1 Capital divided by adjusted quarterly average Total Assets, aftercertain adjustments. The leverage ratio guidelines establish a minimum of three percent. Banking organizations mustmaintain a leverage capital ratio of at least five percent to be classified as well-capitalized. As of December 31, 2005, theCorporation was classified as well-capitalized for regulatory purposes, the highest classification.
Net Unrealized Gains (Losses) on AFS Debt Securities, Net Unrealized Gains on AFS Marketable Equity Securitiesand the Net Unrealized Gains (Losses) on Derivatives included in Shareholders’ Equity at December 31, 2005 and 2004,are excluded from the calculations of Tier 1 Capital and leverage ratios. The Total Capital ratio excludes all of the abovewith the exception of up to 45 percent of Net Unrealized Gains on AFS Marketable Equity Securities.
Regulatory Capital Developments
In June 2004, the Basel Committee on Banking Supervision issued a new set of risk-based capital standards (BaselII) with the intent of more closely aligning regulatory capital requirements with underlying risk. In August 2003, theU.S. regulatory agencies drafted the Advanced Notice of Proposed Rulemaking to establish a comparable rule for largeU.S. financial institutions. The final rule, which is expected to be issued during the second quarter of 2006, will provideus with clarification as to the requirements under U.S. regulations.
Several of our international units will begin implementing Basel II locally during 2006, with full implementation by2007. U.S. regulatory agencies have delayed implementation of Basel II for the consolidated entity until 2008. During
137
BANK OF AMERICA CORPORATION AND SUBSIDIARIES
Notes to Consolidated Financial Statements—(Continued)
2008, we will operate in a parallel testing environment, where current regulatory capital measures will be utilizedsimultaneously with the new rules. However, in 2009 and until at least 2011, the U.S. is expected to impose floors(limits) on capital reductions when compared to current measures.
Regulatory Capital
December 312005 2004
(Restated)Actual Minimum
Required(1)
Actual MinimumRequired(1)(Dollars in millions) Ratio Amount Ratio Amount
(1) Dollar amount required to meet guidelines for adequately capitalized institutions.(2) On June 13, 2005, Fleet National Bank merged with and into Bank of America, N.A., with Bank of America, N.A. as the surviving
entity.
Note 16—Employee Benefit Plans
Pension and Postretirement Plans
The Corporation sponsors noncontributory trusteed qualified pension plans that cover substantially all officers andemployees. The plans provide defined benefits based on an employee’s compensation, age and years of service. The Bankof America Pension Plan (the Pension Plan) provides participants with compensation credits, based on age and years ofservice. The Pension Plan allows participants to select from various earnings measures, which are based on the returnsof certain funds or common stock of the Corporation. The participant-selected earnings measures determine the earningsrate on the individual participant account balances in the Pension Plan. Participants may elect to modify earningsmeasure allocations on a periodic basis subject to the provisions of the Pension Plan. The benefits become vested uponcompletion of five years of service. It is the policy of the Corporation to fund not less than the minimum funding amountrequired by ERISA.
The Pension Plan has a balance guarantee feature, applied at the time a benefit payment is made from the plan,that protects participant balances transferred and certain compensation credits from future market downturns. TheCorporation is responsible for funding any shortfall on the guarantee feature.
The Corporation sponsors a number of noncontributory, nonqualified pension plans. These plans, which areunfunded, provide defined pension benefits to certain employees.
In addition to retirement pension benefits, full-time, salaried employees and certain part-time employees maybecome eligible to continue participation as retirees in health care and/or life insurance plans sponsored by theCorporation. Based on the other provisions of the individual plans, certain retirees may also have the cost of thesebenefits partially paid by the Corporation.
As a result of the FleetBoston Merger, the Corporation assumed the obligations related to the plans of formerFleetBoston. These plans are substantially similar to the legacy Bank of America plans discussed above, however, the
138
BANK OF AMERICA CORPORATION AND SUBSIDIARIES
Notes to Consolidated Financial Statements—(Continued)
FleetBoston Financial Pension Plan does not allow participants to select various earnings measures; rather the earningsrate is based on a benchmark rate. The tables within this Note include the information related to these plans beginningon April 1, 2004.
Reflected in these results are key changes to the Postretirement Health and Life Plans and the NonqualifiedPension Plans. On December 8, 2003, the President signed the Medicare Act into law. The Medicare Act introduces avoluntary prescription drug benefit under Medicare as well as a federal subsidy to sponsors of retiree health care plansthat provide at least an actuarially equivalent benefit. In the third quarter of 2004, the Corporation adopted FSPNo. 106-2, which resulted in a reduction of $53 million in the Corporation’s accumulated postretirement benefitobligation. In addition, the Corporation’s net periodic benefit cost for other postretirement benefits was decreased by $15million for 2004 as a result of the remeasurement.
139
BANK OF AMERICA CORPORATION AND SUBSIDIARIES
Notes to Consolidated Financial Statements—(Continued)
The following table summarizes the changes in the fair value of plan assets, changes in the projected benefitobligation (PBO), the funded status of both the accumulated benefit obligation (ABO) and the PBO, and the weightedaverage assumptions used to determine benefit obligations for the pension plans and postretirement plans atDecember 31, 2005 and 2004. Prepaid and accrued benefit costs are reflected in Other Assets, and Accrued Expenses andOther Liabilities on the Consolidated Balance Sheet. The discount rate assumption is based on a cash flow matchingtechnique and this assumption is subject to change each year. This technique utilizes a yield curve based upon Moody’sAa corporate bonds with cash flows that match estimated benefit payments to produce the discount rate assumption. Forthe Pension Plan and the FleetBoston Pension Plan (the Qualified Pension Plans), as well as the Postretirement Healthand Life Plans, the discount rate at December 31, 2005, was 5.50 percent. For both the Qualified Pension Plans and thePostretirement Health and Life Plans, the expected long-term return on plan assets will be 8.00 percent for 2006. Theexpected return on plan assets is determined using the calculated market-related value for the Qualified Pension Plansand the fair value for the Postretirement Health and Life Plans. The asset valuation method for the Qualified PensionPlans recognizes 60 percent of the market gains or losses in the first year, with the remaining 40 percent spread equallyover the next four years.
Qualified PensionPlans(1)
NonqualifiedPension Plans(1)
PostretirementHealth and Life Plans(1)
(Dollars in millions) 2005 2004 2005 2004 2005 2004
Change in fair value of plan assets(Primarily listed stocks, fixed income and real
(1) The measurement date for the Qualified Pension Plans, Nonqualified Pension Plans, and Postretirement Health and Life Plans wasDecember 31 of each year reported.
(2) The Corporation’s best estimate of its contributions to be made to the Qualified Pension Plans, Nonqualified Pension Plans, andPostretirement Health and Life Plans in 2006 is $0 million, $97 million and $37 million.
(3) In connection with the FleetBoston Merger, the plans of former FleetBoston were remeasured on April 1, 2004, using a discountrate of 6.00 percent.
n/a = not applicable
140
BANK OF AMERICA CORPORATION AND SUBSIDIARIES
Notes to Consolidated Financial Statements—(Continued)
Amounts recognized in the Consolidated Financial Statements at December 31, 2005 and 2004 were as follows:
Qualified PensionPlans
NonqualifiedPension Plans
PostretirementHealth and Life Plans
(Dollars in millions) 2005 2004 2005 2004 2005 2004
(1) Includes the effect of the adoption of FSP No. 106-2, which reduced net periodic postretirement benefit cost by $15 million.(2) In connection with the FleetBoston Merger, the plans of former FleetBoston were remeasured on April 1, 2004, using a discount
rate of 6.00 percent.
141
BANK OF AMERICA CORPORATION AND SUBSIDIARIES
Notes to Consolidated Financial Statements—(Continued)
Net periodic postretirement health and life expense was determined using the “projected unit credit” actuarialmethod. Gains and losses for all benefits except postretirement health care are recognized in accordance with thestandard amortization provisions of the applicable accounting standards. For the Postretirement Health Care Plans, 50percent of the unrecognized gain or loss at the beginning of the fiscal year (or at subsequent remeasurement) isrecognized on a level basis during the year.
Assumed health care cost trend rates affect the postretirement benefit obligation and benefit cost reported for thePostretirement Health Care Plans. The assumed health care cost trend rate used to measure the expected cost ofbenefits covered by the Postretirement Health Care Plans was 10 percent for 2006, reducing in steps to 5 percent in 2011and later years. A one-percentage-point increase in assumed health care cost trend rates would have increased theservice and interest costs and the benefit obligation by $3 million and $51 million in 2005, $4 million and $56 million in2004, and $4 million and $52 million in 2003. A one-percentage-point decrease in assumed health care cost trend rateswould have lowered the service and interest costs and the benefit obligation by $3 million and $43 million in 2005, $3million and $48 million in 2004, and $3 million and $48 million in 2003.
Plan Assets
The Qualified Pension Plans have been established as retirement vehicles for participants, and trusts have beenestablished to secure benefits promised under the Qualified Pension Plans. The Corporation’s policy is to invest the trustassets in a prudent manner for the exclusive purpose of providing benefits to participants and defraying reasonableexpenses of administration. The Corporation’s investment strategy is designed to provide a total return that, over thelong-term, increases the ratio of assets to liabilities. The strategy attempts to maximize the investment return on assetsat a level of risk deemed appropriate by the Corporation while complying with ERISA and any subsequent applicableregulations and laws. The investment strategy utilizes asset allocation as a principal determinant for establishing therisk/reward profile of the assets. Asset allocation ranges are established, periodically reviewed, and adjusted as fundinglevels and liability characteristics change. Active and passive investment managers are employed to help enhance therisk/return profile of the assets. An additional aspect of the investment strategy used to minimize risk (part of the assetallocation plan) includes matching the equity exposure of participant-selected earnings measures. For example, thecommon stock of the Corporation held in the trust is maintained as an offset to the exposure related to participants whoselected to receive an earnings measure based on the return performance of common stock of the Corporation.
The Expected Return on Asset Assumption (EROA assumption) was developed through analysis of historical marketreturns, historical asset class volatility and correlations, current market conditions, anticipated future asset allocations,the funds’ past experience, and expectations on potential future market returns. The EROA assumption represents along-term average view of the performance of the Qualified Pension Plans and Postretirement Health and Life Planassets, a return that may or may not be achieved during any one calendar year. In a simplistic analysis of the EROAassumption, the building blocks used to arrive at the long-term return assumption would include an implied return fromequity securities of 8.75 percent, debt securities of 5.75 percent, and real estate of 8.75 percent for all pension plans andpostretirement health and life plans.
The Qualified Pension Plans’ asset allocation at December 31, 2005 and 2004 and target allocation for 2006 by assetcategory are as follows:
2006Target
AllocationPercentage of Plan Assets at December 31
Equity securities include common stock of the Corporation in the amounts of $798 million (6.10 percent of total planassets) and $871 million (7.17 percent of total plan assets) at December 31, 2005 and 2004.
142
BANK OF AMERICA CORPORATION AND SUBSIDIARIES
Notes to Consolidated Financial Statements—(Continued)
The Postretirement Health and Life Plans’ asset allocation at December 31, 2005 and 2004 and target allocation for2006 by asset category are as follows:
2006Target
AllocationPercentage of Plan Assets at December 31
The Bank of America Postretirement Health and Life Plans had no investment in the common stock of theCorporation at December 31, 2005 or 2004. The FleetBoston Postretirement Health and Life Plans included commonstock of the Corporation in the amount of $0.3 million (0.27 percent of total plan assets) at December 31, 2005 and $0.3million (0.20 percent of total plan assets) at December 31, 2004.
Projected Benefit Payments
Benefit payments projected to be made from the Qualified Pension Plans, the Nonqualified Pension Plans and thePostretirement Health and Life Plans are as follows:
(1) Benefit payments expected to be made from the plans’ assets.(2) Benefit payments expected to be made from the Corporation’s assets.(3) Benefit payments (net of retiree contributions) expected to be made from a combination of the plans’ and the Corporation’s assets.
Defined Contribution Plans
The Corporation maintains qualified defined contribution retirement plans and nonqualified defined contributionretirement plans. As a result of the FleetBoston Merger, beginning on April 1, 2004, the Corporation maintains thedefined contribution plans of former FleetBoston. There are two components of the qualified defined contribution plans,the Bank of America 401(k) Plan and the FleetBoston Financial Savings Plan (the 401(k) Plans), an employee stockownership plan (ESOP) and a profit-sharing plan.
The Corporation contributed approximately $274 million, $267 million and $204 million for 2005, 2004 and 2003, incash and stock. Contributions in 2003 were utilized primarily to purchase the Corporation’s common stock under theterms of the Bank of America 401(k) Plan. At December 31, 2005 and 2004, an aggregate of 106 million shares and113 million shares of the Corporation’s common stock were held by the 401(k) Plans. During 2004, the Corporationconverted the ESOP Preferred Stock held by the Bank of America 401(k) Plan to common stock so that there were nooutstanding shares of preferred stock at December 31, 2004 in the 401(k) Plans.
Under the terms of the ESOP Preferred Stock provision, payments to the plan for dividends on the ESOP PreferredStock were $4 million for 2004 and 2003. Payments to the plan for dividends on the ESOP Common Stock were $207million, $181 million and $128 million during the same years.
In addition, certain non-U.S. employees within the Corporation are covered under defined contribution pensionplans that are separately administered in accordance with local laws.
Rewarding Success Plan
In 2005, the Corporation introduced a broad-based cash incentive plan for more than 140,000 associates that meetcertain eligibility criteria and are below certain compensation levels. The amount of the cash award is determined basedon the Corporation’s operating net income and common stock price performance for the full year. During 2005, theCorporation recorded an expense of $145 million for this plan.
143
BANK OF AMERICA CORPORATION AND SUBSIDIARIES
Notes to Consolidated Financial Statements—(Continued)
Note 17—Stock-based Compensation Plans
At December 31, 2005, the Corporation had certain stock-based compensation plans that are described below. For allstock-based compensation awards issued prior to January 1, 2003, the Corporation applied the provisions of APB 25 inaccounting for its stock option and award plans. Stock-based compensation plans enacted after December 31, 2002, areaccounted for under the provisions of SFAS 123. For additional information on the accounting for stock-basedcompensation plans and pro forma disclosures, see Note 1 of the Consolidated Financial Statements.
The following table presents information on equity compensation plans at December 31, 2005:
Number of Sharesto be Issued Upon
Exerciseof Outstanding
Options(1,4)
Weighted AverageExercise Price of
OutstandingOptions(2)
Number of Shares Remainingfor Future Issuance Under
(1) Includes 10,655,618 unvested restricted stock units.(2) Does not take into account unvested restricted stock units.(3) Excludes shares to be issued upon exercise of outstanding options.(4) In addition to the securities presented in the table above, there were outstanding options to purchase 57,290,213 shares of the
Corporation’s common stock and 1,275,565 unvested restricted stock units granted to employees of predecessor companies assumedin mergers. The weighted average option price of the assumed options was $33.69 at December 31, 2005.
The Corporation has certain stock-based compensation plans that were approved by its shareholders. These plansare the Key Employee Stock Plan and the Key Associate Stock Plan. Descriptions of the material features of these plansfollow.
Key Employee Stock Plan
The Key Employee Stock Plan, as amended and restated, provided for different types of awards. These include stockoptions, restricted stock shares and restricted stock units. Under the plan, ten-year options to purchase approximately260 million shares of common stock were granted through December 31, 2002, to certain employees at the closing marketprice on the respective grant dates. Options granted under the plan generally vest in three or four equal annualinstallments. At December 31, 2005, approximately 90 million options were outstanding under this plan. No furtherawards may be granted.
Key Associate Stock Plan
On April 24, 2002, the shareholders approved the Key Associate Stock Plan to be effective January 1, 2003. Thisapproval authorized and reserved 200 million shares for grant in addition to the remaining amount under the KeyEmployee Stock Plan as of December 31, 2002, which was approximately 34 million shares plus any shares covered byawards under the Key Employee Stock Plan that terminate, expire, lapse or are cancelled after December 31, 2002. Uponthe FleetBoston Merger, the shareholders authorized an additional 102 million shares for grant under the Key AssociateStock Plan. At December 31, 2005, approximately 130 million options were outstanding under this plan. Approximately18 million shares of restricted stock and restricted stock units were granted during 2005. These shares of restricted stockgenerally vest in three equal annual installments beginning one year from the grant date. The Corporation incurredrestricted stock expense of $486 million, $288 million and $276 million in 2005, 2004 and 2003.
144
BANK OF AMERICA CORPORATION AND SUBSIDIARIES
Notes to Consolidated Financial Statements—(Continued)
The Corporation has certain stock-based compensation plans that were not approved by its shareholders. Thesebroad-based plans are the 2002 Associates Stock Option Plan and Take Ownership!. Descriptions of the materialfeatures of these plans follow.
2002 Associates Stock Option Plan
The Bank of America Corporation 2002 Associates Stock Option Plan covered all employees below a specifiedexecutive grade level. Under the plan, eligible employees received a one-time award of a predetermined number ofoptions entitling them to purchase shares of the Corporation’s common stock. All options are nonqualified and have anexercise price equal to the fair market value on the date of grant. Approximately 108 million options were granted onFebruary 1, 2002. The award included two performance-based vesting triggers. During 2003, the first option vestingtrigger was achieved. During 2004, the second option vesting trigger was achieved. In addition, the options continue tobe exercisable following termination of employment under certain circumstances. At December 31, 2005, approximately20 million options were outstanding under this plan. The options expire on January 31, 2007. No further awards may begranted.
Take Ownership!
The Bank of America Global Associate Stock Option Program (Take Ownership!) covered all employees below aspecified executive grade level. Under the plan, eligible employees received an award of a predetermined number of stockoptions entitling them to purchase shares of the Corporation’s common stock at the fair market value on the grant date.Options were granted on the first business day of 1999, 2000 and 2001. All options are nonqualified. At January 2, 2004,all options issued under this plan were fully vested. These options expire five years after the grant date. In addition, theoptions continue to be exercisable following termination of employment under certain circumstances. At December 31,2005, approximately 134 thousand options were outstanding under this plan. No further awards may be granted. Allremaining options expired January 2, 2006.
Additional stock option plans assumed in connection with various acquisitions remain outstanding and are includedin the following tables. No further awards may be granted under these plans. The following tables present the status ofall plans at December 31, 2005, 2004 and 2003, and changes during the years then ended:
(1) Does not reflect the deferred tax effects of Unrealized Gains and Losses on AFS Debt and Marketable Equity Securities, ForeignCurrency Translation Adjustments and Derivatives that are included in Accumulated OCI. As a result of these tax effects,Accumulated OCI increased $2,863 million, $303 million and $1,916 million in 2005, 2004 and 2003. Also, does not reflect taxbenefits associated with the Corporation’s employee stock plans which increased Common Stock and Additional Paid-in Capital$416 million, $401 million and $443 million in 2005, 2004 and 2003. Goodwill was reduced $22 million and $101 million in 2005 and2004, reflecting the tax benefits attributable to exercises of employee stock options issued by FleetBoston which had vested prior tothe merger date.
Income Tax Expense for 2005, 2004 and 2003 varied from the amount computed by applying the statutory incometax rate to Income before Income Taxes. A reconciliation between the expected federal income tax expense using thefederal statutory tax rate of 35 percent to the Corporation’s actual Income Tax Expense and resulting effective tax ratefor 2005, 2004 and 2003 follows:
20052004
(Restated)2003
(Restated)(Dollars in millions) Amount Percent Amount Percent Amount Percent
Notes to Consolidated Financial Statements—(Continued)
During 2002, the Corporation reached a tax settlement agreement with the IRS. This agreement resolved issues fornumerous tax returns of the Corporation and various predecessor companies and finalized all federal income taxliabilities, excluding those relating to FleetBoston, through 1999. As a result of the settlement, a reduction in IncomeTax Expense of $84 million in 2003 was recorded representing refunds received.
The IRS is currently examining the Corporation’s federal income tax returns for the years 2000 through 2002 as wellas the tax returns of FleetBoston and certain other subsidiaries for years ranging from 1997 to 2000. The Corporation’scurrent estimate of the resolution of these various examinations is reflected in accrued income taxes; however, finalsettlement of the examinations or changes in the Corporation’s estimate may result in future income tax expense orbenefit.
Significant components of the Corporation’s net deferred tax liability at December 31, 2005 and 2004 are presentedin the following table.
(1) At December 31, 2004, $70 million of the valuation allowance related to gross deferred tax assets was attributable to theFleetBoston Merger. Future recognition of the tax attributes associated with these gross deferred tax assets would result in taxbenefits being allocated to reduce Goodwill.
(2) The Corporation’s net deferred tax liabilities were adjusted during 2005 and 2004 to include $279 million of net deferred taxliabilities and $2.0 billion of net deferred tax assets related to business combinations accounted for under the purchase method.
The valuation allowance at December 31, 2005 and 2004 is attributable to deferred tax assets generated in certainstate and foreign jurisdictions. During 2005, deferred tax assets were recognized for certain state temporary differencesthat had previously not been recognized. The valuation allowance change for 2005 was primarily attributable to thesedeferred tax assets, as management continues to believe it is more likely than not that realization of these assets will notoccur.
The foreign tax credit carryforward reflected in the table above represents foreign income taxes paid that arecreditable against future U.S. income taxes. If not used, these credits begin to expire after 2012 and could fully expireafter 2014.
147
BANK OF AMERICA CORPORATION AND SUBSIDIARIES
Notes to Consolidated Financial Statements—(Continued)
The American Jobs Creation Act of 2004 (the Act) provides U.S. companies with the ability to elect to apply a specialone-time tax deduction equal to 85 percent of certain earnings remitted from foreign subsidiaries, provided certaincriteria are met. Management elected to apply the Act for 2005 and recorded a one-time tax benefit of $70 million for theyear ended December 31, 2005.
At December 31, 2005 and 2004, federal income taxes had not been provided on $1.4 billion and $1.1 billion ofundistributed earnings of foreign subsidiaries, earned prior to 1987 and after 1997 that have been reinvested for anindefinite period of time. If the earnings were distributed, an additional $249 million and $221 million of tax expense,net of credits for foreign taxes paid on such earnings and for the related foreign withholding taxes, would result in 2005and 2004.
Note 19—Fair Value of Financial Instruments
SFAS No. 107, “Disclosures About Fair Value of Financial Instruments” (SFAS 107), requires the disclosure of theestimated fair value of financial instruments. The fair value of a financial instrument is the amount at which theinstrument could be exchanged in a current transaction between willing parties, other than in a forced or liquidationsale. Quoted market prices, if available, are utilized as estimates of the fair values of financial instruments. Since noquoted market prices exist for certain of the Corporation’s financial instruments, the fair values of such instrumentshave been derived based on management’s assumptions, the estimated amount and timing of future cash flows andestimated discount rates. The estimation methods for individual classifications of financial instruments are describedmore fully below. Different assumptions could significantly affect these estimates. Accordingly, the net realizable valuescould be materially different from the estimates presented below. In addition, the estimates are only indicative of thevalue of individual financial instruments and should not be considered an indication of the fair value of the combinedCorporation.
The provisions of SFAS 107 do not require the disclosure of the fair value of lease financing arrangements andnonfinancial instruments, including intangible assets such as goodwill, franchise, and credit card and trustrelationships.
Short-term Financial Instruments
The carrying value of short-term financial instruments, including cash and cash equivalents, time deposits placed,federal funds sold and purchased, resale and repurchase agreements, commercial paper and other short-terminvestments and borrowings, approximates the fair value of these instruments. These financial instruments generallyexpose the Corporation to limited credit risk and have no stated maturities or have short-term maturities and carryinterest rates that approximate market.
Financial Instruments Traded in the Secondary Market
Held-to-maturity securities, AFS debt and marketable equity securities, trading account instruments and long-termdebt traded actively in the secondary market have been valued using quoted market prices. The fair values of tradingaccount instruments and securities are reported in Notes 4 and 6 of the Consolidated Financial Statements.
Derivative Financial Instruments
All derivatives are recognized on the balance sheet at fair value, net of cash collateral held and taking intoconsideration the effects of legally enforceable master netting agreements that allow the Corporation to settle positiveand negative positions with the same counterparty on a net basis. For exchange-traded contracts, fair value is based onquoted market prices. For non-exchange traded contracts, fair value is based on dealer quotes, pricing models or quotedprices for instruments with similar characteristics. The fair value of the Corporation’s derivative assets and liabilities ispresented in Note 5 of the Consolidated Financial Statements.
Loans
Fair values were estimated for groups of similar loans based upon type of loan and maturity. The fair value of loanswas determined by discounting estimated cash flows using interest rates approximating the Corporation’s currentorigination rates for similar loans and adjusted to reflect the inherent credit risk. Where quoted market prices wereavailable, primarily for certain residential mortgage loans and commercial loans, such market prices were utilized asestimates for fair values.
Substantially all of the foreign loans reprice within relatively short timeframes. Accordingly, for foreign loans, thenet carrying values were assumed to approximate their fair values.
148
BANK OF AMERICA CORPORATION AND SUBSIDIARIES
Notes to Consolidated Financial Statements—(Continued)
Deposits
The fair value for deposits with stated maturities was calculated by discounting contractual cash flows using currentmarket rates for instruments with similar maturities. The carrying value of foreign time deposits approximates fairvalue. For deposits with no stated maturities, the carrying amount was considered to approximate fair value and doesnot take into account the significant value of the cost advantage and stability of the Corporation’s long-termrelationships with depositors.
The book and fair values of certain financial instruments at December 31, 2005 and 2004 were as follows:December 31
The Corporation reports the results of its operations through four business segments: Global Consumer and SmallBusiness Banking, Global Business and Financial Services, Global Capital Markets and Investment Banking, and GlobalWealth and Investment Management. Certain operating segments have been aggregated into a single business segment.The Corporation may periodically reclassify business segment results based on modifications to its managementreporting methodologies and changes in organizational alignment.
Global Consumer and Small Business Banking provides a diversified range of products and services to individualsand small businesses through multiple delivery channels. Global Business and Financial Services serves domestic andinternational business clients providing financial services, specialized industry expertise and local delivery through aglobal team of client managers and a variety of businesses. During the third quarter of 2005, our operations in Mexicowere realigned and are now included in the results of Global Business and Financial Services, rather than GlobalCapital Markets and Investment Banking. Global Capital Markets and Investment Banking provides capital-raisingsolutions, advisory services, derivatives capabilities, equity and debt sales and trading for the Corporation’s clients aswell as traditional bank deposit and loan products, treasury management and payment services to large corporationsand institutional clients. Also during the third quarter of 2005, the Corporation announced the future combination ofGlobal Business and Financial Services and Global Capital Markets and Investment Banking that was effective onJanuary 1, 2006. This new segment is called Global Corporate and Investment Banking. Global Wealth and InvestmentManagement offers investment services, estate management, financial planning services, fiduciary management, creditand banking expertise, and diversified asset management products to institutional clients as well as affluent andhigh-net-worth individuals.
All Other consists primarily of Equity Investments, the residual impact of the allowance for credit losses process,Merger and Restructuring Charges, intersegment eliminations, and the results of certain consumer finance andcommercial lending businesses that are being liquidated. All Other also includes certain amounts associated with theALM process, including the impact of funds transfer pricing allocation methodologies, amounts associated with thechange in the value of derivatives used as economic hedges of interest rate and foreign exchange rate fluctuations thatdo not qualify for SFAS 133 hedge accounting treatment, gains or losses on sales of whole mortgage loans, and Gains onSales of Debt Securities.
Total Revenue includes Net Interest Income on a fully taxable-equivalent (FTE) basis and Noninterest Income. Theadjustment of Net Interest Income to a FTE basis results in a corresponding increase in Income Tax Expense. The NetInterest Income of the business segments includes the results of a funds transfer pricing process that matches assets andliabilities with similar interest rate sensitivity and maturity characteristics. Net Interest Income of the businesssegments also includes an allocation of Net Interest Income generated by the Corporation’s ALM process.
Certain expenses not directly attributable to a specific business segment are allocated to the segments based onpre-determined means. The most significant of these expenses include data processing costs, item processing costs andcertain centralized or shared functions. Data processing costs are allocated to the segments based on equipment usage.Item processing costs are allocated to the segments based on the volume of items processed for each segment. The cost ofcertain centralized or shared functions are allocated based on methodologies which reflect utilization.
149
BANK OF AMERICA CORPORATION AND SUBSIDIARIES
Notes to Consolidated Financial Statements—(Continued)
The following table presents Total Revenue on a FTE basis and Net Income in 2005, 2004 and 2003, and TotalAssets at December 31, 2005 and 2004 for each business segment, as well as All Other.
Business SegmentsAt and for the Year Ended December 31
(1) There were no material intersegment revenues among the segments.
150
BANK OF AMERICA CORPORATION AND SUBSIDIARIES
Notes to Consolidated Financial Statements—(Continued)
The following tables present reconciliations of the four business segments’ Total Revenue on a FTE basis and NetIncome to the Consolidated Statement of Income, and Total Assets to the Consolidated Balance Sheet. The adjustmentspresented in the table below include consolidated income and expense amounts not specifically allocated to individualbusiness segments.
Cash held at bank subsidiaries at December 31 . . . . . . . . . . . . . . . . . . . . . . . . . . . . . . . . . . . $ 49,670 $47,138 $20,436
153
BANK OF AMERICA CORPORATION AND SUBSIDIARIES
Notes to Consolidated Financial Statements—(Continued)
Note 22—Performance by Geographical Area
Since the Corporation’s operations are highly integrated, certain asset, liability, income and expense amounts mustbe allocated to arrive at Total Assets, Total Revenue, Income (Loss) Before Income Taxes and Net Income (Loss) bygeographic area. The Corporation identifies its geographic performance based upon the business unit structure used tomanage the capital or expense deployed in the region as applicable. This requires certain judgments related to theallocation of revenue so that revenue can be appropriately matched with the related expense or capital deployed in theregion.
(1) Total Assets includes long-lived assets, which are primarily located in the U.S.(2) There were no material intercompany revenues between geographic regions for any of the periods presented.(3) Includes the Corporation’s Canadian operations, which had Total Assets of $4,052 million and $4,849 million at December 31, 2005
and 2004; Total Revenue of $113 million, $88 million, and $96 million; Income before Income Taxes of $66 million, $49 million, and$60 million; and Net Income of $56 million, $41 million, and $12 million for the years ended December 31, 2005, 2004 and 2003.
154
BANK OF AMERICA CORPORATION AND SUBSIDIARIES
Notes to Consolidated Financial Statements—(Continued)
Note 23—Restatement of Quarterly Financial Statements (unaudited)
Consolidated Statement of Income
The following tables set forth the effects of the restatement for the quarters in 2005 and 2004.2005 Quarters
Fourth Third Second First
(Dollars in millions, except pershare information)
As PreviouslyReported(1) Restated
As PreviouslyReported Restated
As PreviouslyReported Restated
As PreviouslyReported Restated
Interest incomeInterest and fees on loans and leases . . . $ 9,559 $ 9,536 $ 8,956 $ 8,933 $ 8,312 $ 8,294 $ 8,107 $ 8,080Interest and dividends on securities . . . . 2,819 2,815 2,797 2,793 2,799 2,796 2,534 2,533Federal funds sold and securities
(1) The Corporation provided unaudited financial information relating to the fourth quarter of 2005 in its current report on Form 8-K filed on January 23,2006.
155
BANK OF AMERICA CORPORATION AND SUBSIDIARIES
Notes to Consolidated Financial Statements—(Continued)
Consolidated Statement of Income2004 Quarters
Fourth Third Second First
(Dollars in millions, except pershare information)
As PreviouslyReported Restated
As PreviouslyReported Restated
As PreviouslyReported Restated
As PreviouslyReported Restated
Interest incomeInterest and fees on loans and leases . . . $ 7,919 $ 7,877 $ 7,508 $ 7,499 $ 7,237 $ 7,183 $ 5,549 $ 5,492Interest and dividends on securities . . . . 2,065 2,063 2,078 2,076 1,907 1,907 1,212 1,210Federal funds sold and securities
(1) The Corporation provided unaudited financial information relating to the fourth quarter of 2005 in its current report on Form 8-Kfiled on January 23, 2006.
(2) Authorized—7,500,000,000 shares for the Fourth, Third, Second and First Quarters(3) Issued and outstanding—3,999,688,491 shares, 4,013,063,444 shares, 4,016,703,839 shares and 4,035,318,509 shares for the
Fourth, Third, Second and First Quarters
157
BANK OF AMERICA CORPORATION AND SUBSIDIARIES
Notes to Consolidated Financial Statements—(Continued)
(1) Authorized—100,000,000 shares for the Fourth, Third, Second and First Quarters(2) Issued and outstanding—1,090,189 shares, 1,090,189 shares, 2,292,013 shares and 1,239,563 shares for the Fourth, Third, Second
and First Quarters(3) Authorized—7,500,000,000 shares for the Fourth, Third, Second and First Quarters(4) Issued and outstanding—4,046,546,212 shares, 4,049,062,685 shares, 2,031,328,433 shares and 1,445,487,313 shares for the
Fourth, Third, Second and First Quarters
158
BANK OF AMERICA CORPORATION AND SUBSIDIARIES
Notes to Consolidated Financial Statements—(Continued)
Consolidated Statement of Changes in Shareholders’ Equity, As Previously ReportedFor the Three, Six and Nine Months in 2005
(1) At September 30, 2005, June 30, 2005, and March 31, 2005, Accumulated Other Comprehensive Income (Loss) includes NetUnrealized Gains (Losses) on AFS Debt and Marketable Equity Securities of $(1,908) million, $387 million and $(1,738) million,respectively; Net Unrealized Losses on Foreign Currency Translation Adjustments of $(129) million, $(125) million and $(160)million, respectively; Net Unrealized Gains (Losses) on Derivatives of $(4,338) million, $(5,120) million, and $(3,527) million,respectively; and Other of $(134) million, $(134) million and $(134) million, respectively.
159
BANK OF AMERICA CORPORATION AND SUBSIDIARIES
Notes to Consolidated Financial Statements—(Continued)
Consolidated Statement of Changes in Shareholders’ Equity, As RestatedFor the Three, Six and Nine Months in 2005
PreferredStock
Common Stockand AdditionalPaid-in Capital Retained
Earnings
AccumulatedOther
ComprehensiveIncome (Loss)(1) Other
TotalShare-
holders’Equity
ComprehensiveIncome(Dollars in millions, shares in thousands) Shares Amount
(1) At September 30, 2005, June 30, 2005, and March 31, 2005, Accumulated Other Comprehensive Income (Loss) includes NetUnrealized Gains (Losses) on AFS Debt and Marketable Equity Securities of $(1,908) million, $387 million and $(1,738) million,respectively; Net Unrealized Losses on Foreign Currency Translation Adjustments of $(129) million, $(125) million and $(160)million, respectively; Net Unrealized Gains (Losses) on Derivatives of $(4,409) million, $(5,152) million, and $(3,585) million,respectively; and Other of $(134) million, $(134) million and $(134) million, respectively.
160
BANK OF AMERICA CORPORATION AND SUBSIDIARIES
Notes to Consolidated Financial Statements—(Continued)
Consolidated Statement of Changes in Shareholders’ Equity, As Previously ReportedFor the Three, Six and Nine Months in 2004
(Dollars in millions, shares in thousands)Preferred
(1) At September 30, 2004, June 30, 2004, and March 31, 2004, Accumulated Other Comprehensive Income (Loss) includes NetUnrealized Gains (Losses) on AFS Debt and Marketable Equity Securities of $(460) million, $(2,095) million and $591 million,respectively; Net Unrealized Losses on Foreign Currency Translation Adjustments of $(175) million, $(184) million and $(163)million, respectively; Net Unrealized Gains (Losses) on Derivatives of $(1,930) million, $(1,479) million, and $(3,067) million,respectively; and Other of $(104) million, $(104) million and $(104) million, respectively.
161
BANK OF AMERICA CORPORATION AND SUBSIDIARIES
Notes to Consolidated Financial Statements—(Continued)
Consolidated Statement of Changes in Shareholders’ Equity, As RestatedFor the Three, Six and Nine Months in 2004
(Dollars in millions, shares in thousands)Preferred
(1) At September 30, 2004, June 30, 2004, and March 31, 2004, Accumulated Other Comprehensive Income (Loss) includes NetUnrealized Gains (Losses) on AFS Debt and Marketable Equity Securities of $(460) million, $(2,095) million and $591 million,respectively; Net Unrealized Losses on Foreign Currency Translation Adjustments of $(175) million, $(184) million and $(163)million, respectively; Net Unrealized Gains (Losses) on Derivatives of $(2,067) million, $(1,759) million, and $(2,906) million,respectively; and Other of $(104) million, $(104) million and $(104) million, respectively.
162
BANK OF AMERICA CORPORATION AND SUBSIDIARIES
Notes to Consolidated Financial Statements—(Continued)
Consolidated Statement of Cash Flows
Three Months Ended March 312005 2004
(Dollars in millions)As Previously
Reported RestatedAs Previously
Reported Restated
Operating activitiesNet income . . . . . . . . . . . . . . . . . . . . . . . . . . . . . . . . . . . . . . . . . . . . . . . . . $ 4,695 $ 4,393 $ 2,681 $ 2,648Reconciliation of net income to net cash provided by (used in)
Cash and cash equivalents at September 30 . . . $ 32,771 $ 32,771 $ 29,252 $ 29,252
165
Item 9. CHANGES IN AND DISAGREEMENTS WITH ACCOUNTANTS ON ACCOUNTING AND FINANCIALDISCLOSURE
There were no changes in or disagreements with accountants on accounting and financial disclosure.
Item 9A. CONTROLS AND PROCEDURES
(a) Restatement
As a result of a recent interpretation on the “short cut” method of accounting for derivatives as hedges under ofSFAS 133, the Corporation undertook additional review and testing related to the remediation of a significant deficiencyoutstanding at December 31, 2004 which had been previously reported to the Audit Committee. As a result of thatreview and testing, management identified additional deficiencies in the Corporation’s processes and procedures relatedto the accounting treatment of derivative transactions used as hedges against changes in interest rates and foreigncurrency values.
After initial discussions with the Audit Committee Chair, the Audit Committee held a meeting on February 15, 2006to review with management the potential impact of these matters. After completing further analysis, managementrecommended to the Audit Committee, at a follow-up meeting held on February 21, 2006, that previously reportedfinancial results be restated to eliminate hedge accounting for certain transactions. The Audit Committee agreed withmanagement’s recommendation. In light of the restatement, the previously reported financial statements for the fullyear 2002 as well as the quarterly and annual periods in 2003, 2004, and 2005 should no longer be relied upon.
(b) Evaluation of Disclosure Controls and Procedures
In connection with the restatement, under the direction of our Chief Executive Officer and Chief Financial Officer,we reevaluated our disclosure controls and procedures. As a result we determined that a deficiency in processes andprocedures over financial reporting of derivatives and hedging originally classified as a significant deficiency atDecember 31, 2004 should have been classified as a material weakness at December 31, 2004. Solely as a result of thismaterial weakness, we concluded that our disclosure controls and procedures were not effective as of March 31, 2005,June 30, 2005, and September 30, 2005.
(c) Remediation of Material Weakness in Internal Control
We believe that we have fully remediated the material weakness in our internal control over financial reportingwith respect to accounting for derivative transactions used as hedges as of December 31, 2005. The remedial actionsincluded:
• implementing additional management and oversight controls to review and approve hedging strategies and relateddocumentation to ensure hedge accounting is appropriately applied with respect to SFAS 133;
• discontinuing practices and processes where sustainable controls did not exist and automating other criticalfunctions within the process; and
• retesting our internal financial controls with respect to the deficiencies related to the material weakness to ensurethey are operating effectively to ensure compliance with SFAS 133.
In connection with this report, under the direction of our Chief Executive Officer and Chief Financial Officer, wehave evaluated our disclosure controls and procedures currently in effect, including the remedial actions discussedabove, and we have concluded that, as of December 31, 2005, our disclosure controls and procedures are effective.
See Report of Management on page 87 for management’s report on the Corporation’s internal control over financialreporting which is incorporated herein by reference.
Except for the remediation of the material weakness discussed above, there was no change in our internal controlover financial reporting during the quarter ended December 31, 2005, that materially affected, or is reasonably likely tomaterially affect, our internal control over financial reporting.
Item 9B. OTHER INFORMATION
None
166
PART IIIItem 10. DIRECTORS AND EXECUTIVE OFFICERS OF THE REGISTRANT
Information included under the following captions in the Corporation’s proxy statement relating to its 2006 annualmeeting of stockholders (the “2006 Proxy Statement”) is incorporated herein by reference:
• “The Nominees”;• “Section 16(a) Beneficial Ownership Reporting Compliance”;• “Agreements with Certain Executive Officers”; and• “Corporate Governance.”
Additional information required by Item 10 with respect to executive officers is set forth in Part I, Item 4A hereof.Information regarding the Corporation’s directors is set forth in the Proxy Statement on pages 11 through 14 under “TheNominees.”
The most recent certifications by the Corporation’s Chief Executive Officer and Chief Financial Officer pursuant toSection 302 of the Sarbanes-Oxley Act of 2002 are filed as Exhibits 31(a) and 31(b) to this report. The Corporation alsohas submitted to the New York Stock Exchange (the “NYSE”) its most recent annual certification by its Chief ExecutiveOfficer confirming that the Corporation has complied with the NYSE corporate governance standards, as required bySection 303A.12(a) of the NYSE-Listed Company Manual.
Item 11. EXECUTIVE COMPENSATION
Information included under the following captions in the 2006 Proxy Statement is incorporated herein by reference:
• “Director Compensation”;• “Executive Compensation”;• “Retirement Plans for Executive Officers”;• “Agreements with Certain Executive Officers”;• “Compensation Committee Interlocks and Insider Participation”; and• “Certain Transactions.”
Item 12. SECURITY OWNERSHIP OF CERTAIN BENEFICIAL OWNERS AND MANAGEMENT ANDRELATED STOCKHOLDER MATTERS
Information included under the following caption in the 2006 Proxy Statement is incorporated herein by reference:
• “Stock Ownership.”
See also Note 17 of the Consolidated Financial Statements for information on the Corporation’s equity compensationplans.
Item 13. CERTAIN RELATIONSHIPS AND RELATED TRANSACTIONS
Information included under the following captions in the 2006 Proxy Statement is incorporated herein by reference:
• “Compensation Committee Interlocks and Insider Participation”; and• “Certain Transactions.”
Item 14. PRINCIPAL ACCOUNTANT FEES AND SERVICES
Information included under the following captions in the 2006 Proxy Statement is incorporated herein by reference:
• “Ratification of Independent Public Accountants.”
167
PART IV
Item 15. EXHIBITS, FINANCIAL STATEMENT SCHEDULES
The following documents are filed as part of this report:(1) Financial Statements:
Report of Independent Registered Public Accounting Firm
Consolidated Statement of Income for the years ended December 31, 2005, 2004 and 2003
Consolidated Balance Sheet at December 31, 2005 and 2004
Consolidated Statement of Changes in Shareholders’ Equity for the years ended December 31, 2005,2004 and 2003
Consolidated Statement of Cash Flows for the years ended December 31, 2005, 2004 and 2003
Notes to Consolidated Financial Statements
(2) Schedules:
None
(3) The exhibits filed as part of this report and exhibits incorporated herein by reference to other documentsare listed in the Index to Exhibits to this Annual Report on Form 10-K (pages E-1 through E-7, includingexecutive compensation plans and arrangements which are identified separately by asterisk).
With the exception of the information expressly incorporated herein by reference, the 2006 Proxy Statement is not tobe deemed filed as part of this Annual Report on Form 10-K.
168
SIGNATURESPursuant to the requirements of Section 13 of the Securities Exchange Act of 1934, the registrant has duly caused
this report to be signed on its behalf by the undersigned, thereunto duly authorized.
Date: March 16, 2006
BANK OF AMERICA CORPORATION
By: */s/ KENNETH D. LEWIS
Kenneth D. LewisChairman, Chief Executive Officer and President
Pursuant to the requirements of the Securities Exchange Act of 1934, this report has been signed below by thefollowing persons on behalf of the registrant and in the capacities and on the dates indicated.
Signature Title Date
*/s/ KENNETH D. LEWIS
Kenneth D. Lewis
Chairman, Chief Executive Officer andPresident and Director (PrincipalExecutive Officer)
Senior Vice President and ChiefAccounting Officer (Principal AccountingOfficer)
March 16, 2006
*/s/ WILLIAM BARNET, IIIWilliam Barnet, III
Director March 16, 2006
*/s/ FRANK P. BRAMBLE, SR.Frank P. Bramble, Sr.
Director March 16, 2006
*/s/ CHARLES W. COKER
Charles W. Coker
Director March 16, 2006
*/s/ JOHN T. COLLINS
John T. Collins
Director March 16, 2006
*/s/ GARY L. COUNTRYMAN
Gary L. Countryman
Director March 16, 2006
*/s/ TOMMY R. FRANKS
Tommy R. Franks
Director March 16, 2006
*/s/ PAUL FULTON
Paul Fulton
Director March 16, 2006
*/s/ CHARLES K. GIFFORD
Charles K. Gifford
Director March 16, 2006
*/s/ W. STEVEN JONES
W. Steven Jones
Director March 16, 2006
*/s/ WALTER E. MASSEY
Walter E. Massey
Director March 16, 2006
169
Signature Title Date
*/s/ THOMAS J. MAY
Thomas J. May
Director March 16, 2006
*/s/ PATRICIA E. MITCHELL
Patricia E. Mitchell
Director March 16, 2006
*/s/ EDWARD L. ROMERO
Edward L. Romero
Director March 16, 2006
*/s/ THOMAS M. RYAN
Thomas M. Ryan
Director March 16, 2006
*/s/ O. TEMPLE SLOAN, JR.O. Temple Sloan, Jr.
Director March 16, 2006
*/s/ MEREDITH R. SPANGLER
Meredith R. Spangler
Director March 16, 2006
*/s/ JACKIE M. WARD
Jackie M. Ward
Director March 16, 2006
*By: /s/ WILLIAM J. MOSTYN IIIWilliam J. Mostyn III
Attorney-in-Fact
170
INDEX TO EXHIBITS
Exhibit No. Description
2 Agreement and Plan of Merger dated as of June 30, 2005, between the registrant and MBNA Corporation,incorporated by reference to Exhibit 2.1 of registrant’s Current Report on Form 8-K filed July 6, 2005.
3(a) Amended and Restated Certificate of Incorporation of registrant, as in effect on the date hereof, incorporated byreference to Exhibit 99.1 of registrant’s Current Report on Form 8-K filed May 7, 1999.
(b) Certificate of Amendment of Amended and Restated Certificate of Incorporation of registrant, as in effect on the datehereof, incorporated by reference to Exhibit 3.1 of registrant’s Current Report on Form 8-K filed March 30, 2004.
(c) Amended and Restated Bylaws of registrant, as in effect on the date hereof, incorporated by reference to Exhibit 3.1 ofregistrant’s Current Report on Form 8-K filed December 14, 2005.
4(a) Specimen certificate of registrant’s Common Stock, incorporated by reference to Exhibit 4.13 of registrant’sRegistration No. 333-83503.
(b) Specimen certificate of registrant’s 7% Cumulative Redeemable Preferred Stock, Series B, incorporated by referenceto Exhibit 4(c) of registrant’s 1998 Annual Report on Form 10-K (the “1998 10-K”).
(c) Amended Certificate of Designation of registrant’s 6.75 % Perpetual Preferred Stock, incorporated by reference toExhibit 4.1 of registrant’s Current Report on Form 8-K filed March 30, 2004.
(d) Amended Certificate of Designation of registrant’s Fixed/Adjustable Rate Cumulative Preferred Stock, incorporatedby reference to Exhibit 4.2 of registrant’s Current Report on Form 8-K filed March 30, 2004.
(e) Deposit Agreement relating to registrant’s Series VI 6.75% Perpetual Preferred Stock of Fleet Financial Group, Inc.,dated as of February 21, 1996, by and among Fleet Financial Group, Inc., Fleet National Bank, as depositary, and theholders from time to time of the Depositary Shares, incorporated by reference to Exhibit 4.3 of registrant’s CurrentReport on Form 8-K filed March 30, 2004.
(f) Amendment to the Deposit Agreement relating to registrant’s Series VI 6.75% Perpetual Preferred Stock of FleetFinancial Group, Inc. and dated as of February 21, 1996, effective as of April 1, 2004, by and between Bank ofAmerica Corporation and EquiServe, Inc., incorporated by reference to Exhibit 4.4 of registrant’s Current Report onForm 8-K filed March 30, 2004.
(g) Deposit Agreement relating to registrant’s Series VII Fixed/Adjustable Rate Cumulative Preferred Stock of FleetFinancial Group, Inc., dated as of April 1, 1996, by and among Fleet Financial Group, Inc., Fleet National Bank, asdepositary, and the holders from time to time of the Depositary Shares, incorporated by reference to Exhibit 4.5 ofregistrant’s Current Report on Form 8-K filed March 30, 2004.
(h) Amendment to the Deposit Agreement relating to registrant’s Series VII Fixed/Adjustable Rate Cumulative PreferredStock of Fleet Financial Group, Inc. and dated as of February 21, 1996, effective as of April 1, 2004, by and betweenBank of America Corporation and EquiServe, Inc., incorporated by reference to Exhibit 4.6 of registrant’s CurrentReport on Form 8-K filed March 30, 2004.
(i) Indenture dated as of September 1, 1989 between registrant (successor to NationsBank Corporation, formerly knownas NCNB Corporation) and The Bank of New York, pursuant to which registrant issued its 9 3⁄8% Subordinated Notes,due 2009; and its 10.20% Subordinated Notes, due 2015, incorporated by reference to Exhibit 4.1 of registrant’sRegistration No. 33-30717; and First Supplemental Indenture thereto dated as of August 28, 1998, incorporated byreference to Exhibit 4(f) of the 1998 10-K.
(j) Indenture dated as of January 1, 1995 between registrant (successor to NationsBank Corporation) and U.S. BankTrust National Association (successor to BankAmerica National Trust Company), pursuant to which registrant issuedits 5 7⁄8% Senior Notes, due 2009; its 7 1⁄8% Senior Notes, due 2006; its 4 3⁄4% Senior Notes, due 2006; its 5 1⁄4% SeniorNotes, due 2007; its 6 1⁄4% Senior Notes, due 2012; its 4 7⁄8% Senior Notes due 2012; its 5 1⁄8% Senior Notes, due 2014;its 3.761% Senior Notes, due 2007; its 3 7⁄8% Senior Notes, due 2008; its 4 7⁄8% Senior Notes, due 2013; its 3 5⁄8% SeniorNotes, due 2008; its 3 1⁄4% Senior Notes, due 2008; its 4¼% Senior Notes, due 2010; its 4 3⁄8% Senior Notes, due 2010;its 3 3⁄8% Senior Notes, due 2009; its 4 5⁄8% Senior Notes, due 2014; its 5 3⁄8% Senior Notes, due June 2014; its 4¼%Senior Notes, due October 2010; its 4% Senior Notes, due 2015; its Floating Rate Callable Senior Notes, due 2008; itsFloating Rate Callable Senior Notes, due 2010; its 4 3⁄4% Senior Notes, due 2015; its 4 1⁄2% Senior Notes, due 2010; itsFloating Rate Callable Senior Notes, due August 2008; its Three-Month LIBOR Floating Rate Senior Notes, dueNovember 2008; its One-Month LIBOR Floating Rate Senior Notes, due November 2008; and its Senior Medium-TermNotes, Series E, F, G, H, I, J and K, incorporated by reference to Exhibit 4.1 of registrant’s Registration No. 33-57533;First Supplemental Indenture thereto dated as of September 18, 1998, incorporated by reference to Exhibit 4.3 ofregistrant’s Current Report on Form 8-K filed November 18, 1998; and Second Supplemental Indenture thereto datedas of May 7, 2001 between registrant, U.S. Bank Trust National Association, as Prior Trustee, and the Bank of NewYork, as Successor Trustee, incorporated by reference to Exhibit 4.4 of registrant’s Current Report on Form 8-K datedJune 5, 2001.
(k) Indenture dated as of January 1, 1995 between registrant (successor to NationsBank Corporation) and The Bank ofNew York, pursuant to which registrant issued its 7 3⁄4% Subordinated Notes, due 2015; its 7 1⁄4% Subordinated Notes,due 2025; its 6 1⁄2% Subordinated Notes, due 2006; its 7 1⁄2% Subordinated Notes, due 2006; its 7.80% SubordinatedNotes, due 2016; its 6 3⁄8% Subordinated Notes, due 2008; its 6.80% Subordinated Notes, due 2028; its 6.60%Subordinated Notes, due 2010; its 7.80% Subordinated Notes due 2010; its 7.40% Subordinated Notes, due 2011; its4 3⁄4% Subordinated Notes, due 2013; its 5 1⁄4% Subordinated Notes, due 2015; its 4 3⁄4% Fixed/Floating Rate Callable
E-1
Exhibit No. Description
Subordinated Notes, due 2019 and its Subordinated Medium-Term Notes, Series F incorporated by reference toExhibit 4.8 of registrant’s Registration No. 33-57533; and First Supplemental Indenture thereto dated as of August28, 1998, incorporated by reference to Exhibit 4.8 of registrant’s Current Report on Form 8-K filed November 18,1998.
(l) Amended and Restated Program Agreement dated as of August 4, 2005 among registrant, Banc of America SecuritiesLimited and others.
(m) Amended and Restated Issuing Paying Agency Agreement dated as of January 15, 2004 between Bank of America,N.A., as Issuer, and Deutsche Bank Trust Company Americas, as Issuing and Paying Agent, incorporated byreference to Exhibit 4(n) for the fiscal year ended December 31, 2004.
(n) Indenture dated as of November 27, 1996 between registrant (successor to NationsBank Corporation) and The Bankof New York, incorporated by reference to Exhibit 4.10 of registrant’s Registration No. 333-15375.
(o) Second Supplemental Indenture dated as of December 17, 1996 to the Indenture dated as of November 27, 1996between registrant (successor to NationsBank Corporation) and The Bank of New York pursuant to which registrantissued its 7.83% Junior Subordinated Deferrable Interest Notes due 2026, incorporated by reference to Exhibit 4.3 ofregistrant’s Current Report on Form 8-K dated December 10, 1996.
(p) Third Supplemental Indenture dated as of February 3, 1997 to the Indenture dated as of November 27, 1996 betweenregistrant (successor to NationsBank Corporation) and The Bank of New York pursuant to which registrant issued itsFloating Rate Junior Subordinated Deferrable Interest Notes due 2027, incorporated by reference to Exhibit 4.3 ofregistrant’s Current Report on Form 8-K dated January 22, 1997.
(q) Fourth Supplemental Indenture dated as of April 22, 1997 to the Indenture dated as of November 27, 1996 betweenregistrant (successor to NationsBank Corporation) and The Bank of New York pursuant to which registrant issued its8 1⁄4% Junior Subordinated Deferrable Interest Notes, due 2027, incorporated by reference to Exhibit 4.3 ofregistrant’s Current Report on Form 8-K dated April 15, 1997.
(r) Fifth Supplemental Indenture dated as of August 28, 1998 to the Indenture dated as of November 27, 1996 betweenregistrant and The Bank of New York, incorporated by reference to Exhibit 4(t) of the 1998 10-K.
(s) Indenture dated as of November 27, 1996, between Barnett Banks, Inc. and Bank One (successor to The First NationalBank of Chicago), as Trustee, and First Supplemental Indenture dated as of January 9, 1998, among NationsBankCorporation, NB Holdings Corporation, Barnett Banks, Inc. and The First National Bank of Chicago (predecessor toBank One), as Trustee, pursuant to which registrant (as successor to NationsBank Corporation) issued its 8.06% JuniorSubordinated Debentures, due 2026, incorporated by reference to Exhibit 4(u) of registrant’s 1997 Annual Report onForm 10-K (the “1997 10-K”).
(t) Indenture dated as of November 1, 1991 between the former BankAmerica Corporation and J.P. Morgan TrustCompany, National Association, as successor trustee to the former Manufacturers Hanover Trust Company ofCalifornia, pursuant to which registrant (as successor to the former BankAmerica Corporation) issued its 7.20%Subordinated Notes due 2006; its 6.20% Subordinated Notes due 2006; its 7 1⁄8% Subordinated Notes due 2006; its6 5⁄8% Subordinated Notes due 2007; its 6 5⁄8% Subordinated Notes due August 2007; its 7 1⁄8% Subordinated Notes due2009; its 7 1⁄8% Subordinated Notes due 2011; its 6 5⁄8% Subordinated Notes, due October, 2007; and its 6 1⁄4%Subordinated Notes due 2008; First Supplemental Indenture thereto dated as of September 8, 1992; and SecondSupplemental Indenture thereto dated as of September 15, 1998, incorporated by reference to Exhibit 4(w) of the 199810-K.
(u) Junior Subordinated Indenture dated as of November 27, 1996 between the former BankAmerica Corporation andDeutsche Bank Trust Company Americas, as successor trustee to Bankers Trust Company, pursuant to whichregistrant (as successor to the former BankAmerica Corporation) issued its 8.07% Junior Subordinated DebenturesSeries A due 2026; and its 7.70% Junior Subordinated Debentures Series B due 2026; and First SupplementalIndenture thereto dated as of September 15, 1998, incorporated by reference to Exhibit 4(z) of the 1998 10-K.
(v) Junior Subordinated Indenture dated as of December 20, 1996 between the former BankAmerica Corporation andDeutsche Bank Trust Company Americas, as successor trustee to Bankers Trust Company, pursuant to whichregistrant (as successor to the former BankAmerica Corporation) issued its 8.00% Junior Subordinated DeferrableInterest Debentures, Series 2 due 2026 and its Floating Rate Junior Subordinated Deferrable Interest Debentures,Series 3 due 2027; and First Supplemental Indenture thereto dated as of September 15, 1998, incorporated byreference to Exhibit 4(aa) of the 1998 10-K.
(w) Restated Senior Indenture dated as of January 1, 2001 between registrant and The Bank of New York, pursuant towhich registrant issued its Senior InterNotesSM, incorporated by reference to Exhibit 4.1 of registrant’s RegistrationNo. 333-47222.
(x) Restated Subordinated Indenture dated as of January 1, 2001 between registrant and The Bank of New York,pursuant to which registrant issued its Subordinated InterNotesSM, incorporated by reference to Exhibit 4.2 ofregistrant’s Registration No. 333-47222.
(y) Amended and Restated Senior Indenture dated as of July 1, 2001 between registrant and The Bank of New York,pursuant to which registrant issued its Senior InterNotesSM, incorporated by reference to Exhibit 4.1 of registrant’sRegistration No. 333-65750.
(z) Amended and Restated Subordinated Indenture dated as of July 1, 2001 between registrant and The Bank of NewYork, pursuant to which registrant issued its Subordinated InterNotesSM, incorporated by reference to Exhibit 4.2 ofregistrant’s Registration No. 333-65750.
E-2
Exhibit No. Description
(aa) Restated Indenture dated as of November 1, 2001 between registrant and The Bank of New York, incorporated byreference to Exhibit 4.10 of registrant’s Registration No. 333-70984.
(bb) First Supplemental Indenture dated as of December 14, 2001 to the Restated Indenture dated as of November 1, 2001between registrant and The Bank of New York pursuant to which registrant issued its 7% Junior Subordinated Notesdue 2031, incorporated by reference to Exhibit 4.3 of registrant’s Current Report on Form 8-K dated December 6,2001.
(cc) Second Supplemental Indenture dated as of January 31, 2002 to the Restated Indenture dated as of November 1, 2001between registrant and The Bank of New York pursuant to which registrant issued its 7% Junior Subordinated Notesdue 2032, incorporated by reference to Exhibit 4.3 of registrant’s Current Report on Form 8-K dated January 24,2002.
(dd) Third Supplemental Indenture dated as of August 9, 2002 to the Restated Indenture dated as of November 1, 2001between registrant and The Bank of New York pursuant to which registrant issued its 7% Junior Subordinated Notes due2032, incorporated by reference to Exhibit 4.3 of registrant’s Current Report on Form 8-K dated August 2, 2002.
(ee) Fourth Supplemental Indenture dated as of April 30, 2003 between registrant and The Bank of New York pursuant towhich registrant issued its 5 7⁄8% Junior Subordinated Notes due 2033, incorporated by reference to Exhibit 4.3 ofregistrant’s Current Report on Form 8-K dated April 23, 2003.
(ff) Fifth Supplemental Indenture dated as of November 3, 2004 between registrant and The Bank of New York pursuantto which registrant issued its 6% Junior Subordinated Notes due 2034, incorporated by reference to Exhibit 4.3 ofregistrant’s Current Report on Form 8-K dated October 21, 2004.
(gg) Sixth Supplemental Indenture dated as of March 8, 2005 between the registrant and The Bank of New York pursuant towhich registrant issued its 5 5⁄8% Junior Subordinated Notes due 2035, incorporated by reference to Exhibit 4.3 ofregistrant’s Current Report on Form 8-K dated February 24, 2005.
(hh) Seventh Supplemental Indenture dated as of August 9, 2005 between the registrant and The Bank of New York pursuantto which registrant issued its 5 1⁄4% Junior Subordinated Notes due 2035, incorporated by reference to Exhibit 4.3 ofregistrant’s Current Report on Form 8-K dated August 4, 2005.
(ii) Eighth Supplemental Indenture dated as of August 25, 2005 between the registrant and The Bank of New York pursuantto which registrant issued its 6% Junior Subordinated Notes due 2035, incorporated by reference to Exhibit 4.3 ofregistrant’s Current Report on Form 8-K dated August 17, 2005.
(jj) Indenture dated as of November 26, 1996 between registrant (successor to Bank of Boston Corporation) and The Bank ofNew York, as Debenture Trustee, pursuant to which registrant issued its 8.25% Junior Subordinated Deferrable InterestDebentures due 2026, incorporated by reference to Exhibit 4.1 to BankBoston Corporation’s Registration Statement onForm S-4 (File No. 333-19083); First Supplemental Indenture thereto dated as of October 1, 1999 and SecondSupplemental Indenture thereto dated as of March 18, 2004, incorporated by reference to Exhibit 4(hh) of registrant’s2004 Annual Report on Form 10-K dated March 1, 2005 (the “2004 10-K”).
(kk) Indenture dated as of December 10, 1996 between registrant (successor to Bank of Boston Corporation) and The Bankof New York, as Trustee, pursuant to which registrant issued its 7 3⁄4% Junior Subordinated Deferrable InterestDebentures due 2026, incorporated by reference to Exhibit 4.1 to BankBoston Corporation’s Registration Statementon Form S-4 (File No. 333-19111); First Supplemental Indenture thereto dated as of October 1, 1999 and SecondSupplemental Indenture thereto dated as of March 18, 2004, incorporated by reference to Exhibit 4(ii) of the 200410-K.
(ll) Indenture dated as of June 4, 1997 between registrant (successor to BankBoston Corporation) and The Bank of New York,as Trustee, pursuant to which registrant issued its Floating Rate Junior Subordinated Deferrable Interest Debentures due2027, incorporated by reference to Exhibit 4.1 to BankBoston Corporation’s Registration Statement on Form S-3 (File No.333-27229); First Supplemental Indenture thereto dated as of October 1, 1999 and Second Indenture thereto dated as ofMarch 18, 2004, incorporated by reference to Exhibit 4(jj) of the 2004 10-K.
(mm) Indenture dated as of December 11, 1996 between registrant (successor to Fleet Financial Group, Inc.) and The FirstNational Bank of Chicago (predecessor to Bank One), as Trustee, incorporated by reference to Exhibit 4(b) of FleetFinancial Group, Inc.’s Current Report on Form 8-K (File No. 1-6366) dated December 20, 1996; First SupplementalIndenture thereto dated as of December 11, 1996 pursuant to which registrant issued its 7.92% Junior SubordinatedDeferrable Interest Debentures due 2026, incorporated by reference to Exhibit 4(c) of Fleet Financial Group, Inc.’sCurrent Report on Form 8-K (File No. 1-6366) dated December 20, 1996 and Third Supplemental Indenture theretodated as of March 18, 2004, incorporated by reference to Exhibit 4(kk) of the 2004 10-K.
(nn) Indenture dated as of December 18, 1998 between registrant (successor to Fleet Financial Group, Inc.) and The FirstNational Bank of Chicago (predecessor to Bank One), as Trustee, incorporated by reference to Exhibit 4(b) of FleetFinancial Group, Inc.’s Current Report on Form 8-K (File No. 1-6366) dated December 18, 1998; First SupplementalIndenture thereto dated as of December 18, 1998 pursuant to which registrant issued its Floating Rate JuniorSubordinated Deferrable Interest Debentures due 2028, incorporated by reference to Exhibit 4(c) to Fleet FinancialGroup, Inc.’s Current Report on Form 8-K (File No. 1-6366) dated December 18, 1998 and Second SupplementalIndenture thereto dated as of March 18, 2004, incorporated by reference to Exhibit 4(ll) of the 2004 10-K.
E-3
Exhibit No. Description
(oo) Indenture dated as of June 30, 2000 between registrant (successor to FleetBoston Financial Corporation) and TheBank of New York, as Trustee, incorporated by reference to Exhibit 4(b) of FleetBoston Financial Corporation’sCurrent Report on Form 8-K dated (File No. 1-6366) June 30, 2000.
(pp) Second Supplemental Indenture dated as of September 17, 2001 to the Indenture dated as of June 30, 2000 betweenregistrant (successor to FleetBoston Financial Corporation) and The Bank of New York pursuant to which registrantissued its 7.20% Junior Subordinated Deferrable Interest Debentures due 2031, incorporated by reference to Exhibit2.6 to FleetBoston Financial Corporation’s Registration Statement on Form 8-A (File No. 1-6366) filed on September21, 2001.
(qq) Third Supplemental Indenture dated as of March 8, 2002 to the Indenture dated as of June 30, 2000 betweenregistrant (successor to FleetBoston Financial Corporation) and The Bank of New York pursuant to which registrantissued its 7.20% Junior Subordinated Deferrable Interest Debentures due 2032, incorporated by reference to Exhibit2.7 to FleetBoston Financial Corporation’s Registration Statement on Form 8-A (File No. 1-6366) filed on March 8,2002.
(rr) Fourth Supplemental Indenture dated as of July 31, 2003 to the Indenture dated as of June 30, 2000 betweenregistrant (successor to FleetBoston Financial Corporation) and The Bank of New York pursuant to which registrantissued its 6.00% Junior subordinated Deferrable Interest Debentures due 2033, incorporated by reference to Exhibit2.8 to FleetBoston Financial Corporation’s Registration Statement on Form 8-A (File No. 1-6366) filed on July 31,2003.
(ss) Fifth Supplemental Indenture dated as of March 18, 2004 to the Indenture dated as of June 30, 2000 between theregistrant (successor to FleetBoston Financial Corporation) and The Bank of New York, incorporated by reference toExhibit 4(rr) of the 2004 10-K.
(tt) Indenture dated December 6, 1999 between registrant (successor to Fleet Boston Corporation) and the Bank of NewYork, as Trustee, pursuant to which registrant issued its 4 7⁄8% Senior Notes, due 2006; its 3.85% Senior Notes, due2008; and its Senior Medium-Term Notes, Series T, incorporated by reference to Exhibit 4(a) to FleetBoston Financial
Corporation’s Registration Statement on Form S-3 (File No. 333-72912); and First Supplemental Indenture theretodated as of March 18, 2004, incorporated by reference to Exhibit 4.61 of registrant’s Registration Statement on FormS-3/A (File No. 333-112708).
(uu) Indenture dated October 1, 1992 between registrant (successor to Fleet Financial Group, Inc.) and The First NationalBank of Chicago (predecessor to J.P. Morgan Trust Company, N.A.), as Trustee, incorporated by reference to Exhibit4(d) to Fleet Financial Group, Inc.’s Registration Statement on Form S-3/A (File No. 33-50216) pursuant to whichregistrant issued its 7 1⁄8% Subordinated Notes, due 2006; its 6 7⁄8% Subordinated Notes, due 2028; its 6½%Subordinated Notes, due 2008; its 6 3⁄8% Subordinated Notes, due 2008; its 6.70% Subordinated Notes, due 2028; andits 7 3⁄8% Subordinated Notes, due 2009; First Supplemental Indenture thereto dated as of November 30, 1992,incorporated by reference to Exhibit 4 of Fleet Financial Group, Inc.’s Current Report on Form 8-K (File No. 1-06366)filed December 2, 1992; and Second Supplemental Indenture thereto dated as of March 18, 2004, incorporated byreference to Exhibit 4.59 of registrant’s Registration Statement on Form S-3/A (File No. 333-112708).
The registrant has other long-term debt agreements, but these are not material in amount. Copies of these agreements will befurnished to the Commission on request.
10(a) NationsBank Corporation and Designated Subsidiaries Supplemental Executive Retirement Plan, incorporated byreference to Exhibit 10(j) of the 1994 10-K; Amendment thereto dated as of June 28, 1989, incorporated by referenceto Exhibit 10(g) of registrant’s 1989 Annual Report on Form 10-K (the “1989 10-K”); Amendment thereto dated as ofJune 27, 1990, incorporated by reference to Exhibit 10(g) of registrant’s 1990 Annual Report on Form 10-K (the “199010-K”); Amendment thereto dated as of July 21, 1991, incorporated by reference to Exhibit 10(bb) of the 1991 10-K;Amendments thereto dated as of December 3, 1992 and December 15, 1992, incorporated by reference to Exhibit 10(l)of registrant’s 1992 Annual Report on Form 10-K (the “1992 10-K”); Amendment thereto dated as of September 28,1994, incorporated by reference to Exhibit 10(j) of registrant’s 1994 Annual Report on Form 10-K (the “1994 Form 10-K”); Amendments thereto dated March 27, 1996 and June 25, 1997, incorporated by reference to Exhibit 10(c) of the1997 10-K; Amendments thereto dated April 10, 1998, June 24, 1998 and October 1, 1998, incorporated by referenceto Exhibit 10(b) of the 1998 10-K; Amendment thereto dated December 14, 1999, incorporated by reference to Exhibit10(b) of registrant’s 1999 Annual Report on Form 10-K (the “1999 10-K”); and Amendment thereto dated as of March28, 2001, incorporated by reference to Exhibit 10(b) of registrant’s 2001 Annual Report on Form 10-K (the “2001 10-K”); and Amendment thereto dated December 10, 2002, incorporated by reference to Exhibit 10(b) of registrant’s 2002Annual Report on Form 10-K (the “2002 10-K”).
(b) NationsBank Corporation and Designated Subsidiaries Deferred Compensation Plan for Key Employees, incorporatedby reference to Exhibit 10(k) of the 1994 10-K; Amendment thereto dated as of June 28, 1989, incorporated byreference to Exhibit 10(h) of the 1989 10-K; Amendment thereto dated as of June 27, 1990, incorporated by referenceto Exhibit 10(h) of the 1990 10-K; Amendment thereto dated as of July 21, 1991, incorporated by reference to Exhibit10(bb) of the 1991 10-K; Amendment thereto dated as of December 3, 1992, incorporated by reference to Exhibit 10(m)of the 1992 10-K; and Amendments thereto dated April 10, 1998 and October 1, 1998, incorporated by reference toExhibit 10(b) of the 1998 10-K.
(c) Bank of America Pension Restoration Plan, as amended and restated effective January 1, 2005, incorporated byreference to Exhibit 10(c) of the 2004 10-K.
E-4
Exhibit No. Description
(d) NationsBank Corporation Benefit Security Trust dated as of June 27, 1990, incorporated by reference to Exhibit 10(t) ofthe 1990 10-K; First Supplement thereto dated as of November 30, 1992, incorporated by reference to Exhibit 10(v) of the1992 10-K; and Trustee Removal/Appointment Agreement dated as of December 19, 1995, incorporated by reference toExhibit 10(o) of registrant’s 1995 Annual Report on Form 10-K.
(e) Bank of America 401(k) Restoration Plan, as amended and restated effective January 1, 2005.
(f) Bank of America Executive Incentive Compensation Plan, as amended and restated effective December 10, 2002,incorporated by reference to Exhibit 10(g) of the 2002 10-K.
(g) Bank of America Director Deferral Plan, as amended and restated effective January 27, 1999, incorporated byreference to Exhibit 10(i) of the 1998 10-K; Amendment thereto dated April 24, 2002, incorporated by reference toExhibit 10(h) of the 2002 10-K; and Bank of America Corporation Director Deferral Plan, as amended and restated,effective December 10, 2002, incorporated by reference to Exhibit 10(h) of the 2002 10-K.
(h) Bank of America Corporation Directors’ Stock Plan, as amended and restated effective January 1, 2002, incorporatedby reference to Exhibit 10(j) of the 2001 10-K; Amendment thereto dated April 24, 2002, incorporated by reference toExhibit 10(i) of the 2002 10-K; Bank of America Corporation Directors’ Stock Plan, as amended and restated effectiveDecember 10, 2002, incorporated by reference to Exhibit 10(i) of the 2002 10-K; form of Restricted Stock Awardagreement, incorporated by reference to Exhibit 10(h) of the 2004 10-K; and Bank of America Corporation Directors’Stock Plan as amended and restated effective April 26, 2006, incorporated by reference to Exhibit 10.2 to theRegistrant’s Form 8-K filed on December 14, 2005.
(i) Bank of America Corporation 2003 Key Associate Stock Plan, effective January 1, 2003, as amended and restatedeffective April 1, 2004, incorporated by reference to Exhibit 10(f) of registrant’s Registration Statement on Form S-4(File No. 333-110924); form of Restricted Stock Units Award Agreement; and form of Stock Option Award Agreement.
(j) Split Dollar Life Insurance Agreement dated as of October 16, 1998 between registrant and NationsBank, N. A., asTrustee under that certain Irrevocable Trust Agreement No. 2 dated October 1, 1998, by and between James H.Hance, Jr., as Grantor, and NationsBank, N. A., as Trustee, incorporated by reference to Exhibit 10(dd) of the 199810-K; and Amendment thereto dated January 24, 2002, incorporated by reference to Exhibit 10(o) of the 2001 10-K.
(k) Split Dollar Life Insurance Agreement dated as of September 28, 1998 between registrant and J. Steele Alphin, asTrustee under that certain Irrevocable Trust Agreement dated June 23, 1998, by and between Kenneth D. Lewis, asGrantor, and J. Steele Alphin, as Trustee, incorporated by reference to Exhibit 10(ee) of the 1998 10-K; andAmendment thereto dated January 24, 2002, incorporated by reference to Exhibit 10(p) of the 2001 10-K.
(l) Bank of America Corporation 2002 Associates Stock Option Plan, effective February 1, 2002, incorporated bereference to Exhibit 10(s) of the 2002 10-K.
(m) Take Ownership!, The BankAmerica Global Associate Stock Option Program, effective October 1, 1998, incorporatedby reference to Exhibit 10(t) of the 2002 10-K.
(n) Amendment to various plans in connection with FleetBoston Financial Corporation merger, incorporated by referenceto Exhibit 10(v) of registrant’s 2003 Annual Report on Form 10-K (the “2003 10-K”).
(o) FleetBoston Supplemental Executive Retirement Plan, as amended by Amendment One thereto effective January 1,1997, Amendment Two thereto effective October 15, 1997, Amendment Three thereto effective July 1, 1998,Amendment Four thereto effective August 15, 1999, Amendment Five thereto effective January 1, 2000, AmendmentSix thereto effective October 10, 2001, Amendment Seven thereto effective February 19, 2002, Amendment Eightthereto effective October 15, 2002, Amendment Nine thereto effective January 1, 2003, Amendment Ten theretoeffective October 21, 2003, and Amendment Eleven thereto effective December 31, 2004, incorporated by reference toExhibit 10(r) of the 2004 10-K.
(p) FleetBoston Amended and Restated 1992 Stock Option and Restricted Stock Plan, incorporated by reference toExhibit 10(s) of the 2004 10-K.
(q) FleetBoston Executive Deferred Compensation Plan No. 2, as amended by Amendment One thereto effective February1, 1999, Amendment Two thereto effective January 1, 2000, Amendment Three thereto effective January 1, 2002,Amendment Four thereto effective October 15, 2002, Amendment Five thereto effective January 1, 2003, andAmendment Six thereto effective December 16, 2003, incorporated by reference to Exhibit 10(u) of the 2004 10-K.
(r) FleetBoston Executive Supplemental Plan, as amended by Amendment One thereto effective January 1, 2000,Amendment Two thereto effective January 1, 2002, Amendment Three thereto effective January 1, 2003, AmendmentFour thereto effective January 1, 2003, and Amendment Five thereto effective December 31, 2004, incorporated byreference to Exhibit 10(v) of the 2004 10-K.
(s) FleetBoston Retirement Income Assurance Plan, as amended by Amendment One thereto effective January 1, 1997,Amendment Two thereto effective January 1, 2000, Amendment Three thereto effective November 1, 2001,Amendment Four thereto effective January 1, 2003, Amendment Five thereto effective December 16, 2003, andAmendment Six thereto effective December 31, 2004, incorporated by reference to Exhibit 10(w) of the 2004 10-K; andAmendment Seven thereto dated December 20, 2005.
(t) Trust Agreement for the FleetBoston Executive Deferred Compensation Plans No. 1 and 2, incorporated by referenceto Exhibit 10(x) of the 2004 10-K.
(u) Trust Agreement for the FleetBoston Executive Supplemental Plan, incorporated by reference to Exhibit 10(y) of the2004 10-K.
E-5
Exhibit No. Description
(v) Trust Agreement for the FleetBoston Retirement Income Assurance Plan and the FleetBoston SupplementalExecutive Retirement Plan, incorporated by reference to Exhibit 10(z) of the 2004 10-K.
(w) FleetBoston Directors Deferred Compensation and Stock Unit Plan, as amended by an amendment thereto effectiveas of July 1, 2000, a Second Amendment thereto effective as of January 1, 2003, a Third Amendment thereto datedApril 14, 2003, and a Fourth Amendment thereto effective January 1, 2004, incorporated by reference to Exhibit10(aa) of the 2004 10-K.
(x) FleetBoston 1996 Long-Term Incentive Plan, incorporated by reference to Exhibit 10(bb) of the 200410-K.
(y) BankBoston Corporation and its Subsidiaries Deferred Compensation Plan, as amended by a First Amendmentthereto, a Second Amendment thereto, a Third Amendment thereto, an Instrument thereto (providing for thecessation of accruals effective December 31, 2000) and an Amendment thereto dated December 24, 2001, incorporatedby reference to Exhibit 10(cc) of the 2004 10-K.
(z) BankBoston, N.A. Bonus Supplemental Employee Retirement Plan, as amended by a First Amendment, a SecondAmendment, a Third Amendment and a Fourth Amendment thereto, incorporated by reference to Exhibit 10(dd) ofthe 2004 10-K.
(aa) Description of BankBoston Supplemental Life Insurance Plan, incorporated by reference to Exhibit 10(ee) of the 200410-K.
(bb) BankBoston, N.A. Excess Benefit Supplemental Employee Retirement Plan, as amended by a First Amendment, aSecond Amendment, a Third Amendment thereto (assumed by FleetBoston on October 1, 1999) and an Instrumentthereto, incorporated by reference to Exhibit 10(ff) of the 2004 10-K.
(cc) Description of BankBoston Supplemental Long-Term Disability Plan, incorporated by reference to Exhibit 10(gg) ofthe 2004 10-K.
(dd) BankBoston Director Stock Award Plan, incorporated by reference to Exhibit 10(hh) of the 2004 10-K.
(ee) BankBoston Directors Deferred Compensation Plan, as amended by a First Amendment and a Second Amendmentthereto, incorporated by reference to Exhibit 10(ii) of the 2004 10-K.
(ff) BankBoston, N.A. Directors’ Deferred Compensation Plan, as amended by a First Amendment and a SecondAmendment thereto, incorporated by reference to Exhibit 10(jj) of the 2004 10-K.
(gg) BankBoston 1997 Stock Option Plan for Non-Employee Directors, as amended by an amendment thereto dated as ofOctober 16, 2001, incorporated by reference to Exhibit 10(kk) of the 2004 10-K.
(hh) Description of BankBoston Director Retirement Benefits Exchange Program, incorporated by reference to Exhibit10(ll) of the 2004 10-K.
(ii) Employment Agreement, dated as of March 14, 1999, between FleetBoston and Charles K. Gifford, as amended by anamendment thereto effective as of February 7, 2000, a Second Amendment thereto effective as of April 22, 2002, and aThird Amendment thereto effective as of October 1, 2002, incorporated by reference to Exhibit 10(mm) of the 200410-K.
(jj) Form of Change in Control Agreement entered into with Charles K. Gifford, incorporated by reference to Exhibit10(nn) of the 2004 10-K.
(kk) Global amendment to definition of “change in control” or “change of control,” together with a list of plans affective bysuch amendment, incorporated by reference to Exhibit 10(oo) of the 2004 10-K.
(ll) Employment Agreement dated October 27, 2003 between Bank of America Corporation and Brian T. Moynihan,incorporated by reference to Exhibit 10(d) of registrant’s Registration Statement on Form S-4 (File No. 333-110924).
(nn) Retirement Agreement dated January 26, 2005 between Bank of America Corporation and Charles K. Gifford,incorporated by reference to Exhibit 10.1 to the registrant’s Form 8-K filed on January 26, 2005.
(oo) Amendment to various FleetBoston stock option awards, dated March 25, 2004, incorporated by reference to Exhibit10(ss) of the 2004 10-K.
(pp) Cancellation Agreement dated October 26, 2005 between Bank of America Corporation and Brian T. Moynihan,incorporated by reference to Exhibit 10.1 of registrant’s Form 8-K filed October 26, 2005.
(qq) Agreement Regarding Participation in the FleetBoston Supplemental Executive Retirement Plan dated October 26,2005 between Bank of America Corporation and Brian T. Moynihan, incorporated by reference to Exhibit 10.2 ofregistrant’s Form 8-K filed October 26, 2005.
12 Ratio of Earnings to Fixed Charges.
Ratio of Earnings to Fixed Charges and Preferred Dividends.
21 List of Subsidiaries.
23 Consent of PricewaterhouseCoopers LLP.
24(a) Power of Attorney.
(b) Corporate Resolution.
E-6
Exhibit No. Description
31(a) Certification of the Chief Executive Officer pursuant to Section 302 of the Sarbanes-Oxley Act of 2002
(b) Certification of the Chief Financial Officer pursuant to Section 302 of the Sarbanes-Oxley Act of 2002
32(a) Certification of the Chief Executive Officer pursuant to 18 U.S.C. Section 1350, as adopted pursuant to Section 906 ofthe Sarbanes-Oxley Act of 2002
(b) Certification of the Chief Financial Officer pursuant to 18 U.S.C. Section 1350, as adopted pursuant to Section 906 ofthe Sarbanes-Oxley Act of 2002
* Denotes executive compensation plan or arrangement.