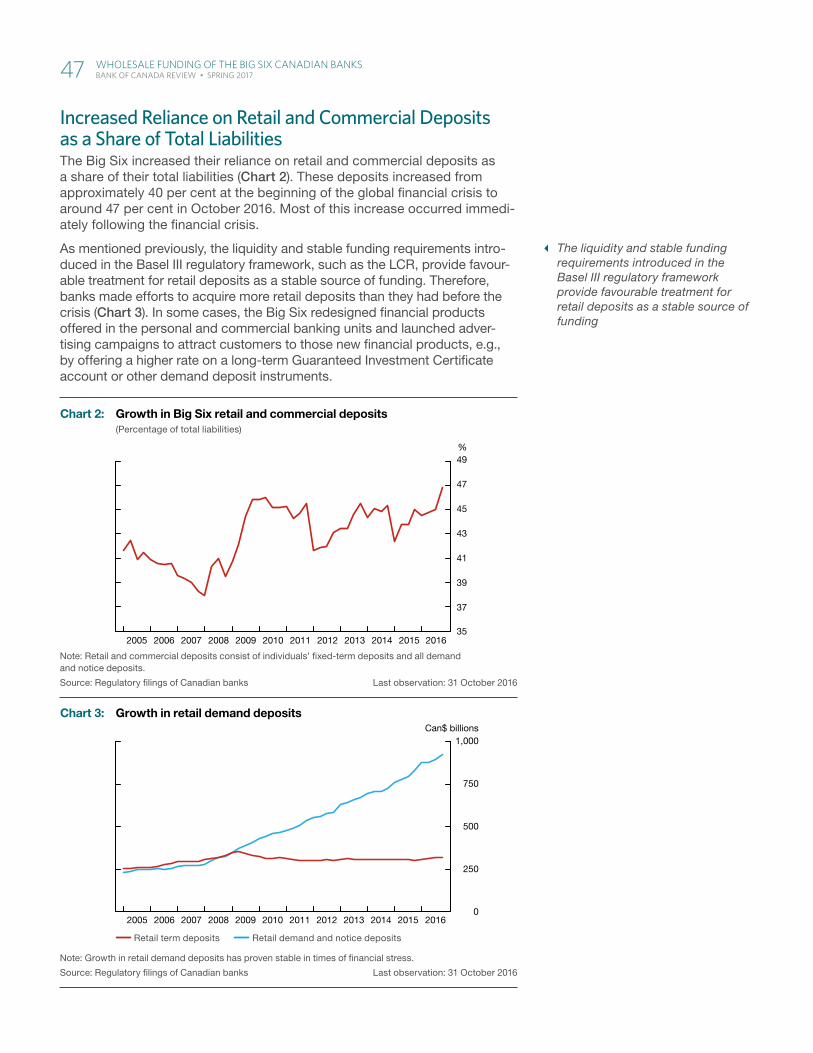
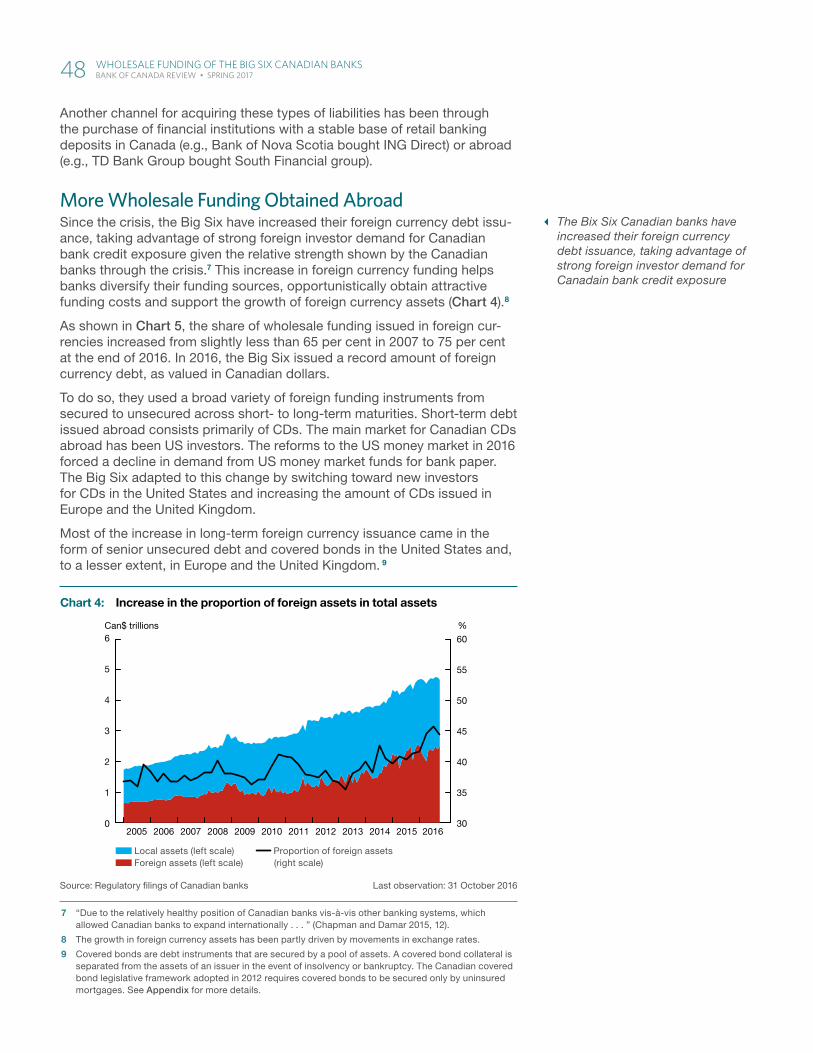
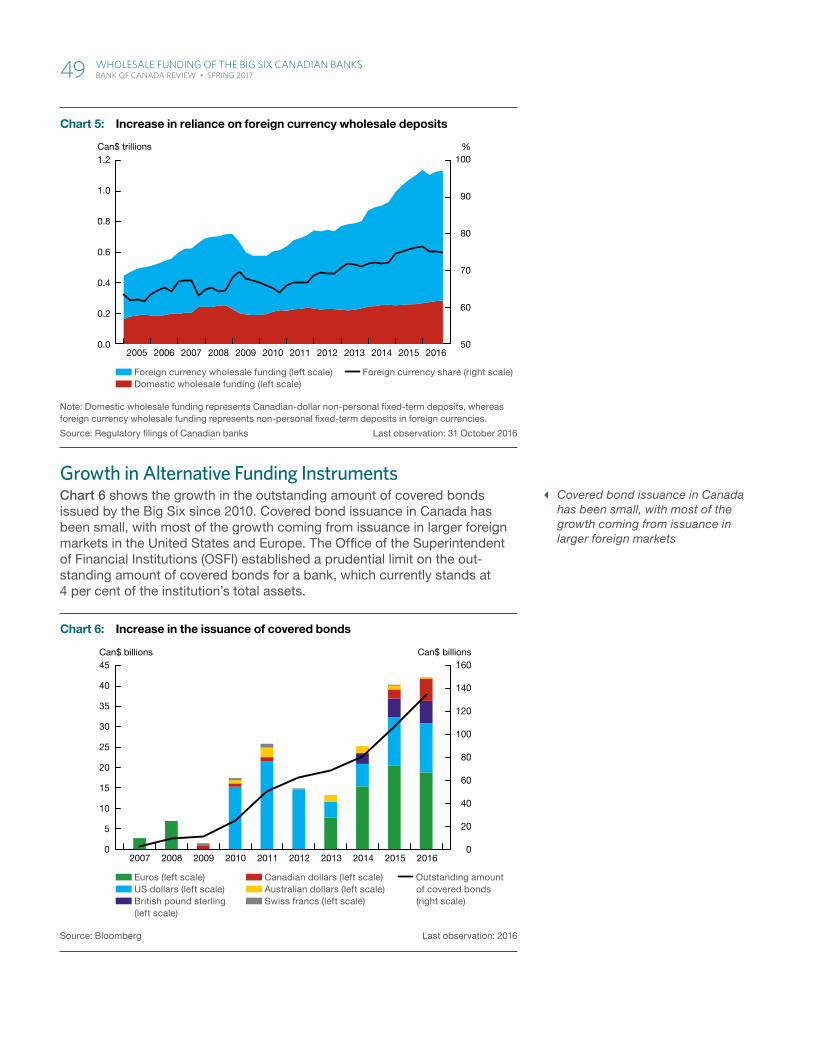
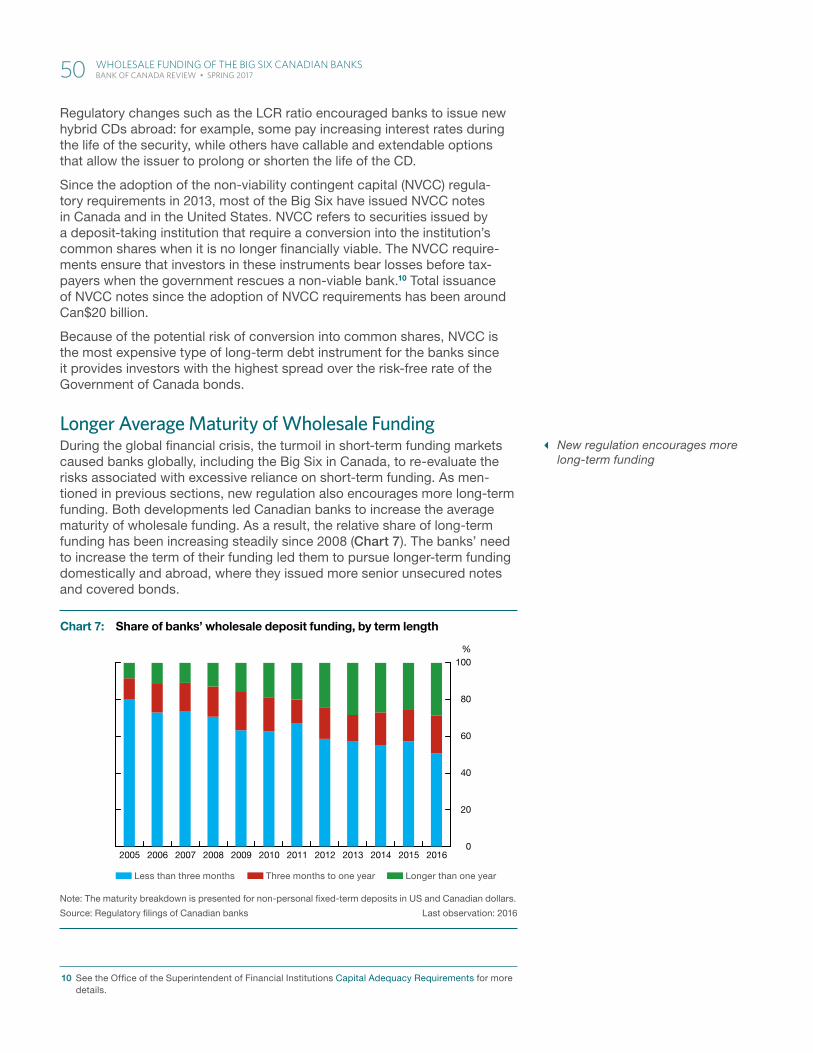
BANK OF CANADA REVIEW Spring 2017 Articles A Closer Look at the Commemorative Bank Note 3 Danielle Côté The Digital Economy 5 Chris D’Souza and David Williams Unconventional Monetary Policy: The Perspective of a Small Open Economy 19 Jean-Sébastien Fontaine, Lena Suchanek and Jing Yang The Life Cycle of Government of Canada Bonds in Core Funding Markets 31 Narayan Bulusu and Sermin Gungor Wholesale Funding of the Big Six Canadian Banks42 Matthieu Truno, Andriy Stolyarov, Danny Auger and Michel Assaf Why Is Global Business Investment So Weak? Some Insights from Advanced Economies 56 Robert Fay, Justin-Damien Guénette, Martin Leduc and Louis Morel
Transcript
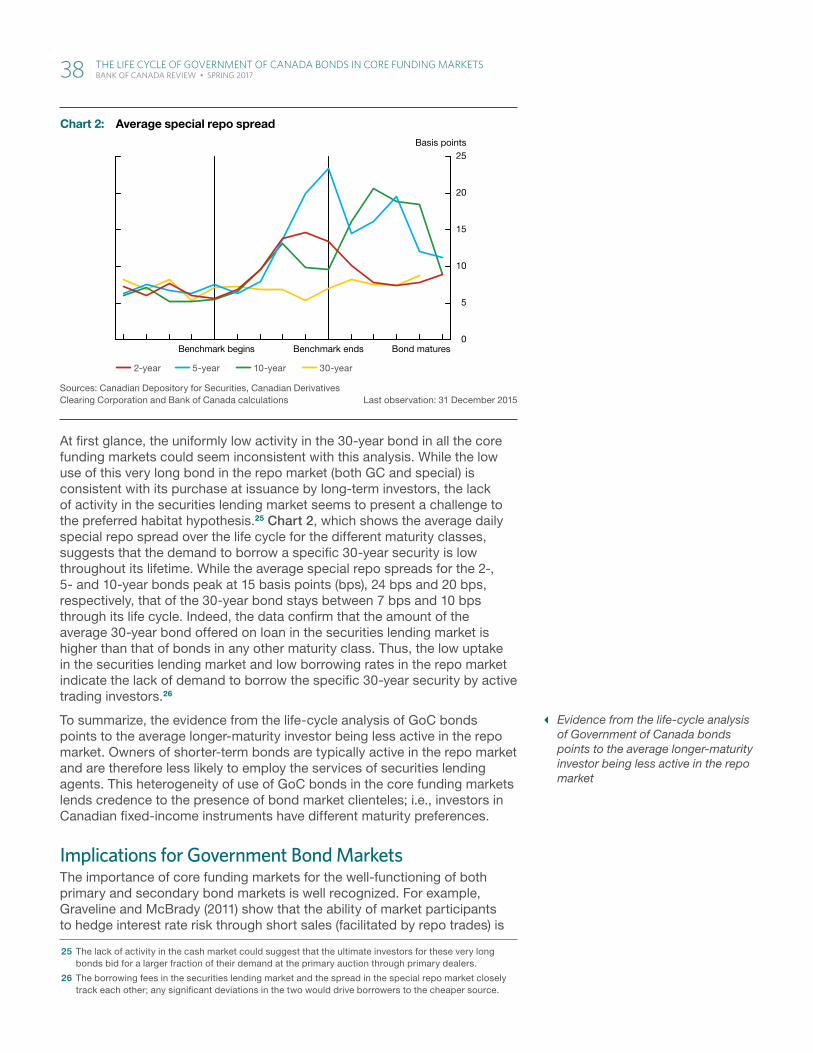
BANK OF CANADA REVIEW Spring 2017
ArticlesA Closer Look at the Commemorative Bank Note . . . . . . . . . . . . . . . . . . . . 3Danielle Côté
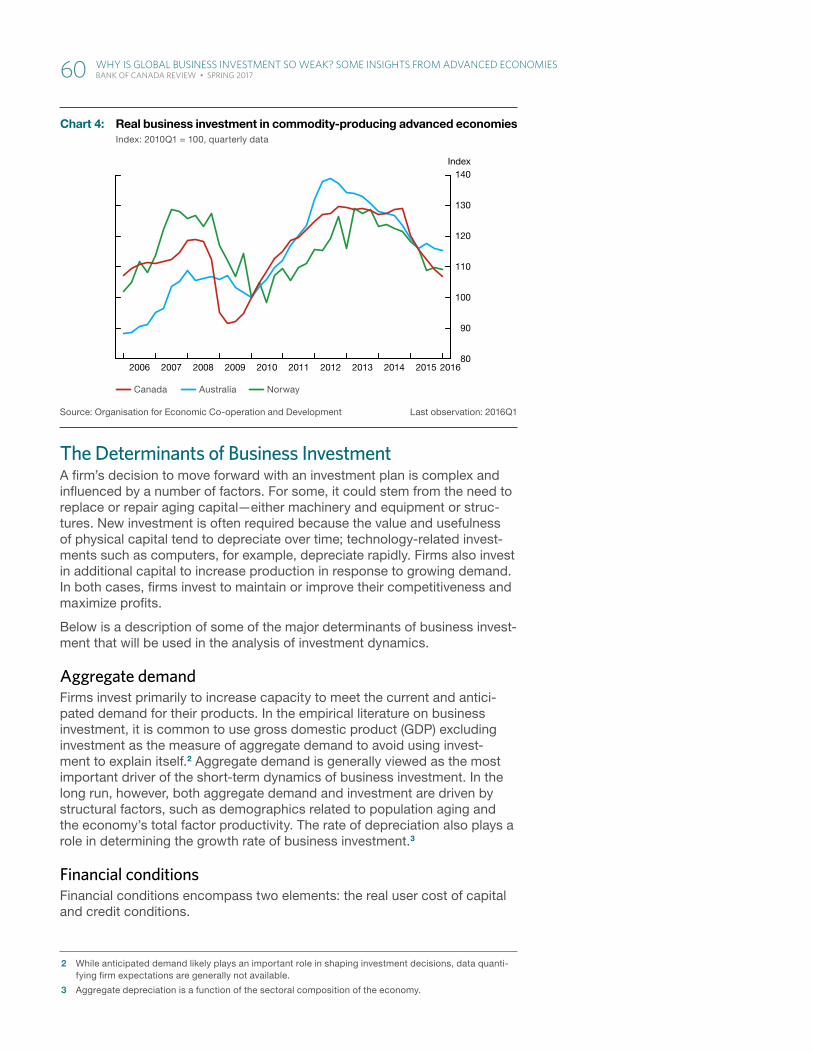
The Digital Economy . . . . . . . . . . . . . . . . . . . . . . . . . . . . . . . . . . . . 5Chris D’Souza and David Williams
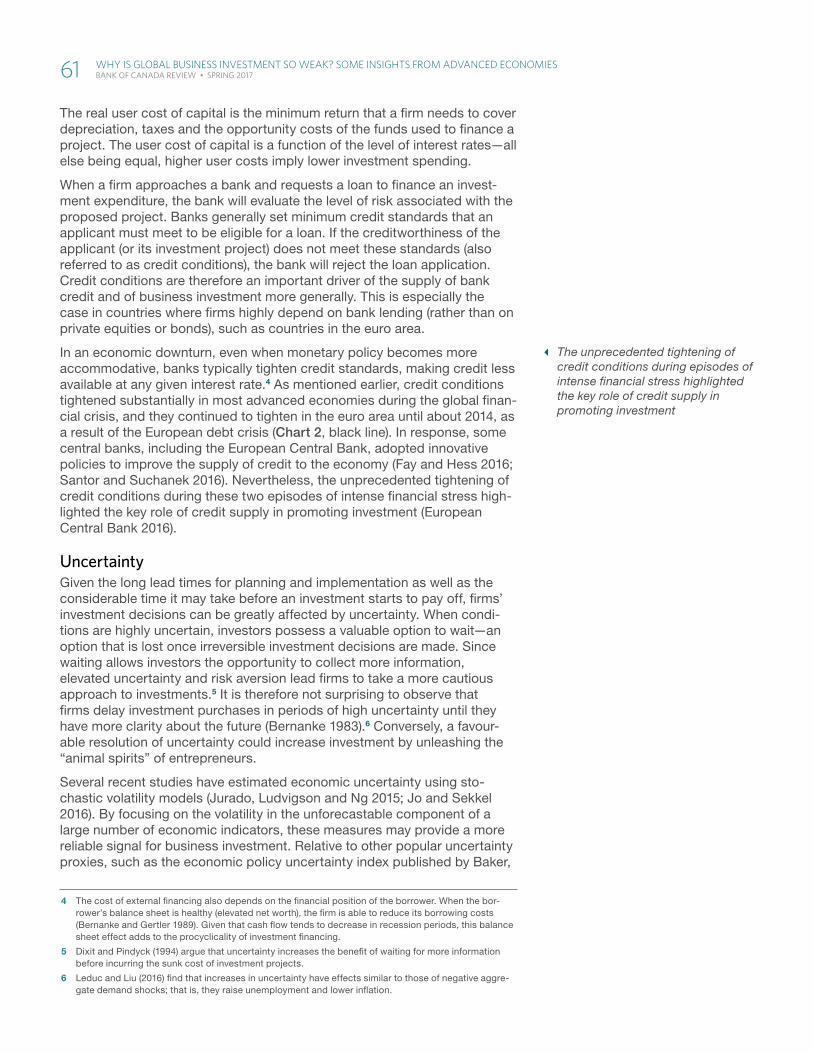
Unconventional Monetary Policy: The Perspective of a Small Open Economy . . . . 19Jean-Sébastien Fontaine, Lena Suchanek and Jing Yang
The Life Cycle of Government of Canada Bonds in Core Funding Markets . . . . . . 31Narayan Bulusu and Sermin Gungor
Wholesale Funding of the Big Six Canadian Banks . . . . . . . . . . . . . . . . . . . 42Matthieu Truno, Andriy Stolyarov, Danny Auger and Michel Assaf
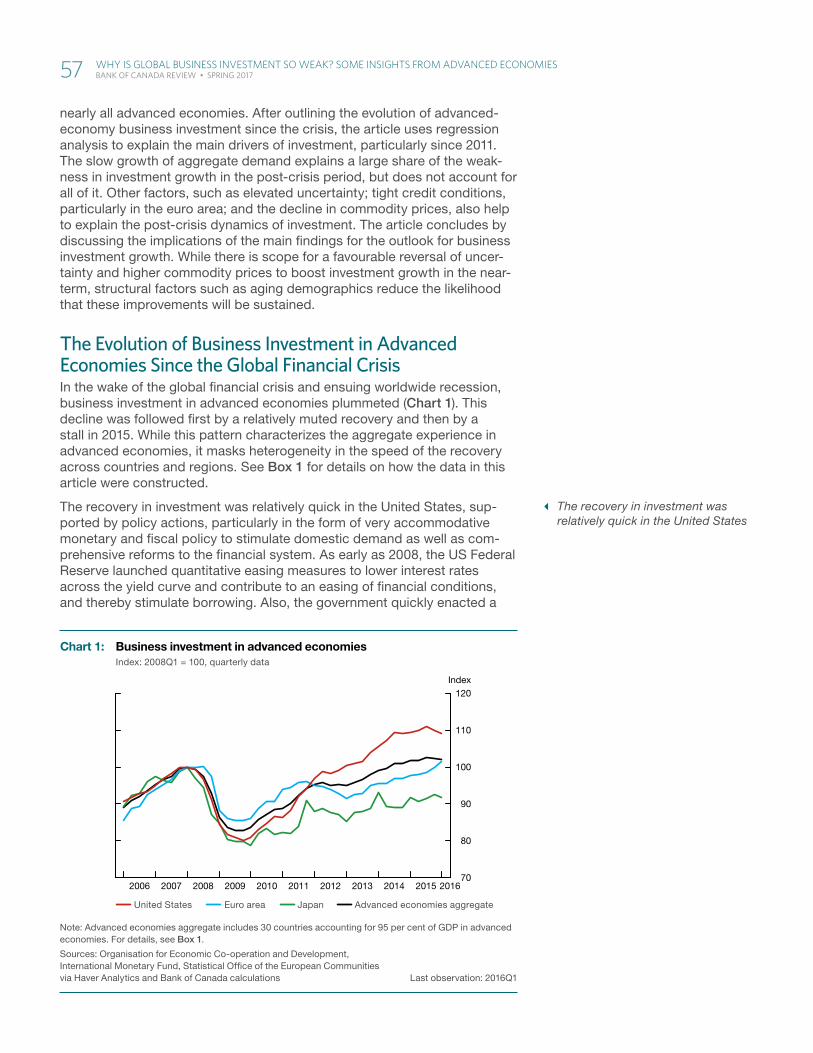
Why Is Global Business Investment So Weak? Some Insights from Advanced Economies . . . . . . . . . . . . . . . . . . . . . . . 56Robert Fay, Justin-Damien Guénette, Martin Leduc and Louis Morel
Members of the Editorial Board
Chair: Don Coletti
Paul Chilcott
Toni Gravelle
Jeremy Harrison
Grahame Johnson
Sharon Kozicki
Sheryl King
Timothy Lane
Sylvain Leduc
Césaire Meh
Rhys Mendes
Ron Morrow
Stephen Murchison
Lynn Patterson
Eric Santor
Lawrence Schembri
Richard Wall
Editor: Nicole van de Wolfshaar
The Bank of Canada Review is published twice a year. Articles undergo a thorough review process. The views expressed in the articles are those of the authors and do not necessarily reflect the views of the Bank.
The contents of the Review may be reproduced or quoted, provided that the publication, with its date, is specifically cited as the source.
For further information, contact:
Public Information Communications Department Bank of Canada Ottawa, Ontario, Canada K1A 0G9
Telephone: 613-782-8111; 1-800-303-1282 (toll-free in North America) Email: [email protected] Website: bankofcanada.ca
A Closer Look at the Commemorative Bank NoteDanielle Côté, Currency Department
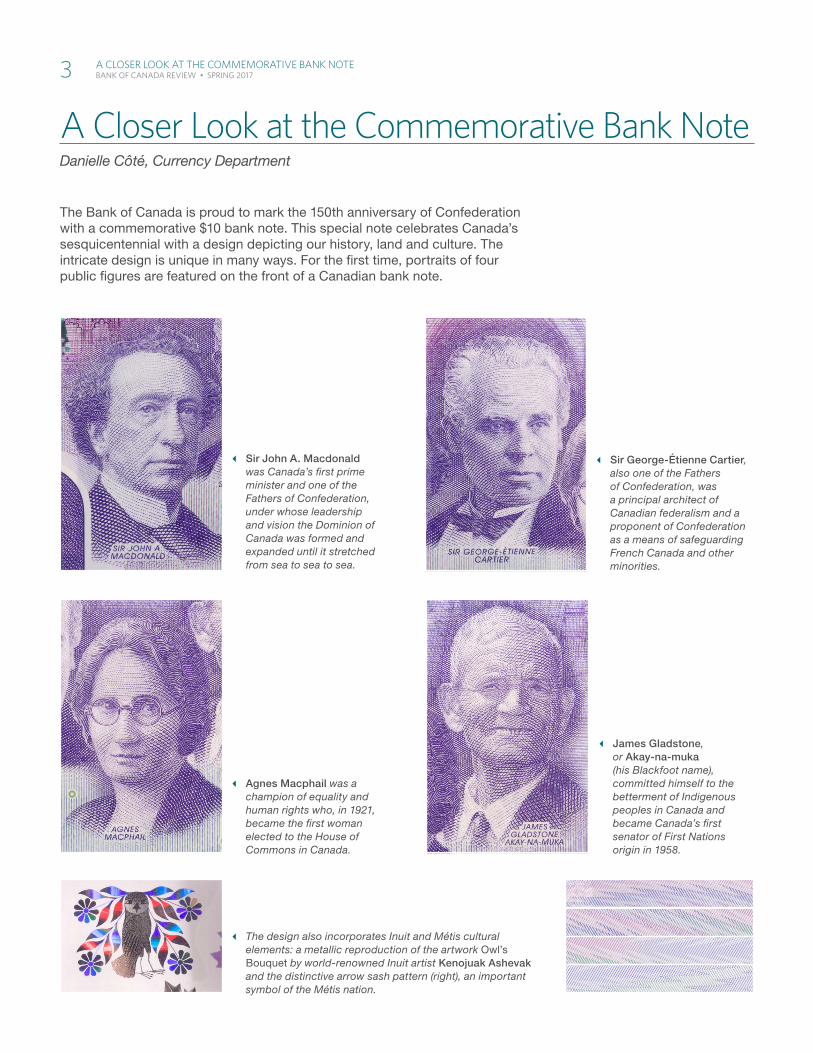
The Bank of Canada is proud to mark the 150th anniversary of Confederation with a commemorative $10 bank note. This special note celebrates Canada’s sesquicentennial with a design depicting our history, land and culture. The intricate design is unique in many ways. For the first time, portraits of four public figures are featured on the front of a Canadian bank note.
� Sir John A. Macdonald was Canada’s first prime minister and one of the Fathers of Confederation, under whose leadership and vision the Dominion of Canada was formed and expanded until it stretched from sea to sea to sea.
� Sir George-Étienne Cartier, also one of the Fathers of Confederation, was a principal architect of Canadian federalism and a proponent of Confederation as a means of safeguarding French Canada and other minorities.
� Agnes Macphail was a champion of equality and human rights who, in 1921, became the first woman elected to the House of Commons in Canada.
� James Gladstone, or Akay-na-muka (his Blackfoot name), committed himself to the betterment of Indigenous peoples in Canada and became Canada’s first senator of First Nations origin in 1958.
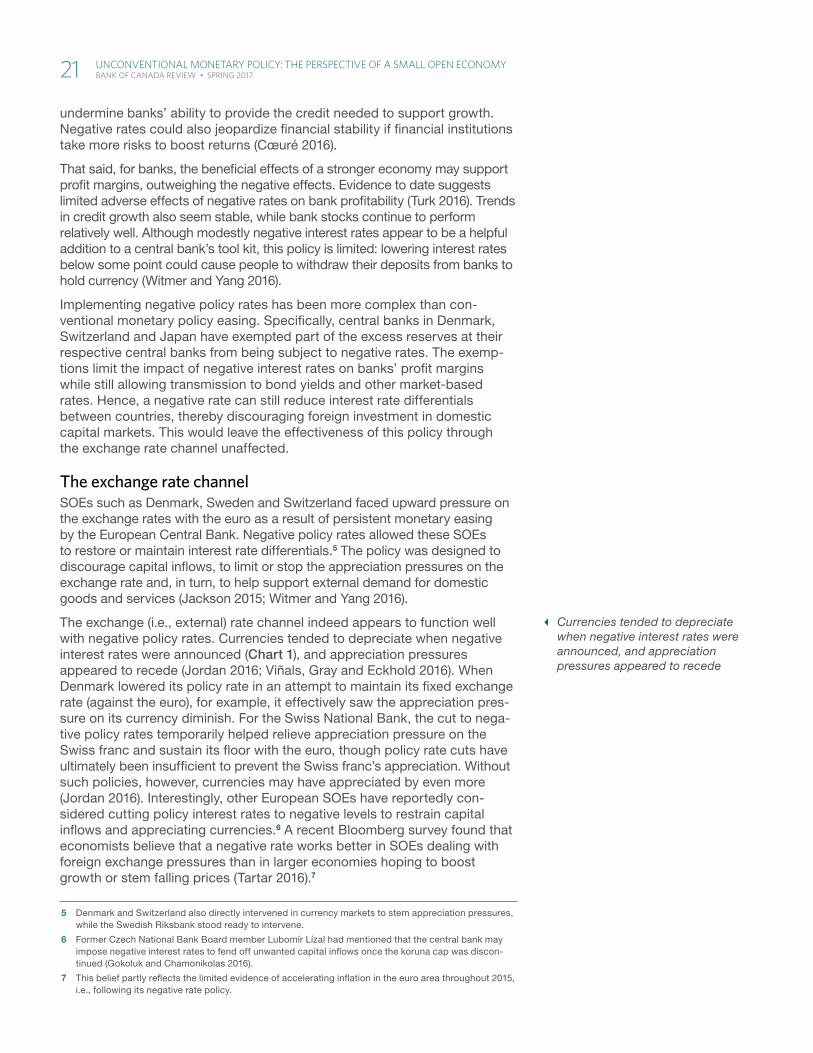
� The design also incorporates Inuit and Métis cultural elements: a metallic reproduction of the artwork Owl’s Bouquet by world-renowned Inuit artist Kenojuak Ashevak and the distinctive arrow sash pattern (right), an important symbol of the Métis nation.
3 A CLoser Look At the CommemorAtive BANk Note Bank of Canada Review • SpRing 2017
The back of the Canada 150 note showcases Canada’s natural beauty and the rugged splendour of a land as diverse as its people. Five landscapes represent the various regions of the country: the West Coast, the Prairie provinces, Central Canada, the Atlantic provinces and the North.
� To represent the West Coast, The Lions are iconic peaks overlooking Vancouver, British Columbia. They were given the name The Lions by John Hamilton Gray, a Father of Confederation. The local Squamish people know the peaks as Ch’ich’iyúy Elxwíkn, or the Twin Sisters.
� Moving from west to east, the next landscape shows stalks of wheat ripening on a family farm outside Regina, Saskatchewan. One of the most important cultivated crops in all of Canada, wheat is emblematic of the Prairie provinces of Western Canada, where the bulk of Canadian wheat is grown.
� A forest stands on the bank of the Kipawa River, which ripples across the ancient rock of the Canadian Shield in Parc national d’Opémican in the Abitibi-Témiscamingue region of Quebec. The Shield covers 4.8 million square kilometres, roughly half the total land area of Canada.
� The Atlantic Ocean meets the rocky coast of Cape Bonavista in Canada’s easternmost province of Newfoundland and Labrador. The Cape is a possible landing site of John Cabot, who sailed to North America in 1497.
� And finally, the northern lights dance across the top portion of the note. Straddling the boundary between Alberta and the Northwest Territories, Wood Buffalo National Park is Canada’s largest national park and the world’s largest dark sky preserve. It is one of the most ideal places on Earth to see the northern lights.
For more information on the commemorative note please visit the Bank of Canada website.
SPECIMEN
4 A CLoser Look At the CommemorAtive BANk Note Bank of Canada Review • SpRing 2017
The Digital EconomyChris D’Souza and David Williams, Canadian Economic Analysis Department
� Digital technologies are transforming how businesses operate by facilita-ting tasks that rely intensively on connectivity, information usage, predic-tion and collaboration.
� Firms with high levels of organizational capital (e.g., people-management and decision-making processes that are high quality) and human capital (skilled labour) are likely to see the largest productivity benefits from investments in digital technologies.1 These firms tend to be agile and able to maximize the benefits of their investments by identifying and exploiting opportunities for sales growth, process redesign and production efficiencies.
� The transition to a digital-technology-intensive economy could have wide-ranging implications for the macroeconomy.
Digital technologies are transforming the way we live, work, consume and produce goods and services. Examples include cloud computing, the Internet of Things, advanced robotics, advanced analytics (including big data, artificial intelligence (AI) and machine learning), biotechnology, social media, three-dimensional (3D) printing, augmented and virtual reality, broadband Internet and wireless mobility.2 Broadband Internet and wireless mobility are not new. However, their widespread adoption and improved
1 Organizational capital is an intangible business asset consisting of processes, systems, norms, values and enterprise knowledge that shapes how a firm’s resources are used in combination to become productive. The firm’s resources include machines, patents, brands, information and communications technologies (ICTs) and human capital. Organizational capital is an asset that cannot be easily imitated by competitors and therefore offers a competitive advantage to the firm’s owners (Lev, Radhakrishnan and Evans 2016).
2 Cloud computing provides on-demand, shared processing resources and data to computers and other devices over the Internet. The Internet of Things is the networking of physical devices—such as smart devices, vehicles, buildings and other items—embedded with sensors, electronics, software, actuators and network connectivity that enable these objects to detect and transmit events or changes in a device’s environment. Big data refers to the large volumes of data that businesses collect and analyze to uncover hidden patterns, market trends, customer preferences, etc. Artificial intelligence (AI) computer systems are able to perform tasks that normally require human intelligence, such as speech recognition and decision making. Machine learning, a field of AI, involves programming computers that learn from sample data or past experience. It is most powerful in situations where a computer program cannot be written directly to solve a given problem (Agrawal, Gans and Goldfarb 2017). Augmented reality involves a live view of a real-world environment with portions that are augmented by computer-generated sensory input such as sound, video, graphics or GPS data. In contrast, virtual reality replaces the real world with a simulated one.
The Bank of Canada Review is published two times a year. Articles undergo a thorough review process. The views expressed in the articles are those of the authors and do not necessarily reflect the views of the Bank. The contents of the Review may be reproduced or quoted, provided that the publication, with its date, is specifically cited as the source.
5 ThE DigiTal Economy Bank of Canada Review • SpRing 2017
bandwidth provide essential virtual connectivity for the digital economy—just as energy, transport and analog communications networks provided essen-tial physical connectivity for the development of the industrial economy.
This article compares the current digital transformation with past industrial revolutions. It discusses whether digitalization should be seen as an evolu-tion of the information and communications technology (ICT) revolution or as a new epoch. During the ICT revolution (discussed below), firms used electronics to automate a limited number of routine steps in production.3 Moving forward, firms will use digital technologies to automate many more routine steps in production as well as some that are complex and non-routine.
Varian (2016) proposes five main ways in which digital technologies will transform economic activities:
(i) Data collection and analysis—Firms will be able to collect large amounts of information about customer preferences that can be used to predict customer behaviours and improve service delivery.
(ii) Personalization and customization—Firms will be able to deliver custom-ized products and services. Customers expect a streamlined experience and count on merchants to possess relevant information about their purchase history, billing preferences, shipping addresses and other details.
(iii) Experimentation and continuous development—Firms will be able to exploit large data sets and employ powerful prediction algorithms to automate systems and inform decisions on production and resource allocation.
(iv) Innovations in contracting—Firms and consumers will be able to track, monitor and verify the performance of others with whom they are con-ducting transactions. This will facilitate new types of economic trans-actions (e.g., ridesharing, e-money, distributed ledgers).4
(v) Coordination and communication—Communication tools (e.g., document-sharing software, video conferencing, wireless mobility devices) will allow people and resources to interact with increased flex-ibility, regardless of where they are located. Firms will be able to service a global market for their products and services more easily.
After reviewing the historical background, this article surveys how new digital technologies are challenging existing systems of production in select industries. Finally, it explores the effects of digitalization at the macro-economic level, including some implications for policy-makers.
Historical Context: A Fourth Industrial Revolution?There have been three industrial revolutions in history, and the emergence of the digital economy is considered by some to represent a fourth.5 The first industrial revolution, originating in Britain between roughly 1760 and 1850, centred on the shift from rural-agrarian to urban-mechanized systems of
3 ICT capital inputs include computer hardware, telecommunications equipment, and computer software and databases (Organisation for Economic Co-operation and Development 2016).
4 Electronic payments represent a technology to purchase goods and services while electronic money or e-money, such as Bitcoin, represents a new form of currency. Both can facilitate economic trans-actions. For details, see Fung, Molico and Stuber (2014) and Fung and Halaburda (2016). A distributed ledger simultaneously records data across multiple locations, without there being a central repository.
5 See Schwab (2016), for example.
� Firms will use digital technologies to automate many more routine steps in production as well as some that are complex and non-routine
� There have been three industrial revolutions in history, and the emergence of the digital economy is considered by some to represent a fourth
6 ThE DigiTal Economy Bank of Canada Review • SpRing 2017
production.6 Key technological advances included cotton spinning, steam power, steamships, railways and the transition from wood to metal (Gordon 2015, 2016). Britain saw a “gradual acceleration to a steady but unspec-tacular [rate of real gross domestic product (GDP)] growth with rapid pro-ductivity advance confined to relatively few sectors” (Crafts 2014, 1). Growth in British labour productivity (GDP per hour) averaged from approximately 0.3 to 0.6 per cent per annum during that era.7
The second industrial revolution spanned roughly the century after 1870. Over time it became led by the United States and centred on the shift to mass production, distribution and communication. Key innovations included electricity, urban water and waste systems, the telephone, the internal com-bustion engine, air transport, highways, radio, television, plastics, air con-ditioning, high-rise buildings, antibiotics and treatments that reduced infant mortality. In contrast to the earlier era, productivity increases were signifi-cant and sustained. Growth in US labour productivity averaged 2.8 per cent per annum from 1920 to 1970 (Gordon 2016).
The third industrial revolution, centred on ICTs, began roughly in the 1960s and was led by the United States. Significant advances in networked computing and telecommunication capabilities were accompanied by steep price declines and rapid quality improvements in ICT hardware and software. Key innovations included advances in semi-conductor manu-facturing, the switch from mainframe to personal computers, email, faxes, photocopying, electronic documents, the Internet, e-commerce, bar-code scanning, electronic catalogues, automatic teller machines, automatic credit scoring and mobile telecommunications. ICT diffusion, especially in offices and in the retail and wholesale sectors, contributed to labour productivity growth in the United States of around 2.5 per cent per annum between 1996 and 2004 (Gordon 2015).
There is no consensus in the literature as to whether digitalization should be seen as an evolution of the third (ICT) revolution or as a distinct, fourth revo-lution. Gordon (2015, 2016), for example, sees digital technologies as evolved ICTs that are less transformative and have far less scope to gen-erate large, sustained increases in productivity compared with innovations in earlier eras.8 In contrast, Schwab (2016) argues that a fourth industrial revolution is under way that will fundamentally transform economies and societies by fusing the physical, digital and biological worlds through, for example, highly interconnected production chains and semi-automated prediction and decision-making processes. Brynjolfsson and McAfee (2014) describe the digital era as a “second machine age.” Whereas the first machine age (the period since the first industrial revolution) featured the automation of tasks reliant on manual labour, the second machine age will see many cognitive or knowledge-based tasks automated and cheaply produced at great scale.
6 Britain became “the workshop of the world” (Temin 1997, 80).
7 See Broadberry, Campbell and Van Leeuwen (2013) and Crafts (2014). Technological diffusion during the first industrial revolution was slow. The peak contribution from steam power to British productivity was not realized until after 1850, almost a century after James Watt’s patent (see Crafts 2014).
8 For example, Gordon (2015, 2016) points out that the ICT revolution’s impact on productivity growth was short-lived and “tended to be channeled into a narrow sphere of human activity involving enter-tainment, communication, and the collection and processing of information” (Gordon 2016, 1). He also points out that the employment share of new firms (a potent source of new technologies and creative destruction) and initial public share offerings have been in decline in the United States since 2000.
� Is a fourth industrial revolution that will fundamentally transform economies and societies now under way?
7 ThE DigiTal Economy Bank of Canada Review • SpRing 2017
Transformative Effects at the Firm and Industry LevelsAcross industries, digital technologies have the potential to drive efficien-cies, provide opportunities for firms to increase earnings and market share, and facilitate ongoing innovation. It is still unclear, however, whether and when these predictions will be borne out empirically. For example, signs of business dynamism, such as new firm entry and new entrepreneurs, remain in long-term decline in both the United States and Canada (Davis and Haltiwanger 2014; Cao et al. 2015).
Digitalization can be measured using the following attributes:9
(i) Ubiquity—the extent to which consumers and enterprises have universal access to digital services and applications;
(ii) Affordability—the extent to which digital services are priced in a range that makes them available to as many people as possible;
(iii) Reliability—the quality of available digital services;
(iv) Speed—the extent to which digital services can be accessed in real time;
(v) Usability—the ease of use of digital services and the ability of local ecosystems to boost adoption of these services; and
(vi) Skill—the ability of users to incorporate digital services into their lives and businesses.
According to Van Ark (2016), only a limited number of firms in the United States, the United Kingdom and Germany have made a full transition to the digital economy. As a result, few sectors and industries have seen large productivity gains to date. He suggests that advanced economies are still in an installation phase, a lengthy period during which new technologies emerge and advance, driven by new and superior ways of doing things, disrupting established practices and organizations. Efficiency gains may not arise until a deployment phase, when the new technologies are widely used and fully entwined both within firms and in their relationships with customers and suppliers. Innovations in the installation phase do not diffuse rapidly across all firms in an industry because successful first movers, in terms of early adoption, are limited as a result of an ongoing battle between new and old technologies and their applications. Schumpeter (1939, 1947) argues that the process of “creative destruction” could initially cause slower poten-tial economic growth, in part reflecting the structural displacement of labour (Keynes 1930).10
We now discuss how new digital technologies are challenging existing sys-tems of production, for example, in retail, wholesale, logistics, construction and automotive industries.
9 Katz and Koutroumpis (2013) construct a digitalization index across 150 countries using these attrib-utes. In their study, Canada placed tenth, after the United States, which placed sixth, in rankings associated with digitalization. In recent years, these “advanced” digitalized nations have improved ICT usability, developed skilled labour to take advantage of available technologies, and improved the speed and quality of digital services.
10 According to Schumpeter (1994, 82–83), creative destruction describes the “process of industrial muta-tion that incessantly revolutionizes the economic structure from within, incessantly destroying the old one, incessantly creating a new one.” Keynes (1930, 358–373) introduces the concept of “technological unemployment” as the situation where the “means of economising the use of labour outrun the pace at which we can find new uses for labour.”
� The process of “creative destruction” could initially cause slower potential economic growth, in part reflecting the structural displacement of labour
8 ThE DigiTal Economy Bank of Canada Review • SpRing 2017
Retail and wholesaleIn both the retail and wholesale sectors of the economy, sensors, AI and machine learning allow retailers and wholesalers to manage their inven-tories, e-commerce strategies (e.g., pricing) and activities across a network of physical and virtual stores and storage facilities in real time and in a semi-autonomous fashion. Arthur (2011, 2) suggests that more and more “large and fairly complicated conversations . . . occur entirely among things remotely talking to other things: servers, switches, routers, and other Internet and telecommunication devices, updating and shuttling information back and forth.”
Social media networks are transforming the retail sector. The benefits of firms’ social media engagement include providing information to consumers, generating customer feedback, acquiring new customers and driving sales from existing customers. Consumers today, with the assistance of new digital technologies, benefit from greater visibility of real-time prices, improved convenience and new opportunities for cross-border purchasing, which can potentially enhance competition and the welfare of its consumers (Reynolds and Cuthbertson 2014).
LogisticsAs retail and wholesale sectors of the economy are transformed by digital technologies, closely related industries, such as logistics, face a similar transformation. The logistics industry might have been thought to suffer as email traffic and digital downloads replaced physical products over the past two decades, but, in fact, more packages than ever before are now being shipped around the globe. On any single day, about 85 million packages and documents are delivered around the world (World Economic Forum [WEF] 2016a). Still, the industry faces significant inefficiencies—for example, 50 per cent of trucks travel empty on their return journey after making a delivery.
There is a race within the logistics industry to eliminate inefficiencies.11 Firms continue to build digitally enabled platforms that decentralize monitoring and control. Information and analytical services that rely on the simultane ous application of cloud-based computer analysis, sensors and the Internet of Things, for example, have positioned data at the heart of the logistics busi-ness. The objective is to detect and predict problems and to optimize deci-sion making. These information services also help reduce operating costs while improving the efficiency of operations. In the future, new delivery capabilities, such as self-driving vehicles and drones, could allow logistics firms to deliver shipments more efficiently (WEF 2016a).
ConstructionBuilding information modelling (BIM) has gained popularity in the construc-tion industry as broadband Internet speeds have increased and computer processing power has improved. In BIM, a digital representation of the physical and functional characteristics of a building extends traditional two-dimensional technical drawings even beyond three dimensions, supple-menting a building’s representation with time and cost as fourth and fifth
11 Earlier advances associated with ICT investment in the logistics industry were one of the main factors contributing to the development of global value chains and the expansion of global trade in recent decades.
� Social media networks are transforming the retail sector
� Data are at the heart of the logistics business
9 ThE DigiTal Economy Bank of Canada Review • SpRing 2017
dimensions. The most important aspect of BIM software is that it defines objects in such a way that if one is amended by an individual participant, related objects will automatically change.
Virtual and augmented reality devices may be connected to BIM software to demonstrate the design and provide progress reports throughout the life of the project, allowing stakeholders to be more engaged. Through mobile connectivity, firms can further engage with their workers with real-time com-munications. In the construction industry, 3D printing technologies are now used to fabricate buildings and construction components. Machines are integrated into production lines featuring additive, subtractive and formative manufacturing processes. Potential advantages include faster construction, lower labour costs, increased complexity and/or accuracy and less waste. Still, 3D printing is at an early stage of development. A number of issues persist, including the fact that large-scale printing jobs are slow and often produce uneven results (WEF 2016b).
AutomotiveOver the past decade, automotive manufacturers have strategically decen-tralized their production process to reduce their costs and mitigate risks. Supply chains in the industry are sometimes characterized “as a complex structure, aimed at getting the right parts into the right factories at the right time” WEF (2016c, 14). Low-cost sensors, wireless mobility and advanced analytics are enhancing the efficiency of the automobile supply chain by improving transparency across connected manufacturers and by gathering and analyzing data to reduce long lead times. Much of this integration along the supply chain is facilitated through cloud computing, which enables upstream and downstream firms in the chain to look at the same data, cre-ating more efficiency and stability throughout the chain.
Effects on the MacroeconomyProductivityProductivity isn’t everything, but in the long run it is almost everything. A country’s ability to improve its standard of living over time depends almost entirely on its ability to raise output per worker. (Krugman 1997, 11)12
Productivity is the efficiency with which an economy transforms inputs into outputs. Growth accounting provides a systematic way of thinking about the possible channels through which firms’ investments in digital technologies could affect productivity.13 Growth in labour productivity, or GDP per unit of hour worked, can be defined as the weighted14 sum of the following:
(i) Capital deepening—growth in capital input per hour;
(ii) Labour quality improvements—increases in how productive each unit of labour is, which is a function of the age and skill levels of the workforce; and
(iii) Multi-factor productivity (MFP) growth—output growth that is unexplained by (i) and (ii).
12 Terms-of-trade movements (which are generally viewed as driven by external forces) can also have important impacts on living standards in small open economies like Canada.
13 Growth accounting relies on strict neoclassical assumptions (e.g., separability of inputs, constant returns to scale, no adjustment costs, competitive factor markets and efficient firms) as well as cor-rectly measured inputs and outputs. Violations of these assumptions can show up as multi-factor productivity. See Baldwin et al. (2014) and Baldwin and Gu (2013) for details.
14 The weights correspond to each factor’s revenue share of total output.
� Three-dimensional printing technologies are now used to fabricate buildings and construction components
� Low-cost sensors, wireless mobility and advanced analytics are enhancing the efficiency of the automobile supply chain
10 ThE DigiTal Economy Bank of Canada Review • SpRing 2017
Investments in digital technologies contribute to higher productivity by providing workers with more tools to do their work. The production process becomes more capital intensive. Falling prices for digital technologies provide encouragement for firms to modernize their equipment so they can achieve cost efficiencies and enhanced capabilities.
Another channel by which investments in digital technologies could raise productivity is through higher MFP growth. MFP captures a wide range of other potential influences on labour productivity. These include techno-logical change (to the extent this is not measured by capital intensity), dynamic reallocation (the economy’s ability to shift outputs and inputs to achieve best use, including through firm entry, exit or reorganization, outsourcing and offshoring) and economies of scale (the ability to produce more output with fewer inputs, such as through increased specialization of individual aspects of the production process). For example, firms may find subcontracted cloud computing capacity or on-demand software more scalable and flexible than maintaining in-house servers and software. The diffusion of digital technologies has the potential to disrupt business models, shift resources from old to new systems of production, spur the development of new products and services, and engender greater special-ization and economies of scale.
The experience of the ICT revolution may offer lessons for how this diffu-sion process plays out. Studies directly estimating the impact of firms’ ICT investments on productivity typically find that a 10 per cent increase in ICT investment raises output by around 0.5 to 0.6 per cent (Cardona, Kretschmer and Strobel 2013).15 Bloom, Sadun and Van Reenen (2012) and Van Reenen et al. (2010) find that firms with high-quality management and organizational practices, and employing or having access to skilled labour (“talent”), tend to reap large productivity benefits from their investments in ICT. The agility of such firms enables them to successfully utilize their ICT investments to see and pursue opportunities for sales growth, process redesign and production efficiencies. Firms that are intensive users of technology tend to grow faster than other types of firms and survive, leading to resource reallocation across the economy. The corollary is that investments in organizational, human and ICT capital should be seen as investments in complementary factors of production.16
Nevertheless, there are reasons to be cautious about the likelihood of Canada seeing sizable MFP gains from the diffusion of digital technologies. Canadian MFP growth has consistently lagged that of the United States since the 1960s and fell further behind during the ICT revolution (Baldwin et al. 2014; Baldwin and Gu 2013). Lagging MFP growth accounts for most of the differential in Canada–United States labour productivity levels. Bibbee (2012) finds that MFP differentials with the United States are widely spread across industries and are largest in sectors that are sheltered (utilities, information and culture, arts and entertainment) and knowledge-intensive and dynamic (professional, scientific and technical services and high-tech
15 These studies estimate the productivity effects of ICT investments. In the digital era, ICT investments might have different impacts on productivity and across industries because of the automation of cogni-tive and non-routine tasks.
16 Bloom and Van Reenen (2010) identify 10 factors associated with better management practices across firms and countries. “Management and organisational practices of the firms such as people manage-ment (better hiring, firing, promotion and pay practices) and decentralisation (giving more power to employees further down the managerial hierarchy) appear complementary with ICT. Additionally, skills appear to be very complementary with ICT” (Van Reenan et al. 2010, 13–14). Van Reenen et al. (2010) find that about half of the productivity performance differential between the United States and Europe during the ICT revolution can be accounted for by firm-level differences in organizational capital.
� Investments in organizational, human and information and communications technology capital should be seen as investments in complementary factors of production
11 ThE DigiTal Economy Bank of Canada Review • SpRing 2017
manufacturing). Impediments to firm growth, resource mobility and innova-tion, as discussed by Bibbee (2012), could affect Canada’s ability to benefit from the use of digital technologies relative to other countries.
Labour marketsDigitalization could have wide-ranging implications for the labour market. Some occupations will see significantly higher wages as a result of increased labour demand for scarce skills. New and more specialized occu-pations that complement technology will emerge. Other occupations will become redundant as a result of automation.17 Frey and Osborne (2017) discuss a wide range of occupations that could be affected by the auto-mation of both routine and non-routine tasks. Occupations most susceptible to automation involve transportation and logistics; office and administrative support; and factory, sales and service jobs that do not involve high-level social skills (the ability to build relationships and navigate social environ-ments) or a variety of tasks. Occupations least susceptible to automation involve creative and social skills, persuasion, negotiation, originality or com-plementarities with technology. Examples include most jobs in education, (non-diagnostic) health care, management, business, finance, sports and arts, mathematics, science and engineering.
Technology-driven changes in the distribution of employment across occu-pations are not new, but they could become more pressing and widespread in years to come.18 Green and Sand (2015) show that the United States, Europe and Canada have seen rises in the share of employment in high- and low-skill jobs since the 1970s. Specifically, employment shares have risen for high-skill management, professional and technical occupations and for low-skill sales and service occupations. Meanwhile, employment shares have fallen for mid-skill occupations in production, crafts and operations and, since the 1990s, for secretaries and clerical support.19 These trends have contributed to a polarization of the United States labour market since the 1970s. Canada’s experience was similar over the three decades before 2000. After roughly 2000, however, the resource boom appears to have dominated the effects arising from technological change in Canada (Green and Sand 2015).20 The ending of the resource boom could see technology-driven changes become more important in determining Canadian employ-ment outcomes.
17 Industrial robots—autonomous machines programmed to perform a range of manual tasks—provide a case in point. Boston Consulting Group (2015, 3) projects that “growth in the global installed base of advanced robotics will accelerate from around 2 to 3 percent annually today to around 10 percent annually during the next decade,” resulting in the share of industrial tasks performed by robots rising from 10 to 25 per cent globally by 2025. Acemoglu and Restrepo (2017) evaluate the equilibrium impact of increased industrial robot usage on United States local labour markets between 1990 and 2007. They find large and robustly negative net impacts on employment and wages. The displacement of labour (especially routine manual jobs) was not offset by increased labour demand in other industries and occupations during the period.
18 These challenges have echoes of the past. As Tugwell (1931, 227) wrote, “In any new regime in which machines and power play a greater role than they do even today, men will not have become useless; but the nature of their tasks will have changed. It is man’s destiny to perform those functions which machines can never do—the thinking and contriving ones. We shall be on the way to that destiny for a very long time, with various ups and downs during the transition. Our task is the double one of speeding the process and of taking precautions meanwhile against unnecessary personal and family loss and suffering. We are not excused from these duties in any case; and ways will somehow be found to meet them; they may be better or worse ways, but human revolt against intolerable conditions will insure some sort of action.”
19 The decline in the employment share for secretarial and clerical support jobs coincides with the ICT revolution’s transformation of the office environment.
20 Green and Sand (2015) suggest that after 2000, because of job opportunities during the resource boom in Canada, low-skilled workers were not pushed into sales and service sector jobs to the same extent as they were in the United States.
� New and more specialized occupa-tions that complement technology will emerge. Other occupations will become redundant. Occupations least susceptible to automation involve creative and social skills, persuasion, negotiation, origin-ality or complementarities with technology.
12 ThE DigiTal Economy Bank of Canada Review • SpRing 2017
Recent evidence also suggests that technological changes contribute to a declining share of total national income paid to labour. Autor et al. (2017) find that many product markets in the United States increasingly exhibit “winner takes most” competition. Across a wide range of industries since the early 1980s, sales have become increasingly concentrated among a small number of highly profitable firms with a low labour share. These “superstar” firms exhibit high capital- and technology-intensity, high productivity or superior product offerings. Industries that became more concentrated over 1982–2012 saw faster productivity growth (as measured by output per worker, value-added per worker, MFP or patents per worker) and a more pronounced decline in the share of income paid to labour.21
Inflation and monetary policyStructural changes in the Canadian economy resulting from digitalization will take many years to play out. Though it is too early to offer conclusions about what these transitions mean for inflation dynamics, we can start to trace some possible channels for further investigation. The Riksbank (2015) identified three potential (and interrelated) channels by which digitalization could affect inflation: (i) productivity and cost structures, (ii) competition and market structures, and (iii) direct effects on the components of the con-sumer price index (CPI).
First, digitalization may raise productivity and potential output growth. All else being equal, a higher rate of potential output growth requires a higher neutral policy rate to achieve the inflation target (Mendes 2014). As dis-cussed earlier, productivity gains could arise through firms applying more capital to the production process (capital deepening) or finding cheaper and better ways to combine capital and labour (higher MFP). Canada could also benefit indirectly to the extent that digitalization leads to faster world growth. However, in the transition to the digital economy, there could be an increase in skill mismatches and long-term unemployment (e.g., among older workers in occupations that become obsolete) and slower potential output growth. Shifts in wealth and income distributions could also have implications for macroeconomic dynamics.22
A related issue is the “mismeasurement hypothesis,” which states that technological change is accelerating but is not fully reflected in produc-tivity statistics (e.g., Brynjolfsson and McAfee 2014). It is argued that this is because official statistics fail to fully capture quality improvements in new ICT goods and services and ignore the benefits to consumers from freely available products (e.g., digital photos, social media and online encyclopaedias).23 However, Syverson’s (2016) empirical study finds these measurement issues explain very little of the post-2004 productivity slow-down across advanced economies, suggesting they have not necessarily become more germane over time.24
21 The industries examined by Autor et al. (2017) are manufacturing, retail trade, wholesale trade, ser-vices, finance, and utilities and transportation.
22 For example, see Kaplan, Moll and Violante (2016).
23 See Dervis and Qureshi (2016).
24 Moreover, Gordon (2014a, 2) points out that “[R]eal GDP measures have always missed vast amounts of consumer surplus since the dawn of the first industrial revolution almost three centuries ago” and “No credit is given in real GDP for the safety, convenience, and brightness of the electric light, or the elevator, or air conditioning, or the replacement of the horse by the motor vehicle, or the end of the dismal task of cleaning the streets of horse manure, or of the epochal decline of infant mortality in the first half of the 20th century” (Gordon 2014b, 8).
13 ThE DigiTal Economy Bank of Canada Review • SpRing 2017
Second, there could be shifts in the intensity of competition, in market structures and in price-setting behaviour. E-commerce, high-speed connec-tivity and social media, for example, enable consumers to search, compare and make their purchases from anywhere in the world. This could lead to prices adjusting more quickly to market forces (becoming less “sticky”). Stronger import competition could also exert downward pressure on infla-tion. Some local firms may not survive these competitive pressures, while others will gain access to new markets as well as the opportunity to operate at a much greater scale. Canadian service exporters appear well-placed to benefit from these trends (Poloz 2016). However, digital technologies encourage networks and economies of scale, so it is also possible that they could encourage the concentration of market power among a few highly successful global firms (see Autor et al. 2017).
Third, there could be direct effects on components of the CPI as a result of falling production costs. These trends have been under way for some time (Riksbank 2015). However, price pressures for an increasing range of prod-ucts may be affected by the lower costs of digital-intensive production and distribution (e.g., online news, films and other services).
Finally, there are questions about how monetary policy should be conducted as the economy becomes more digital-intensive and service-oriented. The Bank targets inflation by adjusting the policy interest rate to minimize the gap between actual and potential output (the “output gap”) over time. Assessing the degree of excess capacity in the economy could become more difficult as its structure changes.25 As Poloz (2016, 6) notes, “In terms of economic models, it is worth considering whether the relationship between inflation and economic growth could change as the economy evolves. Certainly, the concept of an output gap is gradually changing, as services capacity depends mainly on people and skills rather than industrial capacity, while some parts of our old industrial capacity could become redundant in the face of major structural changes. The concept of invest-ment is shifting away from plants and machinery toward human capital. Even the concept of inventories is changing.”
ConclusionDigitalization could have wide-ranging effects across the economy. More and more business tasks that are currently done by humans will be exe-cuted electronically. Many of these processes will occur in digital form “‘speaking to’ other processes in the digital economy, in a constant conver-sation among multiple servers and multiple semi-intelligent nodes that are updating things, querying things, checking off things, readjusting things, and eventually connecting back with processes and humans in the physical economy” (Arthur 2011, 3).
The benefits of digitalization are likely to be greatest among firms with high levels of organizational and human capital that use knowledge intensively. However, there are few signs of accelerating productivity across advanced economies like Canada, even in economies that rank high in terms of overall measures of digitalization. It is possible that advanced economies are still in an “installation phase,” focused on finding new ways of doing things and disrupting established practices and organizations. Economy-wide produc-tivity gains might not arise until a “deployment phase” is reached, where new technologies and business processes are omnipresent.
25 See Ericsson (2016) on economic forecasting in the context of structural change.
� There could be shifts in the intensity of competition, in market structures and in price-setting behaviour
14 ThE DigiTal Economy Bank of Canada Review • SpRing 2017
We are only beginning to understand how the digital economy will function. To successfully manage the transition to digitalization, policy-makers will need to ensure that the economy is adaptable; that firms are encouraged by market forces to be agile; that economic gains are widely distributed; that the “various educational, apprenticeship, immigration and employment insurance programs all work well together with the on-the-job training com-mitments of employers” (Poloz 2016, 6); and that the tools (e.g., statistics, taxation, competition and industrial-relations policies) and associated insti-tutions to manage the economy are up-to-date and fit-for-purpose.
Literature CitedAcemoglu, D. and P. Restrepo. 2017. “Robots and Jobs: Evidence from
US Labor Markets.” Paper presented at the American Economic Association Annual Meeting, Chicago, January 7. Revised version avail-able at https://economics.mit.edu/files/12763.
Agrawal, A., J. S. Gans and A. Goldfarb. 2017. “What to Expect from Artificial Intelligence.” MIT Sloan Management Review 58 (3).
Arthur, W. B. 2011. “The Second Economy.” McKinsey Quarterly (October): 1–9.
Autor, D., D. Dorn, L. F. Katz, C. Patterson and J. van Reenen. 2017. “Concentrating on the Fall of the Labor Share.” National Bureau of Economic Research Working Paper No. 23108.
Baldwin, J. R. and W. Gu. 2013. “Multifactor Productivity Measurement at Statistics Canada.” The Canadian Productivity Review, Statistics Canada Catalogue No. 15-206-X, No. 31.
Baldwin, J. R., W. Gu, R. Macdonald and B. Yan. 2014. “Productivity: What Is It? How Is It Measured? What Has Canada’s Performance Been over the Period 1961 to 2012?” The Canadian Productivity Review, Statistics Canada Catalogue No. 15-206-X, No. 38.
Bibbee, A. 2012. “Unleashing Business Innovation in Canada.” OECD Economics Department Working Paper No. 997. Paris: OECD Publishing.
Bloom, N., R. Sadun and J. van Reenen. 2012. “Americans Do IT Better: US Multinationals and the Productivity Miracle.” American Economic Review 102 (1): 167–201.
Bloom, N. and J. van Reenen. 2010. “Why Do Management Practices Differ Across Firms and Countries?” Journal of Economic Perspectives 24 (1): 203–224.
Boston Consulting Group. 2015. The Robotics Revolution: The Next Great Leap in Manufacturing. Boston, Massachusetts.
Broadberry, S., B. M. S. Campbell and B. van Leeuwen. 2013. “When Did Britain Industrialise? The Sectoral Distribution of the Labour Force and Labour Productivity in Britain, 1381–1851.” Explorations in Economic History 50 (1): 16–27.
15 ThE DigiTal Economy Bank of Canada Review • SpRing 2017
Brynjolfsson, E. and A. McAfee. 2014. The Second Machine Age: Work, Progress, and Prosperity in a Time of Brilliant Technologies. New York: W. W. Norton & Company.
Cao, S., M. Salameh, M. Seki and P. St-Amant. 2015. “Trends in New Firm Entry and New Entrepreneurship in Canada.” Bank of Canada Staff Discussion Paper No. 2015-11.
Cardona, M., T. Kretschmer and T. Strobel. 2013. “ICT and Productivity: Conclusions from the Empirical Literature.” Information Economics and Policy 25 (3): 109–125.
Crafts, N. 2014. “Productivity Growth During the British Industrial Revolution: Revisionism Revisited.” CAGE Online Working Paper No. 204, Centre for Competitive Advantage in the Global Economy.
Davis, S. J. and J. Haltiwanger. 2014. “Labor Market Fluidity and Economic Performance.” National Bureau of Economic Research Working Paper No. 20479.
Derviş, K. and Z. Qureshi. 2016. “The Productivity Slump—Fact or Fiction: The Measurement Debate.” Brookings Global Economy and Development Working Paper.
Frey, C. B. and M. A. Osborne. 2017. “The Future of Employment: How Susceptible Are Jobs to Computerisation?” Technological Forecasting and Social Change 114 (C): 254–280.
Fung, B. and H. Halaburda. 2016. “Central Bank Digital Currencies: A Framework for Assessing Why and How.” Bank of Canada Staff Discussion Paper No. 2016-22.
Fung, B., M. Molico and Gerald Stuber. 2014. “Electronic Money and Payments: Recent Developments and Issues.” Bank of Canada Staff Discussion Paper No. 2014-2.
Gordon, R. J. 2014a. “The Demise of U.S. Economic Growth: Restatement, Rebuttal, and Reflections.” National Bureau of Economic Research Working Paper No. 19895.
—. 2014b. “A New Method of Estimating Potential Real GDP Growth: Implications for the Labor Market and the Debt/GDP Ratio.” National Bureau of Economic Research Working Paper No. 20423.
—. 2015. “Secular Stagnation: A Supply-Side View.” American Economic Review 105 (5): 54–59.
—. 2016. “Perspectives on the Rise and Fall of American Growth.” American Economic Review 106 (5): 72–76.
Green, D. A. and B. M. Sand. 2015. “Has the Canadian Labour Market Polarized?” Canadian Journal of Economics 48 (2): 612–646.
Ericsson, N. R. 2016. “Economic Forecasting in Theory and Practice: An Interview with David F. Hendry.” Board of Governors of the Federal Reserve System, International Finance Discussion Paper No. 1184.
Kaplan, G., B. Moll and G. L. Violante. 2016. “Monetary Policy According to HANK.” Council on Economic Policies, CEP Working Paper No. 2016/2.
16 ThE DigiTal Economy Bank of Canada Review • SpRing 2017
Katz, R. L. and P. Koutroumpis. 2013. “Measuring Digitization: A Growth and Welfare Multiplier.” Technovation 33 (10–11): 314–319.
Keynes, J. M. 1930. “Economic Possibilities for our Grandchildren.” In Essays in Persuasion, 358–373, New York: W.W. Norton & Co., 1963.
Krugman, P. 1997. The Age of Diminished Expectations. Cambridge: MIT Press.
Lev, B., S. Radhakrishnan and P. C. Evans. 2016. Organizational Capital: A CEO’s Guide to Measuring and Managing Enterprise Intangibles. Measuring and Managing Organizational Capital Series No. 1. New York: The Center for Global Enterprise.
Mendes, R. R. 2014. “The Neutral Rate of Interest in Canada.” Bank of Canada Staff Discussion Paper No. 2014-5.
Organisation for Economic Co-operation and Development. 2016. OECD Compendium of Productivity Indicators 2016. Paris: OECD Publishing.
Poloz, S. S. 2016. “From Hewers of Wood to Hewers of Code: Canada’s Expanding Service Economy.” Speech to the C.D. Howe Institute, Toronto, 28 November.
Reynolds, J. and R. Cuthbertson. 2014. Retail & Wholesale: Key Sectors for the European Economy: Understanding the Role of Retailing and Wholesaling Within the European Union. Oxford Institute of Retail Management, Saïd Business School, University of Oxford.
Riksbank. 2015. “Digitisation and Inflation.” Monetary Policy Report (February): 55–59.
Schumpeter, J. A. 1939. Business Cycles: A Theoretical Historical and Statistical Analysis of the Capitalist Process. New York: McGraw-Hill Book Company.
—. 1947. “The Creative Response in Economic History.” Journal of Economic History 7 (2): 149–159.
—. 1994. Capitalism, Socialism and Democracy. London: Routledge.
Schwab, K. 2016. The Fourth Industrial Revolution. Geneva: World Economic Forum.
Syverson, C. 2016. “Challenges to Mismeasurement Explanations for the U.S. Productivity Slowdown.” National Bureau of Economic Research Working Paper No. 21974.
Temin, P. 1997. “Two Views of the British Industrial Revolution.” Journal of Economic History 57 (1): 63–82.
Tugwell, R. G. 1931. “The Theory of Occupational Obsolescence.” Political Science Quarterly 46 (2): 171–227.
Van Ark, B. 2016. “The Productivity Paradox of the New Digital Economy.” International Productivity Monitor 31: 3–18.
Van Reenen, J., N. Bloom, M. Draca, T. Kretschmer, R. Sadun, H. Overman and M. Schankerman. 2010. The Economic Impact of ICT: Final Report. London: Centre for Economic Performance, SMART N. 2007/0020.
17 ThE DigiTal Economy Bank of Canada Review • SpRing 2017
Varian, H. 2016. “Intelligent Technology.” Finance and Development 53 (3): 6–9.
World Economic Forum (WEF). 2016a. Digital Transformation of Industries: Logistics Industry. World Economic Forum White Paper. Prepared in collaboration with Accenture.
—. 2016b. Shaping the Future of Construction: A Breakthrough in Mindset and Technology. Prepared in collaboration with the Boston Consulting Group.
—. 2016c. Digital Transformation of Industries: Automotive Industry. World Economic Forum White Paper. Prepared in collaboration with Accenture.
18 ThE DigiTal Economy Bank of Canada Review • SpRing 2017
Unconventional Monetary Policy: The Perspective of a Small Open EconomyJean-Sébastien Fontaine, Financial Markets Department; Lena Suchanek and Jing Yang, Canadian Economic Analysis Department
� Quantitative easing (QE) and negative interest rates have been imple-mented by several central banks in small open economies (SOEs). Theseunconventional policy tools can be effective in easing financial conditions and also appear to stimulate aggregate demand and inflation.
� Negative rates operate as a continuation of conventional monetary policy,although the pass-through to consumer and business borrowing ratesmay be only partial when rates are low or negative.
� QE in an SOE may operate mainly by lowering the exchange rate and theexpected path of policy rates, but it may have less influence on the termpremium in long-term yields.
� Fiscal policy is a more important complement to monetary policy to sup-port growth when policy rates are close to zero. Fiscal policy may also bemore effective in an SOE if global demand for safe assets compresses long-term interest rates in the SOE and thus creates more fiscal space.
Since the Great Recession, several central banks have reduced their policy rates close to zero, which many consider is the boundary of conventional monetary policy.1 Several central banks also implemented unconventional monetary policies (UMPs), including those in some small open economies (SOEs). The Bank of England and the Swedish Riksbank, for example, purchased large quantities of government debt and other assets, a policy known as quantitative easing (QE), expanding their balance sheets to meet their inflation target. Central banks in Sweden, Switzerland and Denmark also have lowered policy rates below zero.
This article reviews the experience of central banks with UMPs in SOEs, focusing on QE and negative rates. A growing literature provides policy-makers with evidence that UMPs ease financial conditions. However, the
1 The term “conventional monetary policy” refers to adjusting the policy rate, whereas negative rates and QE are considered “unconventional monetary policies.” This article does not cover two other policies (forward guidance and credit easing) that can also be used to provide additional monetary stimulus at very low interest rates, discussed in the Bank of Canada Framework for Conducting Monetary Policy at Low Interest Rates (Bank of Canada 2015).
The Bank of Canada Review is published two times a year. Articles undergo a thorough review process. The views expressed in the articles are those of the authors and do not necessarily reflect the views of the Bank. The contents of the Review may be reproduced or quoted, provided that the publication, with its date, is specifically cited as the source.
19 UncOnvEnTiOnal MOnETary POlicy: ThE PErSPEcTivE Of a SMall OPEn EcOnOMy Bank of Canada Review • SpRing 2017
transmission of UMPs to financial conditions may depend on the size of the economy and how open it is to trade and capital flows.2 The evidence related to UMPs in the United States and the euro area may not apply to an SOE such as Canada. The experience of SOEs with UMPs and recent prog-ress shown in the literature can help inform policy deliberations in Canada.3 At the time of writing, the Bank of Canada does not use UMPs but judges that such tools can allow more room to manoeuvre, should more easing be required.
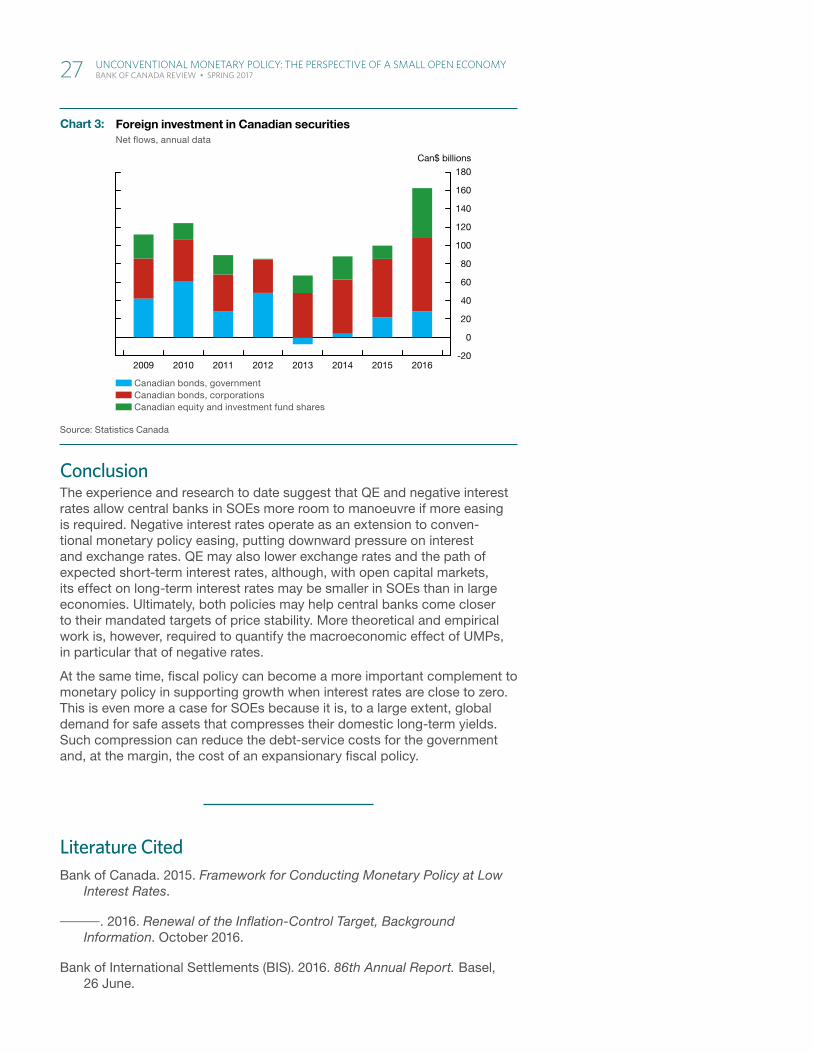
The mobility of capital across borders plays a distinct role when we evaluate the effect of UMPs. This is particularly relevant for SOEs if global demand for safe assets compresses interest rates, limiting the manoeuvring room of monetary policy. In this context, recent research suggests that fiscal expansion may complement monetary policies more effectively to sup-port economic activity. In fact, demand for safe assets may attenuate the classi cal trade-off between the expansionary effects of fiscal spending and the potential rise in interest rates resulting from excessive issuance of debt (Eggertsson et al. 2016; Farhi and Maggiori 2016).
Ultimately, central banks implement UMPs to help achieve their mandates, often spelled out in terms of price stability. While the macroeconomic impacts of UMPs are more difficult to quantify, Bank of Canada simula-tions suggest that UMPs would help close the output gap and lead inflation closer to its target when conventional monetary policy is at its limits (Bank of Canada 2016). With lower potential growth and lower neutral interest rates (Mendes 2014),4 UMP tools may be used more frequently than before.
Negative Interest Rates in a Small Open EconomyCentral banks in both large economies—such as Japan and the euro area—and small economies—such as Sweden, Denmark and Switzerland—lowered their policy rates below zero to help achieve their price stability mandates. Negative rates operate through the same channels as conven-tional monetary policy easing when interest rates are positive.
The interest rate channelLike conventional policy, reducing the policy rate below zero is expected to reduce other interest rates, thereby encouraging bank lending and easing debt-service costs. Modestly negative policy rates have been transmitted to money markets and longer-term yields in much the same way as positive rates. The impact on trading volumes appears to have been limited, while problems with instruments designed to work only with positive nominal interest have so far not materialized (Witmer and Yang 2016).
The transmission of a reduction of a low or negative policy rate to other interest rates may, however, have become weaker. Private banks have been hesitant to charge negative retail deposit rates, and some have even increased mortgage rates (Bech and Malkhozov 2016). The benefits of this policy for domestic financial conditions could moreover decline over time (BIS 2016). In particular, negative rates can weigh on bank profitability and
2 The trade openness of a country is frequently measured by the sum of its exports and imports as a share of its GDP. The United States is relatively closed (28 per cent in 2015) compared with Canada (66 per cent).
3 The Bank of Canada hosted a conference in November 2016 that brought together academic scholars and monetary authorities from around the world to discuss UMPs in the context of SOEs. The confer-ence material can be found on the Bank’s website.
4 Based on Mendes (2014), the lower estimates of the neutral rate are largely due to a lower global neutral rate and weaker potential output growth in Canada.
� The experience of small open economies with unconventional monetary policies and recent progress shown in the literature can help inform policy deliberations in Canada
� Negative policy rates have been passed through to other interest rates in much the same way as positive rates, but transmission may have become weaker
20 UncOnvEnTiOnal MOnETary POlicy: ThE PErSPEcTivE Of a SMall OPEn EcOnOMy Bank of Canada Review • SpRing 2017
undermine banks’ ability to provide the credit needed to support growth. Negative rates could also jeopardize financial stability if financial institutions take more risks to boost returns (Cœuré 2016).
That said, for banks, the beneficial effects of a stronger economy may support profit margins, outweighing the negative effects. Evidence to date suggests limited adverse effects of negative rates on bank profitability (Turk 2016). Trends in credit growth also seem stable, while bank stocks continue to perform relatively well. Although modestly negative interest rates appear to be a helpful addition to a central bank’s tool kit, this policy is limited: lowering interest rates below some point could cause people to withdraw their deposits from banks to hold currency (Witmer and Yang 2016).
Implementing negative policy rates has been more complex than con-ventional monetary policy easing. Specifically, central banks in Denmark, Switzerland and Japan have exempted part of the excess reserves at their respective central banks from being subject to negative rates. The exemp-tions limit the impact of negative interest rates on banks’ profit margins while still allowing transmission to bond yields and other market-based rates. Hence, a negative rate can still reduce interest rate differentials between countries, thereby discouraging foreign investment in domestic capital markets. This would leave the effectiveness of this policy through the exchange rate channel unaffected.
The exchange rate channelSOEs such as Denmark, Sweden and Switzerland faced upward pressure on the exchange rates with the euro as a result of persistent monetary easing by the European Central Bank. Negative policy rates allowed these SOEs to restore or maintain interest rate differentials.5 The policy was designed to discourage capital inflows, to limit or stop the appreciation pressures on the exchange rate and, in turn, to help support external demand for domestic goods and services (Jackson 2015; Witmer and Yang 2016).
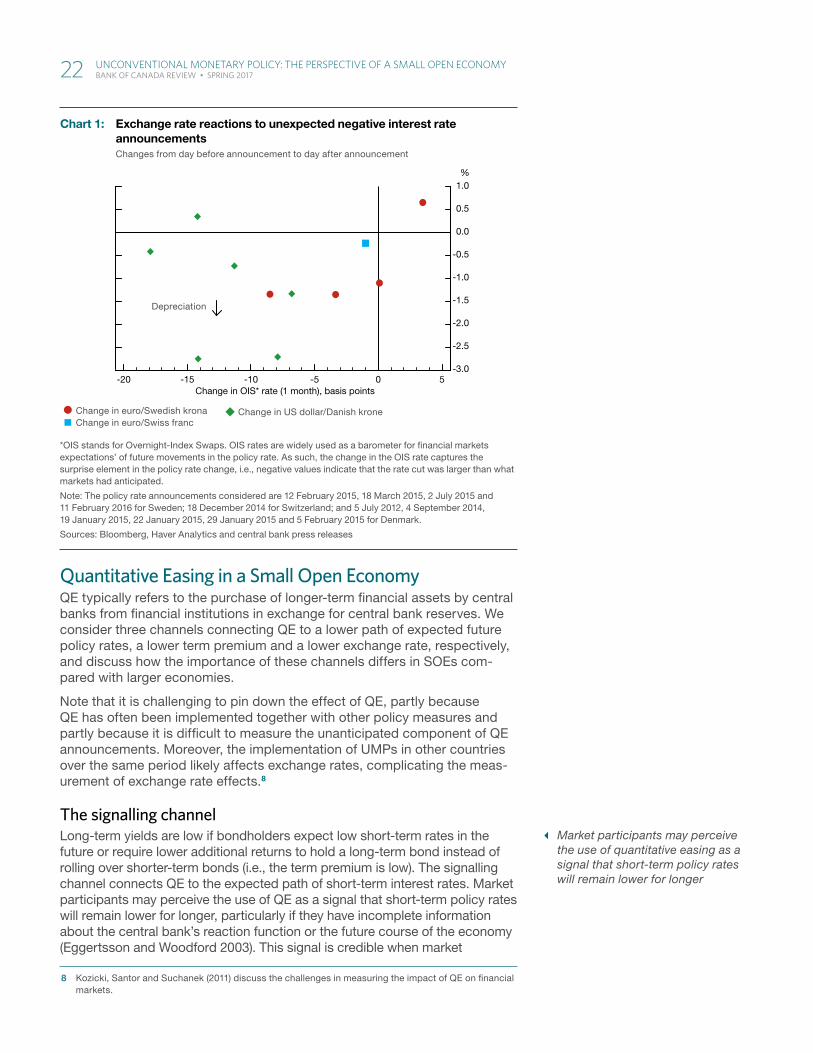
The exchange (i.e., external) rate channel indeed appears to function well with negative policy rates. Currencies tended to depreciate when negative interest rates were announced (Chart 1), and appreciation pressures appeared to recede (Jordan 2016; Viñals, Gray and Eckhold 2016). When Denmark lowered its policy rate in an attempt to maintain its fixed exchange rate (against the euro), for example, it effectively saw the appreciation pres-sure on its currency diminish. For the Swiss National Bank, the cut to nega-tive policy rates temporarily helped relieve appreciation pressure on the Swiss franc and sustain its floor with the euro, though policy rate cuts have ultimately been insufficient to prevent the Swiss franc’s appreciation. Without such policies, however, currencies may have appreciated by even more (Jordan 2016). Interestingly, other European SOEs have reportedly con-sidered cutting policy interest rates to negative levels to restrain capital inflows and appreciating currencies.6 A recent Bloomberg survey found that economists believe that a negative rate works better in SOEs dealing with foreign exchange pressures than in larger economies hoping to boost growth or stem falling prices (Tartar 2016).7
5 Denmark and Switzerland also directly intervened in currency markets to stem appreciation pressures, while the Swedish Riksbank stood ready to intervene.
6 Former Czech National Bank Board member Lubomír Lízal had mentioned that the central bank may impose negative interest rates to fend off unwanted capital inflows once the koruna cap was discon-tinued (Gokoluk and Chamonikolas 2016).
7 This belief partly reflects the limited evidence of accelerating inflation in the euro area throughout 2015, i.e., following its negative rate policy.
� Currencies tended to depreciate when negative interest rates were announced, and appreciation pressures appeared to recede
21 UncOnvEnTiOnal MOnETary POlicy: ThE PErSPEcTivE Of a SMall OPEn EcOnOMy Bank of Canada Review • SpRing 2017
Quantitative Easing in a Small Open EconomyQE typically refers to the purchase of longer-term financial assets by central banks from financial institutions in exchange for central bank reserves. We consider three channels connecting QE to a lower path of expected future policy rates, a lower term premium and a lower exchange rate, respectively, and discuss how the importance of these channels differs in SOEs com-pared with larger economies.
Note that it is challenging to pin down the effect of QE, partly because QE has often been implemented together with other policy measures and partly because it is difficult to measure the unanticipated component of QE announcements. Moreover, the implementation of UMPs in other countries over the same period likely affects exchange rates, complicating the meas-urement of exchange rate effects.8
The signalling channelLong-term yields are low if bondholders expect low short-term rates in the future or require lower additional returns to hold a long-term bond instead of rolling over shorter-term bonds (i.e., the term premium is low). The signalling channel connects QE to the expected path of short-term interest rates. Market participants may perceive the use of QE as a signal that short-term policy rates will remain lower for longer, particularly if they have incomplete information about the central bank’s reaction function or the future course of the economy (Eggertsson and Woodford 2003). This signal is credible when market
8 Kozicki, Santor and Suchanek (2011) discuss the challenges in measuring the impact of QE on financial markets.
� Market participants may perceive the use of quantitative easing as a signal that short-term policy rates will remain lower for longer
File information (for internal use only): Chart 1 - BOCR - 2017-05 - Article 3 - Chart 1 - EN.indd
Last output: 01/06/16 - 02:21PM
Chart 1: Exchange rate reactions to unexpected negative interest rate announcementsChanges from day before announcement to day after announcement
Change in euro/Swedish kronaChange in euro/Swiss franc
Change in US dollar/Danish krone
*OIS stands for Overnight-Index Swaps. OIS rates are widely used as a barometer for � nancial markets expectations’ of future movements in the policy rate. As such, the change in the OIS rate captures the surprise element in the policy rate change, i.e., negative values indicate that the rate cut was larger than what markets had anticipated.
Note: The policy rate announcements considered are 12 February 2015, 18 March 2015, 2 July 2015 and 11 February 2016 for Sweden; 18 December 2014 for Switzerland; and 5 July 2012, 4 September 2014, 19 January 2015, 22 January 2015, 29 January 2015 and 5 February 2015 for Denmark.
Sources: Bloomberg, Haver Analytics and central bank press releases
22 UncOnvEnTiOnal MOnETary POlicy: ThE PErSPEcTivE Of a SMall OPEn EcOnOMy Bank of Canada Review • SpRing 2017
participants believe that the central bank weighs potential capital losses on its holdings of long-term assets, which would follow from raising interest rates.
The signal from QE announcements is similar to forward guidance statements by the central bank about the path of short-term interest rates.9 Indeed, using QE and forward guidance together may reinforce credibility (Santor and Suchanek 2016 and references therein). The lower perceived path of future policy rates also affects the exchange rate, discussed below.
The signalling channel operates in large and small economies alike. The signalling effect of QE can be measured directly from changes in short-term interest rates around QE announcements. For longer maturities, the signalling component must be derived from interest rate models to separate concurrent changes in the term premium.10 Estimates differ and may be imprecise, but the evidence suggests that QE announcements affect the expected path of policy rates in large economies (Swanson 2015). In fact, the magnitude of the estimates suggests that the effect is similar to that of conventional policy announcements.
The limited evidence for SOEs appears consistent with this conclusion (De Rezende 2016). For example, Diez de los Rios and Shamloo (forthcoming) estimate that bond purchases in Sweden lowered the expected path of future policy rates, mainly in the intermediate segments of the yield curve (two to five years).
The exchange rate channelJust like conventional monetary policy, the signalling channel of QE lowers domestic interest rates relative to foreign rates, which tends to depreciate the exchange rate. In response to QE, investors may also rebalance their domestic portfolio toward foreign assets, which puts additional downward pressure on the exchange rate.
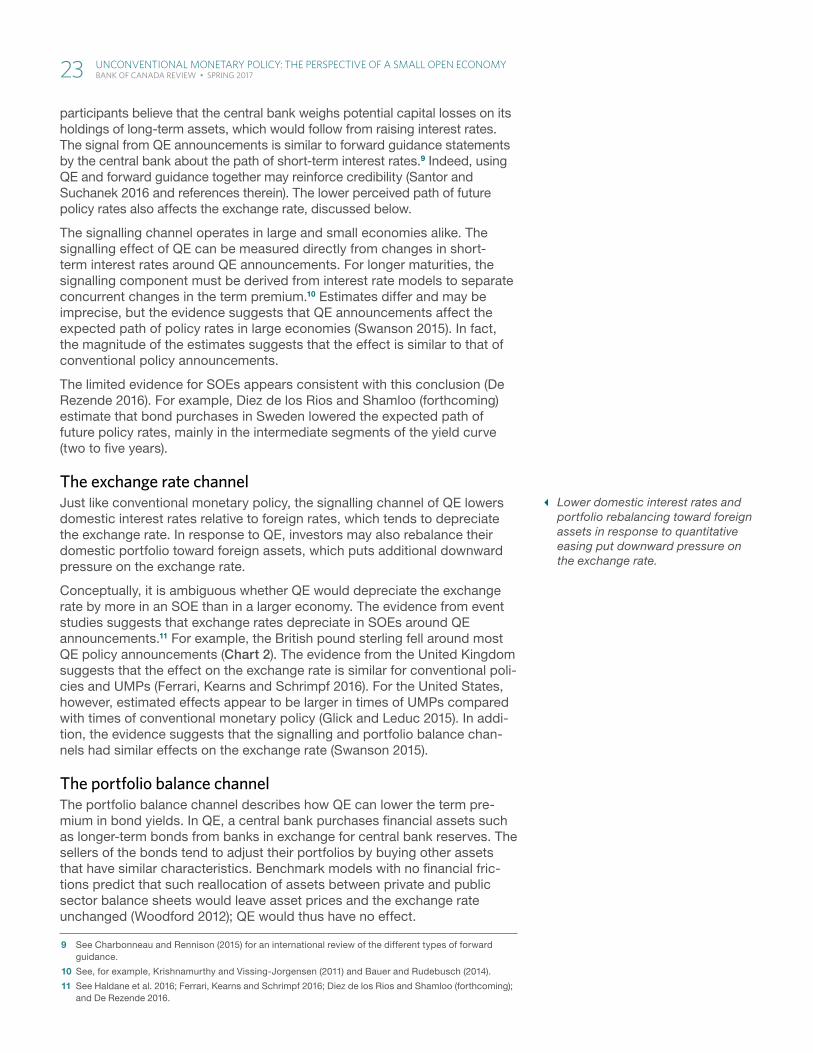
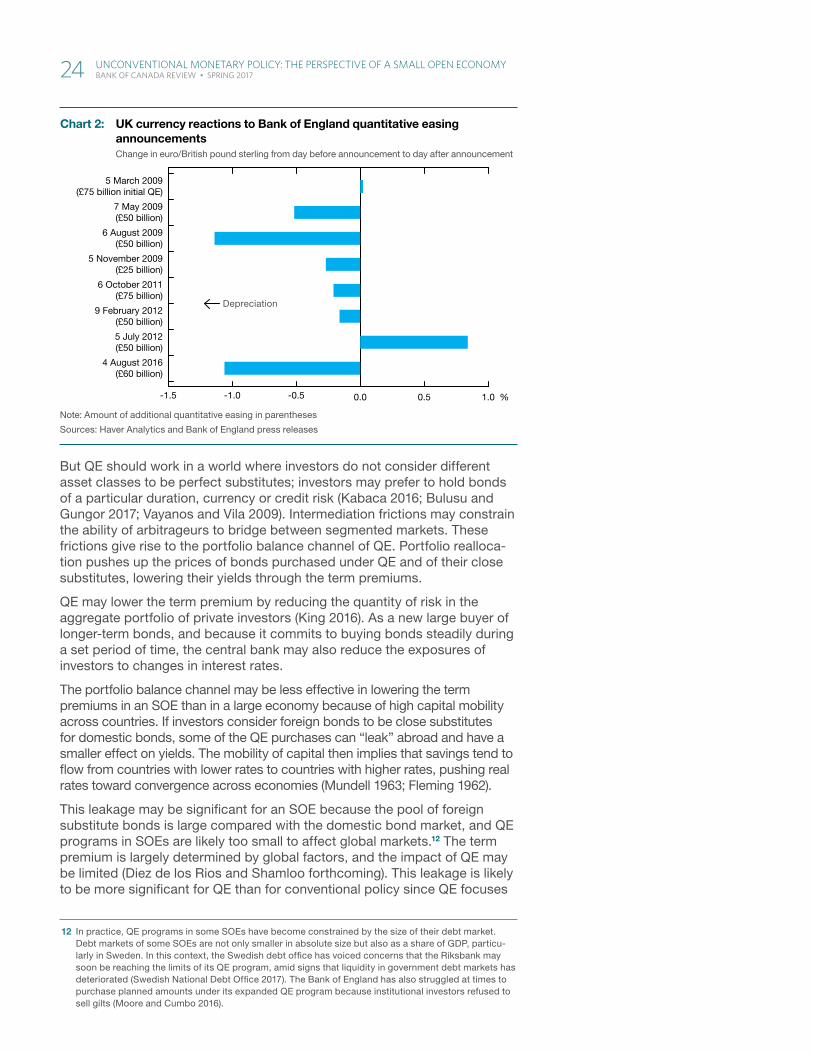
Conceptually, it is ambiguous whether QE would depreciate the exchange rate by more in an SOE than in a larger economy. The evidence from event studies suggests that exchange rates depreciate in SOEs around QE announcements.11 For example, the British pound sterling fell around most QE policy announcements (Chart 2). The evidence from the United Kingdom suggests that the effect on the exchange rate is similar for conventional poli-cies and UMPs (Ferrari, Kearns and Schrimpf 2016). For the United States, however, estimated effects appear to be larger in times of UMPs compared with times of conventional monetary policy (Glick and Leduc 2015). In addi-tion, the evidence suggests that the signalling and portfolio balance chan-nels had similar effects on the exchange rate (Swanson 2015).
The portfolio balance channelThe portfolio balance channel describes how QE can lower the term pre-mium in bond yields. In QE, a central bank purchases financial assets such as longer-term bonds from banks in exchange for central bank reserves. The sellers of the bonds tend to adjust their portfolios by buying other assets that have similar characteristics. Benchmark models with no financial fric-tions predict that such reallocation of assets between private and public sector balance sheets would leave asset prices and the exchange rate unchanged (Woodford 2012); QE would thus have no effect.
9 See Charbonneau and Rennison (2015) for an international review of the different types of forward guidance.
10 See, for example, Krishnamurthy and Vissing-Jorgensen (2011) and Bauer and Rudebusch (2014).
11 See Haldane et al. 2016; Ferrari, Kearns and Schrimpf 2016; Diez de los Rios and Shamloo (forthcoming); and De Rezende 2016.
� Lower domestic interest rates and portfolio rebalancing toward foreign assets in response to quantitative easing put downward pressure on the exchange rate.
23 UncOnvEnTiOnal MOnETary POlicy: ThE PErSPEcTivE Of a SMall OPEn EcOnOMy Bank of Canada Review • SpRing 2017
But QE should work in a world where investors do not consider different asset classes to be perfect substitutes; investors may prefer to hold bonds of a particular duration, currency or credit risk (Kabaca 2016; Bulusu and Gungor 2017; Vayanos and Vila 2009). Intermediation frictions may constrain the ability of arbitrageurs to bridge between segmented markets. These frictions give rise to the portfolio balance channel of QE. Portfolio realloca-tion pushes up the prices of bonds purchased under QE and of their close substitutes, lowering their yields through the term premiums.
QE may lower the term premium by reducing the quantity of risk in the aggregate portfolio of private investors (King 2016). As a new large buyer of longer-term bonds, and because it commits to buying bonds steadily during a set period of time, the central bank may also reduce the exposures of investors to changes in interest rates.
The portfolio balance channel may be less effective in lowering the term premiums in an SOE than in a large economy because of high capital mobility across countries. If investors consider foreign bonds to be close substitutes for domestic bonds, some of the QE purchases can “leak” abroad and have a smaller effect on yields. The mobility of capital then implies that savings tend to flow from countries with lower rates to countries with higher rates, pushing real rates toward convergence across economies (Mundell 1963; Fleming 1962).
This leakage may be significant for an SOE because the pool of foreign substitute bonds is large compared with the domestic bond market, and QE programs in SOEs are likely too small to affect global markets.12 The term premium is largely determined by global factors, and the impact of QE may be limited (Diez de los Rios and Shamloo forthcoming). This leakage is likely to be more significant for QE than for conventional policy since QE focuses
12 In practice, QE programs in some SOEs have become constrained by the size of their debt market. Debt markets of some SOEs are not only smaller in absolute size but also as a share of GDP, particu-larly in Sweden. In this context, the Swedish debt office has voiced concerns that the Riksbank may soon be reaching the limits of its QE program, amid signs that liquidity in government debt markets has deteriorated (Swedish National Debt Office 2017). The Bank of England has also struggled at times to purchase planned amounts under its expanded QE program because institutional investors refused to sell gilts (Moore and Cumbo 2016).
File information (for internal use only): Chart 1 - BOCR - 2017-05 - Article 3 - Chart 2 - EN.indd
Last output: 01/06/16 - 02:21PM
Chart 2: UK currency reactions to Bank of England quantitative easing announcementsChange in euro/British pound sterling from day before announcement to day after announcement
Note: Amount of additional quantitative easing in parentheses
Sources: Haver Analytics and Bank of England press releases
%
5 March 2009(£75 billion initial QE)
7 May 2009(£50 billion)
6 August 2009(£50 billion)
5 November 2009(£25 billion)
6 October 2011(£75 billion)
9 February 2012(£50 billion)
5 July 2012(£50 billion)
4 August 2016(£60 billion)
-1.5 -1.0 -0.5 0.0 0.5 1.0
Depreciation
24 UncOnvEnTiOnal MOnETary POlicy: ThE PErSPEcTivE Of a SMall OPEn EcOnOMy Bank of Canada Review • SpRing 2017
on long-term bonds, while conventional policy focuses on money market instruments. Long-term bonds are likely to be closer substitutes across countries than money market instruments.
The degree of asset substitutability and the size of an economy therefore determine to what extent QE can lower the term premium. Based on an SOE model calibrated for the case of Canada, Kabaca (2016) finds that the effect of QE on the term premium is only about one-third the effect of QE in a large economy, where the size of QE is kept to a fixed share of the government bond market in each country. The empirical evidence is consistent with these results. Estimates of the effect of QE on term premiums in the United Kingdom and Sweden are smaller than in larger economies, such as the United States (Diez de los Rios and Shamloo forthcoming).13
The Macroeconomic Effects of Unconventional Monetary PoliciesUltimately, central banks implement UMPs to help achieve their mandate, which, in most cases, is related to price stability. By easing financial condi-tions and lowering the exchange rate as described above, UMPs may boost demand, which tends to push up inflation. In particular, lower interest rates can encourage bank lending and ease debt-service costs, while a lower exchange rate can provide impetus to net exports. The exchange rate channel could play a greater role in supporting growth in SOEs such as Canada because foreign trade is a bigger share of the economy than it is for a larger economy.14
Bank of Canada simulations suggest that UMPs would indeed help close the output gap and move inflation closer to its target in periods when con-ventional monetary policy is at its limits (Bank of Canada 2016). The results imply that QE and negative rates would reduce both the risk and the dur-ation of a downturn when conventional monetary policy is constrained and would therefore reduce average output and inflation gaps.
Empirically, the effects of UMPs on inflation and economic activity are dif-ficult to measure because of the identification challenges and lagged effect of monetary policy. For QE, the evidence for SOEs is largely limited to the experience of the United Kingdom: the initial £200 billion of QE may have increased GDP growth by 0.8 to 3.3 per cent and contributed to higher inflation (Reza, Santor and Suchanek 2015 and references therein). The large intervals for these estimates speak to the degree of uncertainty about the actual effectiveness.
More recently, researchers have overcome some of the empirical chal-lenges by identifying QE shocks and estimating their effect in structural vector auto regressions (Haldane et al. 2016; Weale and Wieladek 2016). Encouragingly, the results suggest that the peak effects of QE on GDP in the United Kingdom were higher than in earlier studies. Theoretical research has also made some progress in assessing the effect of QE. Based on an SOE dynamic stochastic general-equilibrium (DSGE) model with imperfect sub-stitution across assets, Kabaca (2016) estimates that QE has a smaller effect
13 The estimated effects are not directly comparable because the relative size of different programs differs. However, QE programs were larger in most SOEs than in the United States, as a share of outstanding debt or GDP (Santor and Suchanek 2016).
14 In addition, depreciation has an immediate impact on inflation: the higher cost of imported goods will, at least temporarily, push up prices (Jordan 2016). Sustained depreciation driven by expansionary mon-etary policy may even affect inflation expectations and therefore real interest rates, potentially boosting the transmission to the real economy.
� The degree of asset substitutability and the size of an economy deter-mine to what extent quantitative easing can lower the term premium
� By easing financial conditions and lowering the exchange rate, unconventional monetary policies may boost demand, which tends to push up inflation
25 UncOnvEnTiOnal MOnETary POlicy: ThE PErSPEcTivE Of a SMall OPEn EcOnOMy Bank of Canada Review • SpRing 2017
on overall macroeconomic conditions in an SOE than it does in a larger economy (for a given size of QE normalized to the size of the government bond market). Of course, the results crucially depend on the parameters.
Evidence of the macro effects of negative rates remains sparse, however. More theoretical and empirical work is required to quantify the macro-economic effect of UMPs in an SOE and compare it with their effects in a large economy.
The Mix of Monetary and Fiscal Policy in a Small Open EconomyLower potential growth and lower neutral interest rates imply that con-ventional monetary policy will be closer to its limits more frequently than before.15 While the use of UMP tools may allow for more manoeuvering room for monetary policy-makers when additional stimulus is needed, the trans-mission of monetary policies—conventional and unconventional—appears to be partial when interest rates are approaching zero. This suggests that fiscal policy, or the combination of both fiscal and monetary stimulus, becomes more important. Indeed, fiscal policies may complement monetary policies more effectively to support economic activity when interest rates are low for an extended period.16 This is because the expansionary effects of fiscal policy are not offset by a rise in interest rates that would otherwise crowd out private investment and consumption.
Fiscal policy may also be more effective as a complement to monetary policy if global demand for safe assets compresses long-term interest rates and creates more fiscal space by reducing debt-service costs. This is particularly relevant in SOEs because interest rates in SOEs are more heavily influenced by global factors than those in a large economy (Bauer and Diez de los Rios 2012). Indeed, some SOEs, especially those with perceived safe assets, have seen large financial inflows, which may have contributed to compressing domestic interest rates. In particular, Canada’s government debt market has received large flows from international investors since the Great Recession (Chart 3). For example, Pomorski, Rivadeneyra and Wolfe (2014) document that foreign official reserve managers—who must invest in safe assets— allocate a growing share of their portfolios to Canadian bonds.17 An analysis suggests that such sizable foreign flows lowered the 10-year government bond yield by around 100 basis points between 2009 and 2012 (Feunou et al. 2015). The implication for an SOE is that such global demand for its assets could attenuate the classical trade-off between the expansionary effects of fiscal spending and potentially higher interest rates resulting from excessive debt issuance (Farhi and Maggiori 2016). In other words, the global demand for safe assets may limit the extent of rising costs of borrowing for fiscal authorities in SOEs. As such, fiscal policies may complement monetary poli-cies more effectively to support economic activity.
15 Several structural factors may explain the decline of the global neutral rate. In particular, global demand for safe assets appears to exceed the supply of safe assets. The “global savings glut hypothesis,” for example, states that global excess savings result from a chronic excess desire to save over the desire to invest, particularly in China and other emerging-market economies (Bernanke 2005). More recently, the “secular stagnation hypothesis” argues that some advanced economies suffer from a persistent imbalance between an increasing propensity to save and a decreasing propensity to invest (Bernanke 2015; Summers 2014, 2016; Teulings and Baldwin 2014; Eggertsson and Mehrotra 2014; Eggertsson et al. 2016; Corsetti et al. 2016).
16 See the policy discussion in Eggertsson 2011; Krugman 2009; Christiano, Eichenbaum and Rebelo 2011; and Summers 2016.
17 The estimated total value of official foreign exchange reserves allocated to Canadian assets has continued to grow to as much as Can$300 billion at the end of 2016, compared with their estimate of Can$200 billion in 2014.
� In a small open economy, fiscal policy may be more effective as a complement to monetary policy if global demand for safe assets compresses long-term interest rates
26 UncOnvEnTiOnal MOnETary POlicy: ThE PErSPEcTivE Of a SMall OPEn EcOnOMy Bank of Canada Review • SpRing 2017
ConclusionThe experience and research to date suggest that QE and negative interest rates allow central banks in SOEs more room to manoeuvre if more easing is required. Negative interest rates operate as an extension to conven-tional monetary policy easing, putting downward pressure on interest and exchange rates. QE may also lower exchange rates and the path of expected short-term interest rates, although, with open capital markets, its effect on long-term interest rates may be smaller in SOEs than in large economies. Ultimately, both policies may help central banks come closer to their mandated targets of price stability. More theoretical and empirical work is, however, required to quantify the macroeconomic effect of UMPs, in particular that of negative rates.
At the same time, fiscal policy can become a more important complement to monetary policy in supporting growth when interest rates are close to zero. This is even more a case for SOEs because it is, to a large extent, global demand for safe assets that compresses their domestic long-term yields. Such compression can reduce the debt-service costs for the government and, at the margin, the cost of an expansionary fiscal policy.
Literature CitedBank of Canada. 2015. Framework for Conducting Monetary Policy at Low
Interest Rates.
—. 2016. Renewal of the Inflation-Control Target, Background Information. October 2016.
Bank of International Settlements (BIS). 2016. 86th Annual Report. Basel, 26 June.
File information (for internal use only): Chart 1 - BOCR - 2017-05 - Article 3 - Chart 3 - EN.indd
Last output: 01/06/16 - 02:21PM
Chart 3: Foreign investment in Canadian securitiesNet � ows, annual data
Canadian bonds, government Canadian bonds, corporations Canadian equity and investment fund shares
Source: Statistics Canada
-20
0
20
40
60
80
100
120
140
160
180
2009 2010 2011 2012 2013 2014 2015 2016
Can$ billions
27 UncOnvEnTiOnal MOnETary POlicy: ThE PErSPEcTivE Of a SMall OPEn EcOnOMy Bank of Canada Review • SpRing 2017
Bauer, G. and A. D. Diez de los Rios. 2012. “Global Risk Premiums and the Transmission of Monetary Policy.” Bank of Canada Review (Summer): 12–20.
Bauer, M. D. and G. D. Rudebusch. 2014. “The Signaling Channel for Federal Reserve Bond Purchases.” International Journal of Central Banking 10 (3): 233–289.
Bech, M. and A. Malkhozov. 2016. “How Have Central Banks Implemented Negative Policy Rates?” in BIS Quarterly Review, March: 31–44.
Bernanke, B. S. 2005. “The Global Saving Glut and the U.S. Current Account Deficit.” Speech to the Virginia Association of Economists, Richmond, Virginia, 10 March.
—. 2015. “Why Are Interest Rates So Low, Part 2: Secular Stagnation.” Ben Bernanke’s Blog. 31 March.
Bulusu, N. and S. Gungor. 2017. “The Life Cycle of Government of Canada Bonds in Core Funding Markets.” Bank of Canada Review (Spring): 31–41.
Charbonneau, K. and L. Rennison. 2015. “Forward Guidance at the Effective Lower Bound: International Experience.” Bank of Canada Staff Discussion Paper No. 2015-15.
Christiano, L., M. Eichenbaum and S. Rebelo. 2011. “When Is the Government Spending Multiplier Large?” Journal of Political Economy 119 (1): 78–121.
Cœuré, B. 2016. “Assessing the Implications of Negative Interest Rates.” Speech to the Yale Financial Crisis Forum, Yale School of Management, New Haven, 28 July.
Corsetti, G., E. Mavroeidi, G. Thwaites and M. Wolf. 2016. “Step Away from the Zero Lower Bound: Small Open Economies in a World of Secular Stagnation.” Cambridge Working Paper Series 2016/11.
De Rezende, R. B. 2016. “The Interest Rate Effects of Government Bond Purchases Away From the Lower Bound.” Sveriges Riksbank Working Paper No. 324, May (Revised October 2016).
Diez de los Rios, A. and M. Shamloo. Forthcoming. “Quantitative Easing and Long-Term Yields in Small Open Economies.”
Eggertsson, G. B. 2011. “What Fiscal Policy Is Effective at Zero Interest Rates?” National Bureau of Economic Research Macroeconomics Annual 25 (1): 59–112.
Eggertsson, G. and N. Mehrotra. 2014. “A Model of Secular Stagnation.” National Bureau of Economic Research Working Paper No. 20574.
Eggertsson, G., N. Mehrotra, S. Singh and L. Summers. 2016. “A Contagious Malady? Open Economy Dimensions of Secular Stagnation.” IMF Economic Review 64 (4): 581–634.
Eggertsson, G. B. and M. Woodford. 2003. “The Zero Bound on Interest Rates and Optimal Monetary Policy.” Brookings Papers on Economic Activity 2003 (1): 139–233.
28 UncOnvEnTiOnal MOnETary POlicy: ThE PErSPEcTivE Of a SMall OPEn EcOnOMy Bank of Canada Review • SpRing 2017
Farhi E. and M. Maggiori. 2016. “A Model of the International Monetary System.” National Bureau of Economic Research Working Paper No. 22295.
Ferrari, M., J. Kearns and A. Schrimpf. 2016. “Monetary Shocks at High-Frequency and Their Changing FX Transmission Around the Globe.” 31 August.
Feunou, B., J.-S. Fontaine, J. Kyeong and J. Sierra. 2015. “Foreign Flows and Their Effects on Government of Canada Yields.” Bank of Canada Staff Analytical Note No. 2015-1.
Fleming, J. M. 1962. “Domestic Financial Policies Under Fixed and Floating Exchange Rates.” IMF Staff Papers 9 (3): 369–380.
Glick, R. and S. Leduc. 2015. “Unconventional Monetary Policy and the Dollar: Conventional Signs, Unconventional Magnitudes.” Federal Reserve Bank of San Francisco Working Paper No. 2015-18.
Gokoluk, S. and K. Chamonikolas. 2016. “Czech Central Banker Says Negative Rates May Help End Koruna Cap.” Bloomberg, 8 December.
Haldane, A., M. Roberts-Sklar, T. Wieladek and C. Young. 2016. “QE: The Story so Far.” Bank of England Staff Working Paper No. 624.
Jackson, H. 2015. “The International Experience with Negative Policy Rates.” Bank of Canada Staff Discussion Paper No. 2015-13.
Jordan, T. 2016. “Monetary Policy Using Negative Interest Rates: A Status Report.” Speech to the Vereinigung Basler Ökonomen, Basel, 24 October.
Kabaca, S. 2016. “Quantitative Easing in a SOE: An International Portfolio Balancing Approach.” Bank of Canada Staff Working Paper No. 2016-55.
King, T. 2016. “Expectation and Duration at the Effective Lower Bound.” Federal Reserve Bank of Chicago Working Paper No. 2016-21.
Kozicki, S., E. Santor and L. Suchanek. 2011. “Unconventional Monetary Policy: The International Experience with Central Bank Asset Purchases.” Bank of Canada Review (Spring): 13–25.
Krishnamurthy, A. and A. Vissing-Jorgensen. 2011. “The Effects of Quantitative Easing on Interest Rates: Channels and Implications for Policy.” National Bureau of Economic Research Working Paper No. 17555.
Krugman, P. 2009. “Fighting off Depression.” New York Times, 4 January, Opinion page.
Mendes, R. R. 2014. “The Neutral Rate of Interest in Canada.” Bank of Canada Staff Discussion Paper No. 2014-5.
Moore E. and J. Cumbo. 2016. “Bank of England Bond-Buying Programme Hits Trouble.” Financial Times, 9 August.
29 UncOnvEnTiOnal MOnETary POlicy: ThE PErSPEcTivE Of a SMall OPEn EcOnOMy Bank of Canada Review • SpRing 2017
Mundell, R. A. 1963. “Capital Mobility and Stabilization Policy Under Fixed and Flexible Exchange Rates.” Canadian Journal of Economic and Political Science 29 (4): 475–485.
Pomorski, L., F. Rivadeneyra and E. Wolfe. 2014. “The Canadian Dollar as a Reserve Currency.” Bank of Canada Review (Spring): 1–11.
Reza, A., E. Santor and L. Suchanek. 2015. “Quantitative Easing as a Policy Tool Under the Effective Lower Bound.” Bank of Canada Staff Discussion Paper No. 2015-14.
Santor, E. and L. Suchanek. 2016. “A New Era of Central Banking: Unconventional Monetary Policies.” Bank of Canada Review (Spring): 29–42.
Summers, L. 2014. “U.S. Economic Prospects: Secular Stagnation, Hysteresis, and the Zero Lower Bound.” Business Economics 49 (2): 65–73.
—. 2016. “Secular Stagnation and Monetary Policy.” Federal Reserve Bank of St. Louis Review. Second Quarter. 98 (2): 93–110.
Swanson, E. T. 2015. “Measuring the Effects of Unconventional Monetary Policy on Asset Prices.” National Bureau of Economic Research Working Paper No. 21816.
Swedish National Debt Office. 2017. Central Government Borrowing: Forecast and Analysis 2017:1. 22 February.
Tartar, A. 2016. “Here’s What Economists Think About Negative Policy Rates: They Don’t Do Much for Inflation and Will Last Until at Least 2018.” Bloomberg, 18 February.
Teulings, C. and R. Baldwin, editors. 2014. Secular Stagnation: Facts, Causes and Cures. e-book.
Turk, R. A. 2016. “Negative Interest Rates: How Big a Challenge for Large Danish and Swedish Banks?” International Monetary Fund Working Paper No. 16/198.
Vayanos, D. and J. L. Vila. 2009. “A Preferred-Habitat Model of the Term Structure of Interest Rates.” National Bureau of Economic Research Working Paper No. 15487.
Viñals, J., S. Gray and K. Eckhold. 2016. “The Broader View: The Positive Effects of Negative Nominal Interest Rates.” Posted on 10 April by iMFdirect.
Weale, M. and Wieladek, T. 2016. “What Are the Macroeconomic Effects of Asset Purchases?” Journal of Monetary Economics 79: 81–93.
Witmer, J. and J. Yang. 2016. “Estimating Canada’s Effective Lower Bound.” Bank of Canada Review (Spring): 3–14.
Woodford, M., 2012. “Methods of Policy Accommodation at the Interest-Rate Lower Bound.” The Changing Policy Landscape: 185–288.
30 UncOnvEnTiOnal MOnETary POlicy: ThE PErSPEcTivE Of a SMall OPEn EcOnOMy Bank of Canada Review • SpRing 2017
The Life Cycle of Government of Canada Bonds in Core Funding MarketsNarayan Bulusu, Funds Management and Banking Department, and Sermin Gungor, Financial Markets Department
� Core funding markets are crucial to maintaining financial stability and supporting economic growth because they provide market participants with access to liquidity and the ability to acquire or sell short desired securities. In Canada, activity in core funding markets is mainly driven by trading in Government of Canada debt securities.
� This article analyzes the life cycle of Government of Canada (GoC) bonds by following them from issuance to maturity in the repurchase agreement (repo), securities lending and cash markets. Over their lifetime, longer-maturity bonds are more active in the securities lending market, while shorter-term bonds are used mainly in the repo and cash markets. This article argues that the observed variance in the use of securities of dif-ferent maturity classes is consistent with investor types having different maturity preferences.
� The Bank of Canada plays a key role in supporting and monitoring core funding markets. It also provides policy advice to the government on the efficient management of its debt. Understanding the use of government debt securities in different markets could help the Government of Canada design more effective policies to lower the costs of GoC debt issuance and, more broadly, maintain well-functioning Canadian markets.
Well-functioning financial markets are critical to both financial stability and economic growth because both issuers of securities and investors rely on efficient, liquid markets to allocate capital effectively. Core funding markets, which include the repurchase agreement (repo), securities lending and cash markets, are key to achieving this objective. Market participants frequently face short-term liquidity needs and seek specific securities on short notice, either to fulfill client demand or to hedge. By helping financial institutions access liquidity and trade in specific securities at short notice, core funding markets ultimately support the creation of public and private credit and are therefore critical to the real economy (Carney 2008).
The Bank of Canada Review is published two times a year. Articles undergo a thorough review process. The views expressed in the articles are those of the authors and do not necessarily reflect the views of the Bank. The contents of the Review may be reproduced or quoted, provided that the publication, with its date, is specifically cited as the source.
31 The LiFe CyCLe oF GovernMenT oF Canada Bonds in Core FundinG MarkeTs Bank of Canada Review • SpRing 2017
Relative to exchange-traded products (such as equities), data on core funding market transactions can be more difficult to obtain because such transactions are usually conducted over-the-counter.1 As part of its agenda to study these markets in greater depth (see, for example, Garriott and Gray 2016; Fontaine, Garriott and Gray 2016; and Johal, Roberts and Sim forthcoming), the Bank of Canada has analyzed security-level activity in these markets using data from the Canadian Depository for Securities, the Canadian Derivatives Clearing Corporation2 and Markit Securities Finance.3 This article presents the results of this analysis.
We construct the activity profile of securities of different maturities through the various stages of a bond’s “life cycle” by measuring the daily use of each Government of Canada (GoC) bond from its issuance to maturity. This analysis of the life cycle of GoC bonds uncovers evidence supporting the preferred habitat hypothesis. According to this hypothesis, some investors in fixed-income securities have a strong preference for bonds of certain maturities (Modigliani and Sutch 1966). As a result, they have limited desire to substitute away from bonds of their preferred maturity. Further, the results suggest that the type of market participants, e.g., passive long-term investors or active short-term investors, affects the preferred choice of funding market. We highlight some of the implications of these findings for GoC debt securities, such as the cost-of-issuance and secondary market liquidity effects of policies that may affect the relative supply of bonds of different maturities.
The following section provides background relevant to the life-cycle analysis by discussing the motives and venues of trade of participants in the core funding markets. Readers familiar with this topic may choose to skip to the discussion of the GoC bond life cycle on page 34.
Trading Motives of Participants in Core Funding MarketsRepo and securities lending markets are the main venues where market participants satisfy their temporary needs for cash and specific securities (Baklanova, Copeland and McCaughrin 2015). The search for cash by finan-cial intermediaries is typically motivated by their need to meet temporary mismatches between inflows and outflows or to finance a (leveraged) long position in a security. In other situations, an intermediary’s motivation to trade is driven by the search for specific securities either to satisfy a client’s request to trade or to take (or close out) a short position (Fontaine, Selody and Wilkins 2009; and Fontaine, Garriott and Gray 2016). The cash market, in which securities are bought and sold outright, is a substitute venue for such trades.
Repos involve the sale of a security for cash (the “first leg” of the contract), combined with a promise to buy the security back at a later date (the “second leg”). In other words, a repo is effectively a collateralized loan where the difference between the initial sale price and the repurchase price is the interest on the cash loaned out. Cash lenders who value the col-lateral only for the protection it offers in the event of counterparty default
1 Over-the-counter contracts are negotiated between two parties and do not use the trading infrastruc-ture provided by securities exchanges. These transactions are characterized by a sequential search for counterparties and bargaining over the terms of trade (Duffie, Gârleanu and Pedersen 2005).
2 Data copyright Canadian Derivatives Clearing Corporation (CDCC), all rights reserved. Not to be reproduced or redistributed. The Canadian Derivatives Clearing Corporation disclaims all representa-tions and warranties with respect to this information and shall not be liable to any person for any use of this information.
3 See Bulusu and Gungor (forthcoming) for details about the different data sources used in this article.
� Repo and securities lending markets are the main venues where market participants satisfy their temporary needs for cash and specific securities
32 The LiFe CyCLe oF GovernMenT oF Canada Bonds in Core FundinG MarkeTs Bank of Canada Review • SpRing 2017
are usually indifferent to the specific security being pledged, as long as it belongs to a basket of “equivalent” securities. The interest rate on such general collateral (GC) repos is independent of the specific security (from a pre-specified basket) being pledged. Other repo transactions are character-ized by a desire to obtain specific collateral. If the desired security is scarce, the interest on the cash loan is lower, i.e., the repo rate for that bond is below the GC repo rate. These issues are referred to as being “on special” or a special repo. The spread between GC and special repo rates is the interest foregone by the cash lender in exchange for obtaining the desired security and can be interpreted as the borrowing fee for that security.
Securities lending contracts involve the loan of a security against cash or other acceptable securities. Against cash collateral, they are economically indistinguishable from repos. Unlike repos, however, these trades are conducted between the borrower of the security and the securities lending agent, who intermediates between the ultimate owners of these securities and the borrowers.4 Our calculations show that more than 85 per cent of securities lending in debt securities in Canada from 2010 to 2015 was against other securities. Since the vast majority of securities lending does not involve the exchange of cash, securities lending in Canada is motiv-ated mainly by the desire to borrow specific securities.5 As such, it can be inferred that, in Canada, GC repos are driven by the search for cash, while the search for specific securities is satisfied using special repo and secur-ities lending transactions.6
The cash market is an alternative venue for market participants to search for cash or specific securities. However, settlement delays affect cash trades, making them an imperfect substitute for repo and securities lending. Settle-ment conventions guide the time elapsed between the initiation of a trade and its settlement, i.e., the exchange of cash and securities. The first leg of both repo and securities lending trades are settled on the same day that they are initiated; however, most bonds are settled between two and three days later in the cash market.7 Thus, while cash or security needs that are fully anticipated can still be fulfilled by the cash market, unanticipated needs cannot. Another reason for the imperfect substitutability is that the absence of a “repurchase leg”—a feature of repo and securities lending contracts—exposes the holder of the security to undesirable price risk. In this article, the cash market is therefore treated as a separate category, even though it is a core funding market.
Participants’ choice of core funding markets Securities lending and repo contracts are close economic substitutes. For example, market participants wishing to borrow a particular bond could do so either in the securities lending market against cash (or other acceptable collateral) or through a repo. Similarly, lenders of a bond could access cash
4 The intermediation services offered by the lending agent include arranging trades, performing due diligence on prospective borrowers, reinvesting cash collateral, and managing the operational and administrative aspects of lending (Johal, Roberts and Sim forthcoming).
5 Aggarwal, Bai and Laeven (2016) suggest that securities lending is sometimes used to transform lower-quality collateral into higher-quality assets, which may in turn be used as collateral for repos, for example. In other words, securities lending may occasionally be motivated by the search for a class of securities, rather than for a particular security. For a more complete description of the securities lending market in Canada, see Johal, Roberts and Sim (forthcoming).
6 See Garriott and Gray (2016) for a more complete discussion of repo agreements and the repo market in Canada.
7 Government bonds with three years or less to maturity settle in two days, while those with longer maturities settle in three days. Only money market instruments (debt securities with less than one year to maturity) typically operate under the same-day settlement convention in Canada.
� The cash market is an alternative venue—albeit an imperfect substitute—for market participants to search for cash or specific securities
33 The LiFe CyCLe oF GovernMenT oF Canada Bonds in Core FundinG MarkeTs Bank of Canada Review • SpRing 2017
by posting their collateral in the repo or securities lending markets. Despite these similarities, the organizational structures of the two markets are sig-nificantly different. In particular, securities lending is typically intermediated, while repos are usually negotiated bilaterally in the over-the-counter market. These structural differences are an important factor in market participants’ decisions on trading.
Typical lenders of securities in Canada include pension funds, mutual funds, university endowments and insurance companies (Johal, Roberts and Sim forthcoming). Such investors may choose not to participate directly in the repo market if their portfolio size or desired level of activity does not justify the investment in technology and expertise required to run their own repo desk. Therefore, they would typically use securities lending agents to enhance the returns on their portfolio of assets.8 Further, these investors may not wish to be exposed to the risk arising from the variable returns from reinvesting the cash collateral provided in repos, which increases the favourability of securities lending in Canada.9
Financial institutions using repo markets to search for cash typically include dealers and more active investors, such as hedge funds and some of the largest pension funds. Dealers depend on GC repos to fund their inventories, i.e., borrow the cash they have paid to acquire the bonds in their inventories. Other institutions, such as hedge funds, use repo markets either as a source of funds to meet operational cash requirements or to take leveraged positions.10 These same investors can use special repos to take temporary possession of a desired security. Dealers may choose to borrow a security in a special repo to make markets, i.e., to be able to fulfill client demand for the bond. Other shorter-term investors may use special repos to borrow bonds overnight to close out an existing short position.11
The Life Cycle of Government of Canada Bonds GoC securities play the most important role in core funding markets in Canada. From 2010 to 2015, they were used as collateral for more than 80 per cent of repo trade volume, constituted 60 per cent of all Canadian debt securities traded in the cash market and represented about 65 per cent of fixed-income securities on loan. The prevalence of the use of sovereign debt instruments in core funding markets is due to two main factors. First, they are widely accepted as safe collateral against which short-term loans can be obtained.12 Second, since the closest approximation to the risk-free interest rate for a given maturity is the GoC bond yield at that maturity,
8 Bédard-Pagé et al. (2016) and Garriott and Gray (2016) provide evidence that size is correlated with participation in the repo market. In particular, they show that only the largest pension funds in Canada have a scale to justify being active repo traders.
9 To be able to earn positive returns from lending their securities in the repo market, lenders of the security need to reinvest the cash obtained as collateral in instruments that yield a higher return than the interest paid for borrowing cash. In contrast, in the securities lending market, the borrowers of securities simply pay an agreed-upon fee to compensate the lender of the security.
10 A leveraged position in a security can be taken by buying a security, using it as collateral for a repo and then buying back the security using the cash borrowed in the repo. See Fontaine, Garriott and Gray (2016) for details.
11 Of course, the same shorter-term investors may borrow bonds for longer periods in the securities lending market.
12 Dang, Gorton and Holmström (2012) argue that safe debt securities are widely used as collateral because their low credit risk reduces the overall costs of liquidity provision. The cost reduction is due to the safety of the securities offered, which reduces cash lenders’ incentives to invest resources in producing information about collateral quality. In other words, safe assets are good collateral because of their information insensitivity.
� Differences in the organizational structure of the repo and securities lending markets are an important factor in market participants’ trading venue decision
� Government of Canada securities play the most important role in core funding markets in Canada
34 The LiFe CyCLe oF GovernMenT oF Canada Bonds in Core FundinG MarkeTs Bank of Canada Review • SpRing 2017
contracts involving GoC securities are most appropriate for hedging interest rate risk in Canada. The focus below is therefore on activity in the repo, securities lending and cash markets involving GoC securities.13
The Canadian federal government issues a pre-announced amount of debt securities with maturities of 3, 6 and 12 months, and 2, 3, 5, 10, 30 and occasionally 50 years.14 In contrast to the issuance practice in the United States, large sizes in GoC bonds are achieved through consecutive re-openings after an initial auction. A reopening is a new primary auction of an additional amount of an existing security.15
A GoC bond of a particular maturity achieves benchmark status when its amount outstanding reaches a desired level.16 The benchmark bond is the bond against which other securities are priced and is the most liquid security in its maturity class. Given the government’s stable issuance pat-terns, market participants adopt the bond as the new benchmark in its maturity class once its amount outstanding is close to that of the previous benchmark. Concurrently, the previous benchmark relinquishes this label; this usually takes place close to the last reopening of the new benchmark bond.17 Accordingly, the life cycle of a typical GoC bond can be split into three phases: (i) pre-benchmark—the period from the first issuance to the day before it attains the benchmark status; (ii) benchmark—the period between being designated as the benchmark and the day the next bench-mark in the maturity class is announced; and (iii) post-benchmark—the period between the end of benchmark status and maturity. The pre-benchmark period is characterized by an increasing supply of the bond. Benchmark bonds are analogous to on-the-run Treasuries in the United States, and post-benchmarks are similar to off-the-run bonds.18
Use of Government of Canada Bonds over their Life CycleThe life cycle analysis of GoC bonds presents indirect evidence of bond market clienteles in Canada. According to the preferred habitat hypoth-esis, some investors have preferences for specific maturities and have limited desire to substitute across bonds with different maturities; i.e., they are clientele of bonds of specific maturity classes.19 Previous studies (e.g., Longstaff 2004; Greenwood and Vayanos 2010; Krishnamurthy and
13 In Canada, Canada Mortgage Bonds and provincial government debt are the other debt instruments that constitute a significant fraction of the total trade volume. Trades involving other debt instruments such as corporate bonds, bankers’ acceptances and asset-backed commercial paper are sporadic.
14 There have been a few changes to the maturity structure during the sample period, such as the issu-ance of ultra-long bonds of up to 50 years and a temporary pause in the issuance of new three-year bonds beginning in 2015. We do not include inflation-indexed bonds in our analysis because they form a very small portion of outstanding government debt. For a more detailed description of primary issu-ance practice in Canada, see Gravelle (1999).
15 Such staggered issuance is not unusual for markets with lower capacity to absorb large primary auction sizes without a price impact. The Spanish Treasury market, for example, followed a similar issuance strategy until 2001 (see Díaz, Merrick and Navarro 2006).
16 This desired amount is usually presented as a range that is pre-announced in the Government of Canada’s annual debt-management strategy.
17 Select three-year bonds in our sample were reopened (re-designated) as two-year bonds and subse-quently assigned benchmark status in the two-year maturity class. The anticipated potential rebirth of three-year bonds in their post-benchmark period makes their usage patterns quite different, and we therefore exclude these bonds from our analysis.
18 Short-term zero-coupon GoC debt (three-month, six-month and one-year maturity classes) is not used frequently in repo and securities lending markets. Furthermore, this debt does not experience any changes in status between issuance and maturity, which makes it relatively less interesting from a life-cycle perspective.
19 Which securities the different investor types ultimately hold depends not only on their preferences but also on other factors, such as the stock of available securities and the regulatory environment under which financial institutions operate.
35 The LiFe CyCLe oF GovernMenT oF Canada Bonds in Core FundinG MarkeTs Bank of Canada Review • SpRing 2017
Vissing-Jorgensen 2012; D’Amico and King 2013) have noted that the price impact of regulatory or bond supply changes is consistent with this hypoth-esis. We add to this body of evidence by showing that GoC bonds across maturity classes are used differently in the core funding markets through their life cycle, which indicates the presence of bond market clienteles.
Under the preferred habitat hypothesis, longer-term investors prefer longer-maturity bonds to hedge their longer-term liabilities.20 Since these investors are also more likely to employ the services of lending agents, we should observe higher use of longer-dated bonds in the securities lending market. Short-term bonds, in contrast, should have a greater use as col-lateral in GC and special repos throughout their lifetime. We now show that the life cycle of GoC bonds broadly conforms to these patterns. Chart 1 shows the daily use of 2-, 5-, 10- and 30-year GoC bonds over their life
20 The lack of data on portfolio holdings by investors makes it difficult to directly verify this hypothesis. However, many authors provide anecdotal evidence in its favour. For example, Vayanos and Vila (2009) suggest that, in the United States, pension funds are typical investors for bonds with longer than 15 years to maturity. Insurance companies prefer bonds around 15 years to maturity, while asset managers and banks’ treasury departments are the typical clientele for bonds of shorter maturities.
� Since longer-term investors are more likely to employ the services of lending agents, an implication of the preferred habitat hypothesis is that we should observe higher use of longer-dated bonds in the securities lending market
File information (for internal use only): BOCR - 2017-05 - Article 2 - Chart 1 - EN.indd
Last output: 05/28/09
Chart 1: Use of Government of Canada bonds in core funding marketsPercentage of outstanding stock of bond
a. 2-year bond
c. 10-year bond
b. 5-year bond
d. 30-year bond
General collateral repo Securities lending Special repo Cash
Sources: Canadian Depository for Securities, Canadian Derivatives Clearing Corporation, Markit Securities Finance and Bank of Canada calculations Last observation: 31 December 2015
0
5
10
15
20
25
30
35
%
Benchmark begins Benchmark ends Bond matures
%
0
5
10
15
20
25
30
35
Benchmark begins Benchmark ends Bond matures
0
5
10
15
20
25%
Benchmark begins Benchmark ends Bond matures
%
0
5
10
15
Benchmark begins Benchmark ends Bond matures
36 The LiFe CyCLe oF GovernMenT oF Canada Bonds in Core FundinG MarkeTs Bank of Canada Review • SpRing 2017
cycle as a percentage of their outstanding amount.21, 22 Each panel shows the use of bonds in the search for cash through GC repos, the search for the bond through securities lending and special repos, and trading in the cash market.
First, given the presence of bond-market clienteles, the use of a bond in the securities lending market increases with its maturity. Of the 2-year bond (panel a), 15 per cent is loaned out through securities lending in its lifetime, while the corresponding proportion for the 10-year bond (panel c) is close to 30 per cent. In contrast, 21 per cent of the 2-year bond and 17 per cent of the 10-year bond are used in the GC and special repo markets over their lifetimes.23
Second, as the use of a bond in the GC repo market falls, its use in the securities lending market rises. This could be consistent with a shift in ownership of the security, either from dealers to investors or from more to less active trading investors. Furthermore, the strength of this pattern increases with the maturity of the bond, consistent with the preferred habitat hypothesis. Of the 10-year bond, 14 per cent was used as collateral for GC repos right after issuance, and this falls to 4 per cent in the final period of its benchmark phase. At the same time, the use of the bond in the securities lending market rises from 8 to 21 per cent. In contrast, the use of the 2-year bond in the repo market falls less sharply—from 16 per cent after issuance to 10 per cent at the end of its benchmark period. Its use in the securities lending market in the corresponding period rises from 6 to 20 per cent.
Third, in line with the preferred habitat hypothesis, lending of longer-term bonds occurs primarily in the securities lending market, while shorter-term bonds are borrowed using both securities lending contracts and special repos. More than 30 per cent of the 10-year bond is borrowed in the secur-ities lending market over its lifetime, compared with 3 per cent using special repos. In contrast, 10 per cent of the lending in the lifetime of the 2-year bond is arranged through special repos, while 15 per cent is through securities lending contracts. This is consistent with owners of the longer-term security being less active in the repo market. Investors in the shorter-term security who are active repo traders prefer lending their bonds in the special repo market instead of sharing the lending fee with securities lending agents.
The cash market is an imperfect substitute for the repo and securities lending markets; accordingly, the use of GoC bonds of all maturities displays a strikingly different pattern in Chart 1. The cash market for all maturity classes is very active in the benchmark period and falls very sharply in the post-benchmark period. This is consistent with the behaviour of US Treasuries (Barclay, Hendershott and Kotz 2006). Nevertheless, the post-benchmark period is characterized by residual activity in the secur-ities lending and GC repo markets. In its post-benchmark period, about 10 per cent of a bond is either used as collateral for cash or is sought after in the securities lending market.24 These results reinforce the fact that the lack of trading in the cash market is not necessarily an indicator of an absence of activity in core funding markets.
21 Since a typical GoC bond does not spend an equal amount of time in the three phases of its life cycle, we used a normalization scheme to standardize the time elapsed in each phase.
22 The amount outstanding of a bond is measured using par value, which is the amount paid to the holders of the bond at maturity. Unlike the market value, which is the price investors pay to purchase the bond, the par value of a bond is unchanged over time.
23 This exposition focuses on the 2- and 10-year bonds. The life-cycle pattern of the 5-year bond lies in between that of the 2- and 10-year bonds. The seemingly anomalous behaviour of the 30-year GoC bond is discussed later.
24 The search for the specific security in the securities lending market is perhaps necessitated by the difficulty of locating it in the thinly traded cash market.
37 The LiFe CyCLe oF GovernMenT oF Canada Bonds in Core FundinG MarkeTs Bank of Canada Review • SpRing 2017
At first glance, the uniformly low activity in the 30-year bond in all the core funding markets could seem inconsistent with this analysis. While the low use of this very long bond in the repo market (both GC and special) is consistent with its purchase at issuance by long-term investors, the lack of activity in the securities lending market seems to present a challenge to the preferred habitat hypothesis.25 Chart 2, which shows the average daily special repo spread over the life cycle for the different maturity classes, suggests that the demand to borrow a specific 30-year security is low throughout its lifetime. While the average special repo spreads for the 2-, 5- and 10-year bonds peak at 15 basis points (bps), 24 bps and 20 bps, respectively, that of the 30-year bond stays between 7 bps and 10 bps through its life cycle. Indeed, the data confirm that the amount of the average 30-year bond offered on loan in the securities lending market is higher than that of bonds in any other maturity class. Thus, the low uptake in the securities lending market and low borrowing rates in the repo market indicate the lack of demand to borrow the specific 30-year security by active trading investors.26
To summarize, the evidence from the life-cycle analysis of GoC bonds points to the average longer-maturity investor being less active in the repo market. Owners of shorter-term bonds are typically active in the repo market and are therefore less likely to employ the services of securities lending agents. This heterogeneity of use of GoC bonds in the core funding markets lends credence to the presence of bond market clienteles; i.e., investors in Canadian fixed-income instruments have different maturity preferences.
Implications for Government Bond MarketsThe importance of core funding markets for the well-functioning of both primary and secondary bond markets is well recognized. For example, Graveline and McBrady (2011) show that the ability of market participants to hedge interest rate risk through short sales (facilitated by repo trades) is
25 The lack of activity in the cash market could suggest that the ultimate investors for these very long bonds bid for a larger fraction of their demand at the primary auction through primary dealers.
26 The borrowing fees in the securities lending market and the spread in the special repo market closely track each other; any significant deviations in the two would drive borrowers to the cheaper source.
� Evidence from the life-cycle analysis of Government of Canada bonds points to the average longer-maturity investor being less active in the repo market
File information (for internal use only): Chart 1 - BOCR - 2017-05 - Article 2 - Chart 2 - EN.indd
Last output: 01/06/16 - 02:21PM
Chart 2: Average special repo spread
2-year 5-year 10-year 30-year
Sources: Canadian Depository for Securities, Canadian Derivatives Clearing Corporation and Bank of Canada calculations Last observation: 31 December 2015
0
5
10
15
20
25Basis points
Benchmark begins Benchmark ends Bond matures
38 The LiFe CyCLe oF GovernMenT oF Canada Bonds in Core FundinG MarkeTs Bank of Canada Review • SpRing 2017
an important determinant of the price paid at primary auctions. Fontaine, Garriott and Gray (2016) point to the importance of GC repo and securities lending in supporting cash market liquidity.
This article highlights the activity of bond market clienteles in core funding markets. Knowledge of investor preferences and their trading venues could help inform policies on the maintenance of a well-functioning market in GoC securities. Given the results presented in this article, for example, disloca-tions affecting the repo market may have a greater impact on liquidity in shorter-term bonds, while those in the securities lending market may have a greater impact on the market for longer-term bonds.
The role of bond market clienteles in decisions on sovereign debt issu-ance has recently gained prominence in academic and policy circles (see, for example, Guibaud, Nosbusch and Vayanos 2013; and Cochrane 2015). Another strand of literature suggests that sovereign debt managers need to take into account the use of these securities in financial markets when determining the term structure of issuance (Greenwood, Hanson and Stein 2015).27 This article highlights differences in the use of GoC bonds of dif-ferent maturity classes by financial market participants and could be an additional input into the debt manager’s issuance decision.
These results also provide support for the use of minimum issuance con-straints by maturity class in the Canadian Debt-Strategy Model (Bolder and Deeley 2011). Minimum issuance in different maturity classes is usu-ally suggested as a means of maintaining a “presence across the curve.” The analysis in this article reinforces clientele demand as a reason for the Canadian government to issue securities of different maturities. The current practice of considering feedback from market participants to arrive at the minimum issuance constraints at each maturity could be supplemented by estimates of clientele demand using the activity in core funding markets.
ConclusionThis article uses new data on Canadian debt securities to analyze the use of GoC bonds in Canadian core funding markets. The findings on the life cycle of the use of GoC bonds are consistent with the preferred habitat hypoth-esis, which postulates that some fixed-income investors are characterized by a strong preference for securities of a particular maturity. Accordingly, the data show that shorter-term bonds are disproportionately held by par-ticipants that are more active in the repo market. Their greater use is driven by both the search for such securities and the use of these securities to obtain cash. Longer-term bonds are largely held in the portfolios of investors that are less active in the repo markets. Consequently, market participants seeking to borrow longer-term bonds are more likely to find them with securities lending agents contracted by the owners of such instruments to enhance the returns on their portfolio.
The presence of distinct investor clienteles could be an important factor governing the use, availability and trading venue of bonds of different maturity classes, which could in turn affect secondary-market properties of GoC bonds. Given the importance of maintaining well-functioning core funding markets, awareness of these determinants could contribute to better-designed policies to aid the Bank of Canada in maintaining a stable and efficient financial system. Furthermore, estimates of demand by clientele type could help infer the demand for individual securities at primary auctions and thus help achieve better outcomes in the debt-issuance process.
27 Additionally, D’Amico and King (2013) argue that some of the effect of the US Federal Reserve’s asset purchase program was achieved due to the presence of bond market clienteles.
� Knowledge of investor preferences and their trading venues could help inform policies on the maintenance of a well-functioning market in Government of Canada securities
39 The LiFe CyCLe oF GovernMenT oF Canada Bonds in Core FundinG MarkeTs Bank of Canada Review • SpRing 2017
Literature CitedAggarwal, R., J. Bai and L. Laeven. 2016. “The Role of the Government
Bond Lending Market in Collateral Transformation.” Georgetown McDonough School of Business Research Paper No. 2692251.
Baklanova, V., A. M. Copeland and R. McCaughrin. 2015. “Reference Guide to U.S. Repo and Securities Lending Markets.” Federal Reserve Bank of New York Staff Report No. 740.
Barclay, M. J., T. Hendershott and K. Kotz. 2006. “Automation Versus Intermediation: Evidence from Treasuries Going off the Run.” Journal of Finance 61 (5): 2395–2414.
Bédard-Pagé, G., A. Demers, E. Tuer and M. Tremblay. 2016. “Large Canadian Public Pension Funds: A Financial System Perspective.” Bank of Canada Financial System Review (June): 33–38.
Bolder, D. J. and S. Deeley. 2011. “The Canadian Debt-Strategy Model: An Overview of the Principal Elements.” Bank of Canada Staff Discussion Paper No. 2011-3.
Bulusu, N. and S. Gungor. Forthcoming. “Government of Canada Securities in the Cash, Repo and Securities Lending Markets.” Bank of Canada Staff Discussion Paper.
Carney, M. 2008. “Building Continuous Markets.” Remarks to the Canada–United Kingdom Chamber of Commerce, London, England, 19 November.
Cochrane, J. 2015. “A New Structure for U.S. Federal Debt.” In David Wessel, Ed., The $13 Trillion Question: How America Manages its Debt: 91–146. Washington DC: Brookings Institution Press.
D’Amico, S. and T. B. King. 2013. “Flow and Stock Effects of Large-Scale Treasury Purchases: Evidence on the Importance of Local Supply.” Journal of Financial Economics 108 (2): 425–448.
Dang, T. V., G. Gorton and B. Holmström. 2012. “Ignorance, Debt and Financial Crises.” Yale University and Massachusetts Institute of Technology Working Paper.
Díaz, A., J. J. Merrick and E. Navarro. 2006. “Spanish Treasury Bond Market Liquidity and Volatility Pre- and Post-European Monetary Union.” Journal of Banking & Finance 30 (4): 1309–1332.
Duffie, D., N. Gârleanu and L. H. Pedersen. 2005. “Over‐the‐Counter Markets.” Econometrica 73 (6): 1815–1847.
Fontaine, J.-S., C. Garriott and K. Gray. 2016. “Securities Financing and Bond Market Liquidity.” Bank of Canada Financial System Review (June): 39–45.
Fontaine, J.-S., J. Selody and C. A. Wilkins. 2009. “Improving the Resilience of Core Funding Markets.” Bank of Canada Financial System Review (December): 41–46.
40 The LiFe CyCLe oF GovernMenT oF Canada Bonds in Core FundinG MarkeTs Bank of Canada Review • SpRing 2017
Garriott, C. and K. Gray. 2016. “Canadian Repo Market Ecology.” Bank of Canada Staff Discussion Paper No. 2016-8.
Graveline, J. J. and M. R. McBrady. 2011. “Who Makes On-the-Run Treasuries Special?” Journal of Financial Intermediation 20 (4): 620–632.
Gravelle, T. 1999. “Liquidity of the Government of Canada Securities Market: Stylized Facts and Some Market Microstructure Comparisons to the United States Treasury Market.” Bank of Canada Staff Working Paper No. 1999-11.
Greenwood, R., S. G. Hanson and J. C. Stein. 2015. “A Comparative‐Advantage Approach to Government Debt Maturity.” Journal of Finance 70 (4): 1683–1722.
Greenwood, R. and D. Vayanos. 2010. “Price Pressure in the Government Bond Market.” American Economic Review 100 (2): 585–590.
Guibaud, S., Y. Nosbusch and D. Vayanos. 2013. “Bond Market Clienteles, the Yield Curve, and the Optimal Maturity Structure of Government Debt.” Review of Financial Studies 26 (8): 1914–1961.
Johal, J., J. Roberts and J. Sim. Forthcoming. “Canadian Securities Lending Market Ecology.” Bank of Canada Staff Discussion Paper.
Krishnamurthy, A. and A. Vissing-Jorgensen. 2012. “The Aggregate Demand for Treasury Debt.” Journal of Political Economy 120 (2): 233–267.
Longstaff, F. A. 2004. “The Flight-to-Liquidity Premium in US Treasury Bond Prices.” Journal of Business 77 (3): 511–526.
Modigliani, F. and R. Sutch. 1966. “Innovations in Interest Rate Policy.” American Economic Review 56 (1/2): 178–197.
Vayanos, D. and J.-L. Vila. 2009. “A Preferred-Habitat Model of the Term Structure of Interest Rates.” National Bureau of Economic Research Working Paper No. 15487.
41 The LiFe CyCLe oF GovernMenT oF Canada Bonds in Core FundinG MarkeTs Bank of Canada Review • SpRing 2017
Wholesale Funding of the Big Six Canadian BanksMatthieu Truno, Andriy Stolyarov, Danny Auger and Michel Assaf, Financial Markets Department
� Retail and commercial deposits along with wholesale funding represent the two major sources of funds for Canadian banks. Wholesale funding is typically obtained directly from institutional investors in financial markets. It is largely used to finance banks’ activities in capital markets, to offer financial services to large institutional clients and to support other lending activities.
� Canada’s Big Six banks1 use a wide range of financial instruments to acquire wholesale funding. These financial instruments can be catego-rized into secured and unsecured borrowings across short- to long-term maturities and can be denominated in different currencies.
� The diversity of wholesale funding instruments allows the Big Six Canadian banks to manage their refinancing risk, vary their sources of funding, meet regulatory requirements and lower their overall cost of capital. For investors, the banks’ wholesale borrowings offer investment choices with a variety of credit, liquidity and maturity profiles.
� The resilience of the Canadian banks compared with that of their interna-tional peers during the 2007–09 global financial crisis can be attributed to their sound risk management, strong capitalization and more stable forms of funding. However, new bank regulation and changes in banks’ internal risk-management practices after the crisis led to changes in their funding behaviour, including a further decline in the use of wholesale funding rela-tive to deposits. In addition to lengthening the average maturity of their wholesale borrowings and increasing their funding in foreign currencies, banks expanded their use of alternative instruments, such as covered bonds and non-viability contingent capital notes.
The Big Six banks are a dominant component of the Canadian financial system, and how they finance their business activities is fundamental to their effective functioning. This article describes wholesale funding instruments used by the Big Six, explains how the banks choose between different funding sources and shows how the banks’ funding mix has evolved since the 2007–09 global financial crisis.
1 The Big Six Canadian banks are the Bank of Montreal, the Bank of Nova Scotia, the Canadian Imperial Bank of Commerce, the National Bank of Canada, the Royal Bank of Canada and TD Bank Group.
The Bank of Canada Review is published two times a year. Articles undergo a thorough review process. The views expressed in the articles are those of the authors and do not necessarily reflect the views of the Bank. The contents of the Review may be reproduced or quoted, provided that the publication, with its date, is specifically cited as the source.
42 WholeSale Funding oF the Big Six Canadian BankS Bank of Canada Review • SpRing 2017
Wholesale Funding InstrumentsRetail and commercial deposits and wholesale funding represent the two major sources of funds for Canadian banks. Retail and commercial deposits from individuals and businesses are typically sourced through the bank’s branch network. These funds are used to finance personal and commer-cial lending activities, such as mortgages, business loans, lines of credit and credit cards. Banks consider deposits to be a core source of funding because of their stability over time.
Wholesale funding is typically obtained directly from institutional investors in financial markets. It is mostly used to finance banks’ activities in capital markets, acquire high-quality liquid assets (HQLA), as well as fund the provision of financial services offered to large clients, such as financial institutions, major corporations and government agencies. It can also be employed to finance banks’ mortgage and credit card portfolios or other lending activities. Wholesale funding markets allow banks to quickly raise large amounts of money for both short and long maturities. However, the cost and availability of wholesale funding depend on conditions in global financial markets, thus making it less stable relative to retail and commer-cial deposits. For example, during the financial crisis, excessive reliance on short-term wholesale funding by some foreign financial institutions contributed to their solvency concerns.
The majority of wholesale funding, especially in longer maturities, comes directly from institutional investors. They provide banks funding through the acquisition of marketable securities in the primary market. These instruments can later be traded in the secondary market among various types of investors.
The Big Six employ a broad range of wholesale funding instruments in both Canadian and foreign markets. These funding instruments, typically considered liabilities on banks’ balance sheets, can be categorized as either secured or unsecured borrowings whose maturities can range from short to long term.
Short- and long-term fundingShort-term borrowing, often referred to as money market funding, is typ-ically obtained for maturities of less than one year, while long-term funding is for a term lasting longer than one year. Short-term borrowings are generally a cheaper source of funds for a bank since investors demand a higher yield (i.e., credit spread) for their longer-term investments. However, refinancing risk makes short-term funding less predictable for the issuer than long-term funding, especially if there are interest rate, maturity and currency mis-matches between assets and liabilities.
Secured and unsecured fundingSecured and unsecured funding pose different credit risks to investors and have different cost implications for banks. Secured funding is defined as “liabilities and general obligations that are collateralised by legal rights to specifically designated assets owned by the borrowing institution in the case of bankruptcy, insolvency, liquidation or resolution.”2 Securitization of the bank’s unencumbered assets is a common way to obtain secured funding (see Appendix for details). Unsecured funding, in contrast, is uncol-lateralized, i.e., not guaranteed by specific assets, and is backed by the overall creditworthiness of the bank. Generally, secured funding achieves
2 Basel Committee on Banking Supervision (2013, para. 112)
� Wholesale funding markets allow banks to quickly raise large amounts of money for both short and long maturities
43 WholeSale Funding oF the Big Six Canadian BankS Bank of Canada Review • SpRing 2017
lower borrowing rates than unsecured funding for the same term because of its lower credit risk. The banks’ use of secured funding compared with unsecured funding is driven by the relative pricing between these two instru-ments. The amount of secured funding is also constrained by the desire of banks to have enough unencumbered assets and by regulatory and internal risk limits.
Table 1 categorizes various funding instruments used by banks. These instruments have different credit risk profiles, legal characteristics and investor bases. The Appendix presents detailed descriptions of the indi-vidual funding instruments.
Table 1: Wholesale funding instruments used by the Big Six Canadian banks
Maturity Secured Unsecured
Short term � Repurchase agreementsa
� Asset-backed commercial paper
� Bearer deposit notes
� Bankers’ acceptancesb
� Certificates of deposit
� Deposits from banks
Long term � Covered bonds
� National Housing Act mortgage-backed securities (NHA MBS)c
� Other asset-backed securities
� Senior deposit notes
� Subordinated notes and capital instruments, such as non-viability contingent capital
a. Banks use repurchase agreements (repos) for funding and to intermediate trades between end-users. It is difficult to separate these two uses of repos with public data.
b. A bankers’ acceptance (BA) is a special type indirect funding for a bank. Money raised through BA funding is ultimately passed on to the banks’ corporate clients. See Appendix for details.
c. NHA MBS can be either a source of funding when they are sold to investors or the Canada Housing Trust or a source of high-quality liquid assets when retained on the balance sheet.
Domestic and foreign fundingThe Big Six Canadian banks can choose between Canadian and foreign capital markets to obtain wholesale funds. Foreign currency funding can be used to fund banks’ activities in foreign jurisdictions since most of them offer financial market services in other countries. Foreign funding can also be converted to Canadian dollars or to other currencies, as required, through either foreign exchange or cross-currency swaps, depending on the term of the transaction. Foreign funding in this case presents an opportunity to lower funding costs and/or broaden the bank’s investor base.
Current funding mixThe total outstanding amount of wholesale funding of the Big Six Canadian banks, excluding repurchase agreements (repos) and bankers’ acceptances, was around Can$1 trillion3 on 31 October 2016. The banks’ annual reports from 2016 show that around 70 per cent was unsecured. About 48 per cent of the wholesale funding was for one year or less. The largest single source of wholesale funding, excluding repos and bankers’ acceptances, is senior unsecured medium-term and structured notes, at approximately 32 per cent of the total (Chart 1). A significant portion of funding also comes from mort-gage securitization and covered bonds (27 per cent).
3 Regulatory filings of the Big Six also show the total outstanding amounts for repurchase agreements and bankers’ acceptances, which stood at about Can$320 billion and Can$75 billion, respectively, at the end of October 2016. These numbers are not included in the charts because of the different nature of these funding instruments. See also Table 1, notes a and b.
44 WholeSale Funding oF the Big Six Canadian BankS Bank of Canada Review • SpRing 2017
Banks’ Wholesale Funding ManagementChoosing where, when and what funding instrument to issue is a complex task typically carried out by banks’ treasury departments. The funding strat-egies of banks are structured to satisfy the following objectives:
� liquidity management4—ensuring enough funds are available to satisfy cash outflows in both normal and stress periods;
� asset liability management—managing the interest rate risks, currency risks and maturity profiles of banks’ assets with the liabilities used to fund them;
� regulatory requirements—satisfying various regulatory requirements, such as the Liquidity Coverage Ratio (LCR), Net Cumulative Cash Flow (NCCF) and upcoming Net Stable Funding Ratio (NSFR);
� business objectives—obtaining funding to satisfy expected asset growth of a bank;
� diversified investor base—issuing different wholesale funding instruments in a variety of currencies to reduce reliance on a single market or investor base; and
� minimized cost of capital—monitoring prevailing market conditions and choosing the most cost-effective instruments. There can be a trade-off between minimizing cost of funding and meeting other risk-management and regulatory requirements.
Optimal funding strategies that use various combinations of wholesale funding instruments are typically consolidated into the quarterly and annual funding plans. These funding plans are constantly reviewed and adjusted in response to changes in foreign exchange rates, interest rates, credit spreads, general market conditions, as well as the evolving bank’s funding needs. Banks therefore continuously analyze where their existing debt
4 Liquidity management is defined as “the management of cash flows across an institution’s balance sheet (and possibly across counterparties and locations). It involves the control of maturity/currency mismatches and the management of liquid asset holdings. A bank’s liquidity-management strategy sets out limits on such mismatches and the level of liquid assets to be retained to ensure that the bank remains able to meet funding obligations with immediacy across currencies and locations . . . (Committee on the Global Financial System 2010).
File information (for internal use only): Chart 1 - BOCR - 2017-05 - Article 4 - Chart 1 - EN.indd
Last output: 01/06/16 - 02:21PM
Chart 1: Big Six wholesale funding instrumentsFiscal year ending 31 October 2016
Senior unsecured medium-term and structured notes
Bearer deposit notes, commercial paper and certi� cates of deposit
Covered bonds/asset-backed securities
Mortgage securitization
Subordinated liabilities
Deposits from banks
Asset-backed commercial paper
Other
Credit card receivables and term asset-backed securitization
Source: Big Six annual reports, excluding repos and bankers’ acceptances
32%
29%
15%
12%
4%3%
2% 2% 1%
45 WholeSale Funding oF the Big Six Canadian BankS Bank of Canada Review • SpRing 2017
is trading in the secondary market, examine primary market conditions across the range of markets and currencies that they are active in, respond to reverse inquiries from investors asking to issue a particular instrument, and compare their funding credit spreads with those of their peers. Foreign exchange and cross-currency swaps are used to assess the cost attractive-ness of funding instruments in different currencies.
The turmoil in short-term funding markets during the global financial crisis exposed the risk of banks’ excessive reliance on short-dated funds, which motivated the Basel Committee on Banking Supervision to develop a new international regulatory framework. This framework is designed to improve the resilience of the global financial system by implementing a set of meas-ures at the institutional level.5 Some of these measures specifically target the funding strategies and liquidity-management practices of banks. For example, under LCR, stable funding sources such as retail and commercial deposits receive more favourable regulatory treatment relative to less-stable wholesale funding instruments.6
The introduction of new regulations and changes in internal risk manage-ment have led the Big Six to move toward a more centralized funding and liquidity-management structure where funding decisions are closely con-trolled by the central treasury rather than by individual business units. Centralized funding management is considered by the Big Six to be a more efficient way to create optimal funding mixes that satisfy regulatory require-ments while minimizing the costs, diversifying funding sources and properly transferring funding and associated regulatory costs to the appropriate individual business lines.
Post-Crisis Evolution in Wholesale FundingBefore the financial crisis, the Big Six Canadian banks were more focused on retail deposit funding and less reliant on money market wholesale funding than international investment banks were. Their leverage was also noticeably lower than that of US investment banks and major European banks (Gauthier and Tomura 2011). Not only did the Canadian banks have a better liability/capital position, but they also had more conservative mort-gage lending practices, resulting in stronger asset positions than those of some of their foreign peers.
The financial crisis exposed the fragility of global banks’ funding models, which included their vulnerability to liquidity shortfalls, in addition to cur-rency and maturity mismatches between assets and liabilities. The resilience of the Canadian banks relative to that of their peers throughout this period can be attributed to their sound risk-management practices, strong capital-ization buffers and more stable forms of funding. The banks’ capital position was further strengthened by the issuance of common shares during the crisis as well as strong retained earnings (Arjani and Graydon 2013).
After the crisis, stricter internal liquidity-management practices and regulatory changes led to the increase in the average maturity of wholesale borrowings, a higher use of foreign currency funding and the development of alterna-tive funding instruments, such as hybrid certificates of deposit (CDs) and contingent capital instruments. Those developments resulted in changes to Canadian banks’ wholesale funding mix and are described below.
5 See “Basel III: International Regulatory Framework for Banks.”
6 See the Office of the Superintendent of Financial Institutions Liquidity Adequacy Requirements.
� Centralized funding management is considered a more efficient way to create optimal funding mixes that satisfy regulatory requirements while minimizing the costs, diversifying funding sources and properly transferring funding and associated regulatory costs to the appropriate individual business lines
� The resilience of the Canadian banks relative to that of their peers throughout the global financial crisis can be attributed to their sound risk-management practices, strong capitalization buffers and more stable forms of funding
46 WholeSale Funding oF the Big Six Canadian BankS Bank of Canada Review • SpRing 2017
Increased Reliance on Retail and Commercial Deposits as a Share of Total LiabilitiesThe Big Six increased their reliance on retail and commercial deposits as a share of their total liabilities (Chart 2). These deposits increased from approximately 40 per cent at the beginning of the global financial crisis to around 47 per cent in October 2016. Most of this increase occurred immedi-ately following the financial crisis.
As mentioned previously, the liquidity and stable funding requirements intro-duced in the Basel III regulatory framework, such as the LCR, provide favour-able treatment for retail deposits as a stable source of funding. Therefore, banks made efforts to acquire more retail deposits than they had before the crisis (Chart 3). In some cases, the Big Six redesigned financial products offered in the personal and commercial banking units and launched adver-tising campaigns to attract customers to those new financial products, e.g., by offering a higher rate on a long-term Guaranteed Investment Certificate account or other demand deposit instruments.
� The liquidity and stable funding requirements introduced in the Basel III regulatory framework provide favourable treatment for retail deposits as a stable source of funding
File information (for internal use only): Chart 1 - BOCR - 2017-05 - Article 4 - Chart 2 - EN.indd
Last output: 01/06/16 - 02:21PM
Chart 2: Growth in Big Six retail and commercial deposits (Percentage of total liabilities)
Note: Retail and commercial deposits consist of individuals’ � xed-term deposits and all demand and notice deposits.
Source: Regulatory � lings of Canadian banks Last observation: 31 October 2016
47 WholeSale Funding oF the Big Six Canadian BankS Bank of Canada Review • SpRing 2017
Another channel for acquiring these types of liabilities has been through the purchase of financial institutions with a stable base of retail banking deposits in Canada (e.g., Bank of Nova Scotia bought ING Direct) or abroad (e.g., TD Bank Group bought South Financial group).
More Wholesale Funding Obtained AbroadSince the crisis, the Big Six have increased their foreign currency debt issu-ance, taking advantage of strong foreign investor demand for Canadian bank credit exposure given the relative strength shown by the Canadian banks through the crisis.7 This increase in foreign currency funding helps banks diversify their funding sources, opportunistically obtain attractive funding costs and support the growth of foreign currency assets (Chart 4).8
As shown in Chart 5, the share of wholesale funding issued in foreign cur-rencies increased from slightly less than 65 per cent in 2007 to 75 per cent at the end of 2016. In 2016, the Big Six issued a record amount of foreign currency debt, as valued in Canadian dollars.
To do so, they used a broad variety of foreign funding instruments from secured to unsecured across short- to long-term maturities. Short-term debt issued abroad consists primarily of CDs. The main market for Canadian CDs abroad has been US investors. The reforms to the US money market in 2016 forced a decline in demand from US money market funds for bank paper. The Big Six adapted to this change by switching toward new investors for CDs in the United States and increasing the amount of CDs issued in Europe and the United Kingdom.
Most of the increase in long-term foreign currency issuance came in the form of senior unsecured debt and covered bonds in the United States and, to a lesser extent, in Europe and the United Kingdom. 9
7 “Due to the relatively healthy position of Canadian banks vis-à-vis other banking systems, which allowed Canadian banks to expand internationally . . . ” (Chapman and Damar 2015, 12).
8 The growth in foreign currency assets has been partly driven by movements in exchange rates.
9 Covered bonds are debt instruments that are secured by a pool of assets. A covered bond collateral is separated from the assets of an issuer in the event of insolvency or bankruptcy. The Canadian covered bond legislative framework adopted in 2012 requires covered bonds to be secured only by uninsured mortgages. See Appendix for more details.
� The Bix Six Canadian banks have increased their foreign currency debt issuance, taking advantage of strong foreign investor demand for Canadain bank credit exposure
File information (for internal use only): Chart 1 - BOCR - 2017-05 - Article 4 - Chart 4 - EN.indd
Last output: 01/06/16 - 02:21PM
Chart 4: Increase in t he proportion of foreign assets in total assets
Local assets (left scale) Foreign assets (left scale)
Proportion of foreign assets (right scale)
Source: Regulatory � lings of Canadian banks Last observation: 31 October 2016
48 WholeSale Funding oF the Big Six Canadian BankS Bank of Canada Review • SpRing 2017
Growth in Alternative Funding InstrumentsChart 6 shows the growth in the outstanding amount of covered bonds issued by the Big Six since 2010. Covered bond issuance in Canada has been small, with most of the growth coming from issuance in larger foreign markets in the United States and Europe. The Office of the Superintendent of Financial Institutions (OSFI) established a prudential limit on the out-standing amount of covered bonds for a bank, which currently stands at 4 per cent of the institution’s total assets.
� Covered bond issuance in Canada has been small, with most of the growth coming from issuance in larger foreign markets
File information (for internal use only): Chart 1 - BOCR - 2017-05 - Article 4 - Chart 5 - EN.indd
Last output: 01/06/16 - 02:21PM
Chart 5: Increase in reliance on foreign currency wholesale deposits
File information (for internal use only): Chart 1 - BOCR - 2017-05 - Article 4 - Chart 6 - EN.indd
Last output: 01/06/16 - 02:21PM
Chart 6: Increase in the issuance of covered bonds
Euros (left scale) US dollars (left scale) British pound sterling (left scale)
Canadian dollars (left scale) Australian dollars (left scale) Swiss francs (left scale)
Outstanding amount of covered bonds (right scale)
Source: Bloomberg Last observation: 2016
0
20
40
60
80
100
120
140
160
0
5
10
15
20
25
30
35
40
45
2007 2008 2009 2010 2011 2012 2013 2014 2015 2016
Can$ billionsCan$ billions
49 WholeSale Funding oF the Big Six Canadian BankS Bank of Canada Review • SpRing 2017
Regulatory changes such as the LCR ratio encouraged banks to issue new hybrid CDs abroad: for example, some pay increasing interest rates during the life of the security, while others have callable and extendable options that allow the issuer to prolong or shorten the life of the CD.
Since the adoption of the non-viability contingent capital (NVCC) regula-tory requirements in 2013, most of the Big Six have issued NVCC notes in Canada and in the United States. NVCC refers to securities issued by a deposit-taking institution that require a conversion into the institution’s common shares when it is no longer financially viable. The NVCC require-ments ensure that investors in these instruments bear losses before tax-payers when the government rescues a non-viable bank.10 Total issuance of NVCC notes since the adoption of NVCC requirements has been around Can$20 billion.
Because of the potential risk of conversion into common shares, NVCC is the most expensive type of long-term debt instrument for the banks since it provides investors with the highest spread over the risk-free rate of the Government of Canada bonds.
Longer Average Maturity of Wholesale FundingDuring the global financial crisis, the turmoil in short-term funding markets caused banks globally, including the Big Six in Canada, to re-evaluate the risks associated with excessive reliance on short-term funding. As men-tioned in previous sections, new regulation also encourages more long-term funding. Both developments led Canadian banks to increase the average maturity of wholesale funding. As a result, the relative share of long-term funding has been increasing steadily since 2008 (Chart 7). The banks’ need to increase the term of their funding led them to pursue longer-term funding domestically and abroad, where they issued more senior unsecured notes and covered bonds.
10 See the Office of the Superintendent of Financial Institutions Capital Adequacy Requirements for more details.
� New regulation encourages more long-term funding
File information (for internal use only): Chart 1 - BOCR - 2017-05 - Article 4 - Chart 7 - EN.indd
Last output: 01/06/16 - 02:21PM
Chart 7: Share of banks’ wholesale deposit funding, by term length
Less than three months Three months to one year Longer than one year
Note: The maturity breakdown is presented for non-personal � xed-term deposits in US and Canadian dollars.
Source: Regulatory � lings of Canadian banks Last observation: 2016
ConclusionAfter the financial crisis, Canadian banks increased their reliance on retail and commercial deposits, increased the average maturity of their wholesale borrowings and further diversified their funding sources in foreign markets. The variety of funding tools and the changes in their use over time indicate that the Big Six Canadian banks are sophisticated financial institutions that value the diversity of funding sources, optimize their funding mixes and continuously adapt to a changing external environment.
appendixDescription of Wholesale Funding InstrumentsSecured short-term fundingRepurchase agreementA repurchase agreement (repo) is structured to resemble a collateralized loan. The seller of a security in a repo transaction receives cash and pays interest for the duration of the repo, while the buyer provides cash and holds a security as collateral. Repos are used mainly to finance purchases of secur-ities, such as bonds, and they play a fundamental role in the smooth func-tioning of the fixed-income market. The Canadian repo market is described in detail in Garriott and Gray (2016). Securities used in repos include equities, government bonds, treasury bills, provincial bonds, Canada Mortgage Bonds and corporate bonds.
Asset-backed commercial paperBanks can generally repackage sizable quantities of homogeneous, less liquid assets into a special-purpose vehicle that issues highly rated debt securities. Typical assets include mortgages, credit card receivables, automobile loans and leases, and trade receivables. The usual investors are mutual funds, pension funds, corporations and financial institutions (Toovey and Kiff 2003). Asset-backed commercial paper is a structured financial instrument that provides short-term wholesale funding for portfolios of less liquid assets that would otherwise be difficult to finance in the wholesale market.
Unsecured short-term fundingBankers’ acceptancesWhen a corporate borrower obtains funds through the bank’s BA lending facility (its BA credit line), the issuing bank guarantees the principal and interest payments on the BA loan. This guarantee is established to upgrade the credit quality of the loan, which allows the bank to resell the BA loan in the secondary market to other investors. These products have the same short-term credit rating as the issuing bank’s. Borrowers of BAs typically represent a broad group of corporations ranging from small businesses to mid-sized firms. The investors in BAs are money market funds, mutual funds, pension funds and asset managers. BAs are usually issued with maturities of 1, 3, 6 or 12 months depending on requirements of the BA borrower; however, close to 85 per cent of the overall BA issuance is for 1 month or less. BAs are the second largest money market instrument in Canada, behind Government of Canada treasury bills, with an average out-standing amount of $75 billion in 2016.
51 WholeSale Funding oF the Big Six Canadian BankS Bank of Canada Review • SpRing 2017
Bearer deposit notesBearer deposit notes (BDNs) are issued directly by the bank in its own name, allowing for flexibility in the size and term of the maturity. Typical maturities range from three months to one year. They are tradable on the secondary market and rank pari passu with the other unsecured and senior notes of the bank. These instruments are issued in the Canadian domestic market.
Certificates of depositCertificates of deposit (CDs) are issued by paying interest on deposits for a set period without the usual withdrawal flexibility offered by standard sav-ings accounts; they usually range in term length from 1 week to 18 months.
CDs differ from BDNs mostly in their legal form and they can also be issued in other currencies. Overall BDNs and CDs are complementary tools that allow banks to meet their funding needs while servicing corporations or money market funds who are often buyers of CDs.
Deposits from banksDeposits from banks are raised from other banks through the banks’ treas-uries and are reported in the wholesale funding composition tables of the Big Six. Most of these deposits are less than one month in term length. Deposits mostly differ from foreign currency CDs and BDNs in their legal form as they are not tradable securities.
Foreign currency funding transformationThe Big Six are active in foreign currency funding markets. They regularly borrow money in a foreign currency and convert those funds into Canadian dollars using foreign exchange forwards and swaps or cross-currency swaps for longer-dated transactions.
The foreign exchange forward and swap markets are very liquid, allowing banks to easily transform foreign currency funding into the desired currency. They can accommodate large transactions and be tailored to specific dates to suit funding requirements. These transactions generally range in horizon from overnight to five years.
Secured long-term funding Securitization is a type of secured funding and is usually accomplished by transforming a bank’s financial assets, such as loans or mortgages, into more-liquid assets with higher credit quality as a result of an over-collateralized structure11 with safeguards in case the issuer becomes insol-vent. Assets are typically transferred to a third party, such as a trust or a bank-sponsored structured entity, which in turn issues debt securities to fund the purchases of the assets. Most asset securitizations remain on a bank’s balance sheet and cannot be derecognized because the bank retains eco-nomic and credit exposure to the securitized assets. By retaining the risks and offering collateral as a guarantee, securitization usually achieves a lower cost of funding relative to an uncollateralized borrowing of similar maturity.
National Housing Act mortgage-backed securities and Canada Mortgage Bonds programsNational Housing Act mortgage-backed securities (NHA MBS) secur-ities are created by domestic banks through the Canada Mortgage and Housing Corporation (CMHC) program from pools of individual insured
11 For example, every $100 worth of debt sold to an investor could be supported by $120 of underlying assets.
52 WholeSale Funding oF the Big Six Canadian BankS Bank of Canada Review • SpRing 2017
mortgages whose principal and interest payments are passed through to MBS investors. Timely payments of interest and principal from NHA MBS securities are guaranteed by the CMHC, and thus these securities have the highest triple-A credit rating. NHA MBS securities can be sold to the Canada Housing Trust as part of the Canada Mortgage Bond (CMB) program or to outside investors. They can also remain on the balance sheets of the banks and be accounted as high-quality liquid assets. The typical maturity of an NHA MBS security is around five years, matching the most popular mort-gage type in Canada—a five-year fixed-rate mortgage.
The Canada Housing Trust purchases NHA MBS securities from financial institutions, which it funds through the issuance of CMBs. CMBs offer investors a standard fixed-income instrument with semi-annual interest payments and a full principal repayment at maturity. NHA MBS securities, in contrast, are subject to prepayment risk from the underlying mortgages. CMBs are typically issued as 5-year and 10-year fixed-rate as well as 5-year floating-rate securities. The ability of domestic banks to securitize mort-gages and to sell NHA MBS securities to the Canada Housing Trust is an important, cost-effective wholesale funding tool.12
Covered bondsCMHC defines covered bonds as “debt instruments that are issued by a Financial Institution and secured by a pool of assets (the “cover bond collat-eral”). The issuer of a covered bond pays periodic interest and principal on the bond, in accordance with terms that are set upon issuance. The covered bond collateral is segregated from the assets of the issuer in the event of insolvency or bankruptcy of the issuer and the pool of covered bond collat-eral is owned by a bankruptcy-remote special purpose vehicle (SPV) which guarantees the bonds.”13
In Canada, covered bonds issued by banks are secured by a dedicated pool of high-quality assets. In April 2012, the federal government introduced a framework that requires covered bonds to be secured only by uninsured mortgages (in contrast with NHA MBS). The Office of the Superintendent of Financial Institutions established a prudential limit on the outstanding amount of covered bonds for a financial institution; the limit currently stands at 4 per cent of a financial institution’s total assets.
Because covered bonds are typically structured to achieve the highest triple-A credit rating, they provide the issuing bank with cheaper funding than unsecured senior deposit notes do, although at a cost of encumbering the assets. Given the stronger investor demand in foreign markets for these types of product, domestic financial institutions have issued most of their covered bonds abroad, primarily in US dollars and euros and, to a lesser extent, in Australian dollars, Swiss francs and British pound sterling. Foreign currency proceeds are converted to Canadian dollars using the cross currency and foreign exchange swap markets. Covered bonds are usually issued with a five-year maturity, matching the typical mortgage term, although issuance at three-year and seven-year points is not uncommon.
Asset-backed securitiesAsset-backed securities (ABS) are created when banks combine similar assets, such as credit cards, automobile loans and home equity lines of credit into financial securities sold to investors. According to the Dominion
12 For further details on NHA MBS and CMB programs, see Mordel and Stephens (2015).
13 For more information, see the Canada Mortgage and Housing Corporation website.
53 WholeSale Funding oF the Big Six Canadian BankS Bank of Canada Review • SpRing 2017
Bond Rating Service, the total term ABS market size in Canada at the end of February 2017 was $40.1 billion.14 Credit cards are the largest asset class, representing around 68 per cent of the term ABS market.
Unsecured long-term fundingSenior deposit notesSenior deposit notes are a form of unsecured funding whose quality of credit ranks lower than secured funding but higher than more junior, sub-ordinated debt in the bank’s capital structure. Deposit notes can be viewed as de facto benchmarks for Canadian bank debt because of their large size and relatively good liquidity. They are typically issued with a 5-year maturity, although banks can also issue at 1-, 2-, 3-, 7- or 10-year maturities to meet investor demand for a particular duration and to build out an entire credit curve. Deposit notes are issued both in Canada and internationally in a var-iety of currencies, with foreign proceeds often swapped back to Canadian dollars. Investors in Canadian bank deposit notes are usually diverse and include asset managers, insurance companies, mutual funds and foreign bank treasuries. Big Six deposit notes constitute a significant part of the Canadian corporate bond market given their size and liquidity. In the past several years, Big Six deposit note issuance has represented around 30 per cent of the overall corporate issuance in Canadian dollars.
Subordinated debentures and capital instrumentsSubordinated notes are unsecured obligations that are subordinated in priority of payment to the bank’s depositors and creditors, such as holders of senior unsecured deposit notes. These securities are more costly for the banks to issue compared with covered bonds and senior deposit notes. Subordinated debentures issued before 1 January 2013 are viewed as non-qualifying capital instruments by the Office of the Superintendent of Financial Institutions and are subject to a phase-out period of 10 years.
Capital instruments include common equity, preferred shares and non-viability contingent capital notes. The main purpose of capital instruments is to satisfy regulatory capital requirements. The Big Six must meet minimum levels of capital ratios, and one of the avenues to achieve this is through the issuance of capital instruments. Issuance of these instruments is expensive for banks, and they are not considered major wholesale funding tools. More-over, capital instruments are typically riskier for investors than the other forms of funding discussed above.
14 Dominion Bond Rating Service, “DBRS Releases January 2017 Canadian ABS and Enhanced ABS Reports,” 8 March 2017.
54 WholeSale Funding oF the Big Six Canadian BankS Bank of Canada Review • SpRing 2017
Literature CitedArjani, N. and P. Graydon. 2013. “Lessons from the Financial Crisis:
Bank Performance and Regulatory Reform.” Bank of Canada Staff Discussion Paper No. 2013-4.
Basel Committee on Banking Supervision. 2013. Basel III: The Liquidity Coverage Ratio and Liquidity Risk Monitoring Tools. Bank for International Settlements.
Chapman, J. and H. E. Damar. 2015. “Shock Transmission Through International Banks: Canada.” Bank of Canada Technical Report No. 105.
Committee on the Global Financial System. 2010. Funding Patterns and Liquidity Management of Internationally Active Banks. Bank for International Settlements.
Garriott, C. and K. Gray. 2016. “Canadian Repo Market Ecology.” Bank of Canada Staff Discussion Paper No. 2016-8.
Gauthier C. and H. Tomura. 2011. “Understanding and Measuring Liquidity Risk: A Selection of Recent Research.” Bank of Canada Review (Spring): 3–11.
Mordel, A. and N. Stephens. 2015. “Residential Mortgage Securitization in Canada: A Review.” Bank of Canada Financial System Review (December): 39–48.
Toovey, P. and J. Kiff. 2003. “Developments and Issues in the Canadian Market for Asset-Backed Commercial Paper.” Bank of Canada Financial System Review (June): 43–49.
55 WholeSale Funding oF the Big Six Canadian BankS Bank of Canada Review • SpRing 2017
Why Is Global Business Investment So Weak? Some Insights from Advanced EconomiesRobert Fay, Justin-Damien Guénette, Martin Leduc and Louis Morel, International Economic Analysis Department
� Business investment in advanced economies has been underwhelming since the 2007–09 global financial crisis, explained, in part, by slower growth in aggregate demand. A renewed period of weakness in invest-ment spending began in 2014, likely reflecting the impact of lower com-modity prices and, most recently, a rise in economic uncertainty.
� In coming years, there is scope for growth in investment spending to pick up as the drag from low commodity prices and elevated uncertainty fades.
� But even as these headwinds recede, business investment growth is likely to remain slower than in the pre-crisis period largely because of structural factors. Such factors include slowing growth rates for popula-tion and total factor productivity and an increasing share of services in the economy.
Non-residential private investment, commonly referred to as business investment, is a crucial economic indicator that carries a greater import-ance than its small share of aggregate output may suggest. In particular, it reflects expectations about the future, accounts for a large portion of the variation in output, and contributes to the productive capacity essential to sustaining increases in living standards (Schembri 2017). During the 2007–09 global financial crisis, business investment plummeted and a sub-sequent rebound faltered.1 Now, almost a decade later, despite substantial monetary stimulus, investment spending continues to struggle to exceed its pre-crisis level. Furthermore, forecasts of business investment have been consistently over-optimistic, proving to be a leading source of error in the Bank of Canada’s forecasts of output for the United States and Canada (Guénette et al. 2016).
This article focuses on business investment in advanced economies. Specifically, the article presents an aggregate measure of business invest-ment obtained by combining data for 30 industrialized countries, covering
1 While several advanced economies have experienced declines in housing and government investment, business investment accounted for the majority of the weakness in global investment (International Monetary Fund 2015).
The Bank of Canada Review is published two times a year. Articles undergo a thorough review process. The views expressed in the articles are those of the authors and do not necessarily reflect the views of the Bank. The contents of the Review may be reproduced or quoted, provided that the publication, with its date, is specifically cited as the source.
56 Why IS GloBAl BuSInESS InvEStmEnt So WEAk? SomE InSIGhtS from AdvAncEd EconomIES Bank of Canada Review • SpRing 2017
nearly all advanced economies. After outlining the evolution of advanced-economy business investment since the crisis, the article uses regression analysis to explain the main drivers of investment, particularly since 2011. The slow growth of aggregate demand explains a large share of the weak-ness in investment growth in the post-crisis period, but does not account for all of it. Other factors, such as elevated uncertainty; tight credit conditions, particularly in the euro area; and the decline in commodity prices, also help to explain the post-crisis dynamics of investment. The article concludes by discussing the implications of the main findings for the outlook for business investment growth. While there is scope for a favourable reversal of uncer-tainty and higher commodity prices to boost investment growth in the near-term, structural factors such as aging demographics reduce the likelihood that these improvements will be sustained.
The Evolution of Business Investment in Advanced Economies Since the Global Financial CrisisIn the wake of the global financial crisis and ensuing worldwide recession, business investment in advanced economies plummeted (Chart 1). This decline was followed first by a relatively muted recovery and then by a stall in 2015. While this pattern characterizes the aggregate experience in advanced economies, it masks heterogeneity in the speed of the recovery across countries and regions. See Box 1 for details on how the data in this article were constructed.
The recovery in investment was relatively quick in the United States, sup-ported by policy actions, particularly in the form of very accommodative monetary and fiscal policy to stimulate domestic demand as well as com-prehensive reforms to the financial system. As early as 2008, the US Federal Reserve launched quantitative easing measures to lower interest rates across the yield curve and contribute to an easing of financial conditions, and thereby stimulate borrowing. Also, the government quickly enacted a
� The recovery in investment was relatively quick in the United States
File information (for internal use only): Chart 1 - BOCR - 2017-05 - Article 5 - Chart 1 - EN.indd
Last output: 01/06/16 - 02:21PM
Chart 1: Business investment in advanced economiesIndex: 2008Q1 = 100, quarterly data
United States Euro area Japan Advanced economies aggregate
Note: Advanced economies aggregate includes 30 countries accounting for 95 per cent of GDP in advanced economies. For details, see Box 1.
Sources: Organisation for Economic Co-operation and Development, International Monetary Fund, Statistical Of� ce of the European Communities via Haver Analytics and Bank of Canada calculations Last observation: 2016Q1
57 Why IS GloBAl BuSInESS InvEStmEnt So WEAk? SomE InSIGhtS from AdvAncEd EconomIES Bank of Canada Review • SpRing 2017
series of regulatory reforms to improve both the capital base and the resili-ence of the banking sector, eventually enhancing the sector’s capacity to lend to businesses. As a result, US banks were in a position to start loos-ening credit conditions in 2010 after having tightened them for two years (Chart 2, blue bars).
Although US business investment has moved above its pre-crisis peak, it is still well below the level observed in a typical recovery (Chart 3). This trajec-tory is consistent with developments following a financial crisis where debt overhangs weigh substantially on aggregate demand (Reinhart and Rogoff 2008; Albuquerque and Krustev 2017). Since 2015, US business investment has moved sideways.
In addition to the global financial crisis, the euro area faced a sovereign debt crisis in 2011–12 that was characterized by a further deterioration in credit conditions; these have only recently begun to improve (Chart 2, red bars).
In Japan, meanwhile, domestic investment has been sluggish because manufacturing firms, notably in the auto industry, have been increasingly relocating production abroad, mostly to fast-developing Asian economies,
� Credit conditions have recently begun to improve in the euro area, while domestic investment has been sluggish in Japan
Box 1
Data on Business Investment in Advanced EconomiesFinding data on business investment for all advanced econo mies is challenging. While most statistical agen-cies systematically report estimates of gross fi xed capital formation (GFCF), which include residential and govern-ment investment in addition to business investment, only 17 countries directly report private business investment. These countries are Australia, Belgium, Canada, Denmark, Finland, France, Germany, Iceland, Japan, the Netherlands, New Zealand, Norway, South Korea, Sweden, Switzerland, the United Kingdom and the United States. They account for 35 per cent of global gross domestic product (GDP) and 83 per cent of advanced-economy GDP expressed in terms of purchasing power parity (PPP).
To increase our coverage of advanced economies as much as possible, we relax our defi nition of business investment for 13 additional countries to also include government investment.1 This measure is obtained by subtracting housing investment from GFCF. These 13 countries are Austria, the Czech Republic, Estonia, Ireland, Israel, Italy, Latvia, Lithuania, Luxembourg, Portugal, Slovakia, Slovenia and Spain. The total 30 countries thus account for 40 per cent of global GDP and 95 per cent of advanced-economy
1 For the 17 countries for which we have access to data under both defi nitions (busi-ness investment and GFCF excluding housing), the advanced-economy aggregate investment series display very similar behaviour.
GDP in PPP terms.2 To our knowledge, this is the most com-prehensive data set of business investment assembled to date pertaining to advanced economies.
All investment data in this article come from the Organisation for Economic Co-operation and Development. The investment data for the 30 advanced economies have been aggregated into a summary measure (displayed in Chart 1) by weighting them using relative GDP based on PPP reported by the International Monetary Fund. This aggre-gation method was also used to obtain measures of aggre-gate demand (proxied by GDP excluding investment), and credit conditions, both of which were used in our regres-sion analysis. More specifi cally, we create a measure of aggregate credit conditions that captures the willingness of banks to lend to fi rms in advanced economies by combining results from individual country and regional senior loan o� cer surveys (the various results are normalized before aggregation to impose a common standard deviation). In countries where senior loan o� cer surveys are not available, we use a regional proxy. Before 2003, the European Central Bank’s Bank Lending Survey was not conducted. Therefore, the aggregate measure during this time refl ects results from the US senior loan o� cer survey, for the most part, and, to a much lesser extent, results from Australia, Canada, Finland and Japan.
2 Relative to the International Monetary Fund’s classifi cation of advanced econo-mies, because of data unavailability, our analysis does not include the following advanced economies: Cyprus, Greece, Hong Kong, Malta, Macao, San Marino, Singapore and Taiwan.
58 Why IS GloBAl BuSInESS InvEStmEnt So WEAk? SomE InSIGhtS from AdvAncEd EconomIES Bank of Canada Review • SpRing 2017
to take advantage of lower labour costs and rising demand in the host coun-tries. This offshoring is occurring despite favourable domestic profitability and liquidity conditions (Kang and Piao 2015).
Commodity-producing advanced economies experienced a boom in their business investment, especially from 2010 to 2014 (Chart 4), linked to the robust demand for resources and the resulting high prices for oil and other commodities. However, from 2014 onward, with the large decline observed in commodity prices, investment in these commodity-producing economies has retreated substantially.
� Commodity-producing advanced economies experienced a boom in their business investment, especially from 2010 to 2014
File information (for internal use only): Chart 1 - BOCR - 2017-05 - Article 5 - Chart 2 - EN.indd
Last output: 04/18/17 - 10:48AM
Chart 2: Bank credit conditions for lending to fi rmsNet tightening of credit conditions, quarterly data
United States Euro area Advanced economies aggregate
Note: Advanced economies aggregate includes 30 countries accounting for 95 per cent of GDP in advanced economies. For details, see Box 1.
Sources: National sources, International Monetary Fund via Haver Analytics and Bank of Canada calculations Last observation: 2016Q1
File information (for internal use only): Chart 1 - BOCR - 2017-05 - Article 5 - Chart 3 - EN.indd
Last output: 01/06/16 - 02:21PM
Chart 3: Comparative recoveries in business investmentReal GDP across economic cycles; Index: start of recession = 100, quarterly data
United States—current cycle Advanced economies—current cycle The Big Five modern � nancial crises
Average of past US recessions Range of past US recessions (1948 onward)
Note: The Big Five modern � nancial crisis, as described by Reinhart and Rogoff (2008), are Spain (1977), Norway (1987), Finland (1991), Sweden (1991) and Japan (1992).
Sources: National sources and authors’ calculations
60
80
100
120
140
160
180
-2 -1 0 1 2 3 4 5 6 7 8
Index
Start of the recession
59 Why IS GloBAl BuSInESS InvEStmEnt So WEAk? SomE InSIGhtS from AdvAncEd EconomIES Bank of Canada Review • SpRing 2017
The Determinants of Business InvestmentA firm’s decision to move forward with an investment plan is complex and influenced by a number of factors. For some, it could stem from the need to replace or repair aging capital—either machinery and equipment or struc-tures. New investment is often required because the value and usefulness of physical capital tend to depreciate over time; technology-related invest-ments such as computers, for example, depreciate rapidly. Firms also invest in additional capital to increase production in response to growing demand. In both cases, firms invest to maintain or improve their competitiveness and maximize profits.
Below is a description of some of the major determinants of business invest-ment that will be used in the analysis of investment dynamics.
Aggregate demandFirms invest primarily to increase capacity to meet the current and antici-pated demand for their products. In the empirical literature on business investment, it is common to use gross domestic product (GDP) excluding investment as the measure of aggregate demand to avoid using invest-ment to explain itself.2 Aggregate demand is generally viewed as the most important driver of the short-term dynamics of business investment. In the long run, however, both aggregate demand and investment are driven by structural factors, such as demographics related to population aging and the economy’s total factor productivity. The rate of depreciation also plays a role in determining the growth rate of business investment.3
Financial conditionsFinancial conditions encompass two elements: the real user cost of capital and credit conditions.
2 While anticipated demand likely plays an important role in shaping investment decisions, data quanti-fying firm expectations are generally not available.
3 Aggregate depreciation is a function of the sectoral composition of the economy.
File information (for internal use only): Chart 1 - BOCR - 2017-05 - Article 5 - Chart 4 - EN.indd
Last output: 01/06/16 - 02:21PM
Chart 4: Real business investment in commodity-producing advanced economiesIndex: 2010Q1 = 100, quarterly data
Canada Australia Norway
Source: Organisation for Economic Co-operation and Development Last observation: 2016Q1
60 Why IS GloBAl BuSInESS InvEStmEnt So WEAk? SomE InSIGhtS from AdvAncEd EconomIES Bank of Canada Review • SpRing 2017
The real user cost of capital is the minimum return that a firm needs to cover depreciation, taxes and the opportunity costs of the funds used to finance a project. The user cost of capital is a function of the level of interest rates—all else being equal, higher user costs imply lower investment spending.
When a firm approaches a bank and requests a loan to finance an invest-ment expenditure, the bank will evaluate the level of risk associated with the proposed project. Banks generally set minimum credit standards that an applicant must meet to be eligible for a loan. If the creditworthiness of the applicant (or its investment project) does not meet these standards (also referred to as credit conditions), the bank will reject the loan application. Credit conditions are therefore an important driver of the supply of bank credit and of business investment more generally. This is especially the case in countries where firms highly depend on bank lending (rather than on private equities or bonds), such as countries in the euro area.
In an economic downturn, even when monetary policy becomes more accommodative, banks typically tighten credit standards, making credit less available at any given interest rate.4 As mentioned earlier, credit conditions tightened substantially in most advanced economies during the global finan-cial crisis, and they continued to tighten in the euro area until about 2014, as a result of the European debt crisis (Chart 2, black line). In response, some central banks, including the European Central Bank, adopted innovative policies to improve the supply of credit to the economy (Fay and Hess 2016; Santor and Suchanek 2016). Nevertheless, the unprecedented tightening of credit conditions during these two episodes of intense financial stress high-lighted the key role of credit supply in promoting investment (European Central Bank 2016).
UncertaintyGiven the long lead times for planning and implementation as well as the considerable time it may take before an investment starts to pay off, firms’ investment decisions can be greatly affected by uncertainty. When condi-tions are highly uncertain, investors possess a valuable option to wait—an option that is lost once irreversible investment decisions are made. Since waiting allows investors the opportunity to collect more information, elevated uncertainty and risk aversion lead firms to take a more cautious approach to investments.5 It is therefore not surprising to observe that firms delay investment purchases in periods of high uncertainty until they have more clarity about the future (Bernanke 1983).6 Conversely, a favour-able resolution of uncertainty could increase investment by unleashing the “animal spirits” of entrepreneurs.
Several recent studies have estimated economic uncertainty using sto-chastic volatility models (Jurado, Ludvigson and Ng 2015; Jo and Sekkel 2016). By focusing on the volatility in the unforecastable component of a large number of economic indicators, these measures may provide a more reliable signal for business investment. Relative to other popular uncertainty proxies, such as the economic policy uncertainty index published by Baker,
4 The cost of external financing also depends on the financial position of the borrower. When the bor-rower’s balance sheet is healthy (elevated net worth), the firm is able to reduce its borrowing costs (Bernanke and Gertler 1989). Given that cash flow tends to decrease in recession periods, this balance sheet effect adds to the procyclicality of investment financing.
5 Dixit and Pindyck (1994) argue that uncertainty increases the benefit of waiting for more information before incurring the sunk cost of investment projects.
6 Leduc and Liu (2016) find that increases in uncertainty have effects similar to those of negative aggre-gate demand shocks; that is, they raise unemployment and lower inflation.
� The unprecedented tightening of credit conditions during episodes of intense financial stress highlighted the key role of credit supply in promoting investment
61 Why IS GloBAl BuSInESS InvEStmEnt So WEAk? SomE InSIGhtS from AdvAncEd EconomIES Bank of Canada Review • SpRing 2017
Bloom and Davis (2016) or a volatility index derived from stock options (VIX), these economic uncertainty indexes capture the same broad trend and point to less frequent, larger and more persistent uncertainty shocks (Chart 5).7
Commodity pricesSome advanced economies, such as Canada and Australia, are also important commodity producers. Since the extraction of resources typically requires large infrastructure investment over a long period, movements in commodity prices—energy prices especially—play a key role in determining the level of commodity production and therefore investment. Shifts in com-modity prices can significantly affect the behaviour of business investment in these economies. Interestingly, even in countries where commodities do not represent a large share of output, pronounced and persistent move-ments in commodity prices can have very large effects on investment in the commodity sector and thus a substantial impact on aggregate investment. This was evident in the United States in the lead up to the 2014 oil price collapse, when investment in the extraction of oil and natural gas sectors ramped up as firms exploited new technologies and then subsequently plummeted alongside prices.
What Explains the Recent Slowdown in Business Investment?A number of papers have analyzed the post-crisis weakness in business investment in advanced economies. Some (e.g., Barkbu et al. 2015; Lewis et al. 2014; Bussière, Ferrara and Milovich 2015) find evidence that uncer-tainty explains a large portion of this weakness. In contrast, economists at the International Monetary Fund (IMF 2015) find that subdued aggre-gate demand can fully explain the behaviour of investment. Leboeuf and
7 Jo and Sekkel’s (2016) stochastic volatility measure of uncertainty is only available for the United States.
File information (for internal use only): Chart 1 - BOCR - 2017-05 - Article 5 - Chart 5 - EN.indd
Last output: 01/06/16 - 02:21PM
Chart 5: Uncertainty measuresIndex: 2008Q1 = 100, quarterly data
US Stochastic Volatility Measure (Jo and Sekkel) Global Economic Policy Uncertainty (Baker, Bloom and Davis) VIX (Chicago Board Options Exchange Volatility Index)
Sources: Jo and Sekkel (2016); Baker, Bloom and Davis (2016); and Bloomberg Last observation: 2016Q1
62 Why IS GloBAl BuSInESS InvEStmEnt So WEAk? SomE InSIGhtS from AdvAncEd EconomIES Bank of Canada Review • SpRing 2017
Fay (2016) limit their analysis to a small set of advanced economies and find that the main driver behind the post-crisis weakness in investment is pes-simism on the part of firms about foreign demand prospects. Heightened uncertainty, tight credit conditions and weak corporate profits are also found to explain the slowdown in investment.
Ultimately, explaining business investment is a difficult task, and no single model appears superior to others (Bernanke 2003). Accelerator-type models, which relate the dynamics of business investment primarily to the dynamics of aggregate demand, are a relatively simple framework that generally fit the data well over a long time period and provide good-quality forecasts of invest-ment (Lee and Rabanal 2010; IMF 2015; Furman 2015).
An accelerator-type model (Box 2) is used as the baseline investment model in this article. As shown by the red line in Chart 6, the simple model cannot explain the severity of the investment contraction during the crisis and the recent slowdown. When we add a role for uncertainty, credit conditions and energy prices to the model, however, it is able to capture the investment dynamics much better (Chart 6, blue line).
Box 2
An Accelerator-Type Model of Business InvestmentFor the purpose of this article, we estimate accelerator-type regression models. We fi rst consider a simple model by regressing real aggregate business investment (Investment) in 30 advanced economies on real aggregate demand (GDP excluding investment):
This regression is estimated using ordinary least squares on fi rst-di� erenced data spanning from the fi rst quarter of 1994 to the fi rst quarter of 2016. Real aggregate demand is defi ned as advanced-economy real gross domestic product (GDP) excluding investment to avoid using investment to explain itself. Aggregate demand is found to be positively related to business investment and explains close to half of the historical variation in business investment.
To better explain the dynamics of business investment, we augment the simple accelerator model by including credit conditions, uncertainty and real energy prices: 1
1 The user cost of capital was not statistically signifi cant when included in our short-run dynamic equation. Although a long-run relationship exists between investment and the user cost of capital, including this long-run e� ect in an error-correction framework does not alter our main fi ndings.
Uncertainty is captured by the Jo and Sekkel (2016) sto-chastic volatility measure, and credit conditions are proxied by a weighted average of credit conditions in advanced economies (Chart 2, black line).2 We use the global energy commodity price index produced by the IMF (real energy prices).3
As in the simple model, the aggregate demand component is found to be positively related to business investment. Uncertainty and credit conditions also have the expected sign: rising uncertainty and tighter credit conditions are both associated with a slowdown in investment growth. Real energy prices are found to have a positive and signifi -cant e� ect on business investment in advanced economies. This may sound counterintuitive given that, on average, advanced economies are net importers of energy. However, movements in energy prices over time have generally been dominated by current and expected developments in global demand (Kilian and Murphy 2014).4
2 We tried several proxies for uncertainty in the regression, including the volatility index derived from stock options (VIX), the economic policy uncertainty index and the stochastic volatility measure of Jo and Sekkel (2016). Only the stochastic volatility measure is found to be useful in explaining the behaviour of aggregate business investment in advanced economies.
3 The nominal energy price index is divided by the US GDP defl ator to obtain a real price measure.
4 This fi nding also holds when we estimate the equation using data for net com-modity importers only, reinforcing the notion that oil prices primarily capture the infl uence of global aggregate demand rather than of supply-side commodity considerations.
63 Why IS GloBAl BuSInESS InvEStmEnt So WEAk? SomE InSIGhtS from AdvAncEd EconomIES Bank of Canada Review • SpRing 2017
Based on the historical estimation of the augmented accelerator model, we can decompose the movements in the growth rate of aggregate-advanced economy business investment since 2006 (Chart 7).
In the wake of the global financial crisis, the sharp decline in aggregate demand and its spillovers to energy prices was a key factor behind the exceptional weakness in business investment. However, the dynamics of demand are not the whole story. We find that the sharp tightening of credit conditions was a key contributor to the slump in investment. Furthermore, the surge in economic uncertainty also contributed to reduced investment during this period.
File information (for internal use only): Chart 1 - BOCR - 2017-05 - Article 5 - Chart 6 - EN.indd
Last output: 01/06/16 - 02:21PM
Chart 6: Evolution of advanced-economy business investment versus simulationsDynamic simulations, index: 2008Q1 = 100, quarterly data
Advanced economies aggregate
Accelerator model Augmented accelerator model
Note: Advanced economies aggregate includes 30 countries accounting for 95 per cent of GDP in advanced economies. For details, see Box 1.
Sources: Organisation for Economic Co-operation and Development, International Monetary Fund via Haver Analytics and authors’ calculations Last observation: 2016Q1
64 Why IS GloBAl BuSInESS InvEStmEnt So WEAk? SomE InSIGhtS from AdvAncEd EconomIES Bank of Canada Review • SpRing 2017
During 2010–11, business investment in advanced economies recovered strongly, aided by a rebound in aggregate demand and a gradual dissipation of uncertainty. However, investment growth experienced a notable slow-down through 2012–13, weighed down by moderating aggregate demand, combined with a tightening of credit conditions in Europe.
Since 2014, business investment growth in advanced economies has experienced a renewed episode of weakness despite a strengthening in aggregate demand. This slowdown can be explained by the fall in energy prices (Chart 7, purple bar).8 Also, the persistent rise in macroeconomic uncertainty (Chart 7, green bar) has played an increasing role in dampening investment since 2014. This rise in macroeconomic uncertainty may reflect a sequence of unanticipated economic and political developments, such as the sharp fall in oil and other commodity prices, crises in several emerging markets (e.g., Brazil and Argentina) and political developments in the United States and Europe.
ConclusionAlthough simple accelerator models generally do a reasonable job at explaining business investment dynamics in advanced economies, move-ments in aggregate demand are unable to account for the severity of the decline in business investment during the global financial crisis as well as the more recent slowdown. When the simple model is augmented to take into account credit conditions, uncertainty and commodity market develop-ments, it better tracks the weakness of business investment in the crisis and post-crisis periods. This finding reinforces the idea that investment is weak relative to past business cycles because there are more factors at play than just demand in the current cycle. The slowdown since 2014 appears to be linked primarily to the collapse of global energy prices and increased macroeconomic uncertainty.
While energy prices have rebounded since early 2016, they remain low relative to their pre-2014 levels. Also, uncertainty remains elevated. The favourable resolution of uncertainty, combined with a broad easing of credit conditions, particularly in the euro area, could support an acceleration of business investment in advanced economies in the coming years. The potential benefits of such resumption of investment growth are clear. In the short term, stronger investment could boost economic activity, supporting the closing of output gaps and allowing central banks to normalize policy. In the longer term, stronger investment would lead to sustained increases in living standards by increasing the economy’s stock of productive capital and spurring technological innovation. By supporting both stronger aggregate demand and the long-term potential growth of the economy, accelerated investment can help achieve faster rates of economic growth.
In the longer run, however, structural factors, such as demographics, imply a lower average track for business investment. In recent years, advanced economies have experienced a slowdown in the growth of the labour force as a result of an aging population. A similar slowdown was observed in the growth rate of productivity, possibly linked to a lower scale and scope of technology adoption, a plateauing of educational attainment or simply a
8 As mentioned by Fay, Guénette and Morel (2016), following the large correction in energy prices observed in mid-2014, the response of investment in oil-producing countries has been negative, large and quick to materialize.
� The slowdown since 2014 appears to be linked primarily to the collapse of global energy prices and increased macroeconomic uncertainty
65 Why IS GloBAl BuSInESS InvEStmEnt So WEAk? SomE InSIGhtS from AdvAncEd EconomIES Bank of Canada Review • SpRing 2017
shift in productivity growth back to historical norms (Reza and Sarker 2015).9 While there is scope for stronger productivity growth in the future, supported by rising spending on research and development worldwide, demographic trends are unlikely to reverse.10 Therefore, while a pickup in business invest-ment is expected to occur, a return to pre-crisis rates of growth is unlikely.
Finally, this article has focused on the investment behaviour in advanced economies only. Exploring differences as well as linkages with emerging-market economies remains an area for further analysis.
9 Other structural forces weighing on the growth rate of business investment include the lesser need for physical capital in our modern high-tech economy (Summers 2015), the longer-term shift toward ser-vice sector activity (OECD 2015), and globalization and the related shift in investment toward emerging markets (Berganza, Romero and Sastre 2016).
10 D’Souza and Williams (2017) argue that a wider adoption of digital technologies could increase future trend productivity.
Literature CitedAlbuquerque, B. and G. Krustev. 2017. “Debt Overhang and Deleveraging
in the US Household Sector: Gauging the Impact on Consumption.” Review of Income and Wealth (February).
Baker, S. R, N. Bloom and S. J. Davis. 2016. “Measuring Economic Policy Uncertainty.” Quarterly Journal of Economics 131 (4): 1593–1636.
Barkbu, B., S. P. Berkmen, P. Lukyantsau, S. Saksonovs and H. Schoelermann. 2015. “Investment in the Euro Area: Why Has It Been Weak?” International Monetary Fund Working Paper No. 15/32.
Berganza, J. C., M. Romero and T. Sastre. 2016. “The Weakness of Business Investment in the Advanced Economies.” Banco de España Economic Bulletin (January): 13–26.
Bernanke, B. S. 1983. “Irreversibility, Uncertainty, and Cyclical Investment.” Quarterly Journal of Economics 98 (1): 85–106.
—. 2003. “Will Business Investment Bounce Back?” Remarks to the Forecasters Club of New York, New York, 24 April.
Bernanke, B. S. and M. Gertler. 1989. “Agency Costs, Net Worth, and Business Fluctuations.” American Economic Review (79): 14–31.
Bussière, M., L. Ferrara and J. Milovich. 2015. “Explaining the Recent Slump in Investment: The Role of Expected Demand and Uncertainty.” Banque de France Working Paper No. 571.
Dixit, A. K. and R. S. Pindyck. 1994. Investment Under Uncertainty. Princeton: Princeton University Press.
D’Souza, C. and D. Williams. 2017. “The Digital Economy.” Bank of Canada Review (Spring): 5–18.
European Central Bank. 2016. “Business Investment Developments in the Euro Area Since the Crisis.” Economic Bulletin 7: 48–70.
Fay, R., J.-D. Guénette and L. Morel. 2016. “The Global Benefits of Low Oil Prices: More Than Meets the Eye.” Bank of Canada Staff Analytical Note No. 2016-13.
66 Why IS GloBAl BuSInESS InvEStmEnt So WEAk? SomE InSIGhtS from AdvAncEd EconomIES Bank of Canada Review • SpRing 2017
Fay, R. and K. Hess. 2016. “Monetary Policy Frameworks: Recent International Developments.” Bank of Canada Review (Spring): 43–56.
Furman, J. 2015. “Business Investment in the United States: Facts, Explanations, Puzzles, and Policies.” Remarks to the US Progressive Policy Institute, 30 September.
Guénette, J.-D., N. Labelle, M. Leduc and L. Rennison. 2016. “The Case of Serial Disappointment.” Bank of Canada Staff Analytical Note No. 2016-10.
International Monetary Fund (IMF). 2015. “Private Investment: What’s the Holdup?” World Economic Outlook (April): 111–143.
Jo, S. and R. Sekkel. 2016. “Macroeconomic Uncertainty Through the Lens of Professional Forecasters.” Bank of Canada Staff Working Paper No. 2016-5.
Jurado, K., S. Ludvigson and S. Ng. 2015. “Measuring Uncertainty.” American Economic Review 105 (3): 1177–1216.
Kang, J. S. and S. Piao. 2015. “Production Offshoring and Investment by Japanese Firms.” International Monetary Fund Working Paper No. 15/183.
Killian, L. and D. P. Murphy. 2014. “The Role of Inventories and Speculative Trading in the Global Market for Crude Oil.” Journal of Applied Econometrics 29 (3): 454–478.
Leboeuf, M. and R. Fay. 2016. “What Is Behind the Weakness in Global Investment?” Bank of Canada Staff Discussion Paper No. 2016-5.
Leduc, S. and Z. Liu. 2016. “Uncertainty Shocks Are Aggregate Demand Shocks.” Journal of Monetary Economics 82: 20–35.
Lee, J. and P. Rabanal. 2010. “Forecasting U.S. Investment.” International Monetary Fund Working Paper No. 10/246.
Lewis, C., N. Pain, J. Strásky and F. Menkyna. 2014. “Investment Gaps after the Crisis.” OECD Economics Department Working Paper No. 1168.
Organisation for Economic Co-operation and Development. 2015. “Lifting Investment for Higher Sustainable Growth.” Chapter 3, OECD Economic Outlook 2015/1: 205–279.
Reinhart, C. M. and K. S. Rogoff. 2008. “Is the 2007 U.S. Sub-Prime Financial Crisis So Different? An International Historical Comparison.” American Economic Review 98 (2): 339–344.
Reza, A. and S. Sarker. 2015. “Is Slower Growth the New Normal in Advanced Economies?” Bank of Canada Review (Autumn): 1–13.
Santor, E. and L. Suchanek. 2016. “A New Era of Central Banking: Unconventional Monetary Policies.” Bank of Canada Review (Spring): 29–42.
Schembri, L. 2017. “Getting Down to Business: Investment and the Economic Outlook.” Remarks to the Greater Vancouver Board of Trade, Vancouver, 21 March.
Summers, L. H. 2015. “Reflections on Secular Stagnation.” Remarks to the Julius-Rabinowitz Center, Princeton University, 19 February.
67 Why IS GloBAl BuSInESS InvEStmEnt So WEAk? SomE InSIGhtS from AdvAncEd EconomIES Bank of Canada Review • SpRing 2017