50
Inflation Report February 2018

Inflation ReportFebruary 2018
Inflation ReportFebruary 2018
In order to maintain price stability, the Government has set the Bank’s Monetary Policy Committee (MPC) a target for the annual inflation rate of the Consumer Prices Index of 2%. Subject to that, the MPC is also required to support the Government’s economic policy, including its objectives for growth and employment.
The Inflation Report is produced quarterly by Bank staff under the guidance of the members of the Monetary Policy Committee. It serves two purposes. First, its preparation provides a comprehensive and forward-looking framework for discussion among MPC members as an aid to our decision-making. Second, its publication allows us to share our thinking and explain the reasons for our decisions to those whom they affect.
Although not every member will agree with every assumption on which our projections are based, the fan charts represent the MPC’s best collective judgement about the most likely paths for inflation, output and unemployment, as well as the uncertainties surrounding those central projections.
This Report has been prepared and published by the Bank of England in accordance with section 18 of the Bank of England Act 1998.
The Monetary Policy Committee:Mark Carney, GovernorBen Broadbent, Deputy Governor responsible for monetary policyJon Cunliffe, Deputy Governor responsible for financial stabilityDave Ramsden, Deputy Governor responsible for markets and bankingAndrew HaldaneIan McCaffertyMichael SaundersSilvana TenreyroGertjan Vlieghe
PowerPoint™ versions of the Inflation Report charts and Excel spreadsheets of the data underlying most of them are available at www.bankofengland.co.uk/inflation-report/2018/february-2018
© Bank of England 2018
ISSN 2514-4103 (Online)

Monetary Policy Summary i
1 Global economic and financial market developments 1
1.1 Global economic developments 11.2 Commodity markets and developments in inflation 31.3 Developments in financial markets 4Box 1 Monetary policy since the November Report 5Box 2 Monitoring the effects of the rise in Bank Rate on retail interest rates 8
2 Demand and output 10
2.1 Output 102.2 Household spending 112.3 Housing 132.4 Government 142.5 Net trade and the current account 142.6 Business investment 15Box 3 Brexit and business investment 17
3 Supply and the limits to growth 19
3.1 Slack in the economy 193.2 The outlook for potential supply 21Box 4 The equilibrium rate of unemployment 22Box 5 The implications of changing demographics for UK labour supply 25
4 Costs and prices 28
4.1 Consumer price developments and the near-term outlook 284.2 External cost pressures 294.3 Domestic cost pressures 304.4 Inflation expectations 32
5 Prospects for inflation 34
5.1 The MPC’s key judgements and risks 365.2 The projections for demand, unemployment and inflation 42Box 6 Revisions to the MPC’s productivity projections 41Box 7 Other forecasters’ expectations 44
Glossary and other information 45
Contents
Monetary Policy Summary i
Monetary Policy Summary
The Bank of England’s Monetary Policy Committee (MPC) sets monetary policy to meet the 2% inflation target, and in a way that helps to sustain growth and employment. At its meeting ending on 7 February 2018, the MPC voted unanimously to maintain Bank Rate at 0.5%. The Committee voted unanimously to maintain the stock of sterling non-financial investment-grade corporate bond purchases, financed by the issuance of central bank reserves, at £10 billion. The Committee also voted unanimously to maintain the stock of UK government bond purchases, financed by the issuance of central bank reserves, at £435 billion.
The MPC’s latest projections for output and inflation are set out in detail in the accompanying February Inflation Report. The global economy is growing at its fastest pace in seven years. The expansion is becoming increasingly broad-based and investment driven. Notwithstanding recent volatility in financial markets, global financial conditions remain supportive. UK net trade is benefiting from robust global demand and the past depreciation of sterling. Along with high rates of profitability, the low cost of capital and limited spare capacity, strong global activity is supporting business investment, although it remains restrained by Brexit-related uncertainties. Household consumption growth is expected to remain relatively subdued, reflecting weak real income growth. GDP growth is expected to average around 1¾% over the forecast, a slightly faster pace than was projected in November despite the updated projections being conditioned on the higher market-implied path for interest rates and stronger exchange rate prevailing in financial markets at the time of the forecast.
While modest by historical standards, that rate of growth is still expected to exceed the diminished rate of supply growth. Following its annual assessment of the supply side of the economy, the MPC judges that the UK economy has only a very limited degree of slack and that its supply capacity will grow only modestly over the forecast, averaging around 1½% per year. This reflects lower growth in labour supply and rates of productivity growth that are around half of their pre-crisis average. As growth in demand outpaces that of supply, a small margin of excess demand emerges by early 2020 and builds thereafter. CPI inflation fell from 3.1% in November to 3.0% in December. Inflation is expected to remain around 3% in the short term, reflecting recent higher oil prices. More generally, sustained above-target inflation remains almost entirely due to the effects of higher import prices following sterling’s past depreciation. These external forces slowly dissipate over the forecast, while domestic inflationary pressures are expected to rise. The firming of shorter-term measures of wage growth in recent quarters, and a range of survey indicators that suggests pay growth will rise further in response to the tightening labour market, give increasing confidence that growth in wages and unit labour costs will pick up to target-consistent rates. On balance, CPI inflation is projected to fall back gradually over the forecast but remain above the 2% target in the second and third years of the MPC’s central projection.
As in previous Reports, the MPC’s projections are conditioned on the average of a range of possible outcomes for the United Kingdom’s eventual trading relationship with the European Union. The projections also assume that, in the interim, households and companies base their decisions on the expectation of a smooth adjustment to that new trading relationship. Developments regarding the United Kingdom’s withdrawal from the European Union — and in particular the reaction of households, businesses and asset prices to them — remain the most significant influence on, and source of uncertainty about, the economic outlook. In such exceptional circumstances, the MPC’s remit specifies that the

ii Inflation Report February 2018
Committee must balance any trade-off between the speed at which it intends to return inflation sustainably to the target and the support that monetary policy provides to jobs and activity.
Over the past year, a steady absorption of slack has reduced the degree to which it was appropriate for the MPC to accommodate an extended period of inflation above the target. Consequently, at its November 2017 meeting, the Committee tightened modestly the stance of monetary policy in order to return inflation sustainably to the target.
Since November, the prospect of a greater degree of excess demand over the forecast period and the expectation that inflation would remain above the target have further diminished the trade-off that the MPC is required to balance. It is therefore appropriate to set monetary policy so that inflation returns sustainably to its target at a more conventional horizon. The Committee judges that, were the economy to evolve broadly in line with the February Inflation Report projections, monetary policy would need to be tightened somewhat earlier and by a somewhat greater extent over the forecast period than anticipated at the time of the November Report, in order to return inflation sustainably to the target.
In light of these considerations, all members thought that the current policy stance remained appropriate to balance the demands of the MPC’s remit. Any future increases in Bank Rate are expected to be at a gradual pace and to a limited extent. The Committee will monitor closely the incoming evidence on the evolving economic outlook, and stands ready to respond to developments as they unfold to ensure a sustainable return of inflation to the 2% target.

Section 1 Global economic and financial market developments 1
1 Global economic and financial market developments
The outlook for global growth has strengthened further. As growth has recovered, spare capacity has diminished, and market interest rates imply some gradual withdrawal of global monetary policy stimulus over coming years. Sustaining current rates of global GDP growth has become increasingly dependent on a recovery in productivity growth.
Global GDP growth picked up during 2016 and has been strong over the past year (Section 1.1). Weighted by countries’ shares of UK exports, global growth is estimated to have remained at 0.8% in 2017 Q4. That pace of growth is expected to persist in the near term, above expectations in November. Survey indicators of output (Chart 1.1) and new orders remain robust, particularly in the euro area and United States. Measures of business and consumer confidence are also healthy. Despite further falls in unemployment across a number of countries, inflation remains subdued relative to historical norms (Section 1.2). There are some signs of a recovery in wage growth, however, and further rises in commodity prices are pushing up global inflation.
In light of the recovery in GDP growth, some monetary policy stimulus has begun to be withdrawn across a number of advanced economies, although policy remains supportive. In November, the MPC raised Bank Rate to 0.5%, which has begun to be passed through to retail lending and deposit rates (see Box 2). Market-implied interest rate paths imply a further gradual tightening in policy over the coming years.
The improvements in global growth and confidence since early 2016 have been an important factor supporting rises in risky asset prices in many countries over that period (Section 1.3). Since late January, however, around the time the MPC’s projections were finalised, equity prices have fallen sharply and volatility in equity markets has risen.(1)
1.1 Global economic developments
In recent years, four-quarter GDP growth has recovered towards pre-crisis rates in a number of advanced economies (Chart 1.2). That pace of growth has been met largely by increased employment, with productivity growth still subdued. As a result, much of the slack in labour markets that opened up following the financial crisis appears to have been absorbed.
(1) All financial market data shown in charts within this section are to 31 January 2018.
5
4
3
2
1
0
1
2
3
2006 08 10 12 14 16 18
World(c)
United States(a)
Differences from averages since 2000(number of standard deviations)
Euro area(b)
+
–
Chart 1.1 Survey indicators point to robust advanced‑economy growth Survey measures of international output growth
Sources: IHS Markit, JPMorgan, Thomson Reuters Datastream, US Bureau of Economic Analysis, US Institute for Supply Management (ISM) and Bank calculations.
(a) Manufacturing production and non-manufacturing business activity ISM survey indices of monthly output growth, weighted together using their nominal shares in value added.
(b) Composite (manufacturing and services) purchasing managers’ index (PMI) survey of monthly output growth.
(c) Composite (manufacturing and services) PMI survey of monthly output growth. Based on the results of surveys in over 40 countries. Together these countries account for around 90% of global GDP.
10
8
6
4
2
0
2
4
6
8
2000 02 04 06 08 10 12 14 16
Percentage changes on a year earlier
United Kingdom
Range of G7 excluding United Kingdom(a)
Average of G7 excluding United Kingdom(b)
+
–
Chart 1.2 GDP growth has risen across a number of advanced economiesGDP in the G7 economies
Sources: OECD, Thomson Reuters Datastream and Bank calculations.
(a) Real GDP growth in Canada, France, Germany, Italy, Japan and the United States. Latest observation is for 2017 Q3.
(b) Unweighted average of real GDP growth in the countries listed in footnote (a).
2 Inflation Report February 2018
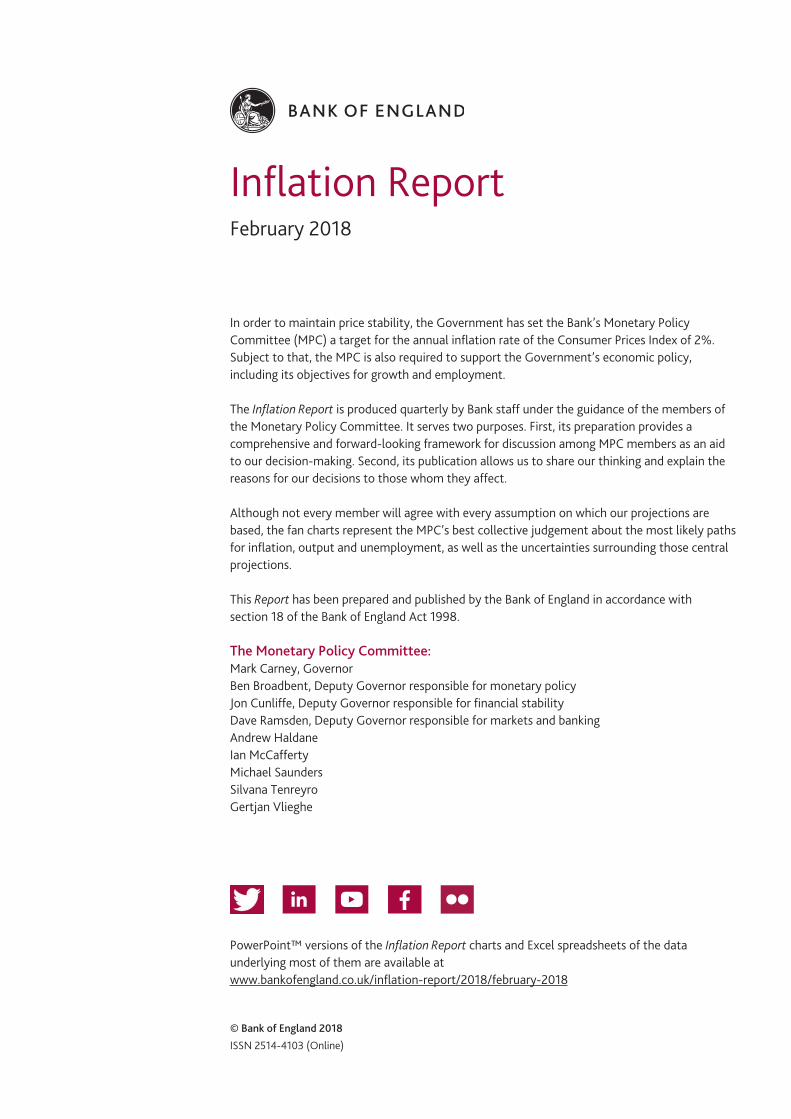
With less remaining slack in labour markets, sustaining the recent pace of global GDP growth has therefore become increasingly dependent on a pickup in productivity growth. Current rates of productivity growth, and shortfalls against pre-crisis trends, differ across advanced economies (Chart 1.3). In particular, euro-area productivity growth had begun to slow prior to the crisis, whereas US and UK productivity growth picked up during the early 2000s before slowing more sharply.(2)
Productivity growth is expected to recover across advanced economies over coming years, but to remain below pre-crisis rates. Investment spending was reined in following the global financial crisis. That continues to weigh on growth in the capital stock — the resources and equipment available to produce output. Investment growth has begun to recover in many countries, however, which will support growth in the capital stock and productivity.
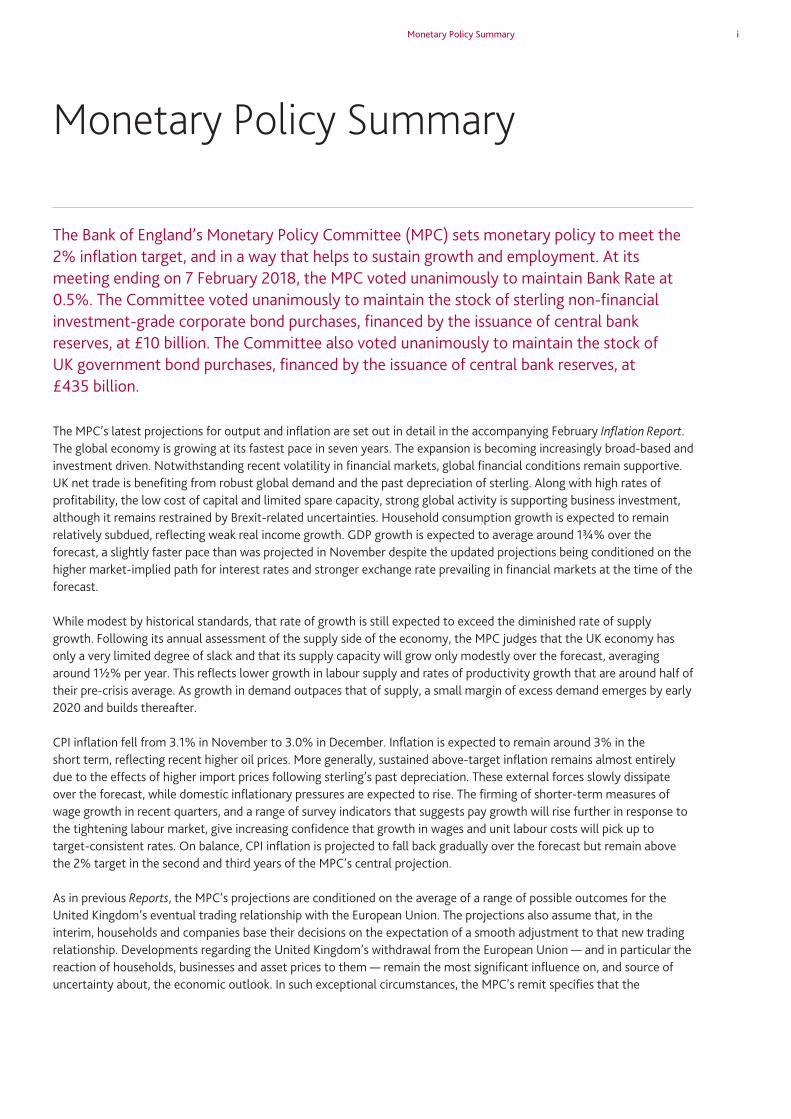
The euro areaQuarterly euro-area GDP growth was robust in 2017 and faster than in preceding years, at 0.6%–0.7% (Table 1.A). That pickup in growth has become increasingly broad-based across countries, supported by an improvement in financial conditions, alongside rises in business and consumer confidence. Business survey indicators, such as the IHS Markit purchasing managers’ indices, have risen further in recent months (Chart 1.1). Consistent with that, quarterly GDP growth is projected to be around ¾% in the near term, stronger than projected three months ago (Table 1.B).
The recovery in demand has led to a continuing decline in measures of economic slack. Euro-area unemployment was 8.7% in December, down from 9.7% a year earlier (Chart 1.4), although the extent of the fall in unemployment has varied across countries. As the recent pace of growth continues, unemployment is projected to fall further in the near term.
The United StatesAt 0.6% in 2017 Q4, US GDP growth was broadly in line with expectations three months ago (Table 1.A). Inventories dragged on growth in Q4, which is unlikely to persist. Business surveys point to quarterly growth of around ¾% in 2018 H1 (Chart 1.1). Personal and corporate tax cuts announced in December are expected to provide a stimulus to activity over the next three years. Those cuts are slightly larger, and take effect earlier, than assumed in November, implying additional support to activity in the near term (Section 5).
Indicators suggest that there is probably little spare capacity remaining in the US economy. A variety of measures of labour market slack — including the unemployment rate (Chart 1.4),
(2) For further detail on the factors driving those trends, and for the United Kingdom in particular, see Tenreyro, S (2018), ‘The fall in productivity growth: causes and implications’.
0.5
0.0
0.5
1.0
1.5
2.0
2.5
3.0
3.5
4.0
1980 85 90 95 2000 05 10 15
Percentage changes on a year earlier
United States
Euro area
United Kingdom +
–
Chart 1.3 Productivity growth has been subdued across advanced economies in recent yearsEuro‑area, UK and US productivity(a)
Sources: Eurostat, Feenstra, R C, Inklaar, R and Timmer, M P (2015), ‘The next generation of the Penn World Table’, American Economic Review, Vol. 105, No. 10, pages 3,150–182, OECD, ONS, US Bureau of Economic Analysis, US Bureau of Labor Statistics and Bank calculations.
(a) Five-year rolling averages of the change in output per hour.
Table 1.A Global GDP growth has been strong in recent quartersGDP in selected countries and regions(a)
Percentage changes on a quarter earlier
Averages 2017
1998–2007 2012–13 2014–16 Q1 Q2 Q3 Q4
United Kingdom 0.7 0.5 0.6 0.3 0.3 0.4 0.5Euro area (38%) 0.6 0.0 0.4 0.6 0.7 0.7 0.6United States (18%) 0.7 0.5 0.5 0.3 0.8 0.8 0.6China (3%)(b) 2.5 1.9 1.7 1.4 1.9 1.8 1.6Japan (2%) 0.3 0.4 0.2 0.4 0.7 0.6 n.a.India (1%) 1.8 1.5 1.8 1.4 1.4 1.6 n.a.Russia (1%)(c) 1.9 0.6 -0.2 0.8 1.0 0.1 n.a.Brazil (1%) 0.8 0.6 -0.7 1.3 0.7 0.1 n.a.UK-weighted world GDP(d) 0.7 0.4 0.6 0.6 0.8 0.8 0.8
Sources: IMF World Economic Outlook (WEO), National Bureau of Statistics of China, OECD, ONS, Thomson Reuters Datastream and Bank calculations.
(a) Real GDP measures. Figures in parentheses are shares in UK goods and services exports in 2016.(b) The 1998–2007 average for China is based on OECD estimates. Estimates for 2008 onwards are from the
National Bureau of Statistics of China.(c) The earliest observation for Russia is 2003 Q2. (d) Constructed using data for real GDP growth rates for 180 countries weighted according to their shares in
UK exports. For the vast majority of countries, the latest observation is 2017 Q3. For those countries where data are not yet available, Bank staff projections are used.
Developments anticipated in November during 2017 Q4–2018 Q2
Developments now anticipated during 2018 Q1–Q3
Advanced economies Revised up
• Quarterlyeuro-areaGDPgrowthtoaverage a little above ½%.
• QuarterlyUSGDPgrowthtoaveragealittle above ½%.
• Quarterlyeuro-areaGDPgrowthtoaverage around ¾%.
• QuarterlyUSGDPgrowthtoaveragearound ¾%.
Rest of the world Revised up
• Averagefour-quarterPPP-weightedEME growth of around 4¾%; GDP growth in China to average a little above 6½%.
• Averagefour-quarterPPP-weightedEME growth of around 5¼%; GDP growth in China to average around 6¾%.
The exchange rate Higher than expected
• SterlingERItoevolveinlinewiththeconditioning assumptions.
• ThesterlingERIis3%higher.Sterling ERI to evolve in line with the conditioning assumptions.
Table 1.B Monitoring the MPC’s key judgements

Section 1 Global economic and financial market developments 3
underemployment and the rate at which employees are voluntarily leaving jobs — are around their pre-crisis levels.
Emerging market economiesIn China, GDP growth continues to be broadly stable (Table 1.A). In 2017 Q4, four-quarter GDP growth was unchanged at 6.8%. Over the past year, activity has been supported by both increased export demand and strong domestic credit expansion. Macroprudential policy measures have led to some slowing in house price inflation and the authorities have continued to take measures to reduce financial sector leverage. There remain challenges for the authorities in maintaining current rates of GDP growth while reducing risks to financial stability.(3)
Growth in other emerging market economies (EMEs) continued to recover in 2017, supported by: higher capital inflows; the recovery in advanced-economy demand; and, for commodity exporters, the recovery in commodity prices since early 2016. Those factors are expected to underpin slightly stronger growth in EMEs than anticipated in November.
1.2 Commodity markets and developments in inflation
Core inflation — which excludes food and energy prices — remains subdued relative to historical norms in the euro area and United States (Table 1.C). There are some signs of wage growth picking up in those regions, however. And with unemployment set to decline further in the euro area, and seemingly little slack in the United States at present, wage growth and broader inflationary pressures are projected to build over 2018.
Despite subdued core inflation, rises in commodity prices are pushing up headline inflation in the euro area, United States and more widely. As a result, global inflation is a little higher than projected three months ago.
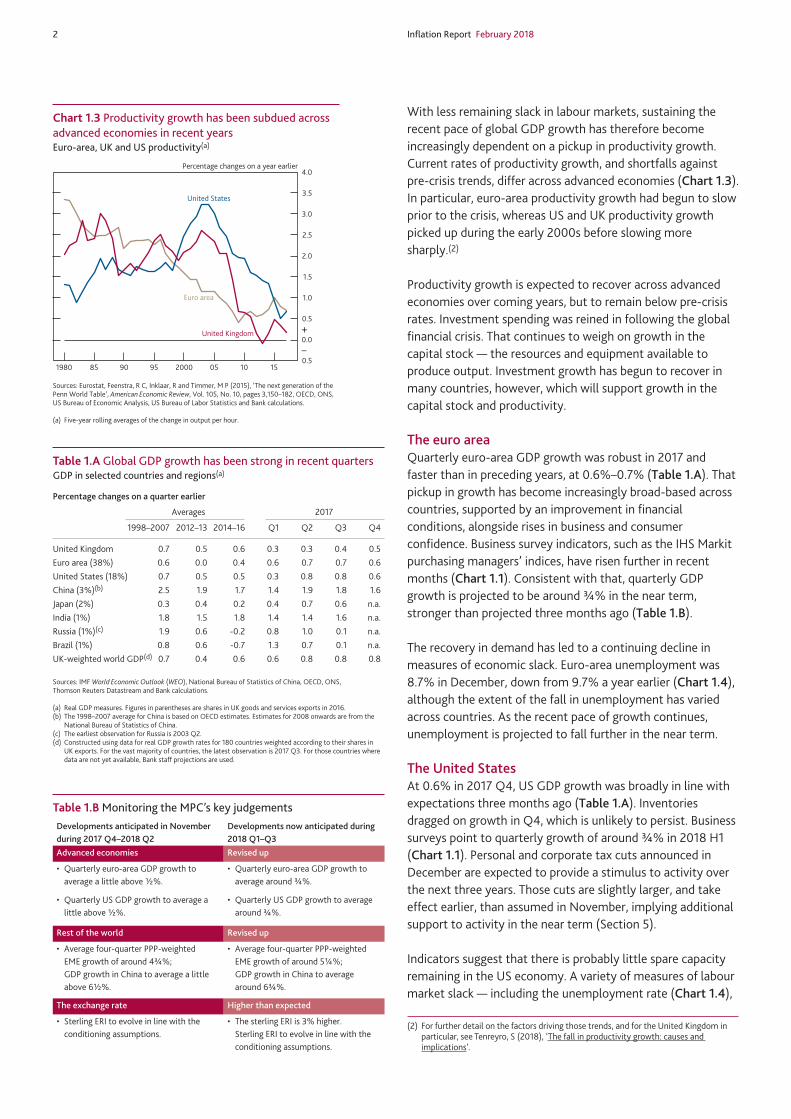
US dollar oil prices have risen fairly steadily since mid-2017, as have industrial metals prices (Chart 1.5). Those rises have in part reflected improvements in global economic activity that have increased demand for commodities. Demand for oil exceeded IEA projections over the second half of 2017, particularly among advanced economies. The rises also reflect supply developments. The supply of oil has risen at a relatively modest pace leading to continued falls in oil stocks. In part, that reflects increased compliance with the late-2016 agreement between OPEC and some non-OPEC oil producers to curb production, which has since been extended to the end of 2018.
(3) For more detail on financial vulnerabilities in China, see the November 2017 Financial Stability Report.
0
2
4
6
8
10
12
14
2000 02 04 06 08 10 12 14 16
Per cent
United States
Euro area
United Kingdom
Chart 1.4 Unemployment has continued to fall across advanced economiesEuro‑area, UK and US unemployment rates(a)
Sources: Eurostat, ONS, Thomson Reuters Datastream and US Bureau of Labor Statistics.
(a) Percentages of economically active population. UK data are a three-month measure and are to November 2017. Euro-area and US data are monthly measures and are to December 2017.
Table 1.C Euro‑area and US core inflation rates remain subdued Inflation and wage growth in selected countries and regions
Per cent
Monthly averages 2017 2018
1998– 2016 2017 2017 Oct. Nov. Dec. Jan. 2007 H1 Q3
Annual headline consumer price inflation
United Kingdom 1.6 0.7 2.4 2.8 3.0 3.1 3.0 n.a.
Euro area(a) 2.0 0.2 1.6 1.4 1.4 1.5 1.4 1.3
United States(b) 2.0 1.2 1.8 1.5 1.6 1.8 1.7 n.a.
UK-weighted world inflation(c) 2.0 0.8 1.6 1.6 n.a. n.a. 2.0 n.a.
Annual core consumer price inflation (excluding food and energy)(d)
United Kingdom 1.2 1.3 2.1 2.6 2.7 2.7 2.5 n.a.
Euro area(a) 1.6 0.9 1.0 1.2 0.9 0.9 0.9 1.0
United States(b) 1.8 1.8 1.7 1.4 1.4 1.5 1.5 n.a.
Annual UK-weighted world export price inflation excluding oil(c)
1.1 -1.8 3.1 2.4 n.a. n.a. 1.7 n.a.
Annual wage growth
United Kingdom 4.3 2.4 2.1 2.3 2.5 2.5 n.a. n.a.
Euro area(e) 2.4 1.3 1.6 1.7 n.a. n.a. n.a. n.a.
United States(f) 3.2 2.3 2.4 2.5 n.a. n.a. 2.6 n.a.
Sources: Eurostat, IMF WEO, ONS, Thomson Reuters Datastream, US Bureau of Economic Analysis and Bank calculations.
(a) Data points for January 2018 are flash estimates.(b) Personal consumption expenditure price index inflation. Data points for December 2017 are preliminary
estimates.(c) UK-weighted world consumer price inflation is constructed using data for consumption deflators for
51 countries, weighted according to their shares in UK exports. UK-weighted world export price inflation excluding oil is constructed using data for non-oil export deflators for 51 countries, excluding major oil exporters, weighted according to their shares in UK exports. For the vast majority of countries, the latest observations are 2017 Q3. Where data are not yet available, Bank staff projections are used. Figures for December are Bank staff projections for 2017 Q4.
(d) For the euro area and the United Kingdom, excludes energy, food, alcoholic beverages and tobacco. For the United States, excludes food and energy.
(e) Compensation per employee.(f) Employment Cost Index for wages and salaries of civilian workers.
4 Inflation Report February 2018
By influencing production and transport costs, global commodity prices are also important drivers of the prices of other internationally traded goods. Annual world export price inflation excluding oil is estimated to have slowed to 1.7% in 2017 Q4 (Table 1.C). The more recent rises in commodity prices are, however, set to push up world export prices and therefore UK import price inflation slightly in the near term (Section 4).
1.3 Developments in financial markets
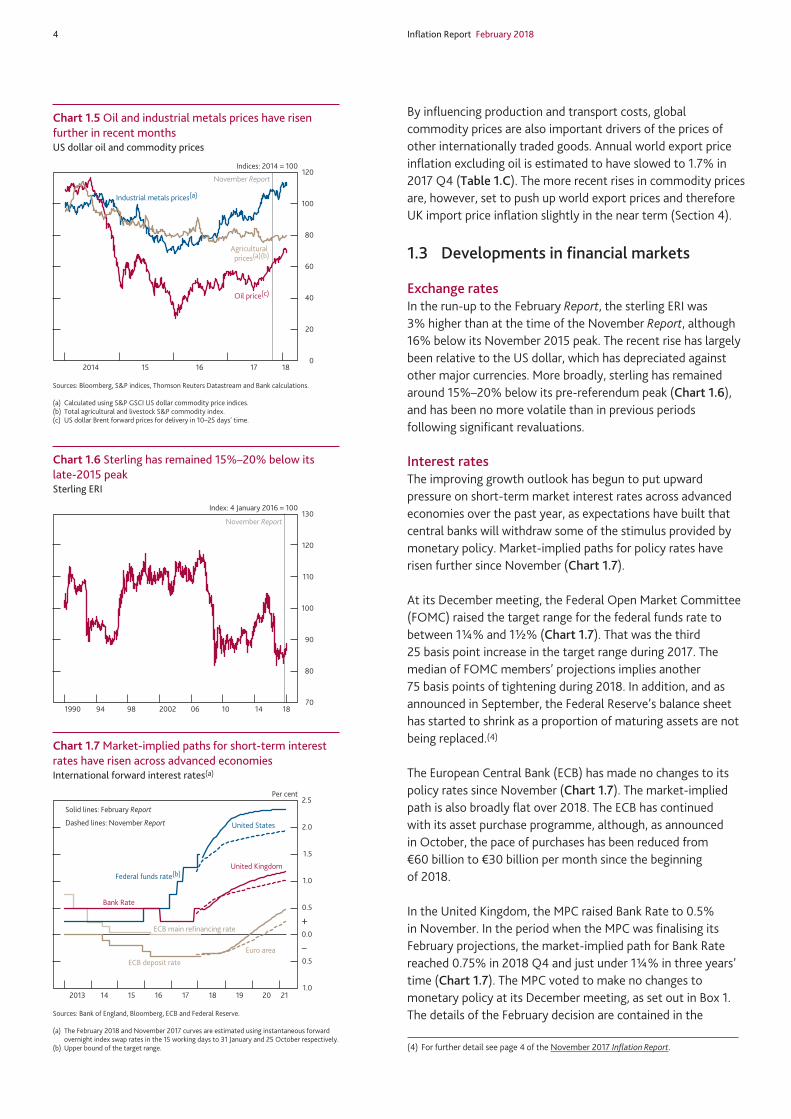
Exchange ratesIn the run-up to the February Report, the sterling ERI was 3% higher than at the time of the November Report, although 16% below its November 2015 peak. The recent rise has largely been relative to the US dollar, which has depreciated against other major currencies. More broadly, sterling has remained around 15%–20% below its pre-referendum peak (Chart 1.6), and has been no more volatile than in previous periods following significant revaluations.
Interest ratesThe improving growth outlook has begun to put upward pressure on short-term market interest rates across advanced economies over the past year, as expectations have built that central banks will withdraw some of the stimulus provided by monetary policy. Market-implied paths for policy rates have risen further since November (Chart 1.7).
At its December meeting, the Federal Open Market Committee (FOMC) raised the target range for the federal funds rate to between 1¼% and 1½% (Chart 1.7). That was the third 25 basis point increase in the target range during 2017. The median of FOMC members’ projections implies another 75 basis points of tightening during 2018. In addition, and as announced in September, the Federal Reserve’s balance sheet has started to shrink as a proportion of maturing assets are not being replaced.(4)
The European Central Bank (ECB) has made no changes to its policy rates since November (Chart 1.7). The market-implied path is also broadly flat over 2018. The ECB has continued with its asset purchase programme, although, as announced in October, the pace of purchases has been reduced from €60 billion to €30 billion per month since the beginning of 2018.
In the United Kingdom, the MPC raised Bank Rate to 0.5% in November. In the period when the MPC was finalising its February projections, the market-implied path for Bank Rate reached 0.75% in 2018 Q4 and just under 1¼% in three years’ time (Chart 1.7). The MPC voted to make no changes to monetary policy at its December meeting, as set out in Box 1. The details of the February decision are contained in the
(4) For further detail see page 4 of the November 2017 Inflation Report.
November Report
0
20
40
60
80
100
120
2014 15 16 17 18
Indices: 2014 = 100
Industrial metals prices(a)
Agricultural prices(a)(b)
Oil price(c)
Chart 1.5 Oil and industrial metals prices have risen further in recent monthsUS dollar oil and commodity prices
Sources: Bloomberg, S&P indices, Thomson Reuters Datastream and Bank calculations.
(a) Calculated using S&P GSCI US dollar commodity price indices.(b) Total agricultural and livestock S&P commodity index.(c) US dollar Brent forward prices for delivery in 10–25 days’ time.
70
80
90
100
110
120
130
1990 94 98 2002 06 10 14 18
Index: 4 January 2016 = 100
November Report
Chart 1.6 Sterling has remained 15%–20% below its late‑2015 peakSterling ERI
2.5
+
–
1.0
0.5
0.0
0.5
1.0
1.5
2.0
2013 14 15 16 17 18 19 20 21
Per cent
United Kingdom
Euro area
United States
Solid lines: February Report
Dashed lines: November Report
ECB deposit rate
ECB main refinancing rate
Federal funds rate(b)
Bank Rate
Chart 1.7 Market‑implied paths for short‑term interest rates have risen across advanced economiesInternational forward interest rates(a)
Sources: Bank of England, Bloomberg, ECB and Federal Reserve.
(a) The February 2018 and November 2017 curves are estimated using instantaneous forward overnight index swap rates in the 15 working days to 31 January and 25 October respectively.
(b) Upper bound of the target range.

Section 1 Global economic and financial market developments 5
Monetary Policy Summary and in more detail in the Minutes of the meeting.
Longer-term interest rates have risen in recent months (Chart 1.8). Those rates had been broadly flat over much of 2017 — albeit at higher levels than in 2016, on average. Although rates were broadly flat, model-based estimates suggest that expected policy rates continued to rise during 2017, but were offset by falls in term premia. Term premia have risen more recently, although they remain relatively compressed. Term premia capture the additional compensation that investors require for holding long-term bonds and therefore reflect market participants’ perceptions of the risks and uncertainties around future interest rates. Market contacts cite the global inflation environment and the prospect of increases in government bond issuance, net of central bank asset purchases, over the coming year as potential sources of the recent rise.
More broadly, continued historically low long-term interest rates in large part probably reflect slow-moving structural factors such as demographics. Those factors are likely to continue to weigh on global interest rates for some time to come.(5) Consistent with this, market-implied paths suggest that policy rates will rise by a limited amount in coming years (Chart 1.7), particularly in comparison to previous tightening cycles.
(5) For further discussion, see the box on pages 8–9 of the November 2016 Inflation Report; Vlieghe, G (2016), ‘Monetary policy expectations and long-term interest rates’; and Vlieghe, G (2017), ‘Real interest rates and risk’.
0
1
2
3
4
5
2014 15 16 17 18
Per cent
United States
Germany
United Kingdom
France
November Report
Chart 1.8 Long‑term interest rates have risen slightly in recent monthsFive‑year, five‑year forward nominal interest rates(a)
Sources: Bloomberg and Bank calculations.
(a) Zero-coupon forward rates derived from government bond prices.
Box 1Monetary policy since the November Report
The MPC’s central projection in the November Report was for four-quarter GDP growth to pick up from early 2018 and settle around 1¾%. Consumption growth was projected to remain subdued, while strong global growth, together with the lower level of sterling, was expected to support net trade and business investment. Inflation was projected to rise a little further above the 2% target in the near term before falling back over 2018. Conditional on the path for Bank Rate implied by market interest rates prevailing at the time, inflation was projected to end the forecast period slightly above the 2% target. That central projection was also conditioned on the Term Funding Scheme, and on the stocks of purchased gilts and corporate bonds remaining at £435 billion and £10 billion respectively.
At its meeting ending on 13 December 2017, the MPC noted that the recent news in the macroeconomic data had been mixed and relatively limited. Global growth had remained strong, while some indicators of domestic activity in Q4
had softened a little. The measures announced in the Autumn Budget would lessen the drag on demand from fiscal consolidation, relative to previous plans. The labour market remained tight, and the latest surveys suggested this would continue. The impact of November’s rise in Bank Rate on the interest rates faced by households and firms had been consistent with previous experience, but it was too early to form a comprehensive view of its effect on the economy.
CPI inflation had risen to 3.1% in November, slightly higher than the MPC had anticipated at the time of the November Report. The MPC continued to judge that inflation was likely to be close to its peak, and would decline towards the 2% target in the medium term.
All Committee members judged it appropriate to leave the stance of monetary policy unchanged. The MPC was of the view that, were the economy to follow the path expected in the November Report, further modest increases in Bank Rate would be warranted over the next few years, in order to return inflation sustainably to the target. Any future increases in Bank Rate were expected to be at a gradual pace and to a limited extent.

6 Inflation Report February 2018
Corporate capital marketsDevelopments in capital markets influence the ease and cost of raising finance for companies. Equity prices rose sharply in late 2017 and early 2018, particularly in the United States (Chart 1.9). The recently announced US tax cuts (Section 1.1) appeared to boost US equities in particular, while rises in commodity prices (Section 1.2) supported the equity values of companies within the energy sector. Since late January, however, around the time the MPC’s projections were finalised, equity prices have fallen back and volatility in equity markets has risen. Market contacts describe those falls as initially prompted by perceptions of increased inflationary risks. Equity prices in most countries remain higher than in mid-2016, supported by the improvements in global growth and confidence (Section 1.1). Much of the rise in the FTSE All-Share index over that period (Chart 1.9), however, has reflected the decline in the exchange rate and its impact on the sterling value of profits earned in UK-listed companies’ overseas operations. Consistent with that, the equity prices of UK-focused companies within the index have been broadly unchanged (Chart 1.9).
Despite rises in government bond yields, corporate bond yields have fallen over the past couple of years, reducing the cost of bond financing. The corporate bond spread is therefore lower than in early 2016 (Chart 1.10), particularly for ‘high-yield’ debt, which is issued by companies perceived as riskier. Spreads on riskier high-yield sterling bonds have narrowed by less than their dollar and euro equivalents since early 2016, however.
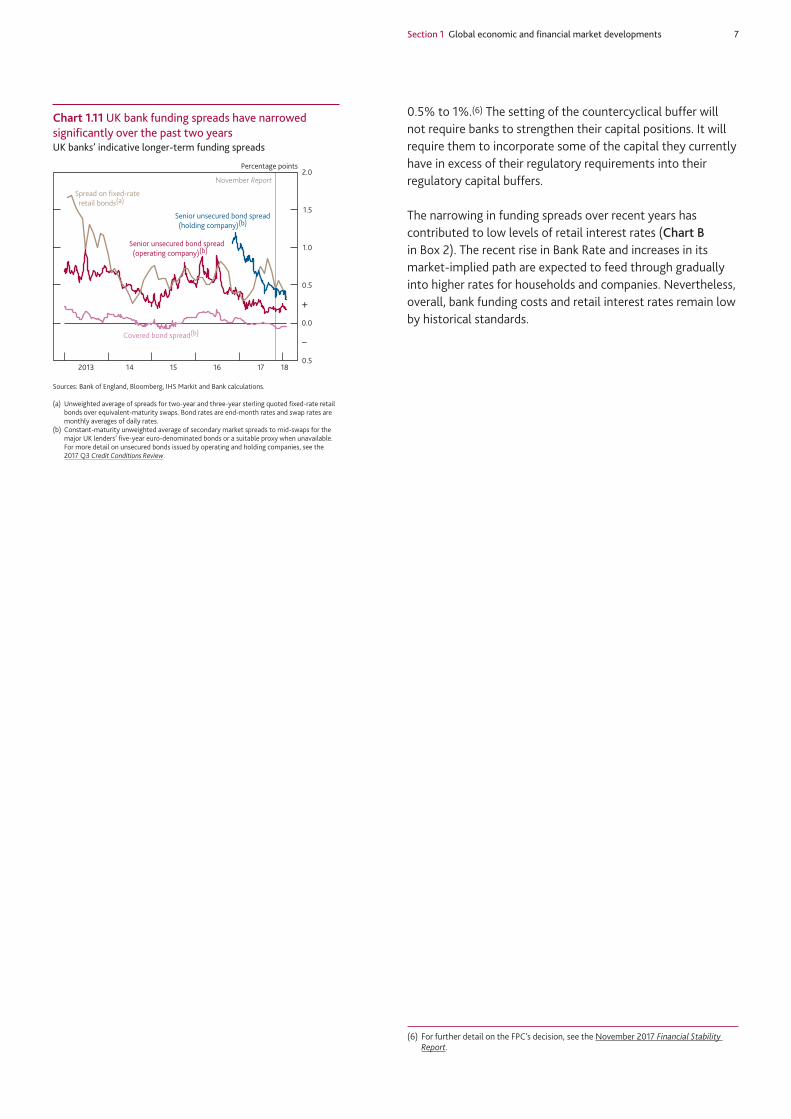
Bank funding costsCapital markets also matter for broader credit conditions through their influence on bank funding costs. Although they have been broadly stable over the past six months, the spreads that banks pay for funding over and above market interest rates have narrowed significantly since early 2016 (Chart 1.11). That narrowing appears largely to have reflected the broader improvement in global financial markets.
To ensure bank lending rates remain closely linked to official policy rates, the Term Funding Scheme (TFS) was introduced in August 2016 to provide funding at close to Bank Rate for lenders that maintained or increased net lending, with a penalty rate for banks that reduced net lending. While the TFS drawdown window will close this month, existing TFS drawings will remain in place for up to four years.
In addition to debt, banks can also raise funds through equity financing, and financial policy can influence the mix of funding. At its November meeting, the Financial Policy Committee (FPC) decided to increase the countercyclical capital buffer rate, levied on banks’ total risk-weighted UK assets, from
70
80
90
100
110
120
130
150
140
2015 16 17 18
Indices: 2 January 2015 = 100
UK domestically focused companies’ equity prices(b)
S&P 500 Euro Stoxx
FTSE All-Share
MSCI Emerging Markets(c)
November Report
Chart 1.9 UK‑focused companies’ equity prices have changed little since mid‑2016International equity prices(a)
Sources: MSCI, Thomson Reuters Datastream and Bank calculations.
(a) In local currency terms, except for MSCI Emerging Markets, which is in US dollar terms.(b) UK domestically focused companies are those generating at least 70% of their revenues in
the United Kingdom, based on annual financial accounts data on companies’ geographic revenue breakdown.
(c) The MSCI Inc. disclaimer of liability, which applies to the data provided, is available here.
0
1
2
3
4
5
0
2
4
6
8
10
2014 15 16 17 18
November Report
Per cent Per cent
Investment-grade (US$) (left-hand scale)
Investment-grade (€) (left-hand scale) Investment-grade (£) (left-hand scale)
High-yield (US$) (right-hand scale) High-yield (£) (right-hand scale) High-yield (€) (right-hand scale)
Chart 1.10 Corporate bond spreads have narrowed since early 2016International non‑financial corporate bond spreads(a)
Sources: Bank of America Merrill Lynch Global Research, Thomson Reuters Datastream and Bank calculations.
(a) Option-adjusted spreads on government bond yields. Investment-grade corporate bond yields are calculated using an index of bonds with a rating of BBB3 or above. High-yield corporate bond yields are calculated using aggregate indices of bonds rated lower than BBB3. Due to monthly index rebalancing, movements in yields at the end of each month might reflect changes in the population of securities within the indices.
Section 1 Global economic and financial market developments 7
0.5% to 1%.(6) The setting of the countercyclical buffer will not require banks to strengthen their capital positions. It will require them to incorporate some of the capital they currently have in excess of their regulatory requirements into their regulatory capital buffers.
The narrowing in funding spreads over recent years has contributed to low levels of retail interest rates (Chart B in Box 2). The recent rise in Bank Rate and increases in its market-implied path are expected to feed through gradually into higher rates for households and companies. Nevertheless, overall, bank funding costs and retail interest rates remain low by historical standards.
(6) For further detail on the FPC’s decision, see the November 2017 Financial Stability Report.
0.5
0.0
0.5
1.0
1.5
2.0
2013 14 15 16 17 18
Percentage points
Senior unsecured bond spread (operating company)(b)
Spread on fixed-rate retail bonds(a)
Covered bond spread(b)
November Report
Senior unsecured bond spread (holding company)(b)
+
–
Chart 1.11 UK bank funding spreads have narrowed significantly over the past two yearsUK banks’ indicative longer‑term funding spreads
Sources: Bank of England, Bloomberg, IHS Markit and Bank calculations.
(a) Unweighted average of spreads for two-year and three-year sterling quoted fixed-rate retail bonds over equivalent-maturity swaps. Bond rates are end-month rates and swap rates are monthly averages of daily rates.
(b) Constant-maturity unweighted average of secondary market spreads to mid-swaps for the major UK lenders’ five-year euro-denominated bonds or a suitable proxy when unavailable. For more detail on unsecured bonds issued by operating and holding companies, see the 2017 Q3 Credit Conditions Review.

8 Inflation Report February 2018
Box 2Monitoring the effects of the rise in Bank Rate on retail interest rates
On 2 November 2017, the MPC announced a 25 basis point rise in Bank Rate to 0.5%. There are a number of ways that this tightening in monetary policy will affect the economy. In particular, a change in Bank Rate will affect financial asset prices (Section 1), lending and deposit rates, and therefore households’ and firms’ cash flows and their incentives for saving and borrowing.
Although it is too early to assess fully the implications of the rise in Bank Rate, this box describes the changes in retail interest rates so far, in the context of broader developments in financial conditions. In particular, bank funding spreads have narrowed significantly over the past 18 months (Chart 1.11), putting downward pressure on retail interest rates relative to Bank Rate. Moreover, strong retail competition appears to be continuing to lower interest rates and squeeze banks’ profit margins on some lending products. Nevertheless, retail interest rates have, in general, risen in recent months and are expected to rise slightly further over coming months as the rise in Bank Rate continues to be passed through. The MPC will continue to monitor these rates closely.
Bank Rate is the benchmark around which short-term interest rates in wholesale money markets, and in turn retail interest rates, are determined. The November rise in Bank Rate passed through fully to sterling overnight wholesale interest rates (Chart A). Movements in financial asset prices and interest rates at longer horizons were fairly muted, as market participants had largely anticipated the rise ahead of its announcement. In particular, the market-implied interest rate path had already risen and sterling had appreciated following the publication of the Minutes of the MPC’s September meeting. Overall, in the run-up to the November Report, one and two-year swap rates had risen by 25 basis points and 30 basis points respectively, and they have risen further since (Section 1.3).
Corporate lending rates have risen in recent months (Table 1). Around 85% of bank lending to companies is at a floating rate, typically linked to a short-term market rate. In addition to being passed through to rates on new corporate lending, therefore, pass-through of changes in Bank Rate to the stock of corporate loans tends to be relatively rapid. Accordingly, average rates on outstanding floating-rate corporate loans have risen by around 20 basis points since August.
Quoted rates on lending to households have also risen, as the rise in Bank Rate has begun to be passed through (Table 1). Around 40% of mortgages by value are floating-rate products.
The rise in Bank Rate was passed through automatically to ‘tracker’ mortgages, and has also been passed through to other floating-rate products.
The share of fixed-rate mortgages has risen in recent years and is now around 60% by value.(1) Interest rates on fixed-rate mortgages are based on longer-term funding costs, which reflect expectations of how Bank Rate will evolve over time. As market-implied interest rate expectations rose in the weeks preceding the rise in Bank Rate, some quoted rates on new
(1) For more details see the box on pages 18–21 of the November 2017 Inflation Report.
Table 1 The rise in Bank Rate has begun to pass through to retail ratesRetail deposit and lending interest rates(a)
Level Change since (per cent) (basis points)
August 2017 May 2016
Households(b)
Mortgages
Two-year variable rate, 75% LTV 1.69 30 8
Two-year fixed rate, 75% LTV 1.53 11 -38
Five-year fixed rate, 75% LTV 1.99 3 -65
Two-year fixed rate, 90% LTV 2.13 -20 -62 Consumer credit
£10,000 unsecured loan 3.83 4 -50 Deposits
Instant access savings 0.21 7 -19
Two-year fixed-rate bond 1.09 -7 -11
Private non-financial corporations(c)
Outstanding floating loans 2.77 19 2
New floating loans 2.53 24 2
(a) The Bank’s quoted and effective rates series are weighted averages of rates from a sample of banks and building societies with products meeting the specific criteria. Data are not seasonally adjusted.
(b) Sterling-only end-month quoted rates. The latest data points are for January 2018.(c) Sterling-only average monthly effective rates. The latest data points are for December 2017.
0.0
0.2
0.4
0.6
0.8
1.0
1.2
2014 15 16 17 18
Per cent
One-year OIS rate(a)
Daily SONIA lending rate(b)
Two-year OIS rate(a)November Report
Bank Rate
Chart A The rise in Bank Rate was passed in full to market interest ratesBank Rate and market interest rates
(a) Spot overnight index swap (OIS) rates.(b) The sterling overnight index average.

Section 1 Global economic and financial market developments 9
fixed-rate mortgages were already increasing ahead of the November announcement.
Retail competition appears to have continued to squeeze banks’ profit margins on some products, pushing down interest rates and offsetting some of the rise in Bank Rate. Indeed, a two-year fixed rate for a new mortgage at 90% loan to value has fallen despite the rise in Bank Rate (Table 1), although these only account for a small share of total lending. That competition, together with a narrowing in bank funding spreads (Chart 1.11), mean that rates on new fixed-rate mortgage products remain significantly lower than 18 months ago. Those past falls mean that many mortgagors have moved onto lower interest rates than they had previously when their fixed rates expired, leading to a fall in effective rates (Chart B).
Rates on other components of household borrowing — such as consumer credit and student loans — are less responsive to changes in Bank Rate and tend to be driven predominantly by other factors. Accordingly, quoted rates on consumer credit have generally changed little since August (Table 1). Sight deposit rates have typically responded gradually to changes in Bank Rate over the past. Prior to the financial crisis, sight deposit rates were several percentage points below Bank Rate and lending rates. There are limits to the extent to which banks can lower deposit rates, however. So sight deposit rates did not fall as much as Bank Rate during the crisis and in recent years they have been slightly above Bank Rate. As Bank Rate rises, the corresponding rise in deposit rates is therefore likely to be somewhat less. Quoted rates on new household sight deposits have risen slightly in recent months (Table 1). Similarly, the effective rate on sight deposits, which account for around two thirds of the total stock of deposits, has risen by around 10 basis points (Chart B).
Quoted rates for some new time deposits have fallen in recent months (Table 1), although the effective rate on the stock of time deposits has risen a little. Lower quoted rates probably reflect developments in the cost and availability of other sources of bank funding. Indeed, the rates on fixed-rate retail bonds and the rates banks pay to raise funds in financial markets have fallen since early 2016 (Section 1.3).
Households’ and companies’ spending decisions will be affected by their expectations of future interest rates, as well as current rates. According to a recent IHS Markit survey, three quarters of households expect Bank Rate to rise further over the next 12 months (Chart C). The Bank’s Agents also report that businesses expect modest rises in Bank Rate, and 85% of respondents to the latest Deloitte CFO Survey anticipated a rise during 2018.
0
1
2
3
4
5
6
7
8
1999 2002 05 08 11 14 17
Per cent
Bank Rate(b)
Rate on stock of mortgages(a)
Rate on stock of interest-bearing sight deposits(a)
Rate on new mortgages(a)
Chart B Effective mortgage rates are lower than in mid‑2016Bank Rate and selected household effective interest rates
(a) Effective rates on sterling household loans and deposits. The Bank’s effective rate series are currently compiled using data from 19 UK monetary financial institutions and are average monthly rates. Not seasonally adjusted.
(b) End-month rate.
0
10
20
30
40
50
60
70
80
90
100
Feb. Apr. July Jan.19
Jan.20
Percentage of respondents who expectBank Rate to have risen by each date
2018
Chart C Households expect Bank Rate to rise further Cumulative distribution of households’ expectations for the timing of the next rise in Bank Rate(a)
Sources: IHS Markit and Bank calculations.
(a) Responses to the IHS Markit Household Finance Index survey for January 2018, excluding those responding that they did not know.

10 Inflation Report February 2018
2 Demand and output
GDP growth slowed around the beginning of 2017 but has picked up slightly in recent quarters. Consumption growth has been subdued as households are adjusting to the squeeze in real incomes following sterling’s depreciation. That depreciation and the strength in global growth have supported net trade and should continue to do so. Global growth has also supported business investment but the drag from uncertainty around the United Kingdom’s future trading arrangements has meant investment has been notably weaker than in previous expansions.
GDP growth picked up in 2017 H2, having slowed at the start of 2017 (Chart 2.1). Consumption growth has been subdued as households have been adjusting to the reduction in their real incomes due to the fall in sterling (Section 2.2). Partially offsetting that, net trade has picked up since the start of 2017, supported by the increase in global demand and sterling’s depreciation (Section 2.5). Business investment growth has been stable over the past year, but it is notably weaker than in previous expansions as a result of the drag from uncertainty around Brexit.
The near-term outlook is slightly stronger than in November, with UK growth expected to be supported by the continued strength in global economic activity (Section 1). But household real income growth remains subdued. Although growth in GDP is projected to be modest by historical standards, it is still expected to be at, or slightly above, that of potential supply — the pace at which output can grow consistent with balanced inflationary pressures (Section 3).
2.1 Output
Output growth picked up to 0.5% in 2017 Q4 (Chart 2.1). That was 0.1 percentage points higher than projected in November. Much of the increase since 2017 H1 has been driven by a strengthening in business-facing service sectors. In addition, manufacturing output growth picked up over 2017 (Chart 2.2), with capital and intermediate goods accounting for much of that strength. Activity in both business-facing services and manufacturing sectors is likely to have benefited from the past fall in sterling and the boost to export demand from the continued strength of global growth (Section 1).
Offsetting that to some extent, output growth in the consumer services sector was relatively weak in Q4, reflecting similar trends in household spending. In addition, disruption to oil production from the temporary closure of a major North Sea oil pipeline in December weighed on growth in Q4.
+
–
0.5
0.0
0.5
1.0
1.5
2012 13 14 15 16 17 18
Projection(c)
Percentage changes on a quarter earlier
Projection for preliminary GDP at the time of the November Report(c)
GDP
Estimate implied by the mode of the latest backcast(b)
Chart 2.1 GDP growth picked up in 2017 Q4 Output growth and Bank staff’s near-term projection(a)
Sources: ONS and Bank calculations.
(a) Chained-volume measures. GDP is at market prices.(b) The latest backcast, shown to the left of the vertical line, is a judgement about the path for
GDP in the final estimate of the data. The observation for 2018 Q1, to the right of the vertical line, is consistent with the MPC’s central projection.
(c) The blue diamond shows Bank staff’s projection for preliminary GDP growth in 2018 Q1. The bands on either side of the diamonds show uncertainty around those projections based on one root mean squared error of past Bank staff forecasts for quarterly GDP growth made since 2004.
Other production (5%)(b)
Construction (6%)
Manufacturing (10%)
Services (79%)
Output gross value added (GVA) growth (per cent)
+
–
0.2
0.0
0.2
0.4
0.6
0.8
2014–15 2016 2017 H1 2017 Q3 2017 Q4
Percentage points
Chart 2.2 Manufacturing continued to support output growth in Q4 Contributions to average quarterly GVA growth(a)
(a) Chained-volume measures at basic prices. Figures in parentheses are weights in nominal GDP in 2015. Components may not sum to the total due to chain-linking.
(b) Other production includes utilities, extraction and agriculture.

Section 2 Demand and output 11
The pipeline has been reopened and that should boost growth in 2018 Q1, as production returns to its previous level. Weakness in construction activity has also weighed on growth in recent quarters, though some of that may be revised up over time. Initial estimates of construction output have been particularly prone to upward revisions in recent years.
Output growth is projected to slow slightly to 0.4% in Q1 (Chart 2.1). That is broadly consistent with survey indicators.
2.2 Household spending
Consumption growth slowed at the start of 2017, with average quarterly growth over the year expected to have been around 0.3%, down from 0.7% in 2016 (Table 2.A). Within that, there has been some quarter-to-quarter volatility, partly reflecting moves in specific components of consumption, such as vehicles and energy (Chart 2.3).
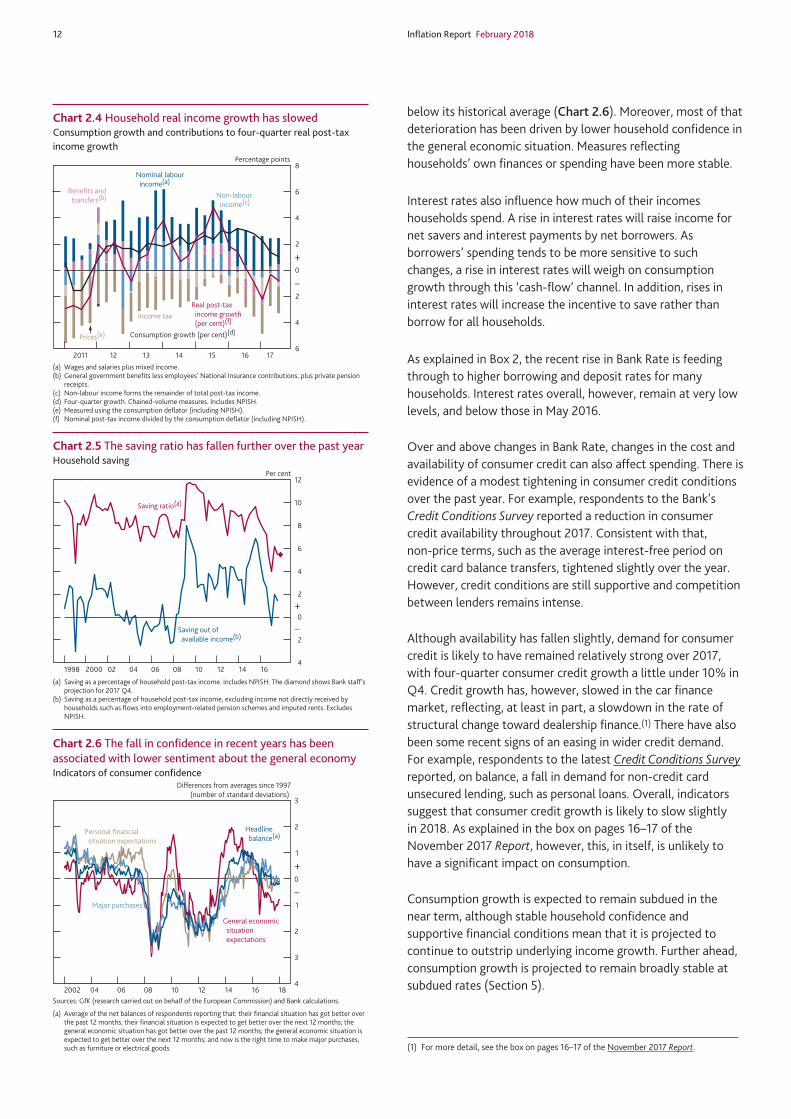
Although consumption growth has slowed, it has outpaced growth in real income. Real post-tax income growth has slowed since the end of 2015, and income fell 0.8% in the year to 2017 Q3 (Chart 2.4). Households’ real income has been squeezed by rises in import prices following the depreciation of sterling (Section 1). In recent quarters, nominal income growth has also been depressed by a fall in non-labour income, such as investment income earned on households’ pension schemes.
As discussed in the box on pages 16–17 of the May 2017 Report, non-labour income is generally less accessible and less visible to households, and so is likely to be a less significant influence on short-term spending decisions. The decline in non-labour income has therefore been reflected in a fall in the saving ratio, which is now well below its historical average (Chart 2.5). A measure of saving out of available income, which excludes some elements of non-labour income, has also fallen, but remains around its past average.
Real income and the saving ratio are expected to be temporarily boosted in 2018 Q1 by a fall in taxes paid on corporate dividends. As explained in the August 2017 Report, a pre-announced rise in the effective rate of tax on dividends in 2016 led to some dividend payments being brought forward to the 2015/16 financial year. The tax on this income is generally paid at the end of the following financial year and so taxes paid increased in 2017 Q1. As a result, dividend payments in 2016/17 were lower than usual and so taxes paid are expected to fall in 2018 Q1. That will boost household incomes and the saving ratio in Q1, but this will unwind in Q2.
One important influence on how much of their incomes households choose to spend is their confidence about future incomes and economic prospects. Consumer confidence has fallen since the start of 2016. It remains, however, only a little
+
–
1.0
0.5
0.0
0.5
1.0
2015 16 17 Q12017
Q2 Q3 Q4
Percentage points
Services (58%)
Energy (3%)
Other goods (35%)
Net tourism (1%)
Vehicles (4%)
Quarterly averages
Consumption growth (per cent)
Chart 2.3 Some components of consumption have been particularly volatile in 2017Contributions to quarterly growth in consumption(a)(b)
(a) Chained-volume measures. Data to 2017 Q3 exclude NPISH. Figures in parentheses are shares in consumption in 2015. Shares do not sum to 100 due to rounding. Other goods are calculated as a residual.
(b) Data point for 2017 Q4 shows Bank staff’s projection for consumption growth including NPISH.
Table 2.A Expenditure components of demand(a)
Percentage changes on a quarter earlier
Quarterly averages
1998– 2008– 2010– 2013– 2016 2017 2017 2007 09 12 15 H1 Q3
Household consumption(b) 0.9 -0.5 0.1 0.6 0.7 0.1 0.4
Private sector investment 0.5 -4.6 2.0 0.9 0.9 0.4 0.7
of which, business investment(c) 0.5 -3.4 2.2 0.4 0.5 0.7 0.5
of which, private sector housing investment 0.6 -7.0 1.5 2.3 2.0 0.0 1.1
Private sector final domestic demand 0.8 -1.1 0.5 0.9 0.6 0.2 0.5
Government consumption and investment(c) 0.9 0.9 -0.2 0.3 0.4 0.6 -0.4
Final domestic demand 0.8 -0.7 0.3 0.8 0.5 0.3 0.3
Change in inventories(d)(e) 0.0 0.0 0.1 0.0 -0.1 0.0 -0.1
Alignment adjustment(e) 0.0 -0.1 0.0 0.0 -0.1 -0.2 0.2
Domestic demand(f) 0.8 -0.8 0.4 0.8 0.3 0.3 0.4
‘Economic’ exports(g) 1.1 -1.0 0.8 0.9 1.2 1.1 0.8
‘Economic’ imports(g) 1.4 -1.2 0.8 1.3 0.9 0.7 0.9
Net trade(e)(g) -0.1 0.1 0.0 -0.1 0.1 0.1 0.0
Real GDP at market prices 0.7 -0.7 0.4 0.7 0.5 0.3 0.4
Memo: nominal GDP at market prices 1.2 -0.2 0.9 0.9 1.3 0.7 0.7
(a) Chained-volume measures unless otherwise stated.(b) Includes non-profit institutions serving households (NPISH).(c) Investment data take account of the transfer of nuclear reactors from the public corporation sector to
central government in 2005 Q2.(d) Excludes the alignment adjustment.(e) Percentage point contributions to quarterly growth of real GDP.(f) Includes acquisitions less disposals of valuables.(g) Excluding the impact of missing trader intra-community (MTIC) fraud.
12 Inflation Report February 2018
below its historical average (Chart 2.6). Moreover, most of that deterioration has been driven by lower household confidence in the general economic situation. Measures reflecting households’ own finances or spending have been more stable.
Interest rates also influence how much of their incomes households spend. A rise in interest rates will raise income for net savers and interest payments by net borrowers. As borrowers’ spending tends to be more sensitive to such changes, a rise in interest rates will weigh on consumption growth through this ‘cash-flow’ channel. In addition, rises in interest rates will increase the incentive to save rather than borrow for all households.
As explained in Box 2, the recent rise in Bank Rate is feeding through to higher borrowing and deposit rates for many households. Interest rates overall, however, remain at very low levels, and below those in May 2016.
Over and above changes in Bank Rate, changes in the cost and availability of consumer credit can also affect spending. There is evidence of a modest tightening in consumer credit conditions over the past year. For example, respondents to the Bank’s Credit Conditions Survey reported a reduction in consumer credit availability throughout 2017. Consistent with that, non-price terms, such as the average interest-free period on credit card balance transfers, tightened slightly over the year. However, credit conditions are still supportive and competition between lenders remains intense.
Although availability has fallen slightly, demand for consumer credit is likely to have remained relatively strong over 2017, with four-quarter consumer credit growth a little under 10% in Q4. Credit growth has, however, slowed in the car finance market, reflecting, at least in part, a slowdown in the rate of structural change toward dealership finance.(1) There have also been some recent signs of an easing in wider credit demand. For example, respondents to the latest Credit Conditions Survey reported, on balance, a fall in demand for non-credit card unsecured lending, such as personal loans. Overall, indicators suggest that consumer credit growth is likely to slow slightly in 2018. As explained in the box on pages 16–17 of the November 2017 Report, however, this, in itself, is unlikely to have a significant impact on consumption.
Consumption growth is expected to remain subdued in the near term, although stable household confidence and supportive financial conditions mean that it is projected to continue to outstrip underlying income growth. Further ahead, consumption growth is projected to remain broadly stable at subdued rates (Section 5).
(1) For more detail, see the box on pages 16–17 of the November 2017 Report.
+
–
6
4
2
0
2
4
6
8
2011 12 13 14 15 16 17
Percentage points
Nominal labour income(a)
Prices(e)
Benefits and transfers(b)
Non-labour income(c)
Real post-tax income growth (per cent)(f)
Consumption growth (per cent)(d)
Income tax
Chart 2.4 Household real income growth has slowedConsumption growth and contributions to four-quarter real post-tax income growth
(a) Wages and salaries plus mixed income.(b) General government benefits less employees’ National Insurance contributions, plus private pension
receipts.(c) Non-labour income forms the remainder of total post-tax income. (d) Four-quarter growth. Chained-volume measures. Includes NPISH.(e) Measured using the consumption deflator (including NPISH).(f) Nominal post-tax income divided by the consumption deflator (including NPISH).
+
–
4
2
0
2
4
6
8
10
12
1998 2000 02 04 06 08 10 12 14 16
Saving ratio(a)
Saving out of available income(b)
Per cent
Chart 2.5 The saving ratio has fallen further over the past yearHousehold saving
(a) Saving as a percentage of household post-tax income. Includes NPISH. The diamond shows Bank staff’s projection for 2017 Q4.
(b) Saving as a percentage of household post-tax income, excluding income not directly received by households such as flows into employment-related pension schemes and imputed rents. Excludes NPISH.
+
–
4
3
2
1
0
1
2
3
2002 04 06 08 10 12 14 16 18
Headline balance(a)
Differences from averages since 1997(number of standard deviations)
General economic situation expectations
Personal financial situation expectations
Major purchases
Chart 2.6 The fall in confidence in recent years has been associated with lower sentiment about the general economy Indicators of consumer confidence
Sources: GfK (research carried out on behalf of the European Commission) and Bank calculations.
(a) Average of the net balances of respondents reporting that: their financial situation has got better over the past 12 months; their financial situation is expected to get better over the next 12 months; the general economic situation has got better over the past 12 months; the general economic situation is expected to get better over the next 12 months; and now is the right time to make major purchases, such as furniture or electrical goods.

Section 2 Demand and output 13
2.3 Housing
Activity in the housing market is a good indicator of consumption, as decisions about whether to buy a house and how much to consume tend to be driven by common factors such as income growth and confidence. It also affects consumption directly. For example, increases in house prices can affect spending by raising the value of homeowners’ equity, which can be used as collateral against which to borrow. This effect is estimated to be small, however.(2) Developments in the housing market will also affect aggregate demand through housing investment. That picked up in Q3 (Table 2.A), with quarterly growth above its past average rate.
Around four fifths of housing investment consists of new buildings and improvements to existing buildings. Housing investment over 2017 has been supported in part by new home building, with housing starts having increased since 2016 Q1 (Chart 2.7). Contacts of the Bank’s Agents have reported that starts have been supported in part by demand for new-build properties from first-time buyers using the Help to Buy equity loan scheme. Starts fell back in 2017 Q3, however, which will weigh slightly on housing investment growth in the near term.
The remaining fifth of housing investment is made up of services associated with property transactions. While housing market transactions have been broadly stable in 2017 H2, mortgage approvals for house purchase drifted lower (Chart 2.8). Housing market activity will have been supported by the low level of mortgage interest rates. Although the increase in Bank Rate in November has begun to be passed through to mortgage rates, those interest rates remain low, in part as a result of continued strong competition among lenders (see Box 2).
Annualised house price inflation was 5% in Q4, according to the average of lenders’ indices, above expectations at the time of the November 2017 Report. More recent data, however, suggest that house price inflation was weaker in January than on average in Q4. While price expectations 12 months ahead remain positive, the RICS survey pointed to some weakness in the near term, with respondents, on balance, expecting house price falls over the next three months, driven in particular by London and the South East.
Overall, activity in the housing market is projected to pick up a little in the near term, while house price inflation and housing investment growth are expected to slow slightly. Measures detailed in the November 2017 Budget to support homeownership — such as stamp duty relief for first-time buyers, an expansion of the Help to Buy equity loan scheme and measures aiming to boost housebuilding — may support activity, particularly for first-time buyers. The impact on the overall housing market is likely to be small, however.
(2) For more details, see the box on pages 18–19 of the November 2016 Report.
0
50
100
150
200
250
2004 06 08 10 12 14 16
Thousands per quarter (annualised)
Chart 2.7 Housing starts have been rising but fell slightly in Q3UK private housing starts(a)
Sources: Department for Communities and Local Government and Bank calculations.
(a) Number of permanent dwellings started by private enterprises up to 2017 Q3 for England and Northern Ireland. Data from 2011 Q2 for Wales and 2017 Q2 for Scotland have been grown in line with permanent dwelling starts by private enterprises in England. Data are seasonally adjusted by Bank staff.
+
–
8
6
4
2
0
2
4
6
8
10
12
2010 12 14 16
1000
150
200
250
300
350
400
2010 12 14 16
House prices(b)
Mortgage approvals for house purchase
Housing transactions(a)
Rolling three-month sum (thousands)
Quarter-on-quarter annualisedpercentage change
Chart 2.8 Housing market activity has slowed slightlyMortgage approvals, housing transactions and house prices
Sources: Bank of England, HM Revenue and Customs, IHS Markit, Nationwide and Bank calculations.
(a) Number of residential property transactions for values of £40,000 or above.(b) Average of the quarterly Halifax/Markit and Nationwide house price indices.
Developments anticipated in November during 2017 Q4–2018 Q2
Developments now anticipated during 2018 Q1–Q3
Cost of credit Broadly unchanged
• Credit spreads to be broadly flat. • Credit spreads to be broadly flat.
Consumer spending Broadly unchanged
• Real post-tax household income to increase slightly in 2018 H1.
• Quarterly consumption growth to average ¼%.
• Quarterly real post-tax household income growth to average ¼%.
• Quarterly consumption growth to average ¼%.
Housing market Revised down slightly
• Mortgage approvals for house purchase to average around 68,000 per month.
• The average of the Halifax/Markit and Nationwide house price indices to increase by just under ¾% per quarter, on average.
• After picking up in Q3, quarterly housing investment growth to average just over ¼%.
• Mortgage approvals for house purchase to average around 65,000 per month.
• The average of the Halifax/Markit and Nationwide house price indices to increase by just under ½% per quarter, on average.
• After picking up in 2017 Q4, housing investment to be broadly flat.
Business investment Broadly unchanged
• Quarterly growth in business investment to average ¾%.
• Quarterly growth in business investment to average ¾%.
Trade Revised up
• Net trade to provide a small boost to quarterly GDP growth.
• Net trade to provide a significant boost to quarterly GDP growth.
Table 2.B Monitoring the MPC’s key judgements

14 Inflation Report February 2018
2.4 Government
The MPC’s projections are conditioned on the Government’s tax and spending plans detailed in the November 2017 Budget. Measures set out under these plans suggest a shallower path for fiscal consolidation over the next three years than in the March 2017 Budget, on which the MPC’s November forecasts were conditioned (Chart 2.9). That more gradual consolidation reflects a combination of increased spending and a reduction in taxes.
The shallower path of structural budget consolidation is projected to provide a small boost to GDP over the next three years, relative to projections in the November 2017 Report, as households and companies adjust their spending over time in response to Government measures (Section 5).
2.5 Net trade and the current account
The strength in global growth, alongside the depreciation of sterling, will support demand partly by boosting net trade. Greater export demand, combined with the rise in profit margins on exports in sterling terms should encourage new and existing exporters to expand their production. In addition, higher import prices should encourage UK households and companies to substitute towards domestically produced goods and services. Net trade will also depend, however, on how companies here and abroad begin to adjust trading relationships in light of the United Kingdom’s prospective withdrawal from the European Union.
ExportsExport growth increased to 8.4% in the year to 2017 Q3 (Chart 2.10), slightly stronger than expected in the November 2017 Report. Much of that growth reflected higher goods exports over the past year, although services exports also picked up slightly in Q3.
The depreciation of sterling, alongside the strength of global demand, is likely to be supporting growth in export volumes. Between 2015 Q4 and 2017 Q3 export prices fell 7% in foreign currency terms, suggesting some increase in competitiveness. In addition, export prices rose by 12% in sterling terms, which suggests that the depreciation has also allowed exporters to increase their profit margins. The rise in margins should support an expansion in export volumes for those firms with spare capacity. Indicators from the CBI, BCC and the Bank’s Agents all suggest that spare capacity in the manufacturing sector overall has been reduced over the past year. As spare capacity dwindles, further expansion by exporters will require investment in additional capacity (Section 2.6).
Quarterly export growth is expected to have remained robust in Q4 — consistent with the strength of business services and manufacturing sector output in that quarter (Section 2.1) — although four-quarter growth in exports is expected to slow
+
–
5
0
5
10
15
1990 94 98 2002 06 10 14 18
Percentages of nominal GDP
Latest ONS data
November 2017 Budget projection
March 2017 Budget projection
Chart 2.9 The projected fall in public sector net borrowing is more gradual than in the March 2017 Budget Public sector net borrowing(a)
Sources: Office for Budget Responsibility and ONS.
(a) Excludes public sector banks. Data are for financial years. Projections are from the Office for Budget Responsibility’s March and November 2017 Economic and Fiscal Outlooks.
+
–
15
10
5
0
5
10
15
2007 09 11 13 15 17
Percentage changes on a year earlier
Range of survey indicators(a)
Exports(b)
Chart 2.10 Indicators of UK export growth continue to be robustUK exports and survey indicators of export growth
Sources: Bank of England, BCC, CBI, EEF, IHS Markit, ONS and Bank calculations.
(a) Swathe includes: BCC net percentage balance of companies reporting that export orders and deliveries increased on the quarter (data are not seasonally adjusted); CBI average of the net percentage balances of manufacturing companies reporting that export orders and deliveries increased on the quarter, and that their present export order books are above normal volumes (the latter series is a quarterly average of monthly data); Markit/CIPS net percentage balance of manufacturing companies reporting that export orders increased this month compared with the previous month (quarterly average of monthly data); Agents measure of manufacturing companies’ reported annual growth in production for sales to overseas customers over the past three months (last available observation for each quarter); EEF average of the net percentage balances of manufacturing companies reporting that export orders increased over the past three months and were expected to increase over the next three months. Indicators are scaled to match the mean and variance of four-quarter export growth since 2000.
(b) Chained-volume measure, excluding the impact of MTIC fraud. The diamond shows Bank staff’s projection for 2017 Q4.
Section 2 Demand and output 15
somewhat, due to the comparison with unusually strong export growth at the end of 2016 (Chart 2.10). Survey indicators suggest that export growth is likely to remain strong in the near term, as support from the strength of global demand and the past fall in sterling continues (Section 1).
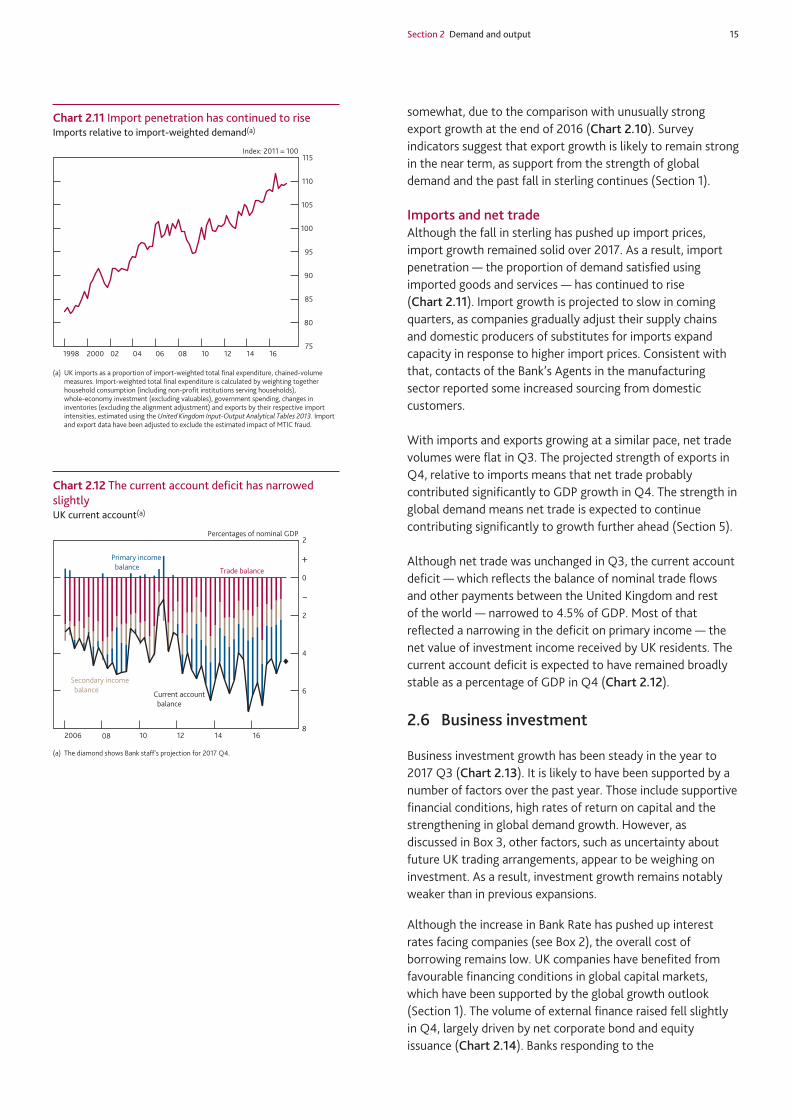
Imports and net tradeAlthough the fall in sterling has pushed up import prices, import growth remained solid over 2017. As a result, import penetration — the proportion of demand satisfied using imported goods and services — has continued to rise (Chart 2.11). Import growth is projected to slow in coming quarters, as companies gradually adjust their supply chains and domestic producers of substitutes for imports expand capacity in response to higher import prices. Consistent with that, contacts of the Bank’s Agents in the manufacturing sector reported some increased sourcing from domestic customers.
With imports and exports growing at a similar pace, net trade volumes were flat in Q3. The projected strength of exports in Q4, relative to imports means that net trade probably contributed significantly to GDP growth in Q4. The strength in global demand means net trade is expected to continue contributing significantly to growth further ahead (Section 5).
Although net trade was unchanged in Q3, the current account deficit — which reflects the balance of nominal trade flows and other payments between the United Kingdom and rest of the world — narrowed to 4.5% of GDP. Most of that reflected a narrowing in the deficit on primary income — the net value of investment income received by UK residents. The current account deficit is expected to have remained broadly stable as a percentage of GDP in Q4 (Chart 2.12).
2.6 Business investment
Business investment growth has been steady in the year to 2017 Q3 (Chart 2.13). It is likely to have been supported by a number of factors over the past year. Those include supportive financial conditions, high rates of return on capital and the strengthening in global demand growth. However, as discussed in Box 3, other factors, such as uncertainty about future UK trading arrangements, appear to be weighing on investment. As a result, investment growth remains notably weaker than in previous expansions.
Although the increase in Bank Rate has pushed up interest rates facing companies (see Box 2), the overall cost of borrowing remains low. UK companies have benefited from favourable financing conditions in global capital markets, which have been supported by the global growth outlook (Section 1). The volume of external finance raised fell slightly in Q4, largely driven by net corporate bond and equity issuance (Chart 2.14). Banks responding to the
8
6
4
2
0
2
2006 08 10 12 14 16
Percentages of nominal GDP
Secondary income balance
Primary income balance
Trade balance
Current account balance
+
–
Chart 2.12 The current account deficit has narrowed slightly UK current account(a)
(a) The diamond shows Bank staff’s projection for 2017 Q4.
75
80
85
90
95
100
105
110
115
1998 2000 02 04 06 08 10 12 14 16
Index: 2011 = 100
Chart 2.11 Import penetration has continued to riseImports relative to import-weighted demand(a)
(a) UK imports as a proportion of import-weighted total final expenditure, chained-volume measures. Import-weighted total final expenditure is calculated by weighting together household consumption (including non-profit institutions serving households), whole-economy investment (excluding valuables), government spending, changes in inventories (excluding the alignment adjustment) and exports by their respective import intensities, estimated using the United Kingdom Input-Output Analytical Tables 2013. Import and export data have been adjusted to exclude the estimated impact of MTIC fraud.

16 Inflation Report February 2018
Credit Conditions Survey also reported a fall in demand for lending across corporates of all sizes over 2017 H2.
The strength in global demand growth should encourage exporters, and domestic producers supplying exporters, to invest in additional capacity (Section 2.5). The fall in sterling may also encourage domestically focused companies to increase investment, in order to expand production of domestic substitutes for imported goods and services, following rises in import prices.
Despite those incentives to invest, most surveys of investment intentions changed little in 2017 (Chart 2.13), and the Bank’s Decision Maker Panel Survey suggests that exporters’ investment spending grew no faster than that of non-exporters in 2017. As set out in Box 3, there is evidence that the anticipation of Brexit and related uncertainties are weighing on businesses’ investment plans. Moreover, as the share of imported inputs in investment is around 30%, the depreciation of sterling will have increased the cost of investment.
Overall, business investment is projected to grow at a little above past average rates in the near term, supported by global activity and financial conditions. Investment is likely to remain sensitive to developments in negotiations around the United Kingdom’s future trading arrangements with the European Union. Moreover, given past falls, investment remains low relative to the size of the capital stock. As such, the capital stock is projected to expand only slowly, weighing on productivity growth relative to the past (Section 3).
+
–
6
4
2
0
2
4
6
8
10
12
14
16
2011 12 13 14 15 16 17
Percentage changes on a year earlier
Business investment(b)
Agents
BCC
CBI
Chart 2.13 Business investment growth has been stableBusiness investment and survey indicators of investment intentions(a)
Sources: Bank of England, BCC, CBI, CBI/PwC, ONS and Bank calculations.
(a) Survey measures are scaled to match the mean and variance of four-quarter business investment growth since 2000. CBI measure is the net percentage balance of respondents reporting that they have increased planned investment in plant and machinery for the next 12 months. BCC measure is the net percentage balance of respondents reporting that they have increased planned investment in plant and machinery; data are not seasonally adjusted. Agents measure shows companies’ intended changes in investment over the next 12 months; last available observation for each quarter. Sectors are weighted together using shares in real business investment.
(b) Chained-volume measure. Data are adjusted for the transfer of nuclear reactors from the public corporation sector to central government in 2005 Q2. The diamond shows Bank staff’s projection for 2017 Q4.
10
5
0
5
10
15
20
2013 14 15 16 17
£ billions
Equities
Commercial paper(b)
Bonds(b)(c)
Loans
Total(d)
2003
–08
2009
–17
Averages
+
–
Chart 2.14 Net external finance raised weakened in 2017 Q4Net external finance raised by UK private non-financial corporations(a)
(a) Includes sterling and foreign currency funds from UK monetary financial institutions and capital markets.
(b) Not seasonally adjusted.(c) Includes stand-alone and programme bonds.(d) As component series are not all seasonally adjusted, the total may not equal the sum of its
components.

Section 2 Demand and output 17
Box 3Brexit and business investment
The prospect of the United Kingdom’s departure from the European Union (EU) appears to have been a key influence on companies’ investment decisions over the past year or so. As set out in this box, Brexit-related effects appear to have weighed on investment plans. As a result, growth in business investment — which, on a four-quarter basis, has picked up since 2016 H1 to 1.7% in 2017 Q3 — is likely to have been weaker than it would otherwise have been, given strong global demand and supportive financial conditions.
Brexit could affect investment decisions in a number of ways. First, the anticipation of changes to UK trading arrangements could change the incentives for businesses to invest. It may discourage some export-focused businesses — particularly those exporting to the EU — from investing in additional capacity, while for others the anticipation of domestic substitution away from imports or improved trading relationships with non-EU countries could encourage higher investment. Second, uncertainty around what shape trading arrangements eventually take could cause companies to defer or cancel investment plans in the short term. Third, as discussed in Section 2.6, the Brexit-related fall in sterling could also affect investment: on the one hand, pushing down investment by increasing its cost; and on the other hand, pushing up investment by increasing profit margins on exports, and therefore the incentive to expand capacity.
Overall, a range of indicators suggests that Brexit-related uncertainty and expectations around lower future sales are, on balance, weighing on business investment growth. Estimates derived from the Bank’s Decision Maker Panel (DMP) Survey suggest nominal investment was around 3%–4% lower over the year to 2017 H1 than it would otherwise have been. In view of the impact of the fall in sterling on the cost of investment goods, the impact on real business investment is likely to have been larger. Given the continuing negotiations over the United Kingdom’s future trading relationship with the EU, there are risks in both directions to the path for business investment in coming years. If uncertainty persists, the drag on capital expenditure could intensify as businesses delay plans further. By contrast, those deferred plans may be brought forward if businesses gain clarity about future trading arrangements, pushing up aggregate investment growth.
Survey evidence on the impact of Brexit on business investmentSince the referendum, a range of business surveys has, on balance, pointed to a negative effect on investment from uncertainty around the United Kingdom’s future trading arrangements (Chart A). Most surveys, however, only provide
evidence on what share of businesses are planning to adjust investment, and not by how much.
Data from the DMP Survey can provide quantitative evidence on how much business investment has been affected by anticipation of Brexit and associated uncertainty. The DMP Survey is a monthly survey of senior executives, set up to monitor the impact of Brexit on companies’ decision-making. As of November 2017, the survey panel consisted of around 2,400 companies, with around 1,200 responding to the survey that month. Unlike most other business surveys, the DMP Survey asks participants for the probabilities they ascribe to various outcomes in a number of areas relating to their business, from which average expected outcomes can be calculated.(1)
The DMP Survey results suggest that Brexit weighed on business investment growth in the year to 2017 H1. Businesses that rank Brexit among their top three sources of uncertainty have, on average, reduced investment spending, as have businesses that, on balance, expect a negative impact from Brexit on their sales (Chart B). Comparing those responses with the responses of firms that do not see Brexit as an important source of uncertainty and/or do not expect a negative impact
(1) For more details, see ‘Tracking the views of British businesses: evidence from the Decision Maker Panel’, Bank of England Quarterly Bulletin, 2017 Q2.
Negative effect
Positive effect
No effect
No negative effect reported
37
36
39
49
44
29
0 20 40 60 80 100
Agents(a)
CBI(b)
Deloitte(c)
EEF(d)
ThomsonReuters(f)
Lloyds/London First(e)
Percentages of respondents
Chart A Brexit has affected investment plans for a significant proportion of companiesSurveys of the impact of Brexit on investment
Sources: Bank of England, CBI, Deloitte CFO Survey, EEF, Lloyds Bank/London First and Thomson Reuters.
(a) Factors influencing investment over the next 12 months relative to the previous 12 months. A company is defined as expecting a negative effect if they report that economic uncertainty, expected future international trade arrangements or other Brexit factors are acting to reduce investment.
(b) Response to ‘How has Brexit impacted your organisation’s investment decisions?’. Companies could select the following responses: ‘positive’, ‘no impact’ or ‘negative’.
(c) Response to ‘Overall how do you think the UK’s exit from the EU will affect your business’ decision around capital expenditure?’.
(d) Companies’ investment intentions following the EU referendum. A company is defined as expecting a negative effect if they report that they are holding off or limiting investment until there is further clarity on Brexit.
(e) Percentage of respondents who report that they have been delaying investment decision-making in response to the EU referendum.
(f) Percentage of respondents who report that they have held off from expanding operations in the United Kingdom in response to Brexit.
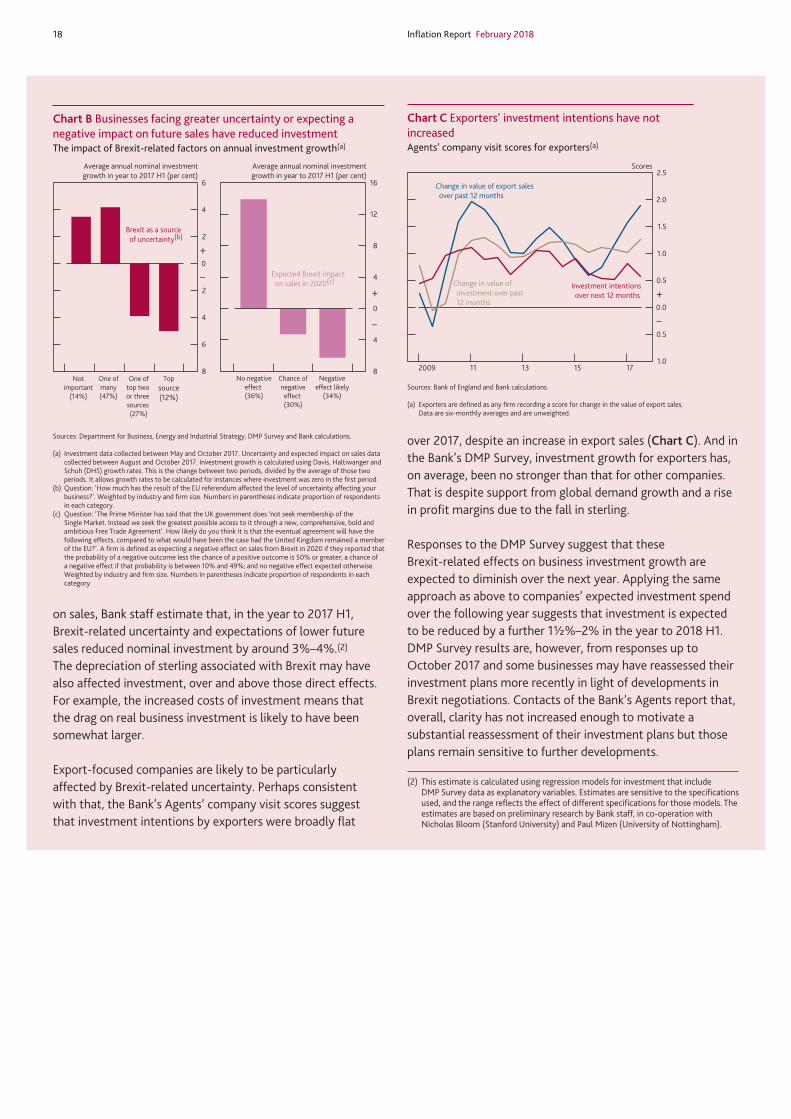
18 Inflation Report February 2018
on sales, Bank staff estimate that, in the year to 2017 H1, Brexit-related uncertainty and expectations of lower future sales reduced nominal investment by around 3%–4%.(2) The depreciation of sterling associated with Brexit may have also affected investment, over and above those direct effects. For example, the increased costs of investment means that the drag on real business investment is likely to have been somewhat larger.
Export-focused companies are likely to be particularly affected by Brexit-related uncertainty. Perhaps consistent with that, the Bank’s Agents’ company visit scores suggest that investment intentions by exporters were broadly flat
over 2017, despite an increase in export sales (Chart C). And in the Bank’s DMP Survey, investment growth for exporters has, on average, been no stronger than that for other companies. That is despite support from global demand growth and a rise in profit margins due to the fall in sterling.
Responses to the DMP Survey suggest that these Brexit-related effects on business investment growth are expected to diminish over the next year. Applying the same approach as above to companies’ expected investment spend over the following year suggests that investment is expected to be reduced by a further 1½%–2% in the year to 2018 H1. DMP Survey results are, however, from responses up to October 2017 and some businesses may have reassessed their investment plans more recently in light of developments in Brexit negotiations. Contacts of the Bank’s Agents report that, overall, clarity has not increased enough to motivate a substantial reassessment of their investment plans but those plans remain sensitive to further developments.
8
6
4
2
0
2
4
6
Notimportant
(14%)
One ofmany(47%)
One oftop two or three sources (27%)
Topsource(12%)
Brexit as a source of uncertainty(b)
8
4
0
4
8
12
16
No negativeeffect (36%)
Chance ofnegativeeffect (30%)
Negativeeffect likely
(34%)
Expected Brexit impact on sales in 2020(c)
Average annual nominal investment growth in year to 2017 H1 (per cent)
Average annual nominal investment growth in year to 2017 H1 (per cent)
+
–+
–
Chart B Businesses facing greater uncertainty or expecting a negative impact on future sales have reduced investment The impact of Brexit-related factors on annual investment growth(a)
Sources: Department for Business, Energy and Industrial Strategy, DMP Survey and Bank calculations.
(a) Investment data collected between May and October 2017. Uncertainty and expected impact on sales data collected between August and October 2017. Investment growth is calculated using Davis, Haltiwanger and Schuh (DHS) growth rates. This is the change between two periods, divided by the average of those two periods. It allows growth rates to be calculated for instances where investment was zero in the first period.
(b) Question: ‘How much has the result of the EU referendum affected the level of uncertainty affecting your business?’. Weighted by industry and firm size. Numbers in parentheses indicate proportion of respondents in each category.
(c) Question: ‘The Prime Minister has said that the UK government does ‘not seek membership of the Single Market. Instead we seek the greatest possible access to it through a new, comprehensive, bold and ambitious Free Trade Agreement’. How likely do you think it is that the eventual agreement will have the following effects, compared to what would have been the case had the United Kingdom remained a member of the EU?’. A firm is defined as expecting a negative effect on sales from Brexit in 2020 if they reported that the probability of a negative outcome less the chance of a positive outcome is 50% or greater; a chance of a negative effect if that probability is between 10% and 49%; and no negative effect expected otherwise. Weighted by industry and firm size. Numbers in parentheses indicate proportion of respondents in each category.
+
–
1.0
0.5
0.0
0.5
1.0
1.5
2.0
2.5
2009 11 13 15 17
Scores
Change in value of export sales over past 12 months
Change in value of investment over past 12 months
Investment intentions over next 12 months
Chart C Exporters’ investment intentions have not increased Agents’ company visit scores for exporters(a)
Sources: Bank of England and Bank calculations.
(a) Exporters are defined as any firm recording a score for change in the value of export sales. Data are six-monthly averages and are unweighted.
(2) This estimate is calculated using regression models for investment that include DMP Survey data as explanatory variables. Estimates are sensitive to the specifications used, and the range reflects the effect of different specifications for those models. The estimates are based on preliminary research by Bank staff, in co-operation with Nicholas Bloom (Stanford University) and Paul Mizen (University of Nottingham).

Section 3 Supply and the limits to growth 19
BANK CONFIDENTIAL LAST UPDATED 7 FEBRUARY 2018 18:45 V9a
3 Supply and the limits to growth
Unemployment remains at historically low levels and the MPC judges that very little slack remains in the economy. Notwithstanding a projected rise in structural productivity growth, potential supply growth is expected to be subdued. As a result, the pace at which output can grow without generating inflationary pressures is likely to remain modest.
In the medium term, the pace at which output can grow without generating inflationary pressures — known as the potential growth rate of the economy — is determined by the economy’s supply capacity. In turn, that depends on structural features of the economy such as population growth and growth in productivity. In the short term, however, there may be scope for output to grow more quickly than this if resources are underutilised such that there is ‘slack’ in the economy. Thus, in judging how fast the economy can grow without generating inflationary pressures, the MPC assesses both the degree of slack and the outlook for potential supply.
During the financial crisis, output fell, unemployment rose substantially and a significant degree of slack opened up. In the years since then, output growth has risen (Chart 3.1). But much of that recovery in output growth has been accounted for by a rise in total hours worked as slack in the labour market has been absorbed. The unemployment rate, for example, fell from 8.5% in 2011 to 4.3% in the three months to November (Chart 3.2), its lowest level since 1975. At the same time, the potential growth rate of the economy has remained subdued due to persistent weakness in productivity growth.
In the run-up to this Report, the MPC conducted its annual reassessment of supply-side conditions. Based on the range of evidence set out in this section, the MPC judges that very little slack remains overall (Section 3.1). Furthermore, the rate of potential growth is projected to be subdued at around 1½% (Section 3.2). As such, the pace of demand growth consistent with balanced domestic inflationary pressures is likely to be modest (Section 5).
3.1 Slack in the economy
The degree of slack in the economy — or the gap between demand and potential supply — is a key determinant of domestic inflationary pressures. Judging the degree of slack is difficult, however, since the level of potential supply cannot be directly observed.
1.5
1.0
0.5
0.0
0.5
1.0
1.5
2.0
2.5
3.0
3.5
1990–97 1998–2007
2008–10 2011–17 2018–20
Potential labour supply
Potential productivity Potential output
Actual output(b)
Percentage changes on a year earlier
+
–
Projection
Chart 3.1 The MPC expects growth in the economy’s potential supply capacity to be subdued Decomposition of estimated potential output growth(a)
Sources: ONS and Bank calculations.
(a) Annual averages. Faded diamonds and bars are projections.(b) Chained-volume measure, based on the backcast for the final estimate of GDP. The diamond
for the 2011–17 average includes Bank staff’s projection for growth in 2017 Q4.
3.5
4.0
4.5
5.0
5.5
6.0
6.5
7.0
7.5
8.0
8.5
2013 14 15 16 17 18
Projection
Per cent
Three-month unemployment rate
Projection in November
0.0
Chart 3.2 Unemployment is projected to remain at its current low level in Q1Unemployment rate and Bank staff’s near-term projection(a)
Sources: ONS and Bank calculations.
(a) The beige diamonds show Bank staff’s central projections for the headline unemployment rate for the three months to September, October, November and December 2017, at the time of the November Report. The red diamonds show the current staff projections for the headline unemployment rate for the three months to December 2017, January, February and March 2018. The bands on either side of the diamonds show uncertainty around those projections based on one root mean squared error of past Bank staff projections for the three-month headline unemployment rate.
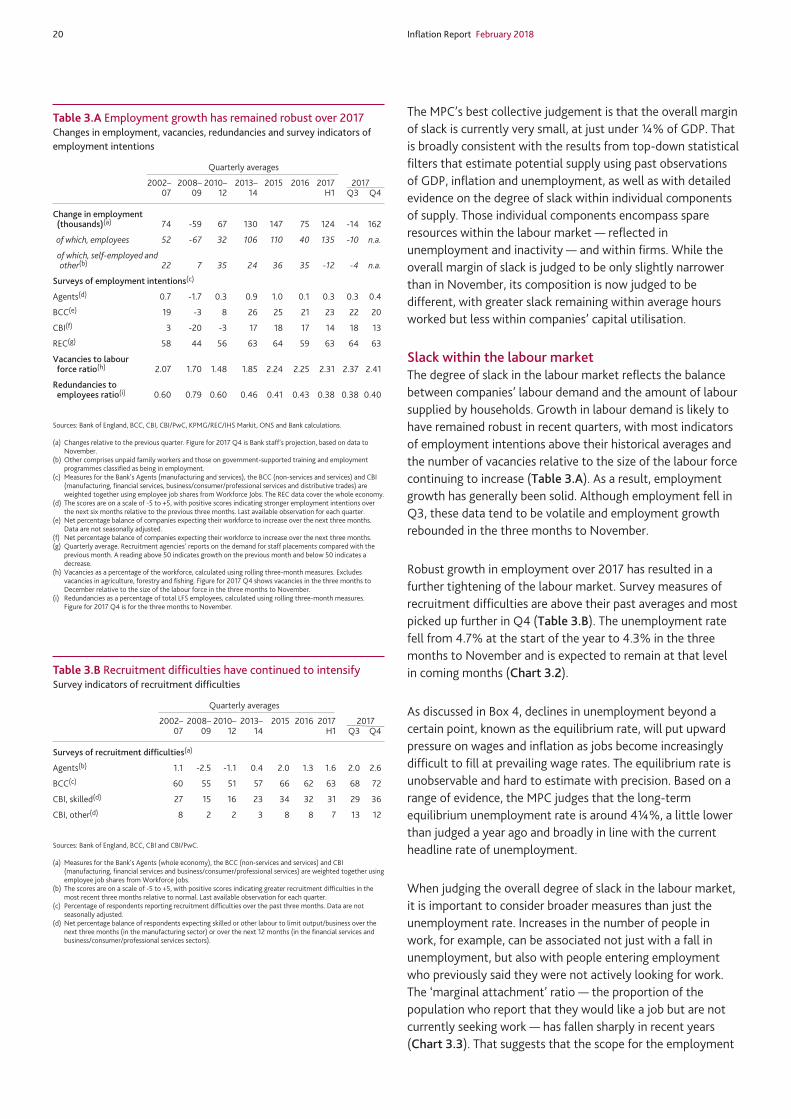
20 Inflation Report February 2018
BANK CONFIDENTIAL LAST UPDATED 7 FEBRUARY 2018 18:45 V9a
The MPC’s best collective judgement is that the overall margin of slack is currently very small, at just under ¼% of GDP. That is broadly consistent with the results from top-down statistical filters that estimate potential supply using past observations of GDP, inflation and unemployment, as well as with detailed evidence on the degree of slack within individual components of supply. Those individual components encompass spare resources within the labour market — reflected in unemployment and inactivity — and within firms. While the overall margin of slack is judged to be only slightly narrower than in November, its composition is now judged to be different, with greater slack remaining within average hours worked but less within companies’ capital utilisation.
Slack within the labour marketThe degree of slack in the labour market reflects the balance between companies’ labour demand and the amount of labour supplied by households. Growth in labour demand is likely to have remained robust in recent quarters, with most indicators of employment intentions above their historical averages and the number of vacancies relative to the size of the labour force continuing to increase (Table 3.A). As a result, employment growth has generally been solid. Although employment fell in Q3, these data tend to be volatile and employment growth rebounded in the three months to November.
Robust growth in employment over 2017 has resulted in a further tightening of the labour market. Survey measures of recruitment difficulties are above their past averages and most picked up further in Q4 (Table 3.B). The unemployment rate fell from 4.7% at the start of the year to 4.3% in the three months to November and is expected to remain at that level in coming months (Chart 3.2).
As discussed in Box 4, declines in unemployment beyond a certain point, known as the equilibrium rate, will put upward pressure on wages and inflation as jobs become increasingly difficult to fill at prevailing wage rates. The equilibrium rate is unobservable and hard to estimate with precision. Based on a range of evidence, the MPC judges that the long-term equilibrium unemployment rate is around 4¼%, a little lower than judged a year ago and broadly in line with the current headline rate of unemployment.
When judging the overall degree of slack in the labour market, it is important to consider broader measures than just the unemployment rate. Increases in the number of people in work, for example, can be associated not just with a fall in unemployment, but also with people entering employment who previously said they were not actively looking for work. The ‘marginal attachment’ ratio — the proportion of the population who report that they would like a job but are not currently seeking work — has fallen sharply in recent years (Chart 3.3). That suggests that the scope for the employment
Table 3.A Employment growth has remained robust over 2017Changes in employment, vacancies, redundancies and survey indicators of employment intentions
Quarterly averages
2002– 2008– 2010– 2013– 2015 2016 2017 2017 07 09 12 14 H1 Q3 Q4
Change in employment (thousands)(a) 74 -59 67 130 147 75 124 -14 162
of which, employees 52 -67 32 106 110 40 135 -10 n.a.
of which, self-employed and other(b) 22 7 35 24 36 35 -12 -4 n.a.
Surveys of employment intentions(c)
Agents(d) 0.7 -1.7 0.3 0.9 1.0 0.1 0.3 0.3 0.4
BCC(e) 19 -3 8 26 25 21 23 22 20
CBI(f) 3 -20 -3 17 18 17 14 18 13
REC(g) 58 44 56 63 64 59 63 64 63
Vacancies to labour force ratio(h) 2.07 1.70 1.48 1.85 2.24 2.25 2.31 2.37 2.41
Redundancies to employees ratio(i) 0.60 0.79 0.60 0.46 0.41 0.43 0.38 0.38 0.40
Sources: Bank of England, BCC, CBI, CBI/PwC, KPMG/REC/IHS Markit, ONS and Bank calculations.
(a) Changes relative to the previous quarter. Figure for 2017 Q4 is Bank staff’s projection, based on data to November.
(b) Other comprises unpaid family workers and those on government-supported training and employment programmes classified as being in employment.
(c) Measures for the Bank’s Agents (manufacturing and services), the BCC (non-services and services) and CBI (manufacturing, financial services, business/consumer/professional services and distributive trades) are weighted together using employee job shares from Workforce Jobs. The REC data cover the whole economy.
(d) The scores are on a scale of -5 to +5, with positive scores indicating stronger employment intentions over the next six months relative to the previous three months. Last available observation for each quarter.
(e) Net percentage balance of companies expecting their workforce to increase over the next three months. Data are not seasonally adjusted.
(f) Net percentage balance of companies expecting their workforce to increase over the next three months.(g) Quarterly average. Recruitment agencies’ reports on the demand for staff placements compared with the
previous month. A reading above 50 indicates growth on the previous month and below 50 indicates a decrease.
(h) Vacancies as a percentage of the workforce, calculated using rolling three-month measures. Excludes vacancies in agriculture, forestry and fishing. Figure for 2017 Q4 shows vacancies in the three months to December relative to the size of the labour force in the three months to November.
(i) Redundancies as a percentage of total LFS employees, calculated using rolling three-month measures. Figure for 2017 Q4 is for the three months to November.
Table 3.B Recruitment difficulties have continued to intensifySurvey indicators of recruitment difficulties
Quarterly averages
2002– 2008– 2010– 2013– 2015 2016 2017 2017 07 09 12 14 H1 Q3 Q4
Surveys of recruitment difficulties(a)
Agents(b) 1.1 -2.5 -1.1 0.4 2.0 1.3 1.6 2.0 2.6
BCC(c) 60 55 51 57 66 62 63 68 72
CBI, skilled(d) 27 15 16 23 34 32 31 29 36
CBI, other(d) 8 2 2 3 8 8 7 13 12
Sources: Bank of England, BCC, CBI and CBI/PwC.
(a) Measures for the Bank’s Agents (whole economy), the BCC (non-services and services) and CBI (manufacturing, financial services and business/consumer/professional services) are weighted together using employee job shares from Workforce Jobs.
(b) The scores are on a scale of -5 to +5, with positive scores indicating greater recruitment difficulties in the most recent three months relative to normal. Last available observation for each quarter.
(c) Percentage of respondents reporting recruitment difficulties over the past three months. Data are not seasonally adjusted.
(d) Net percentage balance of respondents expecting skilled or other labour to limit output/business over the next three months (in the manufacturing sector) or over the next 12 months (in the financial services and business/consumer/professional services sectors).

Section 3 Supply and the limits to growth 21
BANK CONFIDENTIAL LAST UPDATED 7 FEBRUARY 2018 18:45 V9a
rate to increase further as such people enter the labour market is likely to be limited.
Slack within companiesThere may be scope for companies to expand output by utilising their existing capital or labour more intensively. According to the Labour Force Survey (LFS), for example, average hours worked in Q3 were a little below the hours that households said they would like to work. And, while the share of part-time workers who report that they would prefer a full-time job has fallen, it remains above its pre-crisis average (Chart 3.4). As such, there is likely to be some scope for companies to increase output by raising the number of hours their employees work. There is likely to be little scope for companies to use their existing capital more intensively, however. Survey indicators of companies’ capacity pressures, for example, are currently around normal (Chart 3.5).
3.2 The outlook for potential supply
Since very little slack is judged to remain in the economy, the speed at which output can expand without generating inflationary pressures will largely depend on growth in potential supply. That growth can be driven either by increases in labour supply — the size of the labour force and the number of hours that people are willing to work — or by growth in productivity — the amount produced for each of those hours worked.
Labour supplyIn recent decades, growth in the size of the UK workforce has tended to come mainly from population growth. Growth in the working-age population — those aged over 16 — has slowed in recent quarters, in part due to a slowing in net migration, which fell to 230,000 in the year to 2017 Q2 from 336,000 in the previous year.
In the MPC’s latest forecasts, population growth is assumed to evolve in line with the ONS’s principal projection published in October 2017. In that projection, growth in the working-age population remains slower than on average over the past decade (Chart 3.6). Within that, the ONS projects a further slight fall in annual net migration, to 211,000 by mid-2020. Box 5 describes the implications of lower net migration for overall UK labour supply.
The extent to which changes in the population affect the size of the workforce, however, depends on the proportion of the population who are active in the labour market versus, for instance, those in retirement or education. As explained in Box 5, that proportion — the participation rate — is expected to remain broadly flat in coming years (Chart 3.6).
1.5
2.0
2.5
3.0
3.5
4.0
4.5
5.0
2007 09 11 13 15 17
Per cent
0.0
Chart 3.4 The proportion of part-time workers unable to find a full-time job remains slightly elevatedPeople working part-time who could not find a full-time job, as a proportion of total employment(a)
Sources: ONS and Bank calculations.
(a) Percentage of LFS total employment. As reported in the LFS. Rolling three-month measure.
4.0
4.5
5.0
5.5
6.0
6.5
2002 04 06 08 10 12 14 16
Per cent
0.0
Chart 3.3 The proportion of people not currently looking for work, but who would like a job, has continued to fallMarginal attachment ratio(a)
Sources: ONS and Bank calculations.
(a) Number of those aged 16–64 who say they are not actively looking for work but would like a job, as a percentage of the 16–64 population. As reported in the LFS. Rolling three-month measure.
6
5
4
3
2
1
0
1
2
3
4
1999 2003 07 11 15
Differences from 1999 Q1–2007 Q3 averages(number of standard deviations)
BCC
Agents
CBI
+
–
Chart 3.5 Survey measures suggest capacity pressures are around normal Survey indicators of capacity pressures(a)
Sources: Bank of England, BCC, CBI, CBI/PwC, ONS and Bank calculations.
(a) Measures are produced by weighting together surveys from the Bank’s Agents (manufacturing and services), the BCC (non-services and services) and the CBI (manufacturing, financial services, business/consumer/professional services and distributive trades) using shares in nominal value added. Agents data are last available observations for each quarter. The BCC data are not seasonally adjusted.

22 Inflation Report February 2018
BANK CONFIDENTIAL LAST UPDATED 7 FEBRUARY 2018 18:45 V9a
Box 4 The equilibrium rate of unemployment
The unemployment rate has fallen sharply in recent years, from 8.5% in late 2011 to 4.3% in the three months to November, its lowest level since 1975. When unemployment is low, that tends to put upward pressure on wage growth and inflation as companies need to pay more in order to recruit suitably skilled staff. And when unemployment is high, wage and inflationary pressures tend to be subdued as companies find it relatively easy to recruit and retain the right people. A key judgement for the MPC is where the ‘equilibrium rate’ of unemployment is — the rate consistent with meeting the inflation target in the medium term. This box explores the concept of the equilibrium unemployment rate in more detail and the evidence for where it currently lies.
What determines the equilibrium rate of unemployment? The equilibrium unemployment rate can vary over time. Over the longer term, it represents the rate of unemployment that the economy is capable of achieving sustainably over many years. This long-term rate is determined by the structural features of the economy that affect the time it takes for people to find the right jobs, for example the extent to which potential workers are a good match for the jobs companies want to fill. It will also be influenced by the tax and benefit regime, which affects the incentives for people to move between employment and unemployment. Since these factors tend to be slow-moving, the long-term equilibrium rate is usually assumed to change only slowly over time.
In the shorter term, cyclical factors, such as changes in the mix of unemployment, can also affect the unemployment rate consistent with stable wage pressures. For example, people who have been out of work for over a year tend to be less likely to find employment than those who have been out of work for a shorter period of time, and so tend to exert less downward pressure on wages and inflation.
Following the financial crisis, that shorter-term equilibrium unemployment rate probably rose as the proportion of people out of work for over a year increased sharply (Chart A). But that effect has largely unwound, with the proportion unemployed for over 12 months back at its pre-crisis average. That suggests that the recession was not associated with any structural rise in long-term unemployment, in contrast to previous UK experience. It also suggests that the shorter-term equilibrium unemployment rate is likely to be close to its long-term structural rate.
Equilibrium unemployment and wage growthThe equilibrium unemployment rate is unobservable and so difficult to estimate with precision. One way of assessing its level, however, is to make use of the relationship between unemployment and wages. After accounting for factors other than unemployment that are likely to be influencing wage growth — for example growth in productivity — it is possible to infer what the rate of equilibrium unemployment would need to be in order to be consistent with current wage growth.
In February 2017, the MPC lowered its estimate of the long-term equilibrium rate from 5% to 4½%, following a period when wage growth had been below its projections over successive quarters. A lower equilibrium rate helped explain those forecast errors. Over the past year, annual pay growth has remained subdued (Section 4). Although that partly reflects continued weakness in productivity growth, including that stemming from recent shifts in the composition of employment growth, it would, all else equal, be consistent with a long-run equilibrium unemployment rate somewhat below 4½%.
A more formal way of using the relationship between unemployment and wages to estimate the equilibrium rate is to use statistical filtering techniques.(1) These techniques impose an assumption about the relationship between unemployment and wage growth, for example that it is linear. The estimated equilibrium rate is then allowed to vary over time in order to capture persistent structural changes in the labour market. Chart B shows that the equilibrium unemployment rate estimated using one such statistical filter has fallen since 2010. Although there is considerable
(1) For more details, see Berry, S, Corder, M, Duffy, C, Hackworth, C and Speigner, B (2015), ‘Trends in UK labour supply’, Bank of England Quarterly Bulletin, 2015 Q4.
0
1
2
3
4
5
1993 97 2001 05 09 13 17
Under six months
Per cent
Six to twelve months
Over twelve months
Chart A Long-term unemployment has fallen back to its past average rateUnemployment rates by duration(a)
Sources: ONS and Bank calculations.
(a) The number of people unemployed in each duration category, divided by the economically active population. Rolling three-month measures. Dashed lines are averages from 2002 to 2007.
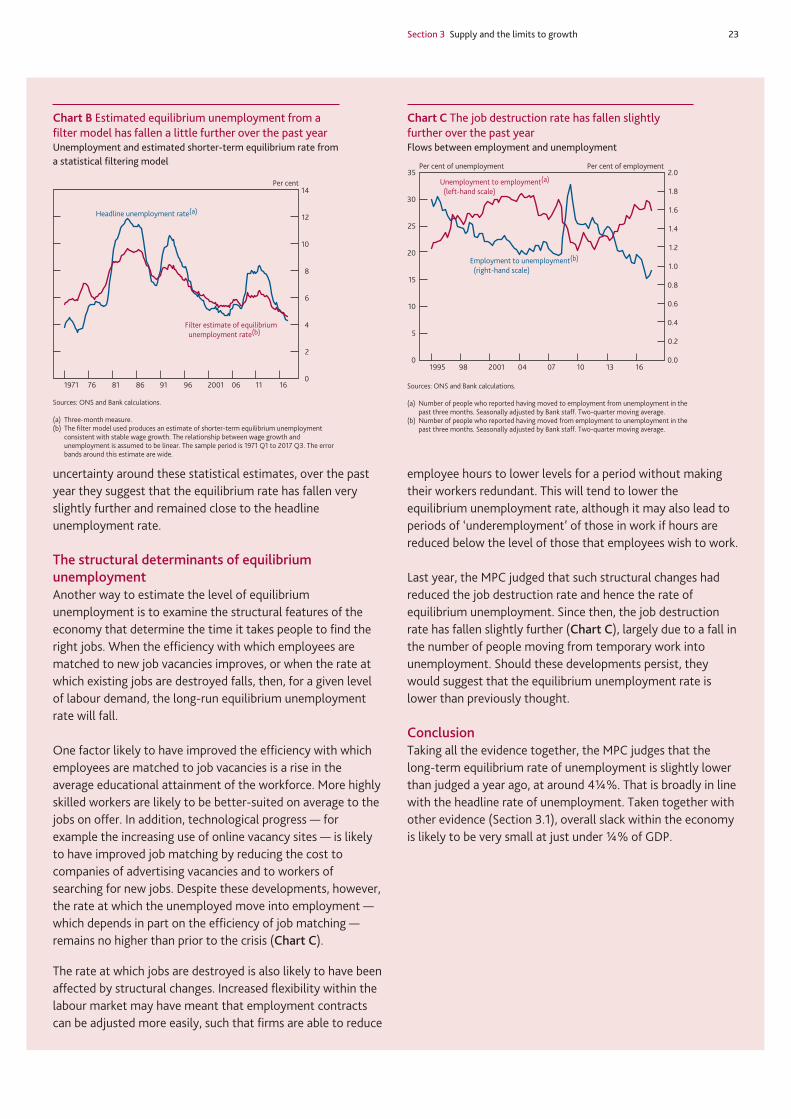
Section 3 Supply and the limits to growth 23
BANK CONFIDENTIAL LAST UPDATED 7 FEBRUARY 2018 18:45 V9a
uncertainty around these statistical estimates, over the past year they suggest that the equilibrium rate has fallen very slightly further and remained close to the headline unemployment rate.
The structural determinants of equilibrium unemploymentAnother way to estimate the level of equilibrium unemployment is to examine the structural features of the economy that determine the time it takes people to find the right jobs. When the efficiency with which employees are matched to new job vacancies improves, or when the rate at which existing jobs are destroyed falls, then, for a given level of labour demand, the long-run equilibrium unemployment rate will fall.
One factor likely to have improved the efficiency with which employees are matched to job vacancies is a rise in the average educational attainment of the workforce. More highly skilled workers are likely to be better-suited on average to the jobs on offer. In addition, technological progress — for example the increasing use of online vacancy sites — is likely to have improved job matching by reducing the cost to companies of advertising vacancies and to workers of searching for new jobs. Despite these developments, however, the rate at which the unemployed move into employment — which depends in part on the efficiency of job matching — remains no higher than prior to the crisis (Chart C).
The rate at which jobs are destroyed is also likely to have been affected by structural changes. Increased flexibility within the labour market may have meant that employment contracts can be adjusted more easily, such that firms are able to reduce
employee hours to lower levels for a period without making their workers redundant. This will tend to lower the equilibrium unemployment rate, although it may also lead to periods of ‘underemployment’ of those in work if hours are reduced below the level of those that employees wish to work.
Last year, the MPC judged that such structural changes had reduced the job destruction rate and hence the rate of equilibrium unemployment. Since then, the job destruction rate has fallen slightly further (Chart C), largely due to a fall in the number of people moving from temporary work into unemployment. Should these developments persist, they would suggest that the equilibrium unemployment rate is lower than previously thought.
ConclusionTaking all the evidence together, the MPC judges that the long-term equilibrium rate of unemployment is slightly lower than judged a year ago, at around 4¼%. That is broadly in line with the headline rate of unemployment. Taken together with other evidence (Section 3.1), overall slack within the economy is likely to be very small at just under ¼% of GDP.
0
2
4
6
8
10
12
14
1971 76 81 86 91 96 2001 06 11 16
Per cent
Headline unemployment rate(a)
Filter estimate of equilibrium unemployment rate(b)
Chart B Estimated equilibrium unemployment from a filter model has fallen a little further over the past yearUnemployment and estimated shorter-term equilibrium rate from a statistical filtering model
Sources: ONS and Bank calculations.
(a) Three-month measure.(b) The filter model used produces an estimate of shorter-term equilibrium unemployment
consistent with stable wage growth. The relationship between wage growth and unemployment is assumed to be linear. The sample period is 1971 Q1 to 2017 Q3. The error bands around this estimate are wide.
0
5
10
15
20
25
30
35
0.0
0.2
0.4
0.6
0.8
1.0
1.2
1.4
1.6
1.8
2.0
1995 98 2001 04 07 10 13 16
Per cent of employmentPer cent of unemployment
Employment to unemployment(b)
(right-hand scale)
Unemployment to employment(a)
(left-hand scale)
Chart C The job destruction rate has fallen slightly further over the past year Flows between employment and unemployment
Sources: ONS and Bank calculations.
(a) Number of people who reported having moved to employment from unemployment in the past three months. Seasonally adjusted by Bank staff. Two-quarter moving average.
(b) Number of people who reported having moved from employment to unemployment in the past three months. Seasonally adjusted by Bank staff. Two-quarter moving average.

24 Inflation Report February 2018
BANK CONFIDENTIAL LAST UPDATED 7 FEBRUARY 2018 18:45 V9a
Finally, overall labour supply will depend on the average number of hours those employed are willing to work. This is projected to fall very slightly in coming years (Chart 3.6), in part reflecting the increasing proportion of the population in older age groups, who tend to work fewer hours (see the box on pages 22–23 of the February 2016 Report).
Taking all these factors together, potential labour supply is projected to grow by 0.4% per year on average over the next three years, much lower than its average of 1.2% in the years following the crisis (Chart 3.6).
ProductivityGiven the relatively subdued outlook for labour supply growth and very little slack within the economy (Section 3.1), growth in the economy’s overall supply capacity will rely in large part on trends in structural productivity growth.
Four-quarter hourly productivity growth stalled in the first half of 2017 and, while it picked up slightly in the second half of the year, it nevertheless remains subdued. One reason for the recent weakness may have been a shift in the composition of employment growth relative to past norms. Employment growth in the year to Q3 was concentrated in people and jobs with characteristics typically associated with lower-than-average wages (Section 4). To the extent that these characteristics are associated with lower levels of productivity, this shift in employment composition is likely also to have reduced aggregate productivity growth. These compositional effects will reduce productivity growth only for as long as such shifts continue, however.
More generally, productivity growth has been so weak since the financial crisis that the level of productivity is barely above its pre-crisis peak (Chart 3.7). A standard growth-accounting framework suggests that around half of the weakness since 2010 has been associated with slow growth in the amount of capital — the resources and equipment available to produce output — per hour worked (Chart 3.8). In turn, that reflects subdued business investment over much of that period (Section 2). The remainder of the weakness in productivity growth is accounted for by weak growth in the efficiency with which labour and capital are put to use, known as total factor productivity. Sectoral data may provide further information about the drivers of the shortfall in productivity growth. These data suggest that over half of the shortfall relative to pre-crisis rates has been concentrated in the financial and insurance services and manufacturing sectors (Chart 3.9). To some degree, the slowdown in financial services is likely to reflect unusually high growth in measured productivity prior to the crisis, driven by increased leverage and risk-taking within financial firms over that period. In addition, mismeasurement of financial services output may have played a role in
1.0
0.5
0.0
0.5
1.0
1.5
Unemployment(b)
Participation
Population
Average hours
Growth in potential hours worked (per cent)
Percentage points
1990–97 1998–2007
2008–10 2011–17 2018–20
+
–
Projection
Chart 3.6 Potential labour supply growth is expected to be subdued relative to the past decadeContributions to annual growth in estimated potential hours worked(a)
Sources: ONS and Bank calculations.
(a) Annual averages. Faded diamond and bars are projections. (b) Positive bars indicate that a fall in the short-run equilibrium unemployment rate has
increased potential labour supply.
Developments anticipated in November during 2017 Q4–2018 Q2
Developments now anticipated during 2018 Q1–Q3
Unemployment Broadly unchanged
• Unemploymentratetoremainarounditscurrent level of 4¼%.
• Unemploymentratetoremainaroundits current level of 4¼%.
Participation Revised up slightly
• Participationratetoremainarounditscurrent level of 63½%.
• Participationratetoremainjustabove63½%.
Average hours Revised down slightly
• Averageweeklyhoursworkedtobebroadly flat at just over 32.
• Averageweeklyhoursworkedtobebroadly flat at around 32.
Productivity Revised down slightly
• Quarterlyhourlylabourproductivitygrowth to average just under ½% in 2018 H1.
• Quarterlyhourlylabourproductivitygrowth to average just over ¼%.
Table 3.C Monitoring the MPC’s key judgements
60
70
80
90
100
110
1990 94 98 2002 06 10 14
Index: 2008 Q1 = 100
Chart 3.7 Productivity has barely risen since the financial crisisWhole-economy hourly labour productivity(a)
Sources: ONS and Bank calculations.
(a) Output per hour based on the backcast for the final estimate of GDP.

Section 3 Supply and the limits to growth 25
BANK CONFIDENTIAL LAST UPDATED 7 FEBRUARY 2018 18:45 V9a
Box 5The implications of changing demographics for UK labour supply
At a basic level, output in the economy can expand because either there are more people producing it or gains in productivity enable more output to be produced by the same workforce. Increases in the size of the workforce have accounted for nearly all of UK output growth over the past decade. Those increases have in turn resulted mainly from population growth, although changes in labour market participation rates have also been significant (Table 1).
In the MPC’s projections, the size and composition of the population are assumed to evolve in line with the ONS’s latest principal population projections, published in October 2017. Under those projections, growth in the workforce is subdued relative to the past decade, as the average age of the population continues to rise and the level of net migration falls. This box discusses the implications of these developments.
Implications of an ageing populationThe proportion of the UK population aged over 65 has been rising steadily, from 20% of the 16+ population in 1997 to 22% in 2016, and it is projected to rise to 23% by 2020, accounting for most of the growth in the 16+ population in the ONS projections (Chart A). A rising average age, all else equal, tends to reduce labour supply growth, since it reduces the proportion of people participating in the labour market relative to those in retirement. Currently just over 10% of those aged over 65 are in work or seeking work, compared with 79% of those aged 16 to 64.
Despite this effect from population ageing, UK labour market participation has been stable in recent years. This is in part because the average participation rates of older people have increased. As explained in the box on pages 30–31 of the November 2014 Report, a number of factors are likely to have contributed to that increase, including better health and improved longevity, and rises in the state pension age. The stability in aggregate participation also reflects other developments, including the continued rise in the proportion of women in or seeking work. The MPC judges that the participation rate is likely to remain broadly flat over the forecast period, as the factors supporting participation continue to offset the effect of demographic shifts.
Implications of falling net migrationAnother feature of UK demographics over the past decade has been the significant contribution of net migration to growth in the UK workforce (Table 1). Since the EU referendum, however, levels of long-term migration have fallen and the ONS projects a further gradual fall in coming years (Chart B).(1) All else equal, that will reduce the pace of growth in UK labour supply slightly.
There is a chance that net migration could fall more sharply than the gradual decline implied by the ONS projections. There tends to be a positive relationship between migration flows to the United Kingdom and economic conditions in the United Kingdom relative to those in migrants’ home countries. Bank staff analysis suggests that the subdued outlook for UK GDP per capita, combined with stronger growth prospects in other countries (Section 1), would, on its own, reduce net
(1) The official long-term migration statistics shown in Chart B define a long-term migrant as ‘a person who moves to a country other than that of his or her usual residence for a period of at least a year, so that the country of destination effectively becomes his or her new country of usual residence’.
0.2
0.0
0.2
0.4
0.6
0.8
1.0
1.2
1997 2000 03 06 09 12 15 18
Percentage points
16–64
65+ Growth in the 16+ population (per cent)
+
–
Chart A Older people account for most of 16+ population growth in the ONS’s projectionsContributions to annual 16+ population growth(a)
Sources: ONS and Bank calculations.
(a) Calculated using ONS mid-year population estimates. Bars to the right of the dashed line are ONS projections.
Table 1 Most of the growth in the UK workforce over the past decade has been accounted for by population growthContributions to changes in size of the UK workforce
Quarterly averages
2008–10 2011–14 2015–16 2017 Q1–Q3
Change in size of the UK workforce (thousands)(a) 54 62 76 21
of which, population growth(a) 69 58 59 51
of which, net inward migration(b) 36 34 45 31
of which, changes in participation(a) -15 4 17 -30
of which, demographic effects(a)(c) -15 -38 -16 -21
of which, within-demographic effects(a)(c) 3 41 36 -14
Sources: ONS and Bank calculations.
(a) Calculated using data from the Labour Force Survey.(b) Calculated using the annual ONS long-term international migration statistics by age. Quarterly average of
annual growth. Scaled to match the LFS population estimates using the annual ONS mid-year population estimates. Includes those aged 15 and over. Data are to 2016. Shows data for 2017 Q1 and Q2 grown in line with the ONS provisional estimates of total long-term net migration.
(c) Decomposition calculated using published ONS age groupings. Demographic effects reflect changes in participation driven by changes in the relative size of the age groupings; within-demographic effects reflect changes in participation within age groups. Differences between the sum of these two components and total changes in participation are predominately due to rounding in age-specific inactivity rates.
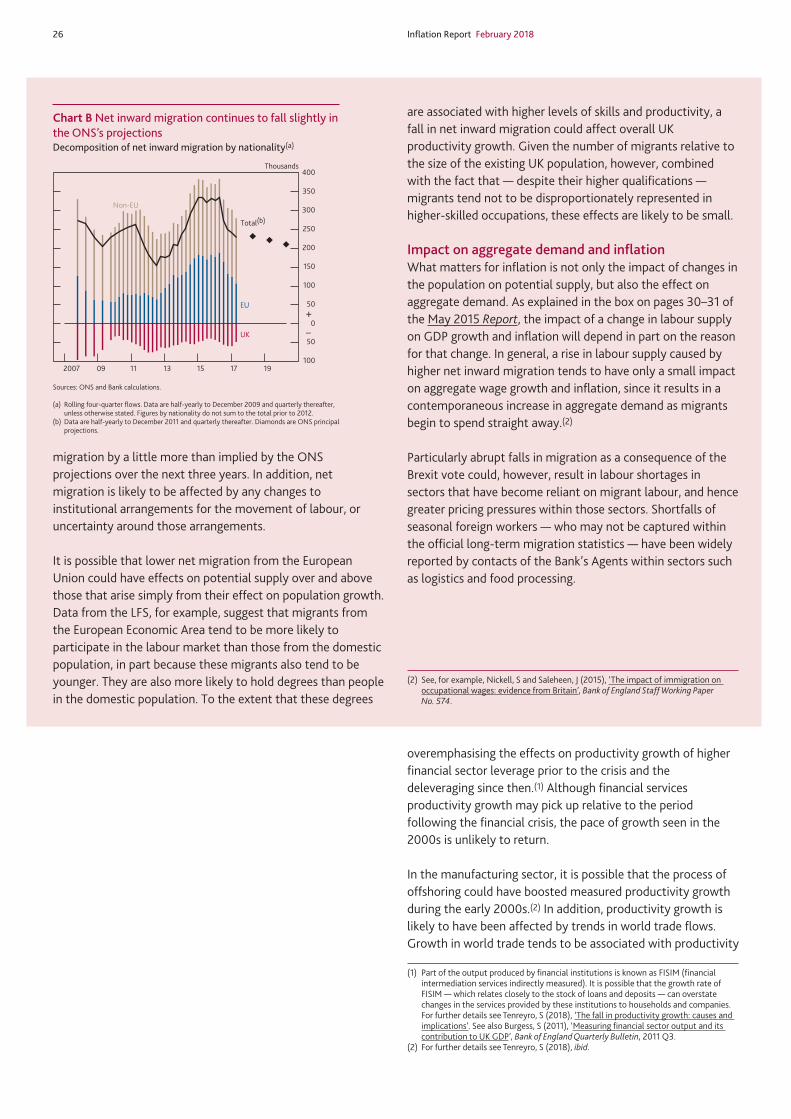
26 Inflation Report February 2018
BANK CONFIDENTIAL LAST UPDATED 7 FEBRUARY 2018 18:45 V9a
migration by a little more than implied by the ONS projections over the next three years. In addition, net migration is likely to be affected by any changes to institutional arrangements for the movement of labour, or uncertainty around those arrangements.
It is possible that lower net migration from the European Union could have effects on potential supply over and above those that arise simply from their effect on population growth. Data from the LFS, for example, suggest that migrants from the European Economic Area tend to be more likely to participate in the labour market than those from the domestic population, in part because these migrants also tend to be younger. They are also more likely to hold degrees than people in the domestic population. To the extent that these degrees
are associated with higher levels of skills and productivity, a fall in net inward migration could affect overall UK productivity growth. Given the number of migrants relative to the size of the existing UK population, however, combined with the fact that — despite their higher qualifications — migrants tend not to be disproportionately represented in higher-skilled occupations, these effects are likely to be small.
Impact on aggregate demand and inflationWhat matters for inflation is not only the impact of changes in the population on potential supply, but also the effect on aggregate demand. As explained in the box on pages 30–31 of the May 2015 Report, the impact of a change in labour supply on GDP growth and inflation will depend in part on the reason for that change. In general, a rise in labour supply caused by higher net inward migration tends to have only a small impact on aggregate wage growth and inflation, since it results in a contemporaneous increase in aggregate demand as migrants begin to spend straight away.(2)
Particularly abrupt falls in migration as a consequence of the Brexit vote could, however, result in labour shortages in sectors that have become reliant on migrant labour, and hence greater pricing pressures within those sectors. Shortfalls of seasonal foreign workers — who may not be captured within the official long-term migration statistics — have been widely reported by contacts of the Bank’s Agents within sectors such as logistics and food processing.
(2) See, for example, Nickell, S and Saleheen, J (2015), ‘The impact of immigration on occupational wages: evidence from Britain’, Bank of England Staff Working Paper No. 574.
100
50
0
50
100
150
200
250
300
350
400
2007 09 11 13 15 17 19
Thousands
UK
Non-EU
EU
Total(b)
+
–
Chart B Net inward migration continues to fall slightly in the ONS’s projectionsDecomposition of net inward migration by nationality(a)
Sources: ONS and Bank calculations.
(a) Rolling four-quarter flows. Data are half-yearly to December 2009 and quarterly thereafter, unless otherwise stated. Figures by nationality do not sum to the total prior to 2012.
(b) Data are half-yearly to December 2011 and quarterly thereafter. Diamonds are ONS principal projections.
overemphasising the effects on productivity growth of higher financial sector leverage prior to the crisis and the deleveraging since then.(1) Although financial services productivity growth may pick up relative to the period following the financial crisis, the pace of growth seen in the 2000s is unlikely to return.
In the manufacturing sector, it is possible that the process of offshoring could have boosted measured productivity growth during the early 2000s.(2) In addition, productivity growth is likely to have been affected by trends in world trade flows. Growth in world trade tends to be associated with productivity
(1) Part of the output produced by financial institutions is known as FISIM (financial intermediation services indirectly measured). It is possible that the growth rate of FISIM — which relates closely to the stock of loans and deposits — can overstate changes in the services provided by these institutions to households and companies. For further details see Tenreyro, S (2018), ‘The fall in productivity growth: causes and implications’. See also Burgess, S (2011), ‘Measuring financial sector output and its contribution to UK GDP’, Bank of England Quarterly Bulletin, 2011 Q3.
(2) For further details see Tenreyro, S (2018), ibid.
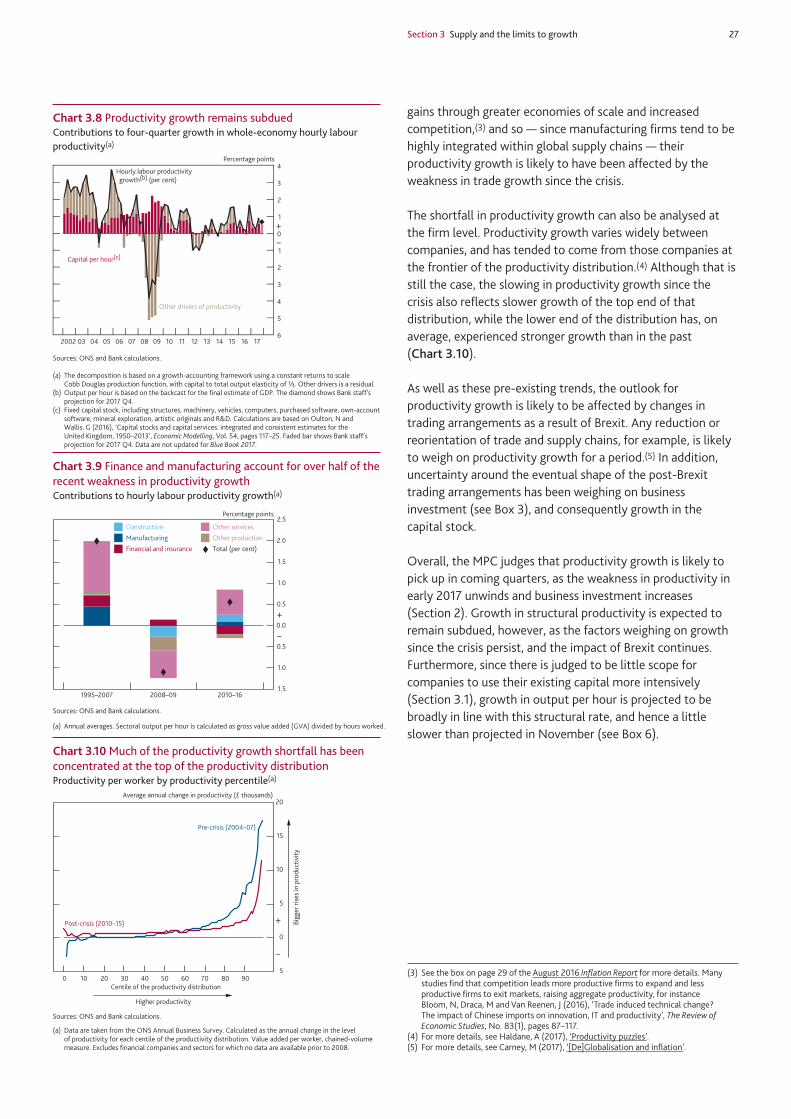
Section 3 Supply and the limits to growth 27
BANK CONFIDENTIAL LAST UPDATED 7 FEBRUARY 2018 18:45 V9a
gains through greater economies of scale and increased competition,(3) and so — since manufacturing firms tend to be highly integrated within global supply chains — their productivity growth is likely to have been affected by the weakness in trade growth since the crisis.
The shortfall in productivity growth can also be analysed at the firm level. Productivity growth varies widely between companies, and has tended to come from those companies at the frontier of the productivity distribution.(4) Although that is still the case, the slowing in productivity growth since the crisis also reflects slower growth of the top end of that distribution, while the lower end of the distribution has, on average, experienced stronger growth than in the past (Chart 3.10).
As well as these pre-existing trends, the outlook for productivity growth is likely to be affected by changes in trading arrangements as a result of Brexit. Any reduction or reorientation of trade and supply chains, for example, is likely to weigh on productivity growth for a period.(5) In addition, uncertainty around the eventual shape of the post-Brexit trading arrangements has been weighing on business investment (see Box 3), and consequently growth in the capital stock.
Overall, the MPC judges that productivity growth is likely to pick up in coming quarters, as the weakness in productivity in early 2017 unwinds and business investment increases (Section 2). Growth in structural productivity is expected to remain subdued, however, as the factors weighing on growth since the crisis persist, and the impact of Brexit continues. Furthermore, since there is judged to be little scope for companies to use their existing capital more intensively (Section 3.1), growth in output per hour is projected to be broadly in line with this structural rate, and hence a little slower than projected in November (see Box 6).
(3) See the box on page 29 of the August 2016 Inflation Report for more details. Many studies find that competition leads more productive firms to expand and less productive firms to exit markets, raising aggregate productivity, for instance Bloom, N, Draca, M and Van Reenen, J (2016), ‘Trade induced technical change? The impact of Chinese imports on innovation, IT and productivity’, The Review of Economic Studies, No. 83(1), pages 87–117.
(4) For more details, see Haldane, A (2017), ‘Productivity puzzles’.(5) For more details, see Carney, M (2017), ‘[De]Globalisation and inflation’.
6
5
4
3
2
1
0
1
2
3
4
2002 04 06 08 10 12 14 16
Percentage points
Other drivers of productivity
Capital per hour(c)
Hourly labour productivity growth(b) (per cent)
03 0705 09 11 13 15 17
+
–
Chart 3.8 Productivity growth remains subdued Contributions to four-quarter growth in whole-economy hourly labour productivity(a)
Sources: ONS and Bank calculations.
(a) The decomposition is based on a growth-accounting framework using a constant returns to scale Cobb Douglas production function, with capital to total output elasticity of 1/£. Other drivers is a residual.
(b) Output per hour is based on the backcast for the final estimate of GDP. The diamond shows Bank staff’s projection for 2017 Q4.
(c) Fixed capital stock, including structures, machinery, vehicles, computers, purchased software, own-account software, mineral exploration, artistic originals and R&D. Calculations are based on Oulton, N and Wallis, G (2016), ‘Capital stocks and capital services: integrated and consistent estimates for the United Kingdom, 1950–2013’, Economic Modelling, Vol. 54, pages 117–25. Faded bar shows Bank staff’s projection for 2017 Q4. Data are not updated for Blue Book 2017.
1.5
1.0
0.5
0.0
0.5
1.0
1.5
2.0
2.5
1995–2007 2008–09 2010–16
Other services
Other production
Construction
Financial and insurance
Manufacturing
Total (per cent)
Percentage points
+
–
Chart 3.9 Finance and manufacturing account for over half of the recent weakness in productivity growthContributions to hourly labour productivity growth(a)
Sources: ONS and Bank calculations.
(a) Annual averages. Sectoral output per hour is calculated as gross value added (GVA) divided by hours worked.
5
0
5
10
15
20
0 10 20 30 40 50 60 70 80 90Centile of the productivity distribution
Average annual change in productivity (£ thousands)
Pre-crisis (2004–07)
Post-crisis (2010–15) Bigg
er ri
ses
in p
rodu
ctiv
ity
Higher productivity
+
–
Chart 3.10 Much of the productivity growth shortfall has been concentrated at the top of the productivity distributionProductivity per worker by productivity percentile(a)
Sources: ONS and Bank calculations.
(a) Data are taken from the ONS Annual Business Survey. Calculated as the annual change in the level of productivity for each centile of the productivity distribution. Value added per worker, chained-volume measure. Excludes financial companies and sectors for which no data are available prior to 2008.
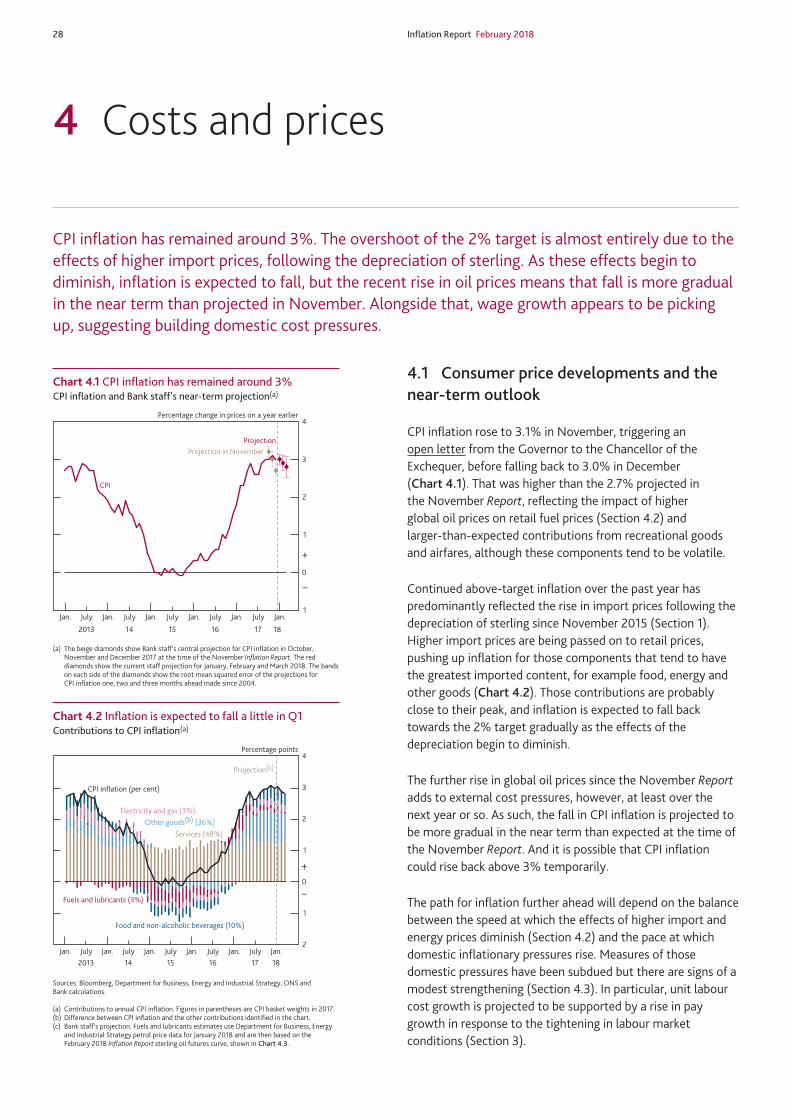
28 Inflation Report February 2018
4 Costs and prices
CPI inflation has remained around 3%. The overshoot of the 2% target is almost entirely due to the effects of higher import prices, following the depreciation of sterling. As these effects begin to diminish, inflation is expected to fall, but the recent rise in oil prices means that fall is more gradual in the near term than projected in November. Alongside that, wage growth appears to be picking up, suggesting building domestic cost pressures.
4.1 Consumer price developments and the near-term outlook
CPI inflation rose to 3.1% in November, triggering an open letter from the Governor to the Chancellor of the Exchequer, before falling back to 3.0% in December (Chart 4.1). That was higher than the 2.7% projected in the November Report, reflecting the impact of higher global oil prices on retail fuel prices (Section 4.2) and larger-than-expected contributions from recreational goods and airfares, although these components tend to be volatile.
Continued above-target inflation over the past year has predominantly reflected the rise in import prices following the depreciation of sterling since November 2015 (Section 1). Higher import prices are being passed on to retail prices, pushing up inflation for those components that tend to have the greatest imported content, for example food, energy and other goods (Chart 4.2). Those contributions are probably close to their peak, and inflation is expected to fall back towards the 2% target gradually as the effects of the depreciation begin to diminish.
The further rise in global oil prices since the November Report adds to external cost pressures, however, at least over the next year or so. As such, the fall in CPI inflation is projected to be more gradual in the near term than expected at the time of the November Report. And it is possible that CPI inflation could rise back above 3% temporarily.
The path for inflation further ahead will depend on the balance between the speed at which the effects of higher import and energy prices diminish (Section 4.2) and the pace at which domestic inflationary pressures rise. Measures of those domestic pressures have been subdued but there are signs of a modest strengthening (Section 4.3). In particular, unit labour cost growth is projected to be supported by a rise in pay growth in response to the tightening in labour market conditions (Section 3).
1
0
1
2
3
4
Jan. July Jan. July Jan. July Jan. July Jan. July Jan.
Projection
Percentage change in prices on a year earlier
CPI
Projection in November
2013 14 1615 1817
+
–
Chart 4.1 CPI inflation has remained around 3%CPI inflation and Bank staff’s near-term projection(a)
(a) The beige diamonds show Bank staff’s central projection for CPI inflation in October, November and December 2017 at the time of the November Inflation Report. The red diamonds show the current staff projection for January, February and March 2018. The bands on each side of the diamonds show the root mean squared error of the projections for CPI inflation one, two and three months ahead made since 2004.
Services (48%) Other goods(b) (36%)
Fuels and lubricants (3%)
2
1
0
1
2
3
4
Jan. July Jan. July Jan. July Jan. July Jan. July Jan.
Percentage points
Projection(c)
2013 15 16 17 1814
Food and non-alcoholic beverages (10%)
CPI inflation (per cent)
Electricity and gas (3%)
+
–
Chart 4.2 Inflation is expected to fall a little in Q1Contributions to CPI inflation(a)
Sources: Bloomberg, Department for Business, Energy and Industrial Strategy, ONS and Bank calculations.
(a) Contributions to annual CPI inflation. Figures in parentheses are CPI basket weights in 2017.(b) Difference between CPI inflation and the other contributions identified in the chart.(c) Bank staff’s projection. Fuels and lubricants estimates use Department for Business, Energy
and Industrial Strategy petrol price data for January 2018 and are then based on the February 2018 Inflation Report sterling oil futures curve, shown in Chart 4.3.

Section 4 Costs and prices 29
4.2 External cost pressures
EnergyIn the run-up to the February Report, the sterling spot Brent oil price was 15% higher than at the time of the November Report and was at its highest level since late 2014 (Chart 4.3). That reflected a sharp rise in US dollar oil prices following the strengthening in global economic activity and only moderate growth in oil supply (Section 1).
Changes in oil prices tend to be passed on to fuel prices relatively quickly. The further rise in oil prices since November is expected to push up CPI inflation in 2018 Q1 by an additional 0.2 percentage points, although that is partly offset by the impact of the freeze in fuel duty announced in the November 2017 Budget.
Although the spot price of oil is higher, the oil futures curve, on which the MPC’s forecasts are conditioned, has risen by less and continues to slope downwards. That downward slope pulls down projected inflation during 2019 by just under 0.1 percentage points on average, a slightly bigger drag than implied at the time of the November Report.
Rises in retail gas and electricity prices in the first half of 2017 have been pushing up inflation, but those rises will drop out of the annual comparison in coming months. Partly offsetting that, some small increases in utility bills are expected towards the end of 2018, as more recent rises in sterling spot wholesale gas prices, and the sterling gas futures curve on which the MPC’s projections are conditioned, feed through.
Non-energy imported costsAs set out in previous Reports, recent above-target inflation has reflected higher non-energy import prices facing UK companies. That largely reflects the depreciation of sterling, which is 16% below its November 2015 peak. In addition, world non-oil export prices — the foreign currency prices companies in other countries charge for their exports — weighted according to countries’ shares in UK imports, have risen in recent years (Section 1) and are projected to increase slightly further during 2018.
Between 2015 Q4 and 2017 Q3, non-energy import prices rose by 10% (Chart 4.4), just under half of the rise in sterling world export prices. As explained in the box on pages 28–29 of the November 2015 Report, Bank staff have estimated that, on average, 60% of changes in the sterling value of non-energy world export prices are subsequently reflected in UK import prices. As most of that occurs within a year the current degree of pass-through is a little less than expected and, in addition, some indicators of import price inflation have fallen (Chart 4.4). Depending on how companies react to the change in the exchange rate, it can take longer for the full effect to
0
20
40
60
80
100
120
0
10
20
30
40
50
60
70
80
90
2007 09 11 13 15 17 19
November 2017 Inflation Report futures curve(c)
February 2018 Inflation Report futures curve(c)
£ per barrelPence per therm
Oil(a) (right-hand scale)
Gas(b) (left-hand scale)
Chart 4.3 Oil prices have continued to riseSterling oil and wholesale gas prices
Sources: Bank of England, Bloomberg, Thomson Reuters Datastream and Bank calculations.
(a) US dollar Brent forward prices for delivery in 10–25 days’ time converted into sterling.(b) One-day forward price of UK natural gas.(c) Fifteen working day averages to 25 October 2017 and 31 January 2018 respectively.
15
10
5
0
5
10
15
2005 08 11 14 17
Percentage changes on a year earlier
Range of input cost indicators(a)
Import prices(b)
10
5
0
5
10
15
20
25
2005 08 11 14 17
Percentage changes on a year earlier
+–
+–
Import prices(b)
Foreign export prices in sterling terms(d)
Foreign export prices in foreign currency(c)
Chart 4.4 Import price inflation appears to have peaked Import prices, foreign export prices and indicators of input cost pressures
Sources: Bank of England, BCC, CBI, CEIC, Eurostat, IHS Markit, ONS, Thomson Reuters Datastream and Bank calculations.
(a) Swathe includes: producer price index (PPI) imported materials prices; Markit/CIPS manufacturing input prices; BCC input cost pressures; CBI manufacturing average costs over the past three months (from the Quarterly Industrial Trends Survey); and Bank Agents’ material costs scores. BCC and PPI data are not seasonally adjusted. Adjusted to match the mean and variance of import price growth since 2000.
(b) UK goods and services import deflator excluding fuels and the impact of MTIC fraud. Diamond shows Bank staff’s projection for 2017 Q4.
(c) Domestic currency non-oil export prices for goods and services of 51 countries weighted according to their shares in UK imports. The sample excludes major oil exporters. Diamond shows Bank staff’s projection for 2017 Q4.
(d) Domestic currency non-oil export prices as defined in footnote (c) divided by the sterling exchange rate index. Diamond shows Bank staff’s projection for 2017 Q4.

30 Inflation Report February 2018
come through. As such, import prices are expected to rise a little further in 2018. There is a risk, however, that the shortfall in import prices relative to the size of the fall in sterling is not fully made up.
The rise in non-energy import prices since the end of 2015 has accounted for most of the rise in companies’ costs over that period. That appears to have squeezed consumer sector companies’ profit margins (Chart 4.5), although these are being restored as companies pass cost increases on to higher retail prices. As explained in the box in the November 2015 Report, the CPI is estimated to rise by around 30% of any rise in import prices. This pass-through has been gradual, on average, in the past with the peak impact on inflation after a year and inflation continuing to be pushed up for a further three years after that.
In the November 2016 Report, the MPC judged that the pass-through from higher non-energy import prices to consumer prices was likely to occur more rapidly than in the past, due to the nature of the depreciation. It is difficult to measure the precise degree of pass-through but, if anything, it appears to be a little greater than expected so far. Inflation among more import-intensive components of the CPI — those components that are imported or have an above-average share of imported inputs, and are therefore most affected by import price increases — has risen sharply (Chart 4.6).
Overall, the impact of the depreciation of sterling on CPI inflation is broadly as expected and is probably close to its peak. That contribution is likely to fall back over the forecast period but the precise path will depend on the speed and extent of further rises in import prices (Section 5).
4.3 Domestic cost pressures
Once the transitory effects from the fall in sterling have passed through, and in the absence of further external cost shocks, CPI inflation will be mainly determined by domestic inflationary pressures.
The cost of labour, and in particular wages, is the largest domestic cost facing most companies and hence is a significant driver of domestic inflationary pressures. The degree to which those costs affect inflation will depend on growth in unit labour costs (ULCs) — the labour costs associated with producing a unit of output.
Wages and unit labour costsULC growth has slowed since the end of 2016 (Chart 4.7). That mainly reflects a decline in the contribution from non-wage labour costs, which had previously been pushing up ULC growth as a result of higher pension contributions. Forthcoming increases in minimum contributions for auto-enrolled pensions will continue to push up non-wage
7
6
5
4
3
2
1
0
1
2
3
1998 2001 04 07 10 13 16
Percentage point deviation from 1998–2007 average
+
–
Chart 4.5 Consumer profit margins have been squeezedEstimated margins on consumer goods and services(a)
Sources: ONS and Bank calculations.
(a) Calculated as differences in the ratio of the CPI, seasonally adjusted by Bank staff, and estimated costs of production and distribution for consumer goods and services relative to 1998–2007 averages. Costs consist of labour, imports, energy and taxes, weighted to reflect their intensity in CPI.
4
3
2
1
0
1
2
3
4
5
1997 2001 05 09 13 17
Per cent
Lower import-intensive CPI components
Higher import-intensive CPI components
+
–
Chart 4.6 The pickup in CPI inflation has largely reflected higher prices for import-intensive componentsCPI inflation by import intensity(a)
Sources: ONS and Bank calculations.
(a) Higher import-intensive and lower import-intensive CPI components comprise the top half and bottom half respectively of CPI components by weight ordered by import intensity. Excluding fuel and administered and regulated prices. Data are adjusted by Bank staff for changes in the rate of VAT, although there is uncertainty around the precise impact of those changes. Import intensities are ONS estimates of the percentage total contribution of imports to final household consumption in the CPI, by COICOP class, based on the United Kingdom Input-Output Analytical Tables 2014.
4
2
0
2
4
6
8
10
2005 07 09 11 13 15 17
Productivity
Non-wage labour costs per head
Wages, salaries and self-employment income per head(b)
Unit labour cost growth (per cent)
Percentage points
+
–
Chart 4.7 Unit labour cost growth is expected to have picked up in Q4 Decomposition of four-quarter whole-economy unit labour cost growth(a)
(a) Whole-economy labour costs divided by real GDP, based on the backcast of the final estimate of GDP. The diamond shows Bank staff’s projection for 2017 Q4.
(b) Self-employment income is calculated from mixed income, assuming that the share of employment income in that is the same as the share of employee compensation in nominal GDP less mixed income.

Section 4 Costs and prices 31
labour costs but, as these rises affect only a subset of employees, the impact on aggregate ULC growth is expected to be modest.
Pay growth has also been weighing on ULC growth in recent years. During the financial crisis, pay growth slowed as unemployment rose. But even though unemployment has fallen back in recent years, to its lowest level since 1975, pay growth has remained subdued relative to historical norms.
For the most part, the weakness of pay growth reflects slow productivity growth (Section 3), so has not affected ULC growth (Chart 4.7). One factor that is likely to have been weighing on both productivity and wage growth in recent years is changes in the composition of the workforce. During a downturn in the economy, job losses tend to be concentrated in lower-skilled, lower-paid roles. Fewer lower-paid workers mechanically lifts average pay even if the wages of those remaining in work are unchanged. As the economy recovers and unemployment falls, this effect tends to unwind, depressing measures of average wages as those out of work find jobs. This effect is estimated from LFS data to have reduced annual pay growth by around ½ percentage point in 2017 Q3 (Chart 4.8). But, to the extent that has also been associated with lower productivity (Section 3), ULC growth will have been less affected.
Weak pay growth over the past is also likely to have reflected slack in the labour market, which will have weighed on ULC growth. The extent to which lower unemployment puts upward pressure on wages and inflation depends on where it is relative to the equilibrium rate, which in turn depends on the structural features of the labour market. As discussed in Box 4, the limited response of wage growth to falling unemployment is one of the reasons why the MPC judges that the long-term equilibrium unemployment rate is probably around 4¼%, lower than assumed in previous Reports and broadly in line with the current headline rate of unemployment, at 4.3% in the three months to November. The drag from unemployment on wage growth is therefore likely to dissipate in coming quarters.
Consistent with pay pressures starting to build as slack has been absorbed, data from the Annual Survey of Hours and Earnings suggest that pay growth for those switching jobs, rather than remaining in the same job, has returned to around its pre-crisis rate (Chart 4.9). Reports from the Bank’s Agents suggest that firms have targeted pay rises to those employees likely to switch jobs in recent years. The REC indicator also shows some rises in pay growth for new recruits (Table 4.A).
There are also signs that pay growth is starting to rise more broadly. Three-month regular pay growth relative to the previous three months has remained around 3% on an annualised basis (Chart 4.10), somewhat higher than expected
+
–Industry
Occupation
Other(b)
1.5
1.0
0.5
0.0
0.5
1.0
1.5Percentage points
Qualification
Total compositional effects
2008 11 14 17
Chart 4.8 Compositional effects weighed on wage growth in Q3Estimates of the contribution of employment characteristics to four-quarter wage growth(a)
Sources: Labour Force Survey and Bank calculations.
(a) Estimates are shown relative to their averages over 1995 Q2–2017 Q3. Estimates of the effect of individual and job characteristics are derived from a regression of these characteristics on levels of employee pay using Labour Force Survey data. The estimate of the total compositional effect is obtained by combining these estimates with changes in the composition of the labour force.
(b) Other includes age, tenure, gender, region of residence, whether working full-time and whether in public sector employment.
Workers staying in jobs
Workers moving jobs
0
2
4
6
8
10
12
2001 03 05 07 09 11 13 15 17
Per cent
Chart 4.9 Pay growth has recovered by more for those switching jobsMedian growth rates of pay(a)(b)
Sources: Annual Survey of Hours and Earnings and Bank calculations.
(a) Workers moving jobs are defined as workers in employment in consecutive years in a different job. Workers staying in jobs are defined as workers in employment in consecutive years in the same job.
(b) Pay growth is median growth rate in April. Based on hourly gross earnings obtained by dividing gross pay in the reference week by total hours worked.
0
1
2
3
4
5Per cent
Three-month on three-month annualised
Three months on a year earlier
Jan. July Jan. July
2016 17
Chart 4.10 Pay growth has picked up in recent monthsWhole-economy regular pay growth(a)
(a) Whole-economy total pay excluding bonuses and arrears of pay.
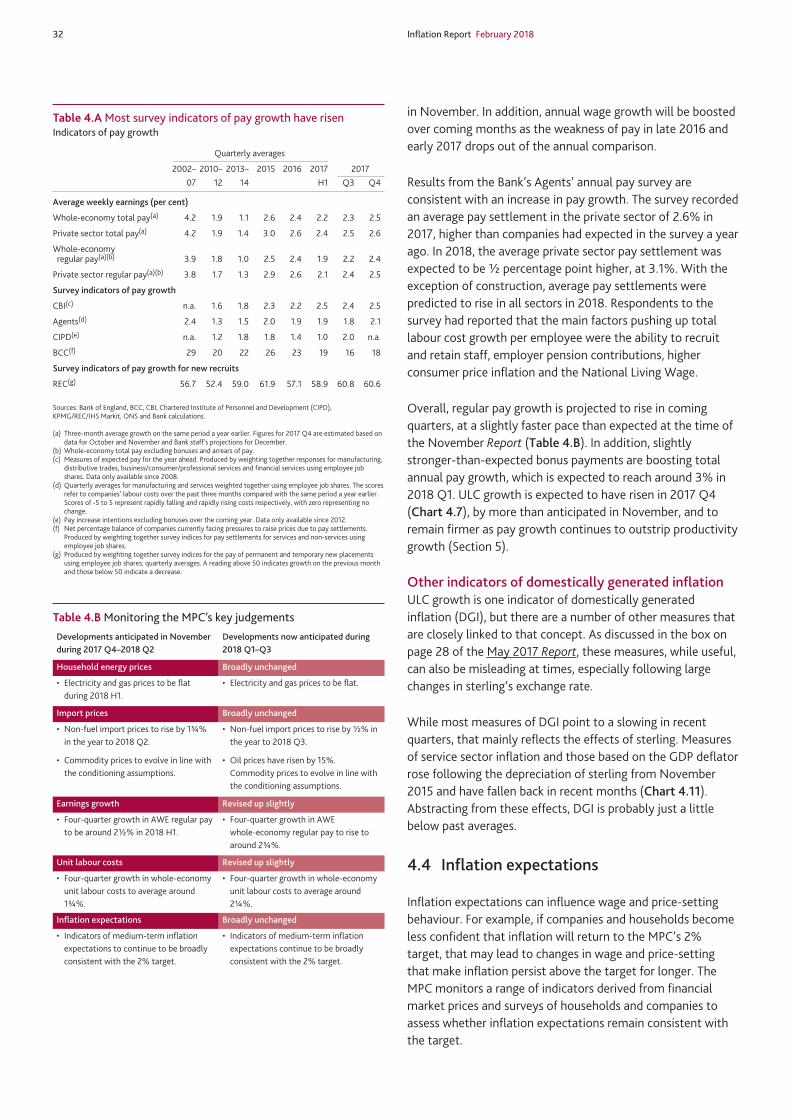
32 Inflation Report February 2018
in November. In addition, annual wage growth will be boosted over coming months as the weakness of pay in late 2016 and early 2017 drops out of the annual comparison.
Results from the Bank’s Agents’ annual pay survey are consistent with an increase in pay growth. The survey recorded an average pay settlement in the private sector of 2.6% in 2017, higher than companies had expected in the survey a year ago. In 2018, the average private sector pay settlement was expected to be ½ percentage point higher, at 3.1%. With the exception of construction, average pay settlements were predicted to rise in all sectors in 2018. Respondents to the survey had reported that the main factors pushing up total labour cost growth per employee were the ability to recruit and retain staff, employer pension contributions, higher consumer price inflation and the National Living Wage.
Overall, regular pay growth is projected to rise in coming quarters, at a slightly faster pace than expected at the time of the November Report (Table 4.B). In addition, slightly stronger-than-expected bonus payments are boosting total annual pay growth, which is expected to reach around 3% in 2018 Q1. ULC growth is expected to have risen in 2017 Q4 (Chart 4.7), by more than anticipated in November, and to remain firmer as pay growth continues to outstrip productivity growth (Section 5).
Other indicators of domestically generated inflation ULC growth is one indicator of domestically generated inflation (DGI), but there are a number of other measures that are closely linked to that concept. As discussed in the box on page 28 of the May 2017 Report, these measures, while useful, can also be misleading at times, especially following large changes in sterling’s exchange rate.
While most measures of DGI point to a slowing in recent quarters, that mainly reflects the effects of sterling. Measures of service sector inflation and those based on the GDP deflator rose following the depreciation of sterling from November 2015 and have fallen back in recent months (Chart 4.11). Abstracting from these effects, DGI is probably just a little below past averages.
4.4 Inflation expectations
Inflation expectations can influence wage and price-setting behaviour. For example, if companies and households become less confident that inflation will return to the MPC’s 2% target, that may lead to changes in wage and price-setting that make inflation persist above the target for longer. The MPC monitors a range of indicators derived from financial market prices and surveys of households and companies to assess whether inflation expectations remain consistent with the target.
Table 4.A Most survey indicators of pay growth have risen Indicators of pay growth
Quarterly averages
2002– 2010– 2013– 2015 2016 2017 2017 07 12 14 H1 Q3 Q4
Average weekly earnings (per cent)
Whole-economy total pay(a) 4.2 1.9 1.1 2.6 2.4 2.2 2.3 2.5
Private sector total pay(a) 4.2 1.9 1.4 3.0 2.6 2.4 2.5 2.6
Whole-economy regular pay(a)(b) 3.9 1.8 1.0 2.5 2.4 1.9 2.2 2.4
Private sector regular pay(a)(b) 3.8 1.7 1.3 2.9 2.6 2.1 2.4 2.5
Survey indicators of pay growth
CBI(c) n.a. 1.6 1.8 2.3 2.2 2.5 2.4 2.5
Agents(d) 2.4 1.3 1.5 2.0 1.9 1.9 1.8 2.1
CIPD(e) n.a. 1.2 1.8 1.8 1.4 1.0 2.0 n.a.
BCC(f) 29 20 22 26 23 19 16 18
Survey indicators of pay growth for new recruits
REC(g) 56.7 52.4 59.0 61.9 57.1 58.9 60.8 60.6
Sources: Bank of England, BCC, CBI, Chartered Institute of Personnel and Development (CIPD), KPMG/REC/IHS Markit, ONS and Bank calculations.
(a) Three-month average growth on the same period a year earlier. Figures for 2017 Q4 are estimated based on data for October and November and Bank staff’s projections for December.
(b) Whole-economy total pay excluding bonuses and arrears of pay.(c) Measures of expected pay for the year ahead. Produced by weighting together responses for manufacturing,
distributive trades, business/consumer/professional services and financial services using employee job shares. Data only available since 2008.
(d) Quarterly averages for manufacturing and services weighted together using employee job shares. The scores refer to companies’ labour costs over the past three months compared with the same period a year earlier. Scores of -5 to 5 represent rapidly falling and rapidly rising costs respectively, with zero representing no change.
(e) Pay increase intentions excluding bonuses over the coming year. Data only available since 2012.(f) Net percentage balance of companies currently facing pressures to raise prices due to pay settlements.
Produced by weighting together survey indices for pay settlements for services and non-services using employee job shares.
(g) Produced by weighting together survey indices for the pay of permanent and temporary new placements using employee job shares; quarterly averages. A reading above 50 indicates growth on the previous month and those below 50 indicate a decrease.
Developments anticipated in November during 2017 Q4–2018 Q2
Developments now anticipated during 2018 Q1–Q3
Household energy prices Broadly unchanged
• Electricityandgaspricestobeflatduring 2018 H1.
• Electricityandgaspricestobeflat.
Import prices Broadly unchanged
• Non-fuelimportpricestoriseby1¾%in the year to 2018 Q2.
• Commoditypricestoevolveinlinewiththe conditioning assumptions.
• Non-fuelimportpricestoriseby½%inthe year to 2018 Q3.
• Oilpriceshaverisenby15%.Commodity prices to evolve in line with the conditioning assumptions.
Earnings growth Revised up slightly
• Four-quartergrowthinAWEregularpayto be around 2½% in 2018 H1.
• Four-quartergrowthinAWEwhole-economy regular pay to rise to around2¾%.
Unit labour costs Revised up slightly
• Four-quartergrowthinwhole-economyunit labour costs to average around 1¾%.
• Four-quartergrowthinwhole-economyunit labour costs to average around 2¼%.
Inflation expectations Broadly unchanged
• Indicatorsofmedium-terminflationexpectations to continue to be broadly consistent with the 2% target.
• Indicatorsofmedium-terminflationexpectations continue to be broadly consistent with the 2% target.
Table 4.B Monitoring the MPC’s key judgements
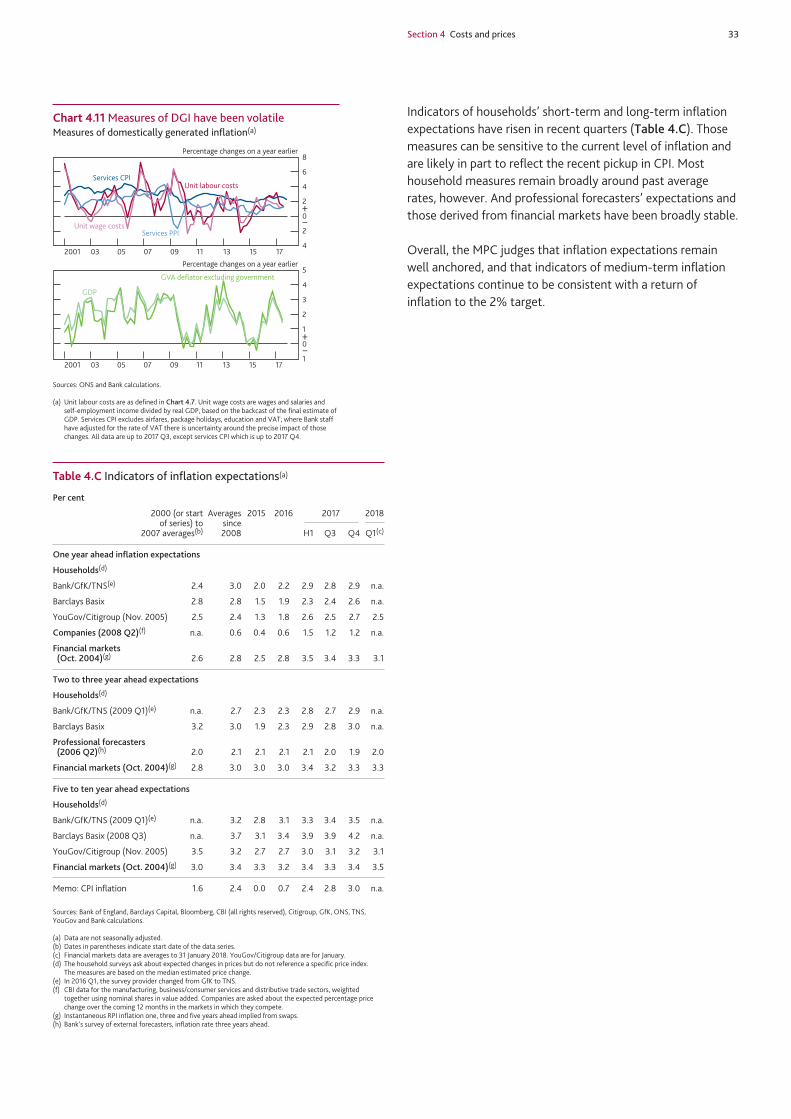
Section 4 Costs and prices 33
Indicators of households’ short-term and long-term inflation expectations have risen in recent quarters (Table 4.C). Those measures can be sensitive to the current level of inflation and are likely in part to reflect the recent pickup in CPI. Most household measures remain broadly around past average rates, however. And professional forecasters’ expectations and those derived from financial markets have been broadly stable.
Overall, the MPC judges that inflation expectations remain well anchored, and that indicators of medium-term inflation expectations continue to be consistent with a return of inflation to the 2% target.
Percentage changes on a year earlier
Percentage changes on a year earlier
4
2
0
2
4
6
8
2001 03 05 07 09 11 13 15 17
Unit wage costs
Services CPI
Services PPI
Unit labour costs
1
0
1
2
3
4
5
2001 03 05 07 09 11 13 15 17
GVA deflator excluding government
GDP
+–
+–
Chart 4.11 Measures of DGI have been volatileMeasures of domestically generated inflation(a)
Sources: ONS and Bank calculations.
(a) Unit labour costs are as defined in Chart 4.7. Unit wage costs are wages and salaries and self-employment income divided by real GDP, based on the backcast of the final estimate of GDP. Services CPI excludes airfares, package holidays, education and VAT; where Bank staff have adjusted for the rate of VAT there is uncertainty around the precise impact of those changes. All data are up to 2017 Q3, except services CPI which is up to 2017 Q4.
Table 4.C Indicators of inflation expectations(a)
Per cent
2000 (or start Averages 2015 2016 2017 2018 of series) to since 2007 averages(b) 2008 H1 Q3 Q4 Q1(c)
One year ahead inflation expectations
Households(d)
Bank/GfK/TNS(e) 2.4 3.0 2.0 2.2 2.9 2.8 2.9 n.a.
Barclays Basix 2.8 2.8 1.5 1.9 2.3 2.4 2.6 n.a.
YouGov/Citigroup (Nov. 2005) 2.5 2.4 1.3 1.8 2.6 2.5 2.7 2.5
Companies (2008 Q2)(f) n.a. 0.6 0.4 0.6 1.5 1.2 1.2 n.a.
Financial markets (Oct. 2004)(g) 2.6 2.8 2.5 2.8 3.5 3.4 3.3 3.1
Two to three year ahead expectations
Households(d)
Bank/GfK/TNS (2009 Q1)(e) n.a. 2.7 2.3 2.3 2.8 2.7 2.9 n.a.
Barclays Basix 3.2 3.0 1.9 2.3 2.9 2.8 3.0 n.a.
Professional forecasters (2006 Q2)(h) 2.0 2.1 2.1 2.1 2.1 2.0 1.9 2.0
Financial markets (Oct. 2004)(g) 2.8 3.0 3.0 3.0 3.4 3.2 3.3 3.3
Five to ten year ahead expectations
Households(d)
Bank/GfK/TNS (2009 Q1)(e) n.a. 3.2 2.8 3.1 3.3 3.4 3.5 n.a.
Barclays Basix (2008 Q3) n.a. 3.7 3.1 3.4 3.9 3.9 4.2 n.a.
YouGov/Citigroup (Nov. 2005) 3.5 3.2 2.7 2.7 3.0 3.1 3.2 3.1
Financial markets (Oct. 2004)(g) 3.0 3.4 3.3 3.2 3.4 3.3 3.4 3.5
Memo: CPI inflation 1.6 2.4 0.0 0.7 2.4 2.8 3.0 n.a.
Sources: Bank of England, Barclays Capital, Bloomberg, CBI (all rights reserved), Citigroup, GfK, ONS, TNS, YouGov and Bank calculations.
(a) Data are not seasonally adjusted.(b) Dates in parentheses indicate start date of the data series.(c) Financial markets data are averages to 31 January 2018. YouGov/Citigroup data are for January.(d) The household surveys ask about expected changes in prices but do not reference a specific price index.
The measures are based on the median estimated price change.(e) In 2016 Q1, the survey provider changed from GfK to TNS.(f) CBI data for the manufacturing, business/consumer services and distributive trade sectors, weighted
together using nominal shares in value added. Companies are asked about the expected percentage price change over the coming 12 months in the markets in which they compete.
(g) Instantaneous RPI inflation one, three and five years ahead implied from swaps.(h) Bank’s survey of external forecasters, inflation rate three years ahead.
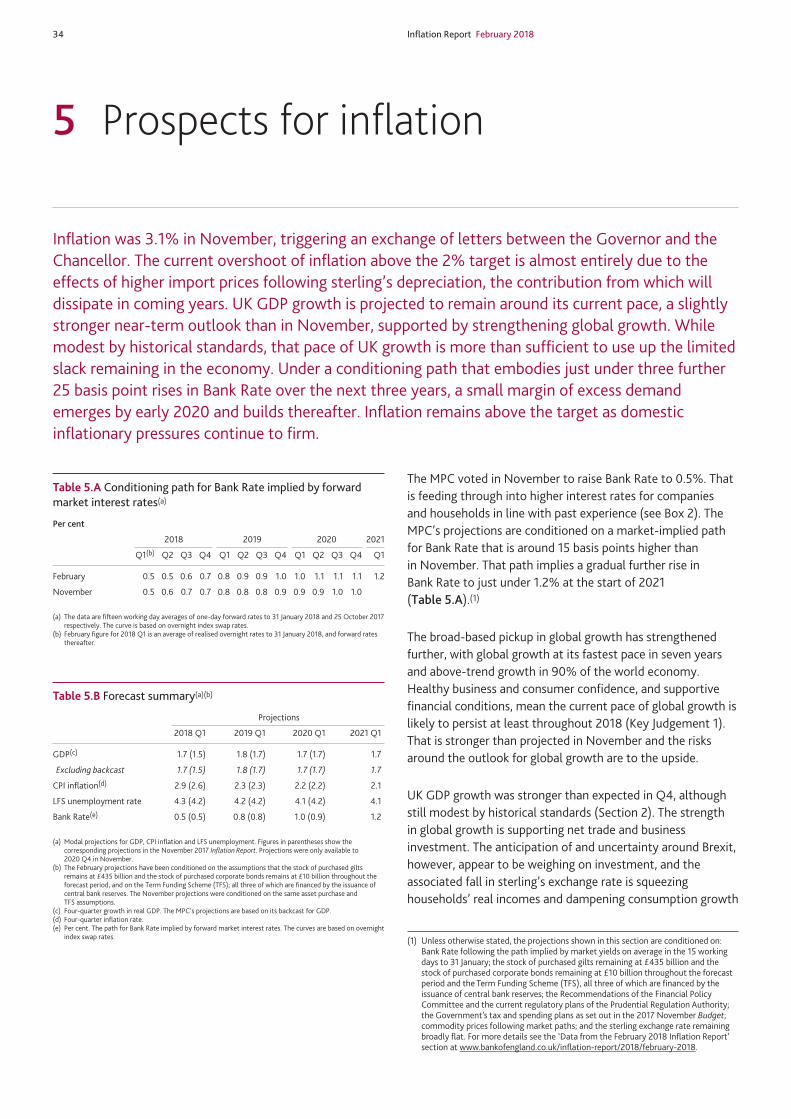
34 Inflation Report February 2018
5 Prospects for inflation
Inflation was 3.1% in November, triggering an exchange of letters between the Governor and the Chancellor. The current overshoot of inflation above the 2% target is almost entirely due to the effects of higher import prices following sterling’s depreciation, the contribution from which will dissipate in coming years. UK GDP growth is projected to remain around its current pace, a slightly stronger near‑term outlook than in November, supported by strengthening global growth. While modest by historical standards, that pace of UK growth is more than sufficient to use up the limited slack remaining in the economy. Under a conditioning path that embodies just under three further 25 basis point rises in Bank Rate over the next three years, a small margin of excess demand emerges by early 2020 and builds thereafter. Inflation remains above the target as domestic inflationary pressures continue to firm.
The MPC voted in November to raise Bank Rate to 0.5%. That is feeding through into higher interest rates for companies and households in line with past experience (see Box 2). The MPC’s projections are conditioned on a market‑implied path for Bank Rate that is around 15 basis points higher than in November. That path implies a gradual further rise in Bank Rate to just under 1.2% at the start of 2021 (Table 5.A).(1)
The broad‑based pickup in global growth has strengthened further, with global growth at its fastest pace in seven years and above‑trend growth in 90% of the world economy. Healthy business and consumer confidence, and supportive financial conditions, mean the current pace of global growth is likely to persist at least throughout 2018 (Key Judgement 1). That is stronger than projected in November and the risks around the outlook for global growth are to the upside.
UK GDP growth was stronger than expected in Q4, although still modest by historical standards (Section 2). The strength in global growth is supporting net trade and business investment. The anticipation of and uncertainty around Brexit, however, appear to be weighing on investment, and the associated fall in sterling’s exchange rate is squeezing households’ real incomes and dampening consumption growth
(1) Unless otherwise stated, the projections shown in this section are conditioned on: Bank Rate following the path implied by market yields on average in the 15 working days to 31 January; the stock of purchased gilts remaining at £435 billion and the stock of purchased corporate bonds remaining at £10 billion throughout the forecast period and the Term Funding Scheme (TFS), all three of which are financed by the issuance of central bank reserves; the Recommendations of the Financial Policy Committee and the current regulatory plans of the Prudential Regulation Authority; the Government’s tax and spending plans as set out in the 2017 November Budget; commodity prices following market paths; and the sterling exchange rate remaining broadly flat. For more details see the ‘Data from the February 2018 Inflation Report’ section at www.bankofengland.co.uk/inflation‑report/2018/february‑2018.
Table 5.A Conditioning path for Bank Rate implied by forward market interest rates(a)
Per cent
2018 2019 2020 2021
Q1(b) Q2 Q3 Q4 Q1 Q2 Q3 Q4 Q1 Q2 Q3 Q4 Q1
February 0.5 0.5 0.6 0.7 0.8 0.9 0.9 1.0 1.0 1.1 1.1 1.1 1.2
November 0.5 0.6 0.7 0.7 0.8 0.8 0.8 0.9 0.9 0.9 1.0 1.0
(a) The data are fifteen working day averages of one‑day forward rates to 31 January 2018 and 25 October 2017 respectively. The curve is based on overnight index swap rates.
(b) February figure for 2018 Q1 is an average of realised overnight rates to 31 January 2018, and forward rates thereafter.
Table 5.B Forecast summary(a)(b)
Projections
2018 Q1 2019 Q1 2020 Q1 2021 Q1
GDP(c) 1.7 (1.5) 1.8 (1.7) 1.7 (1.7) 1.7
Excluding backcast 1.7 (1.5) 1.8 (1.7) 1.7 (1.7) 1.7
CPI inflation(d) 2.9 (2.6) 2.3 (2.3) 2.2 (2.2) 2.1
LFS unemployment rate 4.3 (4.2) 4.2 (4.2) 4.1 (4.2) 4.1
Bank Rate(e) 0.5 (0.5) 0.8 (0.8) 1.0 (0.9) 1.2
(a) Modal projections for GDP, CPI inflation and LFS unemployment. Figures in parentheses show the corresponding projections in the November 2017 Inflation Report. Projections were only available to 2020 Q4 in November.
(b) The February projections have been conditioned on the assumptions that the stock of purchased gilts remains at £435 billion and the stock of purchased corporate bonds remains at £10 billion throughout the forecast period, and on the Term Funding Scheme (TFS); all three of which are financed by the issuance of central bank reserves. The November projections were conditioned on the same asset purchase and TFS assumptions.
(c) Four‑quarter growth in real GDP. The MPC’s projections are based on its backcast for GDP.(d) Four‑quarter inflation rate.(e) Per cent. The path for Bank Rate implied by forward market interest rates. The curves are based on overnight
index swap rates.
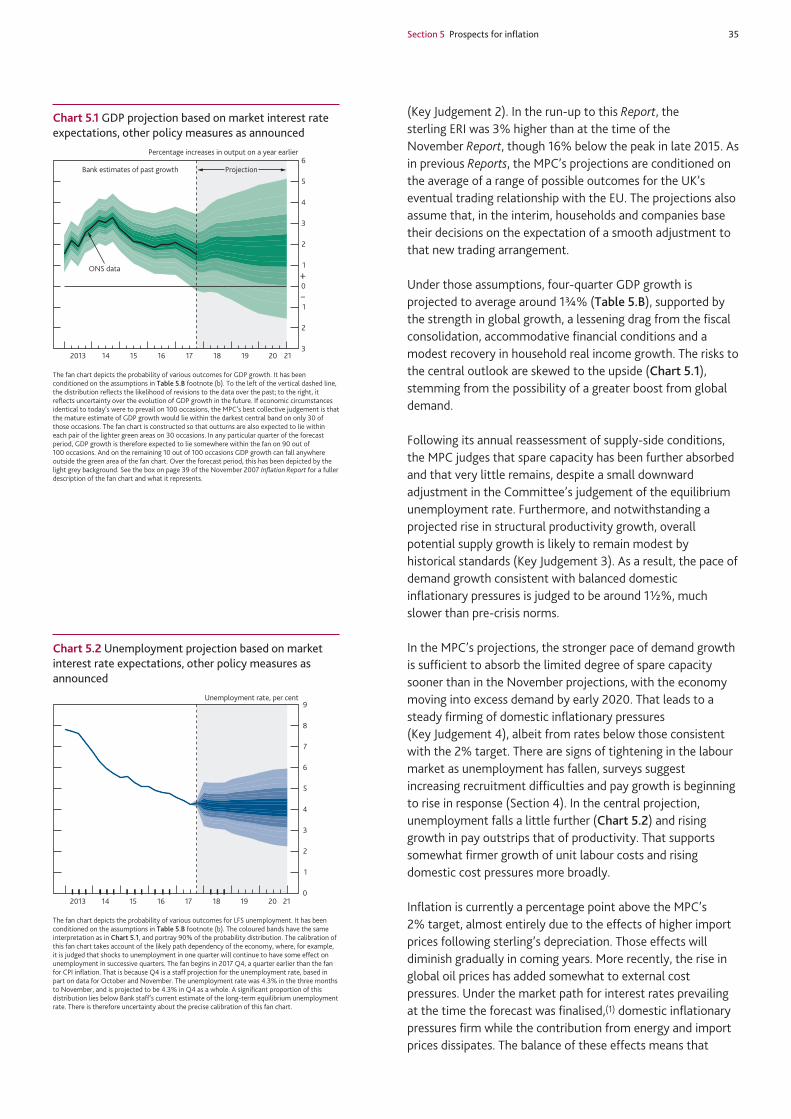
Section 5 Prospects for inflation 35
(Key Judgement 2). In the run‑up to this Report, the sterling ERI was 3% higher than at the time of the November Report, though 16% below the peak in late 2015. As in previous Reports, the MPC’s projections are conditioned on the average of a range of possible outcomes for the UK’s eventual trading relationship with the EU. The projections also assume that, in the interim, households and companies base their decisions on the expectation of a smooth adjustment to that new trading arrangement.
Under those assumptions, four‑quarter GDP growth is projected to average around 1¾% (Table 5.B), supported by the strength in global growth, a lessening drag from the fiscal consolidation, accommodative financial conditions and a modest recovery in household real income growth. The risks to the central outlook are skewed to the upside (Chart 5.1), stemming from the possibility of a greater boost from global demand.
Following its annual reassessment of supply‑side conditions, the MPC judges that spare capacity has been further absorbed and that very little remains, despite a small downward adjustment in the Committee’s judgement of the equilibrium unemployment rate. Furthermore, and notwithstanding a projected rise in structural productivity growth, overall potential supply growth is likely to remain modest by historical standards (Key Judgement 3). As a result, the pace of demand growth consistent with balanced domestic inflationary pressures is judged to be around 1½%, much slower than pre‑crisis norms.
In the MPC’s projections, the stronger pace of demand growth is sufficient to absorb the limited degree of spare capacity sooner than in the November projections, with the economy moving into excess demand by early 2020. That leads to a steady firming of domestic inflationary pressures (Key Judgement 4), albeit from rates below those consistent with the 2% target. There are signs of tightening in the labour market as unemployment has fallen, surveys suggest increasing recruitment difficulties and pay growth is beginning to rise in response (Section 4). In the central projection, unemployment falls a little further (Chart 5.2) and rising growth in pay outstrips that of productivity. That supports somewhat firmer growth of unit labour costs and rising domestic cost pressures more broadly.
Inflation is currently a percentage point above the MPC’s 2% target, almost entirely due to the effects of higher import prices following sterling’s depreciation. Those effects will diminish gradually in coming years. More recently, the rise in global oil prices has added somewhat to external cost pressures. Under the market path for interest rates prevailing at the time the forecast was finalised,(1) domestic inflationary pressures firm while the contribution from energy and import prices dissipates. The balance of these effects means that
+
–
3
2
1
0
1
2
3
4
5
6
2013 14 15 16 17 18 19 20 21
Percentage increases in output on a year earlier
ProjectionBank estimates of past growth
ONS data
Chart 5.1 GDP projection based on market interest rate expectations, other policy measures as announced
The fan chart depicts the probability of various outcomes for GDP growth. It has been conditioned on the assumptions in Table 5.B footnote (b). To the left of the vertical dashed line, the distribution reflects the likelihood of revisions to the data over the past; to the right, it reflects uncertainty over the evolution of GDP growth in the future. If economic circumstances identical to today’s were to prevail on 100 occasions, the MPC’s best collective judgement is that the mature estimate of GDP growth would lie within the darkest central band on only 30 of those occasions. The fan chart is constructed so that outturns are also expected to lie within each pair of the lighter green areas on 30 occasions. In any particular quarter of the forecast period, GDP growth is therefore expected to lie somewhere within the fan on 90 out of 100 occasions. And on the remaining 10 out of 100 occasions GDP growth can fall anywhere outside the green area of the fan chart. Over the forecast period, this has been depicted by the light grey background. See the box on page 39 of the November 2007 Inflation Report for a fuller description of the fan chart and what it represents.
0
1
2
3
4
5
6
7
8
9
2013 14 15 16 17 18 19 20 21
Unemployment rate, per cent
Chart 5.2 Unemployment projection based on market interest rate expectations, other policy measures as announced
The fan chart depicts the probability of various outcomes for LFS unemployment. It has been conditioned on the assumptions in Table 5.B footnote (b). The coloured bands have the same interpretation as in Chart 5.1, and portray 90% of the probability distribution. The calibration of this fan chart takes account of the likely path dependency of the economy, where, for example, it is judged that shocks to unemployment in one quarter will continue to have some effect on unemployment in successive quarters. The fan begins in 2017 Q4, a quarter earlier than the fan for CPI inflation. That is because Q4 is a staff projection for the unemployment rate, based in part on data for October and November. The unemployment rate was 4.3% in the three months to November, and is projected to be 4.3% in Q4 as a whole. A significant proportion of this distribution lies below Bank staff’s current estimate of the long‑term equilibrium unemployment rate. There is therefore uncertainty about the precise calibration of this fan chart.

36 Inflation Report February 2018
inflation falls gradually but remains above the target in the second and third years of the forecast period (Chart 5.3).
At its meeting ending on 7 February 2018, the MPC voted to maintain Bank Rate at 0.5%, to maintain the stock of sterling non‑financial investment‑grade corporate bond purchases, financed by the issuance of central bank reserves, at £10 billion and to maintain the stock of UK government bond purchases, financed by the issuance of central bank reserves, at £435 billion. The factors behind that decision are set out in the Monetary Policy Summary on pages i–ii of this Report, and in more detail in the Minutes of the meeting. The remainder of this section sets out the MPC’s projections, and the risks around them, in more detail.
5.1 The MPC’s key judgements and risks
Key Judgement 1: the broad‑based strength in global growth continuesGrowth has picked up significantly across many economies over the past two years. The outlook for global growth appears to have strengthened somewhat further over the past three months. The current pace of quarterly growth is judged likely to persist at least over 2018, a stronger projection than in November (Chart 5.5).
In the euro area, above‑trend growth has been supported by the accommodative stance of monetary policy, an easing in credit conditions, and reduced fiscal drag, alongside a steady rise in business and consumer confidence. Unemployment has fallen further, to its lowest level since 2009, though a significant degree of slack still appears to remain. These factors are projected to support continued above‑trend annual average growth in 2018 at around 2¾%, compared with a projection of 2¼% in November.
+
–
2
1
0
1
2
3
4
5
6
2013 14 15 16 17 18 19 20 21
Percentage increase in prices on a year earlier
Chart 5.3 CPI inflation projection based on market interest rate expectations, other policy measures as announced
Charts 5.3 and 5.4 depict the probability of various outcomes for CPI inflation in the future. They have been conditioned on the assumptions in Table 5.B footnote (b). If economic circumstances identical to today’s were to prevail on 100 occasions, the MPC’s best collective judgement is that inflation in any particular quarter would lie within the darkest central band on only 30 of those occasions. The fan charts are constructed so that outturns of inflation are also expected to lie within each pair of the lighter red areas on 30 occasions. In any particular quarter of the forecast period, inflation is therefore expected to lie somewhere within the fans on 90 out of 100 occasions. And on the remaining 10 out of 100 occasions inflation can fall anywhere outside the red area of the fan chart. Over the forecast period, this has been depicted by the light grey background. See the box on pages 48–49 of the May 2002 Inflation Report for a fuller description of the fan chart and what it represents.
2
1
0
1
2
3
4
5
6Percentage increase in prices on a year earlier
2013 14 15 16 17 18 19 20 21
+
–
Chart 5.4 CPI inflation projection in November based on market interest rate expectations, other policy measures as announced
+
–1
0
1
2
3
4
5
6
1998 2001 04 07 10 13 16 19
Projection at the time of the November Report
Projection consistent with MPC key judgements in February Percentage change on previous year
Chart 5.5 World GDP (PPP‑weighted)(a)
Sources: IMF World Economic Outlook and Bank calculations.
(a) Annual average growth rates. Chained‑volume measure. Constructed using real GDP growth rates of 181 countries weighted according to their shares in world GDP using the IMF’s purchasing power parity (PPP) weights.
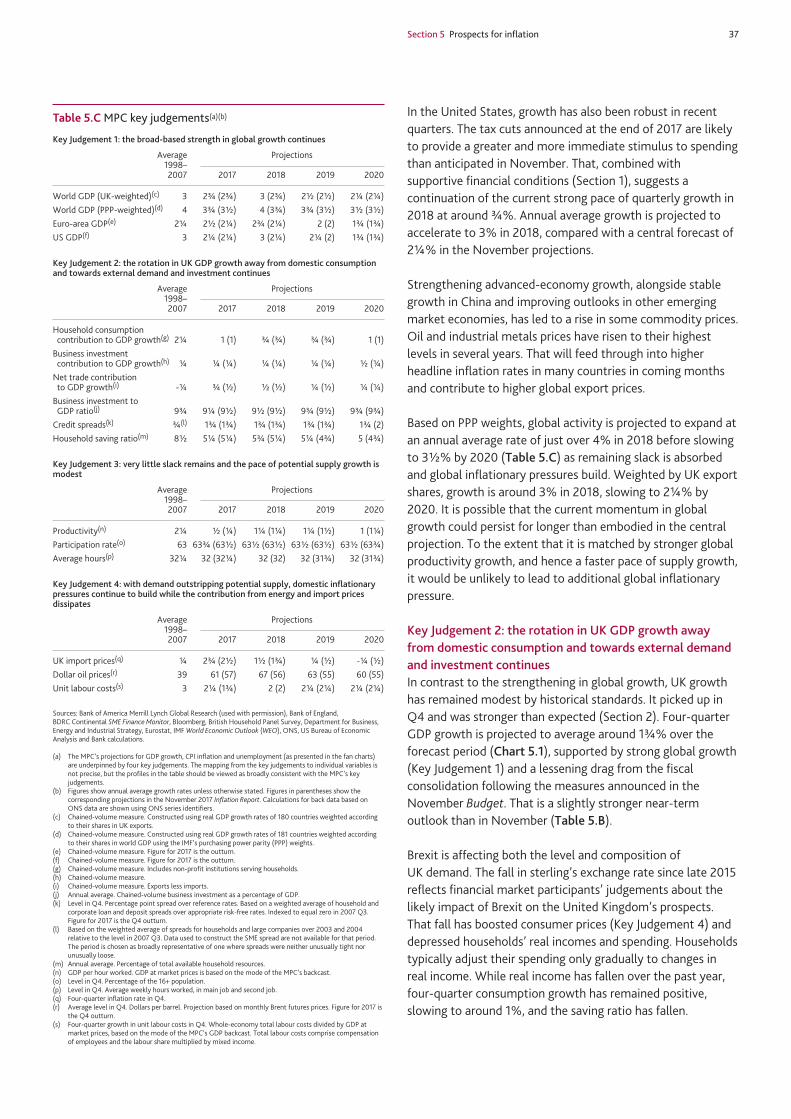
Section 5 Prospects for inflation 37
In the United States, growth has also been robust in recent quarters. The tax cuts announced at the end of 2017 are likely to provide a greater and more immediate stimulus to spending than anticipated in November. That, combined with supportive financial conditions (Section 1), suggests a continuation of the current strong pace of quarterly growth in 2018 at around ¾%. Annual average growth is projected to accelerate to 3% in 2018, compared with a central forecast of 2¼% in the November projections.
Strengthening advanced‑economy growth, alongside stable growth in China and improving outlooks in other emerging market economies, has led to a rise in some commodity prices. Oil and industrial metals prices have risen to their highest levels in several years. That will feed through into higher headline inflation rates in many countries in coming months and contribute to higher global export prices.
Based on PPP weights, global activity is projected to expand at an annual average rate of just over 4% in 2018 before slowing to 3½% by 2020 (Table 5.C) as remaining slack is absorbed and global inflationary pressures build. Weighted by UK export shares, growth is around 3% in 2018, slowing to 2¼% by 2020. It is possible that the current momentum in global growth could persist for longer than embodied in the central projection. To the extent that it is matched by stronger global productivity growth, and hence a faster pace of supply growth, it would be unlikely to lead to additional global inflationary pressure.
Key Judgement 2: the rotation in UK GDP growth away from domestic consumption and towards external demand and investment continuesIn contrast to the strengthening in global growth, UK growth has remained modest by historical standards. It picked up in Q4 and was stronger than expected (Section 2). Four‑quarter GDP growth is projected to average around 1¾% over the forecast period (Chart 5.1), supported by strong global growth (Key Judgement 1) and a lessening drag from the fiscal consolidation following the measures announced in the November Budget. That is a slightly stronger near‑term outlook than in November (Table 5.B).
Brexit is affecting both the level and composition of UK demand. The fall in sterling’s exchange rate since late 2015 reflects financial market participants’ judgements about the likely impact of Brexit on the United Kingdom’s prospects. That fall has boosted consumer prices (Key Judgement 4) and depressed households’ real incomes and spending. Households typically adjust their spending only gradually to changes in real income. While real income has fallen over the past year, four‑quarter consumption growth has remained positive, slowing to around 1%, and the saving ratio has fallen.
Table 5.C MPC key judgements(a)(b)
Key Judgement 1: the broad‑based strength in global growth continues
Average Projections 1998– 2007 2017 2018 2019 2020
World GDP (UK‑weighted)(c) 3 2¾ (2¾) 3 (2¾) 2½ (2½) 2¼ (2¼)World GDP (PPP‑weighted)(d) 4 3¾ (3½) 4 (3¾) 3¾ (3½) 3½ (3½)Euro‑area GDP(e) 2¼ 2½ (2¼) 2¾ (2¼) 2 (2) 1¾ (1¾)US GDP(f) 3 2¼ (2¼) 3 (2¼) 2¼ (2) 1¾ (1¾)
Key Judgement 2: the rotation in UK GDP growth away from domestic consumption and towards external demand and investment continues
Average Projections 1998– 2007 2017 2018 2019 2020
Household consumption contribution to GDP growth(g) 2¼ 1 (1) ¾ (¾) ¾ (¾) 1 (1)Business investment contribution to GDP growth(h) ¼ ¼ (¼) ¼ (¼) ¼ (¼) ½ (¼)Net trade contribution to GDP growth(i) ‑¼ ¾ (½) ½ (½) ¼ (½) ¼ (¼)Business investment to GDP ratio(j) 9¾ 9¼ (9½) 9½ (9½) 9¾ (9½) 9¾ (9¾)Credit spreads(k) ¾(l) 1¾ (1¾) 1¾ (1¾) 1¾ (1¾) 1¾ (2)Household saving ratio(m) 8½ 5¼ (5¼) 5¾ (5¼) 5¼ (4¾) 5 (4¾)
Key Judgement 3: very little slack remains and the pace of potential supply growth is modest
Average Projections 1998– 2007 2017 2018 2019 2020
Productivity(n) 2¼ ½ (¼) 1¼ (1¼) 1¼ (1½) 1 (1¼)Participation rate(o) 63 63¾ (63½) 63½ (63½) 63½ (63½) 63½ (63¾)Average hours(p) 32¼ 32 (32¼) 32 (32) 32 (31¾) 32 (31¾)
Key Judgement 4: with demand outstripping potential supply, domestic inflationary pressures continue to build while the contribution from energy and import prices dissipates
Average Projections 1998– 2007 2017 2018 2019 2020
UK import prices(q) ¼ 2¾ (2½) 1½ (1¾) ¼ (½) ‑¼ (½)Dollar oil prices(r) 39 61 (57) 67 (56) 63 (55) 60 (55)Unit labour costs(s) 3 2¼ (1¾) 2 (2) 2¼ (2¼) 2¼ (2¼)
Sources: Bank of America Merrill Lynch Global Research (used with permission), Bank of England, BDRC Continental SME Finance Monitor, Bloomberg, British Household Panel Survey, Department for Business, Energy and Industrial Strategy, Eurostat, IMF World Economic Outlook (WEO), ONS, US Bureau of Economic Analysis and Bank calculations.
(a) The MPC’s projections for GDP growth, CPI inflation and unemployment (as presented in the fan charts) are underpinned by four key judgements. The mapping from the key judgements to individual variables is not precise, but the profiles in the table should be viewed as broadly consistent with the MPC’s key judgements.
(b) Figures show annual average growth rates unless otherwise stated. Figures in parentheses show the corresponding projections in the November 2017 Inflation Report. Calculations for back data based on ONS data are shown using ONS series identifiers.
(c) Chained‑volume measure. Constructed using real GDP growth rates of 180 countries weighted according to their shares in UK exports.
(d) Chained‑volume measure. Constructed using real GDP growth rates of 181 countries weighted according to their shares in world GDP using the IMF’s purchasing power parity (PPP) weights.
(e) Chained‑volume measure. Figure for 2017 is the outturn.(f) Chained‑volume measure. Figure for 2017 is the outturn.(g) Chained‑volume measure. Includes non‑profit institutions serving households.(h) Chained‑volume measure.(i) Chained‑volume measure. Exports less imports.(j) Annual average. Chained‑volume business investment as a percentage of GDP.(k) Level in Q4. Percentage point spread over reference rates. Based on a weighted average of household and
corporate loan and deposit spreads over appropriate risk‑free rates. Indexed to equal zero in 2007 Q3. Figure for 2017 is the Q4 outturn.
(l) Based on the weighted average of spreads for households and large companies over 2003 and 2004 relative to the level in 2007 Q3. Data used to construct the SME spread are not available for that period. The period is chosen as broadly representative of one where spreads were neither unusually tight nor unusually loose.
(m) Annual average. Percentage of total available household resources.(n) GDP per hour worked. GDP at market prices is based on the mode of the MPC’s backcast.(o) Level in Q4. Percentage of the 16+ population.(p) Level in Q4. Average weekly hours worked, in main job and second job.(q) Four‑quarter inflation rate in Q4.(r) Average level in Q4. Dollars per barrel. Projection based on monthly Brent futures prices. Figure for 2017 is
the Q4 outturn.(s) Four‑quarter growth in unit labour costs in Q4. Whole‑economy total labour costs divided by GDP at
market prices, based on the mode of the MPC’s GDP backcast. Total labour costs comprise compensation of employees and the labour share multiplied by mixed income.
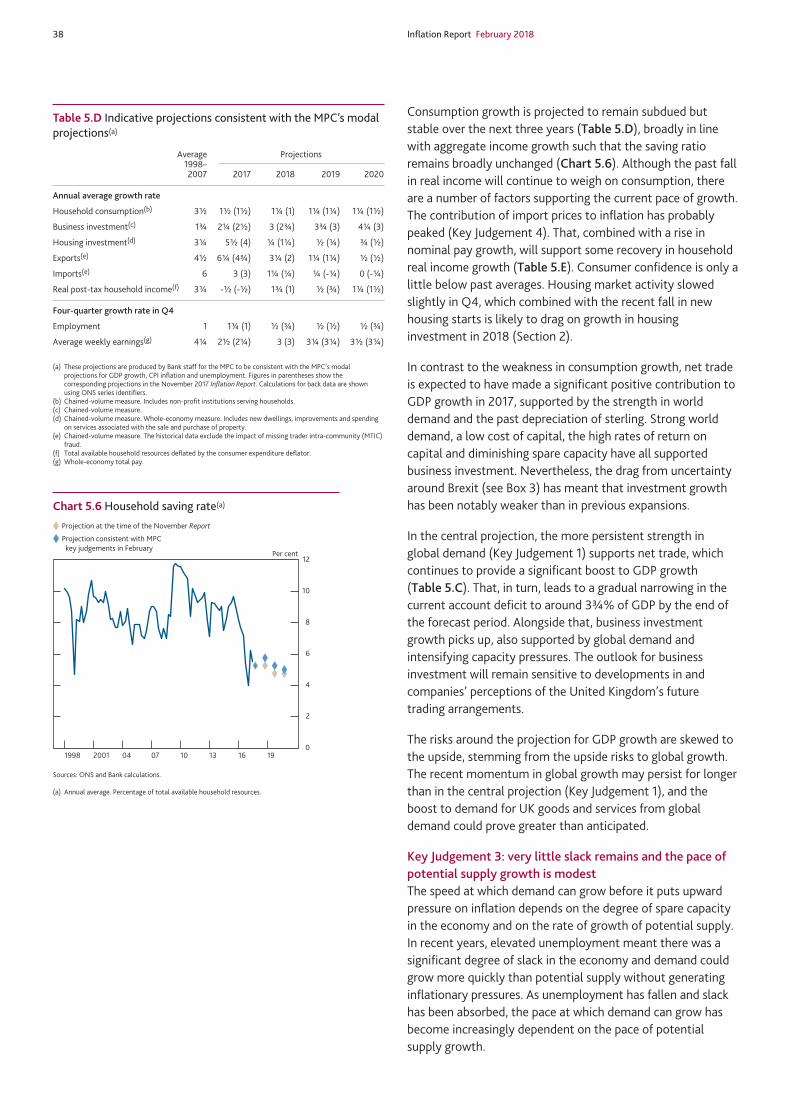
38 Inflation Report February 2018
Consumption growth is projected to remain subdued but stable over the next three years (Table 5.D), broadly in line with aggregate income growth such that the saving ratio remains broadly unchanged (Chart 5.6). Although the past fall in real income will continue to weigh on consumption, there are a number of factors supporting the current pace of growth. The contribution of import prices to inflation has probably peaked (Key Judgement 4). That, combined with a rise in nominal pay growth, will support some recovery in household real income growth (Table 5.E). Consumer confidence is only a little below past averages. Housing market activity slowed slightly in Q4, which combined with the recent fall in new housing starts is likely to drag on growth in housing investment in 2018 (Section 2).
In contrast to the weakness in consumption growth, net trade is expected to have made a significant positive contribution to GDP growth in 2017, supported by the strength in world demand and the past depreciation of sterling. Strong world demand, a low cost of capital, the high rates of return on capital and diminishing spare capacity have all supported business investment. Nevertheless, the drag from uncertainty around Brexit (see Box 3) has meant that investment growth has been notably weaker than in previous expansions.
In the central projection, the more persistent strength in global demand (Key Judgement 1) supports net trade, which continues to provide a significant boost to GDP growth (Table 5.C). That, in turn, leads to a gradual narrowing in the current account deficit to around 3¾% of GDP by the end of the forecast period. Alongside that, business investment growth picks up, also supported by global demand and intensifying capacity pressures. The outlook for business investment will remain sensitive to developments in and companies’ perceptions of the United Kingdom’s future trading arrangements.
The risks around the projection for GDP growth are skewed to the upside, stemming from the upside risks to global growth. The recent momentum in global growth may persist for longer than in the central projection (Key Judgement 1), and the boost to demand for UK goods and services from global demand could prove greater than anticipated.
Key Judgement 3: very little slack remains and the pace of potential supply growth is modestThe speed at which demand can grow before it puts upward pressure on inflation depends on the degree of spare capacity in the economy and on the rate of growth of potential supply. In recent years, elevated unemployment meant there was a significant degree of slack in the economy and demand could grow more quickly than potential supply without generating inflationary pressures. As unemployment has fallen and slack has been absorbed, the pace at which demand can grow has become increasingly dependent on the pace of potential supply growth.
Table 5.D Indicative projections consistent with the MPC’s modal projections(a)
Average Projections 1998– 2007 2017 2018 2019 2020
Annual average growth rate
Household consumption(b) 3½ 1½ (1½) 1¼ (1) 1¼ (1¼) 1¼ (1½)
Business investment(c) 1¾ 2¼ (2½) 3 (2¾) 3¾ (3) 4¼ (3)
Housing investment(d) 3¼ 5½ (4) ¼ (1¼) ½ (¼) ¾ (½)
Exports(e) 4½ 6¼ (4¾) 3¼ (2) 1¼ (1¼) ½ (½)
Imports(e) 6 3 (3) 1¼ (¼) ¼ (‑¼) 0 (‑¼)
Real post‑tax household income(f) 3¼ ‑½ (‑½) 1¾ (1) ½ (¾) 1¼ (1½)
Four‑quarter growth rate in Q4
Employment 1 1¼ (1) ½ (¾) ½ (½) ½ (¾)
Average weekly earnings(g) 4¼ 2½ (2¼) 3 (3) 3¼ (3¼) 3½ (3¼)
(a) These projections are produced by Bank staff for the MPC to be consistent with the MPC’s modal projections for GDP growth, CPI inflation and unemployment. Figures in parentheses show the corresponding projections in the November 2017 Inflation Report. Calculations for back data are shown using ONS series identifiers.
(b) Chained‑volume measure. Includes non‑profit institutions serving households.(c) Chained‑volume measure.(d) Chained‑volume measure. Whole‑economy measure. Includes new dwellings, improvements and spending
on services associated with the sale and purchase of property.(e) Chained‑volume measure. The historical data exclude the impact of missing trader intra‑community (MTIC)
fraud.(f) Total available household resources deflated by the consumer expenditure deflator.(g) Whole‑economy total pay.
0
2
4
6
8
10
12Per cent
Projection at the time of the November Report
Projection consistent with MPC key judgements in February
1998 2001 04 07 10 13 16 19
Chart 5.6 Household saving rate(a)
Sources: ONS and Bank calculations.
(a) Annual average. Percentage of total available household resources.
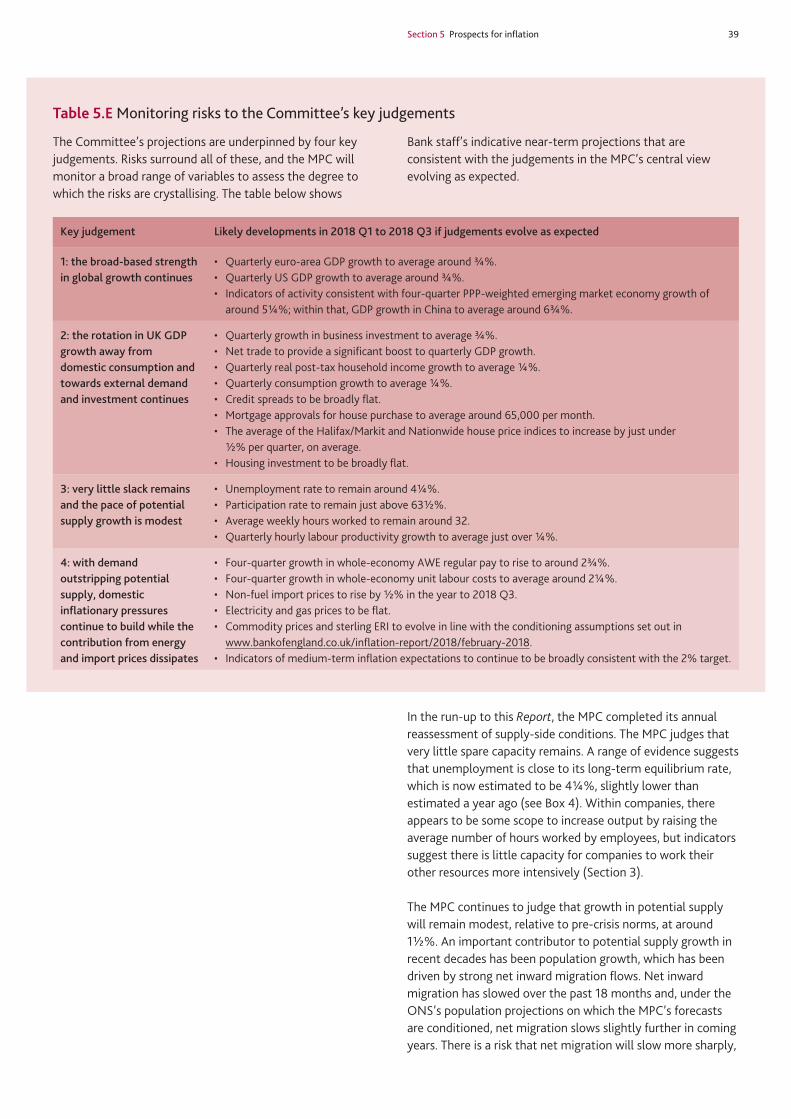
Section 5 Prospects for inflation 39
In the run‑up to this Report, the MPC completed its annual reassessment of supply‑side conditions. The MPC judges that very little spare capacity remains. A range of evidence suggests that unemployment is close to its long‑term equilibrium rate, which is now estimated to be 4¼%, slightly lower than estimated a year ago (see Box 4). Within companies, there appears to be some scope to increase output by raising the average number of hours worked by employees, but indicators suggest there is little capacity for companies to work their other resources more intensively (Section 3).
The MPC continues to judge that growth in potential supply will remain modest, relative to pre‑crisis norms, at around 1½%. An important contributor to potential supply growth in recent decades has been population growth, which has been driven by strong net inward migration flows. Net inward migration has slowed over the past 18 months and, under the ONS’s population projections on which the MPC’s forecasts are conditioned, net migration slows slightly further in coming years. There is a risk that net migration will slow more sharply,
Table 5.E Monitoring risks to the Committee’s key judgements
The Committee’s projections are underpinned by four key judgements. Risks surround all of these, and the MPC will monitor a broad range of variables to assess the degree to which the risks are crystallising. The table below shows
Bank staff’s indicative near‑term projections that are consistent with the judgements in the MPC’s central view evolving as expected.
Key judgement Likely developments in 2018 Q1 to 2018 Q3 if judgements evolve as expected
1: the broad‑based strength in global growth continues
• Quarterlyeuro‑areaGDPgrowthtoaveragearound¾%.• QuarterlyUSGDPgrowthtoaveragearound¾%.• Indicatorsofactivityconsistentwithfour‑quarterPPP‑weightedemergingmarketeconomygrowthof
around 5¼%; within that, GDP growth in China to average around 6¾%.
2: the rotation in UK GDP growth away from domestic consumption and towards external demand and investment continues
• Quarterlygrowthinbusinessinvestmenttoaverage¾%.• NettradetoprovideasignificantboosttoquarterlyGDPgrowth.• Quarterlyrealpost‑taxhouseholdincomegrowthtoaverage¼%.• Quarterlyconsumptiongrowthtoaverage¼%.• Creditspreadstobebroadlyflat.• Mortgageapprovalsforhousepurchasetoaveragearound65,000permonth.• TheaverageoftheHalifax/MarkitandNationwidehousepriceindicestoincreasebyjustunder
½% per quarter, on average.• Housinginvestmenttobebroadlyflat.
3: very little slack remains and the pace of potential supply growth is modest
• Unemploymentratetoremainaround4¼%.• Participationratetoremainjustabove63½%.• Averageweeklyhoursworkedtoremainaround32.• Quarterlyhourlylabourproductivitygrowthtoaveragejustover¼%.
4: with demand outstripping potential supply, domestic inflationary pressures continue to build while the contribution from energy and import prices dissipates
• Four‑quartergrowthinwhole‑economyAWEregularpaytorisetoaround2¾%.• Four‑quartergrowthinwhole‑economyunitlabourcoststoaveragearound2¼%.• Non‑fuelimportpricestoriseby½%intheyearto2018Q3.• Electricityandgaspricestobeflat.• CommoditypricesandsterlingERItoevolveinlinewiththeconditioningassumptionssetoutin
www.bankofengland.co.uk/inflation‑report/2018/february‑2018.• Indicatorsofmedium‑terminflationexpectationstocontinuetobebroadlyconsistentwiththe2%target.

40 Inflation Report February 2018
however, reducing potential supply growth more materially (see Box 5).
Prior to the financial crisis, productivity growth was the largest driver of potential supply growth. In common with many other advanced economies, productivity growth in the UK has been persistently weak in recent years. Part of that global weakness is likely to reflect weak investment, which fell during the crisis and has only recovered gradually since then. As such, growth in the capital stock — the resources and equipment available for workers to produce output and a key driver of productivity — has been subdued. The weakness in productivity growth also appears to reflect weak growth in total factor productivity (TFP) — the efficiency with which companies use their labour and capital to produce output. The expansion in global trade and broadening of supply chains in the decade prior to the crisis is likely to have been one factor contributing to robust TFP growth during that period. Since then, growth in global trade and TFP have both been subdued.
Structural productivity growth is projected to pick up to just over 1% in 2019–20, broadly unchanged from the November projections. While that represents a pickup from the pace of productivity growth since the financial crisis, it is still around half the pre‑crisis rate. Companies’ anticipation of and response to post‑Brexit trading relationships are likely to weigh on UK productivity growth. Uncertainty around Brexit appears to be holding back some investment (see Box 3) and any reduction in openness is also likely to weigh on TFP growth (Section 3). As explained in Box 6, although there has been little change to the MPC’s judgement about the outlook for structural productivity growth, the profile for actual output per hour worked is lower than in the November projections (Table 5.C). Limited scope for companies to work their capital more intensively (Section 3) means output per hour worked now grows broadly in line with structural productivity.
There are significant risks in both directions to the outlook for productivity. Productivity growth has serially disappointed over the past decade and, in common with other forecasters, the MPC has marked down its forecasts numerous times. As such, it could fail to pick up by even the modest amounts assumed. Set against that, productivity, although volatile, has tended to grow by around 2% on average for many decades. Productivity could ultimately pick up by more than expected, particularly if there is a global upswing in trade and investment that benefits the United Kingdom.
Key Judgement 4: with demand outstripping potential supply, domestic inflationary pressures continue to build while the contribution from energy and import prices dissipatesAt 3% in December, inflation remains above the MPC’s 2% target, and the 3.1% outturn in November necessitated an exchange of letters between the Governor and the Chancellor,

Section 5 Prospects for inflation 41
published alongside this Report. That overshoot was almost entirely due to the effects of higher import prices as a result of the past depreciation in sterling, though the recent rise in oil prices has also contributed. And it is possible that inflation could rise back above 3% temporarily.
Increases in global oil prices (Key Judgement 1) tend to be passed on to higher fuel prices quite quickly. The MPC’s projections are conditioned on spot oil prices following the market futures curve, which is currently downward sloping (Table 5.C). The implied easing back in oil prices means that energy prices are weighing on inflation from the end of 2018.
The rise in non‑energy import prices due to the depreciation in sterling will take several years to be passed on to consumer prices. Import prices have so far risen by slightly less than anticipated, given past experience (Section 4). Over the forecast period, import prices are assumed to make up that shortfall (Chart 5.7). Although the contribution from import prices to CPI inflation is likely to have peaked, import prices are projected to continue to push up inflation by around ½ percentage point over 2019 before that contribution diminishes further. Import prices are still pushing up inflation at the end of the three‑year forecast period, but the recent appreciation of sterling means they contribute slightly less than projected in November, at just under ¼ percentage point.
+
–
10
5
0
5
10
15
20Percentage change on a year earlier
1998 2001 04 07 10 13 16 19
Projection at the time of the November Report
Projection consistent with MPC key judgements in February
Chart 5.7 Import price inflation(a)
Sources: ONS and Bank calculations.
(a) Projections are four‑quarter inflation rate in Q4. Excludes the impact of MTIC fraud.
Box 6Revisions to the MPC’s productivity projections
Following the MPC’s annual reassessment of supply‑side conditions, potential supply growth over the forecast period is judged to be around 1½%, the same as in the November projections. Within that, the outlook for structural productivity growth is also broadly unchanged. But changes in the composition of spare capacity in the economy mean the MPC’s projections for measured productivity — output per hour worked — have been revised down relative to November (Table 5.C). As explained in this box, that revision does not affect the outlook for trend growth over the forecast.
Structural labour productivity growth is a fundamental driver of potential supply growth in the economy and, hence, the pace of demand growth consistent with balanced inflationary pressures. It is determined by factors such as the availability of physical capital like buildings and IT equipment, and human capital like experience and education. Measured productivity — actual output per hour worked — can, however, temporarily deviate from its structural level for cyclical reasons. For example, if firms are underutilising their capital due to previous weakness in demand then there is scope for output to grow without an increase in the number of hours employees
work. As demand recovers and firms use up that spare capacity, output per hour will grow even if structural productivity is unchanged. Output per hour worked could also rise above structural productivity if firms experience a temporary boost in demand for the goods and services they produce that leads them to operate above normal capacity levels, which would tend to lead to inflationary pressure.
In the November Report, growth in measured productivity — output per hour worked — was projected to rise to just over 1¼% over the forecast period (Table 5.C). Companies were judged to have some scope to increase their capital utilisation and around ¼ percentage point of the projected rise in productivity growth reflected companies using up that spare capacity. The rest of the pickup in productivity growth reflected a rise in structural productivity.
In this Report, the MPC has reassessed its view of the composition of slack remaining in the economy. With almost no spare capacity judged to be remaining in companies’ capital utilisation, output per hour worked is projected to grow broadly in line with structural productivity. As explained in Key Judgement 3, the outlook for structural productivity growth is broadly unchanged from the November projections and embodies a rise to just over 1% over the forecast period (Table 5.C).
Table 5.F Q4 CPI inflation Mode Median Mean
2018 Q4 2.4 (2.4) 2.4 (2.4) 2.4 (2.4)
2019 Q4 2.2 (2.2) 2.2 (2.2) 2.2 (2.2)2020 Q4 2.1 (2.1) 2.1 (2.1) 2.1 (2.1)
The table shows projections for Q4 four‑quarter CPI inflation. The figures in parentheses show the corresponding projections in the November 2017 Inflation Report. The projections have been conditioned on the assumptions in Table 5.B footnote (b).

42 Inflation Report February 2018
There is a risk, however, that the contribution from import prices to inflation diminishes more rapidly than in the central projection. The more time that passes since the depreciation, the less likely it is that the shortfall in import prices relative to the size of the depreciation will be made up, and the greater the risk that import prices contribute slightly less to inflation over the forecast period.
As the effects from import and energy prices dissipate, inflation is supported by rising domestic inflationary pressures. The largest domestic component of companies’ costs is labour. Although annual pay growth has been relatively subdued in recent years, it picked up by more than expected towards the end of 2017 and shorter‑term measures suggest a further marked rise in annual pay growth in 2018 Q1 (Section 4). Indicators, including the recent Agents’ annual pay survey, suggest pay growth is rising in response to the past tightening in the labour market and greater recruitment difficulties. The outlook for pay growth is stronger than in November (Table 5.D).
What matters for companies’ costs is how fast pay grows relative to productivity — in other words, growth in their unit labour costs (ULCs). As productivity growth has been weak, unit labour cost growth has been much less subdued than pay growth. In the central projection, with unemployment falling slightly further (Chart 5.2), pay growth picks up, continuing to outstrip rising productivity growth (Key Judgement 3), and supporting somewhat firmer ULC growth (Table 5.C). There is a risk, however, that building pressure in the labour market leads to a more marked rise in pay and ULC growth over the forecast period.
The stronger outlook for demand growth (Key Judgement 2) coupled with modest potential supply growth (Key Judgement 3), means that the limited remaining degree of spare capacity in the economy is absorbed more quickly than in the November projections. In the central projection, under a conditioning path that embodies just under three further 25 basis point rises in Bank Rate over the next three years, a small margin of excess demand emerges by early 2020 and builds thereafter. Domestic inflationary pressures firm while the contribution from energy and import prices dissipates, and inflation remains above the target in the second and third years of the forecast period (Table 5.F).
5.2 The projections for demand, unemployment and inflation
Based on the judgements above and the risks around them, under the market path for Bank Rate and the assumption of an unchanged stock of purchased assets, the MPC projects four‑quarter GDP growth to average around 1¾% over the next three years (Table 5.B). That projection is slightly
+– 0
1
2
3
4
2.0 1.0 0.0 1.0 2.0 3.0 4.0 5.0 6.0
Probability density, per cent(b)
FebruaryNovember
Chart 5.8 Projected probabilities of GDP growth in 2019 Q1 (central 90% of the distribution)(a)
(a) Chart 5.8 represents the cross‑section of the GDP growth fan chart in 2019 Q1 for the market interest rate projection. The grey outline represents the corresponding cross‑section of the November 2017 Inflation Report fan chart for the market interest rate projection. The projections have been conditioned on the assumptions in Table 5.B footnote (b). The coloured bands in Chart 5.8 have a similar interpretation to those on the fan charts. Like the fan charts, they portray the central 90% of the probability distribution.
(b) Average probability within each band; the figures on the y‑axis indicate the probability of growth being within ±0.05 percentage points of any given growth rate, specified to one decimal place.
0
10
20
30
40
50
60
70
80
90
100 0
10
20
30
40
50
60
70
80
90
100
2018 19 20 21
Probability of inflation at or belowthe target, inverted (per cent)
Probability of inflationabove the target (per cent)
Q1 Q2 Q3 Q4 Q1 Q2 Q3 Q4 Q1 Q2 Q3 Q4 Q1
FebruaryNovember
Chart 5.9 Inflation probabilities relative to the target
The February and November swathes in this chart are derived from the same distributions as Charts 5.3 and 5.4 respectively. They indicate the assessed probability of inflation relative to the target in each quarter of the forecast period. The 5 percentage points width of the swathes reflects the fact that there is uncertainty about the precise probability in any given quarter, but they should not be interpreted as confidence intervals.
Table 5.G Annual average GDP growth rates of modal, median and mean paths(a)
Mode Median Mean
2018 1.8 (1.6) 1.8 (1.6) 1.8 (1.6)
2019 1.7 (1.7) 1.8 (1.7) 1.8 (1.7)2020 1.7 (1.7) 1.7 (1.7) 1.8 (1.7)
(a) The table shows the projections for annual average GDP growth rates of modal, median and mean projections for four‑quarter growth of real GDP implied by the fan chart. Where growth rates depend in part on the MPC’s backcast, revisions to quarterly growth are assumed to be independent of the revisions to previous quarters. The figures in parentheses show the corresponding projections in the November 2017 Inflation Report. The projections have been conditioned on the assumptions in Table 5.B footnote (b).
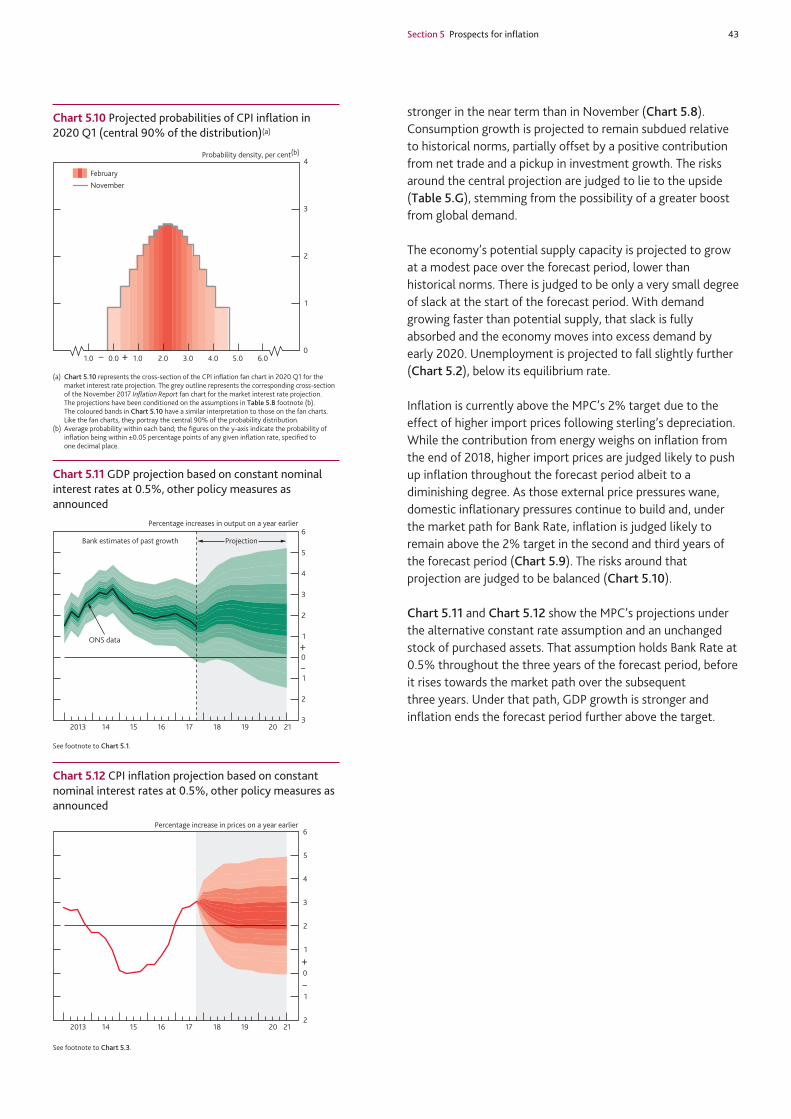
Section 5 Prospects for inflation 43
stronger in the near term than in November (Chart 5.8). Consumption growth is projected to remain subdued relative to historical norms, partially offset by a positive contribution from net trade and a pickup in investment growth. The risks around the central projection are judged to lie to the upside (Table 5.G), stemming from the possibility of a greater boost from global demand.
The economy’s potential supply capacity is projected to grow at a modest pace over the forecast period, lower than historical norms. There is judged to be only a very small degree of slack at the start of the forecast period. With demand growing faster than potential supply, that slack is fully absorbed and the economy moves into excess demand by early 2020. Unemployment is projected to fall slightly further (Chart 5.2), below its equilibrium rate.
Inflation is currently above the MPC’s 2% target due to the effect of higher import prices following sterling’s depreciation. While the contribution from energy weighs on inflation from the end of 2018, higher import prices are judged likely to push up inflation throughout the forecast period albeit to a diminishing degree. As those external price pressures wane, domestic inflationary pressures continue to build and, under the market path for Bank Rate, inflation is judged likely to remain above the 2% target in the second and third years of the forecast period (Chart 5.9). The risks around that projection are judged to be balanced (Chart 5.10).
Chart 5.11 and Chart 5.12 show the MPC’s projections under the alternative constant rate assumption and an unchanged stock of purchased assets. That assumption holds Bank Rate at 0.5% throughout the three years of the forecast period, before it rises towards the market path over the subsequent three years. Under that path, GDP growth is stronger and inflation ends the forecast period further above the target.
0
1
2
3
4
1.0 0.0 1.0 2.0 3.0 4.0 5.0 6.0
Probability density, per cent(b)
– +
FebruaryNovember
Chart 5.10 Projected probabilities of CPI inflation in 2020 Q1 (central 90% of the distribution)(a)
(a) Chart 5.10 represents the cross‑section of the CPI inflation fan chart in 2020 Q1 for the market interest rate projection. The grey outline represents the corresponding cross‑section of the November 2017 Inflation Report fan chart for the market interest rate projection. The projections have been conditioned on the assumptions in Table 5.B footnote (b). The coloured bands in Chart 5.10 have a similar interpretation to those on the fan charts. Like the fan charts, they portray the central 90% of the probability distribution.
(b) Average probability within each band; the figures on the y‑axis indicate the probability of inflation being within ±0.05 percentage points of any given inflation rate, specified to one decimal place.
+
–
3
2
1
0
1
2
3
4
5
6Percentage increases in output on a year earlier
ProjectionBank estimates of past growth
ONS data
2013 14 15 16 17 18 19 20 21
Chart 5.11 GDP projection based on constant nominal interest rates at 0.5%, other policy measures as announced
See footnote to Chart 5.1.
+
–
2
1
0
1
2
3
4
5
6
2013 14 15 16 17 18 19 20 21
Percentage increase in prices on a year earlier
Chart 5.12 CPI inflation projection based on constant nominal interest rates at 0.5%, other policy measures as announced
See footnote to Chart 5.3.

44 Inflation Report February 2018
Box 7Other forecasters’ expectations
This box reports the results of the Bank’s most recent survey of external forecasters, carried out in January.(1) On average, respondents expected four‑quarter GDP growth to slow a little further over the coming year, before picking up to 1¾% in three years’ time (Table 1). Relative to expectations three months ago, that average GDP growth forecast was broadly unchanged at the one and two‑year horizons but weaker further ahead (Chart A). External forecasters, on average, continued to expect a small rise in unemployment, but to a lower level than three months ago.
External forecasters’ central expectations for CPI inflation at the one and two‑year horizons were, on average, lower than three months ago. On average, external forecasters placed around a 50% probability on inflation being at or above the
2% target in two years’ time, lower than the 60% average probability placed on that outcome three months ago (Chart B).
External forecasters, on average, expected somewhat less monetary stimulus over the next three years than they did at the time of the November Report, broadly consistent with the steepening of the market‑implied path for Bank Rate (Chart C). As in November, almost all forecasters expected the current stock of gilt and corporate bond purchases to remain unchanged over the next three years.
(1) For detailed distributions, see ‘Other forecasters’ expectations’.
Table 1 Averages of other forecasters’ central projections(a)
2019 Q1 2020 Q1 2021 Q1
CPI inflation(b) 2.2 2.0 2.0
GDP growth(c) 1.4 1.5 1.7
LFS unemployment rate 4.5 4.6 4.8
Bank Rate (per cent) 0.7 1.0 1.2
Stock of purchased gilts (£ billions)(d) 435 435 430
Stock of purchased corporate bonds (£ billions)(d) 10 10 10
Sterling ERI 76.5 75.6 75.7
Source: Projections of outside forecasters as of 29 January 2018.
(a) For 2019 Q1, there were 23 forecasts for CPI inflation, 23 for GDP growth, 19 for the unemployment rate, 21 for Bank Rate, 15 for the stock of gilt purchases, 12 for the stock of corporate bond purchases and 13 for the sterling ERI. For 2020 Q1, there were 18 forecasts for CPI inflation, 17 for GDP growth, 15 for the unemployment rate, 19 for Bank Rate, 14 for the stock of gilt purchases, 11 for the stock of corporate bond purchases and 10 for the sterling ERI. For 2021 Q1, there were 16 forecasts for CPI inflation, 16 for GDP growth, 13 for the unemployment rate, 17 for Bank Rate, 13 for the stock of gilt purchases, 10 for the stock of corporate bond purchases and 10 for the sterling ERI.
(b) Twelve‑month rate.(c) Four‑quarter percentage change.(d) Original purchase value. Purchased via the creation of central bank reserves.
+
–0.5
0.0
0.5
1.0
1.5
2.0
2.5
3.0
2008 10 12 14 16 18
Per cent
Three years ahead
One year ahead
Chart A Expectations of GDP growth three years ahead have declinedAverage of forecasters’ central projections for four‑quarter GDP growth
Sources: Projections of outside forecasters provided for Inflation Reports between February 2008 and February 2018.
0
5
10
15
20
25
30
35
40
<1.0% 1.0% to1.5%
1.5% to2.0%
2.0% to2.5%
2.5% to3.0%
≥3.0%
Probability, per cent
February Report
November Report
Chart B Risks to inflation are now judged to be broadly balanced around 2%Average of forecasters’ probability distributions for CPI inflation in two years’ time(a)
Sources: Projections of outside forecasters provided for Inflation Reports in November 2017 and February 2018.
(a) Projections on the boundary of these ranges are included in the upper range, for example a projection of inflation being 2.0% is in the 2.0% to 2.5% range.
0.0
0.2
0.4
0.6
0.8
1.0
1.2
1.4
2017 18 19 20 21
Per cent
Market interest rates(a)
(February Report)
Market interest rates(a)
(November Report)
Forecasters’ projections (February Report)
Forecasters’ projections (November Report)
Chart C Expectations of Bank Rate are slightly higher than in NovemberMarket interest rates and average of forecasters’ central projections for Bank Rate
Sources: Bloomberg, projections of outside forecasters provided for Inflation Reports in November 2017 and February 2018 and Bank calculations.
(a) Estimated using instantaneous forward overnight index swap rates in the 15 working days to 25 October 2017 and 31 January 2018.

Glossary and other information 45
Glossary and other information
Glossary of selected data and instrumentsAWE – average weekly earnings. CPI – consumer prices index. CPI inflation – inflation measured by the consumer prices index. DGI – domestically generated inflation. DMP – Decision Maker Panel. ERI – exchange rate index. GDP – gross domestic product. LFS – Labour Force Survey. OIS – overnight index swap. PPI – producer price index. RPI – retail prices index. RPI inflation – inflation measured by the retail prices index. SONIA – sterling overnight index average. ULC – unit labour cost.
AbbreviationsBCC – British Chambers of Commerce. CBI – Confederation of British Industry. CEIC – CEIC Data Company Ltd. CFO – chief financial officer. CIPD – Chartered Institute of Personnel and Development. CIPS – Chartered Institute of Purchasing and Supply. COICOP – Classification of Individual Consumption by Purpose. ECB – European Central Bank. EME – emerging market economy. EU – European Union. FOMC – Federal Open Market Committee. FPC – Financial Policy Committee. FTSE – Financial Times Stock Exchange. G7 – Canada, France, Germany, Italy, Japan, the United Kingdom and the United States. GfK – Gesellschaft für Konsumforschung, Great Britain Ltd. GVA – gross value added. IEA – International Energy Agency. IMF – International Monetary Fund. LTV – loan to value.
MPC – Monetary Policy Committee. MSCI – Morgan Stanley Capital International Inc. MTIC – missing trader intra-community. NPISH – non-profit institutions serving households.OECD – Organisation for Economic Co-operation and Development. ONS – Office for National Statistics. OPEC – Organization of the Petroleum Exporting Countries. PPP – purchasing power parity. PwC – PricewaterhouseCoopers. R&D – research and development. REC – Recruitment and Employment Confederation. RICS – Royal Institution of Chartered Surveyors. S&P – Standard & Poor’s. SMEs – small and medium-sized enterprises. TFP – total factor productivity.TFS – Term Funding Scheme. VAT – Value Added Tax. WEO – IMF World Economic Outlook.
Symbols and conventionsExcept where otherwise stated, the source of the data used in charts and tables is the Bank of England or the Office for National Statistics (ONS) and all data, apart from financial markets data, are seasonally adjusted.
n.a. = not available.
Because of rounding, the sum of the separate items may sometimes differ from the total shown.
On the horizontal axes of graphs, larger ticks denote the first observation within the relevant period, eg data for the first quarter of the year.


