19
September 2018 RUSSIAN ECONOMIC OUTLOOK AND MONETARY POLICY Bank of Russia

RUSSIAN ECONOMIC OUTLOOK
AND MONETARY POLICY CHALLENGES
September 2018
RUSSIAN ECONOMIC OUTLOOK AND MONETARY POLICY
Bank of Russia
RUSSIAN ECONOMIC OUTLOOK
AND MONETARY POLICY CHALLENGES
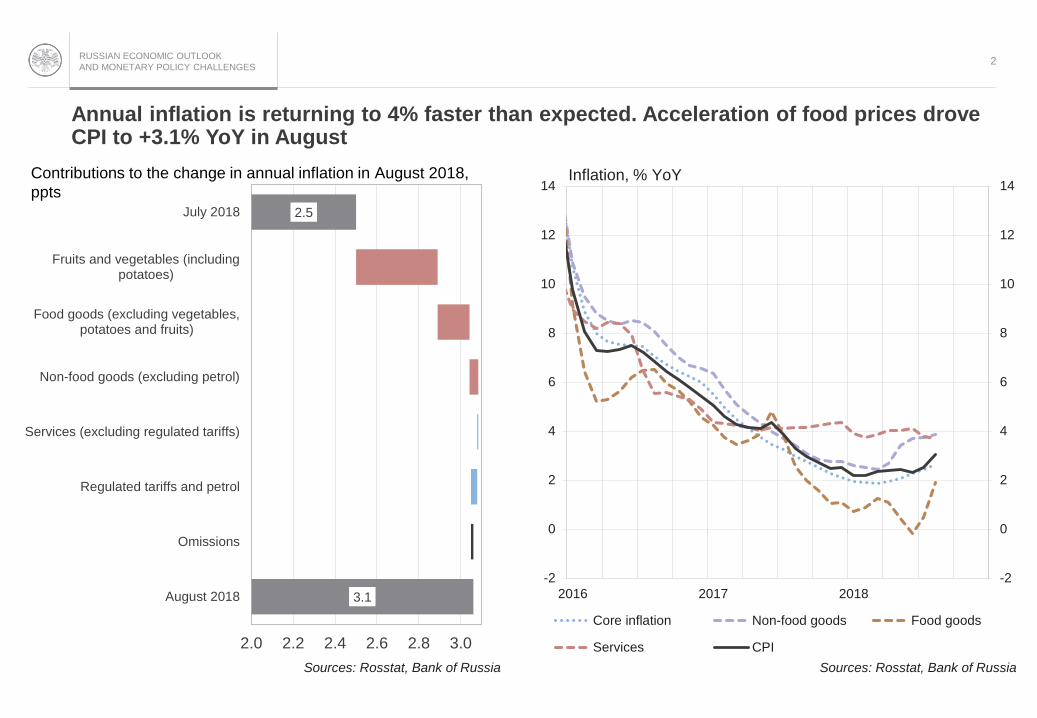
Annual inflation is returning to 4% faster than expected. Acceleration of food prices drove CPI to +3.1% YoY in August
2
3.1
2.5
2.0 2.2 2.4 2.6 2.8 3.0
August 2018
Omissions
Regulated tariffs and petrol
Services (excluding regulated tariffs)
Non-food goods (excluding petrol)
Food goods (excluding vegetables,potatoes and fruits)
Fruits and vegetables (includingpotatoes)
July 2018
Sources: Rosstat, Bank of Russia
Contributions to the change in annual inflation in August 2018,
ppts
-2
0
2
4
6
8
10
12
14
-2
0
2
4
6
8
10
12
14
2016 2017 2018
Core inflation Non-food goods Food goods
Services CPI
Inflation, % YoY
Sources: Rosstat, Bank of Russia
RUSSIAN ECONOMIC OUTLOOK
AND MONETARY POLICY CHALLENGES3
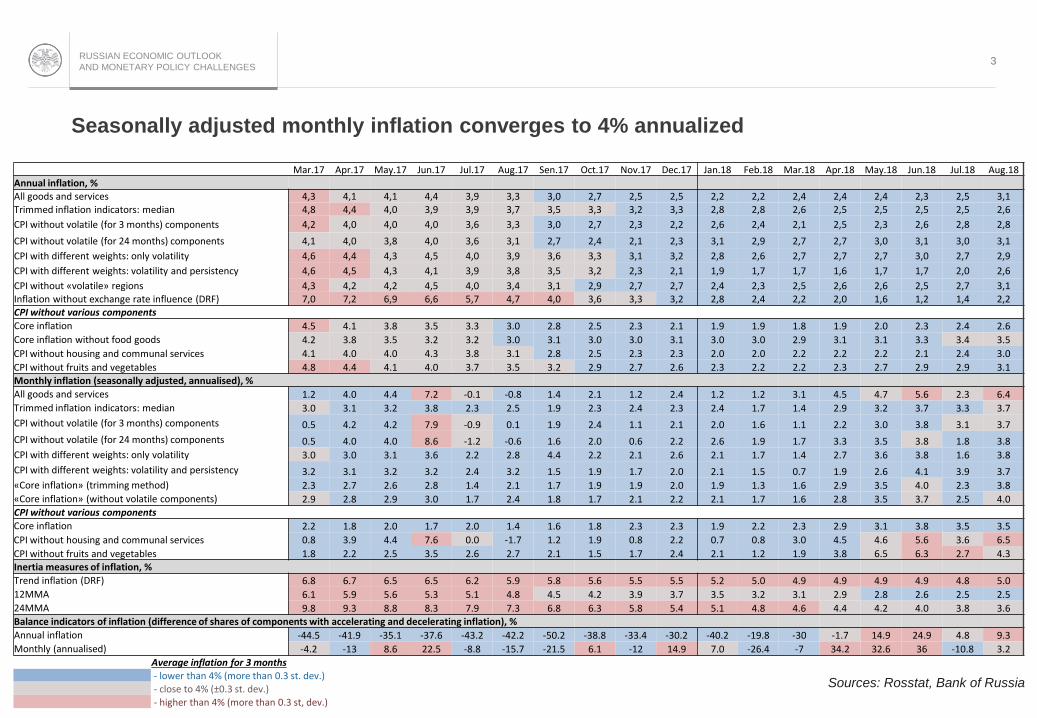
Seasonally adjusted monthly inflation converges to 4% annualized
Mar.17 Apr.17 May.17 Jun.17 Jul.17 Aug.17 Sen.17 Oct.17 Nov.17 Dec.17 Jan.18 Feb.18 Mar.18 Apr.18 May.18 Jun.18 Jul.18 Aug.18Annual inflation, %All goods and services 4,3 4,1 4,1 4,4 3,9 3,3 3,0 2,7 2,5 2,5 2,2 2,2 2,4 2,4 2,4 2,3 2,5 3,1Trimmed inflation indicators: median 4,8 4,4 4,0 3,9 3,9 3,7 3,5 3,3 3,2 3,3 2,8 2,8 2,6 2,5 2,5 2,5 2,5 2,6
CPI without volatile (for 3 months) components 4,2 4,0 4,0 4,0 3,6 3,3 3,0 2,7 2,3 2,2 2,6 2,4 2,1 2,5 2,3 2,6 2,8 2,8
CPI without volatile (for 24 months) components 4,1 4,0 3,8 4,0 3,6 3,1 2,7 2,4 2,1 2,3 3,1 2,9 2,7 2,7 3,0 3,1 3,0 3,1
CPI with different weights: only volatility 4,6 4,4 4,3 4,5 4,0 3,9 3,6 3,3 3,1 3,2 2,8 2,6 2,7 2,7 2,7 3,0 2,7 2,9
CPI with different weights: volatility and persistency 4,6 4,5 4,3 4,1 3,9 3,8 3,5 3,2 2,3 2,1 1,9 1,7 1,7 1,6 1,7 1,7 2,0 2,6
CPI without «volatile» regions 4,3 4,2 4,2 4,5 4,0 3,4 3,1 2,9 2,7 2,7 2,4 2,3 2,5 2,6 2,6 2,5 2,7 3,1Inflation without exchange rate influence (DRF) 7,0 7,2 6,9 6,6 5,7 4,7 4,0 3,6 3,3 3,2 2,8 2,4 2,2 2,0 1,6 1,2 1,4 2,2CPI without various components
Core inflation 4.5 4.1 3.8 3.5 3.3 3.0 2.8 2.5 2.3 2.1 1.9 1.9 1.8 1.9 2.0 2.3 2.4 2.6
Core inflation without food goods 4.2 3.8 3.5 3.2 3.2 3.0 3.1 3.0 3.0 3.1 3.0 3.0 2.9 3.1 3.1 3.3 3.4 3.5
CPI without housing and communal services 4.1 4.0 4.0 4.3 3.8 3.1 2.8 2.5 2.3 2.3 2.0 2.0 2.2 2.2 2.2 2.1 2.4 3.0
CPI without fruits and vegetables 4.8 4.4 4.1 4.0 3.7 3.5 3.2 2.9 2.7 2.6 2.3 2.2 2.2 2.3 2.7 2.9 2.9 3.1Monthly inflation (seasonally adjusted, annualised), %
All goods and services 1.2 4.0 4.4 7.2 -0.1 -0.8 1.4 2.1 1.2 2.4 1.2 1.2 3.1 4.5 4.7 5.6 2.3 6.4
Trimmed inflation indicators: median 3.0 3.1 3.2 3.8 2.3 2.5 1.9 2.3 2.4 2.3 2.4 1.7 1.4 2.9 3.2 3.7 3.3 3.7
CPI without volatile (for 3 months) components 0.5 4.2 4.2 7.9 -0.9 0.1 1.9 2.4 1.1 2.1 2.0 1.6 1.1 2.2 3.0 3.8 3.1 3.7
CPI without volatile (for 24 months) components 0.5 4.0 4.0 8.6 -1.2 -0.6 1.6 2.0 0.6 2.2 2.6 1.9 1.7 3.3 3.5 3.8 1.8 3.8
CPI with different weights: only volatility 3.0 3.0 3.1 3.6 2.2 2.8 4.4 2.2 2.1 2.6 2.1 1.7 1.4 2.7 3.6 3.8 1.6 3.8
CPI with different weights: volatility and persistency 3.2 3.1 3.2 3.2 2.4 3.2 1.5 1.9 1.7 2.0 2.1 1.5 0.7 1.9 2.6 4.1 3.9 3.7
«Core inflation» (trimming method) 2.3 2.7 2.6 2.8 1.4 2.1 1.7 1.9 1.9 2.0 1.9 1.3 1.6 2.9 3.5 4.0 2.3 3.8
«Core inflation» (without volatile components) 2.9 2.8 2.9 3.0 1.7 2.4 1.8 1.7 2.1 2.2 2.1 1.7 1.6 2.8 3.5 3.7 2.5 4.0CPI without various components
Core inflation 2.2 1.8 2.0 1.7 2.0 1.4 1.6 1.8 2.3 2.3 1.9 2.2 2.3 2.9 3.1 3.8 3.5 3.5
CPI without housing and communal services 0.8 3.9 4.4 7.6 0.0 -1.7 1.2 1.9 0.8 2.2 0.7 0.8 3.0 4.5 4.6 5.6 3.6 6.5
CPI without fruits and vegetables 1.8 2.2 2.5 3.5 2.6 2.7 2.1 1.5 1.7 2.4 2.1 1.2 1.9 3.8 6.5 6.3 2.7 4.3Inertia measures of inflation, %
Trend inflation (DRF) 6.8 6.7 6.5 6.5 6.2 5.9 5.8 5.6 5.5 5.5 5.2 5.0 4.9 4.9 4.9 4.9 4.8 5.0
12MMA 6.1 5.9 5.6 5.3 5.1 4.8 4.5 4.2 3.9 3.7 3.5 3.2 3.1 2.9 2.8 2.6 2.5 2.5
24MMA 9.8 9.3 8.8 8.3 7.9 7.3 6.8 6.3 5.8 5.4 5.1 4.8 4.6 4.4 4.2 4.0 3.8 3.6Balance indicators of inflation (difference of shares of components with accelerating and decelerating inflation), %
Annual inflation -44.5 -41.9 -35.1 -37.6 -43.2 -42.2 -50.2 -38.8 -33.4 -30.2 -40.2 -19.8 -30 -1.7 14.9 24.9 4.8 9.3
Monthly (annualised) -4.2 -13 8.6 22.5 -8.8 -15.7 -21.5 6.1 -12 14.9 7.0 -26.4 -7 34.2 32.6 36 -10.8 3.2
Average inflation for 3 months- lower than 4% (more than 0.3 st. dev.)- close to 4% (±0.3 st. dev.)- higher than 4% (more than 0.3 st, dev.)
Sources: Rosstat, Bank of Russia
RUSSIAN ECONOMIC OUTLOOK
AND MONETARY POLICY CHALLENGES
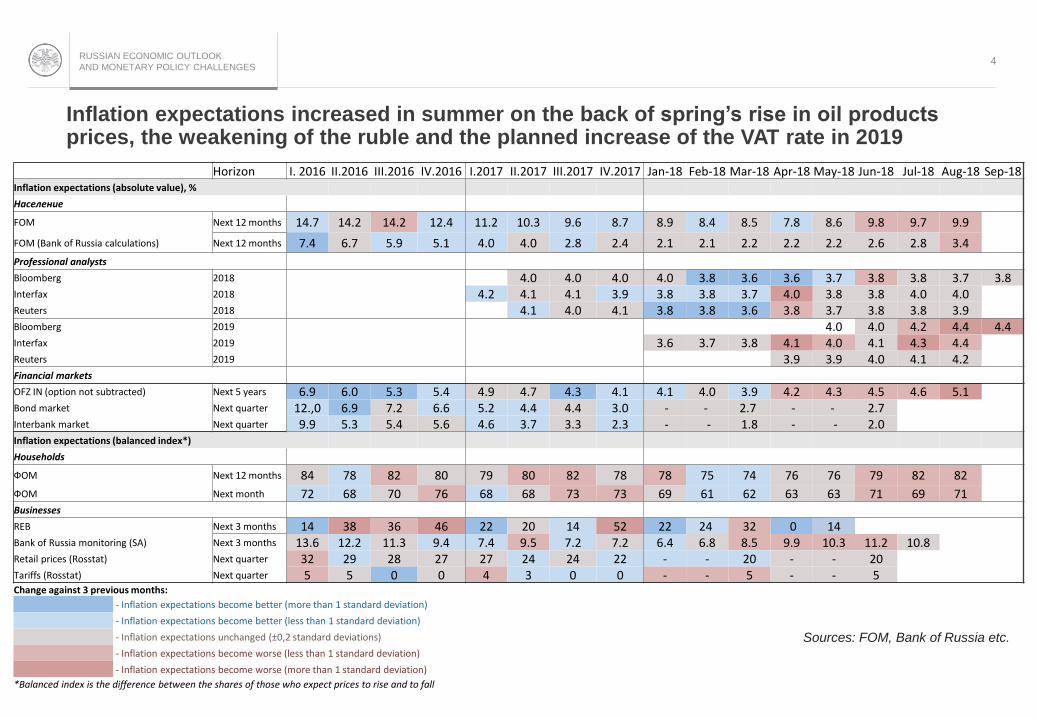
Inflation expectations increased in summer on the back of spring’s rise in oil products prices, the weakening of the ruble and the planned increase of the VAT rate in 2019
4
Horizon I. 2016 II.2016 III.2016 IV.2016 I.2017 II.2017 III.2017 IV.2017 Jan-18 Feb-18 Mar-18 Apr-18 May-18 Jun-18 Jul-18 Aug-18 Sep-18Inflation expectations (absolute value), %
Население
FOM Next 12 months 14.7 14.2 14.2 12.4 11.2 10.3 9.6 8.7 8.9 8.4 8.5 7.8 8.6 9.8 9.7 9.9
FOM (Bank of Russia calculations) Next 12 months 7.4 6.7 5.9 5.1 4.0 4.0 2.8 2.4 2.1 2.1 2.2 2.2 2.2 2.6 2.8 3.4
Professional analysts
Bloomberg 2018 4.0 4.0 4.0 4.0 3.8 3.6 3.6 3.7 3.8 3.8 3.7 3.8Interfax 2018 4.2 4.1 4.1 3.9 3.8 3.8 3.7 4.0 3.8 3.8 4.0 4.0Reuters 2018 4.1 4.0 4.1 3.8 3.8 3.6 3.8 3.7 3.8 3.8 3.9Bloomberg 2019 4.0 4.0 4.2 4.4 4.4Interfax 2019 3.6 3.7 3.8 4.1 4.0 4.1 4.3 4.4Reuters 2019 3.9 3.9 4.0 4.1 4.2Financial markets
OFZ IN (option not subtracted) Next 5 years 6.9 6.0 5.3 5.4 4.9 4.7 4.3 4.1 4.1 4.0 3.9 4.2 4.3 4.5 4.6 5.1Bond market Next quarter 12.,0 6.9 7.2 6.6 5.2 4.4 4.4 3.0 - - 2.7 - - 2.7Interbank market Next quarter 9.9 5.3 5.4 5.6 4.6 3.7 3.3 2.3 - - 1.8 - - 2.0Inflation expectations (balanced index*)
Households
ФОМ Next 12 months 84 78 82 80 79 80 82 78 78 75 74 76 76 79 82 82
ФОМ Next month 72 68 70 76 68 68 73 73 69 61 62 63 63 71 69 71Businesses
REB Next 3 months 14 38 36 46 22 20 14 52 22 24 32 0 14Bank of Russia monitoring (SA) Next 3 months 13.6 12.2 11.3 9.4 7.4 9.5 7.2 7.2 6.4 6.8 8.5 9.9 10.3 11.2 10.8Retail prices (Rosstat) Next quarter 32 29 28 27 27 24 24 22 - - 20 - - 20Tariffs (Rosstat) Next quarter 5 5 0 0 4 3 0 0 - - 5 - - 5Change against 3 previous months:
- Inflation expectations become better (more than 1 standard deviation)
- Inflation expectations become better (less than 1 standard deviation)
- Inflation expectations unchanged (±0,2 standard deviations)
- Inflation expectations become worse (less than 1 standard deviation)
- Inflation expectations become worse (more than 1 standard deviation)
*Balanced index is the difference between the shares of those who expect prices to rise and to fall
Sources: FOM, Bank of Russia etc.

RUSSIAN ECONOMIC OUTLOOK
AND MONETARY POLICY CHALLENGES
Rising geopolitical tensions and capital outflows from emerging market economies significantly impacted Russian CDS and the ruble exchange rate in August and September
5
40
90
140
190
240
290
340
390
440
2017 2018
CDS "проблемных" EM CDS "стабильных" EM
CDS EM CDS Россия
The dynamics of sovereign risk premiums (CDS) for various emerging markets, bp
Sources: Reuters, Bank of Russia
CDS for “troublesome” EM CDS for “stable” EM
CDS Russia
55
57
59
61
63
65
67
69
71
73
2017 2018
Russian ruble exchange rate dynamics
Russian ruble to US dollar exchange rate, RUB/USD
Yearly averageSources: Reuters, Bank of Russia

RUSSIAN ECONOMIC OUTLOOK
AND MONETARY POLICY CHALLENGES6
EM central banks raise interest rates amid monetary policy normalisation in DM
Expected levels of interest rates in developed economies
14.09.2018 4Q2019 2Q2020
Current rateActual change in the
last 3MConsensus as of
August 20186М change in the forecast
Consensus as of August 2018
6М change in the forecast
Federal Reserve (upper bond) 2,00% +25 bp 3,25% +25 bp 3,38% +38 bp
ECB (main refinancing rate ) 0,00% - 0,10% -15 bp 0,38% -12 bp
BOE 0,75% +25 bp 1,25% - 1,50% -
BOJ Target Rate -0,10% - -0,04% -04 bp -0,01% -01 bp
BOC 1,50% +25 bp 2,25% - 2,63% -
Expected levels of interest rates in some emerging market economies
14.09.2018 4Q2019 2Q2020
Current rateActual change in the
last 3MConsensus as of
August 20186М change in the forecast
Consensus as of August 2018
6М change in the forecast
PBOC (Lending Rate) 4,35% - 4,35% - 4,35% -
Indonesia 5,50% +75 bp 5,75% +100 bp 5,75% +125 bp
India (Repo Rate) 6,50% +25 bp 6,5%* +25 bp 6,63%* +50 bp
Brazil 6,50% - 8,00% - 8,00% -
Mexico 7,75% +25 bp 6,75% +75 bp 6,00% +12 bp
Turkey 24,00% +1600 bp 19,25% +1125 bp 17,25% +925 bp
Argentina 60,00% +2000 bp 26,00% +1000 bp 22,00% +675 bp
* - latest consensus as of July 2018 Sources: Reuters, Bloomberg

RUSSIAN ECONOMIC OUTLOOK
AND MONETARY POLICY CHALLENGES
Monetary conditions have tightened under the influence of external factors. 10Y OFZ yield +200bps from March lows. Deposit and lending rates start to rise as well
7
10
13
16
19
22
25
5
6
7
8
9
10
2017 2018
10-year bond yields dynamics of particular EM, %
Россия Южная Африка Мексика
Индонезия Турция (пр. ось)
Source: Reuters, Bank of Russia
-6
-3
0
3
6
9
12
15
18
-6
-3
0
3
6
9
12
15
18
2014 2015 2016 2017 2018
Nominal household deposit rate Real corporate loan rate
Real household deposit rate O/n interbank rate (MIACR)
Nominal corporate loan rate
Source: Bank of Russia
Long-term ruble bank interest rates dynamics*, % p.a.
* Inflation expectations indicator used:1) Real corporate loan rate – Bloomberg2) Real household deposit rate – FOM (adjusted by the Bank of Russia)
Russia
Indonesia Turkey (right axis)
South Africa Mexico
RUSSIAN ECONOMIC OUTLOOK
AND MONETARY POLICY CHALLENGES
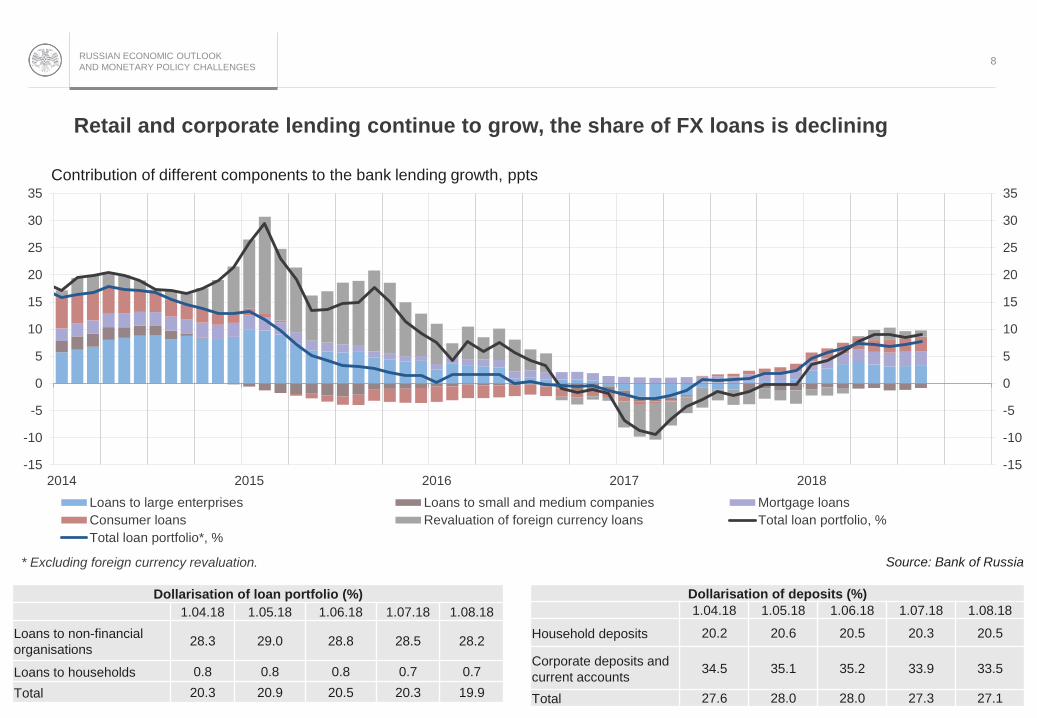
Retail and corporate lending continue to grow, the share of FX loans is declining
8
-15
-10
-5
0
5
10
15
20
25
30
35
-15
-10
-5
0
5
10
15
20
25
30
35
2014 2015 2016 2017 2018
Loans to large enterprises Loans to small and medium companies Mortgage loans
Consumer loans Revaluation of foreign currency loans Total loan portfolio, %
Total loan portfolio*, %
Contribution of different components to the bank lending growth, ppts
Source: Bank of Russia* Excluding foreign currency revaluation.
Dollarisation of loan portfolio (%)
1.04.18 1.05.18 1.06.18 1.07.18 1.08.18
Loans to non-financial
organisations28.3 29.0 28.8 28.5 28.2
Loans to households 0.8 0.8 0.8 0.7 0.7
Total 20.3 20.9 20.5 20.3 19.9
Dollarisation of deposits (%)
1.04.18 1.05.18 1.06.18 1.07.18 1.08.18
Household deposits 20.2 20.6 20.5 20.3 20.5
Corporate deposits and
current accounts34.5 35.1 35.2 33.9 33.5
Total 27.6 28.0 28.0 27.3 27.1
RUSSIAN ECONOMIC OUTLOOK
AND MONETARY POLICY CHALLENGES
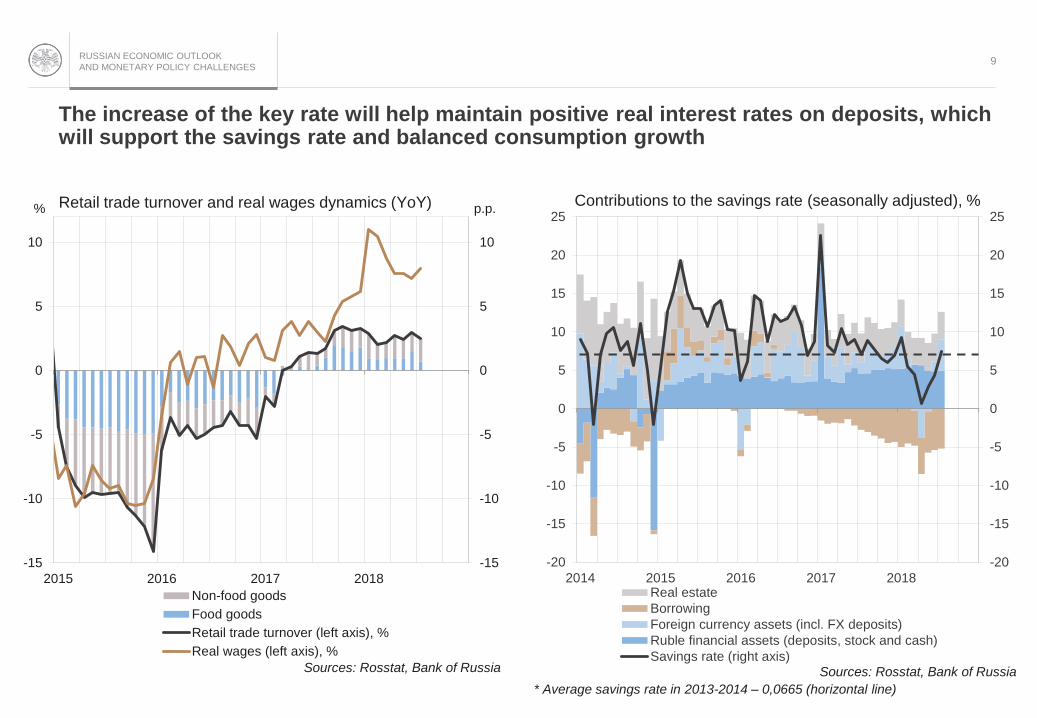
The increase of the key rate will help maintain positive real interest rates on deposits, which will support the savings rate and balanced consumption growth
9
-20
-15
-10
-5
0
5
10
15
20
25
-20
-15
-10
-5
0
5
10
15
20
25
2014 2015 2016 2017 2018Real estate
Borrowing
Foreign currency assets (incl. FX deposits)
Ruble financial assets (deposits, stock and cash)
Savings rate (right axis)
Contributions to the savings rate (seasonally adjusted), %
Sources: Rosstat, Bank of Russia
* Average savings rate in 2013-2014 – 0,0665 (horizontal line)
-15
-10
-5
0
5
10
-15
-10
-5
0
5
10
2015 2016 2017 2018
Non-food goods
Food goods
Retail trade turnover (left axis), %
Real wages (left axis), %
Retail trade turnover and real wages dynamics (YoY)% p.p.
Sources: Rosstat, Bank of Russia
RUSSIAN ECONOMIC OUTLOOK
AND MONETARY POLICY CHALLENGES
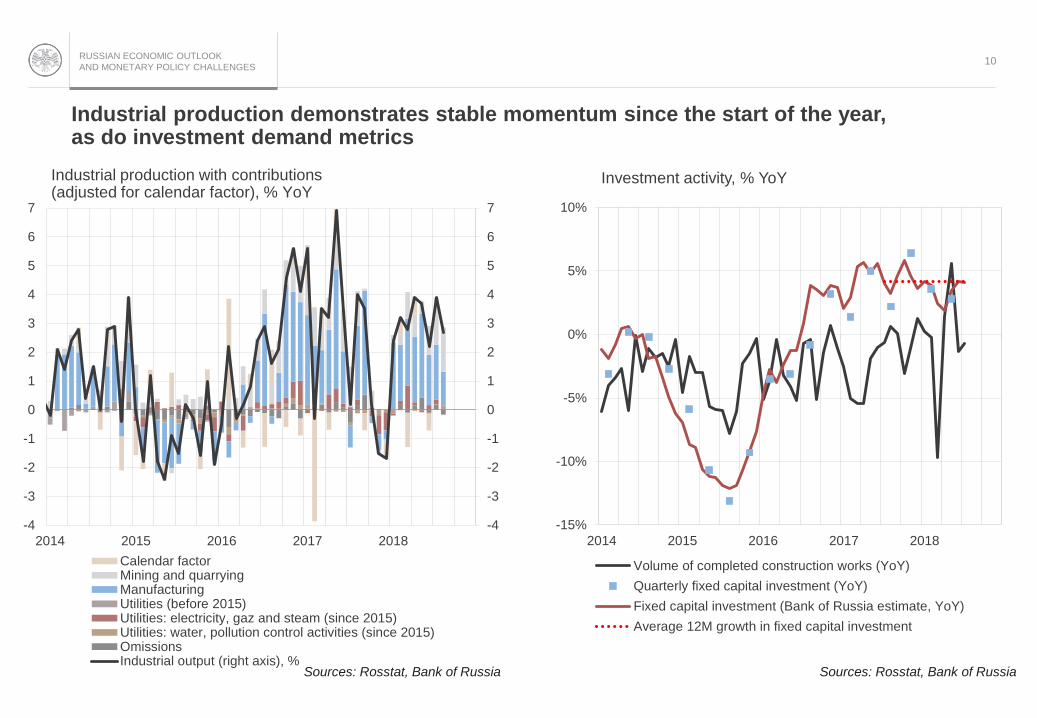
Industrial production demonstrates stable momentum since the start of the year,as do investment demand metrics
10
-4
-3
-2
-1
0
1
2
3
4
5
6
7
-4
-3
-2
-1
0
1
2
3
4
5
6
7
2014 2015 2016 2017 2018
Calendar factorMining and quarryingManufacturingUtilities (before 2015)Utilities: electricity, gaz and steam (since 2015)Utilities: water, pollution control activities (since 2015)OmissionsIndustrial output (right axis), %
Industrial production with contributions(adjusted for calendar factor), % YoY
Sources: Rosstat, Bank of Russia
-15%
-10%
-5%
0%
5%
10%
2014 2015 2016 2017 2018
Volume of completed construction works (YoY)
Quarterly fixed capital investment (YoY)
Fixed capital investment (Bank of Russia estimate, YoY)
Average 12M growth in fixed capital investment
Investment activity, % YoY
Sources: Rosstat, Bank of Russia

RUSSIAN ECONOMIC OUTLOOK
AND MONETARY POLICY CHALLENGES
The Bank of Russia’s forecast takes into account the set of fiscal and structural measures for 2024 as proposed by the Government
The set of fiscal and structural measures to be taken by 2024:
The increase of the value-added tax rate from 18% to 20% in January 2019
The increase of the retirement age from 2019
Additional expenditures in the amount of 8 trlnrubles on infrastructure investment and human capital (education, healthcare, environment and development of advanced technological export) in 2019-2024
11
17.1
19.9 20.020.5
16.617.9
18.9
19.9
0.5
1.8
1.0
0.6
0.0
0.2
0.4
0.6
0.8
1.0
1.2
1.4
1.6
1.8
2.0
0
5
10
15
20
25
2018 2019 2020 2021
Revenues, bln rubles
Expenditures, bln rubles
Federal budget deficit ("-")/surplus ("+"), % of GDP
Key parameters of the Federal budget in 2018-2021
Source: Ministry of Finance

RUSSIAN ECONOMIC OUTLOOK
AND MONETARY POLICY CHALLENGES
The Bank of Russia decided to extend the suspension of FX purchases in the domestic market under the fiscal rule until the end of December 2018
12
The decision to resume regular foreign
currency purchases in the domestic market
under the fiscal rule will be based on the
assessment of the actual situation in the
financial markets
Lowers overall volatility in
the financial markets
Curtails exchange rate
volatility and its influence
on inflation and inflation
expectations over the next
few quarters
Visibility on monetary
authorities' actions
The decision on the foreign currency
purchases in the domestic market that were
postponed in 2018 will be made separately
after regular purchases are resumed
Postponed purchases will be carried out in
the course of 2019 and later years
Source: Bank of Russia

RUSSIAN ECONOMIC OUTLOOK
AND MONETARY POLICY CHALLENGES13
Oil price projection for 2018-2021 shifted moderately higher.Baseline trajectory now stands at $60/bbl - $55/bbl - $55/bbl (from 55-50-50)
40
50
60
70
80
90
100
110
2013 2014 2015 2016 2017 2018 2019 2020
Baseline (June) Unchanged oil price (June) Baseline (September) Unchanged oil price (September)
Source: Bank of Russia
Oil price projections*, USD per barrel
* Based on Monetary Policy Report №3 (September 2018)
RUSSIAN ECONOMIC OUTLOOK
AND MONETARY POLICY CHALLENGES
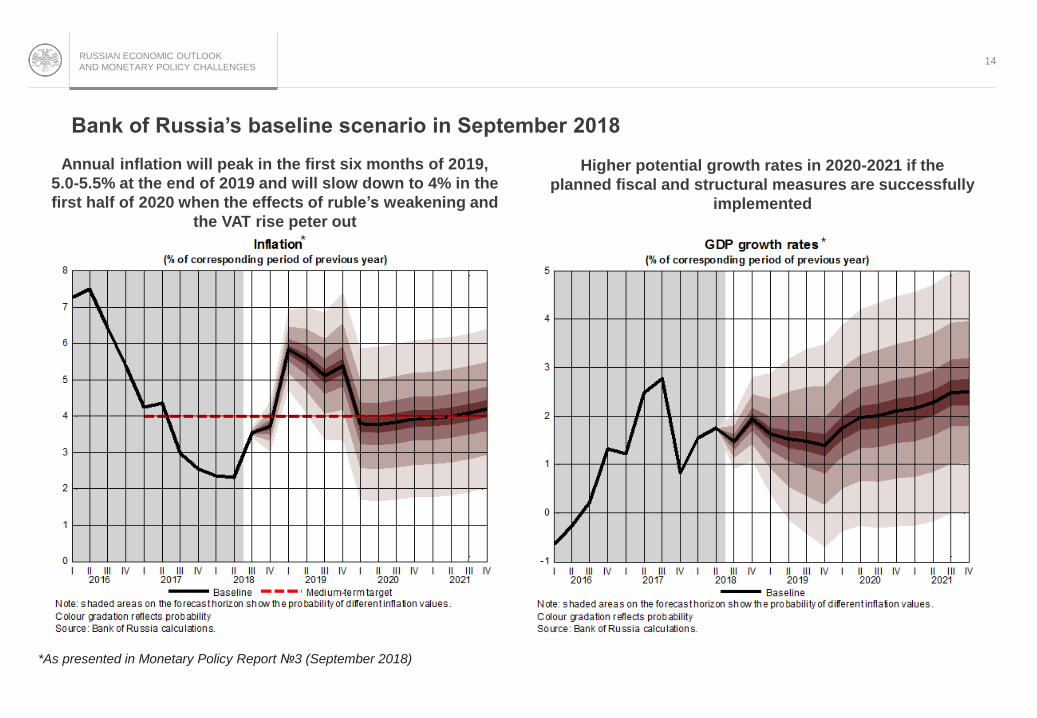
Bank of Russia’s baseline scenario in September 2018
14
*As presented in Monetary Policy Report №3 (September 2018)
* *
Annual inflation will peak in the first six months of 2019,
5.0-5.5% at the end of 2019 and will slow down to 4% in the
first half of 2020 when the effects of ruble’s weakening and
the VAT rise peter out
Higher potential growth rates in 2020-2021 if the
planned fiscal and structural measures are successfully
implemented
RUSSIAN ECONOMIC OUTLOOK
AND MONETARY POLICY CHALLENGES
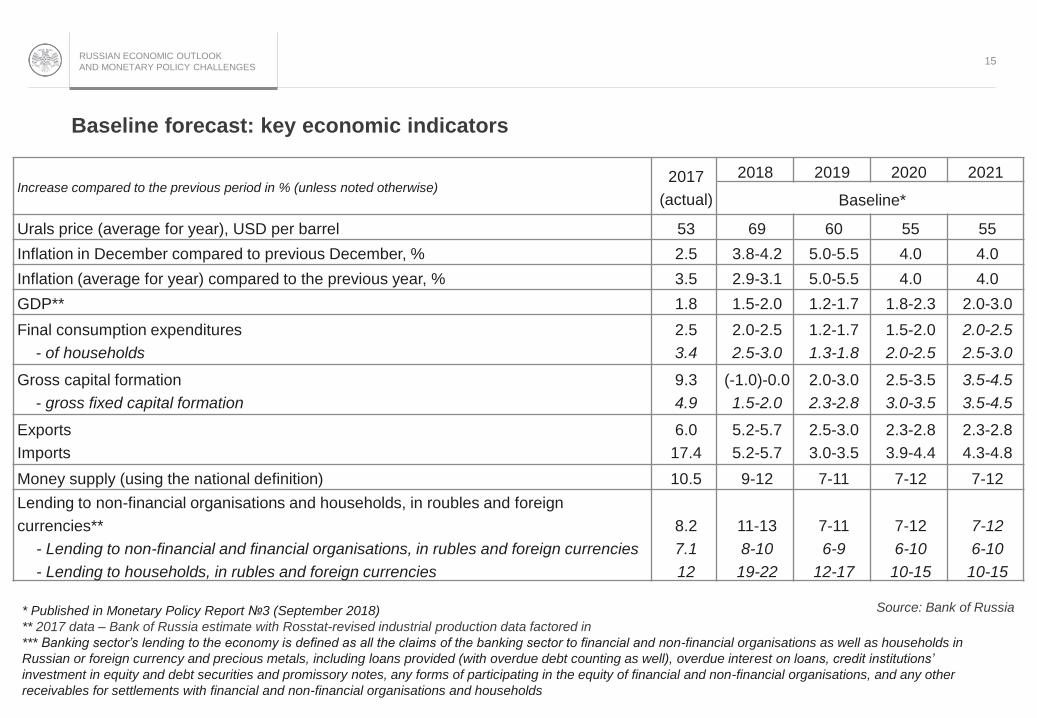
Baseline forecast: key economic indicators
15
Increase compared to the previous period in % (unless noted otherwise)2017
(actual)
2018 2019 2020 2021
Baseline*
Urals price (average for year), USD per barrel 53 69 60 55 55
Inflation in December compared to previous December, % 2.5 3.8-4.2 5.0-5.5 4.0 4.0
Inflation (average for year) compared to the previous year, % 3.5 2.9-3.1 5.0-5.5 4.0 4.0
GDP** 1.8 1.5-2.0 1.2-1.7 1.8-2.3 2.0-3.0
Final consumption expenditures
- of households
2.5
3.4
2.0-2.5
2.5-3.0
1.2-1.7
1.3-1.8
1.5-2.0
2.0-2.5
2.0-2.5
2.5-3.0
Gross capital formation
- gross fixed capital formation
9.3
4.9
(-1.0)-0.0
1.5-2.0
2.0-3.0
2.3-2.8
2.5-3.5
3.0-3.5
3.5-4.5
3.5-4.5
Exports
Imports
6.0
17.4
5.2-5.7
5.2-5.7
2.5-3.0
3.0-3.5
2.3-2.8
3.9-4.4
2.3-2.8
4.3-4.8
Money supply (using the national definition) 10.5 9-12 7-11 7-12 7-12
Lending to non-financial organisations and households, in roubles and foreign
currencies**
- Lending to non-financial and financial organisations, in rubles and foreign currencies
- Lending to households, in rubles and foreign currencies
8.2
7.1
12
11-13
8-10
19-22
7-11
6-9
12-17
7-12
6-10
10-15
7-12
6-10
10-15
* Published in Monetary Policy Report №3 (September 2018)
** 2017 data – Bank of Russia estimate with Rosstat-revised industrial production data factored in
*** Banking sector’s lending to the economy is defined as all the claims of the banking sector to financial and non-financial organisations as well as households in
Russian or foreign currency and precious metals, including loans provided (with overdue debt counting as well), overdue interest on loans, credit institutions’
investment in equity and debt securities and promissory notes, any forms of participating in the equity of financial and non-financial organisations, and any other
receivables for settlements with financial and non-financial organisations and households
Source: Bank of Russia
RUSSIAN ECONOMIC OUTLOOK
AND MONETARY POLICY CHALLENGES
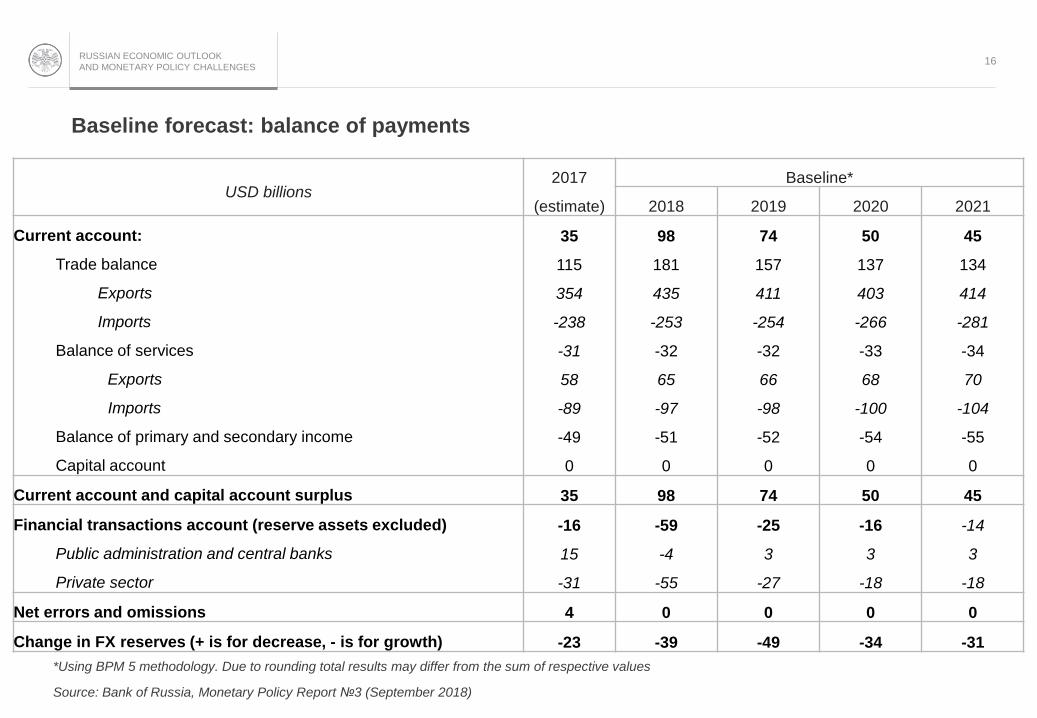
Baseline forecast: balance of payments
16
*Using BPM 5 methodology. Due to rounding total results may differ from the sum of respective values
Source: Bank of Russia, Monetary Policy Report №3 (September 2018)
USD billions2017
(estimate)
Baseline*
2018 2019 2020 2021
Current account:
Trade balance
Exports
Imports
Balance of services
Exports
Imports
Balance of primary and secondary income
Capital account
35
115
354
-238
-31
58
-89
-49
0
98
181
435
-253
-32
65
-97
-51
0
74
157
411
-254
-32
66
-98
-52
0
50
137
403
-266
-33
68
-100
-54
0
45
134
414
-281
-34
70
-104
-55
0
Current account and capital account surplus 35 98 74 50 45
Financial transactions account (reserve assets excluded)
Public administration and central banks
Private sector
-16
15
-31
-59
-4
-55
-25
3
-27
-16
3
-18
-14
3
-18
Net errors and omissions 4 0 0 0 0
Change in FX reserves (+ is for decrease, - is for growth) -23 -39 -49 -34 -31

RUSSIAN ECONOMIC OUTLOOK
AND MONETARY POLICY CHALLENGES17
Monetary policy decision on 14 September 2018
Inflation and inflation expectations
• Annual inflation is returning to 4% faster than expected
• Increase in annual food price growth to 1.9%
• Inflation expectations of both households and businesses have slightly increased on the back
of the foreign exchange rate volatility
• Annual inflation will be 3.8-4.2% by the end of 2018, 5.0-5.5% – in 2019 and will slow down to
4% in the first half of 2020 when the effects of ruble’s weakening and the VAT rise peter out
The Bank of Russia’s decision to suspend foreign currency purchases in the domestic
market under the fiscal rule will serve to curtail exchange rate volatility and its influence
on inflation over the next few quarters
Monetary conditions have slightly tightened under the influence of external factors
Economic activity
• The economic growth forecast for 2019-2021, included in the baseline scenario updated
to take into account changes in external conditions and the estimated influence of the set
of fiscal and structural measures to be taken by 2024 on economic performance
Inflation risks
• The main risks: (1) Highly uncertain external conditions and their impact on financial
markets
• Moderate risks – estimates are mostly unchanged: (2) oil price volatility, (3) wage movements,
(4) possible changes in consumer behavior
Decision
The Bank of Russia
raises the key rate
by 25 bp to 7.50% p.a.
Signal
“…The Bank of Russia will
consider the necessity of
further increases in the key
rate, taking into account
inflation and economic
dynamics against the
forecast, as well as risks
posed by external conditions
and the reaction of financial
markets…”
RUSSIAN ECONOMIC OUTLOOK
AND MONETARY POLICY CHALLENGES
APPENDIX

RUSSIAN ECONOMIC OUTLOOK
AND MONETARY POLICY CHALLENGES
Amid structural liquidity surplus the Bank of Russia mostly conducts deposit auctions, with Bank of Russia bonds (OBR) being issued since August 2017
19
6.0
6.5
7.0
7.5
8.0
8.5
9.0
9.5
10.0
10.5
11.0
11.5
12.0
2017 2018
Bank of Russia key rate MIACR
Source: Bank of Russia
The dynamics of the key rate and MIACR, % p.a.
-5300
-4330
-3360
-2390
-1420
-450
520
1490
2017 2018Amount outstanding on other refinancing operations
Standing REPO facilities
REPO auctions
Bank of Russia bonds
Standing deposit facilities
Deposit auctionsSource: Bank of Russia
The structure of Bank of Russia’s liquidity management operations, bln rubles
0


