35
i BANK OF THE REPUBLIC OF BURUNDI MONETARY POLICY COMMITTEE REPORT N° 1/2013 OCTOBER 2013
i
BANK OF THE REPUBLIC OF BURUNDI
MONETARY POLICY COMMITTEE REPORT
N° 1/2013
OCTOBER 2013

2
Content ANALYTIQUE EXECUTIVE SUMMARY ............................................................................................ 3
1. OBJECTIVES AND TASKS OF THE BANK OF THE REPUBLIC OF BURUNDI................. 7
2. MONETARY POLICY FRAMEWORK OF THE BANK OF THE REPUBLIC OF BURUNDI7
2.1. Monetary policy objectives of the BRB ...................................................................................... 7
2.2. Monetary policy instruments of the BRB .................................................................................. 8
ECONOMIC ENVIRONMENT ......................................................................................................... 11
3.1. International Economic Environment ..................................................................................... 11
3.2. Evolution of economic activity in the EAC countries ............................................................ 14
4. OVERVIEW OF THE FINANCIAL AND ECONOMIC SITUATION IN BURUNDI ........... 21
4.1. Production and prices ................................................................................................................. 21
4.2. Balance of payments and exchange rates ............................................................................... 24
4.3. Public Finance............................................................................................................................... 26
4.4. The money market ....................................................................................................................... 28
5. PERFORMANCE AND OUTLOOK OF MONETARY POLICY ............................................. 29
5. CONCLUSION AND MONETARY POLICY ............................................................................. 32
PRESENTATION OF THE MONETARY POLICY COMMITTEE OF THE BRB ........................ 33
3
ANALYTIQUE EXECUTIVE SUMMARY
The year 2012 was generally characterized
by a slowdown in global growth. The rate
of global GDP growth stood at 3.1 against
3.9% in 2011. However, the performance of
the global economy during the year 2012
remained mixed.
The countries of the euro zone sank into
recession with a growth rate of 0.6%
against 1.5% in 2011. The decline in
growth is due to the lingering effects of the
crisis of sovereign debt. The U.S. economy,
meanwhile, is gradually emerging from the
crisis in 2012 and the good performances
were mainly due to the recovery in private
consumption and a revival in the housing
market. The Japanese economy also
experienced a remarkable increase
compared to 2011. This improvement in
economic activity is mainly due to support
of aggregate demand during the first half
of the year through spending on
reconstruction following the earthquake
that struck the country. In emerging and
developing countries, the growth rate
declined in 2012, falling to 4.9 from 6.2% in
2011. Economic activity contracted
significantly in all emerging economies
(Brazil, Russia, India, China and South
Africa). In Brazil, the growth rate stood at
0.9% against 2.7 in 20 11. Russia recorded
a rate of 3.4% while it has reached 4.3% in
2011. India has experienced a decline in
growth rate; it stood at 3.2% while the
economy had experienced a rate of 6.3% in
2011. The growth slowed in China to 7.8%
against 9.3% the previous year. Regarding
South Africa, she also saw a slowdown in
economic activity in 2012, with a growth
rate of 2.5% against 3.5% achieved in
2011.
During the first half of 2013, there has been
a recovery in economic activity in most
developed economies. The outlook for the
remainder of the year 2013 shows a
rebound in activity in the developed
countries. Despite this recovery, the euro
area is still hampered by the effects of the
crisis of sovereign debt.
With these mixed performance in the
world's economies, it is expected a growth
rate of 3.1%, similar to that recorded in
2012.
In developed countries, the recession in
most countries of the Euro zone continues
with a decrease in growth of 0.6%. In the
U.S., growth will also slow down to a rate of

4
1.7%, despite the efforts of the Federal
Reserve Bank to support economic activity.
In Japan, it is expected a slight
improvement in growth with a rate of 2.0%
due to policies supporting domestic
demand and the expected increase in net
exports.
For all emerging and developing
economies, it is expected an acceleration of
economic growth with a rate of 5.0%. This
growth will be mainly driven by the
performance of the Chinese economy with a
rate of 7.8%, of the Indian economy with a
projected rate of 5.6%, the Brazilian
economy with a rate of 2.5% and Sub-
Saharan Africa with a rate of 5.1%.
As the East African community, the
economic growth was mixed in 2012. She is
decelerated in Burundi, Rwanda and
Uganda while it accelerated in Tanzania
and Kenya. Forecasts for the year 2013, it is
expected a growth rate of 4.5% in Burundi,
7.5% for Rwanda, 4.8% in Uganda, 6.8%
for Tanzania and 5. 8% in Kenya.
For inflation, most countries of the East
African Community have experienced a
surge in prices in 2012. However, compared
to the last quarter of 2012, the inflation
rate declined in the first quarter of 2013,
except in Kenya. This trend continued in
the second quarter. The average inflation
rate stood at 8.4% in Tanzania, 7.5% in
Burundi, 4.4% in Kenya, 3.7% in Rwanda
and 3.5% in Uganda.
However, the increase in the inflation rate
was observed in the third quarter of 2013.
In September 2013, the average inflation
rate stood at 10.3% in Burundi, to 4.2% in
Rwanda, 6.3% in Kenya, 6.2% in Uganda
and 7.2% in Tanzania. This increase is
partly due to rising prices of petroleum
products from June in the OPEC countries,
undermining expectations of a possible
decline in the fourth quarter of 2013.
For the Burundian economy, the growth
rate stood at 4.2% in 2012 as in the
previous year.
The increase in the general level of prices
was mainly caused by a lack of production
facing strong demand, higher administered
prices and the lack of the balance of
payments.
During the first and second quarter 2013
inflation decreased significantly compared
to the last quarter of the year 2012. Indeed,
in the first quarter 2013, the average
inflation rate stood at 7.6% and at 7.5% in
the second quarter compared to 13.1% in

5
the fourth quarter of the previous year.
This decline in the rate of inflation is
largely due to the removal of taxes on some
products of first necessity taken by the
Government on May 15, 2012. However, the
lifting of the exemption from taxes on
certain foodstuffs from July 2013, the
upward revision of some administered
prices and the introduction of new taxes on
certain imported products contained in the
2013 revised Budget Act may accelerate
inflationary pressures for the fourth
quarter of 2013. In September, inflation
was 12.1% against 10.4% in August.
Persistent deficit in the balance of
payments has created pressure on foreign
exchange reserves, causing the
depreciation of the national currency.
Through the efforts of revenue
mobilization by the Burundi Revenue
Authority, the budget deficit is reduced in
2012. This revenue mobilization has led the
state not to use advances from the Central
Bank during the first nine months of 2013.
At the level of monetary sector, the year
2012 was characterized by a lack of
liquidity. To cope with this situation, the
Bank intensified refinancing operations;
specifically to finance the coffee campaign
that was more abundant than in 2011.
During the first half of 2013, liquidity has
improved, resulting in limited use of
resources of the Central Bank. This
improvement in liquidity has resulted in
lower rates on the liquidity and the
marginal lending.
Under the conduct of monetary policy in
2013, the Central Bank continued to use
indirect monetary policy instruments
consist of reserve requirements, tendering
liquidity and marginal lending.
On the foreign exchange market, the BRB
has taken measures to develop the
interbank market and stabilize the
exchange rate. These measures focused on :
1. The establishment of the
Interbank Currency Market (MID) ;
2. The fixing of a fluctuation
margin in the exchange rate of ±
1% around the reference rate on the
purchase and sale transactions of
commercial banks and exchange
offices ;
3. Liberalization of the foreign
currency accounts of residents
(deposits and withdrawals unlimited
amounts).

6
As part of the implementation of monetary
and exchange rate policies, the Central
Bank will take the following actions for the
fourth quarter of 2013:
1. continue to regulate bank
liquidity operations through tender
liquidity;
2. maintain the reserves
requirement ratio to 3%;
3. keep the rate of the marginal
lending indexed to the weighted
average rate on the 13-week
Treasury Bills plus 3 points
percentage
4. ensure compliance with the
ceiling on advances to state ;
5. Further determination of exchange
rates by market mechanisms and
encourage the development of
foreign exchange market.

7
1. OBJECTIVES AND TASKS OF
THE BANK OF THE
REPUBLIC OF BURUNDI
Under Article 6 of Law No. 1/34 of 2
December 2008 on the Statute of the Bank
of the Republic of Burundi, the Central
Bank's main objective is to ensure price
stability and, and without prejudice to the
achievement of the previous objective to
contribute to the stability of the financial
system.
To achieve these two objectives above and
contribute to implementing economic
policies conducive to macroeconomic
stability and the harmonious
development of the country, article 7 of
the same Act gives the Bank the following
missions:
1. Define and implement the
monetary policy;
2. Define and implement the
exchange rate regime;
3. Hold and manage the official
foreign reserves;
4. Regulate and supervise banks,
financial institutions and microfinance
institutions;
5. Issuing of bank notes and coins;
6. Promote a stable and sound
financial system;
7. Promote a reliable national
payment, efficient and robust;
8. Act as cashier of the State;
9. Perform any other duties
prescribed by law, and
10. Perform any task that any law
would give the Central Bank subject to
compatibility with its autonomy.
2. MONETARY POLICY
FRAMEWORK OF THE BANK
OF THE REPUBLIC OF
BURUNDI The monetary policy framework outlines
the operational and intermediate goals as
well as the instruments of monetary
policy implemented by the BRB.
2.1. Monetary policy objectives
of the BRB
The monetary policy framework of the
Bank of the Republic of Burundi is
characterized by the targeting of
monetary aggregates and the use of
indirect instruments to control money
supply and ensure price stability. In the
implementation of monetary policy, the
BRB uses the monetary base as an
operational target, assuming a stable

8
linear relationship both between the
monetary base and money supply M2, and
between the M2 money supply and the
general price level.
The M2 money supply is the intermediate
target of monetary policy that allows
achieving the ultimate goal of price
stability. To act on the intermediate target
M2, the Central Bank shall, within the
framework of economic and financial
program agreed with the International
Monetary Fund and supported by the
Extended Credit Facility, set the
quantitative target for monetary base. The
level of the monetary base set is
controlled through the quantitative
targets of net domestic and foreign assets
using indirect instruments of monetary
policy.
2.2. Monetary policy instruments
of the BRB
2.2.1. Reserve requirements
It is a requirement for commercial banks
to establish separately in their current
accounts in BIF, in U.S. Dollars (USD) and
Euros (EUR), opened in the books of the
Bank of the Republic of Burundi, the
required reserves in the form of unpaid
deposits. Required reserves are used to
control money creation by commercial
banks.
They are calculated on the basis of
deposits on current and saving accounts
made in BIF and foreign currency by bank
clients from their monthly accounting
statements submitted to the Bank of the
Republic of Burundi.
Reserve requirements on deposits in BI,
U.S. Dollars (USD) and euros (EUR) are
made in the same currencies. Reserve
requirements on deposits denominated in
other currencies are made in U.S. Dollars
(USD).
The required reserve ratio, currently set
at 3%, is determined by the Bank of the
Republic of Burundi and communicated to
banks through a circular letter.
The period of minimum reserve extends
from the first to the last day of each
month.
The amount of reserve requirements of
each bank is the monthly average of daily
credit balances in BIF, USD and EUR
current accounts, opened in the books of
the Bank of the Republic of Burundi. For
holidays, the balance to be considered is
that of the last working day. Average

9
balances of these accounts must be at
least equal to the respective amounts
required reserves.
Liquidity tenders
The Central Bank monitors liquidity
through operations of tenders for delivery
and resumption of liquidity which it sets
the duration (usually 7 days) and
frequency. Tenders liquidity may be fixed
or variable rate. In the case of fixed rate
tenders, BRB announces the interest rate
at which all banks present their bids. In
variable rate bidding each bank indicates
the amount it wishes to borrow or invest,
as applicable, and the corresponding
rates.
Liquidity- providing tenders
By calls for liquidity-providing, at a fixed
rate or variable rate tender, the BRB
grants temporary advances to banks.
When the tender is fixed rate, each bank is
served for the full amount she asked as
long as the sum of bids is less than or
equal to the amount that the BRB is
willing to provide. If the total of bids is
greater than the amount set by the BRB,
banks are paid in proportion to their
respective claims on the basis of a
percentage equal to the ratio between the
amount awarded and the total amount
tendered.
When the tender is at variable rates, bids
are ranked in descending order of rates
and are satisfied starting with those that
are accompanied by higher interest rates
until the total amount of cash to provide.
If, at the lowest accepted interest rate,
called marginal rate, the cumulative total
bid exceeds the remaining amount to be
provided, it is allocated pro rata among
the bids according to the ratio of the
remaining amount and the total bids at
the marginal rate. Once the allocations,
the BRB can apply the method of single
rate auction or multiple rate method, as
announced in the tender. In the first case,
all selected banks are paid at the same
rate, in principle, the marginal rate of the
tender. In the second case, banks are paid
to corresponding rates in each of their
bids.
After opening of tenders and auctions, the
BRB notify each bidder bank amounts
allocated to it and the interest rate that
will be counted. The total amount is
credited to the current account on the
date value specified in the tender. At
redemption date announced in the tender,
the current account of the relevant bank is
10
charged the full amount awarded and
interest.
Mop up liquidity tenders
This instrument is to suggest the banks by
way of tender, place within the Central
Bank cash deposits paid for the time
specified in the tender.
When the tender is fixed and if the sum of
bids is less than or equal to the amount
that the BRB has decided to withdraw, the
offer of each bank is total. If the total of
bids is greater than the amount set by the
BRB, the respective offers are made pro
rata on the basis of a percentage equal to
the ratio between the amount awarded
and the total amount offered.
When the tender is at variable rates, bids
are ranked in order of increasing rate and
are satisfied starting with those that are
accompanied by the lowest interest rates
until the total amount of cash to
withdraw. If, at the highest interest rate
chosen, called marginal rate, total bid
exceeds the remaining amount to
withdraw, it is allocated pro rata among
the bids according to the ratio of the
remaining amount and the total bids at
the marginal rate.
Once the allocations, the BRB can apply
either single rate auction method or the
method to multiple rates (as it is
announced in the invitation to tender. In
the first case, all successful bids are taken
at the same rate, in principle, the marginal
rate of the tender. In the second case, the
banks are paid at rates corresponding to
each of their bids.
After opening of tenders and tender, the
BRB notify each bidder bank amounts it
can deposit and the interest rate that will
be applied. The total amount is debited
from the current account on the date
value specified in the tender. At
redemption date announced in the tender,
the current account of the bank will be
credited the full amount of the deposit
plus interest.
Quick tenders
At its own initiative, the BRB can lend or
resume liquidity to banks by means of
quick tenders which all the steps are
performed on the same day. The duration
of these operations is determined by the
BRB. Participation in quick tenders may
be limited to certain banks.
2.2.2. Marginal lending facility

11
BRB provides banks a permanent
marginal lending rate at which they can
use in their initiative to get cash overnight
in money market interest rates (currently
the weighted average interest rate on
Treasuries to 13 weeks in the previous
issue) plus a previously announced
margin (currently three percentage
points). This facility is granted, if at the
end of the day, the current account
balance from one bank to the debtor BRB
is provided it has provided adequate
security to the BRB.
The amount allocated under this facility is
credited the same day informed of the
bank account. The repayment of this
amount and the interest payments occur
on the next business day. If deemed
necessary, the BRB may set limits to use
this facility. These limits can be global or
bank and focus on their loan amounts or
the number of days of use per week.
In addition to these instruments, the BRB
may exceptionally grant a loan to a bank
or a financial institution in the framework
of bilateral agreements.
3. OVERVIEW OF
INTERNATIONAL AND EAST
AFRICAN COMMUNITY
ECONOMIC ENVIRONMENT
3.1. International Economic
Environment
According to the publication of the IMF in
July 2013, the growth rate of world
production fell in 2012 to stand at 3.1%,
compared with 3.9% in 2011.
Table1. Evolution and prospects for economic growth
2011 2012 Forecast for 2013
mondial Global GDP growth 3.9 3.1 3.1
Developed countries 1.7 1.2 1.2
United States 1.8 2.2 1.7
Euro zone 1.5 -0.6 -0.6
Japan -0.6 1.9 2.0
Emerging and developing countries 6.2 4.9 5.0
Asia excluding China and India 6.1 6.1 5.9
China 9.3 7.8 7.8
India 6.3 3.2 5.6
Latin America and the Caribbean 4.6 3.0 3.0
Brazil 2.7 0.9 2.5

12
Sub-Saharan Africa 5.4 4.9 5.1
South Africa 3.5 2.5 2.0
Source : IMF, World Economic Outlook, An update of the key WEO projections, July 2013
In all developed countries, growth has
decelerated in 2012, standing at 1.2%
against 1.7% in 2011. In particular, the
countries of the Eurozone experienced the
recession and economic activity declined,
with a growth rate of 0.6% against 1.5%
in 2011. Germany has also been affected
by the debt crisis in Europe and the
growth rate declined, falling to 0.9%,
compared with 3.1% in 2011.
Contrary to the decrease observed in the
Eurozone, Japan performed well, the
growth rate has improved and stood at
1.9% while it was 0.6% in 2011. Similarly,
the United States recorded a growth rate
of 2.2% in 2012 against 1.8% achieved in
2011.
As for emerging and developing
economies, the rate of growth has also
slowed down and is 4.9% against 6.2% in
2011. In 2012, the growth rate was 7.8%
against 9.3% in China and 3.2% against
6.3% in India. Asia excluding China and
India kept its dynamic economy with a
growth rate of 6.1% mainly due to the
expansion of exports of manufactured
goods.
The countries of Latin America and the
Caribbean have experienced deceleration
in the rate of economic growth, reaching
3.0% against 4.6% in 2011. This
slowdown in growth is mainly due to
lower commodity prices on international
markets. In Brazil, the economy recorded
a growth rate of 0.9% in 2012 when it
stood at 2.7% the previous year. Sub-
Saharan Africa has experienced a
slowdown in growth (4.9% against 5.4%)
which is explained by the decline in
commodity prices.
During the first half of 2013, the U.S.
economy recorded a growth rate of 1.1%
and 1.7% respectively in the first and
second quarter. It is expected that the U.S.
will experience a growth rate of 1.7% in
2013. This projected decline is largely
explained by the fiscal contraction and
poor performance in the international
environment.
In the Eurozone, the economy is still
constrained by the debt crisis with weak
demand and the credit market. During the
first quarter of 2013, the growth rate fell
by 1.1% while it fell by 0.9% in the second
13
quarter. It is expected a growth rate of -
0.6% in 2013 due to the lingering effects
of the crisis.
The Japanese economy recorded growth
rates of 4.1% and 2.9% in the first and the
second quarter of 2013 respectively. It is
expected a growth rate of 2.0% in 2013
and recorded performances are mainly
resulting from the rising private
consumption and net exports following
the implementation of an accommodative
monetary policy, a stimulating fiscal
policy and structural reforms conducive
to the acceleration of economic growth.
In emerging and developing countries,
growth is driven primarily by economic
activity in developing countries in Asia
with expected growth rate of 6.9% in
2013 thanks to strong performances by
China and India.
During the first half of 2013, China's
economy grew by 7.7 and 7.6% in the first
and second quarter. It is expected an
annual growth rate of 7.8% in 2013.
In India, the growth rate was 4.8% and
5.1% in the first and second quarter
respectively. Projections show that
economic activity will record a growth
rate of 5.6% in 2013. The Outlook for the
year 2013 shows that emerging and
developing countries will experience a
growth rate of 5.0% against 4.9% in 2012.
In emerging economies, this growth will
be mainly influenced by the Chinese
economy through the growth of exports
and rising domestic demand, as well as
the good performance expected in India
(5.6 vs. 3.2%), in the Brazil (2.5 versus
0.9%).
However, at the time where growth
continues in some developing Asian
countries, it manifests a turbulence of
financial markets partially caused by the
slackening in policies of quantitative
easing by the Federal Reserve Bank.
In sub-Saharan Africa, improved
economic policies and investment levels
have promoted the dynamics of economic
activity despite lower commodity prices
on international markets and the decline
in external demand. The growth rate
expected in 2013 is 5.1% thanks to the
expected development in the field of
infrastructure, services and industries.

14
3.2. Evolution of economic
activity in the EAC
countries
3.2.1. Economic growth
Compared to the year 2011, economic
growth in 2012 has improved slightly to
Kenya with a rate of 4.7 compared to
4.4% and Tanzania with a rate of 6.9
against 6.4 per cent. In Burundi, the
growth rate in 2012 remained at 4.2% as
in 2011. On the other hand, it has declined
in Uganda and settled at 2.6 against 6.7%
and in Rwanda with a rate of 7.7 against
8.3% in 2011.
Table 2 GDP growth in the EAC countries
Growth rate of GDP in the EAC countries
Year Burundi Rwanda Uganda Tanzania Kenya
2007 4.8 5.5 8.6 7.1 7.0
2008 5.0 11.2 7.7 7.4 1.5
2009 3.5 4.1 7.0 6.0 2.7
2010 3.8 7.2 6.1 7.0 5.8
2011 4.2 8.3 6.7 6.4 4.4
2012 4.2 8.0 2.6 6.9 4.7
2013 4.5 7.5 4.8 6.8 5.8
Source : IMF, World Economic Outlook, April 2013
The outlook for 2013 announces an
expansion of economic activity in most
countries of the EAC. Despite their decline
compared to 2012, Rwanda and Tanzania
will experience the highest growth rates
of 7.6 and 6.8% respectively in 2013. For
Burundi and Kenya, it is expected growth
rates of 4.5 and 4.9% respectively.
3.2.2. Evolution of inflation
Compared to the last quarter of 2012, the
average inflation rate in the first quarter
of 2013 decreased significantly for EAC
countries except Kenya and Rwanda.
Indeed, during the first quarter of 2013,
the average inflation rate fell from 13.1 to
7.6% in Burundi, from 4.9 to 4.1% in
Uganda, 12.4 to 10.4 % in Tanzania, from
15
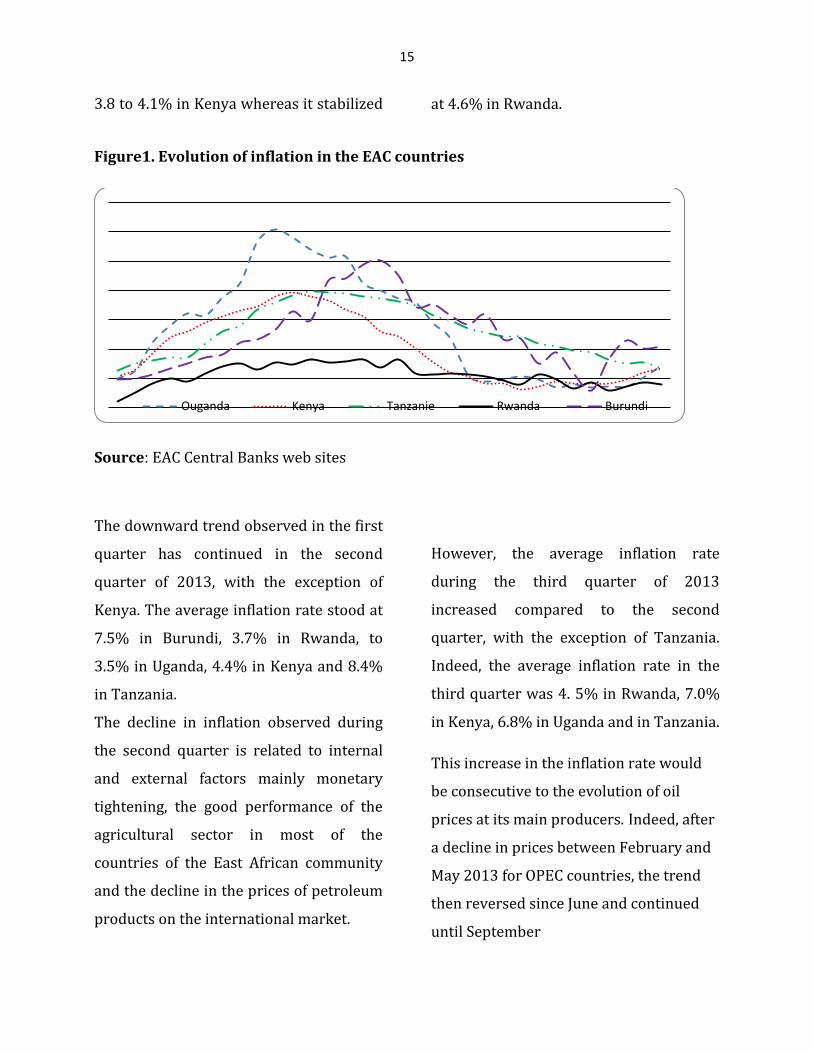
3.8 to 4.1% in Kenya whereas it stabilized at 4.6% in Rwanda.
Figure1. Evolution of inflation in the EAC countries
Source: EAC Central Banks web sites
The downward trend observed in the first
quarter has continued in the second
quarter of 2013, with the exception of
Kenya. The average inflation rate stood at
7.5% in Burundi, 3.7% in Rwanda, to
3.5% in Uganda, 4.4% in Kenya and 8.4%
in Tanzania.
The decline in inflation observed during
the second quarter is related to internal
and external factors mainly monetary
tightening, the good performance of the
agricultural sector in most of the
countries of the East African community
and the decline in the prices of petroleum
products on the international market.
However, the average inflation rate
during the third quarter of 2013
increased compared to the second
quarter, with the exception of Tanzania.
Indeed, the average inflation rate in the
third quarter was 4. 5% in Rwanda, 7.0%
in Kenya, 6.8% in Uganda and in Tanzania.
This increase in the inflation rate would
be consecutive to the evolution of oil
prices at its main producers. Indeed, after
a decline in prices between February and
May 2013 for OPEC countries, the trend
then reversed since June and continued
until September
Ouganda Kenya Tanzanie Rwanda Burundi

16
Figure 2 : Reference price for oil in OPEC countries (USD)
Source: Site OPEC
Expectations of a decline in inflation in
the fourth quarter are likely to be
compromised by the perturbations
observed in the supply of petroleum
products in the Middle East and
expectations of increased U.S. demand
that were at the origin of the evolution
observed in the second quarter. In
Burundi, this optimism would also be
compromised by the revision of
administered prices.
3.2.3. Changes in interest rates
The tight monetary policy adopted by
most central banks of the EAC which is
evidenced by the increase in the
refinancing rate has affected the rates
charged by commercial banks.
a. Central Banks rates1
In the first quarter of 2013, the Central
Bank of Burundi, Kenya and Uganda have
slightly increased their intervention rate
while these latter remained constant for
Rwanda and Tanzania. This rate was
averaged at 11.7 against 14.0% in
Burundi, to 15.3 compared with 16.5% in
Uganda to 11.0 compared to 11.7% in the
Kenya. As regards Rwanda and Tanzania,
these rates have remained at 11.5 and
12.0% respectively.
1 For reasons of comparability of instruments, the levels
considered are those used by central banks for refinancing operations on a daily basis. This is the rate on the marginal lending facility in Burundi, the discount rate for Uganda, Tanzania and Rwanda and the Central Bank Rate for Kenya.
Prix du baril en USD pour les pays de l'OPEP; déc.-16;
106,55
Prix du baril en USD pour les pays de l'OPEP; janv.-
17; 109,28
Prix du baril en USD pour les pays
de l'OPEP; févr.-17; 112,75
Prix du baril en USD pour les pays de l'OPEP; mars-
17; 106,44 Prix du baril en
USD pour les pays de l'OPEP; avr.-17;
101,05
Prix du baril en USD pour les pays de l'OPEP; mai-17;
100,65
Prix du baril en USD pour les pays de l'OPEP; juin-17;
101,03
Prix du baril en USD pour les pays de l'OPEP; juil.-17;
104,45
Prix du baril en USD pour les pays
de l'OPEP; août-17; 107,52
Prix du baril en USD pour les pays de l'OPEP; sept.-
17; 108,73
17
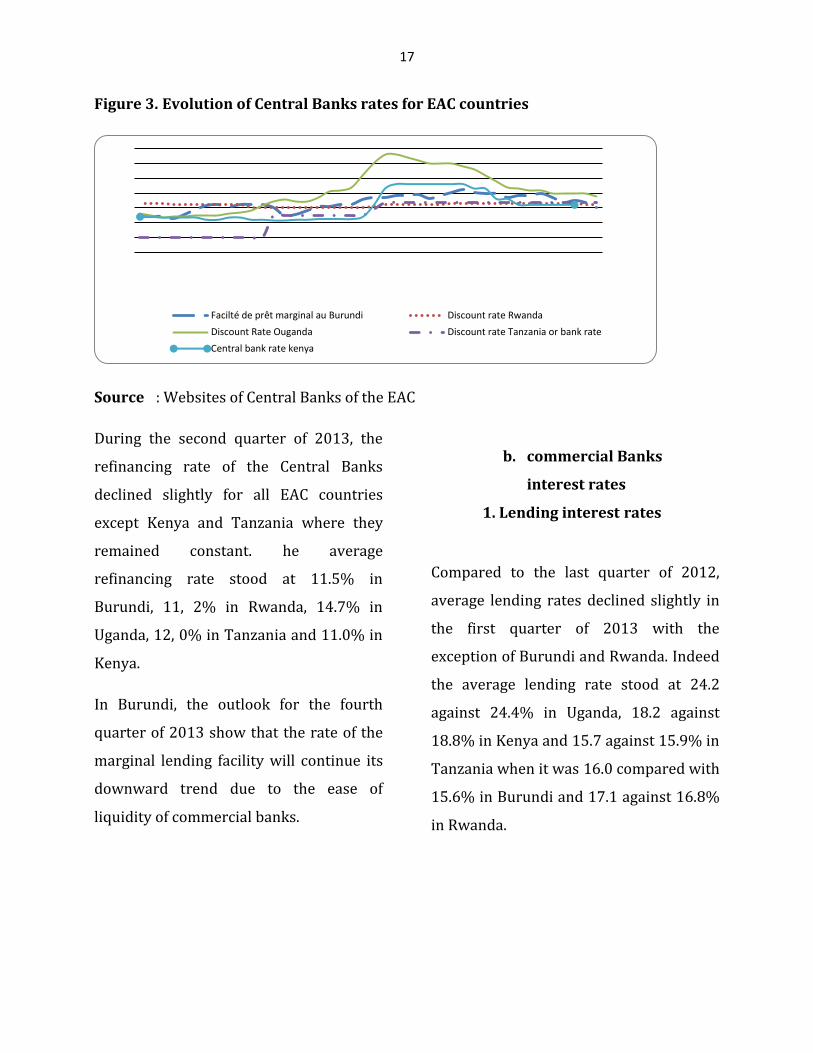
Figure 3. Evolution of Central Banks rates for EAC countries
Source : Websites of Central Banks of the EAC
During the second quarter of 2013, the
refinancing rate of the Central Banks
declined slightly for all EAC countries
except Kenya and Tanzania where they
remained constant. he average
refinancing rate stood at 11.5% in
Burundi, 11, 2% in Rwanda, 14.7% in
Uganda, 12, 0% in Tanzania and 11.0% in
Kenya.
In Burundi, the outlook for the fourth
quarter of 2013 show that the rate of the
marginal lending facility will continue its
downward trend due to the ease of
liquidity of commercial banks.
b. commercial Banks
interest rates
1. Lending interest rates
Compared to the last quarter of 2012,
average lending rates declined slightly in
the first quarter of 2013 with the
exception of Burundi and Rwanda. Indeed
the average lending rate stood at 24.2
against 24.4% in Uganda, 18.2 against
18.8% in Kenya and 15.7 against 15.9% in
Tanzania when it was 16.0 compared with
15.6% in Burundi and 17.1 against 16.8%
in Rwanda.
Facilté de prêt marginal au Burundi Discount rate Rwanda
Discount Rate Ouganda Discount rate Tanzania or bank rate
Central bank rate kenya

18
Figure4. Changes in lending rates in the EAC
Source : websites EAC Central Banks
While the average debtor interest rates
continued the uptrend in Burundi and
Rwanda, they showed a slight decrease in
Uganda, Tanzania and Kenya in the
second quarter of 2013. End of June 2013,
the average borrowing interest rates were
16.08% in Burundi, to 17.5% in Rwanda,
to 22.6% in Uganda, to 16.9% in Kenya
and 15, 5% in Tanzania.
b.2. deposit interest rates
Compared to the level of the first quarter
of 2013, credit rates increased slightly
during the second quarter for all of the
countries of the East African community.
Figure5. Evolution of deposit rates

19
Source : websites EAC Central Banks
From March to late June 2013, the average
deposit rate increased slightly from
8.86% 8.95% in Burundi, 10.35 to 10,
38% in Rwanda and 6.54 to 6.65% to
Kenya. On the other hand, the average
deposit rate declined slightly, falling from
11.87 to 11.57% and 8.79 to 8.65%
respectively for Uganda and Tanzania.
3.2.4 Evolution of exchange rate
YOY, most of the countries of the East
African Community currencies
depreciated against the U.S. dollar during
the first quarter of 2013 with the
exception of the Tanzanian Shilling which
appreciated by 0.20%. The Burundian
currency depreciated by 13%, that of
Rwanda by 4.7%, 3.1% for Kenya and that
for Uganda by 10.5%.
Figure6. Rate of depreciation of EAC currencies against the U.S. dollar
Source : websites EAC Central Banks
During the second quarter of 2013, all the
EAC currencies depreciated against the
U.S. dollar. Year on year, the depreciation
rate was 10.2% for the Franc Burundi,
5.2% for the Rwandan Franc, 3.8% for the
Uganda Shilling, 1.4% for the Kenyan
Shilling and 1.3% for the Tanzanian
Shilling.
For the third quarter of 2013, the
Burundian currency and the Ugandan
Shilling appreciated by 0.8% and 0.3%
respectively. On the other hand, the
Kenyan Shilling depreciated by 2.3%, the
Tanzanian Shilling by 0.5% and the
Rwandan Franc by 1.8%.
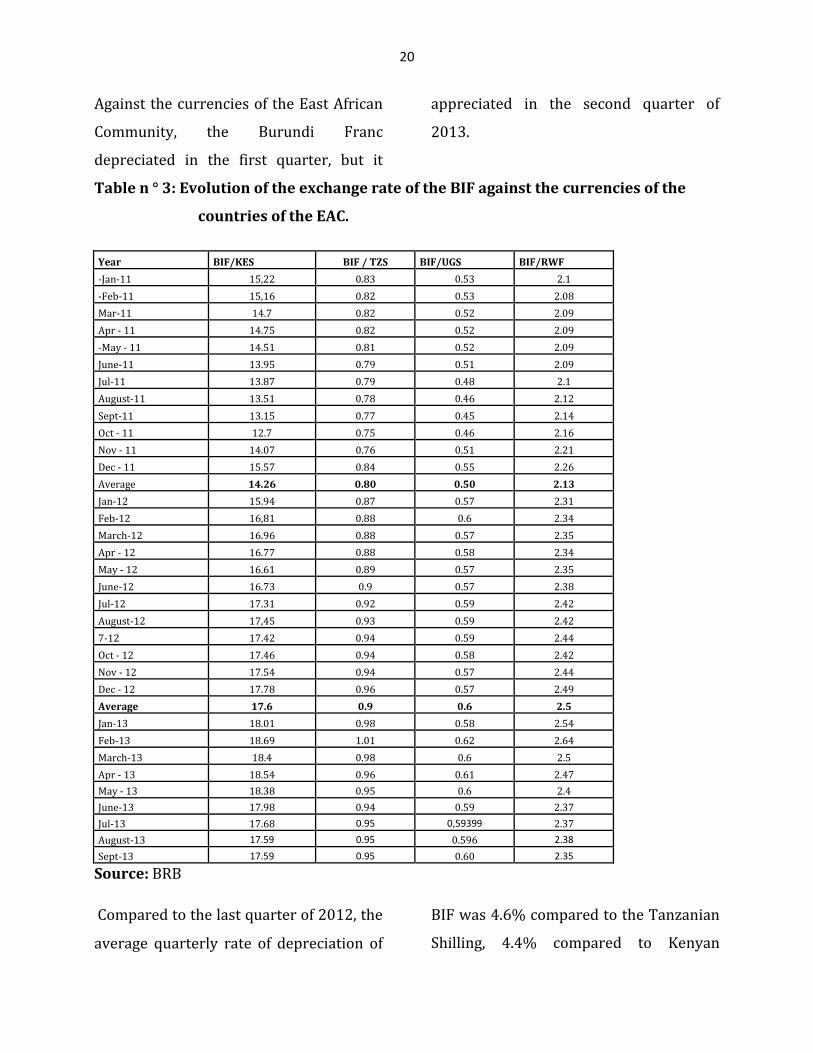
20
Against the currencies of the East African
Community, the Burundi Franc
depreciated in the first quarter, but it
appreciated in the second quarter of
2013.
Table n ° 3: Evolution of the exchange rate of the BIF against the currencies of the
countries of the EAC.
Year BIF/KES BIF / TZS BIF/UGS BIF/RWF -Jan-11 15,22 0.83 0.53 2.1 -Feb-11 15,16 0.82 0.53 2.08 Mar-11 14.7 0.82 0.52 2.09 Apr - 11 14.75 0.82 0.52 2.09 -May - 11 14.51 0.81 0.52 2.09 June-11 13.95 0.79 0.51 2.09 Jul-11 13.87 0.79 0.48 2.1 August-11 13.51 0.78 0.46 2.12 Sept-11 13.15 0.77 0.45 2.14 Oct - 11 12.7 0.75 0.46 2.16 Nov - 11 14.07 0.76 0.51 2.21 Dec - 11 15.57 0.84 0.55 2.26 Average 14.26 0.80 0.50 2.13 Jan-12 15.94 0.87 0.57 2.31 Feb-12 16,81 0.88 0.6 2.34 March-12 16.96 0.88 0.57 2.35 Apr - 12 16.77 0.88 0.58 2.34 May - 12 16.61 0.89 0.57 2.35 June-12 16.73 0.9 0.57 2.38 Jul-12 17.31 0.92 0.59 2.42 August-12 17,45 0.93 0.59 2.42 7-12 17.42 0.94 0.59 2.44 Oct - 12 17.46 0.94 0.58 2.42 Nov - 12 17.54 0.94 0.57 2.44 Dec - 12 17.78 0.96 0.57 2.49 Average 17.6 0.9 0.6 2.5 Jan-13 18.01 0.98 0.58 2.54 Feb-13 18.69 1.01 0.62 2.64 March-13 18.4 0.98 0.6 2.5 Apr - 13 18.54 0.96 0.61 2.47 May - 13 18.38 0.95 0.6 2.4 June-13 17.98 0.94 0.59 2.37 Jul-13 17.68 0.95 0,59399 2.37 August-13 17.59 0.95 0.596 2.38 Sept-13 17.59 0.95 0.60 2.35
Source: BRB
Compared to the last quarter of 2012, the
average quarterly rate of depreciation of
BIF was 4.6% compared to the Tanzanian
Shilling, 4.4% compared to Kenyan

21
Shilling, 4.7% compared to the Ugandans
Shilling and 4.5% compared to the
Rwandan franc.
Compared to the first quarter of 2013, BIF
has appreciated against all EAC currencies
during the second quarter of 2013.
Indeed, BIF has appreciated by 0.4%
against the Kenyan Shilling, 4.0%
compared to the Tanzanian Shilling, 0, 0
9% compared to Ugandan Shilling and
5.7% compared to the Rwandan Franc.
During the third quarter of 2013, BIF has
appreciated by 3.7% against the Kenyan
Shilling, by 0.002% to the Tanzanian
Shilling, 0.6% to Ugandan Shilling and
2.0% from the Rwandan Franc.
4. OVERVIEW OF THE FINANCIAL
AND ECONOMIC SITUATION IN
BURUNDI
The analysis of the national economic
situation looks at the evolution of
economic activity in the real sector,
external sector, monetary sector and
public finance.
4.1. Production and prices
In Burundi, the growth of GDP stabilized
at 4.2% in 2012.
Figure 7 : Evolution of the inflation rate YoY
Source: BRB
However, the observed inflationary
pressures are eased in 2013. Indeed, the
first quarter of 2013 has been
characterized by a deceleration of
inflation, whose rate stood at 5.9% at end
March 2013 compared with 24.5%
Inflation globale inflation alimentaire inflation hors alimentaire
22
observed in the same month of the year
2012. The annual inflation rate dropped
significantly in the month of April 2013, at
3.0% compared with 25.2% in the same
month the previous year.
In general, the average inflation rate has
declined significantly during the first half
of 2013. The rate was 7.6% against 22.7%
in the same quarter of 2012. This
decrease was largely straight part to the
removal of taxes on certain foods.
In addition, some production sectors
have performed well during the first half
of the year. Despite the decline in coffee
production over the previous year, tea
production grew by 9.0% in the first half
of 2013 due to good rainfall conditions
combined with the use of fertilizers.
Economic activity grew at the industry
level in the first two quarters of 2013. The
average industrial production index rose
by 7.4% compared to the same period of
2011. This increase was mainly
influenced by the food industry that grew
by 8.75% and the industry of building
materials with an increase of 28.3%.
However, economic activity in some
sectors of the industry notably decreased
including the chemical industry, the
production of paints, the oxygen and
plastic lockers.
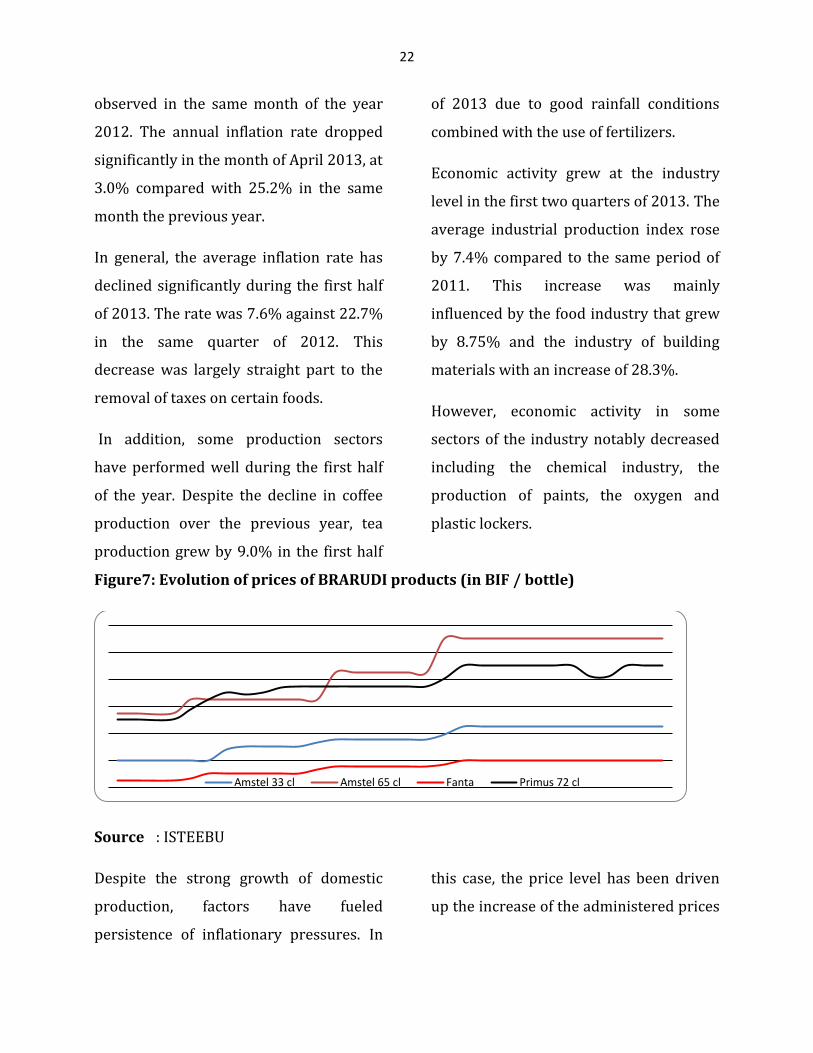
Figure7: Evolution of prices of BRARUDI products (in BIF / bottle)
Source : ISTEEBU
Despite the strong growth of domestic
production, factors have fueled
persistence of inflationary pressures. In
this case, the price level has been driven
up the increase of the administered prices
Amstel 33 cl Amstel 65 cl Fanta Primus 72 cl
23
(products BRARUDI, water and electricity,
petroleum products, etc.).
Since the end of May 2013, the average
price of Amstel 65cl rose from 1500 to
1700 BIF, the lemonade was increased
from 500 to 600 BIF while that of Primus
went from 1150 to 1200 BIF, which
influenced the rise in prices of certain
other consumer products.
In addition, the increase in prices has also
been fueled by reviewed upward in
October 2012 and March 2013 of the price
at the pump for gasoline and other
petroleum products
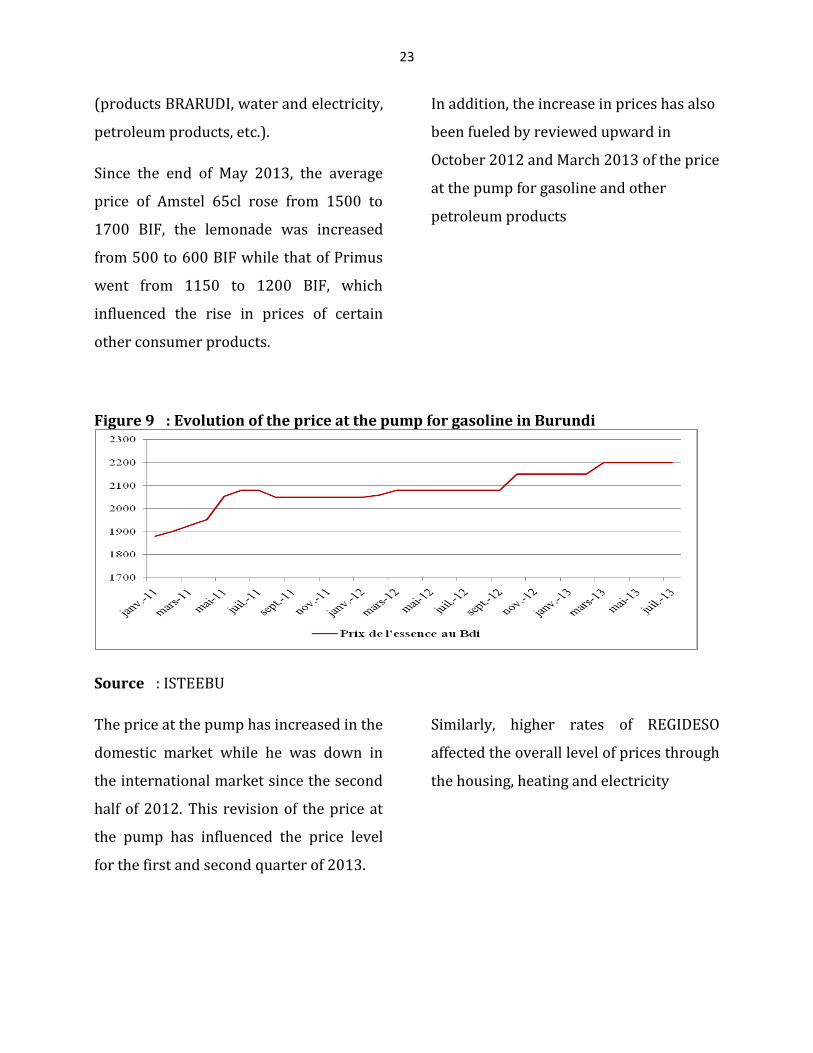
Figure 9 : Evolution of the price at the pump for gasoline in Burundi
Source : ISTEEBU
The price at the pump has increased in the
domestic market while he was down in
the international market since the second
half of 2012. This revision of the price at
the pump has influenced the price level
for the first and second quarter of 2013.
Similarly, higher rates of REGIDESO
affected the overall level of prices through
the housing, heating and electricity
24
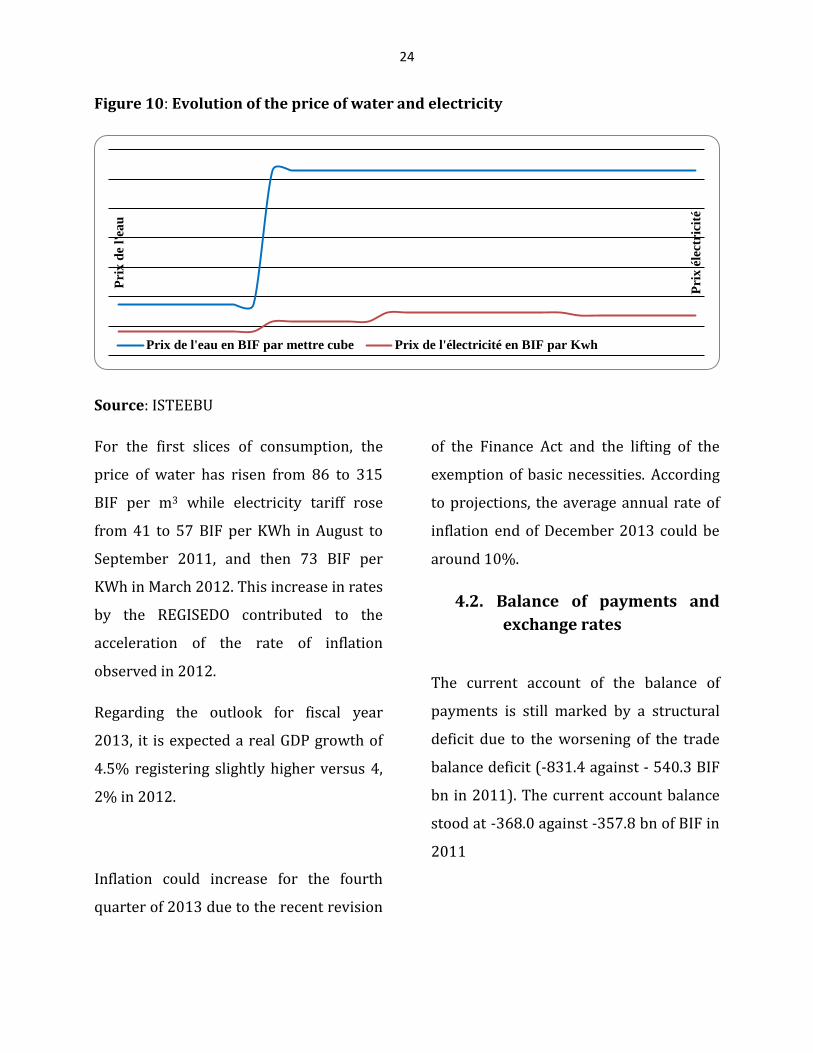
Figure 10: Evolution of the price of water and electricity
Source: ISTEEBU
For the first slices of consumption, the
price of water has risen from 86 to 315
BIF per m3 while electricity tariff rose
from 41 to 57 BIF per KWh in August to
September 2011, and then 73 BIF per
KWh in March 2012. This increase in rates
by the REGISEDO contributed to the
acceleration of the rate of inflation
observed in 2012.
Regarding the outlook for fiscal year
2013, it is expected a real GDP growth of
4.5% registering slightly higher versus 4,
2% in 2012.
Inflation could increase for the fourth
quarter of 2013 due to the recent revision
of the Finance Act and the lifting of the
exemption of basic necessities. According
to projections, the average annual rate of
inflation end of December 2013 could be
around 10%.
4.2. Balance of payments and
exchange rates
The current account of the balance of
payments is still marked by a structural
deficit due to the worsening of the trade
balance deficit (-831.4 against - 540.3 BIF
bn in 2011). The current account balance
stood at -368.0 against -357.8 bn of BIF in
2011
Pri
x é
lectr
icit
é
Pri
x d
e l'
eau
Prix de l'eau en BIF par mettre cube Prix de l'électricité en BIF par Kwh

25
Figure 11 : Evolution of the trade balance
Source: BRB
With regard to external inputs, the
balance of current transfers in 2012
improved significantly to stand at 644.1
bn of BIF against 332.3 bn of BIF recorded
in 2011.
Figure12: Evolution of the components of the current account
Source : BRB
The increase in current transfer surplus is
not yet able to fully finance the deficit of
the trade balance of goods and the
services. Furthermore, capital and
financial transactions that would
normally finance the current account
deficit of the balance of payments is still
very with regard to the magnitude of the
latter.
Forecasts for 2013 show that trade
balance would show a deficit of 649.1 bn
BIF while the deficit of the current
account could be at 586.1 bn BIF. Thus,
the balance of the current account
Biens et services Transferts courants Balance courante

26
remains structural deficit and borrowing
resulting exerts strong pressure on
reserves and the exchange rate.
Similarly, in 2013, capital transfers would
display a lower amount compared to that
recorded in the year 2012 at 110.8
compared to 85.5 bn BIF respectively.
Regarding the exchange rate policy, the
national currency depreciated sharply in
early 2013. The reference exchange rate
reached a peak of 1717.55 BIF / USD on
February 28, 2013 while it was 1546.05
on 31 December 2012. Regarding the
foreign exchange market, the BRB has
taken measures to develop the interbank
market and to stabilize the exchange rate.
These measures have focused on :
1. the establishment of the Interbank
Currency Market (MID);
2. the setting of a fluctuation
in the exchange rate of ± 1% around
the reference rate on operations of
purchase and sale of commercial
banks and exchange offices;
3. Liberalization of the foreign
currency accounts of residents
(deposits and withdrawals
unlimited amounts).
Thus, the exchange rate reference which
was 1586.7 BIF / USD in February 2013
stood at 1537.6 BIF / USD at the end of
June when the rate on the parallel market
has returned from 1707.7 BIF/USD in
February 2013 to 1548.8 BIF / USD at the
end of June 2013.
4.3. Public Finance
The year 2012 was marked by a more
pronounced budget deficit than in the
previous year (-119.7 bn BIF against -90.1
bn BIF in 2011). At the end of March
2013, the overall balance of State has a
surplus of 14.2 against 36.7 bn BIF the
same period of 2012. For the second
quarter, the balance of the General
Treasury Account has an accumulated
deficit of $ 35.1 bn BIF against 38, 02 bn
BIF recorded in the same period of 2012.

27
Table 4: Evolution of the budget deficit (in BIF)
Revenue and Grants Total expenditures Deficit
2010 631 243,10 673 537,60 -42 294,50
2011 678 889,40 768 962,40 -90 073,00
2012 705 729.5 825 482,60 -119 753,10
2013 1 314 041,3 1,368 916.2 -54 874,87
Source: BRB
To finance its deficit, the government has
resorted to domestic borrowing mainly in
the form of Treasury securities and
advances from the Central Bank.
Figure13: Evolution of domestic financing of the deficit (in MBIF)
Source: BRB
Outstanding ordinary advances which
were 82 billion at end-December 2011
reached 155 billion BIF at end-December
2012 while the ceiling was set at 36
billion BIF.
Surge of advances is related to the low
rate of disbursement of budget support
(57.4% of expected support) and the lack
of liquidity in the market which has
resulted in the decrease of subscriptions
to the Treasury securities by banks.
For 2013, the new budget law foresees a
budget deficit (including grants) of 54.8
billion BIF while the overall deficit
excluding grants will total 657.04 billion
BIF. To fill this gap, the government
anticipates net domestic and foreign
financing of 24, 2 billion BIF and 30.6
Avances ordinaires BT et OT banques commerciales Total des BT et OT
28
billion BIF respectively. The maximum
advance is set at 27.3 billion BIF.
4.4. The money market
The interbank market has been more
active in 2012. Indeed, the volume of
interbank transactions increased
significantly from 59.2 to 72.1 billion BIF
the second half of 2011 to the second half
of 2012. However, the banking system
remained marked by the lack of liquidity
which resulted in the more expanded use
of the resources of the Central Bank.
However, the situation was reversed in
early 2013. Bank liquidity has improved
and banks have reduced their use of
resources of the Central Bank. As a result,
all interest rates in the money market
have a downward trend during this
period.
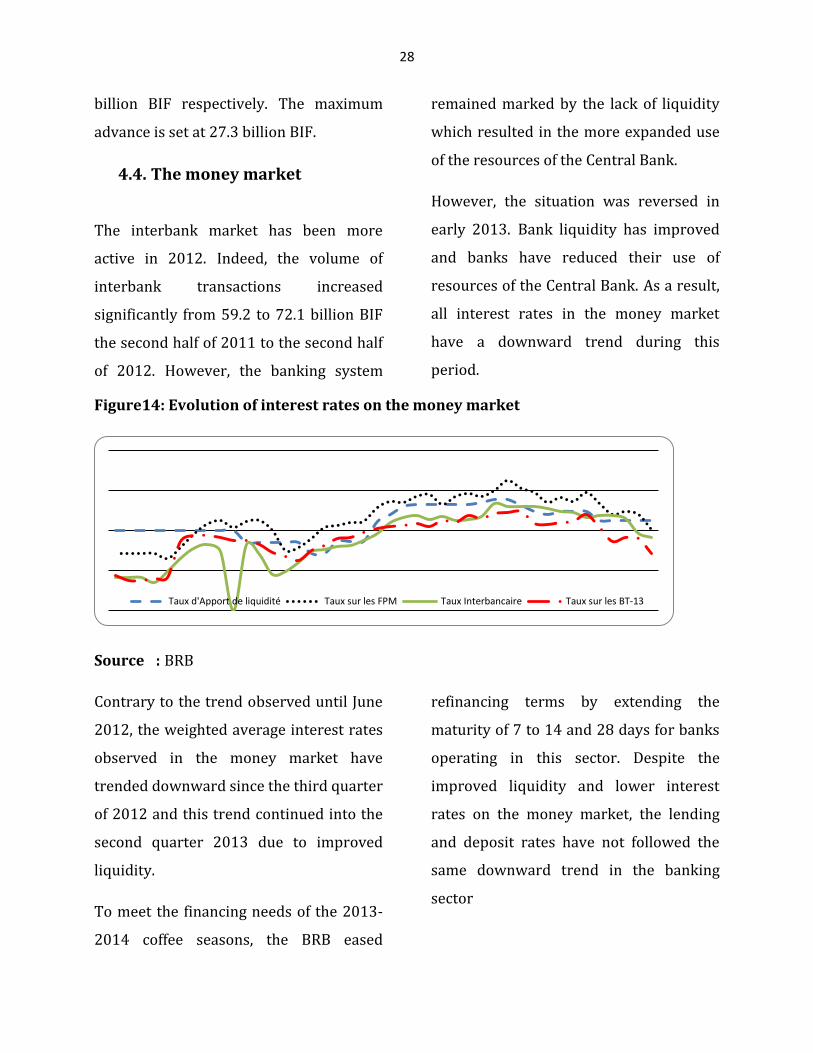
Figure14: Evolution of interest rates on the money market
Source : BRB
Contrary to the trend observed until June
2012, the weighted average interest rates
observed in the money market have
trended downward since the third quarter
of 2012 and this trend continued into the
second quarter 2013 due to improved
liquidity.
To meet the financing needs of the 2013-
2014 coffee seasons, the BRB eased
refinancing terms by extending the
maturity of 7 to 14 and 28 days for banks
operating in this sector. Despite the
improved liquidity and lower interest
rates on the money market, the lending
and deposit rates have not followed the
same downward trend in the banking
sector
Taux d'Apport de liquidité Taux sur les FPM Taux Interbancaire Taux sur les BT-13
29
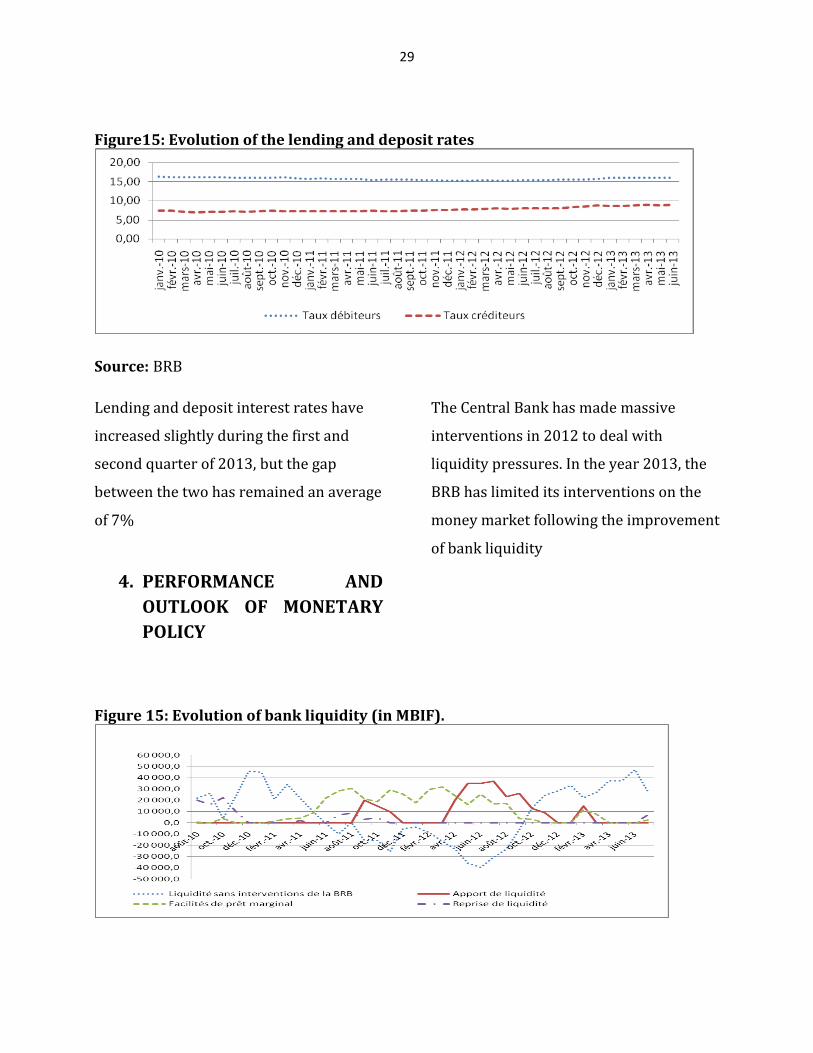
Figure15: Evolution of the lending and deposit rates
Source: BRB
Lending and deposit interest rates have
increased slightly during the first and
second quarter of 2013, but the gap
between the two has remained an average
of 7%
4. PERFORMANCE AND
OUTLOOK OF MONETARY
POLICY
The Central Bank has made massive
interventions in 2012 to deal with
liquidity pressures. In the year 2013, the
BRB has limited its interventions on the
money market following the improvement
of bank liquidity
Figure 15: Evolution of bank liquidity (in MBIF).
30
Source : BRB
The coefficient and the period of reserve
requirements were respectively
maintained at 3% of deposits collected in
BIF currency and a calendar month.
Despite the tension of liquidity observed
over a large part of the year 2012, the
banking system overall met the standard
of minimum reserves. A monthly average
surplus of 5 495.9 million BIF has been
reached by the entire banking system
thanks to the interventions of the Central
Bank during the period of funding of the
coffee year 2012-2013.
For the first half of 2013, banks have
largely met the standard of reserve
requirements with an average monthly
surplus of 16 514,2 MBIF. This situation is
the result of an ease of liquidity in the
banking sector from the month of April
2013 due to the increase in government
expenditure subsequent to the receipt of
budget support.
The monetary base has remained within
the limits of quantitative targets in the
economic and financial program despite
massive interventions in favor of
commercial banks and major advances
granted to the State in 2012.
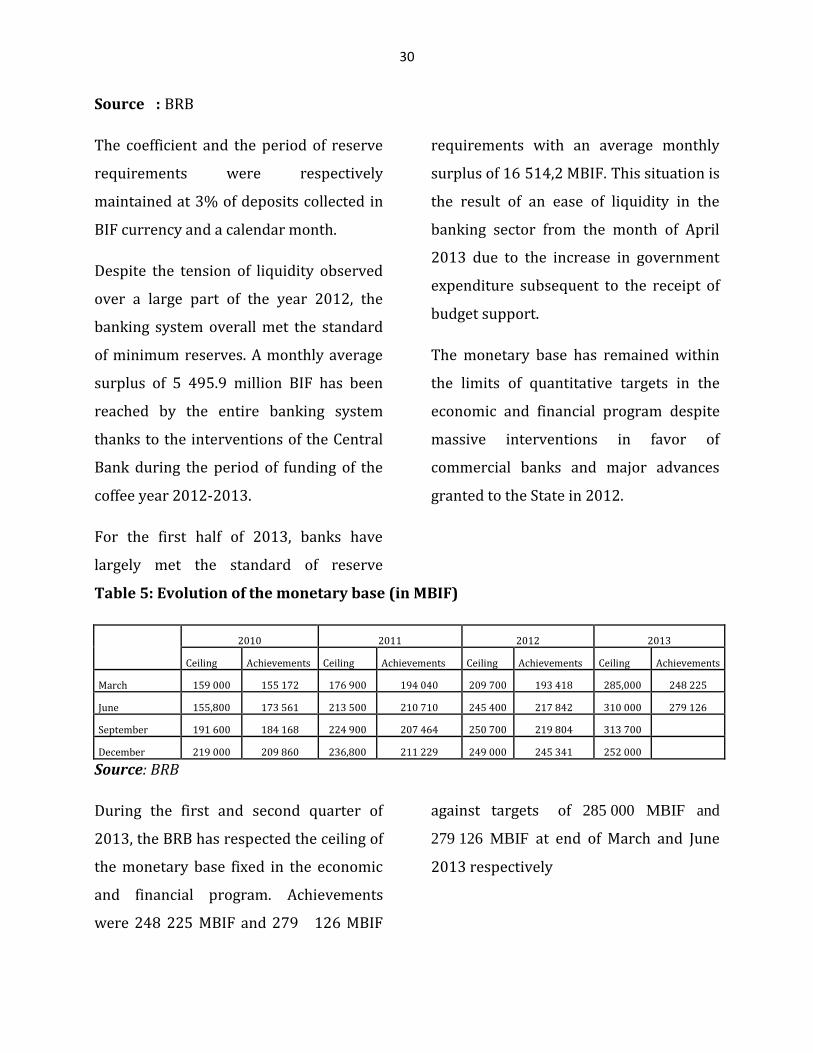
Table 5: Evolution of the monetary base (in MBIF)
2010 2011 2012 2013
Ceiling Achievements Ceiling Achievements Ceiling Achievements Ceiling Achievements
March 159 000 155 172 176 900 194 040 209 700 193 418 285,000 248 225
June 155,800 173 561 213 500 210 710 245 400 217 842 310 000 279 126
September 191 600 184 168 224 900 207 464 250 700 219 804 313 700
December 219 000 209 860 236,800 211 229 249 000 245 341 252 000
Source: BRB
During the first and second quarter of
2013, the BRB has respected the ceiling of
the monetary base fixed in the economic
and financial program. Achievements
were 248 225 MBIF and 279 126 MBIF
against targets of 285 000 MBIF and
279 126 MBIF at end of March and June
2013 respectively

31
By controlling the monetary base, the
Central Bank was able to contain the
growth of the money supply to 5.9%.
Table 6: Evolution of the money supply and its counterparts (in BIF)
2008 2009 2010 2011 2012 March-13 June-13
M2 443 117,80 530 770,30 638 901,10 674 511,30 745 206.50 756 889,90 780 038,20
Net external assets 181 196.60 168 753,00 140 783,00 63 289,90 28 287,30 37 689,30 5 820,50
Domestic credit 448 134.00 569 196.20 699 683,90 889 567.90 976 145,40 966 308,10 1,010 108,60
Other posts -186 212.80 -207 178,90 -201 565,80 -278 346,50 -259 226.20 -247 107.50 -235 890,90
Growth rate of the counterparties
2009 2010 2011 2012 March-13 June-13
M2 19.8 20.4 5.6 10.5 1.6 3.1
Net external assets -6.9 -16.6 -55.0 -55.3 33.2 -84.6
Domestic credit 27.0 22.9 27.1 9.7 -1.0 4.5
Other net items 11.3 -2.7 38.1 -6.9 -4.7 -4.5
Source: BRB

32
The growth of money supply (10.5%)
was mainly caused by the growth of
domestic credit (9.7%), which has offset
the decline in net foreign assets (-
55.3%).
During the first quarter of 2013, growth
in the money supply was 1.6%,
primarily due to the increase in Net
foreign Assets of 33.2% which exceeded
the decline in domestic credit by 1.0%.
The money supply increased by 3.1% in
the second quarter of 2013. Compared
to the first quarter of 2013
This increase is mainly explained by
growth in domestic credit of 4.5% which
has absorbed the decline of net foreign
assets of 84.6%.
Table 7: Evolution of the base and the money supply (in MBIF)
Achievements forecast
Monetary aggregate Dec - 12
March-13 June-13 Sept-13 March-13 June-13 Sept-13 Dec - 13
Monetary base 245 341 248 225 279 126 277 413 284 700 309 600 313 700 252 000
M2 745 207 754 021 780 038 Not available 754 021 780 038 909 730 730 800
Source: Memorandum of economic and financial policy, August 2013
The outlook shows that the Burundian
economy may record a rate of 4.5% by
2013. The forecast of the average
inflation rate for the second half of the
year 2013 show that it could be around
10%.
The monetary base at the end of
December 2013 is 252 bn BIF. Over the
past two years, the average monetary
multiplier for the fourth quarter was 3.2.
Considering that this assumption is valid
for the fourth quarter of 2013, the
money supply would be at 806.4 bn BIF
at the end of December. The record
shows that the money supply at the end
of August was 797.9 bn BIF; this
achievement is provisional because it
does not account for postal check
account.
5. CONCLUSION AND MONETARY
POLICY
During the first two quarters of 2013,
the BRB was able to contain the
monetary base within the limits set in
the economic and financial program.
The monetary base at end of March was
248 225MBIF for a target of 284 700
MBIF. Similarly, the criterion has been
met at the end of June, the monetary
base was performed at 279 125.9 MBIF
for a target value of 309 600 MBIF.
33
For the same period, inflation fell
significantly due to the exemption of
taxes on products of first necessity. The
average inflation rate for the first
quarter was 7.6% and 7.5% for the
second quarter.
Concerning the second half of 2013,
inflation is likely to exceed the level
achieved in the first half following the
lifting of a measure of exemption of
taxes on certain commodities and the
upward revision of prices of BRARUDI
products, sugar and other goods and
services provided in the 2013 Budget
Review.
In the prospect of the ultimate goal of
price stability, the Central Bank will
continue to use, during the fourth
quarter of 2013, the indirect
instruments at his disposal consisting of
mandatory reserves, liquidity tenders,
and marginal lending facilities. The BRB
will also continue its interventions on
the foreign exchange market.
In this regard, the Central Bank plans to
conduct the following actions during the
fourth quarter of 2013:
1. Continue the regulation of
liquidity through the operations
of tender of liquidity;
2. Maintain the coefficient of
reserve requirements to 3%;
3. Keep the rate of the marginal
lending facility indexed to the
weighted average rate on the 13-
week Treasury Bills plus 3 points
percentage;
5. Ensure compliance with the
ceiling for advances to the State
of 27.3 bn BIF;
6. Continue the determination of
the Exchange rate by market
mechanisms and encourage the
development of the foreign
exchange market
PRESENTATION OF THE MONETARY
POLICY COMMITTEE OF THE BRB
The Monetary Policy Committee (MPC) is,
in most modern central banks, the
decision making body for monetary and
exchange rate policy. Based on economic,
monetary and financial analysis, this
body makes decisions in relation to
monetary policy instruments to
implement to effectively achieve the
objective.
The BRB Monetary Policy Committee was
established by the Service Order No. 38 of
17 December 2012, which defines the
mission and composition.

34
The Monetary Policy Committee's main
tasks :
- Regularly define the monetary policy
strategy adapted to the economic
situation in Burundi ;
- follow the day-to-day
implementation of monetary
policy and evaluate the results ;
- determine the conditions for
intervention by the Central Bank
on the money market and foreign
exchange market;
- Constant monitoring of internal and
external economic conditions to
anticipate shocks that disrupt the
macroeconomic framework in
order to provide, without delay,
adjustment measures to improve
the operational framework of
monetary policy ;
- draft a monetary policy statement
for submission to the General
Council, tracing the development
of the economy, and monetary
policy actions envisaged by the
Central Bank to achieve the
desired level of inflation.
The Monetary Policy Committee of the
BRB is composed by:
- Governor is the Chairman;
- 1st Vice-Governor, who is the Vice-
President;
- The 2nd Vice-Governor, Member ;
- Advisor to the Directorate with
communication in its powers,
Member;
- Head of the Research and Statistics
Department, Member;
- Head of the Monetary and Financial
Markets Service, Member ;
- The Head of Service of Supervision of
Banking and Financial Institutions
and Financial Stability, Member ;
- The Head of Supervision of
Microfinance Service, Non-
Banking Financial Institutions and
financial Inclusion, Member ;
- The Head of Internal Banking
Operations Service, Member ;
- The Head of Banking Service with
overseas Member ;
- The Deputy Head of Research and
Statistics Department, Member.
Besides the members of the Executive
Committee, all other MPC members
form the Technical Committee of
Monetary Policy (TCMP) chaired by
the Head of Research and Statistics
Department or his Deputy in the
absence of the first. The Technical
Secretariat of the Monetary Policy
Committee is provided by the team of
the Research and Statistics
Department.

35
While TCMP must meet at the
beginning of each week, the MPC
meets at the beginning of each month
in regular session convened by the
President or Vice President in the
absence of the first. Having analyzed
and validated the report of the
Technical Committee, MPC shall
submit to the MPC General Council a
draft statement of monetary policy
with an update on the economy and
monetary policy actions envisaged by
the Central Bank to reach the
objective of price stability.


