0 Bank Sohar SAOG Registered office and principal place of business: Bank Sohar Building P.O.Box 44, Hai Al - Mina PC 114, Muscat Sultanate of Oman BANK SOHAR SAOG INTERIM CONDENSED FINANCIAL STATEMENTS FOR THE SIX MONTHS ENDED 30 JUNE 2018
Transcript
0
Bank Sohar SAOG
Registered office and principal place of business: Bank Sohar Building P.O.Box 44, Hai Al - Mina PC 114, Muscat Sultanate of Oman
BANK SOHAR SAOG INTERIM CONDENSED FINANCIAL STATEMENTS
FOR THE SIX MONTHS ENDED 30 JUNE 2018
Bank Sohar SAOG
Page 1 of 2
Board of Directors Report for the six months period ended 30 June 2018
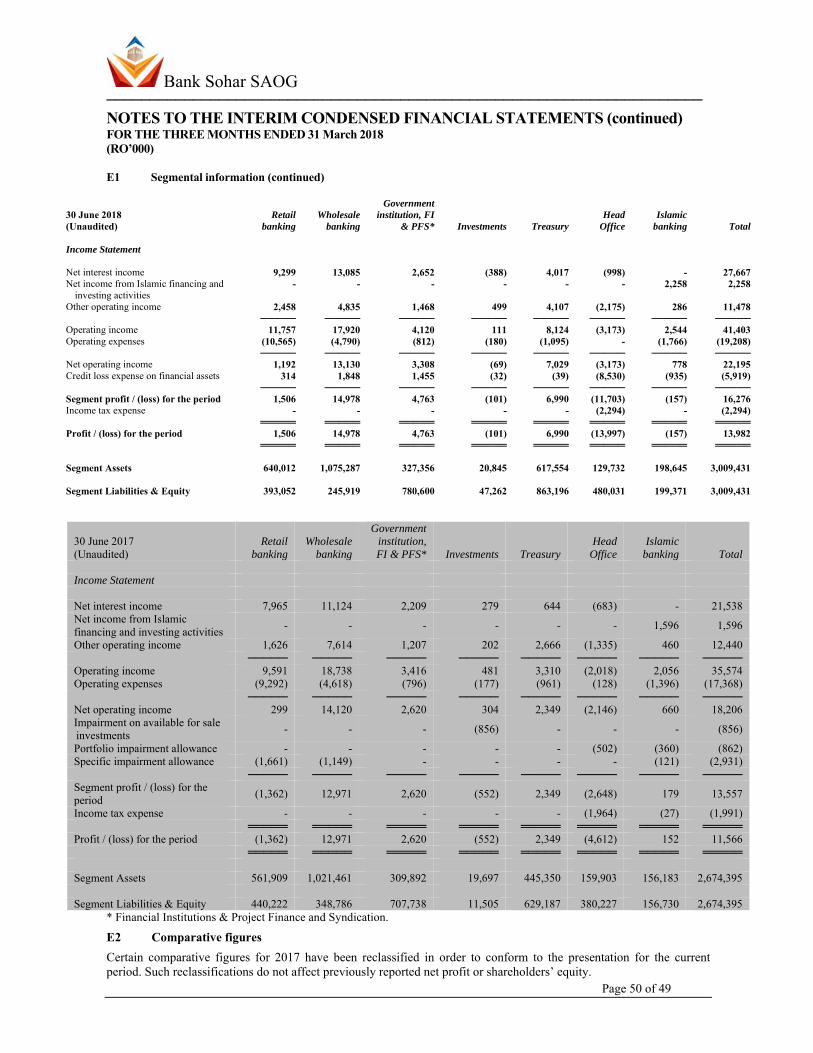
Our Valued Shareholders, On behalf of the Board of Directors of Bank Sohar (SAOG), I am pleased to present the results of the Bank as at 30 June 2018. The Bank’s net profit for the six months ended 30 June 2018 amounted to OMR 13.982 million as compared to OMR 11.566 million during the same period in 2017, a growth of 20.89%. The Bank is continuing with its efforts to achieve sustainable and profitable growth despite the challenges arising out of decline in government spending on infrastructure arising out of lower oil prices. The Bank’s total operating income increased by 16.39% from OMR 35.574 million in the first six months of 2017 to OMR 41.403 million for the same period in 2018. Net operating income increased by 21.91% from OMR 18.206 million in the first six months of 2017 to OMR 22.195 million in 2018. During the first six months of 2018, operating expenses grew by 10.59% to OMR 19.208 million compared to OMR 17.368 million in the first six months of 2017. The bank is focused on its strategy and on continuing its efforts to optimally deliver and achieve sustainable growth. Gross loans of the Bank have increased by 10.79% from OMR 2.044 billion as at 30 June 2017 to OMR 2.264 billion as at 30 June 2018. Net loans and advances grew by 10.04% to OMR 2.198 billion as at 30 June 2018 from OMR 1.998 billion as at 30 June 2017. Total assets also grew by 12.53% from OMR 2.674 billion as at 30 June 2017 to OMR 3.009 billion as at 30 June 2018. Customer deposits increased by 2.76% to OMR 1.706 billion as at 30 June 2018 compared to OMR 1.660 billion as at 30 June 2017. The Bank’s market share of private sector credit was 10.25% as at 31 May 2018 compared to 9.73% as at 30 June 2017, while its share of private sector deposits was 8.35% as at 31 May 2018 compared to 9.16% as at 30 June 2017. Bank Sohar continued to strengthen its leading position among its competition and other corporations, while leveraging the 2018 slogan ‘The Year of You’. The Bank delivered on its expansion strategy by inaugurating new branches in Khasab and Musandam and thereby increasing its branch network in Oman to 31. Moving forward with its customer centric initiatives, the Bank launched a range of innovative services and offers such as credit cards free for life and auto loan promotions and the new relationship banking account ‐ Al Khaas. The Bank further held three monthly draws as part of Al Mumayaz Savings Scheme 2018. Delivering on its commitment to various segments of the community in the Sultanate, the Bank through Sohar Al Atta, donated to many associations that are dedicated to serve the elderly, people living with autism and children with intellectual disabilities. Furthering its CSR initiatives, the Bank also sponsored a number of local and cultural activities such as a camel race in Willayat Al Mudhaibi, the Al Amerat football team as well as supporting the first football team of the Sohar Club in His Majesty’s Cup. Furthering its promise to empower the Omani youth and build the workforce of tomorrow, the Bank started Q2 with the launch of two innovative initiatives: Chairman’s Forum ‘ViewPoints’, a unique platform to gain insights from engaging in dialogue with inspirational personalities on key issues; and Tomohi ‐ Enhancing Omani Youth Skills internship programme with the aim to enhance the
Bank Sohar SAOG
Page 2 of 2
employability of Omani graduates. The Bank also hosted students in various branches introducing them to the banking and finance industry. Sohar Islamic has also been active in community engagement by sponsoring the Izki Cultural Gathering and the Ramadan Aman Road Safety campaign. The bank continued engaging with its followers on various social media platforms, and boosted its digital presence and engagement by organizing three social media competitions giving followers chances to win valuable prizes. In line with the Government’s initiative to promote Small and Medium businesses, our focus remains on growing SME financing steadily by offering attractive program based products with quick turnaround processing time and to enhance the health of the SME portfolio in a phased manner. During the first half of 2018, we have strengthened the SME department by recruiting experienced Omani staff with SME Banking knowledge. It will help the Bank focus on generating new business and effectively manage the existing portfolio. We have also recruited additional Omani staff to improve collection of SME accounts. During the second quarter, the Bank appointed Mr. Ahmed Al Musalmi as the Chief Executive Officer of the Bank. Mr. Al‐Musalmi has over twenty years of extensive banking experience and has outstanding track record in managing top leadership roles. His last position held was as Chief Executive Officer of National Bank of Oman. He holds a Masters in Business Administration with distinction, from the University of Bedfordshire – UK in addition to other degrees and professional certificates. On behalf of the Board of Directors, management and staff of the Bank, I would like to thank the Central Bank of Oman and the Capital Market Authority for their astute regulation and guidance. Above all, I would like to express my humble gratitude and pay tribute to His Majesty Sultan Qaboos Bin Said for his wise and discerning leadership that has firmly set Oman on the path of progress and sustainable development. Mohammed Mahfoudh Saad Al‐Ardhi Chairman
Bank Sohar SAOG ───────────────────────────────────────────────────────────────────
Attached notes A1 to E1 form an integral part of these interim condensed financial statements Page 2 of 49
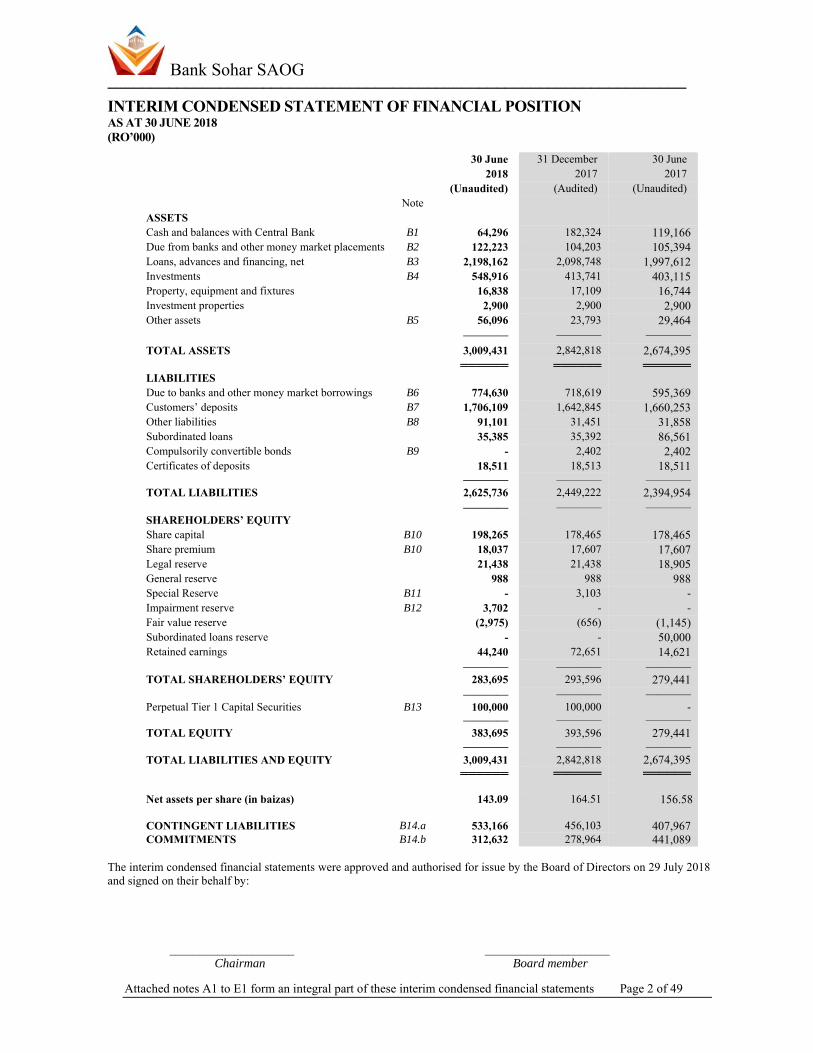
INTERIM CONDENSED STATEMENT OF FINANCIAL POSITION AS AT 30 JUNE 2018 (RO’000)
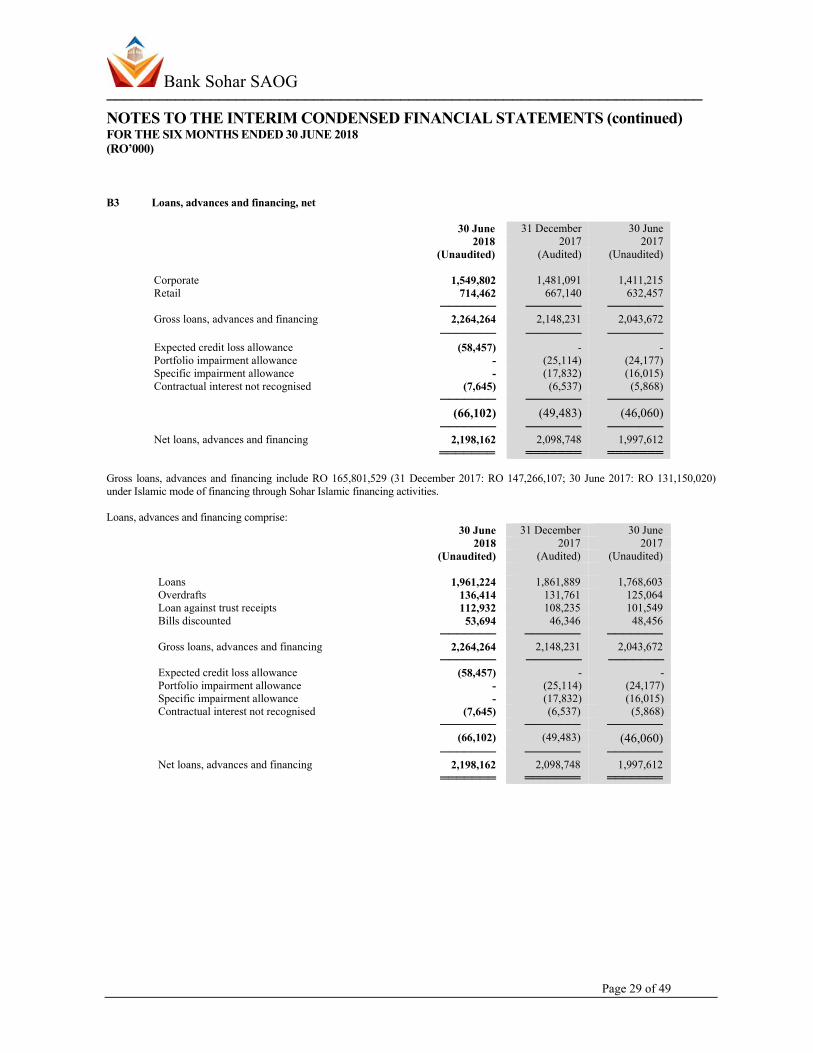
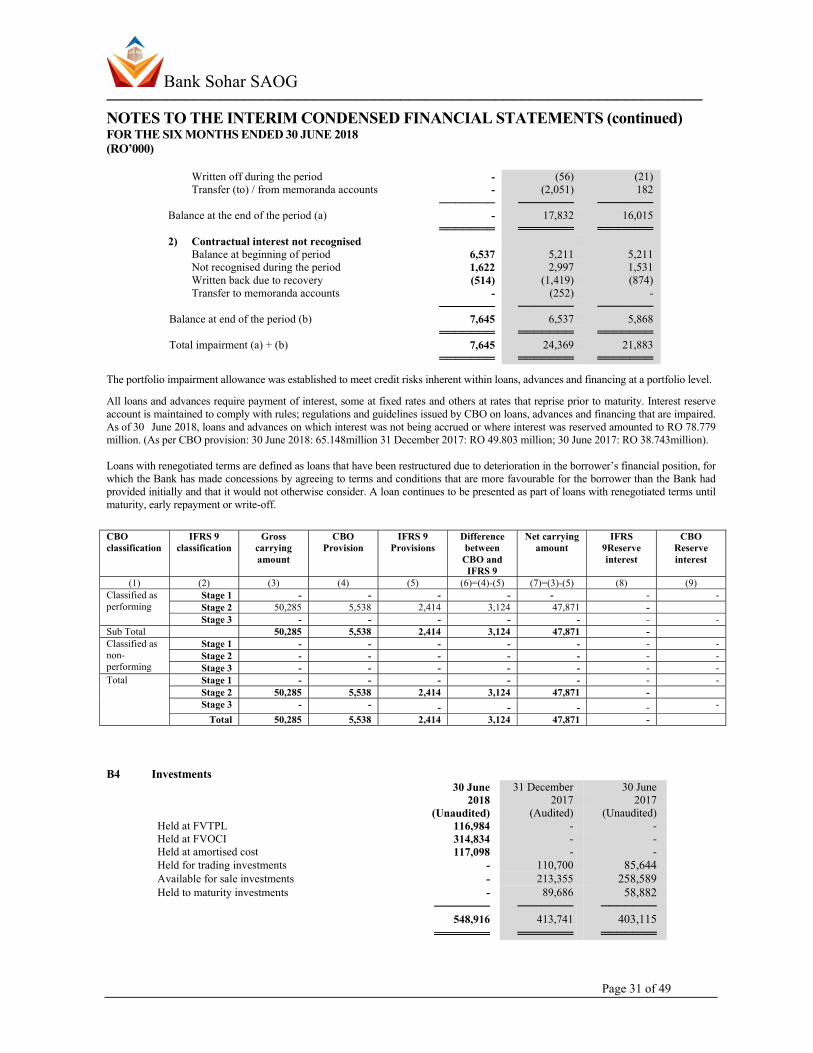
30 June 31 December 30 June 2018 2017 2017 (Unaudited) (Audited) (Unaudited) Note ASSETS Cash and balances with Central Bank B1 64,296 182,324 119,166 Due from banks and other money market placements B2 122,223 104,203 105,394 Loans, advances and financing, net B3 2,198,162 2,098,748 1,997,612 Investments B4 548,916 413,741 403,115 Property, equipment and fixtures 16,838 17,109 16,744 Investment properties 2,900 2,900 2,900 Other assets B5 56,096 23,793 29,464 ———— ———— ———— TOTAL ASSETS 3,009,431 2,842,818 2,674,395 ══════ ══════ ══════ LIABILITIES Due to banks and other money market borrowings B6 774,630 718,619 595,369 Customers’ deposits B7 1,706,109 1,642,845 1,660,253 Other liabilities B8 91,101 31,451 31,858 Subordinated loans 35,385 35,392 86,561 Compulsorily convertible bonds B9 - 2,402 2,402 Certificates of deposits 18,511 18,513 18,511 ———— ———— ———— TOTAL LIABILITIES 2,625,736 2,449,222 2,394,954 ———— ———— ———— SHAREHOLDERS’ EQUITY Share capital B10 198,265 178,465 178,465 Share premium B10 18,037 17,607 17,607 Legal reserve 21,438 21,438 18,905 General reserve 988 988 988 Special Reserve B11 - 3,103 - Impairment reserve B12 3,702 - - Fair value reserve (2,975) (656) (1,145) Subordinated loans reserve - - 50,000 Retained earnings 44,240 72,651 14,621 ———— ———— ———— TOTAL SHAREHOLDERS’ EQUITY 283,695 293,596 279,441 ———— ———— ———— Perpetual Tier 1 Capital Securities B13 100,000 100,000 - ———— ———— ————TOTAL EQUITY 383,695 393,596 279,441 ———— ———— ———— TOTAL LIABILITIES AND EQUITY 3,009,431 2,842,818 2,674,395 ══════ ══════ ══════ Net assets per share (in baizas) 143.09 164.51 156.58 CONTINGENT LIABILITIES B14.a 533,166 456,103 407,967 COMMITMENTS B14.b 312,632 278,964 441,089
The interim condensed financial statements were approved and authorised for issue by the Board of Directors on 29 July 2018 and signed on their behalf by:
_____________________ _____________________ Chairman Board member
Bank Sohar SAOG ──────────────────────────────────────────────────────────────────────
Attached notes A1 to E1 form an integral part of these interim condensed financial statements Page 3 of 49
INTERIM CONDENSED STATEMENT OF INCOME FOR THE SIX MONTHS ENDED 30 JUNE 2018 (Unaudited) (RO’000) For the six months ended For the three months ended
30 June 30 June 30 June 30 June 2018 2017 2018 2017
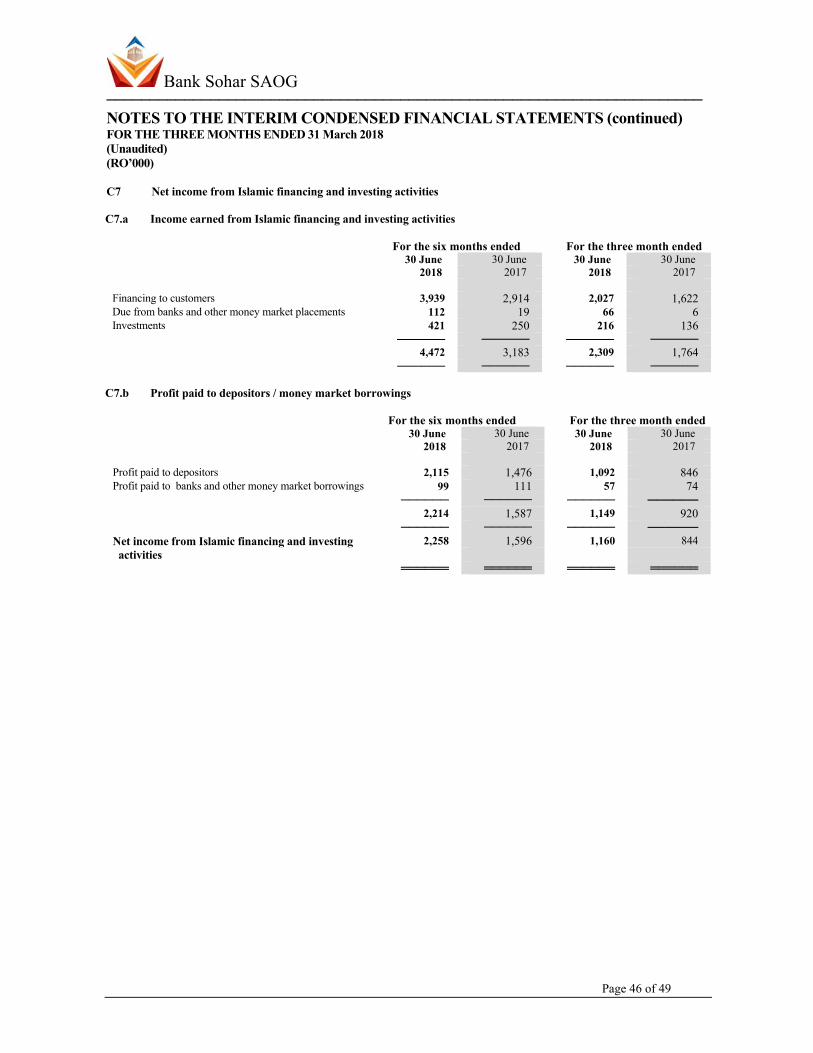
Note Interest income C1 62,936 52,090 32,511 26,486 Interest expense C2 (35,269) (30,552) (18,282) (15,151) ———— ———— ———— ———— Net interest income 27,667 21,538 14,229 11,335 Net income from Islamic financing and investing activities C7 2,258 1,596 1,160 844 Other operating income C3 12,578 12,000 5,306 5,633 Net gains on financial assets at FVOCI/(AFS) - 440 - 86 ———— ———— ———— ———— TOTAL OPERATING INCOME 42,503 35,574 20,695 17,898 ———— ———— ———— ———— Staff costs (11,823) (10,312) (5,942) (5,164) Other operating expenses C4 (6,251) (6,044) (3,291) (3,082) Capital work in progress written off (1,100) - (1,100) - Depreciation (1,134) (1,012) (571) (495) ———— ———— ———— ———— TOTAL OPERATING EXPENSES (20,308) (17,368) (10,904) (8,741) ———— ———— ———— ———— NET OPERATING INCOME 22,195 18,206 9,791 9,157 ———— ———— ———— ———— Credit loss expense on financial assets C5 (5,919) - (3,783) - Impairment on available for sale investments - (856) - (423) Portfolio impairment allowances C5 - (862) - (824) Specific impairment allowances, net - (2,931) - (1,388) ———— ———— ———— ———— NET PROFIT BEFORE TAX 16,276 13,557 6,008 6,522 Income tax expense (2,294) (1,991) (930) (948) ———— ———— ———— ———— NET PROFIT FOR THE PERIOD 13,982 11,566 5,078 5,574 ———— ———— ———— ———— Basic earnings per share for the period – in baizas C6 7.052 5.834 2.561 2.811 Basic earnings per share for the period (annualized)–in baizas C6 14.221 11.764 10.273 11.276 Diluted earnings per share for the period – in baizas C6 - 5.810 - 2.797 Diluted earnings per share for the period (annualized)–in baizas C6 - 11.717 - 11.219 Net Profit for the period Conventional banking 14,139 11,414 5,524 5,387 Islamic banking (157) 152 (446) 187 ———— ———— ———— ———— Total 13,982 11,566 5,078 5,574 ══════ ══════ ══════ ══════
Bank Sohar SAOG ──────────────────────────────────────────────────────────────────────
Attached notes A1 to E1 form an integral part of these interim condensed financial statements Page 4 of 49
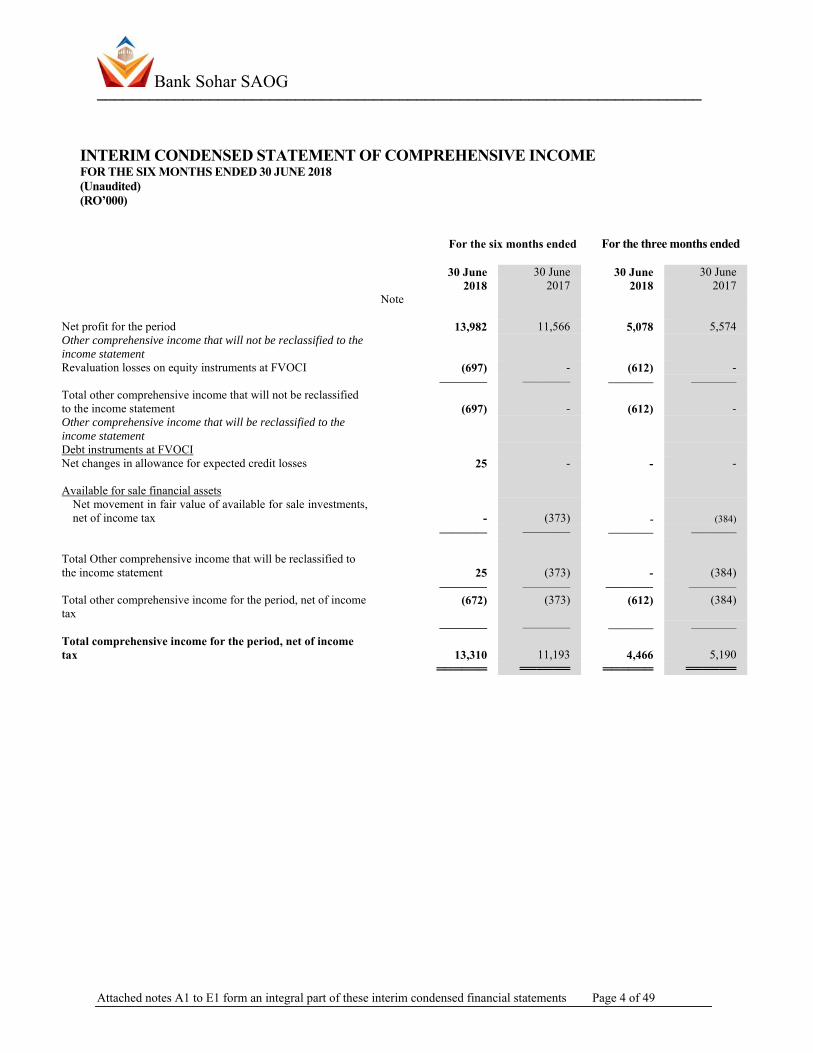
INTERIM CONDENSED STATEMENT OF COMPREHENSIVE INCOME FOR THE SIX MONTHS ENDED 30 JUNE 2018 (Unaudited) (RO’000) For the six months ended For the three months ended
30 June 30 June 30 June 30 June 2018 2017 2018 2017
Note Net profit for the period 13,982 11,566 5,078 5,574 Other comprehensive income that will not be reclassified to the income statement Revaluation losses on equity instruments at FVOCI (697) - (612) - ———— ———— ———— ————Total other comprehensive income that will not be reclassified to the income statement (697) - (612) - Other comprehensive income that will be reclassified to the income statement
Debt instruments at FVOCI Net changes in allowance for expected credit losses 25 - - - Available for sale financial assets
Net movement in fair value of available for sale investments, net of income tax - (373) - (384)
———— ———— ———— ———— Total Other comprehensive income that will be reclassified to the income statement 25 (373) - (384) ———— ———— ———— ———— Total other comprehensive income for the period, net of income tax (672) (373) (612) (384)
———— ———— ———— ————Total comprehensive income for the period, net of income tax 13,310 11,193 4,466 5,190 ══════ ══════ ══════ ══════
Bank Sohar SAOG ──────────────────────────────────────────────────────────────────────
Attached notes A1 to E1 form an integral part of these interim condensed financial statements Page 5 of 49
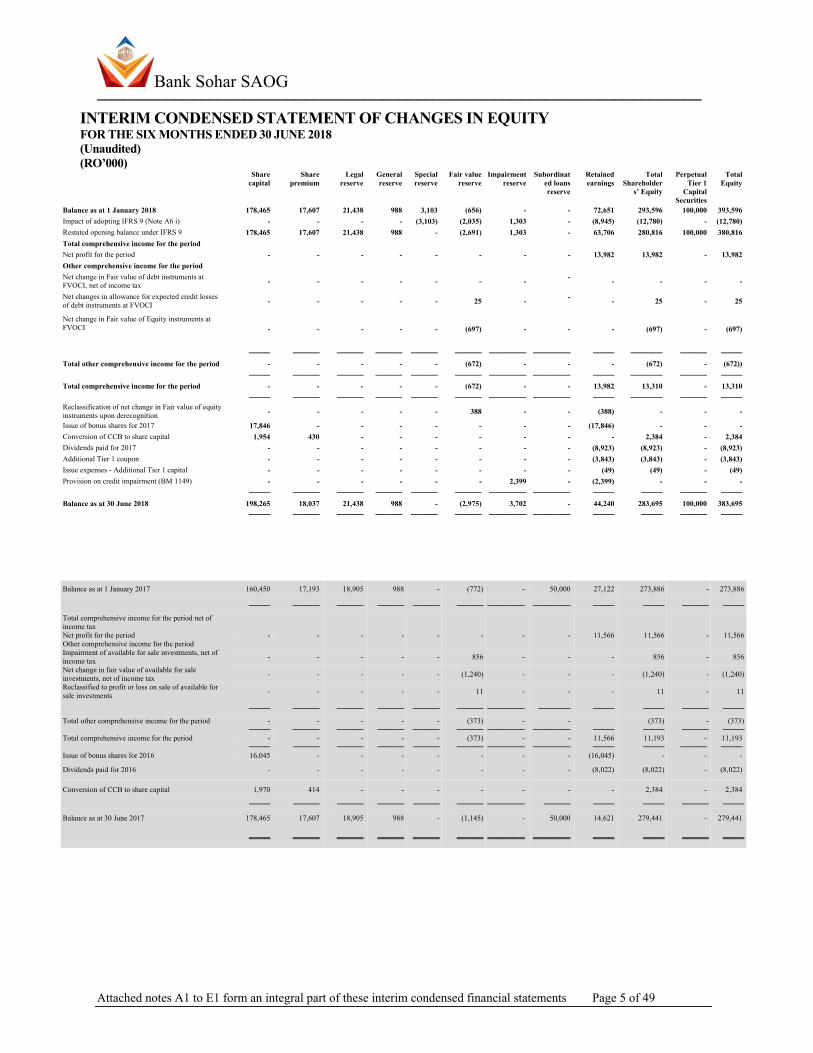
INTERIM CONDENSED STATEMENT OF CHANGES IN EQUITY FOR THE SIX MONTHS ENDED 30 JUNE 2018 (Unaudited) (RO’000)
Share capital
Share premium
Legal reserve
General reserve
Special reserve
Fair value reserve
Impairment reserve
Subordinated loans reserve
Retained earnings
Total Shareholder
s’ Equity
Perpetual Tier 1
Capital Securities
Total Equity
Balance as at 1 January 2018 178,465 17,607 21,438 988 3,103 (656) - - 72,651 293,596 100,000 393,596 Impact of adopting IFRS 9 (Note A6 i) - - - - (3,103) (2,035) 1,303 - (8,945) (12,780) - (12,780) Restated opening balance under IFRS 9 178,465 17,607 21,438 988 - (2,691) 1,303 - 63,706 280,816 100,000 380,816 Total comprehensive income for the period Net profit for the period - - - - - - - - 13,982 13,982 - 13,982 Other comprehensive income for the period Net change in Fair value of debt instruments at FVOCI, net of income tax - - - - - - - - - - - -
Net changes in allowance for expected credit losses of debt instruments at FVOCI - - - - - 25 - - - 25 - 25
Net change in Fair value of Equity instruments at FVOCI
- - - - - (697) - - - (697) - (697)
──── ───── ───── ───── ───── ───── ─────── ─────── ──── ────── ───── ──── Total other comprehensive income for the period - - - - - (672) - - - (672) - (672)) ──── ───── ───── ───── ───── ───── ─────── ─────── ──── ────── ───── ──── Total comprehensive income for the period - - - - - (672) - - 13,982 13,310 - 13,310 ──── ───── ───── ───── ───── ───── ─────── ─────── ──── ────── ───── ──── Reclassification of net change in Fair value of equity instruments upon derecognition - - - - - 388 - - (388) - - -
Total comprehensive income for the period net of income tax
Net profit for the period - - - - - - - - 11,566 11,566 - 11,566Other comprehensive income for the period Impairment of available for sale investments, net of income tax - - - - - 856 - - - 856 - 856
Net change in fair value of available for sale investments, net of income tax - - - - - (1,240) - - - (1,240) - (1,240)
Reclassified to profit or loss on sale of available for sale investments - - - - - 11 - - - 11 - 11
Bank Sohar SAOG ──────────────────────────────────────────────────────────────────────
Attached notes A1 to E1 form an integral part of these interim condensed financial statements Page 6 of 49
INTERIM CONDENSED STATEMENT OF CASH FLOWS FOR THE SIX MONTHS ENDED 30 JUNE 2018 (Unaudited) (RO’000)
30 June 2018
30 June 2017
OPERATING ACTIVITIES Net profit, before tax 16,276 13,557 Adjustments for: Depreciation 1,134 1,012 Credit loss expense on financial assets 5,839 3,793Net losses on FVTPL investments 80 856 Gains on available for sale investments 1,127 (440) Income from Islamic investment activities (421) (250) Interest on investments (6,370) (3,386) Interest accrued on subordinated loans and compulsorily convertible bonds 1,249 2,915
────── ────── Cash from operating activities before changes in operating assets and liabilities 18,914 18,057
Due from banks and other money market placements 4,848 4,192 Loans, advances and financing (103,941) (88,352) Investment in held for trading securities (7,435) (25,373) Other assets (32,714) (11,290) Due to banks and other money market borrowings 242,825 261,784 Customers’ deposits 63,264 128,564 Certificate of deposits (2) (2) Other liabilities 61,531 4,744 ────── ────── Cash from operating activities 247,290 292,324 Income tax paid (4,118) (3,222)
────── ────── Net cash from operating activities, net of tax 243,172 289,102
══════ ══════ INVESTING ACTIVITIES Purchase of investments, net (35,253) (9,300) Proceeds from sale/redemption of investments 541 12,264 Acquisition of property, equipment and fixtures (863) (2,032) Proceeds from sale of property, equipment and fixtures - - Income from Islamic investment activities 210 231 Interest received on investments 6,370 3,386
────── ────── Net cash from / (used in) investing activities (28,995) 4,549
══════ ══════ FINANCING ACTIVITIES Dividends paid (8,923) (8,022) Interest paid on subordinated loans and compulsorily convertible bonds (1,275) (2,989) Additional Tier 1 coupon (3,843) - Issue expenses - Additional Tier 1 capital (49) - ────── ────── Net cash from financing activities (14,090) (11,011)
══════ ══════ NET CHANGE IN CASH AND CASH EQUIVALENTS 200,087 282,640 CASH AND CASH EQUIVALENT AT BEGINNING OF THE PERIOD 13,516 120,071
────── ────── CASH AND CASH EQUIVALENTS AT THE END OF THE PERIOD 213,603 402,711
══════ ══════ REPRESENTING: Cash and balances with Central Bank (other than capital deposit) 63,796 118,666 Due from banks and other money market placements due within 90 days 102,596 80,078 Investments securities maturing within 90 days 293,900 225,356 Due to banks and other money market borrowings within 90 days (246,689) (21,389)
────── ────── 213,603 402,711 ══════ ══════
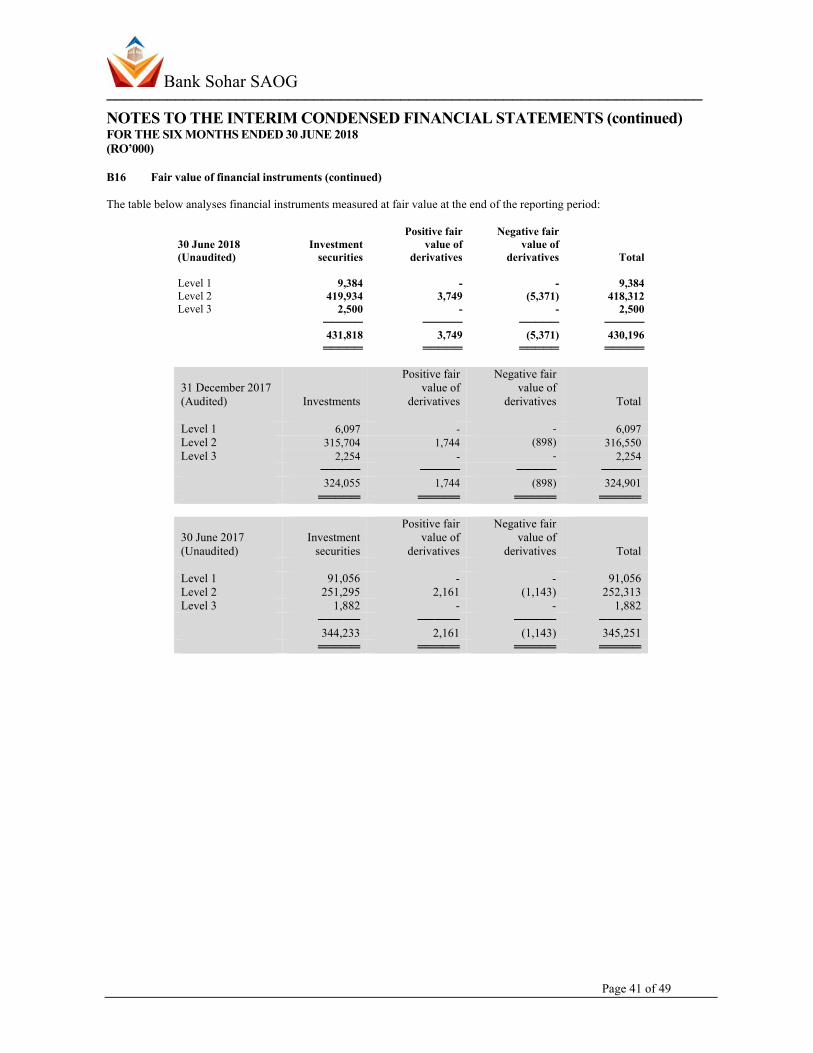
Bank Sohar SAOG ───────────────────────────────────────────────────────────────────── NOTES TO THE INTERIM CONDENSED FINANCIAL STATEMENTS FOR THE SIX MONTHS ENDED 30 JUNE 2018 (RO’000)
Page 7 of 49
A1 Legal status and principal activities
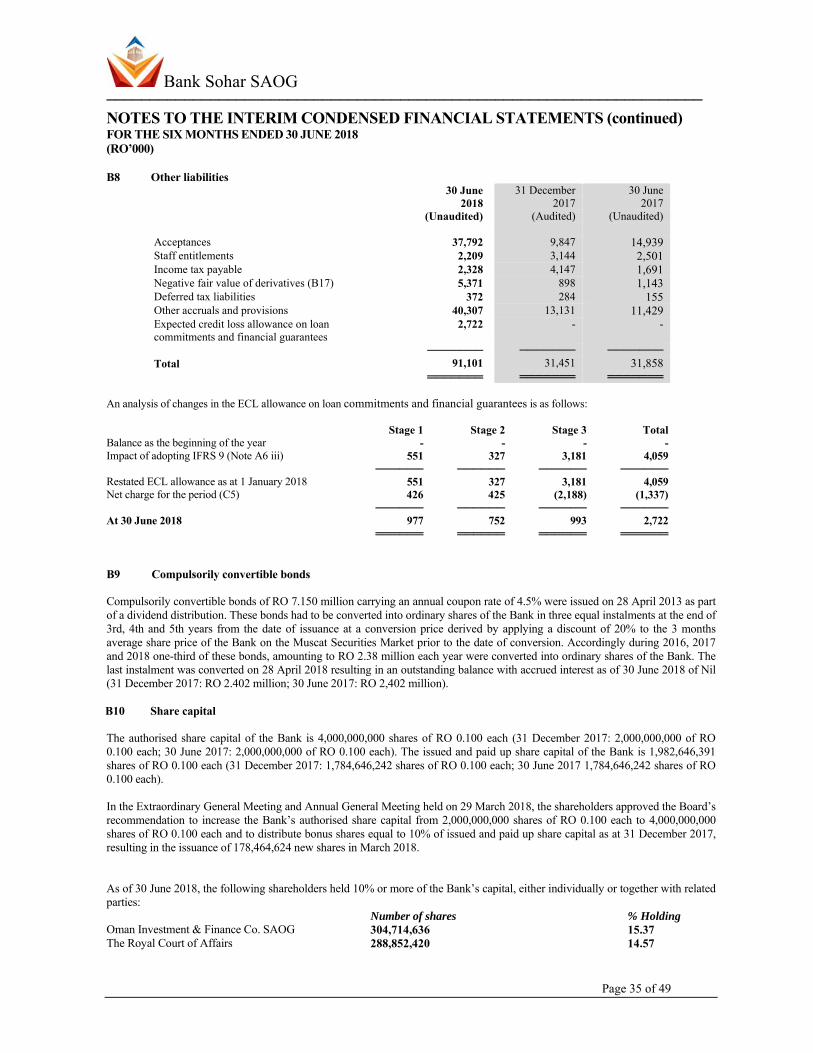
Bank Sohar SAOG (“the Bank”) was established in the Sultanate of Oman on 4 March 2007 as a public joint stock company and is primarily engaged in commercial, investment and Islamic banking through a network of twenty eight commercial banking branches and five Islamic banking branches within the Sultanate of Oman. The Bank operates under commercial, investment and an Islamic banking licence issued by the Central Bank of Oman (CBO) and is covered by its deposit insurance scheme. The Bank started commercial operations from 9 April 2007. The registered address of the Bank is PO Box 44, Hai Al Mina, Postal Code 114, Muscat, Sultanate of Oman. The Bank has its primary listing on the Muscat Securities Market. With effect from 30 April 2013, the Bank obtained a license to operate an Islamic Banking Window (“Sohar Islamic”). Sohar Islamic offers a full range of Islamic banking services and products. The principal activities of the window include accepting Shari'a compliant customer deposits, providing Shari'a compliant financing based on Murabaha, Mudaraba, Musharaka, Ijarah, Istisna'a, Salam and providing commercial banking services, investment and other activities permitted under Islamic Banking Regulatory Framework (IBRF). The Bank employed 775 employees as of 30 June 2018 (31 December 2017: 726; 30 June 2017: 696).
A2 Basis of preparation A2.1 Statement of compliance The financial statements have been prepared in accordance with International Financial Reporting Standards (“IFRS”), relevant requirements of the Commercial Companies Law of Oman of 1974, as amended, Capital Market Authority and the applicable regulations of the CBO. In accordance with the Royal Decree 69/2012 regarding the amendment in the Banking Law 2000, CBO has issued circular no. IB - 1 under which a complete Islamic Banking Regulatory Framework (IBRF) has been promulgated. The framework identifies the permissible form of trade-related modes of financing including purchase of goods by banks from their customers and immediate resale to them at appropriate profit in price on deferred payment basis. The purchases and sales arising under these arrangements are not reflected in these financial statements as such, but are restricted to the amount of facility actually utilised and the appropriate portion of profit thereon. The financial results of the Islamic Banking Window have been reflected in these financial statements for reporting purposes after eliminating inter branch transactions / balances. A complete set of standalone financial statements of Sohar Islamic, prepared under AAOIFI, is included in the Bank’s annual report. A2.2 Basis of measurement The financial statements have been prepared under the historical cost convention except for derivative financial instruments, held for trading and available for sale financial assets which have been measured at fair value. The statement of financial position is presented in descending order of liquidity as this presentation is more appropriate to the Bank’s operations A2.3 Functional and presentation currency These financial statements are presented in Rial Omani, which is the Bank’s functional currency and also in US Dollars, for the convenience of readers. The US Dollar amounts, which are presented in these financial statements have been translated from the Rial Omani amounts at an exchange rate of US Dollar 1 = RO 0.385 and RO 1 = 1000 baizas. All financial information presented in Rial Omani and US Dollars has been rounded to the nearest thousands, unless otherwise indicated. A2.4 Use of estimates and judgements The preparation of financial statements in conformity with IFRS requires management to make judgements, estimates and assumptions that effect the application of accounting policies and reported amounts of assets and liabilities, income and expenses. Actual results may differ from these estimates. The estimates and associated assumptions are based on industry data and various other factors that are believed by the Bank to be reasonable under the circumstances, the results of which form the basis of making the judgments about carrying values of assets and liabilities that are not readily apparent from other sources. The estimates and underlying assumptions are reviewed on a regular basis. Revisions to accounting estimates are recognised in the period in which the estimate is revised if the revision affects only that period or in the period of the revision and future periods if the revision affects both current and future periods. Estimates considered by the Bank to have a significant risk of material adjustment in subsequent periods are discussed in note A5.
Bank Sohar SAOG ───────────────────────────────────────────────────────────────────── NOTES TO THE INTERIM CONDENSED FINANCIAL STATEMENTS (continued) FOR THE SIX MONTHS ENDED 30 JUNE 2018 (RO’000)
Page 8 of 49
A3 Changes in accounting policies and disclosures A3.1 New and amended standards and interpretations In these financial statements, the Bank has applied IFRS 9 and IFRS 7R, effective for annual periods beginning on or after 1 January 2018, for the first time. The Bank has not adopted early any other standard, interpretation or amendment that has been issued but is not yet effective. A3.1.a IFRS 9 Financial Instruments IFRS 9 replaces IAS 39 for annual periods on or after 1 January 2018. The Bank elected, as a policy choice permitted under IFRS 9, to continue to apply hedge accounting in accordance with IAS 39. The Bank has not restated comparative information for 2017 for financial instruments in the scope of IFRS 9. Therefore, the comparative information for 2017 is reported under IAS 39 and is not comparable to the information presented for 2018. Differences arising from the adoption of IFRS 9 have been recognised directly in retained earnings as of 1 January 2018 and are disclosed in Note A6. (i) Changes to classification and measurement To determine their classification and measurement category, IFRS 9 requires all financial assets, except equity instruments and derivatives, to be assessed based on a combination of the entity’s business model for managing the assets and the instruments’ contractual cash flow characteristics. The IAS 39 measurement categories of financial assets (fair value through profit or loss (FVPL), available for sale (AFS), held-to-maturity and amortised cost) have been replaced by: • Debt instruments at amortised cost; • Debt instruments at fair value through other comprehensive income (FVOCI), with gains or losses recycled to profit or loss on
derecognition; • Equity instruments at FVOCI, with no recycling of gains or losses to profit or loss on derecognition; or • Financial assets FVPL.
The accounting for financial liabilities remains largely the same as it was under IAS 39, except for the treatment of gains or losses arising from an entity’s own credit risk relating to liabilities designated at FVPL. Such movements are presented in OCI with no subsequent reclassification to the income statement. Under IFRS 9, embedded derivatives are no longer separated from a host financial asset. Instead, financial assets are classified based on the business model and their contractual terms, as explained in Note A3.1.a (i). The accounting for derivatives embedded in financial liabilities and in non-financial host contracts has not changed. The Bank’s accounting policies for embedded derivatives are set out in Note A.4.3.a. (ii) The Bank’s classification of its financial assets and liabilities is explained in Notes A4.3.d. The quantitative impact of applying IFRS 9 as at 1 January 2018 is disclosed in Note A6. (ii) Changes to the impairment calculation The adoption of IFRS 9 has fundamentally changed the Bank’s accounting for loan loss impairments by replacing IAS 39’s incurred loss approach with a forward-looking expected credit loss (ECL) approach. IFRS 9 requires the Bank to record an allowance for ECLs for all loans and other debt financial assets not held at FVPL, together with loan commitments and financial guarantee contracts. The allowance is based on the ECLs associated with the probability of default in the next twelve months unless there has been a significant increase in credit risk since origination. If the financial asset meets the definition of purchased or originated credit impaired (POCI), the allowance is based on the change in the ECLs over the life of the asset. Details of the Bank’s impairment method are disclosed in Note A4.3.g. The quantitative impact of applying IFRS 9 as at 1 January 2018 is disclosed in Note A6.
Bank Sohar SAOG ───────────────────────────────────────────────────────────────────── NOTES TO THE INTERIM CONDENSED FINANCIAL STATEMENTS (continued) FOR THE SIX MONTHS ENDED 30 JUNE 2018 (RO’000)
Page 9 of 49
A3 Changes in accounting policies and disclosures (continued) A3.1.b IFRS 7R Financial Instruments Disclosures To reflect the differences between IFRS 9 and IAS 39, IFRS 7 Financial Instruments: Disclosures was updated and the Bank has adopted it, together with IFRS 9, for the year beginning 1 January 2018. Changes include transition disclosures as shown in Note A6 and detailed qualitative and quantitative information about the ECL calculations such as the assumptions and inputs used are set out in Note A2.3.g. A3.2 Standards, amendments and interpretations effective in 2017 and relevant for the Bank’s operations For the year ended 31 December 2017, the Bank has adopted all of the following new and revised standards and interpretations issued by the International Accounting Standards Board (IASB) and the International Financial Reporting Interpretations Committee (IFRIC) of the IASB that are relevant to its operations and effective for periods beginning on 1 January 2017. • Amendments to IAS 7 Statement of Cash Flows: Disclosure Initiative • Amendments to IAS 12 Income Taxes: Recognition of Deferred Tax Assets for Unrealised Losses • Annual Improvements Cycle - 2014-2016 • Amendments to IFRS 12 Disclosure of Interests in Other Entities: Clarification of the scope of disclosure requirements in IFRS 12 The adoption of these standards and interpretations has not resulted in any significant changes to the Bank’s accounting policies and has not affected the amounts reported for the current and prior years. A3.3 Standards, amendments and interpretations to existing standards that are not yet effective and have not been early adopted
by the Bank: A3.3.a IFRS 15 - Revenue from Contracts with Customers IFRS 15 was issued in May 2014, and amended in April 2016, and establishes a five-step model to account for revenue arising from contracts with customers. Under IFRS 15, revenue is recognised at an amount that reflects the consideration to which an entity expects to be entitled in exchange for transferring goods or services to a customer. The new revenue standard will supersede all current revenue recognition requirements under IFRS. Either a full retrospective application or a modified retrospective application is required for annual periods beginning on or after 1 January 2018. Early adoption is permitted. The Bank plans to adopt the new standard on the required effective date using the modified retrospective approach. The Bank has performed an initial impact assessment and concluded that the impact is not material as in majority of the Bank’s facility agreements with customers generally expected to be the only performance obligation and accordingly, adoption of IFRS 15 is not expected to have any impact on the Bank’s income and profit or loss. A3.3.b IFRS 16 – Leases The IASB issued IFRS 16 Leases (IFRS 16), which requires lessees to recognise assets and liabilities for most leases. The standard includes two recognition exemptions for lessees – leases of ’low-value’ assets (e.g., personal computers) and short-term leases (i.e., leases with a lease term of 12 months or less). For lessors, there is little change to the existing accounting in IAS 17 Leases. The Bank will perform a detailed assessment in the future to determine the extent. The new standard will be effective for annual periods beginning on or after 1 January 2019. IFRS 16 also requires lessees and lessors to make more extensive disclosures than under IAS 17. In 2018, the Bank will continue to assess the potential effect of IFRS 16 on its financial statements.
A4 Significant accounting policies
The accounting policies set out below have been applied consistently by the Bank to all periods presented in these financial statements, unless otherwise stated.
A4.1 Foreign currency transactions
Transactions in foreign currencies are translated into functional currency at the spot exchange rate at the date of the transaction. Monetary assets and liabilities denominated in foreign currencies at the reporting date are retranslated into the functional currency at the spot exchange rate at that date. The foreign currency gain or loss on monetary items is the difference between amortised cost in the functional currency at the beginning of the period, adjusted for the effective interest and payments during the period, and the amortised cost in the foreign currency translated at the spot exchange rate at the end of the period. The non-monetary assets and liabilities denominated in foreign currencies that are measured at fair value are retranslated into the functional currency at the spot exchange rate at the date the fair value was determined. Foreign currency differences arising on retranslation are recognised in the statement of comprehensive income, except for non-monetary financial assets, such as equities classified as available for sale, which are included in other comprehensive income. Non-monetary assets and liabilities that are measured in terms of historical cost in a foreign currency are translated using the exchange rate at the date of the transaction.
Bank Sohar SAOG ───────────────────────────────────────────────────────────────────── NOTES TO THE INTERIM CONDENSED FINANCIAL STATEMENTS (continued) FOR THE SIX MONTHS ENDED 30 JUNE 2018 (RO’000)
Page 10 of 49
A4 Significant accounting policies (continued) A4.2 Revenue and expense recognition
A4.2.a Interest income and expense
Under both IFRS 9 and IAS 39, interest income is recorded using the effective interest rate (EIR) method for all financial instruments measured at amortised cost, financial instruments designated at FVPL. Interest income on interest bearing financial assets measured at FVOCI under IFRS 9, similarly to interest bearing financial assets classified as available-for-sale or held to maturity under IAS 39 are also recorded by using the EIR method. The EIR is the rate that exactly discounts estimated future cash receipts through the expected life of the financial instrument or, when appropriate, a shorter period, to the net carrying amount of the financial asset. The EIR (and therefore, the amortised cost of the asset) is calculated by taking into account any discount or premium on acquisition, fees and costs that are an integral part of the EIR. The Bank recognises interest income using a rate of return that represents the best estimate of a constant rate of return over the expected life of the loan. Hence, it recognises the effect of potentially different interest rates charged at various stages, and other characteristics of the product life cycle (including prepayments, penalty interest and charges).
Interest income which is doubtful of recovery is included in impairment allowance and excluded from income until it is received in cash. When a financial asset becomes credit-impaired (as set out in Note A 4.3.g) and is, therefore, regarded as ‘Stage 3’, the Bank calculates interest income by applying the effective interest rate to the net amortised cost of the financial asset. If the financial assets cures (as outlined in Note 12.3.3.1) and is no longer credit-impaired, the Bank reverts to calculating interest income on a gross basis. A4.2.b Fair value gains and losses
Fair value changes on derivatives held for risk management purposes and available for sale financial assets are presented in other comprehensive income. Net income from financial assets at fair value through profit or loss, including all realised and unrealised fair value changes, interest, dividend and foreign exchange differences are presented in the income statement for the year.
A4.2.c Dividend income
Dividend income is recognised when the right to receive dividend is established.
A4.2.d Fees and commission
Fees and commission income and expenses that are integral to the effective interest rate on a financial asset or liability are included in the measurement of the effective interest rate. Other fees and commission income – including account or loan servicing fees, advisory fee, investment management fees and sales commission– are recognised as the related services are performed. Loan syndication fees and placement fees are recognised when the loan has been arranged. If a loan commitment is not expected to result in the draw-down of a loan, then the related loan commitment fees are recognised on a straight-line basis over the commitment period.
A4.2.e Provisions
A provision is recognised if, as a result of a past event, the Bank has a present legal or constructive obligation that can be estimated reliably, and it is probable that an outflow of economic benefits will be required to settle the obligation. Provisions are equivalent to the amortised value of the future liabilities which is determined by discounting the expected future cash flows at a pre-tax rate that reflects current market assessments of the time value of money and the risk specific to the liability.
A4.2.f Offsetting of income and expense
Income and expenses are presented on a net basis only when permitted by the IFRS, or for gains and losses arising from a group of similar transactions such as in the Bank’s trading activity.
A4.2.g Temporary significant influence
The Bank is exempt from applying the equity method when significant influence over an associate is intended to be temporary. The temporary significant influence infers that there is an evidence that an associate is acquired with the intention to reduce its stake that it no more has a significant influence on the investee company by soliciting investors to inject fresh capital to the investee company. The investment is classified as available for sale in the financial statements.
Bank Sohar SAOG ───────────────────────────────────────────────────────────────────── NOTES TO THE INTERIM CONDENSED FINANCIAL STATEMENTS (continued) FOR THE SIX MONTHS ENDED 30 JUNE 2018 (RO’000)
Financial assets and liabilities, with the exception of loans and advances to customers and balances due to customers, are initially recognised on the trade date, i.e., the date that the Bank becomes a party to the contractual provisions of the instrument. This includes regular way trades: purchases or sales of financial assets that require delivery of assets within the time frame generally established by regulation or convention in the market place. Loans and advances to customers are recognised when funds are transferred to the customers’ accounts. The Bank recognises balances due to customers when funds are transferred to the Bank.
A4.3.b Initial measurement of financial instruments
The classification of financial instruments at initial recognition depends on their contractual terms and the business model for managing the instruments, as described in Notes A4.3.d. Financial instruments are initially measured at their fair value (as defined in Note A4.3.i except in the case of financial assets and financial liabilities recorded at FVPL, transaction costs are added to, or subtracted from, this amount. Trade receivables are measured at the transaction price. When the fair value of financial instruments at initial recognition differs from the transaction price, the Bank accounts for the Day 1 profit or loss, as described below.
A4.3.c Day 1 profit or loss
When the transaction price of the instrument differs from the fair value at origination and the fair value is based on a valuation technique using only inputs observable in market transactions, the Bank recognises the difference between the transaction price and fair value in net trading income. In those cases where fair value is based on models for which some of the inputs are not observable, the difference between the transaction price and the fair value is deferred and is only recognised in profit or loss when the inputs become observable, or when the instrument is derecognised. A4.3.d Measurement categories of financial assets and liabilities From 1 January 2018, the Bank classifies all of its financial assets based on the business model for managing the assets and the asset’s contractual terms, measured at either: • Amortised cost, as explained in Note A4.3.d(i); • FVOCI, as explained in Notes A4.3.d (iv) and A4.3.d(v); or • FVPL, as explained in Note A4.3.d(vii) The Bank classifies and measures its derivative and trading portfolio at FVTPL The Bank may designate financial instruments at FVTPL, if so doing eliminates or significantly reduces measurement or recognition inconsistencies. (i) Due from banks, Loans and advances to customers, financial investments at amortised cost Before 1 January 2018, Due from bank and Loans and advances to customers, included non–derivative financial assets with fixed or determinable payments that were not quoted in an active market, other than those: • That the Bank intended to sell immediately or in the near term; • That the Bank, upon initial recognition, designated as at FVPL or as available-for-sale; or • For which the Bank may not recover substantially all of its initial investment, other than because of credit deterioration, which were
designated as available-for-sale.
From 1 January 2018, the Bank only measures Due from banks, Loans and advances to customers and other financial investments at amortised cost if both of the following conditions are met:
• The financial asset is held within a business model with the objective to hold financial assets in order to collect contractual cash flows; and
• The contractual terms of the financial asset give rise on specified dates to cash flows that are solely payments of principal and interest (SPPI) on the principal amount outstanding.
The details of these conditions are outlined below.
• Business model assessment
Bank Sohar SAOG ───────────────────────────────────────────────────────────────────── NOTES TO THE INTERIM CONDENSED FINANCIAL STATEMENTS (continued) FOR THE SIX MONTHS ENDED 30 JUNE 2018 (RO’000)
Page 12 of 49
A4 Significant accounting policies (continued) A4.3.d Measurement categories of financial assets and liabilities (continued)
The Bank determines its business model at the level that best reflects how it manages groups of financial assets to achieve its business objective. The Bank's business model is not assessed on an instrument-by-instrument basis, but at a higher level of aggregated portfolios and is based on observable factors such as:
How the performance of the business model and the financial assets held within that business model are evaluated and reported to the
entity's key management personnel; The risks that affect the performance of the business model (and the financial assets held within that business model) and, in particular,
the way those risks are managed; How managers of the business are compensated (for example, whether the compensation is based on the fair value of the assets
managed or on the contractual cash flows collected); and The expected frequency, value and timing of sales are also important aspects of the Bank’s assessment.
The business model assessment is based on reasonably expected scenarios without taking 'worst case' or 'stress case’ scenarios into account. If cash flows after initial recognition are realised in a way that is different from the Bank's original expectations, the Bank does not change the classification of the remaining financial assets held in that business model, but incorporates such information when assessing newly originated or newly purchased financial assets going forward.
• The SPPI test
As a second step of its classification process the Bank assesses the contractual terms of financial assets to identify whether they meet the SPPI test. ‘Principal’ for the purpose of this test is defined as the fair value of the financial asset at initial recognition and may change over the life of the financial asset (for example, if there are repayments of principal or amortisation of the premium/discount). The most significant elements of interest within a lending arrangement are typically the consideration for the time value of money and credit risk. To make the SPPI assessment, the Bank applies judgement and considers relevant factors such as the currency in which the financial asset is denominated, and the period for which the interest rate is set. In contrast, contractual terms that introduce a more than the minimum exposure to risks or volatility in the contractual cash flows that are unrelated to a basic lending arrangement do not give rise to contractual cash flows that are solely payments of principal and interest on the amount outstanding. In such cases, the financial asset is required to be measured at FVTPL.
(ii) Derivatives recorded at fair value through profit or loss
A derivative is a financial instrument or other contract with all three of the following characteristics:
• Its value changes in response to the change in a specified interest rate, financial instrument price, commodity price, foreign exchange
rate, index of prices or rates, credit rating or credit index, or other variable, provided that, in the case of a non-financial variable, it is not specific to a party to the contract (i.e., the 'underlying').
• It requires no initial net investment or an initial net investment that is smaller than would be required for other types of contracts expected to have a similar response to changes in market factors.
• It is settled at a future date.
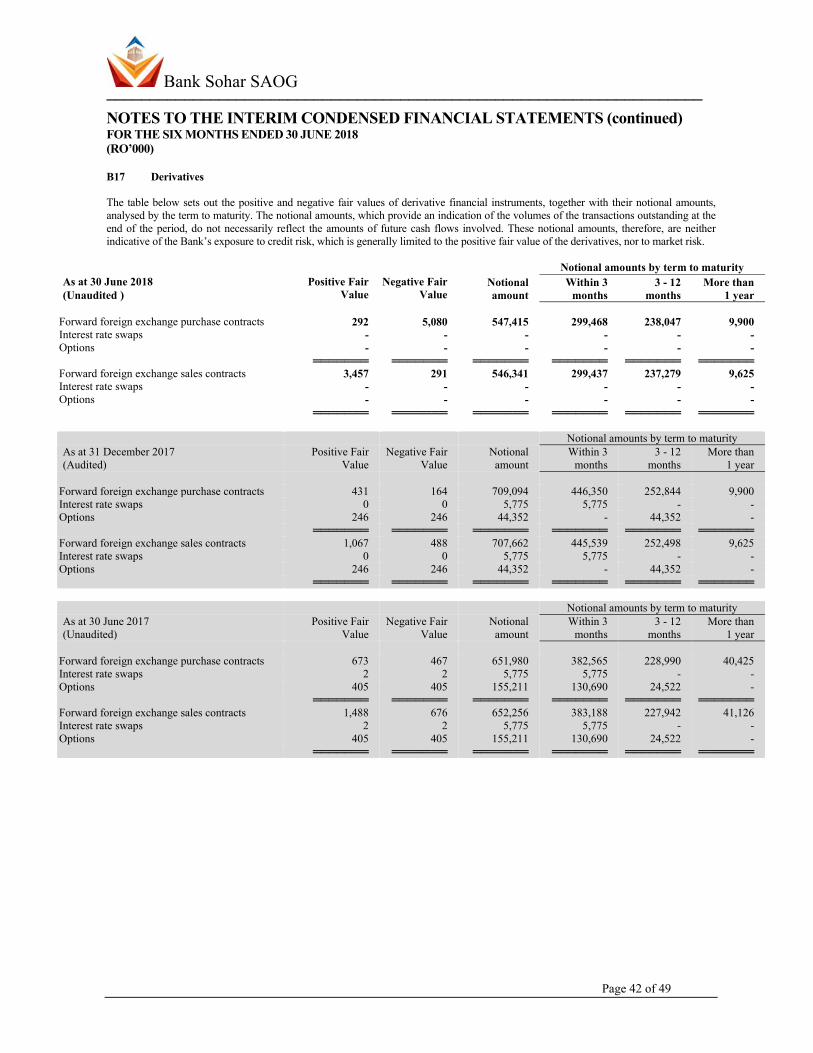
The Bank enters into derivative transactions with various counterparties. These include interest rate swaps, futures, cross-currency swaps, forward foreign exchange contracts and options on interest rates, foreign currencies. Derivatives are recorded at fair value and carried as assets when their fair value is positive and as liabilities when their fair value is negative. The notional amount and fair value of such derivatives are disclosed separately in Note B17. Changes in the fair value of derivatives are included in net trading income unless hedge accounting is applied. Hedge accounting disclosures are provided in Note A4.4.m.
Embedded derivatives
An embedded derivative is a component of a hybrid instrument that also includes a non-derivative host contract with the effect that some of the cash flows of the combined instrument vary in a way similar to a stand-alone derivative. An embedded derivative causes some or all of the cash flows that otherwise would be required by the contract to be modified according to a specified interest rate, financial instrument price, commodity price, foreign exchange rate, index of prices or rates, credit rating or credit index, or other variable, provided that, in the case of a non-financial variable, it is not specific to a party to the contract. A derivative that is attached to a financial instrument, but is contractually transferable independently of that instrument, or has a different counterparty from that instrument, is not an embedded derivative, but a separate financial instrument. Under IAS 39, derivatives embedded in financial assets, liabilities and non-financial host contacts, were treated as separate derivatives and recorded at fair value if they met the definition of a derivative (as defined above), their
Bank Sohar SAOG ───────────────────────────────────────────────────────────────────── NOTES TO THE INTERIM CONDENSED FINANCIAL STATEMENTS (continued) FOR THE SIX MONTHS ENDED 30 JUNE 2018 (RO’000)
Page 13 of 49
A4 Significant accounting policies (continued) A4.3.d Measurement categories of financial assets and liabilities (continued) economic characteristics and risks were not closely related to those of the host contract, and the host contract was not itself held for trading or designated at FVPL. The embedded derivatives separated from the host were carried at fair value in the trading portfolio with changes in fair value recognised in the income statement.
From 1 January 2018, with the introduction of IFRS 9, the Bank continues to accounts in this way for derivatives embedded in financial liabilities and non-financial host contracts. Financial assets are, however, classified based on the business model and SPPI assessments as outlined in Note A4.3.d (i).
(iii) Financial assets or financial liabilities held for trading
The Bank classifies financial assets or financial liabilities as held for trading when they have been purchased or issued primarily for short-term profit making through trading activities or form part of a portfolio of financial instruments that are managed together, for which there is evidence of a recent pattern of short-term profit taking. Held-for-trading assets and liabilities are recorded and measured in the statement of financial position at fair value. Changes in fair value are recognised in net trading income. Interest and dividend income or expense is recorded in net trading income according to the terms of the contract, or when the right to payment has been established.
Included in this classification are debt securities, equities, short positions and customer loans that have been acquired principally for the purpose of selling or repurchasing in the near term.
(iv) Debt instruments at FVOCI (Policy applicable from 1 January 2018)
The Bank applies the new category under IFRS 9 of debt instruments measured at FVOCI when both of the following conditions are met:
• The instrument is held within a business model, the objective of which is achieved by both collecting contractual cash flows and
selling financial assets; and • The contractual terms of the financial asset meet the SPPI test.
These instruments largely comprise assets that had previously been classified as financial investments available for sale under IAS 39. FVOCI debt instruments are subsequently measured at fair value with gains and losses arising due to changes in fair value recognised in OCI. Interest income and foreign exchange gains and losses are recognised in profit or loss in the same manner as for financial assets measured at amortised cost as explained in Note A4.3.d(i). The ECL calculation for Debt instruments at FVOCI is explained in Note A4.3.g(iii) Where the Bank holds more than one investment in the same security, they are deemed to be disposed of on a first–in first–out basis. On derecognition, cumulative gains or losses previously recognised in OCI are reclassified from OCI to profit or loss.
(v) Equity instruments at FVOCI (Policy applicable from 1 January 2018)
Upon initial recognition, the Bank occasionally elects to irrevocably classify some of its equity investments as equity instruments at FVOCI when they meet the definition of Equity under IAS 32 Financial Instruments: Presentation and are not held for trading. Such classification is determined on an instrument by instrument basis.
Gains and losses on these equity instruments are never recycled to profit. Dividends are recognised in profit or loss as other operating income when the right of the payment has been established, except when the Bank benefits from such proceeds as a recovery of part of the cost of the instrument, in which case, such gains are recorded in OCI. Equity instruments at FVOCI are not subject to an impairment assessment.
(vi) Financial assets and financial liabilities at fair value through profit or loss
Financial assets and financial liabilities in this category are those that are not held for trading and have been either designated by management upon initial recognition or are mandatorily required to be measured at fair value under IFRS 9. Management only designates an instrument at FVPL upon initial recognition when one of the following criteria is met. Such designation is determined on an instrument by instrument basis:
• The designation eliminates, or significantly reduces, the inconsistent treatment that would otherwise arise from measuring the assets or
liabilities or recognising gains or losses on them on a different basis; • The liabilities (and assets until 1 January 2018 under IAS 39) are part of a group of financial liabilities (or financial assets, or both
under IAS 39), which are managed and their performance evaluated on a fair value basis, in accordance with a documented risk management or investment strategy; or
Bank Sohar SAOG ───────────────────────────────────────────────────────────────────── NOTES TO THE INTERIM CONDENSED FINANCIAL STATEMENTS (continued) FOR THE SIX MONTHS ENDED 30 JUNE 2018 (RO’000)
Page 14 of 49
A4 Significant accounting policies (continued) A4.3.d Measurement categories of financial assets and liabilities (continued)
• The liabilities (and assets until 1 January 2018 under IAS 39) containing one or more embedded derivatives, unless they do not significantly modify the cash flows that would otherwise be required by the contract, or it is clear with little or no analysis when a similar instrument is first considered that separation of the embedded derivative(s) is prohibited
Financial assets and financial liabilities at FVTPL are recorded in the statement of financial position at fair value. Changes in fair value are recorded in profit and loss with the exception of movements in fair value of liabilities designated at FVPL due to changes in the Bank’s own credit risk. Such changes in fair value are recorded in the Own credit reserve through OCI and do not get recycled to the profit or loss. Interest earned or incurred on instruments designated at FVPL is accrued in interest income or interest expense, respectively, using EIR, taking into account any discount/premium and qualifying transaction costs being an integral part of instrument. Interest earned on assets mandatorily required to be measured at FVPL is recorded using contractual interest rate. Dividend income from equity instruments measured at FVTPL is recorded in profit or loss as other operating income when the right to the payment has been established.
(vii) Financial guarantees, letters of credit and undrawn loan commitments
The Bank issues financial guarantees, letters of credit and loan commitments.
Financial guarantees are initially recognised in the financial statements (within Provisions) at fair value, being the premium received. Subsequent to initial recognition, the Bank’s liability under each guarantee is measured at the higher of the amount initially recognised less cumulative amortisation recognised in the income statement, and – under IAS 39 – the best estimate of expenditure required to settle any financial obligation arising as a result of the guarantee, or – under IFRS 9 – an ECL provision as set out in Note A4.3.g. The premium received is recognised in the income statement in Net fees and commission income on a straight line basis over the life of the guarantee. Undrawn loan commitments and letters of credits are commitments under which, over the duration of the commitment, the Bank is required to provide a loan with pre-specified terms to the customer. Similar to financial guarantee contracts, under IAS 39, a provision was made if they were an onerous contract but, from 1 January 2018, these contracts are in the scope of the ECL requirements.
The nominal contractual value of financial guarantees, letters of credit and undrawn loan commitments, where the loan agreed to be provided is on market terms, are not recorded on in the statement of financial position.
The nominal values of these instruments together with the corresponding ECLs are disclosed in Note 11. The Bank occasionally issues loan commitments at below market interest rates drawdown. Such commitments are subsequently measured at the higher of the amount of the ECL allowance (as explained in Note A4.3.g) and the amount initially recognised less, when appropriate, the cumulative amount of income recognised.
(Viii) Available for sale financial investments (Policy applicable before 1 January 2018)
Available for sale financial assets include equity and debt securities. Equity investments classified as available for sale are those which are neither classified as held for trading nor designated at fair value through profit or loss. Debt securities in this category are intended to be held for an indefinite period of time and may be sold in response to needs for liquidity or in response to changes in the market conditions.
The Bank has not designated any loans or receivables as available for sale.
After initial measurement, available for sale financial investments are subsequently measured at fair value.
Unrealised gains and losses are recognised directly in equity (other comprehensive income) in the change in fair value of available for sale financial assets. When the investment is disposed of, the cumulative gain or loss previously recognised in equity is recognised in the profit or loss in other operating income. Interest earned whilst holding available for sale financial investments is reported as interest income using the EIR. Dividends earned whilst holding available for sale financial investments are recognised in the profit or loss as other operating income when the right of the payment has been established. The losses arising from impairment of such investments are recognised in the profit or loss in impairment for available for sale financial assets and removed from the change in fair value of investments available for sale.
(ix) Held to maturity financial investments (Policy applicable before 1 January 2018)
Held to maturity financial assets are non-derivative assets with fixed or determinable payments and fixed maturity that the Bank has the positive intent and ability to hold to maturity and which are not designated at fair value through profit or loss or available for sale.
These are initially recognised at fair value including direct and incremental transaction costs and measured subsequently at amortised cost, using the effective interest method. Interest on held to maturity investments is included in the statement of comprehensive income and reported as ‘interest income’. In the case of impairment, the impairment loss is been reported as a deduction from the carrying value of the investment and recognised in the statement of comprehensive income as ‘impairment for investments’.
Bank Sohar SAOG ───────────────────────────────────────────────────────────────────── NOTES TO THE INTERIM CONDENSED FINANCIAL STATEMENTS (continued) FOR THE SIX MONTHS ENDED 30 JUNE 2018 (RO’000)
A financial asset (or, where applicable a part of a financial asset or part of a group of similar financial assets) is derecognised when: • The rights to receive cash flows from the asset have expired; or • The Bank has transferred its rights to receive cash flows from the asset or has assumed an obligation to pay the received cash flows in
full without material delay to a third party under a ‘pass–through’ arrangement; and either:
The Bank has transferred substantially all the risks and rewards of the asset; or The Bank has neither transferred nor retained substantially all the risks and rewards of the asset, but has transferred control of the
asset
When the Bank has transferred its rights to receive cash flows from an asset or has entered into a pass–through arrangement, and has neither transferred nor retained substantially all of the risks and rewards of the asset nor transferred control of the asset, the asset is recognised to the extent of the Bank’s continuing involvement in the asset. In that case, the Bank also recognises an associated liability. The transferred asset and the associated liability are measured on a basis that reflects the rights and obligations that the Bank has retained. Continuing involvement that takes the form of a guarantee over the transferred asset is measured at the lower of the original carrying amount of the asset and the maximum amount of consideration that the Bank could be required to repay.
(ii) Financial liabilities
A financial liability is derecognised when the obligation under the liability is discharged or cancelled or expires. Where an existing financial liability is replaced by another from the same lender on substantially different terms, or the terms of an existing liability are substantially modified, such an exchange or modification is treated as a derecognition of the original liability and the recognition of a new liability. The difference between the carrying value of the original financial liability and the consideration paid is recognised in profit or loss.
A4.3.f Offsetting of financial assets and financial liabilities
Financial assets and financial liabilities are only offset and the net amount reported in the statement of financial position when there is a legally enforceable right to set off the recognised amounts and the Bank intends to either settle on a net basis or to realise the asset and settle the liability simultaneously. Income and expenses are presented on a net basis only when permitted by the accounting standards or for gains and losses arising from a group of similar transactions
A4.3.g Impairment of financial assets (Policy applicable from 1 January 2018)
(i) Overview of the ECL principles The adoption of IFRS 9 has fundamentally changed the Bank’s loan loss impairment method by replacing IAS 39’s incurred loss approach with a forward-looking ECL approach. From 1 January 2018, the Bank has been recording the allowance for expected credit losses for all loans and other debt financial assets not held at FVPL, together with loan commitments and financial guarantee contracts, in this section all referred to as ‘financial instruments’. Equity instruments are not subject to impairment under IFRS 9. The ECL allowance is based on the credit losses expected to arise over the life of the asset (the lifetime expected credit loss or LTECL), unless there has been no significant increase in credit risk since origination, in which case, the allowance is based on the 12 months’ expected credit loss (12mECL). The Bank’s policies for determining if there has been a significant increase in credit risk. The 12mECL is the portion of LTECLs that represent the ECLs that result from default events on a financial instrument that are possible within the 12 months after the reporting date. Both LTECLs and 12mECLs are calculated on either an individual basis or a collective basis, depending on the nature of the underlying portfolio of financial instruments. The Bank has established a policy to perform an assessment, at the end of each reporting period, of whether a financial instrument’s credit risk has increased significantly since initial recognition, by considering the change in the risk of default occurring over the remaining life of the financial instrument.
Based on the above process, the Bank groups its loans into Stage 1, Stage 2, Stage 3 and POCI, as described below: • Stage 1: When loans are first recognised, the Bank recognises an allowance based on 12mECLs. Stage 1loans also include facilities
where the credit risk has improved and the loan has been reclassified from Stage 2. • Stage 2: When a loan has shown a significant increase in credit risk since origination, the Bank records an allowance for the LTECLs.
Stage 2 loans also include facilities, where the credit risk has improved and the loan has been reclassified from Stage 3.
Bank Sohar SAOG ───────────────────────────────────────────────────────────────────── NOTES TO THE INTERIM CONDENSED FINANCIAL STATEMENTS (continued) FOR THE SIX MONTHS ENDED 30 JUNE 2018 (RO’000)
Page 16 of 49
A4 Significant accounting policies (continued) A4.3.g Impairment of financial assets (Policy applicable from 1 January 2018) (continued)
• Stage 3: Loans considered credit-impaired .The bank records an allowance for the LTECLs. For financial assets for which the Bank has no reasonable expectations of recovering either the entire outstanding amount, or a proportion thereof, the gross carrying amount of the financial asset is reduced. This is considered a (partial) derecognition of the financial asset.
(ii) The calculation of ECLs
The Bank calculates ECLs based on a four probability-weighted scenarios to measure the expected cash shortfalls, discounted at an approximation to the EIR. A cash shortfall is the difference between the cash flows that are due to an entity in accordance with the contract and the cash flows that the entity expects to receive. The mechanics of the ECL calculations are outlined below and the key elements are, as follows: • PD - The Probability of Default is an estimate of the likelihood of default over a given time horizon. A default may only happen at a
certain time over the assessed period, if the facility has not been previously derecognised and is still in the portfolio. • EAD - The Exposure at Default is an estimate of the exposure at a future default date, taking into account expected changes in the
exposure after the reporting date, including repayments of principal and interest, whether scheduled by contract or otherwise, expected drawdowns on committed facilities, and accrued interest from missed payments.
• LGD - The Loss Given Default is an estimate of the loss arising in the case where a default occurs at a given time. It is based on the difference between the contractual cash flows due and those that the Bank would expect to receive, including from the realisation of any collateral. It is usually expressed as a percentage of the EAD.
When estimating the ECLs, the Bank considers four scenarios (a base case, an upside, a mild downside (‘downside 1’) and a more extreme downside (‘downside 2’)). Each of these is associated with different PDs, EADs and LGDs. When relevant, the assessment of multiple scenarios also incorporates how defaulted loans are expected to be recovered, including the probability that the loans will cure and the value of collateral or the amount that might be received for selling the asset. With the exception of credit cards and other revolving facilities, the maximum period for which the credit losses are determined is the contractual life of a financial instrument unless the Bank has the legal right to call it earlier.
Impairment losses and releases are accounted for and disclosed separately from modification losses or gains that are accounted for as an adjustment of the financial asset’s gross carrying value. The mechanics of the ECL method are summarised below:
• Stage 1: The 12mECL is calculated as the portion of LTECLs that represent the ECLs that result from default events on a financial instrument that are possible within the 12 months after the reporting date. The Bank calculates the 12mECL allowance based on the expectation of a default occurring in the 12 months following the reporting date. These expected 12-month default probabilities are applied to a forecast EAD and multiplied by the expected LGD and discounted by an approximation to the original EIR. This calculation is made for each of the four scenarios, as explained above.
• Stage 2: When a loan has shown a significant increase in credit risk since origination, the Bank records an allowance for the LTECLs. The mechanics are similar to those explained above, including the use of multiple scenarios, but PDs and LGDs are estimated over the lifetime of the instrument. The expected cash shortfalls are discounted by an approximation to the original EIR.
• Stage 3: For loans considered credit-impaired, the Bank recognises the lifetime expected credit losses for these loans. The method is similar to that for Stage 2 assets, with the PD set at 100%.
• POCI: POCI assets are financial assets that are credit impaired on initial recognition. The Bank only recognises the cumulative changes in lifetime ECLs since initial recognition, based on a probability-weighting of the four scenarios, discounted by the credit adjusted EIR.
• Loan commitments and letters of credit: When estimating LTECLs for undrawn loan commitments, the Bank estimates the expected portion of the loan commitment that will be drawn down over its expected life. The ECL is then based on the present value of the expected shortfalls in cash flows if the loan is drawn down, based on a probability-weighting of the four scenarios. The expected cash shortfalls are discounted at an approximation to the expected EIR on the loan.
• Credit cards and revolving facilities that include both a loan and an undrawn commitment, ECLs are calculated and presented together with the loan. For loan commitments and letters of credit, the ECL is recognised within Provisions.
• Financial guarantee contracts: The Bank’s liability under each guarantee is measured at the higher of the amount initially recognised less cumulative amortisation recognised in the income statement, and the ECL provision. For this purpose, the Bank estimates ECLs based on the present value of the expected payments to reimburse the holder for a credit loss that it incurs. The shortfalls are discounted by the risk-adjusted interest rate relevant to the exposure. The calculation is made using a probability-weighting of the four scenarios. The ECLs related to financial guarantee contracts are recognised within Provisions.
Bank Sohar SAOG ───────────────────────────────────────────────────────────────────── NOTES TO THE INTERIM CONDENSED FINANCIAL STATEMENTS (continued) FOR THE SIX MONTHS ENDED 30 JUNE 2018 (RO’000)
Page 17 of 49
A4 Significant accounting policies (continued)
A4.3.g Impairment of financial assets (Policy applicable from 1 January 2018) (continued)
(iii) Debt instruments measured at fair value through OCI The ECLs for debt instruments measured at FVOCI do not reduce the carrying amount of these financial assets in the statement of financial position, which remains at fair value. Instead, an amount equal to the allowance that would arise if the assets were measured at amortised cost is recognised in OCI as an accumulated impairment amount, with a corresponding charge to profit or loss. The accumulated loss recognised in OCI is recycled to the profit and loss upon derecognition of the assets.
(iv) Purchased or originated credit impaired financial assets (POCI)
For POCI financial assets, the Bank only recognises the cumulative changes in LTECL since initial recognition in the loss allowance. (v) Credit cards and other revolving facilities The Bank’s product offering includes a variety of corporate and retail overdraft and credit cards facilities, in which the Bank has the right to cancel and/or reduce the facilities with one day’s notice. The Bank does not limit its exposure to credit losses to the contractual notice period, but, instead calculates ECL over a period that reflects the Bank’s expectations of the customer behaviour, its likelihood of default and the Bank’s future risk mitigation procedures, which could include reducing or cancelling the facilities. The ongoing assessment of whether a significant increase in credit risk has occurred for revolving facilities is similar to other lending products. This is based on shifts in the customer’s internal credit grade, but greater emphasis is also given to qualitative factors such as changes in usage. The interest rate used to discount the ECLs for credit cards is based on the average effective interest rate that is expected to be charged over the expected period of exposure to the facilities. This estimation takes into account that many facilities are repaid in full each month and are consequently charged no interest.
(vi) Forward looking information In its ECL models, the Bank relies on a broad range of forward looking information as economic inputs, such as: • GDP growth • Unemployment rates • Central Bank base rates • House price indices The inputs and models used for calculating ECLs may not always capture all characteristics of the market at the date of the financial statements. To reflect this, qualitative adjustments or overlays are occasionally made as temporary adjustments when such differences are significantly material. (vii) Collateral valuation To mitigate its credit risks on financial assets, the Bank seeks to use collateral, where possible. The collateral comes in various forms, such as cash, securities, letters of credit/guarantees, real estate, receivables, inventories, other non-financial assets and credit enhancements such as netting agreements. The Bank’s accounting policy for collateral assigned to it through its lending arrangements under IFRS 9 is the same as it was under IAS 39. Collateral, unless repossessed, is not recorded on the Bank’s statement of financial position. However, the fair value of collateral affects the calculation of ECLs. It is generally assessed, at a minimum, at inception and re-assessed periodically based on the type of asset, for example, cash or securities relating to margining requirements, is valued daily. To the extent possible, the Bank uses active market data for valuing financial assets held as collateral. Other financial assets which do not have readily determinable market values are valued using models. Non-financial collateral, such as real estate, is valued by certified third party valuers. (viii) Write-offs The Bank’s accounting policy under IFRS 9 remains the same as it was under IAS 39. Financial assets are written off either partially or in their entirety only when the Bank has stopped pursuing the recovery. If the amount to be written off is greater than the accumulated loss allowance, the difference is first treated as an addition to the allowance that is then applied against the gross carrying amount. Any subsequent recoveries are credited to credit loss expense.
Bank Sohar SAOG ───────────────────────────────────────────────────────────────────── NOTES TO THE INTERIM CONDENSED FINANCIAL STATEMENTS (continued) FOR THE SIX MONTHS ENDED 30 JUNE 2018 (RO’000)
Page 18 of 49
A4 Significant accounting policies (continued)
A4.3.g Impairment of financial assets (Policy applicable from 1 January 2018) (continued) (ix) Forborne and modified loans The Bank sometimes makes concessions or modifications to the original terms of loans as a response to the borrower’s financial difficulties, rather than taking possession or to otherwise enforce collection of collateral. The Bank considers a loan forborne when such concessions or modifications are provided as a result of the borrower’s present or expected financial difficulties and the Bank would not have agreed to them if the borrower had been financially healthy. Indicators of financial difficulties include defaults on covenants or significant concerns raised by the Credit Risk Department. Forbearance may involve extending the payment arrangements and the agreement of new loan conditions. Once the terms have been renegotiated, any impairment is measured using the original EIR as calculated before the modification of terms. It is the Bank’s policy to monitor forborne loans to help ensure that future payments continue to be likely to occur. Derecognition decisions and classification between Stage 2 and Stage 3 are determined on a case-by-case basis. If these procedures identify a loss in relation to a loan, it is disclosed and managed as an impaired Stage 3 forborne asset until it is collected or written off. From 1 January 2018, when the loan has been renegotiated or modified but not derecognised, the Bank also reassesses whether there has been a significant increase in credit risk. The Bank also considers whether the assets should be classified as Stage 3. Once an asset has been classified as forborne, it will remain forborne for a minimum 12-month probation period. In order for the loan to be reclassified out of the forborne category, the customer has to meet all of the following criteria: • All of its facilities has to be considered performing • The probation period of two years has passed from the date the forborne contract was considered performing • Regular payments of more than an insignificant amount of principal or interest have been made during at least half of the probation
period • The customer does not have any contract that is more than 30 days past due.
The Bank assesses at each reporting date whether there is objective evidence that a financial asset or a group of financial assets is impaired. A financial asset or a group of financial assets is impaired and an impairment loss is incurred if, and only if, there is objective evidence of impairment as a result of one or more events that occurred after the initial recognition of the asset (a loss event) and that loss event (or events) has an impact on the estimated future cash flows of the financial asset or group of financial assets that can be reliably estimated. Objective evidence that a financial asset or group of assets is impaired includes observable data that comes to the attention of the Bank about the following loss events as well as considering the guidelines issued by the Central Bank of Oman:
• significant financial difficulty of the issuer or obligor; • a breach of contract, such as a default or delinquency in interest or principal payments; • the Bank granting to the borrower, for economic or legal reasons relating to the borrower’s financial difficulty, a concession that the
lender would not otherwise consider; • it becoming probable that the borrower will enter bankruptcy or other financial reorganisation; • the disappearance of an active market for that financial asset because of financial difficulties; or • observable data indicating that there is a measurable decrease in the estimated future cash flows from a group of financial assets since
the initial recognition of those assets, although the decrease cannot yet be identified with the individual financial assets in the group, including adverse changes in the payment status of borrowers in the group, or national or local economic conditions that correlate with defaults on the assets in the group.
(i) Assets carried at amortised cost
The Bank first assesses whether objective evidence of impairment exists individually for financial assets that are individually significant, and individually or collectively for financial assets that are not individually significant. If the Bank determines that no objective evidence of impairment exists for an individually assessed financial asset, whether significant or not, it includes the asset in a group of financial assets with similar credit risk characteristics and collectively assesses them for impairment. Assets that are individually assessed for impairment and for which an impairment loss is or continues to be recognised are not included in a collective assessment of impairment. If there is objective evidence that an impairment loss on loans and receivables or held to maturity investments carried at amortised cost has been incurred, the amount of the loss is measured as the difference between the asset’s carrying amount and the present value of estimated future cash flows (excluding future credit losses that have not been incurred) discounted at the financial asset’s original effective interest rate. The carrying amount of the asset is reduced through the use of an allowance account and the amount of the loss is recognised in the statement of comprehensive income. If a loan or held to maturity investment has a variable interest rate, the discount rate for measuring any impairment loss is the current effective interest rate determined under the contract. The calculation of the present value of the estimated future cash flows of a collateralised financial asset reflects the cash flows that may result from foreclosure less costs for obtaining and selling the collateral, whether or not foreclosure is probable.
Bank Sohar SAOG ───────────────────────────────────────────────────────────────────── NOTES TO THE INTERIM CONDENSED FINANCIAL STATEMENTS (continued) FOR THE SIX MONTHS ENDED 30 JUNE 2018 (RO’000)
Page 19 of 49
A4 Significant accounting policies (continued)
A4.3.g Impairment of financial assets (Policy applicable from 1 January 2018) (continued) Future cash flows in a group of financial assets that are collectively evaluated for impairment are estimated on the basis of the contractual cash flows of the assets in the group and historical loss experience for assets with credit risk characteristics similar to those in the group.
The methodology and assumptions used for estimating future cash flows are reviewed regularly by the Bank to reduce any differences between loss estimates and actual loss experience. When a loan is uncollectible, it is written off against the related allowance for loan impairment. Such loans are written off after all the necessary procedures have been completed and the amount of the loss has been determined. If in a subsequent period, the amount of impairment loss decreases and decrease can be related objectively to an event occurring after the impairment was recognised, the previously recognised impairment loss is reversed by adjusting the allowance account. The amount of the reversal is recognised in the statement of comprehensive income. Also refer to note B3 for loans, advances and financing.
(ii) Assets classified as available for sale
The Bank assesses at the end of each reporting period whether there is objective evidence that a financial asset or a group of financial assets is impaired. For debt securities, the Bank uses the criteria referred to at (i) above. In the case of equity investments classified as available for sale, a significant or prolonged decline in the fair value of the security below its cost is evidence that the assets are impaired. If any such evidence exists for available for sale financial assets, the cumulative loss – measured as the difference between the acquisition cost and the current fair value, less any impairment loss on that financial asset previously recognised in profit or loss - is removed from equity and recognised in the profit or loss. Impairment losses on equity instruments recognised in the profit or loss are not reversed through statement of profit or loss.
A4.3.h Amortised cost measurement
The amortised cost of a financial asset or liability is the amount at which the financial asset or liability is measured at initial recognition, minus principal repayments, plus or minus the cumulative amortisation using the effective interest rate of any difference between the initial amount recognised and the maturity amount, minus any reduction for impairment.
A4.3.i Fair value measurement
A number of the Bank’s accounting policies and disclosures require the determination of fair value, for both financial and non-financial assets and liabilities. Fair values have been determined for measurement and/or disclosure purposes based on a number of accounting policies and methods. Where applicable, information about the assumptions made in determining fair values is disclosed in the notes specific to that asset or liability. Fair value is the price that would be received to sell an asset or paid to transfer a liability in an orderly transaction between market participants at the measurement date. The fair value measurement is based on the presumption that the transaction to sell the asset or transfer the liability takes place either: • In the principal market for the asset or liability, or • In the absence of a principal market, in the most advantageous market for the asset or liability The principal or the most advantageous market must be accessible to the Bank. The fair value of an asset or a liability is measured using the assumptions that market participants would use when pricing the asset or liability, assuming that market participants act in their economic best interest. A fair value measurement of a non-financial asset takes into account a market participant's ability to generate economic benefits by using the asset in its highest and best use or by selling it to another market participant that would use the asset in its highest and best use. The Bank uses valuation techniques that are appropriate in the circumstances and for which sufficient data are available to measure fair value, maximising the use of relevant observable inputs and minimising the use of unobservable inputs. All assets and liabilities for which fair value is measured or disclosed in the financial statements are categorised within the fair value hierarchy, described as follows, based on the lowest level input that is significant to the fair value measurement as a whole:
• Level 1 — Quoted (unadjusted) market prices in active markets for identical assets or liabilities • Level 2 — Valuation techniques for which the lowest level input that is significant to the fair value measurement is directly or
indirectly observable • Level 3 — Valuation techniques for which the lowest level input that is significant to the fair value measurement is unobservable.
Bank Sohar SAOG ───────────────────────────────────────────────────────────────────── NOTES TO THE INTERIM CONDENSED FINANCIAL STATEMENTS (continued) FOR THE SIX MONTHS ENDED 30 JUNE 2018 (RO’000)
Page 20 of 49
A4 Significant accounting policies (continued)
A4.3.i Fair value measurement (continued) For assets and liabilities that are recognised in the financial statements on a recurring basis, the Bank determines whether transfers have occurred between Levels in the hierarchy by re-assessing categorisation (based on the lowest level input that is significant to the fair value measurement as a whole) at the end of each reporting period. At each reporting date, the Bank analyses the movements in the values of assets and liabilities which are required to be re-measured or re-assessed as per the Bank’s accounting policies. For this analysis, the Bank verifies the major inputs applied in the latest valuation by agreeing the information in the Valuation computation to contracts and other relevant documents. The Bank also compares the changes in the fair value of each asset and liability with relevant external sources to determine whether the change is reasonable. For the purpose of fair value disclosures, the Bank has determined classes of assets and liabilities on the basis of the nature, characteristics and risks of the asset or liability and the level of the fair value hierarchy as explained above.
A4.3.j Cash and cash equivalents
Cash and cash equivalents consist of cash in hand, unrestricted balances held with central banks and highly liquid financial assets with original maturities of up to three months, which are subject to insignificant risk of changes in their fair value, and are used by the Bank in management of its short term commitments. Cash and cash equivalents are carried at amortised cost in the statement of financial position.
A4.3.k Repurchase and resale agreements
Securities sold with a commitment to repurchase (repos) at a specified future date are recognised in the statement of financial position and are measured in accordance with accounting policies for trading securities or investment securities. The counterparty liability for amounts received under these agreements is included in ‘due to banks and other money market borrowings’. The difference between sale and repurchase price is treated as interest expense and accrued over the life of the repo agreement. Securities purchased with a corresponding commitment to resell at a specified future date (reverse repos) are not recognised in the statement of financial position and the amounts paid under these agreements are included in ‘due from banks and other money market placements’. The difference between purchase and resale price is treated as interest income and accrued over the life of the reverse repo agreement.
A4.3.l Acceptances
Acceptances are disclosed on the statement of financial position under other assets with corresponding liability disclosed under other liabilities. Therefore, there is no off-balance sheet commitment for acceptances.
A4.3.m Derivatives held for risk management purposes
Derivatives held for risk management purposes include all derivative assets and liabilities that are not classified as trading assets or trading liabilities. Derivatives held for risk management purposes are measured at fair value in the statement of financial position. The treatment of changes in their fair value depends on their classification into the following categories:
(i) Cash flow hedge
When a derivative is designated as a hedge of the change in fair value of a recognised asset or liability or a firm commitment, changes in the fair value of the derivative are recognised immediately in statement of comprehensive income together with changes in the fair value of the hedged item that are attributable to the hedged risk.
If the derivative expires or is sold, terminated, or exercised, no longer meets the criteria for fair value hedge accounting, or the designation is revoked, hedge accounting is discontinued. Any adjustment up to that point, to a hedged item for which the effective interest method is used, is amortised to profit or loss as part of the recalculated effective interest rate of the item over its remaining life.
(ii) Cash flow hedge
When a derivative is designated as the hedging instrument in a hedge of the variability in cash flows attributable to a particular risk associated with a recognised asset or a liability or a highly probable forecast transaction that could affect profit or loss, the effective portion of changes in the fair value of the derivative is recognised in other comprehensive income in hedging reserve. The amount recognised in
Bank Sohar SAOG ───────────────────────────────────────────────────────────────────── NOTES TO THE INTERIM CONDENSED FINANCIAL STATEMENTS (continued) FOR THE SIX MONTHS ENDED 30 JUNE 2018 (RO’000)
Page 21 of 49
A4 Significant accounting policies (continued) A4.3.m Derivatives held for risk management purposes (continued)
other comprehensive income is reclassified to profit or loss as a reclassification adjustment in the same period as the hedged cash flows affect profit or loss, and in the same line item in the statement of comprehensive income. Any ineffective portion of changes in the fair value of the derivative is recognised immediately in profit or loss.
If the hedging derivative expires or is sold, terminated, or exercised, or the hedge no longer meets the criteria for cash flow hedge accounting, or the hedge designation is revoked, then the hedge accounting is discontinued prospectively. In a discontinued hedge of a forecast transaction the cumulative amount recognised in other comprehensive income from the period when the hedge was effective is reclassified from the equity to statement of comprehensive income as a reclassification adjustment when the forecast transaction occurs and affects profit or loss. If the forecast transaction is no longer expected to occur, then the balance in other comprehensive income is reclassified immediately to profit or loss as a reclassification adjustment.
(iii) Other non-trading derivative
When a derivative is not held for trading, and is not designated in a qualifying hedge relationship, all changes in its fair value are recognised immediately in statement of comprehensive income.
A4.4 Property, equipment and fixtures
Items of property, equipment and fixtures are measured at historical cost less accumulated depreciation and impairment losses. Historical cost includes expenditure that is directly attributable to the acquisition of the asset and preparing the asset for its intended use. Depreciation is provided on a straight-line basis over the estimated useful lives of property, equipment and fixtures, except freehold land. The estimated useful lives for the current year are as follows: Asset Years Motor vehicles 5 Furniture and fixtures 6-7 Office equipment 6-7 Production software 10 Land and capital work in progress are not depreciated, but tested for impairment. The assets’ residual values, useful lives and depreciation methods are reviewed and adjusted if appropriate at each reporting date. An asset’s carrying amount is written down immediately to its recoverable amount if the asset’s carrying amount is greater than its estimated recoverable amount. Gains and losses on disposals are determined by comparing the proceeds with the carrying amount and are recognised within ‘other operating income’ in the statement of comprehensive income.
Subsequent costs are included in the asset’s carrying amount or recognised as a separate asset, as appropriate, only when it is probable that future economic benefits associated with the item will flow to the group and the cost of the item can be measured reliably. The carrying amount of the replaced part is derecognised. All other repairs and maintenance are charged to the profit or loss during the financial period in which they are incurred. A4.5 Investment properties
Investment properties comprise plots of land received by the Bank as grant from the Government of Sultanate of Oman during the year 2008. These are currently held for an undetermined business use and not occupied by the Bank. These are carried at the average valuation of the two professional valuators carried out during 2008. Subsequent to initial measurement these properties are carried at cost less accumulated impairments, if any.
A4.6 Deposits, debt securities issued and subordinated liabilities All money market and customer deposits are initially measured at fair value plus transaction cost and subsequently carried at amortised cost. Deposits, debt securities issued and subordinated liabilities are measured at their amortised cost using the effective interest method. The Bank classifies capital instruments as financial liabilities or equity instruments in accordance with the substance of the contractual terms of the instrument.
Bank Sohar SAOG ───────────────────────────────────────────────────────────────────── NOTES TO THE INTERIM CONDENSED FINANCIAL STATEMENTS (continued) FOR THE SIX MONTHS ENDED 30 JUNE 2018 (RO’000)
Taxation is provided in accordance with Omani fiscal regulations. Income tax comprises current and deferred tax. Income tax expense is recognised in the statement of comprehensive income except to the extent that it relates to items recognised directly in equity or other comprehensive income. Current tax is the expected tax payable on the taxable income for the year, using tax rates enacted or substantively enacted at the reporting date, and any adjustment to tax payable in respect of previous years. Deferred tax assets/liabilities are calculated using the liability method, providing for temporary differences between the carrying amounts of assets and liabilities for financial reporting purposes and the amounts used for taxation purposes. Deferred tax is measured at the tax rates that are expected to be applied to the temporary difference when they reverse, based on the laws that have been enacted or substantively enacted by the reporting date. A deferred tax asset is recognised only to the extent that it is probable that future taxable profits will be available against which the asset can be utilised. Deferred tax assets are reviewed at each reporting date and are reduced to the extent that it is no longer probable that the related tax benefit will be realised.
A4.8 Fiduciary assets
Assets held in trust or in a fiduciary capacity are not treated as assets of the Bank and accordingly are not included in these financial statements.
A4.9 Trade and settlement date accounting
All “regular way” purchases and sales of financial assets are recognised on the trade date, i.e. the date that the entity commits to purchase or sell the asset. Regular way purchase or sales are purchases or sales of financial assets that require delivery of assets within the time frame generally established by regulation or convention in the market place.
A4.10 Leases
Operating lease payments are recognised as an expense in the statement of comprehensive income on a straight-line basis over the lease term.
A4.11 Financial guarantees
Financial guarantees are contracts that require the issuer to make specified payments to reimburse the beneficiary for a loss incurred because the debtor fails to make payments when due, in accordance with the terms of the debt. Such guarantees are given to banks, financial institutions or other entities on behalf of the customers. Financial guarantees are initially recognised in the financial statements at fair value on the date the guarantee was issued. Subsequent to initial recognition, the Bank’s liabilities under such guarantees are measured at the higher of initial measurement, less amortisation calculated to recognise in the statement of comprehensive income the fee income earned on the straight line basis over the life of the guarantee and the best estimate of the expenditure required to settle any financial obligation arising at the reporting date. These estimates are determined based on experience of similar transactions and history of past losses, supplemented by the judgment of management. Any increase in the liability relating to guarantees is taken to the statement of comprehensive income. A4.12 Employee benefits
A4.12.a Terminal benefits End of service benefits are accrued in accordance with the terms of employment of the Bank's employees at the reporting date, having regard to the requirements of the Oman Labour Law 2003, as amended.
Contributions to a defined contribution retirement plan and occupational hazard insurance for Omani employees in accordance with the Omani Social Insurances Law of 1991 are recognised as an expense in the statement of comprehensive income as incurred.
Bank Sohar SAOG ───────────────────────────────────────────────────────────────────── NOTES TO THE INTERIM CONDENSED FINANCIAL STATEMENTS (continued) FOR THE SIX MONTHS ENDED 30 JUNE 2018 (RO’000)
Page 23 of 49
A4 Significant accounting policies (continued) A4.12.b Short term benefits
Short term benefit obligations are measured on an undiscounted basis and are expensed as the related service is provided. A provision is recognised for the amount expected to be paid if the Bank has a present legal or constructive obligation to pay this amount as a result of past service provided by the employee and the obligation can be estimated reliably.
A4.13 Earnings per share
The Bank presents basic and diluted earnings per share (EPS) data for its ordinary shares. Basic EPS is calculated by dividing the profit or loss attributable to ordinary shareholders of the Bank by the weighted average number of ordinary shares outstanding during the year. Diluted EPS is determined by adjusting the profit or loss attributable to ordinary shareholders and weighted average number of ordinary shares outstanding for the effects of all dilutive potential ordinary shares, which comprise convertible notes or similar instruments.
A4.14 Dividend on ordinary shares
Dividends on ordinary shares are recognised as a liability and deducted from equity when they are approved by the shareholders. Interim dividends are deducted from equity when they are paid. Dividends for the year that are approved after the reporting date are dealt with as an event after the balance sheet date. A4.15 Segment reporting
An operating segment is the component of the Bank that engages in business activities from which it may earn revenues and incur expenses, including revenue and expenses that relate to transactions with any of the Bank’s other components, whose operating results are reviewed regularly by the Bank’s Acting CEO (being the chief operating decision maker) to make decisions about resources allocated to each segment and assess its performance, and for which discrete financial information is available.
A4.16 Directors’ remuneration and sitting fees
The Directors’ remuneration is governed as set out in the Commercial Companies Law, regulations issued by the Capital Market Authority and the Articles of Association of the Company. The Annual General Meeting determines and approves the remuneration and the sitting fees for the Board of Directors and its sub-committees provided such fees, in accordance with Article 106 of the Commercial Companies Law of Oman of 1974 as amended, shall not exceed 5% of the annual net profit after deduction of the legal reserve and the optional reserve and the distribution of dividends to the shareholders provided that such fees does not exceed RO 200,000. The sitting fee for each Director does not exceed RO 10,000 in one year.
A4.17 Perpetual Tier I Capital Securities
The Bank classifies Perpetual Tier I Capital Securities as financial liabilities or equity instruments in accordance with the substance of the contractual terms of the Tier I Capital Securities. The Bank’s Perpetual Tier I Capital Securities are not redeemable by holders and bear an entitlement to distribution that is non-cumulative and at the discretion of the Board of Directors. Accordingly, they are presented as component within equity A5 Critical accounting estimates and judgements
The preparation of financial statements requires management to make judgements, estimates and assumptions that affect the application of accounting policies and reported amounts of assets, liabilities, income and expenses. The estimates and associated assumptions are based on historical experience and various other factors that are believed to be reasonable under the circumstances, the results of which form the basis of making the judgements about carrying values of assets and liabilities that are not readily apparent from other sources. The resulting accounting estimates will, by definition, seldom equal the related actual results. The estimates and underlying assumptions are reviewed on an ongoing basis. Revisions to accounting estimates are recognised in the period in which the estimate is revised if the revision affects only that period or in the period of the revision and future periods if the revision affects both current and future periods. The Bank’s significant accounting estimates are on:
Bank Sohar SAOG ───────────────────────────────────────────────────────────────────── NOTES TO THE INTERIM CONDENSED FINANCIAL STATEMENTS (continued) FOR THE SIX MONTHS ENDED 30 JUNE 2018 (RO’000)
Page 24 of 49
A5 Critical accounting estimates and judgements (continued) A5.1 Impairment losses on loans and advances
The measurement of impairment losses both under IFRS 9 and IAS 39 across all categories of financial assets requires judgement, in particular, the estimation of the amount and timing of future cash flows and collateral values when determining impairment losses and the assessment of a significant increase in credit risk. These estimates are driven by a number of factors, changes in which can result in different levels of allowances. The Bank’s ECL calculations are outputs of complex models with a number of underlying assumptions regarding the choice of variable inputs and their interdependencies. Elements of the ECL models that are considered accounting judgements and estimates include:
• The Bank’s internal credit grading model, which assigns PDs to the individual grades; • The Bank’s criteria for assessing if there has been a significant increase in credit risk and so allowances for financial assets should be
measured on a LTECL basis and the qualitative assessment; • The segmentation of financial assets when their ECL is assessed on a collective basis; • Development of ECL models, including the various formulas and the choice of inputs; • Determination of associations between macroeconomic scenarios and economic inputs, such as unemployment levels and collateral
values, and the effect on PDs, EADs and LGDs; and • Selection of forward-looking macroeconomic scenarios and their probability weightings, to derive the economic inputs into the ECL
models.
A5.2 Fair value of derivatives and other financial instruments
The fair value of financial instruments that are not traded in an active market (for example, over-the-counter derivatives) is determined by using valuation techniques. The Bank uses its judgement to select a variety of methods and makes assumptions that are mainly based on market conditions existing at the end of each reporting period. The Bank uses expected cash flow analysis for certain available for sale financial assets that are not traded in active markets.
A5.3 Taxes
Uncertainties exist with respect to the interpretation of tax regulations and the amount and timing of future taxable income. Given the wide range of business relationships and nature of existing contractual agreements, differences arising between the actual results and the assumptions made, or future changes to such assumptions, could necessitate future adjustments to tax income and expense already recorded. The Bank establishes provisions, based on reasonable estimates, for possible consequences of finalisation of tax assessments of the Bank. The amount of such provisions is based on various factors, such as experience of previous tax assessments and differing interpretations of tax regulations by the taxable entity and the responsible tax authority. Deferred tax assets are recognised for all unused tax losses to the extent that it is probable that taxable profit will be available against which the losses can be utilised. Significant management judgment is required to determine the amount of deferred tax assets that can be recognised, based upon the likely timing and level of future taxable profits together with future tax planning strategies.
A5.4 Fair value estimation of unquoted securities
In cases where the underlying assets are fair valued such as private equity funds, management uses net assets value. Management believes that net assets values of these investments are representative of their fair values as the majority of the underlying assets are fair valued and the reported net assets of those entities takes into account the updated fair values changes.
A5.5 Fee and commission income
The recognition of fee and commission income depends on the purpose for which fees are assessed and the basis of accounting for any associated financial instrument. Management applies certain assumptions and judgements to determine the fees that are an integral part of the effective interest rate of a financial instrument, fees that are earned as services are provided, and fees that are earned on the execution of a significant act.
Bank Sohar SAOG ───────────────────────────────────────────────────────────────────── NOTES TO THE INTERIM CONDENSED FINANCIAL STATEMENTS (continued) FOR THE SIX MONTHS ENDED 30 JUNE 2018 (RO’000)
Page 25 of 49
A6 Transition disclosures The following pages set out the impact of adopting IFRS 9 on the statement of financial position, and retained earnings including the effect of replacing IAS 39’s incurred credit loss calculations with IFRS 9’s ECLs. Due to a higher level of maturity of the models and processes used to calculate the IFRS 9 provision, the impact of adopting IFRS9 as disclosed in the financial statement as at31 March 2018 is restated in these financial statements .The below tables provide a comparison of the transition disclosure as at 31 March 2018 and those as at 30 June2018. (i) The impact of transition to IFRS 9 on reserves and retained earnings is as follows:
Retained earnings
Loan loss impairment
reserveSpecial reserve
Fair value reserve
As at 30 June 2018 Closing balance under IAS 39 (31 December 2017) 72,651 - 3,103 (656)Impact on reclassification and remeasurement (i):
Reclassification of debt securities from available for sale to amortised cost
- - - 314
Reclassification of debt and equity investment securities from available for sale to FVPL
(292) - - 292
Reclassification of equity securities from available for sale to FVOCI
2,547 - - (2,547)
Deferred tax in relation to the above - - - (94)Impact on recognition of Expected Credit Losses(ii):
Due from Banks, Central Banks and Other Financial Assets (275) (6) - -Loan and advances at amortised cost, including loan commitments and financial guarantees
(10,576) 1,309 (3,103) -
Debt securities at amortised cost (332) - - -Debt securities at FVOCI
(17) - - -
────── ────── ────── ──────Adjusted opening balance under IFRS 9 on date of initial application of 1 January 2018
63,706 1,303 - (2,691)
═════ ═════ ══════ ══════
Retained earnings
Loan loss impairment
reserveSpecial reserve
Fair value reserve
As at 31 March 2018 Closing balance under IAS 39 (31 December 2017) 72,651 - 3,103 (656)Impact on reclassification and remeasurement (i):
Reclassification of debt securities from available for sale to amortised cost
- - - 314
Reclassification of debt and equity investment securities from available for sale to FVPL
(292) - - 292
Reclassification of equity securities from available for sale to FVOCI
2,547 - - (2,547)
Deferred tax in relation to the above - - - (94)Impact on recognition of Expected Credit Losses(ii):
Due from Banks, Central Banks and Other Financial Assets - (281) - -Loan and advances at amortised cost, including loan commitments and financial guarantees
- 4,432 (3,103) -
Debt securities at amortised cost (923) - - -Debt securities at FVOCI
(17) - - -
────── ────── ────── ──────Adjusted opening balance under IFRS 9 on date of initial application of 1 January 2018
73,966 4,151 - (2,691)
═════ ═════ ══════ ══════
Bank Sohar SAOG ───────────────────────────────────────────────────────────────────── NOTES TO THE INTERIM CONDENSED FINANCIAL STATEMENTS (continued) FOR THE SIX MONTHS ENDED 30 JUNE 2018 (RO’000)
Page 26 of 49
(ii) The Bank performed a detailed analysis of its business models for managing financial assets as well as analysing their cash flow characteristics. The below table reconciles the original measurement categories and carrying amounts of financial assets in accordance with IAS 39 and the new measurement categories under IFRS 9 as at 31 December 2017.
As at 30 June 2018 Impact of IFRS 9 Original
classification under IAS 39
New classification under IFRS 9
Original carrying amount
Re-measurement Reclassification
New carrying amount
Financial assets Cash and balances with central banks LR AC 182,324 - - 182,324 Due from banks LR AC 104,203 (281) - 103,922 Loans and advances LR AC 2,098,748 (8,311) - 2,090,437 Investment securities – debt AFS AC 4,344 - (4,344) - Investment securities – debt AFS FVOCI 185,050 - - 185,050 Investment securities – debt AFS FVTPL - - 6,297 6,297 Investment securities – debt HTM AC 89,686 (332) 4,658 94,012 Investment securities – debt HFT FVTPL 105,372 - - 105,372 Investment securities – debt HFT FVOCI 5,328 - - 5,328 Investment securities – equity AFS FVOCI 23,961 (17) (6,297) 17,647 Investment securities – equity AFS FVTPL - - - - Other assets 22,049 (94) - 21,955 Accrued interest receivable LR AC - - - - Derivatives with positive fair value FVTPL FVTPL 1,744 - - 1,744 Other Balance sheet items Loan,commitments, financial guarantees, etc.
LR AC - (4,059) - (4,059)
Net Impact 2,822,809 (13,094) 314 2,810,029 L&R – Loans and receivables; AFS – Available for sale; HFT – Held for trading; AC – Amortised cost; FVTPL – Fair value through profit and loss; FVOCI – Fair value through other comprehensive income There were no changes to the classification and measurement of financial liabilities. As at 31 March 2018 Impact of IFRS 9 Original
classification under IAS 39
New classification under IFRS 9
Original carrying amount
Re-measurement Reclassification
New carrying amount
Financial assets Cash and balances with central banks LR AC 182,324 - - 182,324 Due from banks LR AC 104,203 (281) - 103,922 Loans and advances LR AC 2,098,748 5,388 - 2,104,136 Investment securities – debt AFS AC 4,344 - (4,344) - Investment securities – debt AFS FVOCI 185,050 - - 185,050 Investment securities – debt AFS FVTPL - - 6,297 6,297 Investment securities – debt HTM AC 89,686 (923) 4,658 93,421 Investment securities – debt HFT FVTPL 105,372 - - 105,372 Investment securities – debt HFT FVOCI 5,328 - - 5,328 Investment securities – equity AFS FVOCI 23,961 (17) (6,297) 17,647 Investment securities – equity AFS FVTPL - - - - Other assets 22,049 (94) - 21,955 Accrued interest receivable LR AC - - - - Derivatives with positive fair value FVTPL FVTPL 1,744 - - 1,744 Other Balance sheet items Loan,commitments, financial guarantees, etc.
LR AC - (4,059) - (4,059)
Net Impact 2,822,809 14 314 2,823,137
Bank Sohar SAOG ───────────────────────────────────────────────────────────────────── NOTES TO THE INTERIM CONDENSED FINANCIAL STATEMENTS (continued) FOR THE SIX MONTHS ENDED 30 JUNE 2018 (RO’000)
Page 27 of 49
A6 Transition disclosures (continued) (iii) The following table reconciles the closing impairment allowance for financial assets in accordance with IAS 39 as at 31
December 2017 to the opening ECL allowance determined in accordance with IFRS 9 as at 1 January 2018: As at 30 June 2018 31 December
2017 Re-measurement 1 January
2018Due from Banks, Central Banks and Other Financial Assets 1,039 281 1,320Loan and advances at amortised cost 49,483 8,311 57,794Loan commitments and financial guarantees - 4,059 4,059Debt securities at amortised cost - 332 332Debt securities at FVOCI - 17 17
────── ────── ────── 50,522 13,000 63,522
══════ ══════ ══════As at 31 March 2018 31 December
2017 Re-measurement 1 January
2018Due from Banks, Central Banks and Other Financial Assets 1,039 281 1,320Loan and advances at amortised cost 49,483 (5,388) 44,095Loan commitments and financial guarantees - 4,059 4,059Debt securities at amortised cost - 923 923Debt securities at FVOCI - 17 17
────── ────── ────── 50,522 (108) 50,414
══════ ══════ ══════
Bank Sohar SAOG ───────────────────────────────────────────────────────────────────── NOTES TO THE INTERIM CONDENSED FINANCIAL STATEMENTS (continued) FOR THE SIX MONTHS ENDED 30 JUNE 2018 (RO’000)
Page 28 of 49
B1 Cash and balances with Central Bank
30 June 31 December 30 June 2018 2017 2017 (Unaudited) (Audited) (Unaudited) Cash 24,200 16,853 17,394 Capital deposit with CBO 503 505 507 Balance with CBO 39,593 164,966 101,265 ────── ────── ────── 64,296 182,324 119,166 ══════ ══════ ══════
The capital deposit with CBO cannot be withdrawn without its approval. B2 Due from banks and other money market placements
30 June 31 December 30 June 2018 2017 2017 (Unaudited) (Audited) (Unaudited) Local currency: Money market placements 40,007 - - Foreign currency: Money market placements 23,229 50,888 55,842 Lending to banks 9,267 22,525 25,427 Demand balances 50,119 31,829 24,252 ————— ————— ————— 82,615 105,242 105,521 Expected credit loss allowance (399) - - Specific impairment allowance on lending to banks - (966) -
Portfolio impairment allowance on lending to banks - (73) (127)
An analysis of changes in the ECL allowance on Due from banks and other money market placements is as follows:
30 June 2018 (unaudited) 30 June
2017 Stage 1 Stage 2 Stage 3 Total (unaudited)
Balance at the beginning of the period 73 966 - 1,039 148Impact of adopting IFRS 9 (Note A6.iii) 281 - - 281 - ————— ————— ————— ————— —————ECL allowance as at 1 January 2018 354 966 - 1,320 148Net transfer between stages - - - - -Loans written off - (966) - (966) Net (release)/charge for the period (C5) 45 - - 45 (21)
Bank Sohar SAOG ───────────────────────────────────────────────────────────────────── NOTES TO THE INTERIM CONDENSED FINANCIAL STATEMENTS (continued) FOR THE SIX MONTHS ENDED 30 JUNE 2018 (RO’000)
Page 29 of 49
B3 Loans, advances and financing, net
30 June 31 December 30 June 2018 2017 2017 (Unaudited) (Audited) (Unaudited)
Gross loans, advances and financing include RO 165,801,529 (31 December 2017: RO 147,266,107; 30 June 2017: RO 131,150,020) under Islamic mode of financing through Sohar Islamic financing activities. Loans, advances and financing comprise:
30 June 31 December 30 June 2018 2017 2017 (Unaudited) (Audited) (Unaudited)
Bank Sohar SAOG ───────────────────────────────────────────────────────────────────── NOTES TO THE INTERIM CONDENSED FINANCIAL STATEMENTS (continued) FOR THE SIX MONTHS ENDED 30 JUNE 2018 (RO’000)
Page 30 of 49
B3 Loans, advances and financing, net (continued) The below table provides a Comparison of provision held as per IFRS 9 and required as per CBO norms
An analysis of changes in the ECL allowance on loans, advances and financing is as follows: Stage 1 Stage 2 Stage 3 TotalECL allowance as at 1 January 2018 - - - 42,946Impact of adopting IFRS 9 (Note A6 iii) - - - 8,311 ────── ────── ────── ──────Restated ECL allowance as at 1 January 2018 7,579 22,120 21,558 51,257Net transfer between stages - - - -Net charge/(release) for the period (C5) 577 (6,738) 13,361 7,200Transfer to memoranda accounts - - - -
══════ ══════ ══════ ══════ The movement in the impairment allowance per IAS 39 on loans, advances and financing is:
30 June 31 December 30 June 2018 2017 2017 (Unaudited) (Audited) (Unaudited) Portfolio impairment allowance Balance at beginning of period - 23,294 23,294 Provided during the period (note C5) - 1,820 883 ─────── ─────── ─────── Balance at the end of the period - 25,114 24,177 ═══════ ═══════ ═══════
Specific impairment allowance 1) Loan loss provision
Balance at beginning of period - 12,923 12,923 Provided during the period - 17,401 6,780 Written back due to recovery - (10,385) (3,849)
Bank Sohar SAOG ───────────────────────────────────────────────────────────────────── NOTES TO THE INTERIM CONDENSED FINANCIAL STATEMENTS (continued) FOR THE SIX MONTHS ENDED 30 JUNE 2018 (RO’000)
Page 31 of 49
Written off during the period - (56) (21) Transfer (to) / from memoranda accounts - (2,051) 182
─────── ─────── ─────── Balance at the end of the period (a) - 17,832 16,015 ═══════ ═══════ ═══════ 2) Contractual interest not recognised
Balance at beginning of period 6,537 5,211 5,211 Not recognised during the period 1,622 2,997 1,531 Written back due to recovery (514) (1,419) (874) Transfer to memoranda accounts - (252) -
─────── ─────── ─────── Balance at end of the period (b) 7,645 6,537 5,868 ═══════ ═══════ ═══════ Total impairment (a) + (b) 7,645 24,369 21,883 ═══════ ═══════ ═══════
The portfolio impairment allowance was established to meet credit risks inherent within loans, advances and financing at a portfolio level. All loans and advances require payment of interest, some at fixed rates and others at rates that reprise prior to maturity. Interest reserve account is maintained to comply with rules; regulations and guidelines issued by CBO on loans, advances and financing that are impaired. As of 30 June 2018, loans and advances on which interest was not being accrued or where interest was reserved amounted to RO 78.779 million. (As per CBO provision: 30 June 2018: 65.148million 31 December 2017: RO 49.803 million; 30 June 2017: RO 38.743million). Loans with renegotiated terms are defined as loans that have been restructured due to deterioration in the borrower’s financial position, for which the Bank has made concessions by agreeing to terms and conditions that are more favourable for the borrower than the Bank had provided initially and that it would not otherwise consider. A loan continues to be presented as part of loans with renegotiated terms until maturity, early repayment or write-off.
B4 Investments
30 June 31 December 30 June 2018 2017 2017 (Unaudited) (Audited) (Unaudited) Held at FVTPL 116,984 - - Held at FVOCI 314,834 - - Held at amortised cost 117,098 - - Held for trading investments - 110,700 85,644 Available for sale investments - 213,355 258,589 Held to maturity investments - 89,686 58,882 ─────── ─────── ─────── 548,916 413,741 403,115 ═══════ ═══════ ═══════
Bank Sohar SAOG ───────────────────────────────────────────────────────────────────── NOTES TO THE INTERIM CONDENSED FINANCIAL STATEMENTS (continued) FOR THE SIX MONTHS ENDED 30 JUNE 2018 (RO’000)
Page 32 of 49
B4 Investments (continued) B4.a Held at FVTPL:
Held for trading 30 June 31 December 30 June 2018 2017 2017 (Unaudited) (Audited) (Unaudited)
Government development bonds – Oman 104,319 105,372 80,299 Sukuk trust certificates – secured 5,287 5,328 5,345 Others 7,378 - - ─────── ─────── ─────── Total 116,984 110,700 85,644 ═══════ ═══════ ═══════
B4.b Held at FVOCI: Available for sale 30 June 2018 31 December 2017 30 June 2017 (Unaudited) (Audited) (Unaudited)
An analysis of changes in the ECL allowance on debt investments classified as held at FVOCI is as follows: Stage 1 Stage 2 Stage 3 Total Balance at beginning of the period - - - - Impact of adopting IFRS 9 (Note A6 iii) 17 - - 17 ─────── ─────── ─────── ─────── Restated ECL allowance as at 1 January 2018
17 - - 17
Net transfer between stages - - - - Net charge for the period (C5) 9 - - 9
────── ────── ────── ────── At 30 June 2018 26 - - 26
══════ ══════ ══════ ══════ • The carrying / fair value of available for sale investments are stated after reclassifying RO 3.323 million and RO 3.718 million
to the statement of comprehensive income as impairments on 31 December 2017 and 30 June 2017 respectively.
• Unquoted securities include an investment of RO2,500,000 (31 December 2017: RO 2,254,401; 30 June 2017: RO 1,881,519) in the Oman Development Fund SAOC (“Fund”). The Fund was incorporated on 7 May 2014 under license no. 1196427 with the Bank being the founder shareholder. The purpose of the Fund is to identify mid-segment industrial and manufacturing sectors that leverage Oman’s unique advantages such as its infrastructure, tax treaties, geography and natural mineral resources for potential investment opportunities. During the period the Bank invested RO 245,599 in line with the other investors in the fund. The Bank currently holds a nil 16.9% stake in the Fund (31 December 2017: 16.9%; 30 June 2017: 16.9%). The Bank has an Investment Management Agreement with the Fund.
Bank Sohar SAOG ───────────────────────────────────────────────────────────────────── NOTES TO THE INTERIM CONDENSED FINANCIAL STATEMENTS (continued) FOR THE SIX MONTHS ENDED 30 JUNE 2018 (RO’000)
Page 33 of 49
B4 Investments (continued) B4.b Held at FVOCI (continued)
• Treasury bills include investments in USD Treasury bills of RO 293.9 million (31 December 2017: RO 184.80 million; 30
June 2017: RO 185 million) assigned as collaterals against the Bank’s borrowings. B4.c Held at amortised cost:
Held to maturity 30 June 31 December 30 June 2018 2017 2017 (Unaudited) (Audited) (Unaudited)
An analysis of changes in the ECL allowance on debt investments classified as held at amortised cost is as follows: Stage 1 Stage 2 Stage 3 TotalBalance as at 1 January 2018 - - - -Impact of adopting IFRS 9 (Note A6 iii) 332 - - 332 ─────── ─────── ─────── ───────Restated ECL allowance as at 1 January 2018 332 - - 332Net charge for the period (C5) 75 - - 75
Bank Sohar SAOG ───────────────────────────────────────────────────────────────────── NOTES TO THE INTERIM CONDENSED FINANCIAL STATEMENTS (continued) FOR THE SIX MONTHS ENDED 30 JUNE 2018 (RO’000)
Page 34 of 49
B5 Other assets 30 June 31 December 30 June 2018 2017 2017 (Unaudited) (Audited) (Unaudited) Acceptances 37,792 9,847 14,939 Prepayments 3,637 2,215 3,062 Receivables 1,955 4,022 4,220 Positive fair value of derivatives (B17) 3,749 1,744 2,161 Others 8,963 5,965 5,082
─────── ─────── ─────── Total 56,096 23,793 29,464
═══════ ═══════ ═══════ B6 Due to banks and other money market borrowings
Bank Sohar SAOG ───────────────────────────────────────────────────────────────────── NOTES TO THE INTERIM CONDENSED FINANCIAL STATEMENTS (continued) FOR THE SIX MONTHS ENDED 30 JUNE 2018 (RO’000)
Page 35 of 49
B8 Other liabilities 30 June 31 December 30 June 2018 2017 2017 (Unaudited) (Audited) (Unaudited) Acceptances 37,792 9,847 14,939 Staff entitlements 2,209 3,144 2,501 Income tax payable 2,328 4,147 1,691 Negative fair value of derivatives (B17) 5,371 898 1,143 Deferred tax liabilities 372 284 155 Other accruals and provisions 40,307 13,131 11,429 Expected credit loss allowance on loan commitments and financial guarantees
2,722 - -
─────── ─────── ─────── Total 91,101 31,451 31,858 ═══════ ═══════ ═══════
An analysis of changes in the ECL allowance on loan commitments and financial guarantees is as follows: Stage 1 Stage 2 Stage 3 TotalBalance as the beginning of the year - - - -Impact of adopting IFRS 9 (Note A6 iii) 551 327 3,181 4,059 ────── ────── ────── ──────Restated ECL allowance as at 1 January 2018 551 327 3,181 4,059Net charge for the period (C5) 426 425 (2,188) (1,337)
══════ ══════ ══════ ══════ B9 Compulsorily convertible bonds Compulsorily convertible bonds of RO 7.150 million carrying an annual coupon rate of 4.5% were issued on 28 April 2013 as part of a dividend distribution. These bonds had to be converted into ordinary shares of the Bank in three equal instalments at the end of 3rd, 4th and 5th years from the date of issuance at a conversion price derived by applying a discount of 20% to the 3 months average share price of the Bank on the Muscat Securities Market prior to the date of conversion. Accordingly during 2016, 2017 and 2018 one-third of these bonds, amounting to RO 2.38 million each year were converted into ordinary shares of the Bank. The last instalment was converted on 28 April 2018 resulting in an outstanding balance with accrued interest as of 30 June 2018 of Nil (31 December 2017: RO 2.402 million; 30 June 2017: RO 2,402 million). B10 Share capital The authorised share capital of the Bank is 4,000,000,000 shares of RO 0.100 each (31 December 2017: 2,000,000,000 of RO 0.100 each; 30 June 2017: 2,000,000,000 of RO 0.100 each). The issued and paid up share capital of the Bank is 1,982,646,391 shares of RO 0.100 each (31 December 2017: 1,784,646,242 shares of RO 0.100 each; 30 June 2017 1,784,646,242 shares of RO 0.100 each). In the Extraordinary General Meeting and Annual General Meeting held on 29 March 2018, the shareholders approved the Board’s recommendation to increase the Bank’s authorised share capital from 2,000,000,000 shares of RO 0.100 each to 4,000,000,000 shares of RO 0.100 each and to distribute bonus shares equal to 10% of issued and paid up share capital as at 31 December 2017, resulting in the issuance of 178,464,624 new shares in March 2018. As of 30 June 2018, the following shareholders held 10% or more of the Bank’s capital, either individually or together with related parties:
Number of shares % Holding Oman Investment & Finance Co. SAOG 304,714,636 15.37 The Royal Court of Affairs 288,852,420 14.57
Bank Sohar SAOG ───────────────────────────────────────────────────────────────────── NOTES TO THE INTERIM CONDENSED FINANCIAL STATEMENTS (continued) FOR THE SIX MONTHS ENDED 30 JUNE 2018 (RO’000)
Page 36 of 49
B11 Special Reserve As required by CBO circular BSD/2017/BKUP/Banks & FLCs/467, the Bank reserved 10% of the outstanding exposure of restructured facilities that are not classified as non-performing loans as of 30 June 2018. After the implementation of IFRS 9 effective 1 Jan 2018, this reserve was reversed. B12 Impairment Reserve Effective Jan 2018, IFRS 9 was implemented replacing existing IAS39. CBO circular BM 1149 requires the Bank to create a reserve for the difference between CBO provisions and IFRS 9 if CBO provision is higher than IFRS 9 provision. As of Jan 2018 the Bank created a reserve of RO1.303 million for the difference that existed on 1 Jan 2018. During 2018, an additional RO 2.399 million was transferred totalling to RO3.702 million for the difference existing between IFRS 9 ECL impairments and CBO provision as of 30 June 2018. B13 Perpetual Tier 1 Capital Securities The Bank issued Perpetual Tier 1 Capital Securities amounting to OMR 100 million on 25th September 2017. The securities constitute direct, unconditional, subordinated and unsecured obligations of the Bank and are classified as equity in accordance with IAS 32: Financial Instruments – Classification. They do not have a fixed or final maturity date. The Bank may at its discretion and after prior consent from the relevant regulatory authority, exercise its option to redeem the securities in full (not in part) on the first Call Date i.e the 5th anniversary of the Issue Date, and on every fifth anniversary thereafter, again subject to the prior consent of the regulatory authorities. The Tier 1 Capital Securities bear interest on their nominal amount from the issue date to the first call date at a fixed annual rate of 7.75%. Thereafter the interest rate will be reset at five year intervals. Interest will be payable semi-annually in arrears and treated as a deduction from equity. The Bank at its sole discretion may elect not to distribute interest and this is not considered as an event of default. If the Bank does not pay interest on the Tier 1 Capital Securities, on a scheduled interest payment date (for whatever reason), then the Bank must not make any other distribution or payment on or with respect to its ordinary shares or any of its other Common Equity Tier 1 Instruments or securities, ranking junior to or pari passu with the Tier 1 Capital Securities unless and until it has paid one interest payment in full on the Tier 1 Capital Securities. The Tier 1 Capital Securities also allow the Bank to write-down (in whole or in part) any amounts due to the holders of the Securities in certain circumstances. RO 3.843 million was paid as coupon during 2018 and is recognised in the statement of changes in equity. B14 Contingent liabilities and commitments B14.a Contingent liabilities Standby letters of credit and guarantees commit the Bank to make payments on behalf of customers contingent upon the failure of the customer to perform under the terms of a specified contract.
30 June 31 December 30 June 2018 2017 2017 (Unaudited) (Audited) (Unaudited) Guarantees 407,468 376,583 365,169 Documentary letters of credit 125,698 79,520 42,798 ────── ────── ────── 533,166 456,103 407,967 ══════ ══════ ══════
Credit related commitments include commitments to extend credit, standby letters of credit and guarantees, which are designed to meet the requirements of the Bank’s customers. Commitments to extend credit represent contractual commitments to make loans and revolving credits. Commitments generally have fixed expiry dates or other termination clauses and require the payment of a fee. Since commitments may expire without being drawn upon, the total contracted amounts do not necessarily represent future cash obligations.
Bank Sohar SAOG ───────────────────────────────────────────────────────────────────── NOTES TO THE INTERIM CONDENSED FINANCIAL STATEMENTS (continued) FOR THE SIX MONTHS ENDED 30 JUNE 2018 (RO’000)
Page 37 of 49
B14 Contingent liabilities and commitments (continued) B14.b Contingent liabilities (continued)
30 June 31 December 30 June 2018 2017 2017
(Unaudited) (Audited) (Unaudited)
Capital commitments 1,663 516 1,332 Credit related commitments 310,969 278,448 439,757
In the ordinary course of business the Bank enters into transactions with certain of its directors, shareholders, senior management, Shari’a supervisory board, Shari’a reviewer and companies in which they have a significant interest. These transactions are conducted on an arm’s length basis and are approved by the Bank’s management and Board of Directors.
The aggregate amount of balances and the income and expenses generated with such related parties are as follows:
30 June 31 December 30 June 2018 2017 2017 (Unaudited) (Audited) (Unaudited)
Key management personnel Loans, advances and financing at the end of the period 3,620 2,659 2,697 Loans disbursed during the period 182 590 213 Loans repaid during the period (763) (655) (1,002) Deposits at the end of the period 1,284 725 838 Deposits received during the period 597 1,348 1,368 Deposits repaid during the period (151) (1,200) (1,120) Interest income during the period 180 133 72
Other related parties Loans, advances and financing at the end of the period 47,418 6,158 5,823 Loans disbursed during the period 58,701 16,956 7,087 Loans repaid during the period (1,305) (14,212) (6,194) Deposits at the end of the period 3,267 10,165 11,394 Deposits received during the period 2,976 11,242 10,821 Deposits repaid during the period (7,471) (13,562) (12,112) Interest income during the period 225 374 173 Interest expense during the period 16 556 348
Key management personnels’ compensation Salaries and other short term benefits 3,687 2,977 1,703 Post-employment benefits 88 96 48 Directors’ sitting fees and remuneration 163 199 176 Shari’a Supervisory Board members 24 44 20
The aggregate amount of balances and the income and expenses generated with shareholders holding 10% or more of the Banks’ shares are as follows:
Bank Sohar SAOG ───────────────────────────────────────────────────────────────────── NOTES TO THE INTERIM CONDENSED FINANCIAL STATEMENTS (continued) FOR THE SIX MONTHS ENDED 30 JUNE 2018 (RO’000)
Page 38 of 49
B15 Related party transactions (continued)
30 June 31 December 30 June 2018 2017 2017 (Unaudited) (Audited) (Unaudited)
Loans, advances and financing at the end of the period 3,129 - 19 Loans disbursed during the period 893 5,580 5,599 Loans repaid during the period (575) (23,765) (23,765) Deposits at the end of the period 929 1,262 4 Deposits received during the period 449 18 4 Deposits repaid during the period (824) (4,352) (5,595) Interest income during the period 75 62 58 Interest expense during the period 2 14 10
As at 30 June 2018, no loans to related parties are impaired (31 December 2017: Nil; 30 June 2017: Nil).
Bank Sohar SAOG ───────────────────────────────────────────────────────────────────── NOTES TO THE INTERIM CONDENSED FINANCIAL STATEMENTS (continued) FOR THE SIX MONTHS ENDED 30 JUNE 2018 (RO’000)
Page 39 of 49
B16 Fair value of financial instruments Fair value is the price that would be received to sell an asset or paid to transfer a liability in an orderly transaction between market participants at the measurement date. The fair value measurement is based on the presumption that the transaction to sell the asset or transfer the liability takes place either:
i) In the accessible principal market for the asset or liability; or ii) In the absence of a principal market, in the most advantageous accessible market for the asset or liability.
The Bank uses the following hierarchy for determining and disclosing the fair value of financial instruments:
Level 1: quoted prices in active markets for the same instrument (i.e., without modification or repacking); Level 2: quoted prices in active markets for similar assets and liabilities or other valuation techniques for which all significant inputs are based on observable market data; and Level 3: valuation techniques for which any significant input is not based on observable market data.
The Bank considers that the fair value of financial instruments was not significantly different to their carrying value (including accrued interest) at each of those dates. The table below sets out the classification and fair value of each class of financial assets and liabilities:
At 30 June 2018 (Unaudited )
Amortised cost FVOCI FVTPL
Total carrying (including
accrued interest)/fair
value Assets Cash and balances with CBO 64,296 - - 64,296Due from banks and other money market placements 122,223 - - 122,223Loans, advances and financing 2,198,162 - - 2,198,162Investments 117,098 314,834 116,984 548,916Other assets (excluding prepayments) 52,459 - - 52,459 ───── ───── ───── ─────Total 2,554,238 314,834 116,984 2,986,056 ═════ ═════ ═════ ═════Liabilities Due to banks and other money market borrowings 774,630Customers’ deposits 1,706,109Other liabilities (excluding other accruals & provisions) 50,794Compulsorily convertible bonds -Certificates of deposit 18,511Subordinated loans 35,385 ─────Total 2,585,429 ═════
Bank Sohar SAOG ───────────────────────────────────────────────────────────────────── NOTES TO THE INTERIM CONDENSED FINANCIAL STATEMENTS (continued) FOR THE SIX MONTHS ENDED 30 JUNE 2018 (RO’000)
Page 40 of 49
B16 Fair value of financial instruments (continued)
At 31 December 2017 (Audited)
Loans and receivables
Held to maturity
Available for sale
Held for trading
Total carrying (including
accrued interest)/fair
value Assets Cash and balances with CBO 182,324 - - - 182,324 Due from banks and other money market placements 104,203 - - - 104,203 Loans, advances and financing 2,098,748 - - - 2,098,748 Investments - 89,686 213,355 110,700 413,741 Other assets (excluding prepayments) 21,578 - - - 21,578 ───── ───── ───── ───── ───── Total 2,406,853 89,686 213,355 110,700 2,820,594 ═════ ═════ ═════ ═════ ═════ Liabilities Due to banks and other money market borrowings 718,619Customers’ deposits 1,642,845 Other liabilities (excluding other accruals & provisions) 18,320 Compulsorily convertible bonds 35,392 Certificates of deposit 2,402 Subordinated loans 18,513 ───── Total 2,436,091 ═════
At 30 June 2017 (Unaudited)
Loans and receivables
Held to maturity
Available for sale
Held for trading
Total carrying (including
accrued interest)/fair
value Assets Cash and balances with CBO 119,166 - - - 119,166 Due from banks and other money market placements 105,394 - - - 105,394 Loans, advances and financing 1,997,612 - - - 1,997,612 Investments - 58,882 258,589 85,644 403,115 Other assets (excluding prepayments) 26,402 - - - 26,402 ───── ───── ───── ───── ───── Total 2,248,574 58,882 258,589 85,644 2,651,689 ═════ ═════ ═════ ═════ ═════ Liabilities Due to banks and other money market borrowings 595,369 Customers’ deposits 1,660,253 Other liabilities (excluding other accruals & provisions) 20,692 Compulsorily convertible bonds 2,402 Certificates of deposit 18,511 Subordinated loans 86,561 ───── Total 2,383,788 ═════
Bank Sohar SAOG ───────────────────────────────────────────────────────────────────── NOTES TO THE INTERIM CONDENSED FINANCIAL STATEMENTS (continued) FOR THE SIX MONTHS ENDED 30 JUNE 2018 (RO’000)
Page 41 of 49
B16 Fair value of financial instruments (continued) The table below analyses financial instruments measured at fair value at the end of the reporting period:
Bank Sohar SAOG ───────────────────────────────────────────────────────────────────── NOTES TO THE INTERIM CONDENSED FINANCIAL STATEMENTS (continued) FOR THE SIX MONTHS ENDED 30 JUNE 2018 (RO’000)
Page 42 of 49
B17 Derivatives The table below sets out the positive and negative fair values of derivative financial instruments, together with their notional amounts, analysed by the term to maturity. The notional amounts, which provide an indication of the volumes of the transactions outstanding at the end of the period, do not necessarily reflect the amounts of future cash flows involved. These notional amounts, therefore, are neither indicative of the Bank’s exposure to credit risk, which is generally limited to the positive fair value of the derivatives, nor to market risk.
Notional amounts by term to maturity As at 30 June 2018 (Unaudited )
Bank Sohar SAOG ───────────────────────────────────────────────────────────────────── NOTES TO THE INTERIM CONDENSED FINANCIAL STATEMENTS (continued) FOR THE THREE MONTHS ENDED 31 March 2018 (Unaudited) (RO’000)
Page 43 of 49
C1 Interest income For the six months ended For the three month ended
30 June 30 June 30 June 30 June 2018 2017 2018 2017 Loans and advances to customers 54,156 47,621 27,926 24,083 Due from banks and other money market placements 2,410 1,083 1,194 515 Investments 6,370 3,386 3,391 1,888 ───── ───── ───── ───── 62,936 52,090 32,511 26,486 ═════ ═════ ═════ ═════
C2 Interest expense For the six months ended For the three month ended
30 June 30 June 30 June 30 June 2018 2017 2018 2017 Customers’ deposits 20,426 20,471 10,514 9,936 Subordinated loans 1,215 2,827 611 1,422 Due to banks and other money market borrowings 13,594 7,166 7,149 3,758 Compulsorily convertible bonds 34 88 8 35 ───── ───── ───── ───── 35,269 30,552 18,282 15,151 ═════ ═════ ═════ ═════
C3 Other operating income For the six months ended For the three month ended
30 June 30 June 30 June 30 June 2018 2017 2018 2017 Fees and commission 8,004 8,573 3,388 4,560 Net gains from foreign exchange dealings 5,233 2,828 2,362 1,002 Bad debt recovery written off earlier 88 30 44 22 Dividends income 380 569 111 49 Net losses on FVTPL investments (1,127) - (599) - ───── ───── ───── ───── 12,578 12,000 5,306 5,633 ═════ ═════ ═════ ═════
C4 Other operating expenses For the six months ended For the three month ended
30 June 30 June 30 June 30 June 2018 2017 2018 2017 Operating and administration costs 4,774 4,601 2,481 2,424 Capital work in progress written off 1,100 1,100 Occupancy cost 1,290 1,247 653 624 Directors sitting fees 163 176 145 21 Shari’a supervisory board remuneration and sitting fees 24 20 12 13 ───── ───── ───── ───── 7,351 6,044 4,391 3,082 ═════ ═════ ═════ ═════
Bank Sohar SAOG ───────────────────────────────────────────────────────────────────── NOTES TO THE INTERIM CONDENSED FINANCIAL STATEMENTS (continued) FOR THE THREE MONTHS ENDED 31 March 2018 (Unaudited) (RO’000)
Page 44 of 49
C5 Credit loss expense on financial assets
For the six months ended For the three month ended 30 June 30 June 30 June 30 JuneProvided during the period: 2018 2017 2018 2017 Credit loss expense/(release) on
Loans, advance and financing 7,200 - 5,502 -Loan commitments and financial guarantees (1,337) - (1,771) -Due from banks and other money market placements 45 - 109 -Debt securities at amortised cost 75 - (63) -Debt securities at FVOCI 9 2 -
Loans written off during the period (73) 4 ────── ────── ────── ──────Total credit loss expense 5,919 - 3,783 -Portfolio impairment on:
Loans, advances and financing - 883 - 847Lending to banks - (21) - (23) ────── ────── ────── ──────
Bank Sohar SAOG ───────────────────────────────────────────────────────────────────── NOTES TO THE INTERIM CONDENSED FINANCIAL STATEMENTS (continued) FOR THE THREE MONTHS ENDED 31 March 2018 (Unaudited) (RO’000)
Page 45 of 49
C6 Basic and diluted earnings per share
Basic earnings per share are calculated by dividing net profit for the period by the weighted average number of shares outstanding during the period. For the six months ended For the three month ended 30 June 30 June 30 June 30 June 2018 2017 2018 2017
Net profit for the period 13,982 11,566 5,078 5,574
─────── ─────── ─────── ─────── Weighted average number of shares outstanding during the
period (in thousands) 1,982,646 1,982,646 1,982,646 1,982,646
─────── ─────── ─────── ─────── Basic earnings per share (in baizas) 7.052 5.834 2.561 2.811
═══════ ═══════ ═══════ ═══════ Basic earnings per share annualized (in baizas) 14.221 11.764 10.273 11.276
═══════ ═══════ ═══════ ═══════
In the Annual General Meeting held on 29 March 2018, the shareholders approved the Board’s recommendation to distribute 10% bonus shares resulting in the issuance of 178,464,624 new shares.
Diluted earnings per share is calculated by dividing the net profit attributable to ordinary shareholders (after adjusting for interest on the compulsorily convertible bonds, net of income tax) for the period by the weighted average number of ordinary shares including the dilutive potential of ordinary shares that would be issued on the conversion of the compulsorily convertible bonds into ordinary shares. The compulsorily convertible bonds was fully converted as of 30 June 2018. For the six months ended For the three month ended
30 June 30 June 30 June 30 June 2018 2017 2018 2017
Net profit for the period - 11,566 - 5,574 Interest on convertible bonds, net of income tax - 75 - 29 ─────── ─────── ─────── ─────── - 11,641 - 5,603 ═══════ ═══════ ═══════ ═══════ Weighted average number of shares outstanding during the period - 2,003,371 - 2,003,371 period after dilution (in thousands) ─────── ─────── ─────── ─────── Diluted earnings per share (in baizas) - 5.810 - 2.797 ═══════ ═══════ ═══════ ═══════ Diluted earnings per share annualized (in baizas) - 11.717 - 11.219 ═══════ ═══════ ═══════ ═══════ The reconciliation of weighted average number of shares shown under basic earnings and diluted earnings are as follow: For the six months ended For the three month ended 30 June 30 June 30 June 30 June 2018 2017 2018 2017 Weighted average number of shares outstanding during the - 1,982,646 - 1,982,646 period Dilutive potential of ordinary shares to be issued on the - 20,725 - 20,725
conversion of convertible bonds ─────── ─────── ─────── ───────
Weighted average number of shares outstanding during the - 2,003,371 - 2,003,371
═══════ ═══════ ═══════ ═══════
Bank Sohar SAOG ───────────────────────────────────────────────────────────────────── NOTES TO THE INTERIM CONDENSED FINANCIAL STATEMENTS (continued) FOR THE THREE MONTHS ENDED 31 March 2018 (Unaudited) (RO’000)
Page 46 of 49
C7 Net income from Islamic financing and investing activities C7.a Income earned from Islamic financing and investing activities For the six months ended For the three month ended
30 June 30 June 30 June 30 June 2018 2017 2018 2017 Financing to customers 3,939 2,914 2,027 1,622 Due from banks and other money market placements 112 19 66 6 Investments 421 250 216 136 ────── ────── ────── ────── 4,472 3,183 2,309 1,764 ────── ────── ────── ──────
C7.b Profit paid to depositors / money market borrowings For the six months ended For the three month ended
30 June 30 June 30 June 30 June 2018 2017 2018 2017 Profit paid to depositors 2,115 1,476 1,092 846 Profit paid to banks and other money market borrowings 99 111 57 74 ────── ────── ────── ────── 2,214 1,587 1,149 920 ────── ────── ────── ────── Net income from Islamic financing and investing 2,258 1,596 1,160 844 activities ══════ ══════ ══════ ══════
Bank Sohar SAOG ───────────────────────────────────────────────────────────────────── NOTES TO THE INTERIM CONDENSED FINANCIAL STATEMENTS (continued) FOR THE THREE MONTHS ENDED 31 March 2018 (RO’000)
Page 47 of 49
D Financial risk management D1 Liquidity risk D1.1 Exposure to liquidity risk The table below summarises the maturity profile of the Bank’s assets and liabilities as on the reporting date based on contractual repayment arrangements. The contractual maturities of assets and liabilities have been determined on the basis of the remaining period at the statement of financial position date to the contractual maturity date and do not take account of the effective maturities as indicated by the Bank’s deposit retention history and the availability of liquid funds.
Carrying
amount
Gross nominal outflow
Within 3 months
3 - 12 months
Over 1 year
RO’000 RO’000 RO’000 RO’000 RO’000 30 June 2018 Non – derivative liabilities Due to banks and other money market borrowings
(Audited) Non – derivative liabilities Due to banks and other money market borrowings 718,619 746,466 183,305 198,129 365,032 Customers’ deposits 1,642,845 1,756,980 872,311 427,479 457,190 Other liabilities 31,451 31,451 31,451 - - Subordinated loans 35,392 48,768 366 2,084 46,318 Compulsorily convertible bonds 2,402 2,437 - 2,437 - Certificates of deposits 18,513 19,319 12 18,736 571 ────── ────── ────── ────── ────── Total liabilities and equity 2,449,222 2,605,421 1,087,445 648,865 869,111 ══════ ══════ ══════ ══════ ══════
30 June 2017
Carrying amount
Gross nominal outflow
Within 3 months
3 - 12 months
Over 1 year
(Unaudited) Non – derivative liabilities Due to banks and other money market borrowings 595,369 610,667 75,918 286,763 247,986 Customers’ deposits 1,660,253 1,762,950 974,621 372,653 415,676 Other liabilities 31,858 36,502 36,502 - - Subordinated loans 86,561 101,593 51,886 2,190 47,517 Compulsorily convertible bonds 2,402 2,491 - 2,491 - Certificates of deposits 18,511 19,692 12 732 18,948 ────── ────── ────── ────── ────── Total liabilities and equity 2,394,954 2,533,895 1,138,939 664,829 730,127 ══════ ══════ ══════ ══════ ══════
Bank Sohar SAOG ───────────────────────────────────────────────────────────────────── NOTES TO THE INTERIM CONDENSED FINANCIAL STATEMENTS (continued) FOR THE THREE MONTHS ENDED 31 March 2018 (RO’000)
Page 48 of 49
D Financial risk management (continued)
D2 Capital management
D2.1 Regulatory capital
The international standard for measuring capital adequacy is the risk asset ratio, which relates capital to balance sheet assets and off balance sheet exposures weighted according to broad categories of risk.
The risk asset ratio calculated in accordance with the capital adequacy guidelines of the Bank for International Settlement is as follows:
30 June 31 December 30 June 2018 2017 2017
Tier I capital Ordinary share capital 198,265 178,465 178,465 Share premium 18,037 17,607 17,607 Legal reserve 21,438 21,438 18,905 General reserve 988 988 988 Subordinated loan reserve - - 50,000 Retained earnings * 44,240 63,728 14,621 Perpetual bond 100,000 100,000 - Fair value losses (2,984) (784) (1,231) Deferred tax asset - - - ────── ────── ────── Total 379,984 381,442 279,355 ────── ────── ────── Tier 2 capital Stage 1 ECL impairment 8,999 25,187 24,304 Fair value gains 4 60 41 Subordinated loan 35,000 35,000 35,000 Compulsorily convertible bonds - 2,383 2,383 ────── ────── ────── Total 44,003 62,630 61,728 ────── ────── ────── Total regulatory capital 423,987 444,072 341,083 ────── ────── ────── Risk weighted assets Credit and market risks 2,593,995 2,597,309 2,397,216 Operational risk 140,106 140,106 130,335 ────── ────── ────── Total risk weighted assets 2,734,101 2,737,415 2,527,551 ────── ────── ────── Capital adequacy ratio Total regulatory capital expressed as a percentage of
total risk weighted assets 15.51 % 16.22% 13.49% Total tier I capital expressed as a percentage of total
risk weighted assets 13.90 % 13.93% 11.05%
The capital adequacy ratio is calculated in accordance with Basel II & Basel III requirements as adopted by CBO. Disclosures required under Basel III and circular BM-1114 dated 17 November 2013 issued by CBO are available in the Investor Relations section of the Bank’s website.
* Retained earnings for 31 December 2017 are stated after excluding cash dividend of RO 8,923,250
Bank Sohar SAOG ───────────────────────────────────────────────────────────────────── NOTES TO THE INTERIM CONDENSED FINANCIAL STATEMENTS (continued) FOR THE THREE MONTHS ENDED 31 March 2018 (RO’000)
Page 49 of 49
E Segmental information
Segment information is presented in respect of the Bank’s operating segments. For management purposes, the Bank is organised into the following seven operating segments based on products and services as follows:
• Wholesale banking includes loans to and deposits from corporates, small & medium enterprises and trade finance
customers. • Retail banking includes loans to and deposits from retail customers, credit card and fund transfer facilities. • Government and Project Finance and Syndication include loans to and deposits from government and financial
institutions, project finance and syndicated loans. • Investments include proprietary investments, correspondent and investment banking. • Treasury includes the treasury function of the bank. • Head office includes the pool of resources considered for transfer pricing and absorbs the cost of portfolio impairments
and income tax. • Islamic banking includes Islamic financing activities, current accounts, unrestricted investment accounts and other
products and services to corporate and individual customers under Shari’a principles.
The CEO monitors the operating results of the business units separately for the purpose of making decisions about resource allocation and performance assessment. Segment performance is evaluated based on operating profit or loss. Income taxes are managed on a Bank basis and are not allocated to operating segments. Interest income is reported net as the CEO primarily relies on net interest income as a performance measure, not the gross income and expense. Transfer prices between operating segments are on an arm’s length basis in a manner similar to transactions with third parties. No revenue from transactions with a single external customer or counterparty amounted to 10% or more of the Bank’s total revenue in 2018 or 2017.
Bank Sohar SAOG ───────────────────────────────────────────────────────────────────── NOTES TO THE INTERIM CONDENSED FINANCIAL STATEMENTS (continued) FOR THE THREE MONTHS ENDED 31 March 2018 (RO’000)
Page 50 of 49
E1 Segmental information (continued)
30 June 2018 (Unaudited)
Retail banking
Wholesale banking
Government institution, FI
& PFS* Investments Treasury Head
Office Islamic
banking Total
Income Statement Net interest income 9,299 13,085 2,652 (388) 4,017 (998) - 27,667 Net income from Islamic financing and
investing activities - - - - - - 2,258 2,258
Other operating income 2,458 4,835 1,468 499 4,107 (2,175) 286 11,478 ───── ───── ───── ───── ───── ───── ───── ─────
Government institution, FI & PFS* Investments Treasury
Head Office
Islamic banking Total
Income Statement Net interest income 7,965 11,124 2,209 279 644 (683) - 21,538 Net income from Islamic financing and investing activities - - - - - - 1,596 1,596
* Financial Institutions & Project Finance and Syndication.
E2 Comparative figures
Certain comparative figures for 2017 have been reclassified in order to conform to the presentation for the current period. Such reclassifications do not affect previously reported net profit or shareholders’ equity.