24
Bank Structure and the Terms of Lending to Small Businesses Rodrigo Canales (MIT Sloan) Ramana Nanda (HBS) World Bank Conference on Small Business Finance May 5, 2008

Bank Structure and the Terms of Lending to Small Businesses
Rodrigo Canales (MIT Sloan)Ramana Nanda (HBS)
World Bank Conference on Small Business FinanceMay 5, 2008

2
Motivation
> Large literature on the positive aspects of decentralized-bank lending for entrepreneurship
> Better able to process soft information (Stein 2002)> Particularly valuable for small firms with fewer sources of external finance
(Berger et al 2005)
> Are decentralized banks more sensitive (than centralized banks) to their local environment when setting deal terms?
> Beneficial for small firms in certain markets> But potentially also more costly to small firms when banks have market power

3
This Paper
> Examine lending terms for centralized vs. decentralized banks> Comprehensive database covering all loans to SMEs in Mexico from 2002-2006> Examine loan size; interest rates and loan defaults
> Exploit variation in Mexico’s institutional environment to study structure-environment interaction
> Federal structure implies variation across states in contract enforceability> Differences in banks’ competitive environment across states and over time

4
Summary of Findings
> Decentralized banks are better at processing soft information > Larger loans compared to centralized banks> Difference is more pronounced for smaller firms and firms in the service industry
(associated more with soft information) > IV estimates suggest this is not just due to selection
> Decentralized banks are more responsive to their local environment when setting deal terms
> Give smaller firms better deal terms in markets with weak contract enforceability> Particularly true when use instrumental variables
> Exploit market power more effectively> Charge higher rates to small and micro firms in concentrated banking markets,
particularly so for those in service industry> Robust to using instrumental variables

5
Agenda
I. Context: SME Lending in Mexico
II. Data
III. Results
IV. Conclusions

Context: SME Lending
> Virtually no SME lending prior to 2002> Very little lending, even to large corporate clients> Deep distrust of banks in private sector, specially small firms (96% of firms SMEs)> Low, and falling private sector credit, large informal sector, > High dependence on expensive trade credit (~10-15% a month)
> SME Loan Guarantee Program initiated in 2001> Federal program, run from a central government agency> All banks invited to participate, involvement by all major banks in Mexico
> 28 of 30 banks represented in our data, but 6 banks constitute 95% of loans> Credit decision solely with banks> Main product covers SME loan losses on a first-loss basis up to a certain percentage
of loan portfolio
> Dramatic Growth since 2002> About 300 loans in 2002 to 30,000 loans in 2005 to 90,000 loans in 2007> ~15% of registered SME firms have received a loan

7
Context: Variation in Bank Lending Structure unrelated to SME lending
> Shaped by 1994 banking crisis > 1994 banking crisis led to several (failed) banks being acquired by foreign banks
> 2 Foreign-owned banks in 1994 out of 33, 17 in 1995> Foreign banks instituted centralized lending structures for retail credit operations
such as credit cards, mortgages, loans> Growth of regional banks in parallel that have national presence but decentralized
lending structure
> Retail lending structure ported to SME lending> Verified through field-based interviews of bank managers, looking at lending
decisions by loan officers across all major banks> All adjudication, loan-size and rate decisions for centralized banks come from
headquarters; based on parametric models > Adjudication decisions for decentralized banks happen at the branch-level.
Branch manager has control over who gets approved, for how much and at what rate

8
Context: Institutional Environment
> Contract Enforceability > Federal system: variation across 32 states in terms of legal enforcement of
contracts> Data from Moodys; also judicial efficiency index from Laeven and Woodruff (2004)> Only cross-sectional variation by state
> Competitive Environment> Calculated Herfindahl Index of concentration by state-year> Based on bank branches in each state
> Branch presence based on retail opportunity (no SME lending until 2002)> No systematic relation to SME sector opportunity (in fact, share of small firms
negatively correlated with number of branches, checking accounts, loans)

9
Agenda
I. Context: SME Lending in Mexico
II. Data
III. Results
IV. Conclusions

10
Overview of Data
> Registry of all loans given by banks through the SINAFIN > Comprehensive (all SME lending through the Program at present)
> 81,583 loans from Jan 2002 to June 2006> Unique bank and firm identifiers> Deal terms on each loan, basic information on firms> Separate database on defaults
> Over 200 qualitative interviews> Ministry of the economy> Branch managers and loan officers> Business owners across states with different legal and competitive environments

11
Descriptive Statistics on Firms
Total Medium Small MicroFraction of loans in database 100% 19% 23% 58%Average Number of Employees* 16 52 21 6
Average Loan Size (USD) 30,091 44,735 31,155 24,908
Average Interest rate (%) 19.0% 18.2% 18.9% 19.4%
Fixed Asset Loan share 4.6% 1.3% 1.0% 7.1%* Calculated on a subset (~ 70%) of firms for which data availble

12
Descriptive Statistics on Banks
Total Decentralized Banks Centralized Banks
Fraction of loans in database 100% 19% 81%
Fraction in Manufacturing 100% 13.7% 86.3%Fraction in Commerce 100% 9.0% 91.0%Fraction in Services 100% 44.6% 55.4%
Fixed Asset Loan Share 4.6% 23.0% 0.4%
Average Loan Size - Working Capital Loans ('000 USD)All Firms 31 42 29Medium Firms 45 50 44Small Firms 31 45 30Micro Firms 26 39 23
Average Loan Size - Fixed Asset Loans ('000 USD)All Firms 17 15 35Medium Firms 46 46 45Small Firms 41 48 33Micro Firms 14 13 33

13
Agenda
I. Context: SME Lending in Mexico
II. Data
III. Results
IV. Conclusions

14
Loan Amount by Bank Structure
All models include industry and year fixed effects Models (2), (3), (4) and (5) include state fixed effectsModels (3), (4) and (5) include bank fixed effects
IV (1) (2) (3) (4) (5)
Micro Firm -0.796*** -0.794*** -0.834*** -0.960*** -0.969***(0.034) (0.035) (0.046) (0.023) (0.067)
Small Firm -0.439*** -0.436*** -0.437*** -0.506*** -0.569***(0.037) (0.038) (0.042) (0.028) (0.039)
Decentralized Bank x Micro 0.661*** 0.758*(0.049) (0.390)
Decentralized Bank x Small 0.383*** 0.925***(0.030) (0.240)
Observations 81,583 81,583 81,583 81,583 81,583R-squared 0.17 0.18 0.23 0.25 0.24Robust standard errors in brackets, clustered at the state level*** p<0.01, ** p<0.05, * p<0.1
OLS Regressions
Dependent Variable is Log of Loan Amount

15
Interest Rates by Bank Structure
IV (1) (2) (3) (4) (5)
Micro Firm 0.067*** 0.067*** 0.015*** -0.004* 0.018(0.005) (0.005) (0.002) (0.002) (0.014)
Small Firm 0.032*** 0.031*** 0.017*** 0.006*** 0.007(0.002) (0.002) (0.002) (0.002) (0.008)
Decentralized Bank x Micro 0.098*** -0.004(0.013) (0.063)
Decentralized Bank x Small 0.055*** 0.093(0.008) (0.083)
Observations 81,583 81,583 81,583 81,583 81,583R-squared 0.25 0.26 0.61 0.61 0.61Robust standard errors in brackets, clustered at the state level*** p<0.01, ** p<0.05, * p<0.1
OLS Regressions
Dependent Variable is Log of Annualized Interest Rate
All models include industry and year fixed effects Models (2), (3), (4) and (5) include state fixed effectsModels (3), (4) and (5) include bank fixed effects

16
Lending Terms by Bank Structure and Strength of Legal Environment
All regressions include industry, year, state and bank fixed effects
OLS OLS(1) (3)
Micro Firm -0.834*** 0.015***(0.046) (0.002)
Small Firm -0.437*** 0.017***(0.042) (0.002)
Decentralized Bank x Weak Enforcement 0.015 0.017(0.023) (0.011)
Observations 81,583 81,583R-squared 0.25 0.61Robust standard errors in brackets, clustered at the state level*** p<0.01, ** p<0.05, * p<0.1
Log Amount Log Rate

17
Lending Terms by Bank Structure and Strength of Legal Environment
All regressions include industry, year, state and bank fixed effects
OLS IV OLS IV(1) (2) (3) (4)
Micro Firm -0.834*** -0.832*** 0.015*** 0.015***(0.046) (0.047) (0.002) (0.004)
Small Firm -0.437*** -0.438*** 0.017*** 0.017***(0.042) (0.044) (0.002) (0.004)
Decentralized Bank x Weak Enforcement 0.015 1.159 0.017 -0.342*(0.023) (0.887) (0.011) (0.194)
Observations 81,583 81,583 81,583 81,583R-squared 0.25 0.26 0.61 0.61Robust standard errors in brackets, clustered at the state level*** p<0.01, ** p<0.05, * p<0.1
Log Amount Log Rate

18
Lending Terms by Bank Structure and Strength of Competitive Environment
All regressions include industry, year, state and bank fixed effects
OLS OLS(1) (3)
Micro Firm -0.834*** 0.015***(0.046) (0.002)
Small Firm -0.438*** 0.017***(0.042) (0.001)
Log Herfindahl index (at state level) 0.540** 0.035(0.261) (0.059)
Decentralized Bank x Log Herfindahl Index -0.536* 0.079(0.263) (0.131)
Observations 81,583 81,583R-squared 0.23 0.61Robust standard errors in brackets, clustered at the state level*** p<0.01, ** p<0.05, * p<0.1
Log Amount Log Rate

19
Lending Terms by Bank Structure and Strength of Competitive Environment
All regressions include industry, year, state and bank fixed effects
OLS IV OLS IV(1) (2) (3) (4)
Micro Firm -0.834*** -0.834*** 0.015*** 0.015***(0.046) (0.046) (0.002) (0.002)
Small Firm -0.438*** -0.438*** 0.017*** 0.018***(0.042) (0.042) (0.001) (0.002)
Log Herfindahl index (at state level) 0.540** 0.537 0.035 -0.173(0.261) (0.686) (0.059) (0.107)
Decentralized Bank x Log Herfindahl Index -0.536* -0.527 0.079 0.629**(0.263) (1.722) (0.131) (0.252)
Observations 81,583 81,583 81,583 81,583R-squared 0.23 0.23 0.61 0.59Robust standard errors in brackets, clustered at the state level*** p<0.01, ** p<0.05, * p<0.1
Log Amount Log Rate
20
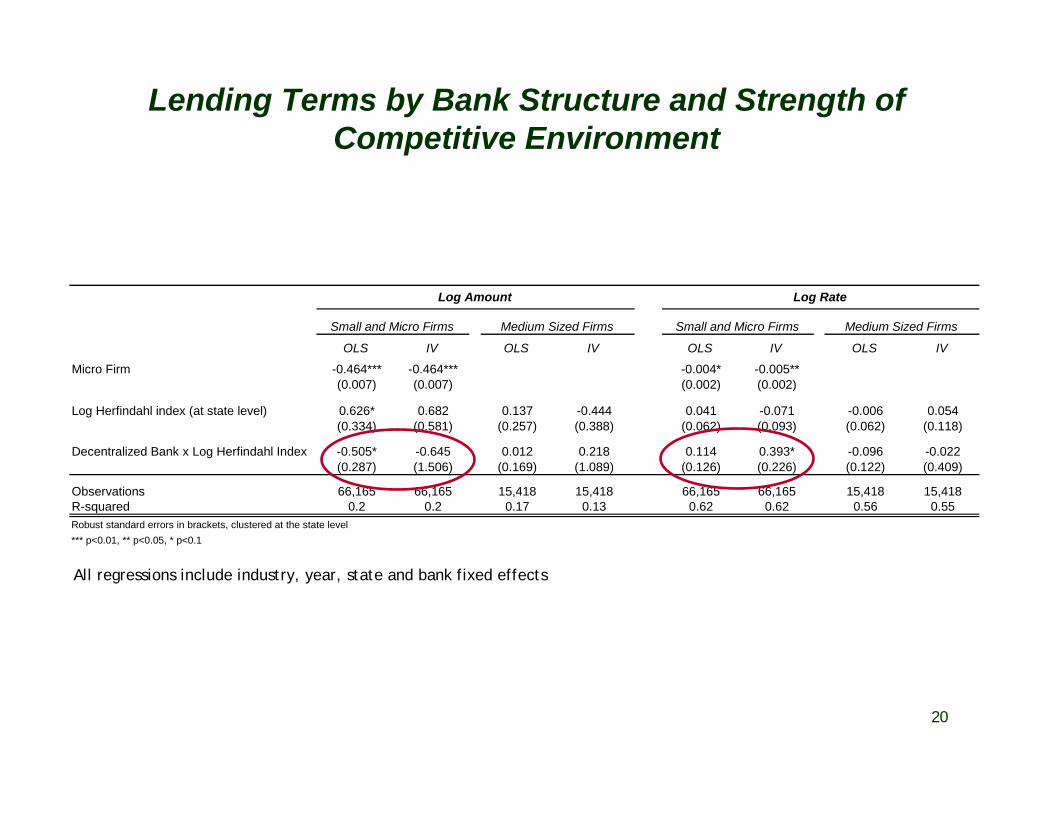
Lending Terms by Bank Structure and Strength of Competitive Environment
OLS IV OLS IV OLS IV OLS IV
Micro Firm -0.464*** -0.464*** -0.004* -0.005**(0.007) (0.007) (0.002) (0.002)
Log Herfindahl index (at state level) 0.626* 0.682 0.137 -0.444 0.041 -0.071 -0.006 0.054(0.334) (0.581) (0.257) (0.388) (0.062) (0.093) (0.062) (0.118)
Decentralized Bank x Log Herfindahl Index -0.505* -0.645 0.012 0.218 0.114 0.393* -0.096 -0.022(0.287) (1.506) (0.169) (1.089) (0.126) (0.226) (0.122) (0.409)
Observations 66,165 66,165 15,418 15,418 66,165 66,165 15,418 15,418R-squared 0.2 0.2 0.17 0.13 0.62 0.62 0.56 0.55Robust standard errors in brackets, clustered at the state level*** p<0.01, ** p<0.05, * p<0.1
Log Amount Log Rate
Small and Micro Firms Medium Sized Firms Small and Micro Firms Medium Sized Firms
All regressions include industry, year, state and bank fixed effects

21
Robustness Check: Defaults
> Separate database on defaults> Patchy data on the bank id> Restrict to firms that took only one loan (92% of the firms; 85% of the loans)
> No major differences in default rates across organizational structures
> Difference in deal terms seem to be driven by organizational structure/ capabilities rather than a differential tolerance for risk

22
Agenda
I. Context: SME Lending in Mexico
II. Data
III. Results
IV. Conclusions

23
Conclusions
> Decentralized banks are better are processing soft information> Larger loans to small and micro firms> Even more so for smaller firms in the service industry where soft information more
extreme
> Also more sensitive to external environment when setting terms of loan contracts
> Better terms for small firms in markets where there is weak legal enforcement of contracts
> Higher rates in more concentrated markets, particularly for firms with fewer outside options for external finance
> Relative benefit of decentralized banks for small business seems to also depend on institutional environment

24
Implications
> Interaction between organizational structure and institutional environment when considering lending outcomes
> Prior research has tended to focus on one or the other> Evidence of Stein model at play even in large, decentralized banks
> May shed light on US experience following banking deregulation
> Why did entrepreneurship increase following US branch banking deregulation despite massive decline of small (decentralized) banks?
> Important policy Implications> Bank finance is one of the most important sources of external finance for
startups and small businesses> Is promoting decentralized lending models enough?


