17
Banking and Commercial Real Estate pro.manchester report June 2012 The implications of Slotting
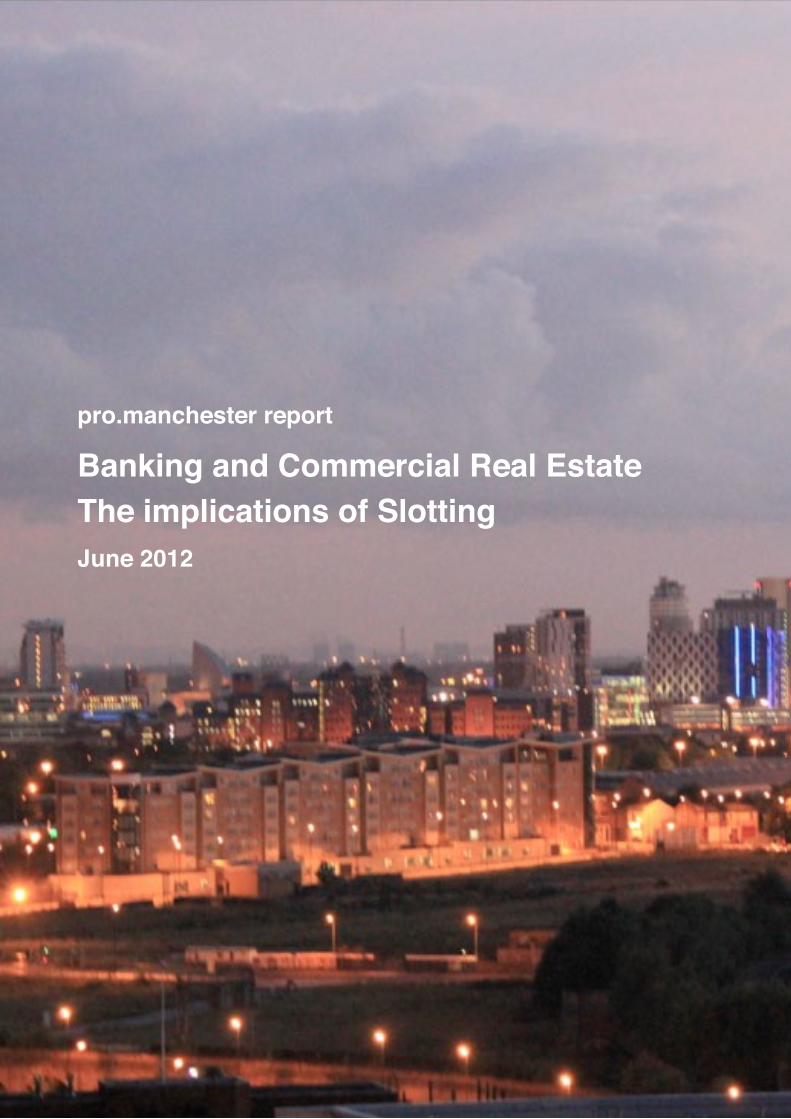
Banking and Commercial Real Estatepro.manchester report
June 2012
The implications of Slotting

ForewordJohn Ashcroft
John AshcroftCEO pro.manchester
Welcome to this report on Banking and the Commercial Real Estate Market. The report follows discussions with the pro.manchester Banking and Property Group in which it was considered an update of lending trends in the CRE sector would be a valuable contribution to the exchange of views.
CRE and banking face a number of challenges presented by the new environment. Difficult markets, a tough economy, banks and borrowers faced with the challenges of capital limitations, higher costs of capital, greater regulation and control.
Term loans are shrinking, LTVs are falling, spreads and deal fees rising, interest covers widening and covenants tightening.
The FSA guidelines on slotting, loom. The report analyses the implications of the new requirements for capital provisions across the property panorama.
The report draws heavily on the information on market data from the influential De Montfort University Report - The UK Commercial Property Lending Market: Year-end 2011 - published in May 2012 by Bill Maxted and Trudi Porter.
I am grateful to all those who have given of their time in meetings and discussions in the preparation of this document. Especially to the contributions from Barclays and the Co-operative Banks.
The opinions expressed in this report are my own and should not be attributed in any way to pro.manchester or pro.manchester member organizations.
JKA June 2012To view this report on line, visitw w w. j o h n a s h c r o f t . c o . u k /publications
The charts are available in Keynote or PowerPoint format from the above site.pro.manchester81 King StreetManchesterM2 4AH
“Slotting” will have significant implications on lendingin the sector......
2 3
The UK Banking Sector is facing a number of challenges as a result increased regulation and supervisory control which impact on lending in the Commercial Real Estate Market.
International measures include the Basel III initiatives and the identification of international GSIFIs. The objective, to improve capital ratios and supervision - avoiding future bank failure and systemic risk in the wider economy.
In the UK, the Vickers Banking Report recommends ring fencing, to seperate the vanilla from the exotic and greater loss absorbency. Yet higher capital ratios with greater Equity to Risk Weighted Asset (RWA) provision to be introduced.
As for regulation, the tripartite arrangement of the Treasury, The Bank of England and the FSA relating to supervision and control is deemed to have failed. A new regulatory structure under the mandate of the Bank of England is to be introduced.
The FSA is to be replaced by the FPC, the PRA and the FCA. [HMT 2012].
The effect of higher regulation will increase costs, ring fencing will lower overall returns and higher capital provisions will increase the cost of project capital.
The FSA is to introduce new guidelines on slotting in which the FSA seeks to standardise the risk assessment model across the banking sector. Identification of risk will involve increased capital provisions along the risk curve. The greater the risk, the greater the capital provision.
Banks will be faced with either lower returns in relation to risk, or borrowers will be faced with higher costs to compensate the higher capital provision.
Where capital is finite, banks may just avoid the higher risk sectors altogether.
In the Commercial Real Estate sector, market conditions are deteriorating. An economy with low growth at best, a rising risk of a deteriorating double dip recession, problems in Europe, the slow down in world trade and the possible implosion of the European banking System create challenges to investment and return.
In the UK, during 2011, lenders reported weakening cash flows due to tenant defaults, tenant non renewals and renewals at lower rents. This in turn was impacting on capital values, LTV ratios, generating a real risk of breach of covenant leading to default.
CRE capital values have fallen by an estimated 35% - 40% from the peak of 2008 triggering LTV default and an extended lend and pretend or delay and pray philosophy amongst lenders in some areas.
Covenant values are put at risk by cyclical economic conditions but also structural changes in the retail sector as on line sales place increasing pressure on extensive retail footprints.
Approximately 20% of the UK loan book is under water on a conventional LTV test with a further 30% above desired 65% - 70% ratios at current lending practise.
Over the next five years, 72% of the loan book is due for repayment or roll over. Over half of the book is due to roll within the period 2012 - 2014.
Term loans are contracting with 3 - 5 years considered to be extensive compared to 5, 7 and 10 of say five years ago.
Arrangement fees are increasing, spreads are widening and term loans are shrinking in duration. HIgher interest covers are the new norm.
The implications of slotting are that conditions for CRE funding will become even more difficult. JKA.
Banking and Commercial Property Report June 2012
Introduction
Banking and Commercial Real Estate

4 5
1 Size of Market
The value of outstanding debt in the UK property market is estimated at £212.5 billion at the end of 2011 down by 7% approximately on the previous year. [Chart 1].
This figure is derived from the latest De Montfort University report and provides a useful comparison over the period from 2000 to 2011. The trends in market are identified in [Chart 1] and year on year changes identified in [Chart 2].
The value represented in this chart is not considered to be comprehensive. This estimate excludes social housing (£20.2 billion), Commercial Mortgage Backed Securities [CMBS] (£42 billion), assets held by NAMA (£21.5bn) and a possible £20 billion of debt from organizations outside of the DMU sample.
Including all references, total lending into the commercial property market as at the end of 2011 is estimated at £299 billion by the De Montfort report. If we include the potential £19.5 billion for data not included in the sample, the figure rises to £315.7 billion. [Chart 3].
2 Market Structure
The loan book of £212.5 billion was allocated predominantly into investment property £173.2 billion, with commercial and residential development accounting for the balance. [Chart 4 table 1].
UK Lenders and UK Building Societies held 66.5% of the outstanding debt retained on balance sheets, secured by commercial property with an estimated value of £135 billion at the end of 2011. International lenders accounted for the balance. [Charts 6 and 7]
3 Loan to Value ratios LTVs
The De Montfort report analyzed the proportion of outstanding debt within different brackets of loan-to-value ratio. Approximately 13% of outstanding debt had an LTV of 50% or less, 37% of debt had an LTV of between 51% and 70%, 16% of debt had an LTV of between 71% and 85%, 14% of debt had an LTV ratio of between 86% and 100%, 9% of debt had a LTV of between 101% and 120% and 11% of debt had an LTV of 121% and above. [Chart 5 Table 2]
Effectively, 20% of the loan book is under water on a conventional LTV test and a further 31% is above the more conservative 70% LTV ratio. Half the loan book faces challenges to return within the more conservative categories defined by the new FSA slotting guidelines.
Note the average new loan-to-value ratio for all sectors fell to the lowest levels recorded by De Montfort. For example, the average LTV ratio for loans secured by prime offices decreased from 67.0% at year-end 2010 to 64.3% at year-end 2011 and that for secondary offices decreased from 62.0% at year-end 2010 to 60.0% at year-end 2011.
For new loans 65% LTV ratio is the new norm.
4 Repayment Schedules
Over the next five years, 72% of all outstanding debt is due for repayment valued at approximately £153 billion. [Chart 12]. Over half of the debt due for repayment crystalizes within the three years 2012 - 2104. We use the sample from Chart 12 to generate the repayment estimates for the debt of UK institutions in [Chart 13].
5 Classification of Loans
According to the De Montfort research 41% of outstanding debt is considered to be prime. The De Montfort report suggests some £23 billion of loans are in breach of loan covenants [Chart 17] and a further £23 billion are in default. [Chart19]. Reasons for breach are indentified in [Chart 18], with multiple default criteria accelerating.
In Chart 10 Table 5 we estimate that 35% of the debt can be classified into Tier 1 and a further 35% into Tier 2 using the FSA guidelines on slotting. [Chart 9]. The residual 30% would fall equally into Tier 3 and Tier 4 categories.
6 Loan Originations and Loan Extensions
In 2011 there was a total of £27.5 billion of new loans plus a further £10.2 billion of loan roll overs. This compares with £20.7 billion and £15.3 billion in the prior year.[Chart 15]
Six organizations accounted for approximately 60% of new lending but UK lenders and building societies completed just 50% of new loan originations.
The investment climate having hit a low in 2008 had rallied into 2009 and 2010 as the number of organisations intending to increase loan books increased from 24% to 49% then 46%. By the end of 2011 intentions to increase loan book size had fallen to 38%. We expect this number to decline further in 2012. Intentions to increase Loan Book Size 2008 24% 2009 49% 2010 46% 2011 38%
7 Problem Loans
The value of loans in breach of financial covenant at year-end 2011 and reported to the research was approximately £22.8 billion and represented 12% of the total aggregated loan book of organisations that contributed data. This compares with £22.0bn representing 12% at year-end 2010.
With regard to loan defaults, at year-end 2011, £19.6 billion of loans was reported to the research as having been declared in default during 2011. This compares with £15.4bn reported to the research at year-end 2010.
pro.manchester
Banking and Commercial Property Report June 2012

6 7
8 Lending Margins and Spreads [Charts 20 and 21]
At year-end 2011 interest rate margins were the highest recorded by the De Montfort research for each property sector. The average margin on loans secured by prime office property increased from 230 bps, year-end 2010 to 300 bps, year-end 2011. Similarly for secondary offices, average margins increased from 268 bps at year-end 2010 to 336bps at year-end 2011. [Charts 20 and 21]. For some rollover loans, spreads were recorded at 500 bps.
9 Loan to Value ratios Trend Analysis [Chart 22].LTV ratios have fallen from an average of 75% from 1999 to 2007 before falling to around 63% in 2008. As a bellweather on trends, LTVs on prime office have fallen from 80% to 64%.
Arrangement fees [Chart 24]Arrangement fees are increasing. At year-end 2011, a substantial increase in the average fees applied to loans secured by all types of commercial property was recorded to the highest levels recorded by the research. The average arrangement fee for loans secured by prime offices increased from 95 bps at year-end 2010 to 113 bps at year-end 2011 and that for secondary offices increased from 107 bps at year-end 2010 to 120 bps at year-end 2011.
For rollover loans, the fees could be higher.
9 Interest Cover [Chart 23]
For all sectors except Secondary Retail and Secondary Industrial, an increase in average income to interest cover is recorded between year-end 2010 and year-end 2011. The average income to interest cover applied to a loan secured by prime offices increased from 1.51 times [2010] to 1.60 times [2011] and for secondary offices from 1.80 [2010] to 1.90 [2011]. This compares to an average 1.25 times in 2006.
10 Regional Allocation [Chart 35]
In [Chart 35], we use the regional data in the De Montfort report to estimate the market vale of CRE loans in the North West and in Greater Manchester. The methodology is derived from GVA data from the ONS and correlations between regional lending and GVA data. On this basis we estimate the vale of CRE loans in Greater Manchester to be between £6.0 and £6.5 billion. We also use the data in section 11 to estimate the market shares of major lenders in GM.
11 UK Market Shares [Chart 8]
Using data within the De Montfort report and research by Morgan Stanley, we estimate the shares of the big five banks lenders. RBS (29%), LBG (25%), HSBC (11%) Nationwide (10%) and Barclays (9%) dominate. We use these shares to generate a first level analysis of lending profiles in Greater Menchester. [Chart 8].
13 Banks Cost of Capital [Charts 25 and 26]
Banks cost of capital are increasing particulalry over a three to five year horizon. As a result term loans bejond a three to five year term are becoming more expensive at best or more difficult to secure. The cost of capital trends are identified in the CDS spreads in charts 25 and 26. In chart 26, the CDS premium for RBS has risen from 10 basis points to around 350 basis points. over the past five years,
14 Property Capital Values Charts 27 and 28.
Property capital values have fallen from a peak in 2008 by around 35% to 40%. For this analysis we use data from RICS, IPD and Morgan Stanley Research. Capital values fell sharply in 2008 and 2009 before recovering into 2010. According to Morgan Stanley prices remain some 34% below peak.
Transaction volumes recovered into 2010 and 2011 towards the long term average but fell back in the first quarter of 2012. In Chart 30 RICS investment enquiries and the IPD capital grorwth index confirm the deterioration in trend and sentiment. 15 Property Yields and Gilt Yields Comparison [Charts 29 - 33] Property yields remain attractive with the IPD all property index [Chart 29] suggesting yields have risen from 4.5% to 6.3%. The spread over gilts has widened [Chart 31] to around 350 basis points.
As we explain in [Charts 32 and 33], the fall in gilt yields explains the spread, as QE and the international demand for gilts drive gilt prices higher.
12 New PlayersLower gilt yields and wider spreads on property yields offer greater attraction to pension funds and insurance companies alike. Pension funds in the quest for yield and the satisfaction of liquidity driven investment demands are obliged to examine alternative high yield options including investment exotics. Commercial property offers a comparative safe haven.
Insurance companies, subject to solvency guidelines without the need for capital provision for commercial property with low LTV ratios increasingly find the CRE sector attractive. Aviva/Norwich Union, Met Life, Axa, the Pru, L & G, and others recently active in the market.
Mezzanine players including Black Rock, Blackstone and M&G offer an investment option . Mezz funds have recently raised £1.4 billion according to research from Savills.
The CMBS market remains bouyant with REITS also offering an option for borrowers. The current CMBS maturity profile is indentified in [Chart 34] with hurdles in 2014 and 2017.
15 Slotting Implications [Charts 9 and10]
Slotting is on the horizon as the new lending guidelines from the FSA seek to standardise lending risk models. Over seventy criteria are included in the latest supervisory slotting criteria for specialised lending, classifying loans into four tiers or slots, 1 - 4 we may call the good, the not so good, the bad and the down right ugly.
Capital provisions increase as the slotting criterial deteriorate. No exact dimensions have been afforded to the slots but capital provisions could vary from Tier 1 - 3% - Tier 2 - 5%, Tier 3 - 8% and Tier 4 - 35% as assessments deteriorate capital provisions increase. The implications for pricing are evident. Either banks will have to accept a lower rate of return on capital as pricing is held constant along the risk curve, or spreads will increase. Funding for higher tier 3 and 4 projects will be restricted or denied altogether precipitating default.
The FSA is currently undertaking a thematic review into CRE which will cover the extent of forbearance in the sector as a prelude to tier classification. The analysis will be highly detailed covering over twelve lenders with analysis down to tenancy levels. The thematic review is expected to be published in the Autumn of 2012.
Banking and Commercial Property Report June 2012
pro.manchester

Summary - from cash machines ...
8 9
Banking and Commercial Property Report June 2012
The Overall Picture Slotting will have a significant impact on lending in the commercial real estate market. The four tier FSA classification will include over seventy parameters in a quest to standardise the lending model in the CRE market.
Four tiers have been identified by the FSA, within which loan to value ratios and Debt Service Cover Ratios criteria will be predominant in assessing profile.
Bank lenders will be required to make larger capital provisions as the lending quality deteriorates. At present suggestions are the tier provisions could range from Tier 1 6% Tier 2 8% Tier 3 13% Tier 4 37%.
Whilst still subject to negotiation and finalisation, larger capital provisions are inevitable Larger provisions of scarce capital will lead to lower returns or higher pricing. A withdrawal from the higher risk tiers 3 and 4 may well follow given a finite capital resource.
We estimate as much as 30% of loan books could fall within the tier 3 and tier 4 provisions.
According to the De Montfort report banks are reporting some 12% of loans in breach and a similar amount in default.
The FSA is undertaking an extensive “thematic review” of forbearance in the sector involving over twelve lenders with an analysis down to tenant level to evaluate the risk profile. The FSA remains sceptical of the extent of lend and pretend or delay and pray strategies. The classification into tier 3 and tier 4 levels may increase as a result.
In the UK, 72% of all outstanding loans are due for repayment within five years. Of this over half or £75 billion approximately will fall due in the period 2012 - 2014.
All loans will be subject to higher arrangment fees, higher spreads, lower LTV ratios and higher debt service cover ratios. Loan terms will be truncated with three to five years the norm given the cost of capital over term for lending bankers.
30% of the debt will have difficulty securing finance from the traditional bank sector. This would place as much as £50 billion at risk of non renewal. At best haf of this will be subject to premium pricing.
CRE prices are likely to remain subdued given a slow recovery (at best ) for the UK economy. Prices are not expected to fall further and may rally significantly if the economy recovers.
CRE yields remain attractive with new players in insurance, pensions, REITS and collateralised debt markets an option for engagement.
Property in Greater Manchestern the Manchester market, we estimate that bank lending into the CRE sector is valued at between £6 billion to £6.5 billion.
Assuming lending profiles follow the national picture, we estimate the market shares of the big six in the city to be as follows :
RBS £1.7 - 2.0 billion LBG £1.7 - 2.0 billion HSBC £0.6 - 0.8 billion Nationwide £0.5 - 0.7 billion Barclays £0.5 - 0.7 billion Others £1.4 - 0.5 billion including the Co-operative Bank Total £6.4 billion.
Approximately £0.7 billion could be in default and a further £0.7 billion in breach
Approximately 30% or £1.8 billion would fall into the tier 3 and tier 4 categories suggesting refinancing may be an issue for at least half of this amount within the period 2012 - 2014.
Over £2.0 billion is due for refinancing within the next three years which will crystallise forbearance for a significant proportion of the loan portfolio.
Prices are expected to remain subdued but yields will remain attractive especially as the so-called risk free rate of return on gilts tracks sub 2%.
New players will find the UK market atractive and the introduction of local authority options could prove timely.
JKA
... to slot machines?
changing the rules for CRE lending.
pro.manchester

10 11
Total debt including Social Housing, NAMA, CMBS and an adjustment for out of sample data increases the total value to £315.7 billion.
Investment property accounts for the major proportion of debt by sector at £173.2 billion. Commercial and residential development the main balance.
Banking and Commercial Property Report June 2012
pro.manchester - Charts are available in PowerPoint or Keynote
The value of outstanding debt in the commercial property market fell to £212.5 billion in 2011 compared to £228 billion in the prior year.
The rate of change fell by 7% in 2011 compared to 9.9% in 2012. The fall in 2010 reflects some transfers out of the sector into government funds.
12 13
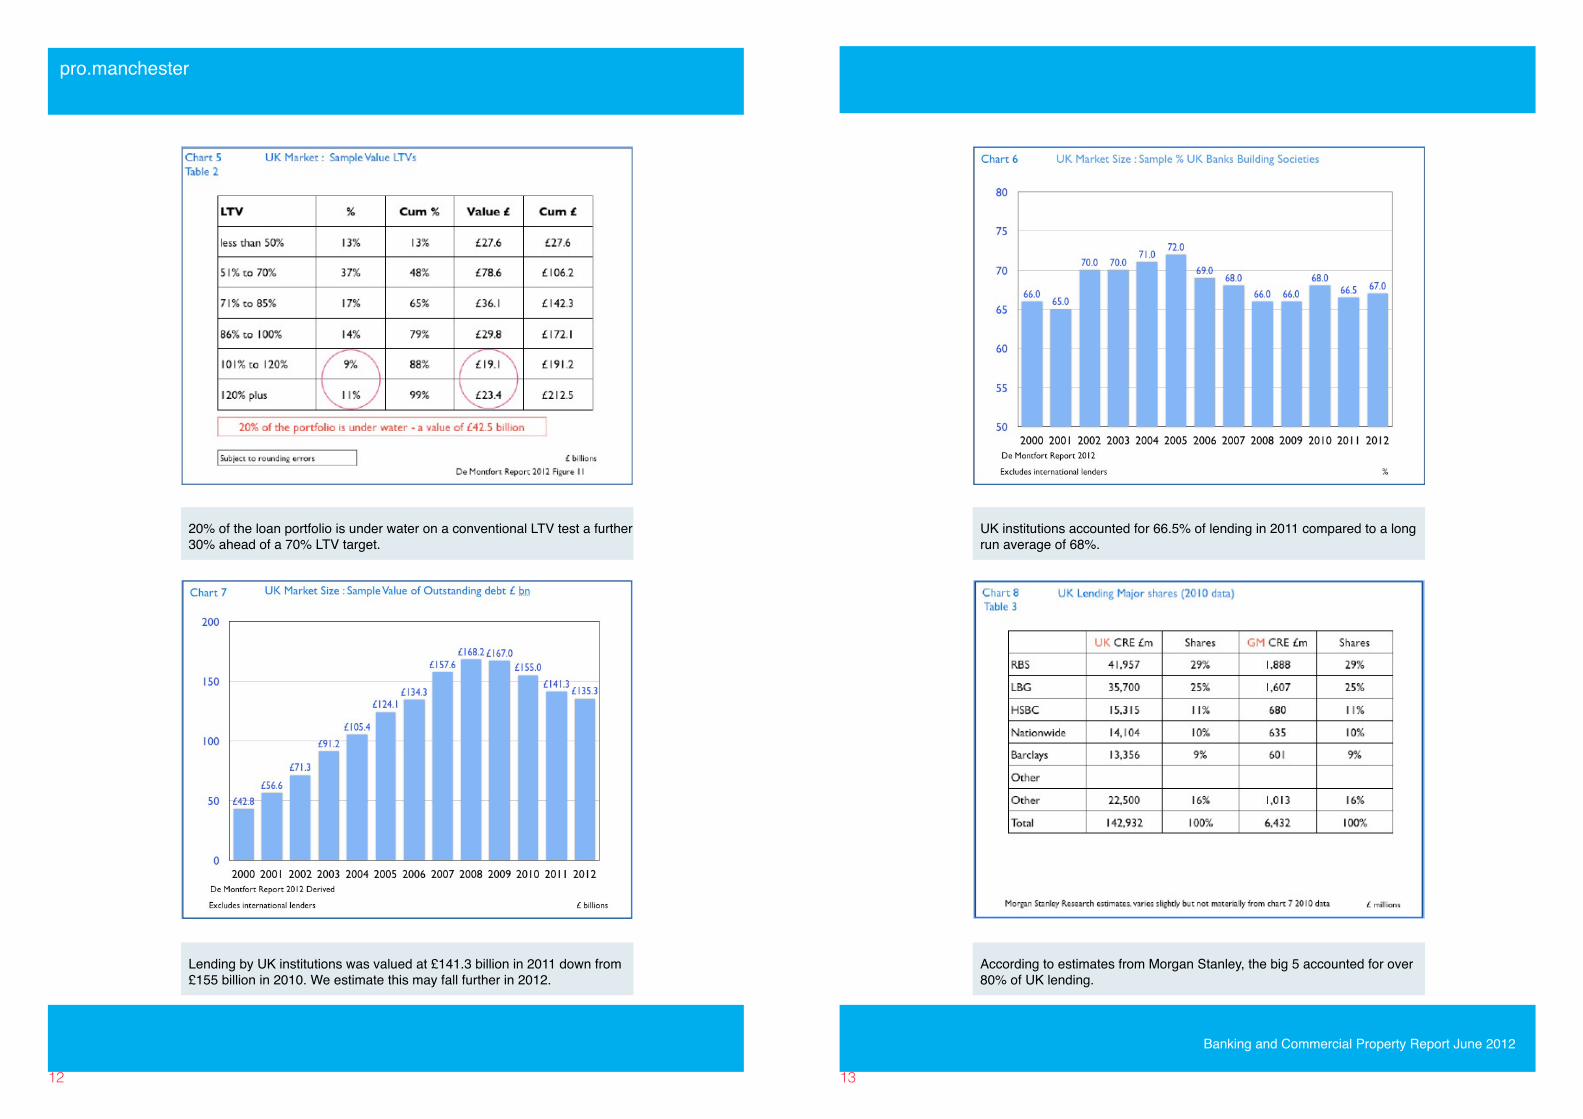
Lending by UK institutions was valued at £141.3 billion in 2011 down from £155 billion in 2010. We estimate this may fall further in 2012.
UK institutions accounted for 66.5% of lending in 2011 compared to a long run average of 68%.
According to estimates from Morgan Stanley, the big 5 accounted for over 80% of UK lending.
Banking and Commercial Property Report June 2012
pro.manchester
20% of the loan portfolio is under water on a conventional LTV test a further 30% ahead of a 70% LTV target.

14 15
FSA identifies four tiers or slots for CRE lending defined as strong, good, satisfactory and weak. LTVs, interest cover and payment dominate.
We estimate 35% of the debt will fall equally into tier 1 and tier 2, with a further 15% into tier 3 and tier 4 ratings
Of the estimated £31.5 billion of debt reductions in 2011, scheduled repayments and paydowns accounted for over 60%.
Debt maturity profiles suggest 72% of the debt will roll within five years of which over 50% will mature within the 2012 - 2014 period.
Banking and Commercial Property Report June 2012
pro.manchester
16 17
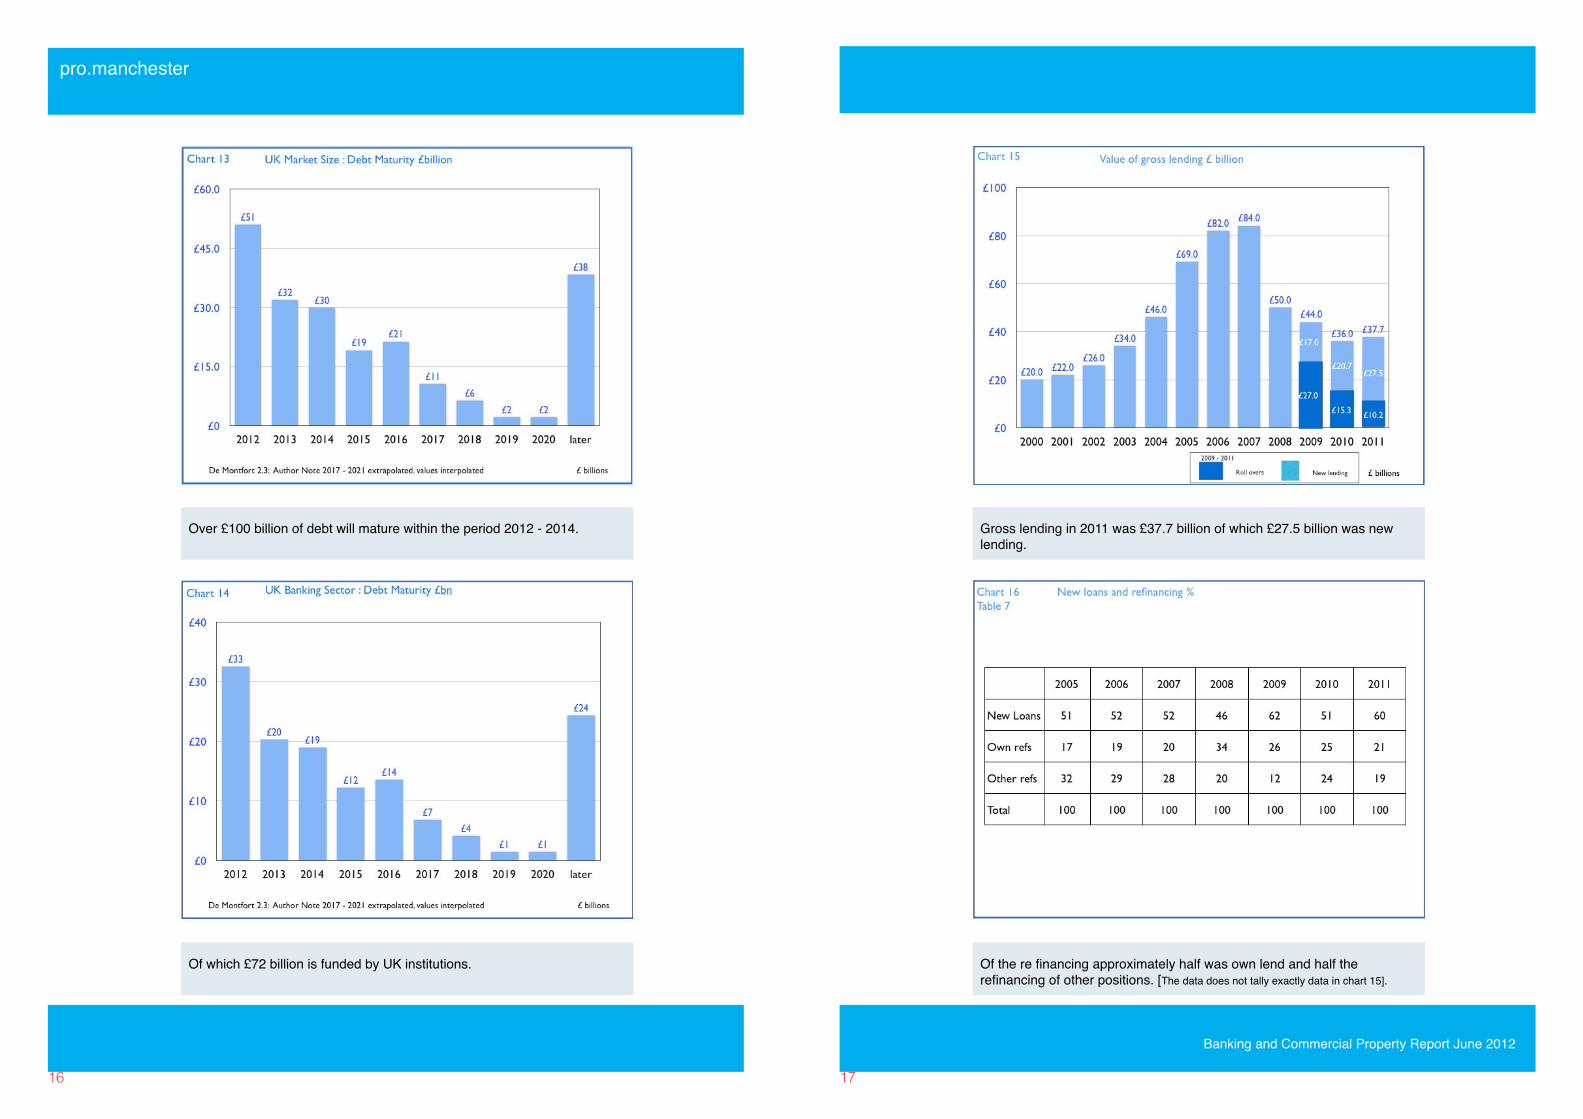
Over £100 billion of debt will mature within the period 2012 - 2014.
Of which £72 billion is funded by UK institutions.
Gross lending in 2011 was £37.7 billion of which £27.5 billion was new lending.
Of the re financing approximately half was own lend and half the refinancing of other positions. [The data does not tally exactly data in chart 15].
Banking and Commercial Property Report June 2012
pro.manchester

18 19
The De Montfort report records 8,366 loans in breach with a value of £22.8 billion approximately 12% of total book.
In 2010, LTVs dominated the reason for breach with interest payments and principal payments featuring. By 2011, the situation is more composite.
Loans in default in 2011 totalled 8,940 with a gross value of £23.3 billion. The provision ratio was estimated at 38%.
Average loan spreads increased to over 300 basis points in 2011 compared to 100 points in 2006.
Banking and Commercial Property Report June 2012
pro.manchester

20 21
Spreads by project type opened up in all categories with speculative office development pushing towards 500 basis points.
Loan to value ratios fell to an average around 62% in 2011 down from an average 76% in 2006.
Interest rate covers increased from an average 1.25 times in 2006 to a spread ranging from 1.6 to 2.1 times according to project class.
Arrangement fees pushed to an average 125 basis points compared to sub 50 basis points in 2006
Banking and Commercial Property Report June 2012
pro.manchester

22 23
Banks cost of capital over term is rising with the benchmark five year CDS premia rising towards 300 basis points.
The spreads are opening up for individual banks with RBS, sub 350 and Barclays around 210.
The property rally in 2010 faded into 2011 with returns slowing further into 2012.
Property prices remain some 34% below peak according to research from Morgan Stanley despite a small price rally in 2010.
Banking and Commercial Property Report June 2012
pro.manchester
24 25
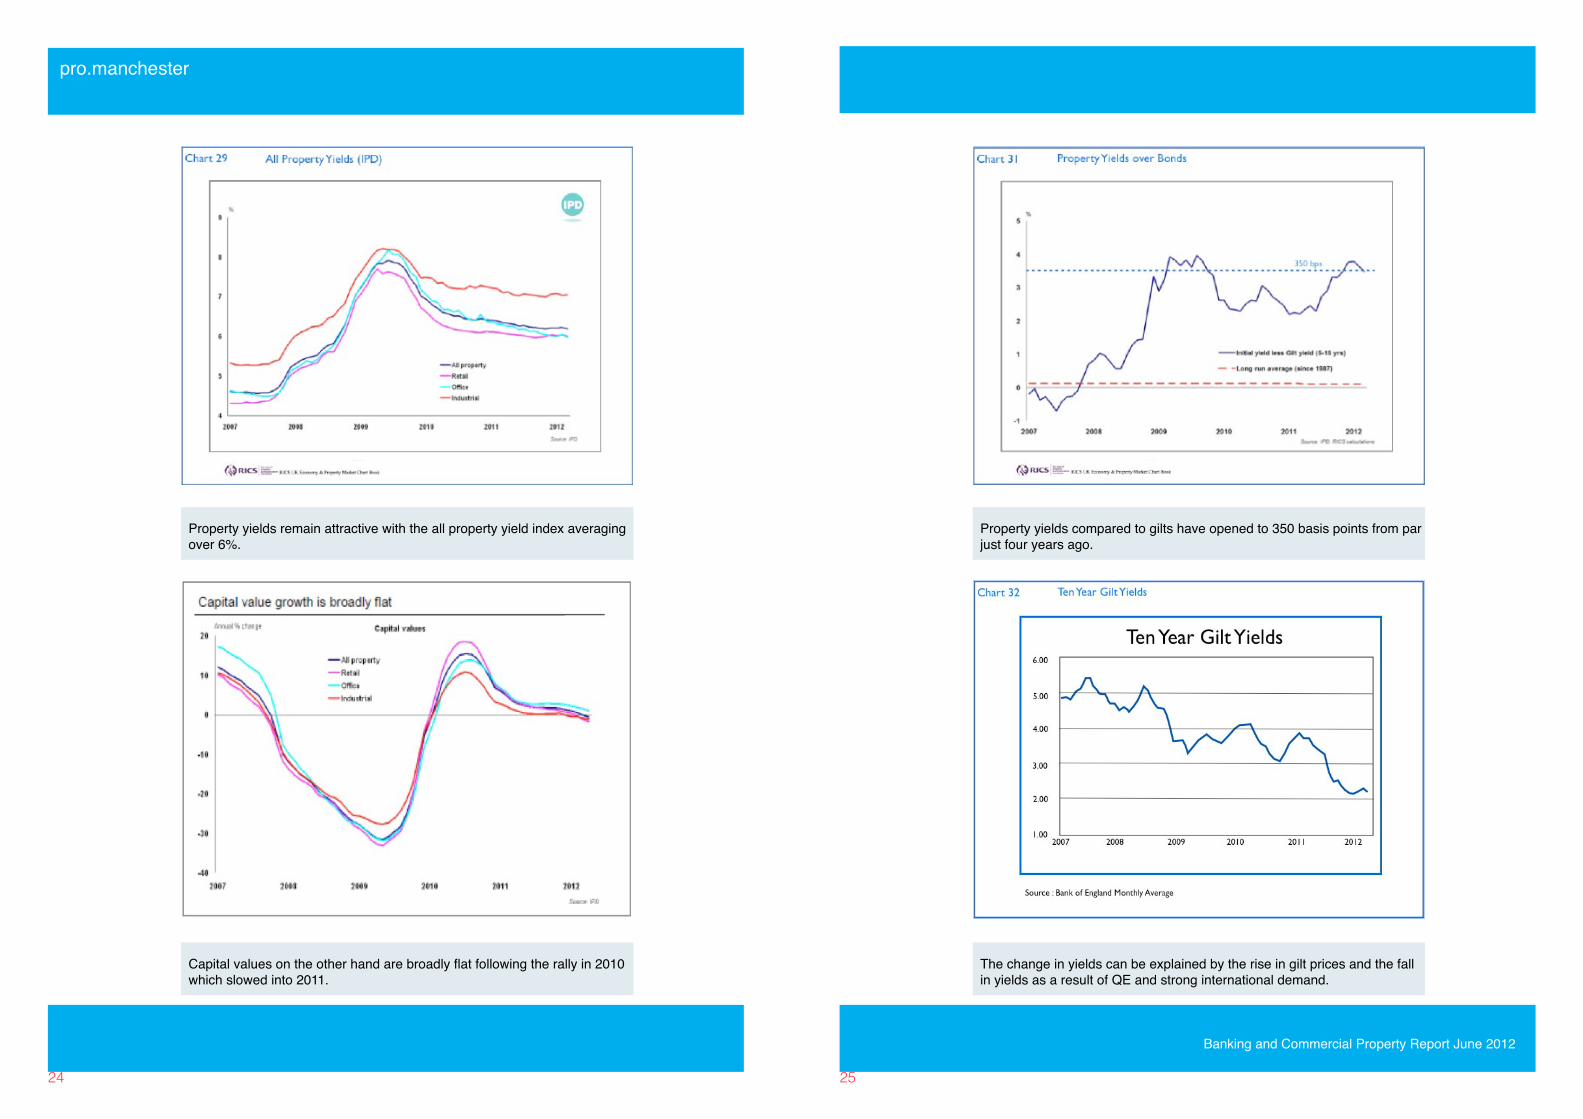
Property yields remain attractive with the all property yield index averaging over 6%.
Capital values on the other hand are broadly flat following the rally in 2010 which slowed into 2011.
Property yields compared to gilts have opened to 350 basis points from par just four years ago.
The change in yields can be explained by the rise in gilt prices and the fall in yields as a result of QE and strong international demand.
Banking and Commercial Property Report June 2012
pro.manchester

26 27
Inverting the gilt yields demonstrates the correlation
CMBS maturities suggest a hurdle in 2014 and 2017. Appetite for new more collateralised debt is considered to be healthy.
Banking and Commercial Property Report June 2012
pro.manchester
The report draws heavily on the information relating to market data from the influential De Montfort University Report. The UK Commercial Property Lending Market: Year-end 2011 published in May 2012 by Bill Maxted and Trudi Porter.
The opinions expressed in this report are entirely those of the author and should not be attributed in any way to pro.manchester or pro.manchester member organizations.
pro.manchester can take no responsibility for any damage or loss suffered as a result of any inadvertent inaccuracy within this report.
This report should not be relied upon as a basis for entering into transactions without seeking specific, qualified, professional advice.
Information contained herein should not, in whole or part, be published, reproduced or referred to without prior approval. Any such reproduction should be credited.
The material in the report is based upon information which we consider to be reliable but we do not represent that it is accurate or complete and it should not be relied upon as such. We accept no liability for errors, or omissions of opinion or fact.
In particular, no reliance should be placed on the comments or trends in financial markets. The publication of this document should not be construed as the giving of investment advice.
All views expressed in the report are my own. Information is intended to provide a general outline of the subjects covered. It should neither be regarded as comprehensive nor sufficient for making decisions, nor should it be used in place of professional advice. Neither the pro.manchester or any representative accept any responsibility for any loss arising from any action taken or not taken by anyone using this material.
JKA

28
Glossary Basel III ‘Basel III’ is a comprehensive set of reform measures, developed by the BCBS, to strengthen the regulation, supervision and risk management of the banking sector. These international standards aim to: improve the banking sector’s ability to absorb shocks arising from financial and economic stress, whatever the source; improve risk management and governance; and strengthen the transparency and disclosure standards of banks.
BCBS Basel Committee on Banking Supervision BIPRU Prudential sourcebook for Banks, Building Societies and Investment Firms (BIPRU) (FSA)BPS Basis points or bips, 100 basis points equal 1%. Capital Ratios A bank’s ‘capital’ comprises equity and debt instruments that absorb losses before depositors and other creditors. Regulators require banks to hold minimum amounts of capital relative to their risk- weighted assets to cover unexpected lossesCDS Credit Default Swap’ is a financial contract under which one party sells protection to another party against the occurrence of a defined ‘credit event’ – including restructuring and default – in respect of a specified borrower. The CDS buyer pays a premium to receive protection against default by the borrower; the CDS seller receives the premium and in return guarantees the credit risk of the borrower. If a party holds a security issued by the borrower, it may want to protect itself against default by the borrower on that security by entering into a CDS to buy credit protection. Alternatively, a party may simply choose to speculate on the performance of the borrower by buying or selling a CDS without having any other exposure to the borrower.CET 1 Common Equity Tier 1 The highest quality form of regulatory capital, comprising common equity (i.e. shares) and retained earnings (net of various technical deductions). CET1 forms part of Tier 1 capital.CMBS Commercial Mortgage Backed Securities. CRD Capital Requirements DirectiveCRE Commercial Real EstateDAP Delay and PrayDMU De Montfort UniversityDodd-Frank Act The Wall Street Reform and Consumer Protection Act – known as the ‘Dodd-Frank Act’ – was signed into law in the US in July 2010. The aim of the Act is to promote financial stability and address the ‘too big to fail’ problem in the US financial sector. The key changes include an overhaul of the regulatory and supervisry structure, introduction of formal liquidation responsibilities, increased transparency, and the implementation of the ‘Volcker rule’, which Independent Commission on Banking 247 Final Report limits the extent to which insured deposit-taking institutions can carry out proprietary tradingDSCR Debt Service Cost RatioEL Expected LossEPD Exposure at DefaultFCA Financial Conduct AuthorityFPC Financial Policy CommitteeFSA Financial Services AuthorityGDV Gross Developed Value GSIBs see GSIFIsGSIFIs Global systemically important (financial Institutions ) banks (G-SIBs)/G-SIB surcharge ‘Global sys temically important banks’ are banks that will in due course be identified as such under a proposed methodology published for consultation by the BCBS in July 2011.1 The consultation paper proposes that G-SIBs be required to have additional loss-absorbency – a ‘G-SIB surcharge’ – in the form of equity.
29
ICB Independent Commission on Banking IPD Investment Property DatabankIPRE Income-producing real estate portfoliosIRB Internal Ratings Based (Model) LBG Lloyds Banking GroupLGD Loss Given Default LLCR Loan Life Cost RatioLRP Liquidity Risk PremiumLTC Loan to CostLTGDV Loan to Gross Developed ValueLTV Loan to ValueMark to Market The value at which an asset or liability is accounted for based on current market price rather than the cost of acquisition.MPD Mean Probability of Default NAMA National Asset Management Agency - Ireland property work out vehicle.
PAE Pretend and ExtendPD Probability of DefaultPLCR Project Life Coverage Ratio PRA Prudential Regulatory AuthorityREITS Real Estate Investment TrustRWA Risk Weighted Assets An asset’s ‘risk weight’ is a measure of its riskiness; the riskier the asset, the higher the risk weight. A ‘risk-weighted asset’ is an asset adjusted for risk by the application of a risk weight.Tier 1/Tier 2 capital Classification of different types of regulatory capital. Under Basel III, Tier 1 capital comprises common equity, retained earnings, preference shares and some types of debt instruments that convert into equity or can be written down. Tier 2 capital comprises certain other types of debt instruments that can similarly convert or be written down.UL Unexpected LossVerde/Project Verde The divestiture of a retail banking business agreed by LBG, the UK Government and the European Commission as one of the conditions of LBG’s recapitalisation by the UK Government.
Additional References
Bank of England Financial Stability Report December 2011 Issue no. 30. De Montfort University The UK Commercial Property Lending Market: Year-end 2011 - May 2012 Bill Maxted and Trudi Porter.FSA Supervisory Slotting Criteria for Specialized Lending. HMT A new approach to Financial Regulation January 2012ICB Final Report and Recommendations September 2011.IPD Monthly Property IndexMorgan Stanley Research SeriesONS Regional, sub-regional and local Gross Value Added Data 2010RICS UK Economy and Property Chart Book June 2012Savills Financing Property Presentation 2011.
Banking and Commercial Property Report June 2012
pro.manchester

Don’t miss
The Sunday Times and Croissants
The Saturday Economist
The Corporate Strategist
www.johnashcroft.co.uk
Linkedin, Twitter, Facebook and Google+
Youtube, Slideshare and Prezi presentations.
A copy of this report can be downloaded from
www.johnashcroft.co.uk/publications
The slide set is available in PowerPoint and Keynoteformat on request.
Banking and Commercial Real Estatepro.manchester report
June 2012
The implications of Slotting


