20
Banking and securities M&A outlook Opportunities amid uncertainty

Banking and securities M&A outlook Opportunities amid uncertainty

Brochure / report title goes here | Section title goes here
2

Banking and securities M&A outlook | Opportunities amid uncertainty
3
Even so, large national banks are likely to continue strategic divestitures to trim their expenses and footprint, shedding non-core businesses and those which don’t generate sufficient return on investment. Large regional banks above $50 billion in assets could continue making strategic acquisitions to gain greater scale and absorb regulatory compliance and operational costs. As a result, business line and geographic market share growth may be opportunistic; valuations for these assets should rise as the targeted asset pool gets progressively smaller. If systemically important financial institution (SIFI) threshold rules remain unchanged, smaller regionals approaching the current $50 billion threshold will likely try to get comfortably above that mark to attain the necessary operational and compliance heft. However, the bulk of bank M&A is expected to once again occur within the $1 billion to $10 billion range.
While financial technology (fintech) acquisitions have historically focused on revenue-enhancement opportunities, we see greater value-creation opportunities today in leveraging fintech as a tool for cost mitigation and rationalization. Continued advances in automation and other fintech applications can drive new efficiencies across banking and securities' back office and customer service functions, but would require the creation and oversight of strong governance structures and control mechanisms. And while fintech M&A deals appear to be on banks’ and investment management (IM) firms’ radars, many organizations may opt for partnerships and joint ventures ( JVs), an easier path to dip a toe in fintech’s waters.
In this report, we review 2016 M&A activity in banking, specialty finance, IM and securities, and fintech; share our expectations for 2017; and review selective trends and issues that have the potential to influence sector M&A activity in the coming year.
Overview and outlookFollowing 2015’s record resurgent year for banking and securities mergers and acquisitions (M&A), first-half 2016 activity was tempered somewhat by persistent low interest rates and elevated regulatory pressure on the investment banking industry. While dealmaking increased in the latter part of the year—with higher deal values than the sector has seen in some time—post-election uncertainty may slow 2017 M&A until greater clarity emerges around the coming regulatory landscape.

4
2016 activityWith 249 announced deals as of December 31, 2016 banking M&A volume was down a bit from 2015’s total of 286 transactions. This is not particularly surprising given the disconnect between sellers’ expectations for higher valuations (even though YTD price/tangible book value through October 31, 2016, dipped to 130.4 percent from 138 percent
for the prior year period and 140 percent for full-year 2015) and buyers’ difficulty raising capital due to low stock prices resulting from larger macroeconomic issues limiting revenue growth. However, as we anticipated, deal sizes are coming up: average deal value rose from $154.4 million in 2015 to $161 million in 2016 (Figure 1).
Review and outlook
M&A Activity - Banking
2011
240 272 243 308 286 249Total number of deals
2012
2013
2014
2015
2016
24
61
7
73
36
39
$176.3
$113.5
$95.8
$106.9
$154.4$161.0
39
28
56
10
114
79
8
62
43
33
31
51
61
12
123
30 35
106
13
64
38
30
25
26
60
9
110
1925 18
Mid-Atlantic Midwest Northeast Southeast Southwest West Average deal value
0
50
100
150
350
300
250
200
$0
$20.0
$40.0
$60.0
$200.0
$180.0
$140.0
$100.0
$160.0
$120.0
$80.0Num
ber
of d
eals
Ave
rage
dea
l val
ue ($
m)
Figure 1: Banking deals (by region and average overall deal value)
Note: Average deal size is based on disclosed deal values. 60%, 49%, 39%, 43%, 41%, and 36% of reported deals did not disclose deal values for FY11, FY12, FY13, FY14, FY15, and FY16, respectively.
Banking and securities M&A outlook | Opportunities amid uncertainty
M&A activity—Banking
Banking
Source: SNL Financial—M&A market data, http://www.snl.com.

5
From a regional perspective, the Midwest and Southeast led deal volume in 2016, racking up 110 and 60 deals, respectively, of the year’s total 249 transactions. Both regions’ composition of smaller, more acquirable banks and the shift of banking assets as a result of population movements are likely the reason for their higher deal volume. In addition, the Midwest had three of 2016’s top five transactions in terms of deal value while the Southeast had the other two.
Small banks pressured by prolonged low interest rates, cost-burdensome regulatory compliance and technology upgrades, depopulation in rural service areas, and the search for talent often face a tough choice: either consolidate to build scale or be purchased. In fact, the majority of banking M&A deals in 2016 occurred at the small-bank level, with most acquisition targets holding less than $1 billion in assets (Figure 2). These transactions were aimed at helping struggling institutions counter margin and return on equity (ROE) pressures, broaden their real-estate-heavy asset base, and spread regulatory compliance and technology investment costs over a larger base.
Banking: 2016 top five deals by deal value
Buyer TargetAgreement date
Deal value ($m)
Target general industry type
Target region
Canadian Imperial Bank of Commerce
Private Bancorp, Inc. 6/29/2016 $3,834.09 Bank Midwest
Huntington Bancshares Incorporated
FirstMerit Corporation 1/26/2016 $3,437.42 Bank Midwest
TIAA Board of Overseers EverBank Financial Corp 8/8/2016 $2,513.08 Savings bank/thrift/mutual
Southeast
F.N.B. Corporation Yadkin Financial Corporation
7/21/2016 $1,476.07 Bank Southeast
Toronto-Dominion Bank Scottrade Bank 10/24/2016 $1,300.00 Savings bank/thrift/mutual
Midwest
Source: SNL Financial—M&A market data, http://www.snl.com.
Banking and securities M&A outlook | Opportunities amid uncertainty

6
Banking and securities M&A outlook | Opportunities amid uncertainty
203
256258
218
27
4
23 24 20
320
< $1 B Assets $1B - $10B Assets >$10B Assets
0
50
100
150
300
250
200
2013
2014
2015
2016
Figure 2: Bank transactions by asset size
Source: SNL Financial—M&A market data, http://www.snl.com.
Historically, the significant majority of bank acquisition targets in the United States have had less than $1 billion in assets.
Targets by asset size

7
Banking and securities M&A outlook | Opportunities amid uncertainty
What we expect to see for 2017 Post-election regulatory uncertainty is likely to extend well into 2017. Yet there are positive signals for increased banking M&A in the coming year. First, sellers are still looking to sell; there’s definitely supply available. The hurdle to deal completion in 2016 was the gap between expected valuations and buyer capital constraints. But entering 2017, bank stock prices are up. If the rally is sustainable, it may open up new deals because buyers have more currency in their stock price that, potentially, may serve to bridge bid/ask gaps. Also, the Federal Reserve Bank’s (the Fed) December 2016 rate hike and expectations for additional hikes in 2017 are positive indicators for M&A activity.
Second, some regulatory relief, especially if it’s focused on smaller banks, may reduce cost pressures on these institutions, make their sale to larger banks less likely, thin the pool of sellers, and potentially increase valuations due to scarcity. Instead, small banks may become more interested in merging with peers to open up new revenue sources and realize economies of scale on regulatory and operational costs. Third, a potential softening of the $50 billion asset
threshold would be good news for banks above $50 billion that are looking to grow without incurring the additional regulatory burden of becoming a SIFI.
One topic that bears monitoring: If the new administration’s proposed three-legged stool of monetary spending, tax cuts and general deregulation creates economic growth, the inflation rate may pop up, interest rates may also rise, customers may want to increase bank deposits, and banks may see organic growth for the first time in a long time. Such a scenario could take buyers out of the market who were reliant on M&A as their main avenue of growth. It also could enhance potential sellers’ financial performance, improve their franchise values, and increase their desirability to buyers. Additionally, in a domino effect, sellers’ improved financial performance would increase the valuations of potential buyers, enhancing their stock currency. In short, it has been so long since there has been true topline growth that there isn’t a precise road map as to how potential sellers and buyers will respond. Stakeholders should evaluate numerous competing forces when monitoring policy shifts.

8
2016 activityAfter the GE Capital divestitures of 2015, we expected specialty finance M&A activity to slow in 2016—both in deal volume and size—and it did. The number of completed deals dropped from 86 in 2015 to 63 in 2016, and average deal value decreased from $1.1 billion to $655 million (Figure 3). A lack of sizeable inventory to be sold was a major contributing factor to 2016’s slowdown— over the last five years, the bones have been picked pretty clean.
In 2016’s largest specialty finance deal, Bohai Capital Holding Co., Ltd., subsidiary Avolon Holdings Limited announced in October an agreement to acquire the aircraft leasing business
of CIT Group Inc. The transaction, which is expected to close in first quarter 2017, will create a leading aircraft leasing business with an owned, managed, and committed fleet of 910 aircraft valued at over $43 billion.
Three of the top 10 deals announced in 2016 were consolidations to gain scale and counter competitors’ moves; not surprising, given that specialty finance firms—like banks—are feeling the effects of sustained low interest rates and seeking scale for improved operational efficiencies.
2011
2012
2013
2014
2015
2016
Num
ber
of c
ompl
eted
dea
ls
Ave
rage
dea
l val
ue ($
m)
76
8794
86 86
63
$654.8
$1,147.8
$90.6
$340.4$337.2
$1,363.0
No of deals Average deal value Average deal value (excl. GE)
0
10
20
30
80
60
50
70
40
$0
$200.0
$400.0
$600.0
$1,400.0
$1,000.0
$1,600.0
$1,200.0
$800.0
$316.0
Banking and securities M&A outlook | Opportunities amid uncertainty
Figure 3: Specialty finance deals and average deal value
M&A activity—Specialty finance
Specialty finance
Source: SNL Financial—M&A market data, http://www.snl.com.

9
What we expect to see for 2017 Specialty finance deal volume should be consistent with 2016 but price tags likely will be lower as the inventory of attractive franchises becomes depleted. Organizations are expected to continue to consolidate and make financial plays to take out the competition—especially as banks become more aggressive in lending and cut into specialty finance’s market share.
Look for a few more cross-border deals in 2017; international players prefer the specialty finance space to banking in the United States because its regulations around M&A are not as restrictive. Assuming successful completion of the Bohai-CIT deal, equipment and vehicle financing/leasing firms should continue to be popular acquisition targets although new
accounting standards on leasing may tweak that market a bit. Finally, watch for middle-market deals such as PE roll-ups of mortgage originators. Given the recent rate hike and signals for more to come, specialty finance firms will need scale to compete on the origination side and capital to invest in mortgage servicing rights (MSRs). Potential buyers will be looking for alternative asset plays and ways to put excess capital to work outside the regulated banking system.
Specialty finance: 2016 top five deals by deal value
Buyer TargetAgreement date
Deal value ($m)
Target general industry type
Target region
Bohai Financial Investment Holding Co., Ltd.
CIT Holdings Canada ULC/C2 Aviation Capital Inc..
10/6/2016 $10,027.49 Equipment lender
Ares Capital Corporation America Capital, Ltd. 4/28/2016 $3,368.92 Business development company
Mid-Atlantic
NorthStar Asset Management Group Inc.
Colony Capital, Inc. 5/31/2016 $2,030.61 MBS REIT West
Annaly Capital Management, Inc. Hatteras Financial Corp. 8/9/2016 $1,498.30 MBS REIT Southeast
First Cash Financial Services, Inc. Cash America International, Inc.
2/25/2016 $982.17 Pawn shop Southeast
Banking and securities M&A outlook | Opportunities amid uncertainty
Source: SNL Financial—M&A market data, http://www.snl.com.

10
2016 activityAs of December 31, the 2016 IM and securities segment M&A volume of 185 announced transactions was a bit lower than 2015’s strong showing of 199 deals but it was still a good year, as evidenced by both sizeable and strategic deals. Average deal value was $563 million for securities and $191 million for IM (Figure 4).
Several factors squeezed firm margins and drove consolidation; among them, fee compression for the overall segment, rising compliance costs, and the need for increasing IT investments to meet compliance standards and address customers’ demands for digitalization. In addition, numerous securities deals were prompted by firms exiting the independent broker channel space in preparation for the stated April 2017 compliance date for the Department of Labor’s (DOL) “Conflict of Interest” rule.
2011
2012
2013
2014
2015
2016
$191.2
$287.5
$104.3
$245.5
$116.7
$160.1
$633.4
$98.1 $80.2
$138.6
$563.0
$240.9
Number of securities deals Number of investment management deals
Average deal value - Securities Average deal value - Investment management
59
98
111
86
94145
126
8457
7454 59
Num
ber
of c
ompl
eted
dea
ls
0
50
150
200
250
100
$0
$100.0
$300.0
$500.0
$400.0
$600.0
$700.0
$200.0
Ave
rage
dea
l val
ue ($
m)
Figure 4: Investment management and securities deals and average deal value
Banking and securities M&A outlook | Opportunities amid uncertainty
M&A activity—investment management and securities
Investment management and securities
Source: SNL Financial—M&A market data, http://www.snl.com.

11
What we expect to see for 2017IM M&A activity should be brisk in 2017. Aging population demographics are impacting industry asset levels and flows, and the broad shift to passive management (currently favored over active management) is putting pressure on industry fee levels and placing greater value on players with valuable distribution platforms and who have invested in technology infrastructure to drive back-office cost-efficiencies. In addition, updating middle-office technology and enhancing digital solutions are becoming key imperatives to meet the service requirements of investors. This is especially true for the current generation of asset accumulators who do not leverage their advisers in historic communication patterns, adding greater costs to the businesses and further prioritizing the need to spread costs over a larger client asset base. We’ll likely see more partnering and/or consolidation in IM-to-IM deals to build requisite scale, leverage technology advantages, and build out product lines to provide distribution channels with more offerings to increase wallet share.
The regulatory environment is a double-edged sword for IM and securities M&A. Regulatory pressures overall may ease somewhat in 2017 under the new administration and make transacting a deal more appealing. For example, certain M&A plays have been put on hold due to current systemically important financial institution (SIFI) requirements, especially
for SIFI-level banks and insurance companies that have an interest in expanding IM and wealth management. If SIFI threshold levels are increased, deal momentum may pick up. Conversely, a delay in the DOL rule’s April 2017 compliance date may drive down M&A volume. Why? Because firms currently divesting independent broker assets could decide to pull them off the market because they are capital-light cash-generators. The DOL rule also may be the gatekeeper to more or less M&A on the securities side.
Finally, there may be more transformative, cross-industry deals for IM assets, as capabilities and product lines blur even more between insurance companies and asset managers. Big insurance companies looking to exit underwriting are attracted to asset management’s fee-based business model. Also, some players may be looking internationally at deals like the Janus/Henderson transaction to diversify their client base and provide clients with a global service offering.
Investment management and securities: 2016 top five deals by deal value
Buyer TargetAgreement date
Deal value ($m)
Target general industry type
Target region
CBOE Holdings, Inc. Bats Global Markets, Inc. 9/26/2016 $3,177.69 Exchange Midwest
TD Ameritrade Holding Corporation Scottrade Financial Services, Inc.
10/24/2016 $2,791.92 National broker-dealer Midwest
Henderson Group Plc Janus Capital Group Inc. 10/3/2016 $2,600.00 Asset manager Southwest
Nasdaq, Inc. US Exchange Holdings, Inc. 3/9/2016 $1,100.00 Regional broker-dealer Midwest
Huatai Securities Co., Ltd. AssetMark Financial Holdings, Inc.
4/11/2016 $780.00 Asset manager West
Source: SNL Financial—M&A market data, http://www.snl.com.
Banking and securities M&A outlook | Opportunities amid uncertainty

12
2016 activityFintech M&A transactions in 2016 were noteworthy more for their strategic importance than their size (Figure 5), as average deal value dropped from $601. 8 million in 2015 to $376 million. Banks seeking to improve their digital customer experience and back-office operations continued to actively engage with the emerging fintech ecosystem, as seen in transactions involving financial services providers, payment companies, marketplace lenders, and technology and data vendors.
Fintech deals that enable growth and digital innovation are becoming a strategically significant component of banking and securities M&A. In addition, banks’ loaded cost structures make them ripe for investing in cost-cutting technologies. Some institutions envision using new fintech capabilities internally and then selling them to others. Buying a platform, integrating it in-house, and trying to get scale out of it appears to be a driver for many fintech deals.
2011
2012
2013
2014
2015
2016
158 142123
188206 209
$147.1 $155.3
$277.9
$240.1
$601.8
$375.7
Completed deals Average deal value
M&A Activity - Financial technology
Num
ber
of c
ompl
eted
dea
ls
0
50
150
200
250
100
$0
$100.0
$300.0
$500.0
$400.0
$600.0
$700.0
$200.0
Ave
rage
dea
l val
ue ($
m)
Figure 5: Fintech deals and average deal value
Note: Average deal size is based on disclosed deal values. 61%, 55%, 54%, 63%, 61%, and 74% of reported deals did not disclose deal values for FY11, FY12, FY13, FY14, FY15, and FY16, respectively.
Banking and securities M&A outlook | Opportunities amid uncertainty
M&A activity—Financial technology
Fintech
Source: SNL Financial—M&A market data, http://www.snl.com.

13
The rise of millennials and other tech-savvy customers who are demanding secure, readily available account data and mobile-device-based transactions signals the need for IM and wealth management firms to invest in non-traditional, less expensive ways to distribute and service their products. Little surprise, then, that developing “robo-advisor” capabilities is a growing focus area, both as a DOL compliance solution and an update to an increasingly digitized customer experience. Some IM firms and other financial institutions are hiring teams of developers to build these capabilities in-house; others are forming JVs or buying companies with the requisite technologies.
What we expect to see for 2017Demand for fintech capabilities will continue to rise in 2017, although deal sizes are likely to remain on the smaller side. The question is whether the year’s transactions will be alliances or JVs versus acquisitions. Digital and mobile wallet applications and those that can fundamentally shift down the cost curve (for example, machine learning to automate mundane tasks)
appear to be the top technology priority for capital markets businesses. Industry assets managed by robo-advisors should continue growing at an exponential rate as more banks, insurance companies, and traditional wealth managers embrace the technology. Banks are expected to continuously invest in digital platforms such as marketplace lending and mobile apps and explore the real-time payments ecosystem to meet customer demand for faster transaction speeds. In addition, robotics process automation will likely ramp up for various applications, including compliance, fraud detection, and customer service. At the end of the day, financial services companies operating in a low-rate environment have to focus on the cost side because they can’t grow revenue at will. Fintech M&A is a major avenue to cost rationalization.
Fintech: 2016 top five deals by deal value
Buyer TargetAgreement date
Deal value ($m)
Target general industry type
Target region
Quintiles Transnational Holdings, Inc.
IMS Health Holdings, Inc. 5/3/2016 $9,002.32 Financial technology company
Northeast
Total System Services, Inc. TransFirst Holdings Corp. 1/26/2016 $2,350.00 Financial technology company
Mid-Atlantic
Synchronoss Technologies, Inc. IntraLinks Holdings, Inc.. 12/5/2016 $799.92 Financial technology company
Mid-Atlantic
Investor group Epiq Systems, Inc. 7/27/2016 $630.30 Financial technology company
Midwest
Thoma Bravo, LLC Imprivata, Inc. 7/13/2016 $543.75 Financial technology company
Northeast
Source: SNL Financial—M&A market data, http://www.snl.com.
Banking and securities M&A outlook | Opportunities amid uncertainty
14
After three years of robust activity, banking and securities organizations may take a short pause in early 2017 before resuming M&A activity as both sellers and buyers weigh the potential implications of a post-election regulatory reset, a mid-December interest rate hike, and customers’ growing digital demands. Still, elevated market valuations, a boost in corporate revenue from increasing consumer spending, and other positive macroeconomic conditions will provide impetus to the anticipated resumption of M&A deals.
The big unknown: Potential M&A impacts from post-election regulatory policy shifts
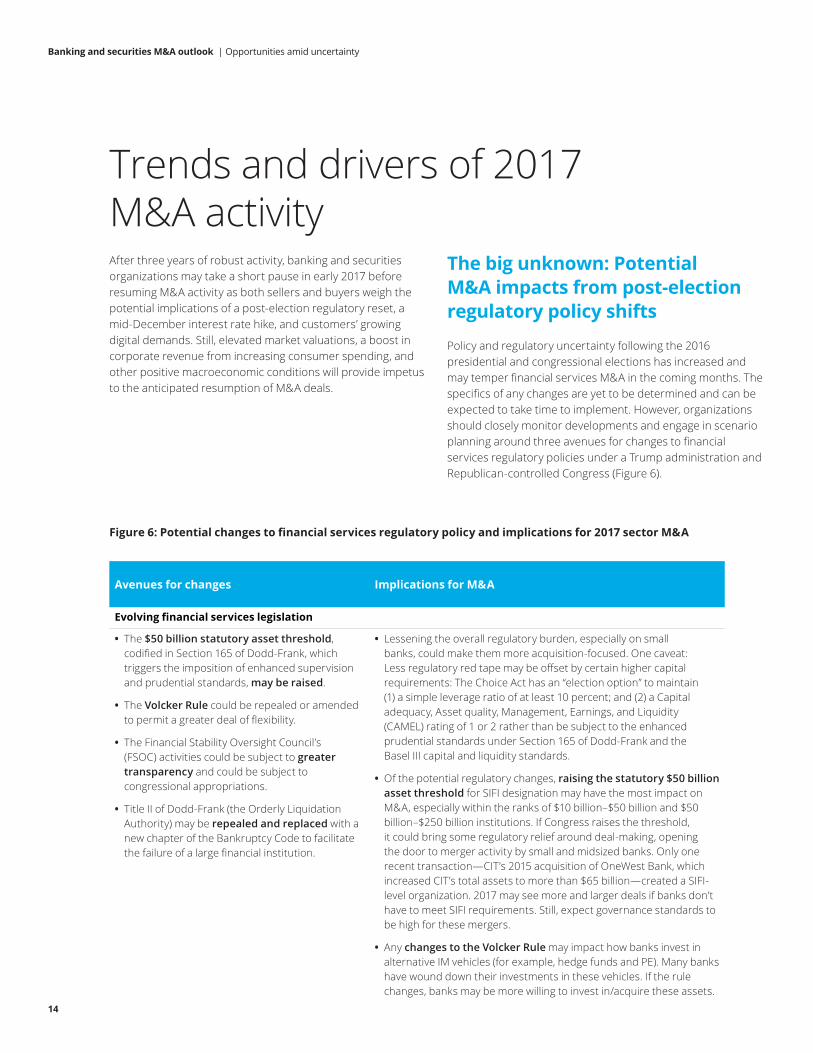
Policy and regulatory uncertainty following the 2016 presidential and congressional elections has increased and may temper financial services M&A in the coming months. The specifics of any changes are yet to be determined and can be expected to take time to implement. However, organizations should closely monitor developments and engage in scenario planning around three avenues for changes to financial services regulatory policies under a Trump administration and Republican-controlled Congress (Figure 6).
Avenues for changes Implications for M&A
Evolving financial services legislation
• The $50 billion statutory asset threshold, codified in Section 165 of Dodd-Frank, which triggers the imposition of enhanced supervision and prudential standards, may be raised.
• The Volcker Rule could be repealed or amended to permit a greater deal of flexibility.
• The Financial Stability Oversight Council’s (FSOC) activities could be subject to greater transparency and could be subject to congressional appropriations.
• Title II of Dodd-Frank (the Orderly Liquidation Authority) may be repealed and replaced with a new chapter of the Bankruptcy Code to facilitate the failure of a large financial institution.
• Lessening the overall regulatory burden, especially on small banks, could make them more acquisition-focused. One caveat: Less regulatory red tape may be offset by certain higher capital requirements: The Choice Act has an “election option” to maintain (1) a simple leverage ratio of at least 10 percent; and (2) a Capital adequacy, Asset quality, Management, Earnings, and Liquidity (CAMEL) rating of 1 or 2 rather than be subject to the enhanced prudential standards under Section 165 of Dodd-Frank and the Basel III capital and liquidity standards.
• Of the potential regulatory changes, raising the statutory $50 billion asset threshold for SIFI designation may have the most impact on M&A, especially within the ranks of $10 billion–$50 billion and $50 billion–$250 billion institutions. If Congress raises the threshold, it could bring some regulatory relief around deal-making, opening the door to merger activity by small and midsized banks. Only one recent transaction—CIT’s 2015 acquisition of OneWest Bank, which increased CIT’s total assets to more than $65 billion—created a SIFI-level organization. 2017 may see more and larger deals if banks don’t have to meet SIFI requirements. Still, expect governance standards to be high for these mergers.
• Any changes to the Volcker Rule may impact how banks invest in alternative IM vehicles (for example, hedge funds and PE). Many banks have wound down their investments in these vehicles. If the rule changes, banks may be more willing to invest in/acquire these assets.
Figure 6: Potential changes to financial services regulatory policy and implications for 2017 sector M&A
Banking and securities M&A outlook | Opportunities amid uncertainty
Trends and drivers of 2017 M&A activity

15
Avenues for changes Implications for M&A
Changes to existing rules or guidance at the agency level
• Further to its pending proposed rule to amend the Comprehensive Capital Analysis and Review (CCAR) process for “large and noncomplex” firms by exempting these firms from the qualitative assessment, the Fed could make additional discretionary changes to the program, such as providing greater transparency regarding its stress scenarios.
• The DOL could delay the initial April 2017 compliance date for its “Conflict of Interest” rule.
• The Fed and the Federal Deposit Insurance Corporation (FDIC) could amend its resolution planning rule to require submissions every two years rather than annually.
• The Treasury Secretary, as Chair of the FSOC, could seek to rescind the existing nonbank financial company designations and decline to pursue additional designations.
• The compliance date for the DOL’s fiduciary standard and its related exemptions has already jump-started strategic reconfigurations and divestitures in the industry. However, in 2017 organizations may wait for clarity about any delay in the compliance date before choosing among the paths that have been created by the rule. The paths that firms choose could influence portfolio shifts, M&A activity, operating models, compliance intensity, and change the nature of risks that constitute the costs of doing business. Regulatory policy and the industry’s choices could, in turn, influence the future structure of revenue pools within the market itself. Also, a current key challenge in dealmaking is modeling pro forma CCAR in diligence so softening in this area would reduce a key dealmaking impediment.
Changes to personnel and future rule-making/enforcement
Among the most significant vacancies or expected vacancies for the Trump Administration to fill:
• Treasury Secretary (also serves as FSOC Chair)
• Two Fed Governors (including the Vice Chairman for Supervision)
• Independent Director of the FDIC Board (Chairman Gruenberg’s term expires in November 2017 and Vice Chairman Hoenig’s term expires in April 2017)
• Comptroller of the Currency (Comptroller Curry’s term expires in April 2017)
• CFPB Director (ability to replace Director Cordray at will is contingent on ongoing litigation)
• Three SEC Commissioners (including Chair White)
• Three CFTC Commissioners
• Regulatory agency heads have the authority to change policies and practices, including those that may impact 2017 banking and securities M&A. The longer key vacancies remain unfilled, the more uncertainty it will produce, a situation that tends to place M&A in a holding pattern. When organizations get more clarity about agency appointments and regulatory direction, they may be more likely to move ahead with dealmaking.
Banking and securities M&A outlook | Opportunities amid uncertainty

16
Banking and securities M&A outlook | Opportunities amid uncertainty
Despite the prospects of a “regulatory re-do” in 2017, the financial services industry is getting better at taking waves of regulation-induced change within its stride. For example, banks continue to restructure their businesses in light of capital liquidity and other regulatory requirements. And even though the Volcker Rule has not been fully enacted, most banks have already divested the pertinent assets so any subsequent changes are likely to have little-to-no impact. The persistent onslaught of new regulation in the years following the financial crisis has created enterprise-level adaptability to change that extends to the M&A lifecycle. While transitions are no less difficult or painful, they have become less surprising and, thus, more manageable.
Other 2017 M&A influencers
Although the evolving, post-election regulatory environment is likely to attract the most attention among the clutch of 2017 banking and securities M&A drivers (and inhibitors), financial services organizations should also be aware of several other potential market influencers:
• Rise in interest rates. The Fed’s December 2016 interest rate increase of a quarter percent was not unexpected, given the sustained improvements in the US economy. And although the rate increase was slight (and not indicative of a steepening of the rate cycle), it—and the Fed’s signals for more frequent increases in 2017—is enough so that higher net interest margins (NIM) will give banks at least a little wiggle room to improve ROE in light of today’s increased regulatory capital and liquidity requirements. In addition, the combination of an interest rate increase and a softening of financial services regulations (especially raising the SIFI thresholds) may make people more bullish about engaging in banking sector M&A. Also, if the stock market continues to rally through the first half of 2017, we may see deals over $5 billion.
• OCC charters may boost marketplace lending through fintechs. The Office of the Comptroller of the Currency (OCC) announced in December 2016 that it will consider granting special-purpose bank charters to fintech companies, in recognition of the growing importance of fintech and the movement of banking to digital platforms. The OCC solicited public comment on a number of questions, and that comment period closed on January 15, 2017. Such charters potentially could spark deal activity or strategic partnering. In any case, fintechs choosing an OCC charter, if one becomes available, will need to quickly respond to the set of OCC regulatory requirements compared to state requirements.
• Potential tax reform impacts. Corporate tax law changes may increase war chests for investment in domestic M&A deals but negatively impact the mortgage lending market should interest deductions be impacted. A meaningful reduction in the US corporate tax rate could also reduce investor appetite for real estate investment trusts (REITS) and related vehicles.
• New capital requirements may slow inbound M&A. As part of Basel III banking reforms, European banks should anticipate a likely increase in the leverage ratio for SIFIs above the current three percent level. Yet the timing and final calibration for new capital buffer requirements remain uncertain. If higher capital requirements are imposed, it could further weaken European banks’ ability to make any near-term acquisitions in the United States. Likely, the few exceptions to slower inbound M&A in 2017 may be pure-play banking deals from Canada, Asia, and the UK for specialty finance and IM assets. Two Canadian banks’ announced acquisitions of US institutions were among the top five banking deals of 2016: Canadian Imperial Bank of Commerce/Private Bancorp, Inc., and Toronto Dominion Bank/Scottrade Bank. Their actions may inspire other Canadian banks to follow suit.
17
Banking and securities M&A outlook | Opportunities amid uncertainty
What should banks consider doing now?
Entering 2017, the shifting regulatory environment, rising (yet still near-historic lows) interest rates, and persistent challenges to topline growth are likely to prompt banking and securities organizations to reevaluate the efficacy of their business-building strategies. Yet even as some capital markets businesses answer tough questions about their short-term growth and long-term return potential, banks with strong franchises that have “stayed the course” could see their patience rewarded.
For organizations considering M&A in 2017—especially those that have been sitting on the sidelines for several years—considerable preparation will need to take place. Many firms disbanded their M&A function post-recession, reassigning staff to stress-testing and other compliance-related roles. In anticipation of a possible general regulatory softening, now may be a good time to re-engage internal and external M&A professionals to conduct due diligence on potential targets to help modernize operations, add products and capabilities, and enter new markets. Importantly, this analysis should identify opportunities for pure-play M&A as well as JVs and other partnerships.
Playbooking is another important exercise for the coming year. Banking and securities firms should come up with at least two marketplace scenarios and their potential responses. For example, should the economy take off, will they be a buyer or seller? If their choice is to buy, their M&A professionals should identify assets that may come on the market that will be accretive to the company. It is important in scenario planning to align corporate and M&A strategies and make them nimble enough to address whatever the coming year brings.
Finally, keep an eye on the news. Market conditions may change in 2017—especially on the regulatory front. The 2016 presidential and congressional election results have implications for future regulatory policy. However, the specifics are as yet uncertain, and any changes can be expected to take time to implement. Accurate and up-to-date information is the bedrock of strategic M&A planning and execution.
Taking advantage of opportunities amid uncertainty
18
Endnotes1 SNL Financial—M&A market data, http://www.snl.com.
2 Bank M&A 2016 Deal Tracker—Deal volume down YOY, SNL, November 15, 2016.
3 SNL Financial—M&A market data, http://www.snl.com.
4 Ibid.
5 Ibid.
6 http://www.4-traders.com/BOHAI-FINANCIAL-INVESTMEN-10237875/news/Bohai-Financial-Investment-Holdng-Avolon-to-Ac-quire-Aircraft-Leasing-Business-of-CIT-Group-23176530/.
8 “CIT completes acquisition of OneWest Bank,” CIT news release, August 5, 2015, http://news.cit.com/press-release/corpo-rate-news/cit-completes-acquisition-onewest-bank.
9 “Moody’s: Marketplace Lending May Benefit from OCC Fintech Bank Charter,” Crowdfund Insider, December 10, 2016, http://www.crowdfundinsider.com/2016/12/93571-moodys-marketplace-lending-will-benefit-occ-fintech-bank-charter/. Accessed December 13, 2016.
10 “Basel Committee Head Takes Hard Line on New Banking Rules,” Law360, November 30, 2016, http://www.law360.com/arti-cles/867266/basel-committee-head-takes-hard-line-on-new-banking-rules. Accessed December 13, 2016.
Banking and securities M&A outlook | Opportunities amid uncertainty

ContactsJason LanganPartner, M&A Transaction ServicesDeloitte & Touche LLP+1 212 436 [email protected]
Paul LegerePrincipal, M&A Consultative ServicesDeloitte Consulting LLP+1 312 486 [email protected]
ContributorsMatthew HuttonPartnerDeloitte & Touche LLP
Masaki NodaManaging DirectorDeloitte & Touche LLP
Christopher SpothManaging Director, Americas Lead, Center for Regulatory Strategy Deloitte & Touche LLP
Christopher TotoManaging Director Deloitte & Touche LLP
19
Banking and securities M&A outlook | Opportunities amid uncertainty

About DeloitteDeloitte refers to one or more of Deloitte Touche Tohmatsu Limited, a UK private company limited by guarantee (“DTTL”), its network of member firms, and their related entities. DTTL and each of its member firms are legally separate and independent entities. DTTL (also referred to as “Deloitte Global”) does not provide services to clients. In the United States, Deloitte refers to one or more of the US member firms of DTTL, their related entities that operate using the “Deloitte” name in the United States, and their respective affiliates. Certain services may not be available to attest clients under the rules and regulations of public accounting. Please see www.deloitte.com/about to learn more about our global network of member firms
This publication contains general information only and Deloitte is not, by means of this publication, rendering accounting, business, financial, investment, legal, tax, or other professional advice or services. This publication is not a substitute for such professional advice or services, nor should it be used as a basis for any decision or action that may affect your business. Before making any decision or taking any action that may affect your business, you should consult a qualified professional advisor.
Deloitte shall not be responsible for any loss sustained by any person who relies on this publication.
Copyright © 2017 Deloitte Development LLC. All rights reserved.


