Page 1
Banking Relationships and Syndicated Loans during the
2008 Financial Crisis
Herve Alexandre, Karima Bouaiss, Catherine Refait-Alexandre
To cite this version:
Herve Alexandre, Karima Bouaiss, Catherine Refait-Alexandre. Banking Relationships andSyndicated Loans during the 2008 Financial Crisis. Journal of Financial Services Research,Springer Verlag, 2014, 46 (1), pp.99:113. <10.1007/s10693-013-0172-4>. <halshs-01067252>
HAL Id: halshs-01067252
https://halshs.archives-ouvertes.fr/halshs-01067252
Submitted on 24 Sep 2014
HAL is a multi-disciplinary open accessarchive for the deposit and dissemination of sci-entific research documents, whether they are pub-lished or not. The documents may come fromteaching and research institutions in France orabroad, or from public or private research centers.
L’archive ouverte pluridisciplinaire HAL, estdestinee au depot et a la diffusion de documentsscientifiques de niveau recherche, publies ou non,emanant des etablissements d’enseignement et derecherche francais ou etrangers, des laboratoirespublics ou prives.
Page 2
1
Banking Relationships and Syndicated Loans during the 2008 Financial Crisis
H. Alexandre a*
, K. Bouaiss b, Catherine Refait-Alexandre
c
a Université Paris Dauphine, DRM, Place du Maréchal de Lattre de Tassigny 75016 Paris
b Université François Rabelais, 50 av Portalis, 37200 Tours Cedex 03
c Université de Franche Comté, Crese, 45 avenue de l’Observatoire, 25000 Besançon
*Corresponding author. E-mail: [email protected]
Abstract
The research shows that banking relationships are important to lending. However, few
studies focus on the banking relationships in syndicated loans, although these loans have
became a major source of financing. The last financial crisis clearly shows the impacts of
credit rationing and tightening credit conditions, even in the syndicated loans market. We
investigate whether banking relationships help firms to benefit from better terms for
syndicated loans in a chaotic financial environment. Using a sample of syndicated loans
arranged from 2003 to 2008 in North America and Europe, we find that firms with a
previously developed relationship with a lead bank obtained a lower spread and a longer
maturity during the financial crisis but did not benefit from larger loan facilities.
Keywords : syndication, loans, banking relationship, financial crisis. JEL classification: G10,
G21, G32
Page 3
2
1. Introduction
Syndicated bank loans have been a major type of financing in the world since the early
1990s. In the mid-2000s, these loans became the principal source of financing for firms
in the United States. However, their role in financing the economy was affected by the
2008 Financial Crisis that brought about a sharp reduction in the overall credit facilities
and the number of loans granted. The number of syndicated loans granted worldwide
was 9,270 in 2007 down to 7,120 in 2008 and the syndicated loan credit facilities
worldwide were 44,615,000 MUSD (millions USD) in 2007 down to only 24,760,000
MUSD in 2008. The spreads also rose considerably during 2008, and the average
maturity of newly arranged loans declined.
Given this situation, our study addresses the following questions: Does a past
relationship help a firm to find financing on good terms, not only with regard to the
extent of the facility, but also the interest rate and maturity? Our goal is to verify
whether the existence of past relationships helped borrowers gain more favorable credit
terms in 2008 because the relationships gave information and more confidence to the
banks.
The literature has not studied the role of banking relationships in the syndicated loan
market to much extent. Harjoto et al. (2006) and Bosch (2007) show that borrowers
benefiting from a long-term relationship are charged a reduced spread. In contrast,
Mattes et al. (2012) show that banks can exploit their competitive advantage and charge
a surplus called information rent. The peculiar role of banking relationships during the
2008 crisis has been analyzed for credit loans (see for instance Albertazzi and
Marchetti, 2012), but not for syndicated loans, excepted Ivashina and Scharfstein (2010),
focusing on the bank-dependence issue.
Page 4
3
Accordingly, our article makes three contributions to the literature. First, we show that
banking relationships strongly influences the terms of syndicated loans. Next, we focus on
the banks’ behavior during the last financial crisis by examining the features of the
syndicated loans issued in 2008. Further, we make the loan amount and the maturity
endogenous because they can be rationing variables for the banks. Indeed, in 2008, banks
rationed credit for businesses by reducing the amounts they lent or reducing the maturities
of their loans. Because most articles concentrate on the determination of the spread and
consider that the maturity and the amount of the loans themselves are exogenous, this
article provides new results concerning the determination of the amount and maturity of
loans.
We use a sample of 4,044 tranches of syndicated loans arranged in the United States,
Canada, and Europe during 2008. We construct an original database and original proxies
to capture the relationship between the borrowing firm and the banks in the lending
syndicate in 2008. We find that borrowing frequently or in large amounts does not help
the firm to improve its credit terms in a time of crisis. However, we find that a previous
relationship between the firm and its syndicate, particularly with the lead bank, improves
credit terms. If the lead bank of the syndicate in 2008 has been a book-runner for a
previous syndicated loan to the firm, it helps to decrease the spread by 14 bps. Moreover,
if the syndicate is the same as before the spread decreases by 57 bps and the maturity
increases by more than half a year.
The rest of the article is organized as follows: Section 2 presents the literature review
and the hypotheses we test. Section 3 describes the data set and the variables. Section 4
explains the econometric models and reports the results. Section 5 summarizes the key
conclusions of this paper.
Page 5
4
2. Literature review and hypothesis
2.1. Banking relationships in syndicated loans
Banking relationships can influence syndicated loans terms. However, the role of lending
relationships in syndicated loans remains virtually unexplored. When banks develop a
long-term relationship (called a banking relationship, or a lending relationship) with
their customers in a syndicated-loan market with repeated transactions, they gather
information about the firms. Harjoto et al. (2006) and Bosch (2007) show that the
consequences from information gathering can be positive for debtors, such as the benefit
of a reduced interest charge or suffering less from credit rationing.
Harjoto et al. (2006) try to confirm if banking relationships matter by asking whether
commercial and investment banks adopt the same tariff policies. Their reasoning is the
following: In the syndicated loan market, commercial banks are more likely to develop
a banking relationship. In contrast, investment banks are more likely to adopt arm’s
length transactions, the so-called transaction banking. So commercial banks could
gather information about firms and charge a reduced spread. Harjoto et al. (2006) find
that the investment banks charge higher spreads, and they thus provide the first
evidence that banking relationships matter in syndicated loans. Bosch (2007) also
investigates the role of banking relationships in the determination of the spread. He
shows that, whereas information asymmetries between the debtor and the syndicate
increase the spread, a preexisting banking relationship reduces it. His result confirms
the reasoning of Harjoto et al. (2006) that banking relationships provide information to
the banks, decrease the information asymmetries, and therefore allow a reduction of the
spread.
However, these results must be qualified. Banking relationships could have negative
consequences for firms, via the so-called hold-up effect. Indeed, banking relationships in
the syndicated loan market offer banks a competitive advantage because of the private
Page 6
5
information that banks have about firms. Thus, lending relationships can create
switching costs for firms, and banks can charge an information rent. As mentioned,
Mattes et al. (2012) show that if firms suffer from important switching costs, banks
exploit their advantage and charge a higher spread. Therefore, banking relationships can
offer an information rent to the banks, and can present drawbacks to the firms.
2.2. Banking relationships during the financial crisis of 2008
A financial crisis generates uncertainty and increase agency problems between banks
and borrowers. A first consequence is a “flight home effect”: Banks reduced their loans
to foreign customers. Giannetti and Laeven (2012) and De Haas and Van Horen (2013)
shown that a flight home effect existed on syndicated loans market during the financial
crisis of 2008. As information matters during 2008 financial crisis, another consequence
is that financial crises make the information that banks hold more valuable and make
the role of banking relationships greater .The information that banks hold thanks to
lending relationships can protect firms against an increase in the spread or against credit
rationing by generating confidence (see for instance Jiangli et al., 2008, showing that
banking relationships protect Korean and Thai firms against credit rationing during the
Asian financial crisis). Furthermore, when a firm is in financial distress, a preexisting
relationship can give banks the incentive to continue financing the firm because of the
belief that they will get their money back. On the contrary, information banks hold can
increase their competitive advantage by increasing their information rent and increasing
the spread.
Some empirical evidence exists that banking relationships protected firms from the
credit crunch during the crisis of 2008. Bartoli et al. (2011) analyze Italian bank loans
for small business and find that banks use information they hold about the firms. This
finding implies that banks reduce their credit supply more for firms they do not know
than towards firms they know well. Cotugno et al. (2012) confirm that preexisting
Page 7
6
relationships in Italy reduce the risk of credit rationing. The results of De Mitri et al.
(2011) also show that long-term and concentrated relationships with banks protected
firms against the credit crunch of 2008. However, Albertazzi and Marchetti (2012)
analyze Italian bank credit and find no evidence that bank relationships influence the
credit supply. Firms benefiting from lending relationships suffered from the credit
crunch as much as the other firms, implying that banking relationships do not matter.
Few studies analyze whether banking relationships matter for the characteristics and
distribution of syndicated loans during the 2008 crisis. Ivashina and Scharfstein (2010)
show that this issue of bank-dependence was critical during the crisis of 2008. They
analyze all kinds of loans, but most of them are syndicated loans. They show that firms
borrowing from a liquidity-constrained bank, or borrowing from a sub-capitalized bank
suffer could not borrow easily from less constrained banks. Firms became more
dependent on their banks. Mattes et al. (2012) show that this phenomenon existed in the
syndicated loan market before the crisis of 2008 (from 1996 to 2005). The increased
risk of default for firms raised the market power of the banks and raised their
information rent (and so the spread) during periods of recession. However, the authors
do not find evidence of this holdup effect during the phases of expansion.
To sum up, the role played by banking relationships during the 2008 crisis is not
clear. And, in particular, their role has not been analyzed to much extent for the
syndicated loan market.
2.3. Hypothesis
We intend to test the idea that banking relationships provide advantages to the borrower
in the syndicated loan market. These advantages accrue from a syndicate’s temporal
stability: The temporal stability reduces the average cost of acquiring information
because banks can reuse information over time. That enables firms to pay a lower
spread, borrow a higher amount, and enjoy a longer maturity.
Page 8
7
The experience that a borrower has of the syndicated loan market is also important. The
market’s knowledge of a firm is better when the firm has previously received a
syndicated loan. Furthermore, if a firm successfully services a previous loan, it also
improves the firm’s reputation, as shown by Sufi (2007). Therefore, a firm’s incentive is
to reduce risk-taking in order to build up and retain a good reputation in the debt
market. Positive past operations on the syndicated-loan market enable firms to negotiate
loans with lower spreads, longer maturities, and larger amounts.
We also consider other determinants of credit terms in our empirical analysis. First,
the issue of banking relationships makes sense if information asymmetries exist
between the borrower and banks. A serious information asymmetry situation generates
high screening and monitoring costs for the bank, and these costs are passed on to the
borrower through the interest rate. The spread thus increases with the extent of the
information asymmetry (Ivashina 2009). To protect themselves against uncertainty,
banks also can reduce the maturity of the loan and the amount loaned in the presence of
information asymmetries.
Second, the borrower’s risk influences the spread. In a traditional risk or return
situation, the remuneration demanded by creditors necessarily depends on the risk
presented by the borrower—namely the probability the borrower might not repay the
loan. A higher default risk increases the spread. This risk can also lead banks to reduce
the amount loaned and the maturity of the loan.
Third, a link exists between the spread, the maturity, and the amount because they
are negotiated simultaneously between the firm and the loan arrangers. The maturity of
the loan plays a positive role in determining the spread: A long maturity increases
uncertainty about the risk of default and leads to a higher spread. Meanwhile, the
amount of the loan can have a negative influence on the spread because of important
Page 9
8
economies of scale, especially the reduction in screening and monitoring costs per
dollar loaned (see Bosch 2007).
Fourth, the structure of the banking syndicate also influences the terms of the loan.
The syndicate’s size affects risk diversification. Syndication of a loan spreads the risk
between several lenders, thus resulting in lower risk-taking for each bank, and leads to a
lower spread (see Ivashina 2009). We therefore expect the size of the syndicate to have
a negative effect on the spread and a positive effect on the amount loaned and the
maturity of the loan. The portion of the loan financed by the arranging banks also plays
an important role because of the information asymmetry between arrangers and the
other banks in the syndicate regarding the borrower’s risk of default (Esty and
Megginson 2003). This asymmetry creates the risk of opportunism by the well-informed
arrangers, because they could syndicate the riskier loans and keep the safer loans for
themselves. This eventuality can make less-informed banks reluctant to join the
syndicate. However, the participating banks’ confidence increases if the lead bank and
all of the arrangers retain a large share of the loan, because this signals their belief in the
quality of the project and because they have a greater incentive to ensure that the
transaction runs smoothly. Therefore, seeing the arrangers finance a large share fosters
greater confidence and therefore a lower spread, a larger amount, and a longer maturity
(see e.g. Casolaro et al. 2008).
3. Data
3.1. Sample selection
We draw our data from the Dealscan database. We start with all of the syndicated loans
issued in 2008 for Europe, Canada, and the United States. The data represents 80% of
the amount of loans syndicated worldwide. The Dealscan database contains 5,917
tranches of loans for 2008. We eliminate all tranches for which the spread, maturity, and
the nature of the bank syndicate are not available. Each loan consists of separate
Page 10
9
tranches with different maturities, rank (senior, subordinated, or mezzanine), spread,
and maturity. A tranche-based approach facilitates consideration of the risk borne by the
creditor and of the loan features. The sample consists of 4,044 tranches of which 3,143
were issued to firms in the United States and Canada and 901 to firms in Europe. We
offer two empirical analyses. In the first one, we take into consideration all of the
tranches. We explain the spread, facility size and maturity. In the second analysis, we
restrict our sample, retaining only firms that received at least one syndicated loan in the
period of 2003 to 2007 in order to take into account the preexisting relationship between
the firm and the banks. This restriction applies to 2,092 tranches, but we can only keep
those which have the necessary information in the database. Therefore, our final
subsample consists of 1,733 tranches.
3.2. Dependent variables: Loan determinants
In this subsection, we seek to explain the syndicated loan features, collectively referred
to as the loan determinants. Three dependent variables are taken into consideration.
Facility is the amount of each tranche in millions of dollars. Spread is the number of
basis points that the borrower pays in addition to a base rate—in most cases the Libor—
but sometimes the Euribor or a fixed rate. Maturity expresses the maturity of the tranche
in months.
Table 1 here
The average size of the tranches in our sample is 195.44 MUSD, the average spread
is 266 bps, and the average maturity is 52.66 months. In 2008, firms that benefited from
at least one syndicated loan between 2003 and 2007 were able on average to borrow a
significantly larger amount than firms that were not active in the syndicated-loan market
(272.19 MUSD against 113.73 MUSD). They also generally had the advantage of
paying lower spreads (249 bps compared to 283 bps). However, contrary to
Page 11
10
expectations, the loan maturity is shorter for firms that had previously taken out
syndicated loans (47.88 months against 57.74 months).
3.3. Independent variables
Five types of explanatory variables are considered: Banking relationships, borrower
experience, information asymmetry, borrower default risk, syndicate structure and
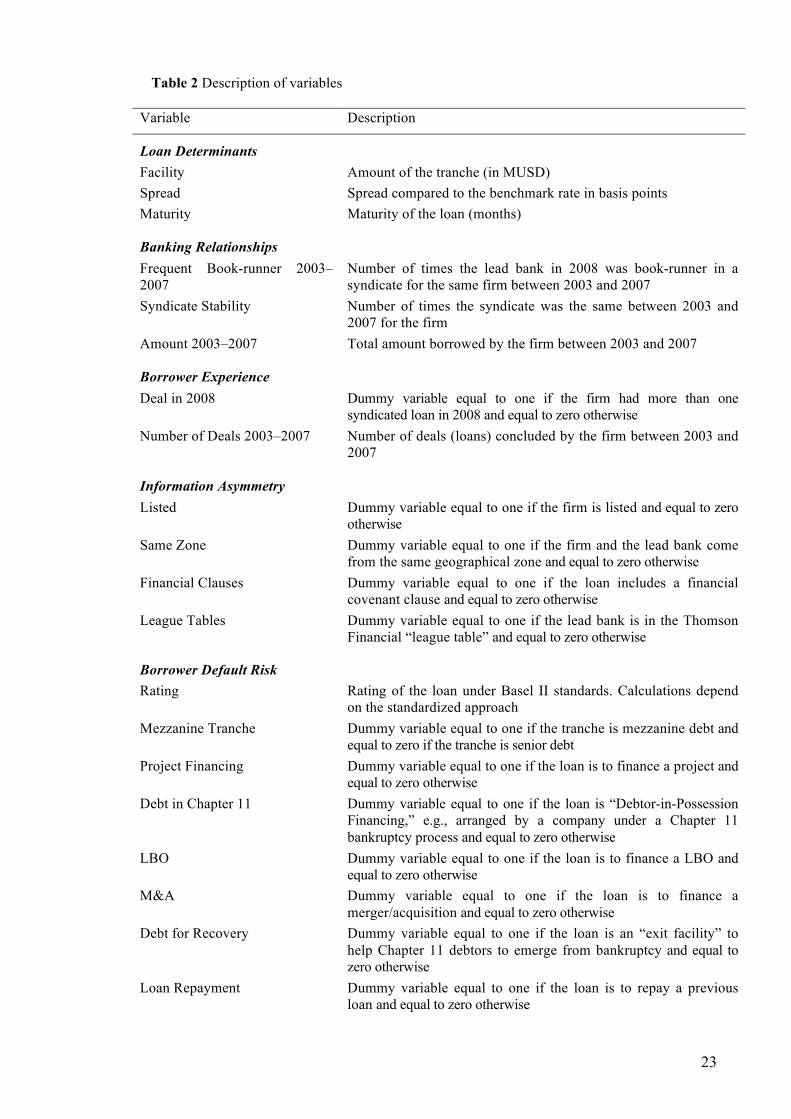
control variables. Table 2 defines the variables and table 3 provides summary statistics.
Table 2 here
Banking Relationships. We created detailed variables on the nature of the relationships
between the firm and the banks. These variables are only constructed for firms that had
at least one loan between 2003 and 2007. Actually, a borrower and his banks need time
to build banking relationships. Frequent Book-runner 2003–2007 indicates the number
of times the lead bank in 2008 was a book-runner for a loan issued by the firm between
2003 and 2007. Syndicate Stability shows the number of times the 2008 syndicate was
the same for previous syndicated loans to the firm. Amount 2003–2007 is the total
amount the firm borrowed in the syndicated-loan market between 2003 and 2007.
Borrower Experience. For all tranches, we consider whether the firm frequently
borrows in the syndicated-loan market. Deal in 2008 is equal to one if the firm had more
than one syndicated loan in 2008 and zero otherwise. Number of Deals 2003–2007 is
the number of syndicated loans borrowed by the firm between 2003 and 2007.
Information Asymmetry. Measuring the scale of informational imperfections directly
is difficult. Information asymmetry is often assessed indirectly, primarily through
debtor transparency. Listed firms are presumed to be more transparent. We therefore use
the variable Listed, a dummy variable equal to one if the firm is listed, and zero
otherwise. As shown by Giannetti and Laeven (2012) and De Haas and Van Horen
(2013), the monitoring costs and the screening costs are reduced by geographical
Page 12
11
proximity between the borrower and the banks. So we consider Same Zone, equal to
one if the firm and the lead bank come from the same geographical zone, and zero
otherwise. The inclusion of the financial covenant clauses in the loan agreement
(Financial Clauses is equal to one in such a case and zero otherwise) can restrict the
manager’s freedom of action and therefore reduce the risk of opportunistic behavior by
the manager. Lastly, informational problems between the arrangers and the other banks
in the syndicate are eased by the lead bank’s reputation. We therefore use the variable
League Tables that is equal to one if the lead bank is included in the Dealscan league
tables, and zero otherwise.
Borrower Default Risk. The measure of the borrower’s risk (Rating) is based on the
Standard & Poor’s ratings available from Bankscope. These ratings are difficult to use
in an empirical study and have been converted into a weighting (from zero to 150%)
identical to the weighting used for standard credit risk assessment under Pillar 1 of the
Basel II framework. This approach offers two advantages: It can quantify the risk in the
context of an econometric study, and it makes possible the incorporation of the
observations for which the database contains no rating (a 100% weighting is applied to
an unrated firm). Furthermore, we use several variables to measure the default risk in
each tranche. First, We take into consideration the tranche's degree of subordination.
Mezzanine Tranche is equal to one for a mezzanine tranche and is equal to zero for a
senior tranche. And second, the syndicate’s default risk depends on the intended
application of the funds, in other words on the loan’s purpose. Therefore, we use the
following six variables: Project Financing is equal to one if the purpose of the loan is to
finance a project, equal to zero otherwise; Debt in Chapter 11 is equal to one if the loan
is a “Debtor-in-Possession Financing” arranged by a company under the Chapter 11
bankruptcy process, equal to zero otherwise; LBO is equal to one if financing an LBO
operation, equal to zero otherwise; M&A is equal to one if financing a merger or
Page 13
12
acquisition operation, equal to zero otherwise; Debt for Recovery is equal to one if
financing a business’s recovery under Chapter 11, equal to zero otherwise; and Loan
Repayment is equal to one if repaying a previous loan, equal to zero otherwise.
Syndicate Structure. We measure the syndicate size by the total number of banks
(Number of Banks). The relative importance of the arrangers is measured by the ratio of
the number of top tier arrangers to the total number of banks (Top Tier Arranger).
Control Variables. Two control variables are used: The first is the number of tranches
in the loan (Number of Tranches). The second is the borrower’s nationality in case there
are disparities associated with the geographical area (Borrower’s Nationality is equal to
one for a European borrower and zero for a North American borrower from the United
States or Canada).
Table 3 here
4. Results and discussion
4.1. Analysis of loan determinants in 2008
In this subsection, we study the determinants of the features of the syndicated loans
granted in 2008. The three dependent variables are determined simultaneously by the
arranger when the loan is organized and during the negotiation with the firm. They are
endogenously set and interdependent; so we use a simultaneous equation model.
We estimate the following model:
Spread = f {Borrower Experience, Information Asymmetry, Borrower Default Risk,
Syndicate Structure, Facility, Maturity, Control Variables} (1)
Facility = f {Borrower Experience, Information Asymmetry, Borrower Default Risk,
Syndicate Structure, Spread, Maturity, Control Variables} (2)
Maturity = f {Borrower Experience, Information Asymmetry, Borrower Default Risk,
Syndicate Structure, Spread, Facility, Control Variables) (3)
Page 14
13
The estimation uses a two-stage least squares (2SLS) with instrumental variables.
First, we check for multicollinearity between the explanatory variables. With a finite
sample, the advantage of an estimate of the overall system is not clearly established,
whereas an equation-by-equation estimation is perfectly valid (Davidson and Mac
Kinnon 1993). Moreover, when there is no heteroskedasticity and no autocorrelation,
the 2SLS estimator is the most efficient (Greene 2008). In this method, the choice of the
instruments and the number of instruments are critical because we need to satisfy order
and rank conditions. Davidson and Mac Kinnon (1993) show that the exogenous
variables in the system are the optimal instruments. As in Brick and Palia (2007), we
use a Hansen–Sargan test to validate our instruments (for each equation, if we can’t
reject the null hypothesis, then our instruments are valid and uncorrelated with the
errors). Consequently, the instrument variables are the independent variables of the
system.
Our results show the link between the determinants of the loan (see Table 4). A
longer maturity is linked to a higher spread, attributable particularly to the higher risk
involved. A longer maturity is also linked to a higher facility (in mean, one more year
allows a firm to borrow 78 MUSD more), maybe because the long-term loans fund
larger investments. And a higher amount is linked to a lower spread, chiefly due to
economies of scale in the bank's fixed costs. We thus confirm the previous findings in
the literature (Casolaro et al. 2008), even if the effect of the facility on the spread is
statistically more significant in their article but with a lower coefficient (-28 bps for 100
MUSD borrowed in their paper instead of -115 bps in ours). It is important to notice that
the mean spread is 266 bps in our sample to compare with 161 bps in theirs.
Table 4 here
The firm’s past financing record influences its loan determinants. First, the fact of
receiving several loans in 2008 reduces the amount loaned by 83.13 MUSD ceteris
Page 15
14
paribus. Maybe firms spread their credit needs across the year in order to take
advantage of any reversal in the trends of the crisis environment. Thus, this strategy
reduces the facilities of each loan. In line with the predictions, the greater the number
of loans arranged between 2003 and 2007 for a firm (Number of Deals 2003–2007),
the greater the amount this firm can borrow in 2008. The Number of Deals 2003–
2007, in contrast, has a positive influence on the spread in 2008 (an increase of 44 bps
for each past deal) and a negative influence on the maturity (-4.9 months for each past
deal). There are several possible explanations for this finding: The banks might
perceive an overuse in syndicated loans compared to diversified financing through
traditional forms of credit and capital-raising in the markets as a negative signal.
Alternatively, issuing syndicated loans to the same firms might reduce the gain from
risk diversification for the banks. Also, the frequent calls to the syndicated-loan
market might increase a firm's leverage and therefore its default risk, thus widening
the spread.
Our results also show that informational problems play a decisive role. The fact that
a firm is listed and therefore better known and subject to transparency obligations
enables it to borrow higher amounts (878 MUSD versus 338 MUSD), but the spread
and the maturity are unaffected by the listing. The inclusion of the financial covenant
clauses to protect creditors reduces the spread (130 bps on average) and makes
maturities longer (14 months on average), but also results in lower amounts. Lastly, as
expected, the lead bank’s presence in the Dealscan league tables increases the loan size
(92 MUSD on average). However, it also increases the spread. This finding cannot be
explained by internal information asymmetries in the syndicate: The lead bank’s
reputation is supposed to reduce the spread by reassuring the participating banks. But
our finding is attributable to the information asymmetries between the firm and the
Page 16
15
banking syndicate because the borrower is prepared to pay a high spread in order to
secure the services of a reputable investment bank.
In line with the predictions, the borrower’s default risk (measured by Rating) has a
negative influence on the amount of the loan. However, its impact is positive on the
maturity and it does not influence the spread. The purpose of the loan also plays a role
in determining the loan determinants. The loans used to finance projects have lower
spreads (a decrease of 790 bps) and smaller facilities, but longer maturities (89 months
on average). Conversely, loans for other purposes (namely the firm’s reorganization
under Chapter 11, financing takeovers – M&A – and debt for recovery) are charged a
higher spread, but also involve larger amounts and shorter maturities.
We also test for the influence of the syndicate structure on the financing terms. As
hypothesized, the larger the syndicate size, the higher the amount loaned (an increase of
30 MUSD per supplementary bank in the syndicate); and the higher the proportion of
arrangers, the higher the amount loaned. These two variables have a negative impact on
the maturity and a positive impact on the spread (one more bank in the syndicate leads
to an increase of 34 bps), which is contrary to other empirical studies such as Casolaro
et al. (2008) and Bosch (2007). Having a larger portion of the loan financed by the
arranging banks implies a larger borrower risk even though the arrangers signal their
confidence in the project to other banks in such a case. The arrangers thus charge for
their risk-taking through a shorter maturity and a higher spread. Another possible reason
for theses results is the risk of free riding in the monitoring activity that arises when the
number of banks is too high, which leads to higher spreads and shorter maturities.
Our last finding is very interesting: North American firms are charged higher spreads
than European firms (301 bps on average), and their maturities are shorter (32 months
on average) but their sizes are larger (216 MUSD on average). The literature does show
that international differences exist on syndicated loans markets. For instance, Carey and
Page 17
16
Nini (2007) and Christodoulakis and Olupeka (2010) shown that the debtor country
influences the spread. Carey and Nini (2007) also provided evidence that spreads are
higher in North American than in Europe. European firms benefited from a reduced
spread of 25 bps from 1992 to 1998 (on average) and 36 bps from 1999 to 2008 (on
average). This effect is higher in ours study (301 bps on average), maybe because the
crisis was harsher in North America.
Finally, the number of tranches does not play a significant role, contrary to the
results reported by Maskara (2010).
4.2. Analysis of previous banking relationships
We now examine whether the previous relationships developed between the firm and
the banks in the 2008 syndicate improve the terms of the loan received in 2008. We
focus on the firms that had a loan between 2003 and 2007. We restrict the sample to the
1,733 tranches received by these firms for which the relevant information is available.
The dependent variables are the same as previously, but the variables for banking
relationships are added to independent variables. We estimate the following model:
Spread = f {Banking Relationships, Borrower Experience, Information Asymmetry,
Borrower Default Risk, Syndicate Structure, Facility, Maturity, Control Variables} (1)
Facility = f {Banking Relationships, Borrower Experience, Information Asymmetry,
Borrower Default Risk, Syndicate Structure, Spread, Maturity, Control Variables} (2)
Maturity = f {Banking Relationships, Borrower Experience, Information Asymmetry,
Borrower Default Risk, Syndicate Structure, Spread, Facility, Control Variables) (3)
The econometric methodology is the same as previously.
The most striking result is that a past relationship between the 2008 syndicate and the
borrowing firm has a negative impact on the spread (see Table 5). The temporal stability
in the syndicate reduces the spread as does a past relationship with the lead bank:
Page 18
17
Borrowing from the same book-runner decreases the spread by 14 bps compared to the
past deal; if the past syndicate is the same as in 2008, the spread then decreases by 56
bps. This decrease shows that better knowledge of the borrower and existing trust
outweigh the hold-up effect during a crisis. Furthermore, the impact of past
relationships on the maturity is also beneficial for the borrower. Banking relationships
(measured by Syndicate Stability) lead to a longer maturity of 7.4 months for each past
loan with the same syndicate. And borrowing from the same book-runner increases the
maturity by 1.3 months. However, the previous relationship (Syndicate Stability and
Frequent Book-runner 2003–2007) has a negative impact on the loan size.
However, the indebtedness in the syndicated-loan market has drawbacks: Each past
deal (Number of Deals 2003–2007) increases the spread by 8 bps and decreases the
maturity of 1.8 months. And getting several deals in 2008 also increases the spread.
Furthermore, the total amount borrowed from 2003 to 2007 has a positive effect on the
spread (but only 0,005 bps per MUSD) and a negative (but very small) effect on the
maturity in 2008. Actually, a large loan amount and numerous past deals indicate high
leverage, which leads to a high-risk premium. However, these variables (Amount 2003–
2007, Deal 2008, and Number of Deals 2003–2007) in fact have a positive influence on
the amount loaned in 2008—maybe quite simply due to a firm size effect.
Table 5 here
Most other results are basically the same as in the first model, but certain new results
are worth noting. Some interesting results come from the comparison with the previous
regression. In the second model, the coefficient for the maturity in the equation
concerning the spread is 4.347 (one more month of credit increases the spread of 4 bps).
In the first model it is 8.819. Ceteris paribus, this coefficient means that increasing the
maturity of the loan doubles the spread for the sample of borrowers that previously did
not use a syndicated loan. So, the risk-premium is reduced for the firms that have
Page 19
18
previously borrowed on the syndicated loan market. The difference between spreads
charged to European firms and spreads charged to North-American firms is also
reduced: The latter benefit from banking relationships. In the same vein, the purpose of
the loan plays an almost insignificant role in the second model (except LBO); perhaps
because, during the crisis, the trust and knowledge in the firm replace the economic
features of the project financed by the loan.
4.3. Robustness test
We want to measure the evolution of the role played by relationships between
borrowers and banking syndicates before and during the crisis. We used the same model
as in section 4.2 but with the syndicated loans taken out before the 2008 financial crisis.
Then we compare the results of the two regressions. We find that the role of the
relationships between the banking syndicates and borrowers increased: Banking
relationships are especially valuable during a crisis.
The most important change is about the relation between the syndicate stability
(Syndicate Stability) and the spread. Before the crisis, the syndicate stability increases
the spread (providing evidence of a hold-up effect) while it decreases it after the crisis.
This confirms the importance of banking relationships on the loans determinants.
The crisis also changed the influence of banking relationships on the maturity of
loans. Before the crisis, relationship variables (Frequent Book-runner 2003–2007 and
Syndicate Stability) have no effect on the maturity. However, they have a positive effect
on the maturity after 2008. During the crisis, the previous relationship with banks helps
to increase the maturity.
As we have seen before, the number of deals decreases the spread for a new loan
done during the crisis. An interesting result of our robustness test is that this effect was
no significant in the model before the crisis.
Page 20
19
To conclude, one main result is that during a crisis banks lend to borrowers they
know with a lower spread and a longer maturity than before the crisis.
5. Conclusion
In the 2008 Financial Crisis, the banks reduced the amount of credit and tightened up
their terms in the syndicated-loan market. We examine whether a past relationship
between a firm and a banking syndicate, and the firm’s experience on syndicated loan
markets, can cushion a firm somewhat against this trend towards stricter terms.
Constructing original variables concerning the firm's syndicated loan record between
2003 and 2007, we show that several loans on the syndicated-loan market are
unfavorable for the firm in terms of spread and maturity. Borrowing frequently or in
large amounts does not enable the firm to build up a positive reputation in this market
that might improve its credit terms, especially in a time of crisis.
However, a relationship between the firm and its syndicate, particularly with the lead
bank, improves credit terms. Specifically, this relationship reduces the loan’s spread and
increases its maturity. We also show that this relationship does not protect the firm from a
reduction in the size of its credit facilities. We thus show that during the crisis, the hold-
up effect is outweighed by the positive effect arising from better knowledge of the firm
and a strengthened confidence.
References
Albertazzi U, Marchetti D (2012) Credit crunch, flight to quality and evergreening: An
analysis of bank-firm relationships after Lehman. Working paper, Banca d’Italia,
available on ssrn
Bartoli F, Ferri G, Murro P, Rotondi Z (2011) Soft information and loan supply in the
crisis Evidence from the credit files of a large bank. Rivista Bancaria - Minerva
Bancaria No. 5-6/2011 available on ssrn
Bosch O (2007) Information asymmetry and the pricing of private debt—Evidence from
European syndicated loans EFA 2007 Ljubljana meetings paper Available at SSRN:
http://ssrncom/abstract=963412
Page 21
20
Brick IE, Palia D (2007) Evidence of jointness in the terms of relationship lending. J
Financ Intermed 16:452–476
Carey, M., Nini, G. (2007) Is the Corporate Loan Market Globally Integrated? A
Pricing Puzzle. The Journal of Finance, vol 62, n°6, p. 2969–3007.
Casolaro L, Focarelli D, Pozzolo A F (2008) The pricing effect of certification on bank
loans: Evidence from the syndicated credit market. J Mon Econ 55:335–349
Christodoulakis GA, Olupeka T (2010) Pricing and momentum of syndicated credit in
Europe. Omega 38:325-332. doi: 10.1016/j.omega.2009.09.008
Cotugno M, Monferrà S, Sampagnaro G (2012) Relationship lending, hierarchical
distance and credit tightening: Evidence from the financial crisis. J Bank Finance.
Available online
Davidson R, MacKinnon JG (1993) Estimation and inference in econometrics, OUP
USA
De Mitri S, Gobbi, G, Sette, E (2011) Do firms benefit from concentrating their
borrowing? Evidence from the 2008 financial crisis. Working Paper 772, Banca d’Italia
De Haas R, Van Horen N (2013) Running for the exit? International bank lending
during a financial crisis. Review of Financial Studies 26(1), p. 244-285
Esty BC, Megginson WL (2003) Creditor rights, enforcement, and debt ownership
structure: Evidence from the global syndicated loan market. J Financ Quant Anal 38:37-
60
Giannetti M, Laeven L (2012) The Flight Home Effect: Evidence from the Syndicated
Loan Market During Banking Crises. Journal of Financial Economics, vol. 104-1, p. 23-
43.
Greene W (2008) Econometric analysis, sixth ed., Pearson Education, New Jersey
Harjoto M, Mullineaux DJ, Yi H-C (2006) A comparison of syndicated loan pricing at
investment and commercial banks, Financ Manag Winter : 49-70
Ivashina V (2009) Asymmetric information effects on loan spreads. J Financ Econ
92:300–319
Ivashina V, Scharfstein D (2010) Bank lending during the Financial Crisis of 2008. J
Financ Econ 97:319-338
Jiangli W, Unal H, Yom C (2008) Relationship Lending, Accounting Disclosure, and
Credit Availability During the Asian Financial Crisis. Journal of Money, Credit and
Banking 40:25-55.
Maskara PK (2010) Economic value in tranching of syndicated loans. J Bank Finance
34:946–955
Page 22
21
Mattes J A, Steffen S, and Wahrenburg M (2012) Do information rents in loan spreads
persist over the business cycles? J Financ Serv Res. Published online.
Sufi A (2007) Information Asymmetry and Financing Arrangements: Evidence from
Syndicated Loans. J. of Finance 62:629-668.
Page 23
22
Table 1 Loan determinants
FACILITY
(mean, in MUSD)
SPREAD
(mean, in bps)
MATURITY (mean,
in months)
Full sample (4,044 tranches) 195.44 266.20 52.66
Firms that had at least one loan
between 2003 and 2007 (2,092
tranches)
272.19 *** 249.96 ** 47.88 ***
Firms that had no syndicated
loans between 2003 and 2007
(1,952 tranches)
113.73 283.48 57.74
The ** or *** indicate significant at the 5% or 1% level, respectively, for the difference
between the two subsamples
Page 24
23
Table 2 Description of variables
Variable Description
Loan Determinants
Facility Amount of the tranche (in MUSD)
Spread Spread compared to the benchmark rate in basis points
Maturity Maturity of the loan (months)
Banking Relationships
Frequent Book-runner 2003–
2007
Number of times the lead bank in 2008 was book-runner in a
syndicate for the same firm between 2003 and 2007
Syndicate Stability Number of times the syndicate was the same between 2003 and
2007 for the firm
Amount 2003–2007 Total amount borrowed by the firm between 2003 and 2007
Borrower Experience
Deal in 2008 Dummy variable equal to one if the firm had more than one
syndicated loan in 2008 and equal to zero otherwise
Number of Deals 2003–2007 Number of deals (loans) concluded by the firm between 2003 and
2007
Information Asymmetry
Listed Dummy variable equal to one if the firm is listed and equal to zero
otherwise
Same Zone Dummy variable equal to one if the firm and the lead bank come
from the same geographical zone and equal to zero otherwise
Financial Clauses Dummy variable equal to one if the loan includes a financial
covenant clause and equal to zero otherwise
League Tables Dummy variable equal to one if the lead bank is in the Thomson
Financial “league table” and equal to zero otherwise
Borrower Default Risk
Rating Rating of the loan under Basel II standards. Calculations depend
on the standardized approach
Mezzanine Tranche Dummy variable equal to one if the tranche is mezzanine debt and
equal to zero if the tranche is senior debt
Project Financing Dummy variable equal to one if the loan is to finance a project and
equal to zero otherwise
Debt in Chapter 11 Dummy variable equal to one if the loan is “Debtor-in-Possession
Financing,” e.g., arranged by a company under a Chapter 11
bankruptcy process and equal to zero otherwise
LBO Dummy variable equal to one if the loan is to finance a LBO and
equal to zero otherwise
M&A Dummy variable equal to one if the loan is to finance a
merger/acquisition and equal to zero otherwise
Debt for Recovery Dummy variable equal to one if the loan is an “exit facility” to
help Chapter 11 debtors to emerge from bankruptcy and equal to
zero otherwise
Loan Repayment Dummy variable equal to one if the loan is to repay a previous
loan and equal to zero otherwise
Page 25
24
Syndicate Structure
Number of Banks Total number of banks belonging to the syndicate
Top Tier Arranger Number of top-tier arrangers / Total number of banks
Control Variables
Number of Tranches Number of tranches in the loan
Borrower’s Nationality Dummy variable equal to one if the borrower is European, zero if
North American (USA or Canada)
Page 26
25
Table 3 Summary statistics
Full sample (4,044 tranches) Sub-sample (1,733 tranches)
Min Mean or
proportion Max Min
Mean or
proportion Max
Loan Determinants
Facility (MUSD) 0.28 195.44 10,419.70 0.63 271.42 10,419.70
Spread (bps) 5.00 266.65 2,000.00 8.50 250.58 1646
Maturity (months) 1 52.69 354 1 47.90 336
Banking Relationships
Frequent Bookrunner 2003–2007 0 0.40 5
Syndicate Stability 0 0.08 5
Amount 2003–2007(MUSD) 2 1,410 1,142.e5
Borrower Experience
Deal in 2008 0 66.05% 1 0 65.20% 1
Number of Deals 2003–2007 0 1.24 18 1 2.41 18
Information Asymmetry
Listed 0 28.39% 1 0 39.72% 1
Same Zone 0 51.53% 1 0 53.20% 1
Financial Clauses 0 21.19% 1 0 27.24% 1
League Tables 0 10.51% 1 0 11.32% 1
Borrower Default Risk
Rating 20 % 101.37% 150 % 20 % 101.73% 150 %
Mezzanine Tranche 0 1.58% 1 0 1.38% 1
Project Financing 0 3.68% 1 0 1.58% 1
Debt in Chapter 11 0 1.16% 1 0 1.96% 1
LBO 0 18.50% 1 0 13.05% 1
M&A 0 6.27% 1 0 8.32% 1
Debt for Recovery 0 0.54% 1 0 0.86% 1
Loan Repayment 0 0.015% 1 0 0.019% 1
Syndicate Structure
Number of Banks 1 5.80 47 1 6.73 47
Top Tier Arranger 2.93% 44.23% 100% 0% 41.23% 1.25%
Control Variables
Number of Tranches 1 2.22 11 1 2.18 11
Borrower’s Nationality 0 22.28% 1 0 19.74% 1
Page 27
26
Table 4 Simultaneous regressions – Model 1 (Estimated with the whole sample)
Variable Spread Facility Maturity
Constant -75.352
(0.55)
84.351
(0.31)
-7.639
(0.58)
Loan Determinants
Facility -1.147*
(0.059) _
0.127**
(0.02)
Spread _ -0.672 *
(0.08)
0.100***
(0.004)
Maturity 8.819 ***
(0.003)
6.508**
(0.04) _
Borrower Experience
Deal in 2008 -86.136
(0.24)
-83.128 ***
(0.005)
10.381
(0.11)
Number of Deals 2003–2007 43.809 *
(0.052)
37.492 ***
(1.85e-09)
-4.932 **
(0.01)
Information Asymmetry
Listed 83.594
(0.18)
77.529 ***
(0.002)
-9.480
(0.13)
Financial Clauses -129.514 **
(0.02)
-103.602 ***
(0.001)
14.209 ***
(0.005)
League Tables 123.524 **
(0.01)
92.304**
(0.04)
-13.492
(0.003)
Borrower Default Risk
Rating -3.491
(0.14)
-3.193 ***
(4.09e-06)
0.406*
(0.05)
Mezzanine Tranche -115.334
(0.26)
-99.140
(0.16)
12.525
(0.26)
Project Financing -790.197 ***
(0.002)
-587.149**
(0.02)
88.844***
(1.68e-34)
Debt in Chapter 11 576.859 ***
(6.15e-05)
416.664**
(0.03)
-61.973***
(3.45e-05)
LBO -34.295
(0.59)
-34.255
(0.47)
5.514
(0.35)
M&A 545.293 *
(0.05)
471.368 ***
(5.26e-33)
-60.402**
(0.02)
Debt for Recovery 369.949 *
(0.06)
303.001**
(0.014)
-39.673 *
(0.07)
Loan Repayment -83.867
(0.49)
-89.598
(0.25)
10.336
(0.41)
Syndicate Structure
Number of Banks 34.331*
(0.07)
30.340 ***
(8.30e-43)
-3.834 **
(0.03)
Top Tier Arranger 343.336 **
(0.02)
283.825 ***
(1.22e-08)
-37.420 **
(0.01)
Control Variables
Number of Tranches 4.728
(0.72)
5.265
(0.62)
-0.330
(0.83)
Page 28
27
Borrower’s Nationality -301.062 ***
(3.26e-06)
-216.447 **
(0.03)
32.369***
(4.89e-07)
Sample size 4,044 4,044 4,044
The estimated coefficients are shown in the table. Numbers in brackets are the p-value. The *,
**, and *** indicate significance at the 10%, 5%, and 1% levels respectively.
Page 29
28
Table 5 Simultaneous regressions – Model 2 (Estimated with the sample of firms that had
already borrowed by syndication before 2008)
Variable Spread Facility Maturity
Constant -157.224***
(0.0031)
-371.919
(0.13)
33.410 ***
(2.42e-16)
Loan Determinants
Facility -0.087**
(0.037)
_
0.008
(0.21)
Spread _ -2.669***
(0.028)
0.09***
(0.002)
Maturity 4.347 ***
(0.0023)
11.826*
(0.007) _
Banking Relationships
Frequent Bookrunner 2003–2007 -14.179 ***
(0.001)
-38.603*
(0.06)
1.273*
(0.09)
Syndicate Stability -56.768 ***
(2.87e-05)
-211.076***
(0.001)
7.397***
(0.0006)
Amount 2003–2007 0.005 **
(0.031)
0.051***
(2.68e-28)
-6.66e-04*
(0.05)
Borrower Experience
Deal in 2008 55.6359 ***
(2.79e-05)
118.253 *
(0.095)
-1.911
(0.49)
Number of Deals 2003–2007 7.985**
(0.0438)
36.581 *
(0.021)
-1.789***
(4.34e-05)
Information asymmetry
Same Zone 4.191
(0.709)
8.71
(0.84)
-0.408
(0.79)
League Tables 9.016**
(0.64)
41.515
(0.57)
-3.934**
(0.13)
Borrower Default Risk
Rating 1.338 ***
(1.07 e-05)
1.541
(0.38)
-0.055
(0.398)
LBO 30.491 ***
(0.510)
86.544
(0.62)
15.417***
(0.004)
Syndicate Structure
Number of Banks -0.088
(0.957)
24.097 ***
(8.24e-108)
0.004
(0.984)
Top Tier Arranger 159.546 ***
(4.90e-08)
737.283***
(2.59e-07)
-16.615***
(0.005)
Control Variables
Borrower’s Nationality -169.561 ***
(8.46e-10)
-523.442 ***
(0.003)
24.210***
(3.67e-09)
Sample size 1,733 1,733 1,733
The estimated coefficients are shown in the table. Numbers in brackets are the p-value. The *,
**, and *** indicate significance at the 10%, 5%, and 1% levels respectively.