46


STX
FACULTY WORKINPAPER NO. 1023
G
Bankruptcy, Working Capital and
Funds Flow Components
James A Gentry
Paul NewboldDavid T. Whitford
JHE LIBRARY OK BHH
UN 6 1984
UNIVERSITY OF ILLINOIS
UftBANA-CHAMPAJGH
ege oi Commerce and Business Admin isfr&tlcin
Bureau a- ULsdnomic ar,d Business Research
University of Illinois. UrbanaChampai


BEBRFACULTY WORKING PAPER NO. 1023
College of Commerce and Business Administration
University of Illinois at Urbana-Champaign
March 1984
James A. Gentry, ProfessorDepartment of Finance
Paul Newbold, ProfessorDepartment of Economics
David T. Whitford, Assistant ProfessorDepartment of Finance


BANKRUPTCY, WORKING CAPITAL AND FUNDS FLOW COMPONENTS
ABSTRACT
In recent years the theoretical linkages that integrate short-run
financial planning components into long-run valuation models have been
developed. Simultaneously bankruptcy studies found a few aggregate
working capital ratios to be key measures in predicting financial
failure. However, these empirical studies on predicting financial
failure did not have an underlying theory for selecting specific
ratios, and frequently a brute empiricism approach was used to deter-
mine the significant explanatory ratios. The result was the selection
of ratios that tended to be sample dependent. To overcome this criti-
cism we turned to a cash based funds flow model that measures the
interaction of all cash flows within the firm. Inspecting the time
series trends of disaggregated working capital funds flow components of
failed companies suggested they might improve the -ability to classify
financially failing enterprises. We substituted five working capital
components for the one aggregate net working capital component and
tested the classification ability of each set. The empirical analysis
utilized MDA and probit programs. The results found the funds flow
components with five working capital measures provided superior infor-
mation for differentiating between failed and nonfailed firms. Addi-
tionally, the probit model found dividends, capital investment and
receivables funds flow components were significant in distinguishing
between failed and nonfailed firms. In summary, cash based funds flow
components with decomposed working capital components are a viable
alternative for classifying failed and nonfailed firms.

<
4

BANKRUPTCY, WORKING CAPITAL AND FUNDS FLOW COMPONENTS
The long-run financial success or failure of a firm is often
closely related to the success or failure of its short-run financial
performance. Financial theory focuses on long-run financial planning
with major emphasis on the decision areas of investments, capital
structure and dividend policy, e.g., Brealey and Myers [1981], Brigham
[1982], Van Home [1980] and Weston and Brigham [1981]. With long-run
wealth maximization as the normative criterion, valuation models
provide the unifying theme for the development of financial theories
related to investment, financing and dividend decisions.
In the early stages of the capital asset pricing model (CAPM) the
assumption of perfect market conditions resulted in the exclusion of
short-run policy and planning decisions from the CAPM. Under these
assumed conditions with no transfer costs, the firm has no incentive
to hold short-run financial assets or liabilities, Cohn and Pringle
[1980]. That is the certainty-equivalent returns or costs in the CAPM
are assumed to equal the risk free rate (&„)• The perfect market
assumption is incapable of dealing with the investment in marketable
securities or receivables, Lewellen, McConnell and Scott [1980], or the
use of short-run borrowing. Additionally the assumption of a static,
one period, long-run based CAPM is unresponsive to the dynamic, short-
run adjustments that are experienced in the management of a firm's
working capital position.
The need for integrating short-run investment and financing com-
ponents into either the CAPM or the present value valuation models has

-2-
been recognized by many authors. A variety of techniques have been sug-
gested. For example. Warren and Shelton [ L9 7 1 ] and Francis and Rowell
[1976] used a simultaneous equation model to integrate working capital
components into the total valuation process of the firm. Cohn and
Pringle [1980] indicated working capital policies could be employed to
keep a firm's shares in a given risk class. They observed the fluid
nature of working capital components act as an adjustment mechanism to
offset swings in the real asset value of the firm. Knight [1972] and
Krouse [1974] recognized the complexity of the short-run financial
management and suggested the need to structure hierarchical goals that
integrate short, intermediate and long-run objectives in the modeling
of the financial decision making process. Smith [1980] advocated the
need to integrate working capital policies into the capital investment
process of a firm. Gentry [1980] designed a simulation model that
integrates working capital components into the capital investment
decision process. Recently, Sartoris and Hill [1983] extended the
firm valuation model by explicitly including credit policy decisions
in the maximization of a firm's net cash flows. in summary, the theo-
retical literature recognizes that short-run investment and financing
decisions make a significant contribution to the value of a firm and
should be explicitly included in valuation models.
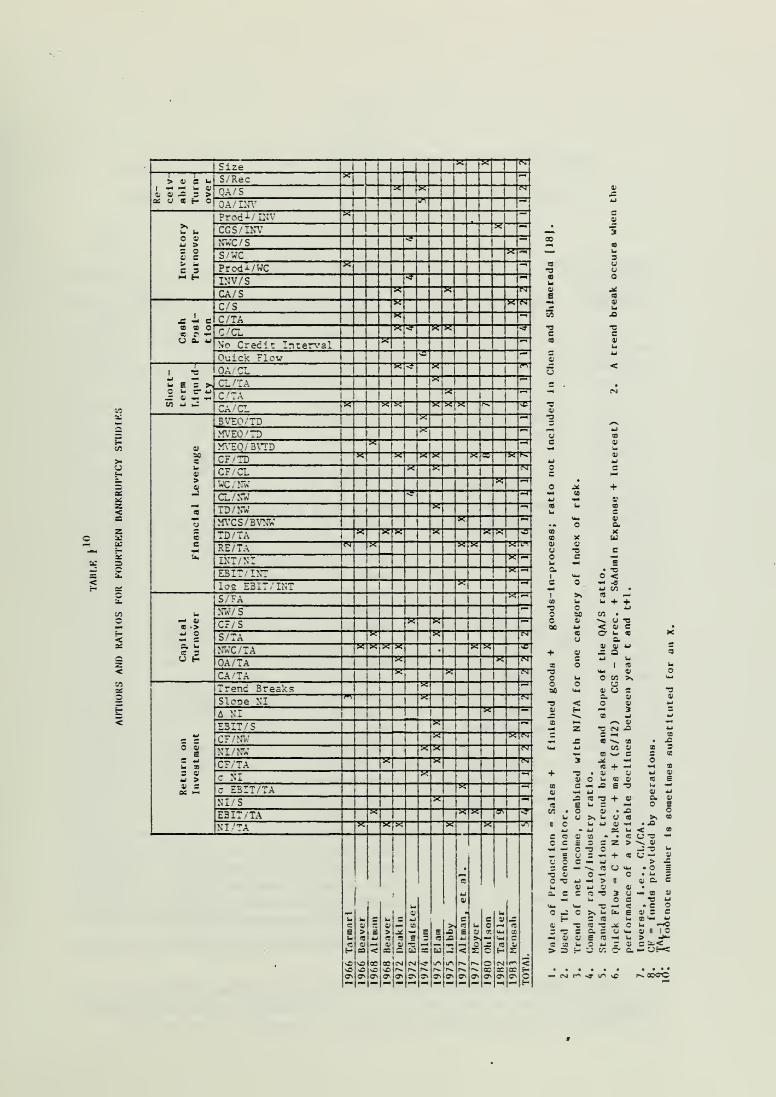
Empirical studies that use financial ratios to predict bankruptcy
highlight the importance of short-run financial management performance
in classifying failed and nonfailed firms. A summary of the signifi-
cant ratios in fourteen failure classification studies is found in
Table 1. Under the general heading of short-term liquidity, the

-3-
curreat ratio was found to be significant in classifying failed/nonfailed
companies in studies by Tamari [1966], Beaver [1968], Deakin [1972],
Elara [1975], Libby [1975], Altman, et al . [1977] and Ohlson [1980].
The quick ratio, another measure of short-term liquidity, was signifi-
cant in classifying failed firms in studies by Deakin [1972], Edmister
[1972] and Elam [1975]. The ratio of cash/current liabilities, as a
measure of a firm's cash position, was found to be a significant dis-
crinitiating variable by Deakin [1972], Edmister [1972], Elam [1975] and
Libby [1975]. Table 1 also shows inventory turnover and receivables
turnover were significant classification measures in a few studies.
It has been recognized by Foster [1973, p. 477] and others that
previous bankruptcy studies have used a brute empiricism approach to
choose 20 to 40 variables and, then rely on a stepwise discriminant
method to select the variables for the final discriminant analysis.
Examples of these studies are Altman [1966; 1971; 1983], Altman and
Loris [1976], Altman and McGough [1974], Altman, Halderaan and
Narayanan [1977], Beaver [1966; 1968], Blum [1974], Castagna and
Matolcsy [1981], Deakin [1972], Diamond [1976], Edmister [1972], Elam
[1975], Lev [1971], Libby [1975], Moyer [1977], Sinkey [1975], Taffler
[1982], and Taffler and Tisshaw [1977]. The significant ratios
selected in these studies were dependent on the data sample used in
the empirical analysis. Because there is not an underlying theoreti-
cal rationale to justify the selection of specific ratios, the empiri-
cal findings cannot be generalized to indicate the most likely
predictors of financial distress. To overcome this shortcoming we
turned to a cash based funds flow model developed In 1972 by Helfert
[1982! and suggested in the FASS Exposure Draft [1981],
Financial theorists agree that net cash flows are the basis for
determining the value of a firm, e.g., Brealey and Myers [1981],
Brigham [1982], Van Home [1983], Weston and Brigham [1981]. The
need to use cash flows from operations in predicting failure has been
suggested by Largay and Stickney [1980], Mensah [1983], Ohlson [1980],
5cott [1981], and Zavgren [1982]. Using the working capital method for
calculating a sources and uses statement, Casey and 3artzak [1983]
found cash flow from operations did not improve the classification of
failed companies. Unlike financial ratios which serve as proxies for
measuring cash flows, cash based funds flow components unambiguously
measure cash inflows and outflows. This study develops a common set of
cash based funds flow components.
Another criticism of earlier bankruptcy studies focused on the
shortcomings of multivariate discriminant analysis (MDA). The statis-
tical problems of MDA were identified by McFadden [1973] , Eisenbeis-
[1977], Joy and Tollefson [1975], Santomero and Vinso [1979], and
Ohlson [1980], An alternative to MDA is the use of a conditional
probability model. The use of conditional probit analysis avoids the
problems related to the use of MDA. With a conditional probability
model no assumptions have to be made regarding prior probabilities of
bankruptcy and/or the distribution of the predictor variables. The
empirical analysis in this study utiltizes MDA and probit programs.
The objectives of this study are to offer cash based funds flow
components as an alternative to financial ratios for classifying the
financial performance of companies; to test empirically the ability of

-5-
funds flow components to distinguish between failed and nonfailed com-
panies with special emphasis on working capital components; to analyze
the empirical results and make recommendations for future study.
THE MODEL
Rationale
Net cash flow is composed of cash inflows and outflows. In an
accounting context, cash inflows equal cash outflows. The level and
speed of each cash inflow and outflow component reflect the operating,
investment and financing decisions of management. For a given state
of economic conditions, the mix of the components generating cash in-
flows or outflows is a signal of the resource allocation decisions of
management. Measuring the change in the level and speed of each cash
inflow and outflow component provides a theoretical rationale to dif-
ferentiate between financially successful or financially failing firms.
The financial success or failure of a firm is related to the level
and speed that net cash flow components move through a firm. The higher
the level and/ or speed that net cash flow components move through the
firm, the smaller the probability of failure. For example, the level
of net cash flow from operations rises when either the quantity or
price of products sold increase or when the cost of operations for a
given level of sales are decreased. There is an increase in the speed
that net operating cash flows move through a firm when sales increase
more rapidly than investment, i.e., assets turnover is increased. The
result reflects increased efficiency in the management of assets.
The development of the preceding framework makes it possible to
construct a set of propositions that relate the trend of the cash
inflow and outflow components to the probability of failure.

-6-
The larger the proportion of aet cash inflow coining from opera-tions, the smaller the probability of failure. [The larger thedifference between cash inflows and outflows from operations, thehigher the return on sales and the greater the financial strengthof a firm.]
The larger the proportion of net cash outflow going to capitalinvestment, the smaller the probability of failure. [The size of
the net cash outflow going to capital investment directly reflectsthe competitive position of the firm, the size of its market shareand the expected growth in demand for its products.]
The smaller the proportion of net cash inflow coming from outsideborrowing, the smaller the probability of failure. [The largerthe net cash flow from operations, the lower the need to borrow in
order to meet the cash outflows for investment. \s net operatingflows become smaller, the need to borrow may increase to meet cashflow shortfalls. The higher the flow of funds from borrowing, thegreater the financial risk and the higher the probability of
failure.
]
The smaller the proportion of the net cash outflow going to
interest and leasing expenditures, the smaller the probability of
failure. [The smaller the fixed coverage expenditures in relationto operating earnings, the lower the financial risk and the
chances of failure.]
The smaller the proportion of net cash outflow going to net
working capital, the lower the probability of failure. [Net
working capital is considered to be under control when it is
increasing at a lower rate than the rate of increase in sales.
Net working capital (NWC) equals A accounts receivable plus the A
in inventories plus the A in other net working capital items minusthe A in accounts payable. Working capital components are imper-
fectly related to sales, but the relative increase in the turnoverof receivables or inventories or the relative decrease in the
turnover of accounts payable are considered an increase in inter-
nal operating efficiency.
]
The larger the relative proportion of net cash outflow going to
dividends, the smaller the probability of failure. [Companiespaying a higher proportion of their cash outflows in dividends are
signalling not only their financial ability to pay the dividend,
but they are satisfying the preferences of their stockholders.]
The larger the proportion of inflows that result from an increase
in other liabilities (e.g., accrued income taxes) or a decrease in
other assets, the lower the probability of failure. [Companieswith a trend of increased deferred income taxes and/or decreasingother assets are experiencing investment growth, while companieswith declining income taxes and/or increased other assets are
experiencing a decline in investment growth.]
-7-
Coraponents
The model we have used to identify funds flow measures was devel-
oped in 1972 by Erich Helfert [1982]. We selected Helfert's cash
based funds flow model to classify bankrupt firms and to measure the
contribution of working capital components in the evaluation of finan-
cial performance. After extensive use of Helfert's funds flow model,
we redesigned it to have eight major components. The eight net funds
flow components are operations (NOFF) , working capital (NWCFF) , finan-
cial (NFFF), fixed coverage expenses (FCE) , capital expenditures
(NIFF), dividends (DIV), other asset and liability flows (NOA&LF) and
the change in cash and marketable securities (CC).
The funds flow components contained in the revised model are
presented in equation (1)
.
NOFF + NWCFF + NFFF + FCEF + NIFF + DIV + NOA&LF - CC =0 (1)t t t t tt ttBecause the interrelationship among the components is complex,
equation (1A) is presented in a sources and uses format of a most
likely case. Excepting changes in cash and marketable securities, a
source (S) would be a positive number and a use (U) would be negative:
NOFF + NWCFF + NFFF + FCEF + NIFF + DIV + NOA&LF - CC =0 (1A). t t . t t t t C , t"T ~ + — — — ~ T
(3) (U) (S) (U) (U) (U) (U) (U)
Because the relative funds flow component is our key measure used to
classify failure, a brief discussion of this measure follows.
The algebraic sum of the components in (1A) equals zero, there-
fore, the contribution of each component in relation to the total
-9-
that were deleted from the Compustat Industrial Files due to failure
related circumstances during the twelve year period.
We searched leading information sources, F&S Index of Corporate
Change [1970-1979], Fisher [1971; 1975], Financial Stock Guide Service
[1982], Wall Street Journal Index [1981], to determine why a company
was deleted from Compustat. There were 92 companies classified as
failed, i.e., 68 involved in bankruptcy and 24 were liquidated. These
92 companies are the failed companies used in this study.
During the third phase of the screening process, the recorded date
of failure is compared to Compustat '
s
date of the last reported annual
report of the failed company. Although Compustat files do not report
the precise date the last annual report was released, they explicitly
indicate if bankruptcy was declared before or after Compustat received
the annual report. For all of the failed companies selected to be
used in the analysis, the Compustat files indicated bankruptcy was
declared after they received and recorded the last annual report.
Balance sheet and income statement information for the failed com-
panies are used to determine the funds flow components. Leases were
not capitalized as recommended by Altraan, et al . [1977], because these
data were not available for all of the selected companies during the
three years studied. The relative funds flow components were computed
for one, two and three years immediately prior to the date of failure
for each of the 92 failed companies. Complete financial statement
information for one, two and three years before the failure date was
available for only 33 of the 92 failed companies. Among the 33 com-
panies, 21 were industrial and 12 were a mixture of other industries.
-10-
Matching
Previous bankruptcy studies have matched the sample failed com-
panies with a sample of nonfailed companies that were in the same
respective industries and of approximately the same asset size.
Generally, the number of matching companies was arbitrarily deter-
mined by the authors. Theoretically the best criterion for selecting
matching companies would be to match each failed company with the pro-
portionate number of existing nonfailed companies during the period.
For example, the average business failure rate between 1970 and 1981
was 38 per 100,000 firms (Altman (1982, p. 32)) which would require
2,631 matching companies for each failed company or 86,842 matching
firms for our sample. Compustat Industrial Files have approximately
2,000 companies which makes proportionate matching impossible. In
contrast, matching a failed company with one nonfailed company prede-
termines a marginal failure rate of 50 percent which is less than
optimal, but it is not an unrealistic test. Although the results may
be slightly biased, we choose to utilize a one-to-one matching sample.
This study matches each of the 33 failed companies with a non-
failed company in the same industry, i.e., selecting matching com-
panies that were similar in asset size and sales for the fiscal year
three years before bankruptcy. The matching nonfailed company was
required to have the necessary financial information for the respec-
tive three years of the failed company. A list of the 33 failed com-
panies and the matching set of 33 nonfailed companies is presented in
Tables 2 and 3, respectively.
-11-
ANALYSIS
One objective of the analysis is to determine if relative funds
flow components can discriminate between failed and nonf ailed compa-
nies. A second objective is to substitute for net working capital
(NWCFF/TNF) its five component parts—receivables (AR/TNF), inventories
(INV/TNF), other current assets (OCA/TNF), payables (AP/TNF) and other
current liabilities (OCL/TNF)—and determine if the discriminating
ability of the model is improved. MDA and probit techniques are used
to examine the predictive ability of the funds flow components.
Although the components were calculated for one, two and three years
before failure, the best statistical results came from the data pre-
senting (1) one year before failure and (2) the mean of each variable
for three years before failure. The analysis utilizes these two sets
of components and reports the results from the MDA and the probit
models.
MDA Results
The mean of each funds flow component is presented in Table 4. A
brief review of these data shews there is generally a marked differ-
ence between the means of the failed and nonfailed companies. Also
the standard deviations are substantially larger for the components of
the failed companies. Additionally, a component whose mean was an
inflow for the failed companies was frequently an outflow for a non-
failed company, and vice versa.
Figure 1 is a graphic presentation of the mean of each relative
funds flow component for the 33 failed and 33 nonfailed companies for
the three years preceding bankruptcy. The graphics show the three
-12-
year trend of the relative funds flow components cor the failed versus
the nonf ailed companies. Vivid changes in the trend of the flow com-
ponents of the failed companies are observed in operations, investment,
net working capital and fixed coverage expenditures. Figure 2 high-
lights the trend of the relative working capital components, short-
terra borrowing component, and change in cash and marketable securities
components. The trends of these components that changed most signifi-
cantly for the f ai Led companies are accounts receivable, accounts
payable, inventories, and short term borrowing. Additionally, the
graphics highlight the differences in the level of the mean funds
flow components for failed and nonfailed firms for the three periods.
In Figure 1, these differences are most apparent in the operations,
investment, working capital, fixed coverage expenditures and dividend
components; in Figure 2, they are found in receivables, payables,
inventories and short-term borrowing.
The ability of the funds flow components with either an aggregate
or five disaggregated working capital components to discriminate be-
tween failed and nonfailed companies is found in Table 5. The tests
using data for one year before failure with one working capital com-
ponent indicate that 82 percent (27/33) of the failed companies were
classified correctly and 88 percent (29/33) of the nonfailed companies
were identified correctly. When the working capital components are
included separately, the classification of the failed companies is
slightly lower at 76 percent, but modestly higher for the nonfailed
companies, which are all classified correctly. In MDA the percent
2correctly identified is similar to the R measure in regression
-13-
analysis. For the tests using the three year average data, Table 6
shows that with an aggregate working capital component, 79 percent
(26/33) of the failed companies and 88 percent (29/33) of the nonfailed
companies were identified correctly. THe classification rates are
slightly higher when the five working capital components are used.
Probit Results
The probit model discussed in Judge, et al. , [1981], or McKelrey
and Zavoina [1975] is a conditional probability model that utilizes
the coefficients of the independent variables to predict the probabil-
ity of occurrence of a dichotomous dependent variable. As a nonlinear
model, probit provides unique insight vis-a-vis the linearly based MDA
model.
The classification results of the probit analysis are presented in
Tables 5 and 6. in Table 5, using funds flow components with a single
working capital measure for one year before failure, the probit tech-
nique correctly identified 79 percent (26/33) of the failed companies
and 85 percent (28/33) of the nonfailed companies. When the working
capital components are disaggregated, the classification results are
slightly higher, as shown in Table 5. Using the mean of each funds
flow component for a three year period prior to failure, probit
correctly classified 82 percent (27/33) of the failed companies and
73 percent (24/33) of the nonfailed companies. With the five working
capital components Table 6 shows the classification results are
modestly higher for the nonfailed companies and slightly lower for the
failed firms.
In summary, when comparing the five working capital measures to
the single aggregated measure with data for one year before failure,

-14-
the total classification success ratio is modestly higher with both the
MDA and probit model. With the use of mean results for three years
before failure, both MDA and probit tests show the disaggregated
working capital components give slightly higher total classification
performance. On balance, the five working capital components generate
classification results that are slightly higher than when using a
single working capital component.
Probit Coefficients
In addition to the classification results, the probit model iden-
tifies the variables that are significant in classifying failed and
nonfailed firms. Probit calculates the weight each coefficient con-
tributes to the overall prediction of failure or nonfailure. The
probit coefficients are similar to the coefficients that compose the
Z score developed by Altman [1968].
The probit coefficients and the asymptotic T ratios are presented
in Tables 7 and 8. For the probit test in Table 7 that use funds flow
components one year before failure with a single working capital
measure, only the dividend component (DIV/TNF) is significant at the
.05 level. When the five working capital components were substituted
for the aggregated working capital measure, three of the thirteen com-
ponents were significant at the 5 percent level. The significant com-
ponents were investment (NIFF/TNF), dividend (DIV/TNF) and receivables
(AR/TNF). The substitution of the working capital components provided
insightful information concerning the classification of failed and
nonfailed companies that was not previously available in studies by
Gentry, Newbold and Whitford [1983].
-15-
The test results that used a three year mean for each component
are reported in Table 8. When the single working capital component
(NWCFF/TNF) was included, only the dividend component (DIV/TNF) was
significant at the 5 percent level in classifying the companies. When
the five working capital components were substituted for NWCFF/TNF,
the flow scale measure (TNF/TA) and dividend (DIV/TNF) were significant
at the 5 percent level. None of the working capital components were
significant
.
The results show the smaller the relative dividend component, the
higher the probability of failure, which is supportive of the pre-
viously developed proposition 6. A typical failing firm tends to lose
its market share and experience a shortfall of funds from operations,
thereby causing a reduction in its dividend payments. The decline in
relative dividend payments was not a statistically important variable
in previous bankruptcy studies that cited ratios. However, this find-
ing may be related to the time period of the study, the use of funds
flow components vis-a-vis financial ratios, the probit model versus the
MDA model, a combination of these factors or more complex reasons.
The study shows the larger the net investment component, the lower
the probability of failure. This finding closely resembles proposi-
tion 2 which indicates the larger the size of the net outflow going to
capital investment, the higher the anticipated growth in demand for a
firm's products.
Finally, the study discovered a receivables effect, i.e., the
higher the inflow of funds from accounts receivable, the greater the
probability of failure. That is, using information one year before
-16-
failure shows receivables were a source of funds for firms that everi-
tualLy faiLed. In contrast, the matching nonfaiied companies extended
more credit than they collected and thereby expanded receivables.
However, when averaging the AR/TNF component for three years prior to
failure, the receivables effect did not exist. Figure 2 presents a
graphic illustration of the behavior of the mean AR/TNF component for
three years before failure.
Comparison of Probability Distributions
A comparison of the probabilities of failure determined by each
technique for the two sets of statistical data provide unique insight
concerning these models. Tables 9 and 10 present the distribution of
the probabilities of failure and nonfailure in rows of ten equal size
segments. The information in Table 9 is based on models using the one
year before failure data and the results are subdivided into one and
five working capital components. The distributions of the failed
firms are presented in one column under each of classification tech-
nique. The distribution of the nonfaiied firms are shown in the
adjoining column under each classification technique. Table 10 con-
tains similar probability information based on data that are means
of the components for three years before failure.
A few key observations emerge from Tables 9 and 10. The classifi-
cation probabilities of the MDA results are clustered at the extremes
for the correctly identified failed and nonfaiied companies, e.g., in
Exhibit 9 under the one working capital component heading, 19 of the
33 firms classified as failed firms were in the .90 to 1.0 probability
-17-
range and 22 of 33 nonfilled firms have a probability of failure be-
tween zero and .1. Only a few firms fail in the segments near the .5
probability level. Tables 9 and 10 show the probabilities of
classifying failure with the probit model are more widely disbursed
across the probability ranges.
The MDA probability results give a strong positive identification
to the correctly identified companies, while the probit technique pro-
vides a more diffused identification of the correctly classified com-
panies. For the 'DA technique there are only a few companies close to
the .5 probability of failure level, which indicates only a small
chance of the misclassif ication being in the grey zone. The grey zone
contains more companies when the probit model is used.
Likelihood Tests
We completed four separate probit analyses in order to measure the
contribution of the funds flow components with specific attention to
working capital components in classifying failed and nonfailed com-
panies. From the probit analysis, the change in the log of the likeli-
hood function statistic serves as the basis for measuring the signifi-
cance of the contribution of working capital funds flow components.
The first test uses only the intercept to classify the 66 sample com-
panies. The objective of initially using only the intercept to
classify the sample companies is to establish a standard for comparing
the change in the likelihood statistic when fund flow 'components with a
single working capital component are added, and when the five working
capital fund flow components are substituted for the one working capi-
tal measure. The log of the likelihood function statistic for Test 1,

-18-
intercept only with data from one year before failure, is -45.748 and
is reported in Table 11.
The second test adds eight funds flow components to the probit
analysis. In Test 2, we include the NWCFF/TNF component. When the
eight ratios for Test 2 are added, the likelihood statistic drops to
-28.737 as reported in Table 11. A Chi Square test of the change in
the likelihood statistic from -45.748 to -28.737 is significant at the
.01 level. This test shows funds flow components make a significant
contribution in classifying the 66 companies.
In Test 3, the five working capital components are substituted for
NWCFF/TNF. The likelihood statistic for Test 3 was -23.366 and the
change in the likelihood statistic from Test 1 to Test 3, -45.748 to
-23.366, was significant at the .01 level. A Chi Square test of the
change in the likelihood statistic from -28.737 to -23.366 was signif-
icant at the .05 level. This test shows the substitution of the five
working capital components make a significant contribution in classi-
fying the 66 sample companies, when compared to using only the eight
components with an aggregated working capital component.
The log of the likelihood test using the mean of three years of
data are shown in the lower part of Table 11. The results from this
test are identical to the preceding likelihood tests with one excep-
tion. The substitution of the five working capital components did not
statistically improve the classification results vis-a-vis using the
one aggregate net working capital component.
CONCLUSIONS
Cash based funds flow components are a set of uniform measures that
provide common information concerning the cash flow performance of a

-19-
firra. These unambiguous measures of cash flow provide significant
information in classifying failed and nonfailed companies. This cash
based model does not use stepwise probit regression to search through a
cross section of financial measures to find the best combination of
components, rather it utilizes a standard set of theoretically
justified components to discriminate companies on the basis of cash
flow performance. We discovered the dividend component (DIV/TNF) , the
investment component (NIFF/TNF) and the receivables component (AR/TNF)
provided significant information for classification purposes. The
receivables effect was present in the data one year before failure, but
not in the data averaged over the three years before failure. For
failed companies, receivables were a large inflow of funds one year
before failure. The essence of this discovery is that a specific
short-run financial planning component is closely related to an explan-
ation of financial failure.
Previous studies have explained financial failure with long-run
financial planning ratios and/or highly aggregated working capital
ratios. In this study the aggregated working capital component
(NWCFF/TNF) was not significant in classifying companies. However, the
decomposition of the working capital component into its five subcom-
ponents resulted in superior information for classifying failed and
nonfailed companies.
Cash flow from operations (CFO) is a short-run financial perfor-
mance measure that is often considered a prime candidate for predicting
financial failure. In our study none of the components of CFO—NOFF/TNF
+ NWCFF/TNF - FCE/TNF— is significant. Casey and Bartczak [1983] have
also found similar results.

-20-
Future studies should test the model with a hold-out sample. A
hold-out sample was not possible in this study because the total sample
of 33 companies was too small. Also future studies should use the five
component working capital funds flow model to classify financial per-
formance on the basis of size, industry, and competitive position
within the industry.

-21-
REFERENCES
Edward I. Altman, "Financial Ratios, Discriminant Analysis, and thePrediction of Corporate Bankruptcy," Journal of Finance , Vol. 23
(September 1968), pp. 589-609."
, "Corporate Bankruptcy Potential, Stockholder Returns, andShare Evaluation," Journal of Finance , Vol. 24 (December 1969),
pp. 887-900.
, Corporate Bankruptcy in America , Lexington, Mass.: HeathLexington, 1971.
, "Predicting Railroad Bankruptcies in America," Bell Journalof Economics and Management Science , Vol. 4 (Spring 1973),
pp. 184-217.
, Corporate Financial Distress , New York: John Wiley & Sons,1983.
, R. Haldeman and P. Narayanan, "Zeta Analysis: A New Modelto Identify Bankruptcy Risk of Corporations," Journal of Bankingand Finance , Vol. 1 (June 1977), pp. 29-54.
and Bettina Loris, "A Financial Early Warning System for
Over-the-Counter Broker Dealers," Journal of Finance , Vol. 31
(September 1976), pp. 1201-1217.
and McGough, "Evaluations of A Company As A Going Concern,"Journal of Accountancy , Vol. 138 (December 1974).
Takeshi Amemiya, "Qualitative Response Models: A Survey," Journal of
Economic Literature , Vol. 19 (December 1981), pp. 1483-1536.
William H. Beaver, "Financial Ratios as Predictors of Failure,"Empirical Research in Accounting: Selected Studies 1967
,
supplement to Vol. 5 Journal of Accounting Research (January
1966), pp. 71-110.
, "Market Prices, Financial Ratios and the Prediction of
Failure," Journal of Accounting Research , Vol. 6 (Autumn 1968),
pp. 179-192.
Marc Blum, "Failing Company Discriminant Analysis," Journal of
Accounting Research , Vol. 12 (Spring 1974), pp. 1-24.
Richard Brealey and Stewart Myers, Principles of Corporate Finance ,
New York: McGraw-Hill Book Company, 1981.
Eugene F. Brighara, Financial Management Theory and Practice , Third
Edition, Hinsdale, IL : Dryden Press, 1982.

-22-
Cornelius Casey and Norman Bartczak, "Operating Cash Flow Data and
Financial Distress: Some Empirical Evidence," working paper, 1983.
A. D. Castagna and Z. P. Matolcsy, "The Market Characteristics of
Failed Companies: Extensions and Further Evidence," Journal of
Business, Finance and Accounting , Vol. 8 (Winter 1981), pp. 467-483.
Richard A. Cohn and John J. Pringle, "Steps Toward an Integration of
Corporate Financial Theory," in Keith V. Smith, ed., Readings on
the Management of Working Capital , St. Paul, West Publishing Company,
1980, pp. 35-42.
F. B. Deakin, "A Discriminant Analysis of Predictors of Failure,"Journal of Accounting Research , Vol. 10 (Spring 1972), pp. 167-179.
Harold A. Diamond, Jr., "Pattern Recognition and the Detection of
Corporate Failure," (unpublished Ph.D. dissertation, New YorkUniversity, 1976).
Robert 0. Edmister, "An Empirical Test of Financial Ratio Analysis for
Small Business Failure," Journal of Financial and QuantitativeAnalysis , Vol. 7 (March 1972), pp. 1477-1493.
Robert A. Eisenbeis, "Pitfalls in the Application of DiscriminantAnalysis in Business Finance and Economics," Journal of Finance
,
Vol. 32 (June 1977), pp. 875-900.
Rick Elam, "The Effect of Lease Data on the Predictive Ability of
Financial Ratios," The Accounting Review , Vol. 50 (January 1975),
pp. 25-43.
F&S Index of Corporate Change , Editors, Diana Cutter and MichaelPaulson, Cleveland: Predicasts Volumes, 1970-1979.
Robert D. Fisher, Manual of Valuable and Worthless Securities , NewYork: Robert D. Fisher, Vol. 13, 1971, Vol. 14, 1975.
Financial Stock Guide Service , Jersey City: Financial Information,Inc., 1982.
George Foster, Financial Statement Analysis , Englewood Cliffs, NewJersey: Prentice-Hall, Inc., 1978.
Jack C. Francis and Dexter R. Rowell, "A Simultaneous Equation Modelof the Firm for Financial Analysis and Planning," FinancialManagement , Vol. 7 (Spring 1978), pp. 29-44.
James A. Gentry, "Integrating Working Capital and Capital InvestmentProcesses," in Keith V. Smith, ed., Readings on the Management of
Working Capital , St. Paul, West Publishing Company, 1980, pp.585-608.

James A. Gentry, Paul Mewbold and David T. Whitford, "ClassifyingBankrupt firms with Funds Flow Components," Working Paper, Collegeof Commerce and Rusiness Administration, University of Illinois,October 1983.
, "Classifying Bankruptcy of Small Firms with Funds FlowComponents and Financial Ratios," working paper, College ofCommerce and Business Administration, University of Illinois,October 1983.
, "Comparing Funds Flow Components to Financial Ratios as
Predictors of Bankruptcy," Working Paper, College of Commerce andBusiness Administration, University of Illinois, November 1983.
Erich A. Helfert, Techniques in Financial Analysis , Fifth Edition,Homewood : Richard D. Irwin, 1982, Chapter 1.
0. Maurice Joy and Joseph 0. Tollefson, "On the Financial Applicationsof Discriminant Analysis," Journal of Financial and QuantitativeAnalysis , Vol. 10 (December 1975), pp. 723-739.
George G. Judge, et al . , Econometrics : Theory and Practice , New York:
John Wiley and Sons, 1981.
W. D. Knight, "Working Capital Management—Satisfying VersusOptimization," Financial Management , Vol. 1 (Summer 1972), pp. 33-40,
Clement G. Krouse, "Programming Working Capital Management," in KeithV. Smith, ed., Readings on the Management of Working Capital , St.
Paul, West Publishing Company, 1980, pp. 573-584.
James A. Largay, III and Clyde P. Stickney, "Cash Flows, RatioAnalysis and The W. T. Grant Company Bankruptcy," FinancialAnalysts Journal , Vol. 36 (July/ August 1980), pp. 51-54.
Baruch Lev, "Financial Failure and Information DecompositionMeasures," in Accounting in Perspective: Contributions to
Accounting Thoughts by Other Disciplines , R. R. Sterling andW. F. Bentz, Eds., Cincinnati: Southwestern Publishing Co., 1971,
pp. 102-111.
Wilbur G. Lewellen, John J. McConnell and Jonathan A. Scott, "CapitalMarket Influences on Trade Credit Practices," The Journal of
Financial Research , Summer 1980, pp. 105-14.
Robert Libby, "Accounting Ratios and the Predictions of Failure: Some
3ehavioral Evidence," Journal of Accounting Research , Vol. 13
(Spring 1975), pp. 150-161.
David McFadden, "Conditional Logit Analysis of Qualitative ChoiceBehavior," in Frontiers in Econometrica . Edited by P. Zarembka:Academic Press, 1974, pp. 104-42.

-24-
Richard D. McKelvey and William Zavoina, "A Statistical Model for
the Analysis of Ordinal Level Dependent Variables," Journal of
Mathematical Sociology , Vol. 4 (1975), pp. 103-120.
Yaw M. Mensah, "The Differential Bankruptcy Predictive Ability of
Specific Price Level Adjustments: Some Empirical Evidence," TheAccounting Review , Vol. 58 (April 1983), pp. 228-246.
R. Charles Moyer, "Forecasting Financial Failure: A Reexamination,"Financial Management , Vol. 6 (Spring 1977), pp. 11-17.
James A. Ohlson, "Financial Ratios and the Probabilistic Prediction of
Bankruptcy," Journal of Accounting Research , Vol. 18 (Spring 1980),
pp. 109-131.
A. Santomero and J. D. Vinso, "Establishing the Probability of Failurefor Commercial Banks and the Bankruptcy System," Journal of
Banking and Finance , Vol. 1 (October 1979), pp. 185-205.
William L. Sartoris and Ned C. Hill, "A Generalized Cash Flow Approachto Short-Term Financial Decisions," Journal of Finance , Vol. 38
(May 1983), pp. 349-360.
Joseph F. Sinkey, Jr., "A Multivariate Statistical Analysis of the
Characteristics of Problem Banks," Journal of Finance , Vol. 30
(March 1975), pp. 21-36.
Keith V. Smith, "On Working Capital as an Investment by the Firm," in
Keith V. Smith, ed., Readings on the Management of Working Capital,
St. Paul, West Publishing Company, 1980, pp. 609-626.
R. J. Taffler, "Forecasting Company Failure in the UK Using Dis-criminant Analysis. and Financial Ratio Data," Journal of RoyalStatistical Society , Vol. 145 (Part 3, 1982), pp. 342-358.
and H. Tisshaw, "Going, Going, Gone—Four Factors WhichPredict," Accountancy , Vol. 88 (March 1977), pp. 50-54.
Meir Tamari , "Financial Ratios as a Means of Forecasting Bankruptcy,"Management International Review , (1966, 4), pp. 15-21.
James C. Van Home, Financial Management and Policy , Fifth Edition,Englewood Cliffs: Prentice-Hall, Inc., 1980.
Wall Street Journal Index , Editor, Sharon Travitsky Russin, New York:
Dow Jones and Company, Inc., 1981.
James M. Warren and John P. Shelton, "A Simultaneous Equation Approachto Financial Planning," Journal of Finance , Vol. 26 (December 1971),
pp. 1123-1142.
J. Fred Weston and Eugene F. Brigham, Managerial Finance , SeventhEdition, Hinsdale, IL: Dryden Press, 1981.

-25-
Christiae V. Zavgren, "Empirical Analyses of Financial Distress: TheState of the Art," Working Paper, Krannert Graduate School of
Management, Purdue University, 1982.
"Reporting Income, Cash Flows and Financial Position of BusinessEnterprises," Exposure Draft, November 16, 1981, Stamford, CT:
Financial Accounting Standards Board, 1981.
D/58
Size 1 I !
ST X* NlI
=• -. 3 i-
I -rt —1 u: - — : >- - - — :
S/Rec H 1
—
1
QA'S i|
u: M N
5 A DTV i i
!1
7C —
b Li
u >e o
c
C 3
?rod~ Z'iVw
1
i
. I
CGS/IHVT !*! —
HUC .' S"*
1
—
5 i*C 1
« "~
ProdVwc RT -^
INV/S <f —
"
CA/S!< W ^;
Cnah Posi- tion
c/s« w N
C/TAix ~
C CLW ^ i-! w <T
Np Credit Interval•-; ~
Quick Flov |1^
~
i "a 0A CL1
X *\ x w
CL'TA!
!
1* —
C 'TA J*—
co - _-CA CL
1
W|M « XIX1
^
so
>
<9
U
5c
BVEO/TDI
"5? —
HVEO ' TO i
.-«; ~
KVEp/BVTD jw!
—
CF/TD « xt x; x: i: w
CF/CLX >s N
wei
rris"1
W —
CL ;".' ~
TT •' HW 1
M
|
~
'
MVCS/BVNU 1
>" ~
TD/TA 'XT- x «
1
H St -*> J3
RE/TA p—IR
I
W £: w l"
orr/Ki j 1
X-""
E3IT INT 1
x! —
log E3IT INT!
« —
S / FA i
i r""
u—a •>— c
— k.
s
HW/ S 1
1
rt
CF/S JW X
1
—
S TA '
1 *l|
-1
HWC TAX KIN >: W X X
OA/TAI
X « K
CA TA1
R X N
Trend 3reaks i
•a —*
5 ue
r —u a3U >V zat m
Slope HI"*
!
'y. ^
A MI|
'
^r
E3IT ' S Mil 1*1—
CF >":1 1
M W N
N * Htt ! i
y w H
CF/TA I*>; s
KIV —
r E5IT TA « —
HI Sx: —
EBIT/TA 'x * X = <9
\ T '***_> K S?w "ST lx IF
u
Eu
u
>
=,3
<DOO
u
>(3
0)=
Is
e
5)
•1
1
CM
w
B
CxJ
CM
=
IsCd
in
3"
JB
CO
V
B-
<rv
—
u
>,O
rv
coen—
oCO
-
H
XON
rJ;
<a.-
—cr
u41
E
T3eca
cu
B
-
c
3
3yuo
ce
•oc
^r »<
h«M
B
. m o Btto XX X Ua "O Bc c —- — =
ilb c
—<
c 3 — -:
1 ^— to _'
- - + +_Q M en •
o •> u -=
X w < B •
z c - I Xu —
'
e+ u
^u
B
en i a Li
-r — Oa u c CO >> —a a Usc tu U
1"O < LI
— — 3 3~ **^ I w —a — >-N —_ ?:
~ ~J J3 i-l— B — CO—^ ^ « « X • US*- ^
,
EC B X 3—
-
^^ c 3 CO
t .* * 3ee — pH — SO
* -r • i, U ~j C - O B eg
r, = *- « B "3 Li —_ - -j LI
— ji CO— + =.
<a § u ~ — 3 Ben • -J • ^ o
U u >, u u a >, GO
L. «-l *- • JB4ml « u pA - < X
= CO « • m 0*0 *i
z c - 3 ~ 2 > ^ U•»J Q
— ^ — Li
u = u ~ — + to ^; —u f) c vH LI > JC— c M ^, CO u — • o s— : — c • - 3o —
IJ — > 1 a, 3_ ij •
— = d Q — 3 u — CO— U B -r LI
u-l <— 3o _J D ^ u h B 3 3
,- Q <s w X — D"3 - — -t Q Li -«o
—•c B a. ^ u i
—
1 OH a = — u > _>-
31 .- 1* n IJ 5 1' B X<=> r- w 03 C a — w'e—s
— tN f^ «J iA >C p^ x«rc

Table 2
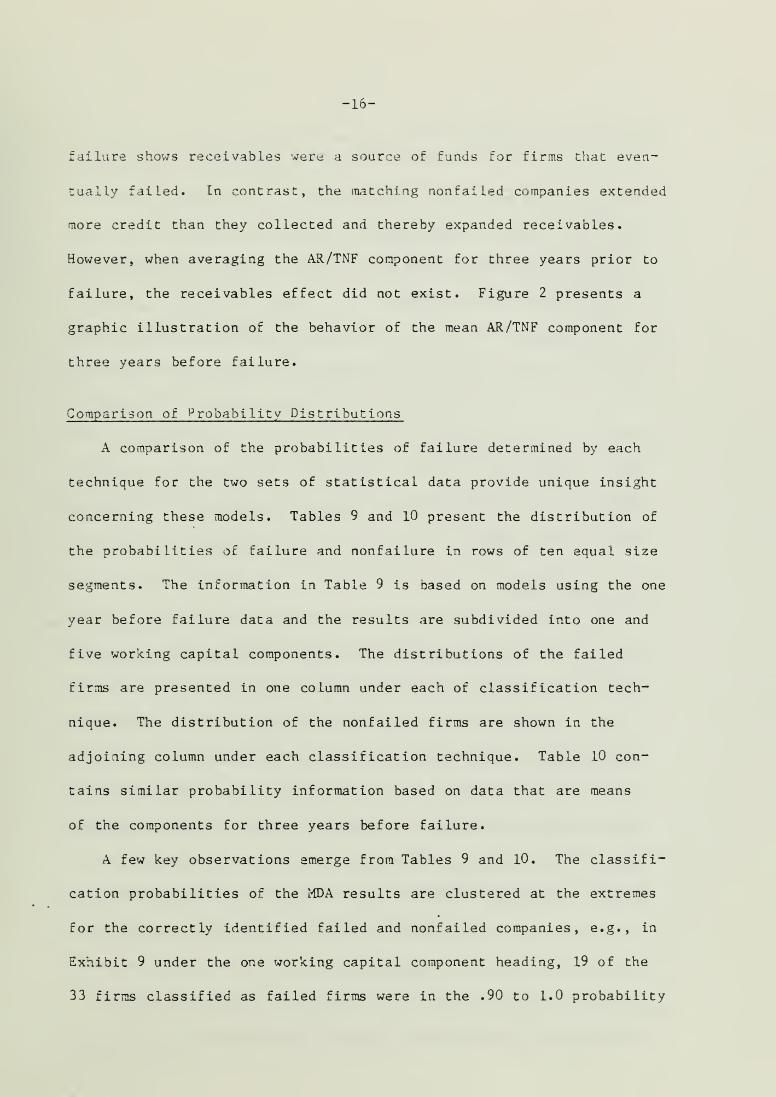
SAMPLE OF FAILED FIRMS COMPUSTAT INDUSTRY CLASSIFICATIONAND YEAR OF FAILURE
Company Name
CompustatIndustry
Classification
Yearof
Failure*
Westates Petroleum Co.
Cott Corp.
American Mfg. Co.
Scottex Corp.Lynnwear Corp.-CL A
Nelly Don, Inc.
Wentworth Mfg. Co.
Mansfield Tire & Rubber Co.
Brody (B.) Seating Co.
Paterson Parchment Paper Co
Rowland Inc.
APCO Oil Corp.EDG Inc.
PASCO Inc.
RAI Inc.
Sitkin Smelting & RefiningGray Mfg . Co. (i)
Gladding Corp.Computer Instruments Corp.Harvard Inds. Inc.Waltham Industries Corp.Leader Intl. Industries Co.
Merchants, Inc.
St. Johnsbury Trucking Co.
Xirby Industries Inc.Overseas National AirwaysShulraan TransportEnterprises
Reeves Telecom Corp.De Jur AMSCO Corp.-CL AArlans Dept. Stores, Inc.
PK.L Cos. Inc.-CL APlaza Group Inc.Computer Applications, Inc.
Crude Petroleum &
Natural Gas 1975Bottled-Canned Soft Drinks 1977
Textile Mill Products 1978Textile Mill Products 1972Apparel & Other Finished
Products 1979
Apparel & Other FinishedProducts 1977
Apparal & Other FinishedProducts 1971
Lumber & wood Products 1978Household Furniture 1979
Paperboard Containers 1973
Misc. Chemical Products 1974
Petroleum Refining 1976
Petroleum Refining 1975
Petroleum Refining 1975Footwear Except Rubber 1971
Secondary Smelting-Ref ining 1977
Misc. Metal work 1974
Radio-TV Trans. Equip. 19 76
Electronic Components NEC 1976
Electronic Components NEC 1970Electrical Mach. & Equip. 1970
Motor Vehicle Parts 1972
Trucking-Local & Long Dist. 1973
Trucking-Local & Long Dist. 1974
Water Transportation 1975
Air Transportation 1977
Transport Service 1977
Radio-TV Broadcasters 1979
Wholasale-Mach, & Equip. 19 76
Retail-Dept. Stores 1970Service-Advertising Agencies 1971
Service-Advertising Agencies 1973
Service-Business Services 1969
*The last year of annual financial statement information reported in
Compustat before actual failure of the company. The data is withina maximum of 3 months before failure or 4 months after failure.
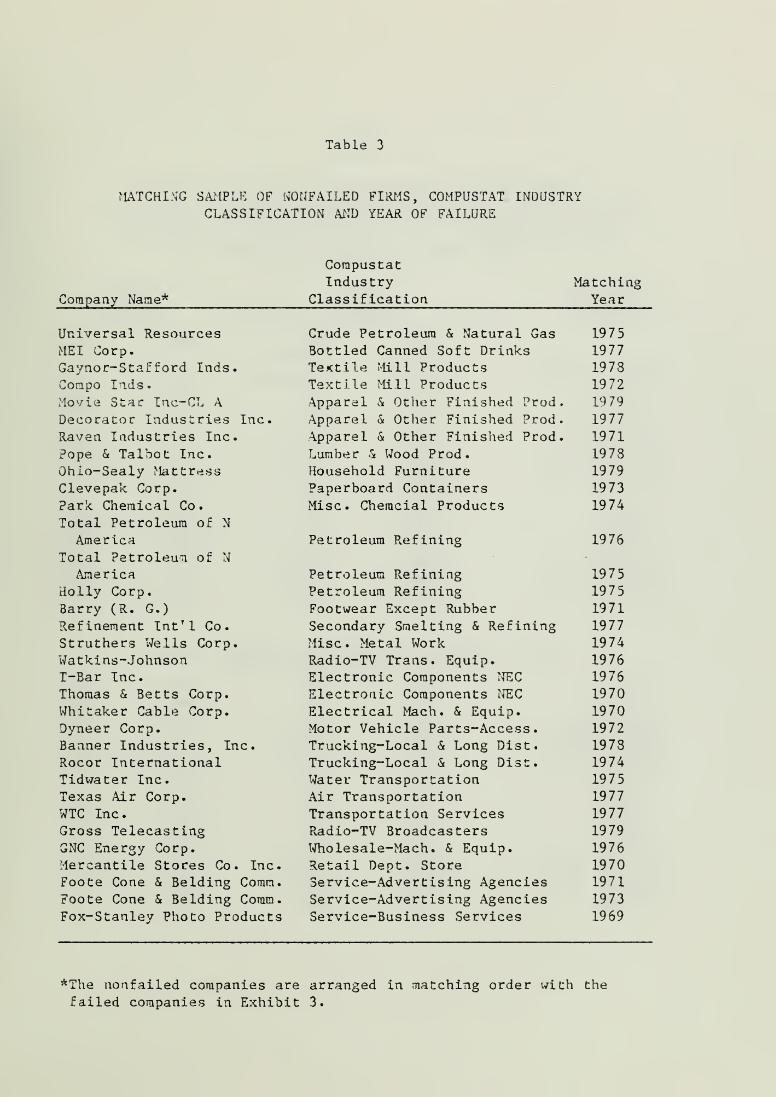
Table 3
MATCHING SAMPLE OF NONFAILED FIRMS, COMPUSTAT INDUSTRYCLASSIFICATION AND YEAR OF FAILURE
Company Name*
Corapustat
IndustryClassification
MatchingYear
1975197719731972
1979
1977
1971
19781979
1973
1974
Universal ResourcesMEI Corp.Gaynor-Staf ford Inds.
Corapo Inds.Movie Star Inc-CL A
Decorator Industries Inc.
Raven Industries Inc.
Pope & Talbot Inc.
Ohio-Sealy flattress
Clevepak Corp.
Park: Chemical Co.
Total Petroleum of N
AmericaTotal Petroleum of N
AmericaHolly Corp.
Barry (R. G.)
Refinement Int'l Co.Struthers Wells Corp.
Watkins-JohnsonT-Bar Inc.Thomas & Betts Corp.Whi taker Cable Corp.Dyneer Corp.Banner Industries, Inc.
Rocor InternationalTidwater Inc.Texas -Air Corp.WTC Inc.
Gross TelecastingGNC Energy Corp.
Mercantile Stores Co. Inc.Foote Cone & Belding Comm.Foote Cone & Belding Coram.
Fox-Stanley Photo Products
Crude Petroleum & Natural GasBottled Canned Soft DrinksTextile Mill ProductsTextile Mill Products•\pparel & Other Finished ProdApparel & Other Finished Prod\pparel & Other Finished ProdLumber & Wood Prod.Household FurniturePaperboard ContainersMisc. Cheracial Products
Petroleum Refining
Petroleum RefiningPetroleum RefiningFootwear Except RubberSecondary Smelting & RefiningMisc. Metal WorkRadio-TV Trans. Equip.Electronic Components "TEC
Electronic Components NECElectrical Mach. & Equip.Motor Vehicle Parts-Access.Trucking-Local & Long Dist.Trucking-Local & Long Dist.Water TransportationAir TransportationTransportation ServicesRadio-TV BroadcastersWholesale-Mach. & Equip.Retail Dept. StoreService-Advertising AgenciesService-Advertising AgenciesService-Business Services
1976
19751975
19711977
1974197619761970197019721978197419751977
19771979
1976
197019711973
1969
*The nonfailed companies are arranged in matching order with the
failed companies in Exhibit 3.

Table 4
MEAN FUNDS FLOW COMPONENTS FOR FAILED AND NONFAILEDCOMPANIES FOR TWO MDA TESTS
ONE YEAR BEFORE FAILURE
Funds FlowComponent
TF/TANOFF/TNFNWCFF/TNFNOA&LF/TNFNFFF/TNFFCE/TNFNIFF/TNFDIV/TNFCC/TNFAR/TNFINV/TNFOCA/TNFAP/TNFOCL/TNF
Group 1 Group 2
Failed Nonfailed
Mean S.D. Mean S.D.
.25741 .1409 .22650 .0951
.16335 .5286 .55646 .2474
.13030 .4531 -.12962 .3444
.04404 .2589 .04776 .1787
.16752 .4905 .14064 .3695
.15299 .1278 -.08043 .0958
.16349 .2882 -.36766 .2672
.01881 .0502 -.09220 .1033
.08182 .2900 -.07496 .2^34
.10035 .3516 -.16937 .2575
.01357 .4858 -.12646 .2460
.01746 .1485 -.02030 .0658
.17093 .5599 .10151 .3937
,17201 .6808 .08502 .2418
MEAN OF VARIABLE FOR THREE YEARS BEFORE FAILURE
TF/TANOFF/TNFNWCFF/TNFNOA&LF/TNFNFFF/TNFFCE/TNFNIFF/TNFDIV/TNFCC/TNFAR/TNFINV/TNFOCA/TNFAP/TNFOCL/TNF
.25569 .1363 .21974 .0764
.28846 .3445 .58885 .2288
.00723 .2916 -.10282 .1975
.01830 .2026 .02954 .0640
.12042 .3425 .09055 .2113
.12622 .1009 -.07918 .0623
.22021 .1705 -.36426 .2114
.02228 .0493 -.09392 .1060
.02911 .1453 -.06878 .1087
.01344 .3042 -.15108 .1958
.06158 .2113 -.11708 .1674
.00276 .0220 -.01557 .0326
.14722 .2602 .13959 .2121
.08907 .3891 .04133 .2506

Table 5
CLASSIFICATION MATRICES FOR FAILED AND NONFAILED COMPANIES BASEDON RELATIVE FUNDS FLOW COMPONENTS WITH ONE NET WORKING CAPITAL
AND WITH FIVE SEPARATE WORKING CAPITAL COMPONENTS ONE YEARBEFORE FAILURE USING MDA AND PROBIT
ONE NET WORKING CAPITAL COMPONENT
NumberCorrect
PercentCorrect
PercentError N
MDA
FailedNonf ailed
Total
27
29
56
81.82 18.18 33
87.88 12.12 33
84.85 15.15 66
PROBIT (Pr < .5)
FailedNonf ailed
Total
26
54
78.79 21.21 33
84.85 15.15 33
81.81 18.13 66
MDA
FIVE WORKING CAPITAL COMPONENTS
FailedNonf ailed
Total
25
33
58
75.76 24.24 33
100.00 0.00 33
87.88 13.64 66
PROBIT (Pr < .5)
FailedNonfailed
Total
26
29
55
78.79 21.21 33
87.88 12.12 33
83.33 16.67 66
Table 6
CLASSIFICATION MATRICES FOR FAILED AND NONFAILEDCOMPANIES BASED ON MEANS OF VARIABLES WITH ONEAND FIVE WORKING CAPITAL COMPONENTS FOR THREE
YEARS BEFORE FAILURE USING MDA AND PROBIT
ONE WORKING CAPITAL COMPONENT
NumberCorrect
PercentCorrect
PercentError N
MDA
FailedNonf ailed
Total
26
29
55
78.7987.87
83.33
21.21 33
12.12 33
16.67 66
PROBIT (Pr < .5)
FailedNonfailed
Total
27
24
51
81.82 18.18 33
72.73 27.27 33
77.27 22.73 66
MDA
FIVE WORKING CAPITAL COMPONENTS
FailedNonf ailed
Total
27
31
58
81.8293.9487.88
18.18 33
6.06 33
15.15 66
PROBIT (Pr < .5)
FailedNonfailed
Total
26
26
52
78.79 21.21 33
78.79 21.21 33
78.79 21.21 66
Table 7
PROBIT COEFFICIENTS AND ASYMPTOTIC T RATIOS WITHONE AND FIVE WORKING CAPITAL COMPONENTS USING
DATA ONE YEAR BEFORE FAILURE
ONE WORKING FIVE WORKINGCAPITAL COMPONENT CAPITAL COMPONENTS
ASYMPTOTIC ASYMPTOTICCOMPONENTS COEFFICIENT T RATIO COEFFICIEN1 T RATIO
CONSTANT .762 .8 59 1.567 1.164
NOFF/TNF -.348 -.364 1.257 .871
NWCFF/TNF .574 .723 - -
NOA&LF/TNF -2.672 -1.677 -1.040 -.514
NFFF/TNF -.301 -.290 1.580 1.067
FCE/TNF -.843 -.381 2.713 .887
NIFF/TNF 1.600 1.397 3.678 2.308**
DIV/TNF 9.892 2.521** 13.133 2.652**
TNF/TA 1.493 .648 .129 .044
AR/TNF - - 4.339 2.594**
INV/TNF - - 1.253 .986
OCA/TNF - - 2.490 .672
AP/TNF - - 2.086 1.638
OCL/TNF — — .560 .525
**Si£nif icant at the .05 level.

Table 8
PROBIT COEFFICIENTS AND ASYMPTOTIC T RATIOS WITHONE AND FIVE WORKING CAPITAL COMPONENTS USING
THE MEAN OF COMPONENT THREE YEARS BEFORE FAILURE
ONE WORKING FIVE WORKINGCAPITAL COMPONENT CAPITAL COMPONENTS
ASYMPTOTIC ASYMPTOTICCOMPONENTS COEFFICIENT T RATIO COEFFICLEN1 T RATIO
CONSTANT .792 .813 .07 3 .063
NOFF/TNF .163 .091 1.630 .700
NWCFF/TNF 1.299 .b23 - -
NOA&LF/TNF -4.190 -1.640 -6.094 -1.994
NFFF/TNF -.038 -.017 -.008 -.003
FCE/TNF -1.828 -.557 -2.041 -.462
NIFF/TNF 3.155 1.552 4.245 1.691
DIV/TNF 12.126 2.374** 17.691 2.906**
TNF/TA 2.945 1.040 7.362 2.027**
AR/TNF - - 3.656 1.037
INV/TNF - - 2.115 .819
OCA/TNF - - 4.532 .471
AP/TNF - - 2.649 .853
OCL/TNF — - -.470 -.166
**Sisnif icant at the .05 level.
Table 9
PROBABILITY OF FAILURE FOR FAILED AND NONFAILED COMPANIESDETERMINED BY MDA AND PROBIT USING INFORMATION WITH ONE ANDFIVE WORKING CAPITAL COMPONENTS FOR ONE YEAR BEFORE FAILURE
ONE WORKING CAPITAL COMPONENT
Probabilityof Failure
MDANF
ProbitF NF
.000 -
.1001-
.2001-
.3001-
.4001-
.5001-
.6001-
.7001-
.8001-
.9001-
.1000
.2000
.3000
.4000
.5000
.6000
.7000
.8000
.90001.000
2
1
2
3
2
19
22
4
3 1
2
2
4
3
3
4
12
TOTAL 33 33 33 33
FIVE WORKING CAPITAL COMPONENTS
Probabilityof Failure
MDANF
ProbitF NF
.000 -
.1001-
.2001-
.3001-
.4001-
.5001-
.6001-
.7001-
.8001-
.9001-
•.1000
.2000
.3000
.4000
.5000
.6000
.7000
.8000
.9000
1.000
TOTAL
1
1
23
33
311
33
1
2
2
2
1
3
1
19
33
10
7
5
4
3
2
1
1
33
Table 10
PROBABILITY OF FAILURE FOR FAILED AND NONFAILED COMPANIESDETERMINED BY MDA AND PROBIT USING INFORMATION BASED ON
MEANS OF VARIABLES WITH ONE AND FIVE WORKING CAPITALCOMPONENTS FOR THREE YEARS BEFORE FAILURE
ONE WORKING CAPITAL COMPONENT
Probabllityof Fai lure
.000 - .1000
.1001- .2000
.2001- .3000
.3001- ,4000
.4001- .5000
.5001- .6000
.6001- .7000
.7001- .8000
.8001- .9000
.9001- 1.000
MDA Probit
1
1
22
NF
24
4 1
3
1
1
2
7
5
3
10
NF
10
8
1
2
3
4
2
2
TOTAL 33 33 33 33
FIVE WORKING CAPITAL COMPONENTS
Probabilityof Failure
MDA
.000 -
.1001-
.2001-
.3001-
.4001-
.5001-
.6001-
.7001-
.8001-
.9001-
.1000
.2000
.3000
.4000
.5000
.6000
.7000
.8000
.90001.000
1
4
21
NF
28
2
1
1
1
ProbitF NF
1
4
1
2
6
6
12
15
7
1
1
2
2
1
3
3
TOTAL 33 33 33 33
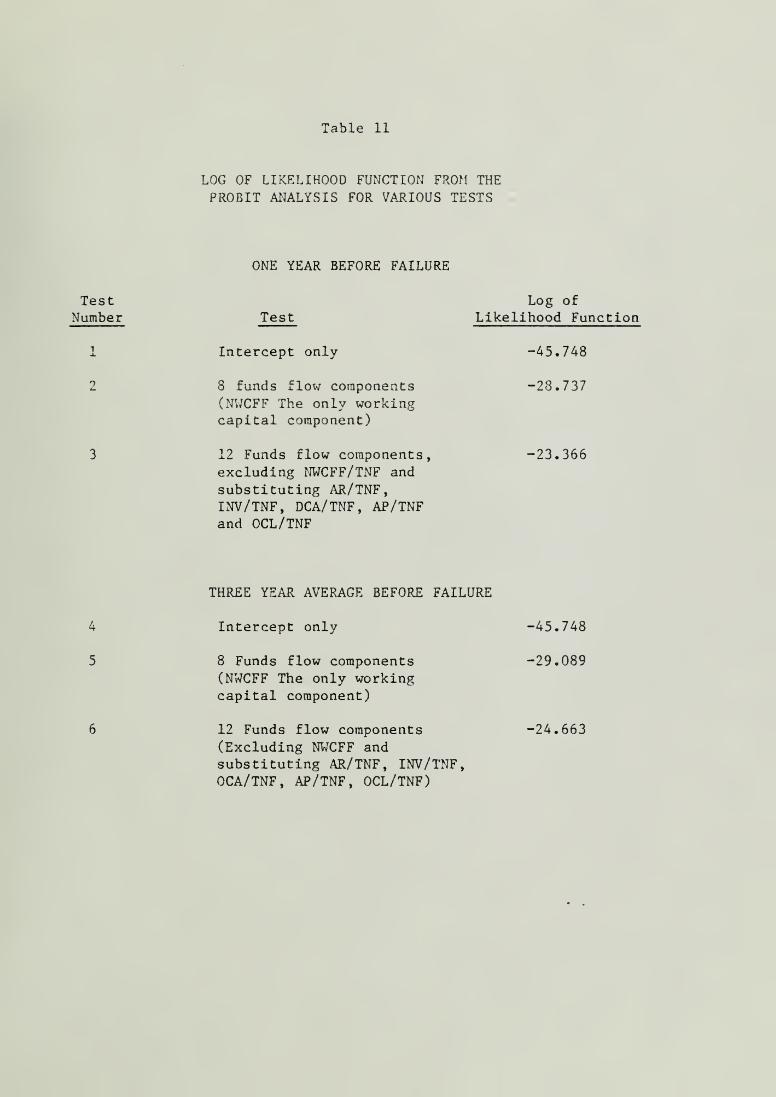
Table 11
LOG OF LIKELIHOOD FUNCTION FROM THE
PROBIT ANALYSIS FOR VARIOUS TESTS
ONE YEAR BEFORE FAILURE
TestNumber
1
2
Test
Intercept only
8 funds flow components(NWCFF The only workingcapital component)
12 Funds flow components,excluding NWCFF/TNF and
substituting AR/TNF,INV/TNF, DCA/TNF, AP/TNFand OCL/TNF
Log ofLikelihood Function
-45.748
-28.737
-23.366
THREE YEAR AVERAGE BEFORE FAILURE
Intercept only -45.748
8 Funds flow components -29.089(NWCFF The only workingcapital component)
12 Funds flow components -24.663(Excluding NWCFF andsubstituting AR/TNF, INV/TNF,OCA/TNF, AP/TNF, OCL/TNF)