78
ANNUAL REPORT 2008

ANNUAL REPORT
2008

BANQUE PSA FINANCE 2008 Annual Report
Board of directors senior ManageMent auditors
isabel Marey-semper isabel Marey-semper Pricewaterhousecoopers audit
Chairman Chief Executive Officer Mazars
christian streiff Bernard darrieutort suBstitute auditors
Director Chief Operating Officer etienne Boris
guillaume Potel
Peugeot s.a.
Represented by:
Jean-claude Hanus
autoMoBiles Peugeot
Represented by:
Jean-Philippe collin
autoMoBiles citroËn
Director
At February 9, 2009
BANQUE PSA FINANCESociété Anonyme. Share capital: €177,408,000
Registered office: 75, avenue de la Grande Armée – 75116 ParisRegistered in Paris under no. 325 952 224 - SIRET 325 952 224 00013
APE business identifier code: 6419 ZInterbank code: 13168N
Phone: +33 (1) 46 39 66 33 – Fax: +33 (1) 46 39 54 03

1BANQUE PSA FINANCE 2008 Annual Report
ANNUAl rEPort 21.1 Key figures 31.2 Chairman’s Message 41.3 Group Overview 51.4 Businesses of the main Banque PSA Finance
companies and its branches 61.5 Business Review 71.6 Results and Outlook 141.7 Refinancing policy 151.8 Capital Markets Program Ratings and Issuer
Financial Strength Ratings 171.9 Financial Risk Management 181.10 Credit Risk Management 201.11 Internal Control 211.12 Banque PSA Finance in 2008 24
CoNSolIdAtEd FINANCIAl StAtEmENtS For thE yEArS ENdEd dECEmBEr 31, 2008 ANd 2007 252.1 Consolidated balance sheet 272.2 Consolidated statement of income 282.3 Consolidated statement of changes in equity
attributable to equity holders of the parent and minority interests 29
2.4 Consolidated statement of cash flows 31 Notes to the consolidated financial statements
for the years ended December 31, 2008 and 2007 32
1 2
CoNtENtS
Annual Shareholders’ Meeting at April 21, 2009
Wholly-owned by Peugeot S.A., Banque PSA Finance provides financing for sales of Peugeot and Citroën cars and light commercial vehicles in 24 countries. It supports the brands’ growth by offering retail and fleet customers a diversified range of financing solutions and related services, and by providing Peugeot and Citroën dealers with financing for new and used vehicles and replacement parts inventories.

2 BANQUE PSA FINANCE 2008 Annual Report BANQUE PSA FINANCE 2008 Annual Report
1.1 Key figures 3
1.2 Chairman’s message 4
1.3 Group overview 5
1.4 Businesses of the main Banque PSA Finance companies and its branches 6
1.5 Business review 7
1.5.1 Peugeot and Citroën Sales 71.5.2 Banque PSA Finance – Business Scope 71.5.3 Retail Financing 81.5.4 Wholesale Financing 12
1.6 results and outlook 14
1.6.1 Results for the year 141.6.2 Capital management 141.6.3 Tier One capital 141.6.4 Outlook 15
1.7 refinancing policy 15
1.7.1 Diversifying sources of financing 151.7.2 Liquidity reserves 16
1.8 Capital markets Program ratings and Issuer Financial Strength ratings 17
1.8.1 Capital markets programs 17
1.9 Financial risk management 18
1.9.1 Currency risk 181.9.2 Interest rate risk 181.9.3 Counterparty risk 191.9.4 Concentration Of Credit Risks 19
1.10 Credit risk management 20
1.10.1 Retail credit risk management 201.10.2 Wholesale and Fleet credit risk management 201.10.3 Basel II 21
1.11 Internal Control 21
1.11.1 Recurring controls 221.11.2 Periodic controls 221.11.3 Oversight by executive management and the Board 231.11.4 Organisation of internal control 23
1.12 Banque PSA Finance in 2008 24
1.12.1 Proposed Resolutions 241.12.2 Ordinary resolutions 24
TITRE 1
annual report1

BANQUE PSA FINANCE 2008 Annual Report 3BANQUE PSA FINANCE 2008 Annual Report
ANNUAl rEPort 11.1 - Key figures
1.1 Key figuresnumber of vehicles financed, retail loans •(in thousand vehicles)
Penetration rate by country at dec. 31, 2008 (as a %) •(new vehicles financed / PSA Peugeot Citroën
new vehicle registrations)
outstanding retail and wholesale loans at dec. 31 •(in million euros)
outstanding retail and wholesale loans by country •at dec 31, 2008 (in million euros)
equity and net income at dec. 31 •(in million euros)
net banking revenue • (in million euros)
4 BANQUE PSA FINANCE 2008 Annual Report
ANNUAl rEPort11.2 - Chairman’s Message
BANQUE PSA FINANCE 2008 Annual Report
1.2 Chairman’s Message
2008 was shaped by a global economic and financial crisis whose impact on the automobile industry steadily worsened as the months went by. In this challenging environment, Banque PSA Finance delivered a satisfactory marketing performance after several years of strong growth and successfully limited the margin impact of higher refinancing costs and escalating credit risks.
The PSA Peugeot Citroën Group sold 3,260,400 new vehicles and CKD units during the year, a decline of 4.9% in a market down 5.4%. The total included 2,390,200 new vehicles sold in the geographic markets served by Banque PSA Finance. Banque PSA Finance provided financing for 27.3% of the vehicles sold by Automobiles Peugeot and Automobiles Citroën, versus 26.1% in 2007. This was its highest penetration rate since it was licensed to operate as a bank in July 1995. In all, it extended retail financing for 848,077 new and used vehicles, a decline of just 0.3% over the previous year. The contribution of new markets in Central and Eastern Europe and Latin America continued to grow, representing 12.6% of total new loans and 14.5% of new vehicle financing alone.
In line with its strategy, the Bank continued to expand internationally, building a presence in all of the PSA Peugeot Citroën Group’s host countries. In particular, the year saw the start-up of operations in Algeria, Croatia, Slovenia and Russia.
In order to offer customers an increasingly comprehensive service offering tailored to their needs, in 2008 the Bank set up a life insurance company and a property and casualty insurance company that will gradually roll out their solutions to every European country. They have already begun operations in France and Germany.
The Bank successfully raised appropriate financing for its business and protected its liquidity position, by increasing long-term financing to 75% of the total. At the year-end, it also had €6,000 million in undrawn syndicated lines of credit and more than €1 billion worth of immediately realizable assets.
Despite last year’s higher interest rates, the Bank’s net banking revenue was on a par with that for 2007, while operating income held up reasonably well at €557 million, reflecting tight control over general operating expenses and increased margins on sales of services. The bulk of the decline in operating income was due to provision expense (reported in the income statement under “cost of risk”), which at 0.42% nevertheless stayed below 0.50% of average net outstanding loans for the eleventh year running.
The serious turmoil afflicting economies around the globe is expected to continue weighing heavily on carmaker sales volumes. However, PSA Peugeot Citroën has considerable strengths that will help it to withstand this unfavourable environment, including a broad international presence and a diversified, contemporary vehicle line-up that will be enhanced with further new models in 2009. As it continues to give the Group the support it expects, Banque PSA Finance can deploy a comprehensive range of financing products and services that have demonstrated their close alignment with the needs of every customer category. It has also developed strong synergies with the brands and their dealer networks, which it is constantly broadening and deepening. Last but not least, it has highly effective risk management tools, as evidenced by its low credit loss ratio. All of these factors should enable Banque PSA Finance to withstand the effects of the current crisis.
Isabel Marey-Semper

BANQUE PSA FINANCE 2008 Annual Report 5BANQUE PSA FINANCE 2008 Annual Report
ANNUAl rEPort 11.3 - Group overview
1.3 Group overview
New financing
(in million euros) 2008 2007 % change
retail loans
Number of vehicles financed 848,077 850,982 -0.3
Amount of financing (excluding interest) 9,135 9,253 -1.3
Wholesale loans
Number of vehicles financed 2,055,900 2,214,214 -7.1
Amount of vehicles financing 35,177 37,784 -6.9
Amount of replacement parts financing 4,582 4,565 +0.4
oustanding loans at december 31
By type of customers
Retail loans 17,913 17,850 +0.3
Wholesale loans 4,370 5,606 -22.0
ToTal 22,283 23,456 -5.0
Consolidated financial data
At December 31 (in million euros) 2008 2007 % change
Consolidated stockholders’ equity before income appropriation 2,924 2,900 +0.8
Total assets 26,371 28,739 -8.2
european capital adequacy ratio 11.23% 10.36%
financial results
Net banking revenue 976 981 -0.5
Income before tax 555 607 -8.5
NeT iNcome for The year 358 421 -14.9
- of which minority interets 2 3 -39.1
- of wich attributable to equity holders of the parent 356 418 -14.7

6 BANQUE PSA FINANCE 2008 Annual Report
ANNUAl rEPort11.4 - Businesses of the main Banque pSa Finance companies and its branches
BANQUE PSA FINANCE 2008 Annual Report
1.4 Businesses of the main Banque pSa Finance companies and its branches
Country % Company Automotive Financing Refinancing Services
Algeria 100% BPF Algeria
Germany Banque PSA Finance SA Niederlassung Deutschland
Austria Banque PSA Finance SA Niederlassung Ôsterreich
Belux100% PSA Finance Belux
Luxembourg
Croatia 100% PSA Financial d.o.o.
Spain Banque PSA Finance – Sucursal en España
France
Banque PSA Finance
100% Groupe Crédipar
98% Sofira
100% Sofib
99% PSA Assurances S.A.S.
Hungary 100% PSA Finance Hungaria R.T.
ItalyBanque PSA Finance – Succursale in Italia
100% PSA Renting Italia S.p.A.
Malta
99.9% PSA Services Ltd
99.9% PSA Insurance Ltd
99.9% PSA Life Insurance Ltd
Netherlands100% PSA Finance Nederland B.V.
100% Peugeot Finance International N.V.
PolandBanque PSA Finance SA Oddzial w Polsce
100% PSA Finance Polska Sp.zo.o
PortugalBanque PSA Finance – Succursal em Portugal
98% PSA Gestão Comercio E Aluguer de Veículos
United Kingdom
Banque PSA Finance – Branch in UK
50% PSA Finance Plc *
100% PSA Wholesale Ltd
Slovakia 100% PSA Finance Slovakia S.r.o.
Slovenia 50% BPF Financiranje d.o.o.
Switzerland 100% PSA Finance Suisse S.A.
Czech Republic 100% PSA Finance Ceska Republika S.r.o.
Turkey 100% BPF Pazarlama A.H.A.S.
Argentina 50% PSA Finance Argentina Compania Financiera S.A.
Brazil100% Banco PSA Finance Brazil S.A.
100% PSA Finance Arrendamento Mercantil S.A.
Mexico 100% Banque PSA Finance Mexico, S.A. de C.V. SOFOL
China 25% Dongfeng Peugeot Citroën Auto Finance Co Ltd
Retail financing : installment loans.
Retail financing : lease financing.
Wholesale financing.
Refinancing of Banque PSA Finance units.
Retail financing broker.
Insurance activity.
* Responsible for mananing the loan book at December 2001 on a run-off basis.

BANQUE PSA FINANCE 2008 Annual Report 7BANQUE PSA FINANCE 2008 Annual Report
ANNUAl rEPort 11.5 - Business review
1.5 Business review
1. ➜ 5.1 Peugeot and Citroën Sales
PSA Peugeot Citroën’s worldwide sales declined in 2008, but the Group maintained market share in a time of global economic crisis.In a deeply troubled global economic environment that severely tested every automobile market around the world, PSA Peugeot Citroën’s 2008 unit sales attested to the Group’s strong resilience.
In a global market down 5.4%, the Group successfully limited the decline in sales of new vehicles and CKD units to 4.9%, at 3,260,400 units for the year.
This enabled the Group to hold on to its market share both worldwide (with 5%) and in Western Europe (with 13.8%), where it remains the region’s second largest carmaker.
In Western Europe, the 8.6% decline in PSA Peugeot Citroën’s car and light commercial vehicle registrations was in line with the 8.8% contraction in the market. In all, Group registrations stood at 2,130,900 units, including 1,125,700 Peugeots and 1,005,200 Citroëns. Market share improved in France (by 0.8 points to 31.6%) and Germany (by 0.2 points to 5.7%), remained stable in Spain and Italy, and fell in the United Kingdom where the Group took appropriate measures to limit the effect of the unfavourable exchange rate.
Outside Western Europe, 1,181,300 vehicles and CKD units were sold, representing 36.2% of total unit sales versus 32.2%
in 2007. The Group achieved its best performance in Russia, where registrations rose 67% in a market up 13.6%. It also performed well in Latin America, where Peugeot and Citroën registrations advanced 5.4% in a market up 2.0%. And although it underperformed the market in China, registrations nevertheless reached 178,100 units for the year.
Among the significant growth drivers in 2008 were the Peugeot 308 and the Citroën C5:
after successfully ramping up in the first half, sales of the •Peugeot 308 continued to climb in the second half, led by the launch of the 308 SW which sold 290,100 units during the year;
a new version of the Citroën C5 sedan was launched in April, •followed by the Tourer version in June. With unit sales of 87,900, the model exceeded its targets in a contracting market segment;
in the light commercial vehicle market, the launch of the •Citroën Nemo and Peugeot Bipper, along with new versions of the Citroën Berlingo and Peugeot Partner, enabled the Group to extend its market leadership in Western Europe, lifting its share by 1.3 points to 19.9%. In all, 456,510 light commercial vehicles were sold during the year.
Lastly, the PSA Peugeot Citroën Group maintained its global environmental leadership, delivering 921,000 vehicles emitting less than 140g CO
2/km, up 7.4% from 2007.
1. ➜ 5.2 Banque PSA Finance – Business Scope
Banque PSA Finance’s growth strategy consists of extending coverage all of the high potential markets where PSA Peugeot Citroën is present. In 2008, operations were set up in four new markets – Russia, Algeria, Slovenia and Croatia – completing the preparatory work initiated in 2007. With these business launches, the Bank’s operations now span four continents and 24 countries.
The Bank also expanded its presence in the service business, with the creation in Malta of two insurance subsidiaries, PSA Insurance Ltd. and PSA Life Insurance Ltd. The two companies were licensed by the Maltese authorities at the end of the first half of 2008.
With these two new subsidiaries, the Bank is now capable of serving all the needs of its international customer base.

8 BANQUE PSA FINANCE 2008 Annual Report
ANNUAl rEPort11.5 - Business review
BANQUE PSA FINANCE 2008 Annual Report
1.5.3 ➜ retail Financing
Satisfactory performance in a crisis environmentBanque PSA Finance successfully contained the effects of the global crisis, which affected every automobile market more or less simultaneously, by significantly improving its penetration rate among buyers of new Peugeots and Citroëns. This performance, combined with an increase in the number of used vehicles financed, helped to ensure that the overall number of new contracts declined only slightly from 2007.
At 27.3% versus 26.1% in 2007, the Bank’s penetration rate among buyers of new Peugeots and Citroëns was the highest ever.
In all, 653,545 new vehicles were financed, compared with 660,398 in 2007, representing a decline of just 1% in a year when the two brands’ unit sales in the markets served by the Bank were down 5.5%.
The relative contribution from new markets in Central and Eastern Europe and Latin America continued to grow, rising to 14.5% of new vehicle sales from 11.7% in 2007. This represented a total of 94,643 new vehicles financed during the year, up 22.4% over the previous year.
Western EuropeA total of 558,902 new vehicles were financed in 2008, lifting the Bank’s penetration rate by one point to 27.7%.
Significant gains were achieved in Spain (with the penetration rate rising to 26.2% from 21% in 2007), the United Kingdom (28.9% versus 26.5%), Germany (43.5% versus 41.7%), Austria (21.1% versus 19.6%) and Switzerland (29.3% versus 28%). However, the penetration rate eroded slightly in France, to a still satisfactory 28.5%, as well as in Belgium and Portugal.
The German branch reported a strong 6.5% rise in the number of new vehicles financed during the year. It led a large number of joint initiatives with the Peugeot and Citroën brands to offer customers very attractive financing terms, which in particular drove a sharp rise in long-term leasing volumes. Financing volumes also increased in Austria, the Netherlands and Switzerland.
In France, the less favourable performance was concentrated essentially in the first half of the year. The situation improved significantly in the second half, following measures to strengthen local relations with the dealer networks.
In Spain, the effects of the collapse in automobile demand on the Bank’s local branch were considerably attenuated by a series of
measures focused on offering integrated financing and service packages. This type of solution responds closely to the needs not only of individual car buyers but also of corporate customers which accounted for a growing share of the branch’s retail financing volume in 2008. In all, the penetration rate for services grew to 126.3% from 117.2% in 2007. The Spanish branch also worked to consolidate existing dealer relationships and to enhance relations with dealers for which the branch’s penetration rate was low.
In Italy, the local branch limited the impact of fast falling demand and aggressive competition by stepping up its marketing drive targeting selected dealers.
Central and Eastern EuropeThe Bank significantly improved its performance in most of its host markets in Central and Eastern Europe, in terms of both penetration rates and volume. In Poland, the penetration rate rose to 30.4% from 26.4% in 2007, with financing volume up 17.5% to 12,840 contracts. In Hungary, the penetration rate was 21.6% versus 17%, reflecting 17.6% growth in financing volume, while in Slovakia, the number of new contracts surged by 30.7%.
In the Czech Republic, the Bank’s penetration rate among Peugeot and Citroën customers eased back slightly to what remains a very healthy 34.2%.
latin AmericaMarkets continued to expand throughout most of 2008 in Brazil and Argentina, where the Bank enjoyed strong growth, with penetration rates increasing by 5.5 points to 29.1% and 3.6 points to 14.8% respectively. In Mexico, however, the penetration rate was down compared with 2007.
In Brazil, the number of new vehicles financed during the year was up 45.8%, with fourth quarter volumes boosted by marketing initiatives conducted jointly with the brands.
In Argentina, ongoing action to strengthen the sales organisation, targeted marketing initiatives conducted jointly with the brands and increased integration of services in the financing offer helped to drive up the local subsidiary’s penetration rate over the year. The rate stood at 35.8% for financing contracts and 199.7% for services, corresponding to the sale of just under two service contracts for every financing contract.
In Mexico, the sharp drop in the automobile market led to a significant decline in the Bank’s financing volumes, but its penetration rate nevertheless remained high at 45.3%.

BANQUE PSA FINANCE 2008 Annual Report 9BANQUE PSA FINANCE 2008 Annual Report
ANNUAl rEPort 11.5 - Business review
Used vehicle financingIn 2008, the number of used vehicles financed by the Bank rose by 2.1% to 194,532 units, helped by the gradual integration of its service solutions into the financing offer.
Marketing performance varied, however, from one country to another. In Western Europe, used vehicle financing volume rose 1.4% to 181,667 units, lifted by a 41.3% gain in the United
Kingdom. In the new markets in Central and Eastern Europe and Latin America, financing volumes grew 13.6%, with increases of 79.2% in Argentina and 67.4% in the Czech Republic.
in all, total new and used vehicle financing contracts dipped just 0.3% to 848,077 units, Outside Western Europe, financing volumes rose 21.4%, led mainly by Brazil and Argentina.
New retail financing
2008 2007 % change
number of contracts
Installment sales 529,584 574,580 -7.8
Leasing activity and other financing 318 493 276,402 +15.2
ToTal 848,077 850,982 -0.3
of which outside Western Europe 107,481 88,368 +21.6
in million euros (excluding interest)
Installment sales 4,884 5,458 -10.5
Leasing activity and other financing 4,251 3,795 +12.0
ToTal 9,135 9,253 -1.3
of which outside Western Europe 849 668 +27.1
Average outstanding retail end of period 17,288 16,946 +2.0
Number of new and used vehicles financed by Banque PSA Finance
Retail financing by country 2008 2007 % change
Germany 106,286 100,545 +5.7
Austria 9,595 8,784 +9.2
Belgium-Luxemburg 31,654 32,008 -1.1
Spain 75,545 86,692 -12.9
France 315,925 328,302 -3.8
Hungary 3,684 3,038 +21.3
Italy 56,548 63,038 -10.3
Netherlands 11,946 11,474 +4.1
Poland 13,874 11,939 +16.2
Portugal 17,432 19,639 -11.2
United Kingdom 105,627 102,089 +3.5
Slovakia 3,121 2,408 +29.6
Slovenia 1,038
Switzerland 10,215 10,043 +1.7
Czech Republic 7,125 7,396 -3.7
Turkey 8,024 9,392 -14.6
Argentina 13,906 9,979 +39.4
Brazil 52,007 37,596 +38.3
Mexico 4,525 6,620 -31.6
ToTal 848,077 850,982 -0.3

10 BANQUE PSA FINANCE 2008 Annual Report
ANNUAl rEPort11.5 - Business review
BANQUE PSA FINANCE 2008 Annual Report
Banque PSA Finance market share by country
PSA Peugeot Citroën registration * New vehicles financed *Banque PSA Finance penetration rate (%)
Countries 2008 2007 2008 2007 2008 2007
Germany 189,500 185,600 82,380 77,385 43.5 41.7
Austria 29,500 28,600 6,234 5,596 21.1 19.6
Belux 129,600 127,300 27,961 28,105 21.6 22.1
Spain 254,300 363,200 66,658 76,253 26.2 21.0
France 794,100 779,700 226,407 231,926 28.5 29.7
Hungary 14,200 16,200 3,057 2,600 21.6 19.6
Italy 235,700 268,900 51,569 57,999 21.9 21.6
Netherlands 74,600 71,200 8,343 7,853 11.2 11.0
Poland 42,200 41,500 12,840 10,927 30.4 26.3
Portugal 43,700 46,500 12,639 14,047 28.9 30.2
United Kingdom 237,200 286,000 68,581 75,877 28.9 26.5
Slovakia 12,900 11,900 3,072 2,351 23.9 19.8
Slovenia 7,300 889 12.2
Switzerland 27,800 28,800 8,130 8,058 29.3 28.0
Czech Republic 20,000 19,600 6,840 7,237 34.2 36.9
Turkey 35,400 34,600 7,698 8,732 21.7 25.2
Argentina 81,700 79,700 12,086 8,899 14.8 11.2
Brazil 151,000 128,200 43,864 30,085 29.1 23.5
Mexico 9,500 13,600 4,307 6,468 45.3 47.6
ToTal 2,390,200 2,531,100 653,545 660,398 27.3 26.1
* Cars and light commercial vehicles.
Marketing strategyIn 2008, the Bank continued to focus on supporting the marketing strategies of the Peugeot and Citroën brands, in line with its corporate mission, by further enhancing and extending its product line-up.
A sustained drive to develop new products and servicesIn all, 28 new retail financing and service products were launched during the year.
Pursuing the international roll-out of long-term leasing solutions, the Bank supported the Polish subsidiary’s corporate fleet business by adding these solutions to the subsidiary’s line-up and backing them with vehicle maintenance services.
Financing for vehicle repairs is now being offered in Belgium and Portugal, while the line-up in the new markets has been further extended with, for example, the introduction of balloon loans in Slovakia.
In the area of brand-delivered services, warranty extensions were introduced for new vehicles in Slovakia and used Citroën vehicles in Spain where this service was already available for Peugeots.
Among the services offered to private car owners, assistance insurance is now offered in Poland, loan protection insurance has been added to the line-up in Hungary and supplementary insurance solutions have extended the range of services offered by the Austrian branch.
As part of the commitment to steadily enhancing the service line-up, the Bank continued to develop its motor insurance capabilities during the year, launching offers in Hungary and for long-term leasing customers in Poland.
Additional leverage was created through the formation of captive life insurance and property & casualty insurance companies.
Stronger ties with the brands and their dealer networksWith its products and services playing a critical role in the car-buying decision, Banque PSA Finance enjoys a preferred relationship

BANQUE PSA FINANCE 2008 Annual Report 11BANQUE PSA FINANCE 2008 Annual Report
ANNUAl rEPort 11.5 - Business review
with the two brands and their dealers. This relationship fosters the development of synergies for the deployment of products tailored to the needs of different customer categories and countries. In turn, this translates into joint operations with the brands and their dealers to offer customers very attractive financing terms.
As part of this process, the Bank’s operating subsidiaries and branches are committed to strengthening their presence in dealerships, using state-of-the-art communication tools to offer training and information.
One example is the OPV point-of-sale information system, which is being steadily integrated into the brand information systems. It enables dealers to adapt their financing and service packages to each customer’s specific needs.
When combined with the Bank’s credit scoring systems, these highly efficient tools enable dealers to obtain swift decisions from the Bank. Regularly updated, they are one of the cornerstones of the high quality service line-up.
outstanding retail loans remained highOutstanding retail loans grew 0.4% to €17,913 million at December 31, 2008, reflecting the Bank’s sustained marketing performance.
oustanding loans
(in million euros) 31/12/2008 31/12/2007 % change
retail loans outstanding
Net of deferred income and allowances for credit losses 17,913 17,850 +0.4
Of which outside Western Europe 1,101 892 +23.4
oustanding loans by country
Oustanding loans at December 31, 2008 Oustanding loans at December 31, 2007
(in million euros) Wholesale loans Retail loans TOTAl Wholesale loans Retail loans TOTAl
Germany 566 2,775 3,341 639 2,636 3,275
Austria 83 205 288 91 194 285
Belux 271 753 1,024 301 721 1,022
Spain 371 2,220 2,591 592 2,283 2,875
France 1,347 7,080 8,427 1,621 6,973 8,594
Hungary 34 100 134 38 64 102
Italy 561 1,311 1,873 774 1,347 2,121
Netherlands 218 298 516 260 292 552
Poland 76 173 249 98 146 244
Portugal 134 450 584 137 443 580
United Kingdom 330 1,459 1,789 700 1,839 2,539
Slovakia 18 37 56 17 24 41
Slovenia 18 11 28
Switzerland 67 260 327 77 230 307
Czech Republic 40 114 154 44 95 139
Argentina 91 91 55 55
Brazil 215 526 742 191 460 651
Mexico 20 49 69 26 48 74
ToTal 4,370 17,913 22,283 5,606 17,850 23,456

12 BANQUE PSA FINANCE 2008 Annual Report
ANNUAl rEPort11.5 - Business review
BANQUE PSA FINANCE 2008 Annual Report
Services
Services
(number of contracts) 2008 2007 % change
Financial services 578,316 598,343 -3.3
Car insurance 197,973 173,133 +14.3
Vehicle related-services 420,383 440,627 -4.6
ToTal 1,196,672 1,212,103 -1.3
1. ➜ 5.4 Wholesale Financing
Banque PSA Finance provides financing for new and demonstration vehicles and replacement parts for the two brands’ dealer networks. In 2008, wholesale financing volumes declined due to action by the PSA Peugeot Citroën Group to reduce inventories at all of its manufacturing facilities in response to the global economic crisis.
In all, 2,055,900 vehicles were financed compared with 2,214,214 in 2007, a decrease of 7.1%. New lending for the year amounted to €35,177 million.
In addition, Sofib extended financing to several importers, mainly in Northern Europe. The company’s loan book stood at €187 million at December 31, 2008, representing a sharp drop compared to the year-earlier figure of approximately €272 million.
Average net outstanding wholesale loans, comprising financing extended to dealers and to importers, were down 3% over the year.
At the end of the year, outstanding wholesale loans for new vehicles came to €3,903 million versus €5,105 million at end-2007, representing a drop of 23.5%.
New wholesale financing
2008 2007 % change
number of vehicles 2,055,900 2,214,214 -7.1
amount (in million euros)
Vehicles 35,177 37,784 -6.9
Replacement parts 4,582 4,565 +0.4
ToTal 39,759 42,349 -6.1
Sales of services declined 1.3% overall to 1,196,672 contracts, primarily due to lower sales of financial and automobile services. Sales of motor insurance policies surged by 14.3%, however, led by the offer’s rollout in a growing number of markets, particularly in Central and Eastern Europe and Latin America. This strong performance also reflected the programs implemented in most of the country organisations to integrate motor insurance into their
service offer, with gains of 47.6% in Spain, 24% in Belgium, 18.6% in the Netherlands and 18.8% in the new markets.
In 2008, an average of 1.413 service contracts were sold for every new or used vehicle financed, rising to close to or more than 2 contracts per vehicle financed in Latin America.

BANQUE PSA FINANCE 2008 Annual Report 13BANQUE PSA FINANCE 2008 Annual Report
ANNUAl rEPort 11.5 - Business review
Wholesale outstanding loans
(in million euros) 2008 2007 % change
oustanding loans at december 31
Vehicles 3,903 5,105 -23.5
Replacement parts 467 501 -6.8
ToTal 4,370 5,606 -22.0
average oustanding 6,260 6,131 +2.1
Wholesale financing by country
(number of vehicles financed) 2008 2007 % change
Germany 213,923 219,941 -2.7
Austria 28,174 28,290 -0.4
Belgium-Luxemburg 111,322 110,365 +0.9
Spain 186,515 276,503 -32.5
France 687,446 668,210 +2.9
Hungary 15,330 15,335 -0.0
Italy 203,653 258,148 -21.1
Netherlands 77,765 78,868 -1.4
Poland 37,754 38,269 -1.3
Portugal 42,903 44,062 -2.6
United Kingdom 229,327 280,226 -18.2
Slovakia 13,025 11,876 +9.7
Slovenia 6,680 0
Switzerland 25,226 26,053 -3.2
Czech Republic 19,493 19,841 -1.8
Brazil 148,644 125,286 +18.6
Mexico 8,720 12,941 -32.6
ToTal 2,055,900 2,214,214 -7.1

14 BANQUE PSA FINANCE 2008 Annual Report
ANNUAl rEPort11.6 - results and outlook
BANQUE PSA FINANCE 2008 Annual Report
1.6 results and outlook
1. ➜ 6.1 results for the year
The economic and financial crisis severely restricted the availability of refinancing and pushed up the related cost, while also affecting the ability of individual and fleet customers to repay their loans. In this challenging environment, Banque PSA Finance ended the year with pre-tax income of €555 million, versus €607 million in 2007, and net income of €358 million.
The Bank succeeded in maintaining business volumes on a par with 2007 levels and in controlling both its refinancing costs and general operating expenses. And while the crisis clearly had an effect on customers’ ability to repay their loans, the Bank’s provision expense remained fairly low, with the credit loss ratio coming in at less than 0.50%.
Average net interest-bearing retail and wholesale loans grew by 2% over the year to €23,549 million, helping net banking revenue to withstand the effects of the higher refinancing costs observed for new lending over the last eighteen months. The contribution of finance companies outside Western Europe rose 22.1% to €1,090 million in 2008 from €893 million the previous year.
Reported net banking revenue dipped by 0.5% to €976 million in 2008, due to the €11 million net unfavourable effect of fair value adjustments. Excluding this effect, net banking revenue rose 0.6% to €987 million.
The margin on sales of services once again represented a key earnings driver, contributing €157 million to income in 2008 – an increase of 5.4% year-on-year and 26% over the past three years.
General operating expenses declined by 0.7% to €304 million, providing further evidence of the Bank’s excellent cost discipline.
Provision expense (reported in the income statement under “Cost of risk”) amounted to €98.5 million in 2008, representing 0.42% of average net outstanding loans versus 0.22% in 2007. The increase in the credit loss ratio mainly concerned the retail financing business, particularly in Spain where the worsening economic situation very quickly dampened customers’ ability to repay their loans. Non-recurring provision reversals reduced provision expense by €16 million in 2008 (see Note 32.2 to the consolidated financial statements) compared with a €27 million reduction in 2007. Excluding these items, provision expense came to €114 million in 2008 and €78 million in 2007, representing respectively 0.48% and 0.34% of average net outstanding loans. Collection resources have been increased to ensure that the growing volume of defaults experienced in a crisis environment is processed efficiently.
1. ➜ 6.2 Capital management
As a wholly-owned subsidiary of PSA Peugeot Citroën, Banque PSA Finance’s capital management strategies are closely linked to those of the Group.
The Bank’s capital adequacy ratio and other capital ratios comply with the applicable banking regulations.
1. ➜ 6.3 tier one capital
In line with the Bank’s policy of regularly increasing its Tier One capital to support business growth, at the Annual Meeting, Shareholders will be asked to approve a recommendation to reinvest 60% of net income for the year, leading to a €213 million increase in equity, and to pay out €143 million in dividends.
After taking into account the recommended appropriation of income, regulatory capital will amount to €2,593.6 million, up 2.0% on December 31, 2007. This will put the Bank’s European capital adequacy ratio at 11.23% versus 10.36% at December 31, 2008.

BANQUE PSA FINANCE 2008 Annual Report 15BANQUE PSA FINANCE 2008 Annual Report
ANNUAl rEPort 11.7 - refinancing policy
1. ➜ 6.4 outlook
While it is difficult to predict how long the current crisis will last and how deep its effects will be, Banque PSA Finance’s core strengths should ensure that it continues to deliver satisfactory marketing and financial performance in line with the PSA Peugeot Citroën Group’s expectations.
The Bank has a comprehensive range of diversified financing •products and services that are aligned both with its host markets and the specific needs of its individual and corporate customers.
Working with the brands and their dealer networks, it has •developed and deployed state-of-the-art communication tools.
It is a preferred partner of the brands and maintains close ties •with their dealer networks in France and abroad.
It has developed effective automated risk selection systems •that are overseen and regularly updated by its expert teams. These systems allow the Bank to align its risk acceptance criteria with the economic environment.
It uses up-to-the-minute, efficient collection systems to speed •the recovery of past-due payments.
Its competent, highly dedicated teams are ready and able to •deal with both the current difficulties and any future challenges that may arise.
1.7 refinancing policy
Banque PSA Finance has a capital base in line with regulatory requirements. Each year, a significant proportion of the year’s net income is transferred to reserves, leading to robust regulatory ratios that reflect the quality of the asset base.
Its refinancing strategy consists of diversifying liquidity sources as broadly as possible, matching the maturities of assets and liabilities, and hedging all of its exposure to currency and interest rate risks. The Bank also endeavours to maintain a liquidity cushion
in the form of permanent liquidity reserves and undrawn confirmed syndicated lines of credit.
This strategy enabled the Bank to finance its operations during last year’s turmoil in the financial markets without significantly weakening its liquidity position. This was particularly the case from September onwards when the banking and financial crisis deepened.
1. ➜ 7.1 diversifying sources of financing
The Bank’s refinancing strategy focuses on consistently maintaining a good balance among the various sources of financing. At December 31, 2008, for example, 40% of financing was provided by bank facilities, 39% by the capital markets and 21% by loan securitisations.
During the year, bank borrowings were increased to compensate for the lack of opportunities in the bond market. The Bank’s leading banks actively supported both the rollover of its confirmed medium-term lines of credit and the continued regular drawdowns
on its short-term bank lines. These facilities’ maturities and spreads were adjusted on rollover to reflect the banks’ cost of liquidity and certain unconfirmed lines were converted into confirmed lines. At December 31, 2008, bank borrowings totalled €8,541 million versus €7,479 million one year earlier, including drawdowns of €6,426 million on confirmed lines of credit versus €4,420 million.
Issuance under the Banque PSA Finance and PFI NV EMTN programs was low in 2008, due to the complete absence of investor interest over several months, particularly for bank paper,

16 BANQUE PSA FINANCE 2008 Annual Report
ANNUAl rEPort11.7 - refinancing policy
BANQUE PSA FINANCE 2008 Annual Report
and the flight to quality triggered by the steady stream of bad news from the financial crisis. Just €1,034 million worth of EMTNs were issued, while bond issues by Banque PSA Finance were scaled back to €5,064 million from €7,711 million in 2007.
The decline in capital markets issuance was partly offset by a new €1,000 million securitisation of German automobile loans that was placed in the market during July. The securitisation programs were not affected by the credit crisis; there was no decline in the credit
quality of the underlying loans and no evidence of any weaknesses in the way the programs are structured.
In the fourth quarter, the Bank obtained €446 million in financing from Société de Financement de l’Économie Française, the institution set up by the French government to inject cash into the economy. The financing has a two-year maturity for the most part and is secured by French retail and wholesale loan portfolios.
sources of refinancing • (in million euros)
(except non-drawn confirmed bank credit)
capital Markets • (in million euros)
1. ➜ 7.2 liquidity reserves
In 2008, the second year of the financial crisis, Banque PSA Finance sought to strike an appropriate balance between paying the higher financing costs generated by widening credit spreads and safeguarding its liquidity position.
The liquidity reserves helped the Bank to withstand the effects of the credit crunch without overly eroding its liquidity position and without incurring the significant additional costs generated by the considerable increase in lender’s credit margins.
At December 31, 2008, 75% of refinancing had an initial maturity of twelve months or more (versus 68% at end-2007), representing continued solid coverage of potential liquidity risk.
The maturities of refinancing comfortably exceed the maturities of the retail financing loan book.
In addition to these borrowings, the Bank has €6,000 million worth of undrawn syndicated lines of credit that were refinanced in 2007
and now consist of three €2,000 million backup facilities obtained from two syndicates of leading banks, maturing in July 2010, June 2012 and June 2014.
In all, the Bank has access to sufficient financing to cover over six months’ worth of wholesale and retail loan originations based on a constant loan book.
The Bank has various solutions whose implementation is not expected to be affected by the current financial environment. These solutions include:
Rolling over existing bank lines of credit on expiry, •
Launching new automobile line securitization programs in •certain countries, particularly in connection with central bank cash injections
Long-term capital markets issues, if necessary. •

BANQUE PSA FINANCE 2008 Annual Report 17BANQUE PSA FINANCE 2008 Annual Report
ANNUAl rEPort 11.8 - Capital Markets program ratings and Issuer Financial Strength ratings
Liquidity reserves in the form of immediately realizable assets were kept at more than €1 billion throughout the year, although they declined to €1,176 million at December 31, 2008 due to the increased difficulty of rolling over short-term facilities.
1.8 Capital Markets program ratings and Issuer Financial Strength ratings
On October 30, 2008, Moody’s Investor Services placed Banque PSA Finance’s A3 long-term ratings on review and affirmed the P-2 short-term rating. The announcement follows the agency’s decision on October 27, 2008, to downgrade Peugeot S.A.’s long-term rating from Baa1 to Baa2 and to change the outlook from negative to stable.
On February 3rd, 2009, Standard & Poor’s placed the Bank’s A- long-term rating and A-2 short-term rating on review. The decision followed the announcement on the same day that the agency placed Peugeot S.A.’s BBB+ long-term rating and A-2 short-term rating, on review.
➜ 1.8.1 Capital markets programs
Visit www.banquepsafinance.com to find out more about Banque PSA Finance’s debt issuance programs, program documentation, credit rating and outstandings. Information is updated monthly.
Credit Rating Issuer (active programs) Type Limit at December 31, 2008 Utilised at December 31, 2008
s&P Moody’s short-term (in millions)
a2 P2 Banque PSA Finance CD EUR4,000 EUR1,948
a2 P2 Sofira BT EUR1,800 EUR1,348
long-term
a- a3 Banque PSA Finance BMTN EUR1,000 EUR10
a- a3 Banque PSA Finance (and PFI NV) EMTN EUR14,000 eur5,656 (1)
(1) Excluding accrued interest and debt issuance costs; including €985 million in intragroup financing eliminated in consolidation.

18 BANQUE PSA FINANCE 2008 Annual Report
ANNUAl rEPort11.9 - Financial risk Management
BANQUE PSA FINANCE 2008 Annual Report
1.9 Financial risk Management
1. ➜ 9.1 Currency risk
Banque PSA Finance does not take operational currency positions. The assets and liabilities of each entity are matched through the use – where necessary – of appropriate financial instruments. Structural currency positions (investments in subsidiaries and branches’ dotation capital) and future profits and losses are not
hedged using derivative financial instruments. As the businesses of subsidiaries and branches will, by definition, continue for an indefinite period, any such hedges would represent long-term open positions. At December 31, 2008, the structural currency position amounted to €375 million.
1. ➜ 9.2 Interest rate risk
general policy: The Bank’s policy consists of neutralizing the effect of changes in interest rates on each entity’s recurring operating income by using appropriate financial instruments to match interest rate structures of assets and liabilities.
interest rate risk management: Implementation of this policy is supervised by the Refinancing Committee. Interest rate risks on outstanding loans are attenuated through an assertive hedging policy, with a 3% ceiling on unhedged exposures (by country and by half-yearly maturity band) arising from the difficulty of precisely matching loan balances with the notional amounts of derivatives. The Bank’s average annual sensitivity to a 1-point increase in interest rates remained below €4 million throughout the year.
sensitivity to a 1-point increase in interest rate •(in million euros)
fair value hedges: Concerning assets, fixed rate instalment loans are either hedged by interest rate swaps that are purchased on the market as soon as the financing is granted or – in countries where there is no liquid market for interest rate instruments – financed by fixed rate debt. In practice, the swaps are purchased at ten-day intervals. Wholesale financing is granted at rates based on short-term market rates, while the liquidity reserve is invested at the same rates. This fair value hedging strategy means that all of the Bank’s interest-bearing assets are at short-term rates.
Concerning liabilities, all new interest-bearing debt is converted to a rate based on a 3-month benchmark using appropriate hedging instruments.
These management techniques serve to neutralize interest rate risks on the Bank’s balance sheet.
cash flow hedges: In order to cap the refinancing cost of new retail financing, the Bank purchased swaptions (options on interest rate swaps) on several occasions starting from September 2004. The swaptions hedged part of the Bank’s new lending for 2008 and generated a gain for the year of €24.4 million. In light of the decline in interest rates since last summer, this hedging strategy has been discontinued and no swaptions were outstanding at December 31, 2008.

BANQUE PSA FINANCE 2008 Annual Report 19BANQUE PSA FINANCE 2008 Annual Report
ANNUAl rEPort 11.7 - refinancing policy
1. ➜ 9.3 Counterparty risk
Banque PSA Finance is consistently in a net borrower position.
As a result, its exposure to counterparty risk is limited to the investment of the liquidity reserve and other cash balances, and to the use of derivatives (swaps and swaptions) to hedge interest rate and currency risks.
The liquidity reserve and other cash balances are invested in money market securities and in mutual funds with a capital guarantee and guaranteed yields issued and managed by leading banks.
An internal rating is assigned to each counterparty, based on issuer financial strength and capital adequacy analyses. These ratings are used to set exposure limits. Exposure limits cover both amounts and periods, by counterparty and by type of transaction (investments and derivatives). Actual exposures are checked and compared with the corresponding limits on a daily basis.
Derivatives are governed by standard ISDA or FBF agreements and contracts with the most frequently used counterparties provide for regular margin calls. Counterparties for derivatives contracts are all rated A or higher.
1. ➜ 9.4 Concentration of Credit risks
The Bank pays close attention to maintaining concentrations of credit risk within limits considered internally as being acceptable, which are below the regulatory limits.
At December 31, 2008, risk-weighted assets corresponding to loans to PSA Peugeot Citroën Group entities totalled €324 million or 1.45% of customer loans and 12.5% of regulatory capital.
Risk-weighted assets corresponding to the ten largest external exposures amounted to €766 million (financial counterparties: €337 million and dealer networks: €429 million), representing 3.3% of total risk-weighted assets.
top ten risk-weighted exposures to credit risk •(in million euros)
(excluding financing extended to PSA Peugeot Citroën Group entities)

20 BANQUE PSA FINANCE 2008 Annual Report
ANNUAl rEPort11.10 - Credit risk Management
BANQUE PSA FINANCE 2008 Annual Report
1.10 Credit risk Management
Provision expense for 2008 – reported in the income statement under “Cost of risk” – stood at €98.5 million or 0.42% of average net outstanding loans, versus €51.3 million and 0.22% the previous year. In the rapidly worsening economic environment in a majority of countries, the credit loss ratio – although significantly higher – remained satisfactory at below 0.50% for the eleventh year running.
Provision expense for 2008 is stated net of non-recurring items for a net amount of €16 million. In the United Kingdom, recoveries on bad debts of €6.4 million were recorded, corresponding to VAT refunded on loans written off in prior periods for their amount including tax. An amount of €8 million was reversed from provisions for loan losses due to the overstatement of these provisions caused by discounting adjustments to loss given default (LGD). Lastly, recoveries on bad debts of €3.6 million were recorded, corresponding to sales of loans that had been written down in full. These gains were partly offset by adjustments to probabilities of default and loss rates which led to a €1.9 million increase in provisions. In 2007, non-recurring items comprised provision
reversals and recoveries on loans written off in prior periods for a total of €27 million. Excluding these items, the credit loss ratio was 0.48% in 2008 versus 0.34% in 2007, with provision expense amounting to €114 million in 2008 compared with €78 million the previous year, an increase of some €36 million.
Retail financing provision expense, excluding non-recurring items, was €22 million higher, of which €16 million concerned Spain. Wholesale financing provision expense was up by €9 million.
The Bank has tightened up its loan acceptance criteria and bolstered its collections resources in response to the worsening economic situation.
Its tried and tested, structured organisation is supported by powerful management systems deployed at all units in Western Europe. In Central Europe and Latin America, the Bank has outsourced credit risk management to its strategic partners, while participating in overseeing the processes through its own local units.
1.10.1 ➜ retail credit risk management
Retail loan acceptance processes are based on a credit scoring system that is managed and overseen by a dedicated expert unit at the Bank’s headquarters. To enhance its effectiveness, the scoring system is adapted according to the specific characteristics of each local market. The headquarters-based credit risk control unit regularly assesses the credit scoring system’s effectiveness, working closely with the operating units in France and abroad.
The collection system uses shared applications deployed in the main European countries to automatically resubmit the first rejected
payments and manage dunning calls. The payment resubmission applications are maintained by the Bank’s headquarters teams, while dunning call management applications are run by national or regional platforms. For example, the Eastern platform set up in 2008 covers France, Germany, the United Kingdom, Austria and Poland, and the Southern platform covers Spain, Portugal and Italy. These platforms receive real-time assistance and support from the headquarters team tasked with overseeing all collection operations.
1. ➜ 10.2 Wholesale and Fleet credit risk management
Reporting to the Risk Management Department, the “Wholesale and Fleet” unit is responsible for controlling wholesale and fleet credit risks. It uses for this purpose the wholesale and fleet customer credit rating systems, which determine discretionary lending limits and define clear risk management and control rules.
The systems’ effectiveness is underpinned by high quality credit analyses performed by local units and headquarters teams, as well as by warning systems designed to ensure that incurred risks are identified and dealt with on a timely basis.

BANQUE PSA FINANCE 2008 Annual Report 21BANQUE PSA FINANCE 2008 Annual Report
ANNUAl rEPort 11.11 - Internal Control
Cost of risks average outstandings
France International TOTAl
(in million euros) Amount Rate (in %) Amount Rate (in %) Amount Rate (in %)
2008
retail financing 30.3 0.47 51.2 0.47 81.5 0.47
New vehicles 22.6 0.46 42.3 0.48 64.9 0.47
Used vehicles 4.8 0.39 8.9 0.44 13.7 0.42
Direct customers 2.9 1.53 0.0 0.00 2.9 1.53
Wholesale financing 3.6 0.16 13.4 0.34 17.0 0.27
ToTal 33.9 0.39 64.6 0.43 98.5 0.42
2007
retail financing 18.6 0.30 24.6 0.23 43.2 0.26
New vehicles 9.5 0.20 17.5 0.20 27.0 0.20
Used vehicles 6.4 0.52 7.1 0.39 13.5 0.45
Direct customers 2.7 1.38 0.0 0.00 2.7 1.38
Wholesale financing 1.0 0.04 7.1 0.18 8.1 0.13
ToTal 19.6 0.23 31.7 0.22 51.3 0.22
1. ➜ 10.3 Basel II
In 2008, the Bank continued to work extensively to improve the reliability of its Basel II risk databases and the performance of its risk indicator calculation models, for both corporate and retail exposures. It also fine-tuned its prudence margins and conducted model back-testing exercises. The Basel II project was audited
during 2008 by the Banque de France, which conducted additional audit procedures in January 2009 that have now been completed. These audits were part of the process for supervisory approval of the Bank’s use of the IRBA and IRB approaches.
1.11 Internal Control
In line with CRBF regulation 97-02, dealing with internal control systems of credit institutions, the Bank’s internal control system is organised around two lines of responsibility – for recurring controls and periodic controls – and the first-tier controls performed by the operating units.
The fundamental principles underpinning the organisation and implementation of internal control are set out in an internal control charter that describes the system’s organisation, resources, scope, missions and processes.

22 BANQUE PSA FINANCE 2008 Annual Report
ANNUAl rEPort11.11 - Internal Control
BANQUE PSA FINANCE 2008 Annual Report
1.1 ➜ 1.1 recurring controls
First-tier controls, the lynchpin of the internal control systemFirst-tier controls are either embedded in procedures and performed by all employees in the normal course of their work, or they are performed by dedicated employees within the operating units. They are supervised by the structures responsible for recurring controls.
Second-tier controlsSecond-tier controls include compliance controls and controls over operational risks within the finance companies and corporate units, including those arising from services performed by the PSA Peugeot Citroën Group on the Bank’s behalf.
the compliance unit is responsible for preventing, controlling and overseeing compliance risks.
In 2008, the Compliance unit focused on:
continuing to train staff in compliance risks, particularly the •prevention of money laundering and the financing of terrorism, and the protection of personal data;
deploying controls to help prevent money-laundering and the •financing of terrorism and improving the related systems and processes;
monitoring regulatory changes more closely across the entire •business.
controls over operational risks include:
r • ecurring assessments of the effectiveness of controls over operational risks within the Bank, including for outsourced services;
s • pecific second-tier controls, performed across the entire organisation.
In 2008, the focus was on assessing recurring controls over the subsidiaries’ and branches’ operational risks, as identified during the Banque PSA Finance risk mapping process.
The department set up in the fourth quarter of 2007 to control operational risks associated with accounting, IT, refinancing and treasury processes gradually extended its activities during 2008. A significant proportion of the department’s time was devoted to supporting the upgrading of internal control processes within the PSA Peugeot Citroën Group’s Financing and Treasury Department, which is responsible for the Bank’s refinancing.
Alongside the risk mapping approach, a system to monitor first-tier recurring controls was implemented from the second half of 2008. It consists of a quarterly reporting system designed to inform the Bank’s executive management of the extent to which operational risks are controlled within the various units.
risk Management functionThe Risk Management unit of the Management Control Department is responsible for measuring and overseeing the Bank’s financial risks on a consolidated basis and participating in their overall management.
The second and third pillars of Basel II are currently being incorporated into the Bank’s risk management system.
1.1 ➜ 1.2 Periodic controls
Periodic – or third-tier – controls consist of periodically checking transaction compliance, risk levels, compliance with procedures and the effectiveness of recurring controls.
They are performed by the internal auditors, based on an internal audit plan that provides for all of the Bank’s units and processes (including those that are outsourced) to be audited at least once every three years.

BANQUE PSA FINANCE 2008 Annual Report 23BANQUE PSA FINANCE 2008 Annual Report
ANNUAl rEPort 11.11 - Internal Control
1.1 ➜ 1.3 oversight by executive management and the Board
The internal control system is overseen by executive management and the Board, supported by various committees.
The Board of Directors ensures that the Bank’s main risks are properly managed and obtains assurance about the system’s reliability, through the Audit Committee. The Audit Committee reviews the lessons to be learnt from risk monitoring activities and from recurring and periodic controls. It met four times in 2008.
Executive management is responsible for defining and implementing the system of internal control. It oversees the system’s efficiency and effectiveness, and ensures that adequate resources are assigned to internal control. It is supported in this task by a Control Committee, which has front-line responsibility for the operational management of the internal control system.
1.1 ➜ 1.4 organisation of internal control
The internal control system is built around regular first-tier controls backed by an organisation structure in which each individual’s authority and responsibilities are clearly defined, primarily through delegations of authority applicable to all operating units and corporate departments. These delegations of authority determine the levels at which decisions must be made in the areas of banking and financial transactions, loan approvals, lending terms, new products and services and expenditure commitments.
At the beginning of 2008, the system of dual signatures for banking and financial transactions was stepped up and extended to executive directors.
At Group level, committees have been set up to determine and implement Bank policies in the areas of internal control and
decision-making processes during regular meetings. These committees are as follows:
the Credit Risks Committee, which monitors changes in •troubled loans and credit losses, and analyzes the performance of the risk selection systems;
the Lending Margins Committee; •
the Products and Processes Committee; •
the Group Credit Committee, which reviews wholesale and •fleet financing applications;
the Refinancing Committee, which reviews the results of the •Bank’s refinancing and interest rate risk management policies;
the IT Security Committee; •
the Compliance Committee. •

24 BANQUE PSA FINANCE 2008 Annual Report
ANNUAl rEPort11.12 - Banque pSa Finance in 2008
1.1 ➜ 2.1 Proposed resolutions
At the Annual Meeting, shareholders will be asked to approve the financial statements of the Bank and the Group, as presented, and to set the 2008 dividend at €12.90 per share. If approved, the dividend will be paid as from 21 April 2009.
Shareholders will also be asked to approve the Auditors’ special report on related party agreements.
1.1 ➜ 2.2 ordinary resolutions
First resolution
Approval of the Management Report and the financial statements of the BankThe Annual Meeting, having considered the financial statements of the Bank, the Board of Directors’ Management Report for 2008 and the Auditors’ report, approves the Board of Directors’ Management Report in its entirety.
The Annual Meeting approves the financial statements of the Bank for 2008, which show net income of €359,614,132.37.
Second resolution
Approval of the consolidated financial statementsThe Annual Meeting, having considered the consolidated financial statements of the Banque PSA Finance Group, as well as the Board of Directors’ comments and the Auditors’ report on the consolidated financial statements, approves the consolidated financial statements for 2008 as presented.
third resolution
Appropriation of incomeThe Annual Meeting notes that income available for distribution, consisting of net income for the year of €359,614,132.37 and retained earnings of €629,592,943.96 brought forward from the previous year, amounts to €989,207,076.33.
The Annual Meeting resolves to appropriate income available for distribution as follows:
- To the payment of a dividend €143,035,200.00
- Of which dividends paid out of reserves €6,770,768.98
- To retained earnings €852,942,645.31
The dividend of €12.90 per share will be paid after the Annual Meeting on 21 April 2009.
The Annual Meeting notes that dividends for 2004, 2005, 2006 and 2007 amounted to €8.62, €14.50, €14.10 and €15.10 respectively. The 2004 dividend qualified for a 50% tax rebate, and the 2005, 2006 and 2007 dividends for a 40% tax rebate.
Fourth resolution
Approval of the Auditors’ special report on related party agreements
The Annual Meeting, having considered the Auditors’ special report on related party agreements, approves said report.
1.12 Banque pSa Finance in 2008
In 2008, Banque PSA Finance – the Group’s parent company – reported net income of €359,614,132.37. Its income statement is presented and discussed in the appendix to this report.

25BANQUE PSA FINANCE 2008 Annual Report
TITRE 1
2 Consolidated finanCial statements for the years ended deCember 31, 2008 and 2007
2.1 Consolidated balance sheet 27
2.2 Consolidated statement of income 28
2.3 Consolidated statement of changes in equity attributable to equity holders of the parent and minority interests 29
2.4 Consolidated statement of cash flows 31
Notes to the consolidated financial statements for the years ended December 31, 2008 and 2007 32

26 BANQUE PSA FINANCE 2008 Annual Report
CoNSolIdAtEd FINANCIAl StAtEmENtS For thE yEArS ENdEd dECEmBEr 31, 2008 ANd 20072Statutory auditors’ report on the consolidated financial statementst
BANQUE PSA FINANCE 2008 Annual Report
Statutory auditors’ report on the consolidated financial statements
For the year ended December 31, 2008 ➜
This is a free translation into English of the statutory auditors’ report issued in French and is provided solely for the convenience of English speaking users.
The statutory auditors’ report includes information specifically required by French law in such reports, whether qualified or not. This information is presented
below the opinion on the consolidated financial statements and includes an explanatory paragraph discussing the auditors’ assessments of certain significant
accounting and auditing matters. These assessments were considered for the purpose of issuing an audit opinion on the consolidated financial statements taken
as a whole and not to provide separate assurance on individual account captions or on information taken outside of the consolidated financial statements.
This report should be read in conjunction with, and construed in accordance with, French law and professional auditing standards applicable in France.
I - opinion on the consolidated financial statements
We conducted our audit in accordance with professional standards applicable in France. Those standards require that we plan and perform the audit to obtain reasonable assurance about whether the consolidated financial statements are free of material misstatement. An audit includes examining, on a test basis or on other selection method, evidence supporting the amounts and disclosures in the financial statements. An audit also includes assessing the accounting principles used and significant estimates made by management, as well as evaluating the overall consolidated financial statements presentation. We believe that our audit provides a reasonable basis for our opinion.In our opinion, the consolidated financial statements give a true and fair view of the assets and liabilities and of the financial position of the Group as at December 31, 2008 and of the results of its operations for the year then ended in accordance with IFRS as adopted by the European Union.
II - Justification of our assessments
III - Specific verification
In accordance with professional standards applicable in France, we have also verified the information given in the Group’s management report. We have no matters to report as to its fair presentation and its consistency with the consolidated financial statements.
Neuilly-sur-Seine Paris, February 10, 2008
The Statutory AuditorsPricewaterhousecoopers Audit
Patrice MorotMazars
Herve Helias
To the Shareholders
Following our appointment as statutory auditors by your Annual General Shareholders’ Meeting, we present to you our report on :
the audit of the accompanying consolidated financial statements of Banque PSA Finance for the year ended December 31, 2008; •
the justification of our assessments; •
the specific verification. •
The consolidated financial statements have been approved by the Board of Directors. Our responsibility is to express an opinion on these financial statements based on our audit.
In accordance with the requirements of article L.823-9 of the French Commercial Code (Code de commerce) relating to the justification of our assessments, we bring to your attention the following matter: for all companies with banking operations and specifically in the current financial crisis context, significant accounting estimates have to be used when provisioning for credit risks. Banque PSA Finance sets aside provisions to cover credit risks that are inherent to its business (Note 2 par C.6.3). As part of our assessment of theses estimates, we have examined the control procedures used for monitoring credit risks, for assessing the risk of non-recovery, and for covering these risks by provisions.
These assessments were made in the context of our audit of the consolidated financial statements taken as a whole, and therefore contributed to the opinion we formed which is expressed in the first part of this report.

BANQUE PSA FINANCE 2008 Annual Report 27BANQUE PSA FINANCE 2008 Annual Report
CoNSolIdAtEd FINANCIAl StAtEmENtS For thE yEArS ENdEd dECEmBEr 31, 2008 ANd 2007 22.1 - Consolidated balance sheet
2.1 Consolidated balance sheet(in million euros) Dec. 31, 2008 Dec. 31, 2007
Assets
Cash, central banks, post office banks (Note 3) 9 21
Financial assets at fair value through profit or loss (Note 4) 1,159 3,396
Hedging instruments (Note 5) 526 201
Available-for-sale financial assets (Note 6) 12 3
Loans and advances to credit institutions (Note 7) 1,340 927
Customer loans and receivables (Notes 8 and 34) 22,283 23,456
Fair value adjustments to finance receivables portfolios hedged against interest rate risks (Note 9) 213 (63)
Held-to-maturity investments - -
Current tax assets 35 37
Deferred tax assets 66 28
Accruals and other assets (Note 10) 495 502
Investments in associates and joint ventures 14 12
Property and equipment (Note 11) 41 44
Intangible assets (Note 11) 96 94
Goodwill (Note 12) 81 81
ToTal asseTs 26,370 28,739
(in million euros) Dec. 31, 2008 Dec. 31, 2007
Equity and liabilities
Central banks, post office banks - -
Financial liabilities at fair value through profit or loss (Note 13) - 201
Hedging instruments (Note 14) 419 113
Deposits from credit institutions (Notes 15 and 34) 8,536 7,479
Due to customers (Note 16) 260 321
Debt securities (Notes 17 and 34) 13,005 16,688
Fair value adjustments to debt portfolios hedged against interest rate risks (Note 18) 25 (28)
Current tax liabilities 27 55
Deferred tax liabilities 442 356
Accruals and other liabilities (Note 19) 678 598
Provisions (Note 20) 54 56
Subordinated debt - -
Equity 2,924 2,900
- Equity attributable to equity holders of the parent 2,908 2,888
- Share capital 177 177
- Capital in excess of par value of stock 332 332
- Reserves 2,025 1,929
- Unrealised or deferred gains and losses 18 32
- Net income for the year 356 418
- Minority interests 16 12
ToTal equiTy and liabiliTies 26,370 28,739

28 BANQUE PSA FINANCE 2008 Annual Report
CoNSolIdAtEd FINANCIAl StAtEmENtS For thE yEArS ENdEd dECEmBEr 31, 2008 ANd 200722.2 - Consolidated statement of income
BANQUE PSA FINANCE 2008 Annual Report
2.2 Consolidated statement of income(in million euros) Dec. 31, 2008 Dec. 31, 2007
Net interest revenue on customer transactions 1,910 1,763
- Interest and other revenue on assets at amortised cost (Note 25) 1,736 1,601
- Fair value adjustments to finance receivables hedged against interest rate risks (Note 21) 276 34
- Net interest revenue from hedging instruments (Note 26) 122 107
- Fair value adjustments to hedging instruments (Note 21) (285) (30)
- Interest expense on customer transactions (Note 27) (7) (5)
- Other revenue and expense (Note 28) 68 56
Net investment revenue 99 121
- Interest and dividends on marketable securities 64 54
- Fair value adjustments to assets valued using the fair value option (Note 21) (1) (5)
- Gains and losses on sales of marketable securities 36 73
- Business acquisition costs - (1)
Net refinancing cost (1,194) (1,055)
- Interest and other revenue from loans and advances to credit institutions 34 23
- Interest on deposits from credit institutions (Note 29) (445) (330)
- Interest on debt securities (Note 30) (710) (671)
- Expenses related to financing commitments received (Note 24) (6) (6)
- Fair value adjustments to financing liabilities hedged against interest rate risks (Note 21) (52) (12)
- Interest on hedging instruments (58) (60)
- Fair value adjustments to hedging instruments (Note 21) 52 10
- Fair value adjustments to financing liabilities valued using the fair value option (Note 21) (1) 2
- Debt issuing costs (8) (11)
Net gains and losses on trading transactions 4 3
- Interest rate instruments - -
- Currency instruments 4 3
Margin on sales of services 157 149
- Revenues 184 175
- Expenses (27) (26)
Net banking revenue (Note 34) 976 981
General operating expenses (Notes 31 and 34) (305) (307)
- Personnel costs (130) (132)
- Other general operating expenses (175) (175)
Depreciation and amortisation (15) (15)
Gains and losses on disposals of fixed assets (1) -
Gross operating income 655 659
Cost of risk (Notes 32 and 34) (98) (51)
Operating income (Note 34) 557 608
Share of net income of companies accounted for by the equity method - -
Impairment on goodwill - -
Interest cost on pension obligations (3) (3)
Expected return on external pension funds 2 2
Other non-operating items (1) -
Pre-tax income 555 607
Income taxes (Note 33) (197) (186)
neT income for The year 358 421
- of which minority interests 2 3
- of which attributable to equity holders of the parent 356 418
Earnings per share (in €) 32.1 37.7

BANQUE PSA FINANCE 2008 Annual Report 29BANQUE PSA FINANCE 2008 Annual Report
CoNSolIdAtEd FINANCIAl StAtEmENtS For thE yEArS ENdEd dECEmBEr 31, 2008 ANd 2007 22.3 - Consolidated statement of changes in equity attributable to equity holders of the parent and minority interests
2.3 Consolidated statement of changes in equity attributable to equity holders of the parent and minority interests
(in million euros)
Share capital and other reserves Reserves
Deferred gains and losses
Profit attributable
to equity holders of the parent
Equity attributable
to equity holders of the parent
Minority interests
Total equity
Share capital
Capital in
excess of par
value of stock (1)
Treasury stock Reserves
Translation reserve
Revaluation reserve
Deferred gains and losses on financial
instruments (2) (3)
Equity at December 31, 2006 177 332 - 1,718 - - 30 390 2,647 10 2,657
Appropriation of prior-year income 234 (390) (156) - (156)
Income for the year - 418 418 3 421
Unrealised or deferred gains or losses (3) - - - 3 3 - 3
Deferred taxes on unrealised or deferred gains or losses - - - (1) (1) - (1)
Translation adjustments (23) (23) (1) (24)
Comprehensive income for the period* 399
Equity at December 31, 2007 177 332 - 1,929 - - 32 418 2,888 12 2,900
Effect of changes in group structure (4) - - 3 3
Capital increase (5) - - 3 3
Appropriation of prior-year income 251 (418) (167) (3) (170)
Income for the period - 356 356 2 358
Unrealised or deferred gains or losses (3) - - - (21) (21) - (21)
Deferred taxes on unrealised or deferred gains or losses - - - 7 7 - 7
Translation adjustments (155) (155) (1) (156)
Comprehensive income for the period* 188
equiTy aT december 31, 2008 177 332 - 2,025 - - 18 356 2,908 16 2,924
* Comprehensive income for the period comprises all the changes in equity arising from transactions with parties other than stockholders. Share capital amounts to €177 million, made up of 11,088,000 common shares, all fully paid. There were no changes in capital during the period.(1) Including Banque PSA Finance share premiums and legal reserve.(2) Including fair value adjustments to cash flow hedges.(3) The intrinsic value of swaptions at maturity is recognised over the life of the corresponding external swap purchased as a hedge of outstanding loans (fair value hedge). The income
recognised during the period ended December 31, 2008 amounted to €32,5 million (see table in Note 21.2).(4) The Slovenian subsidiary BPF Financiranje d.o.o., created in January 2008 and 50%-owned by Banque PSA Finance, has joined the list of consolidated companies.(5) $9.6 million (€6.2 million) capital increase by PSA Finance Argentina, 50%-owned by Banque PSA Finance.

30 BANQUE PSA FINANCE 2008 Annual Report
CoNSolIdAtEd FINANCIAl StAtEmENtS For thE yEArS ENdEd dECEmBEr 31, 2008 ANd 200722.3 - Consolidated statement of changes in equity attributable to equity holders of the parent and minority interests
BANQUE PSA FINANCE 2008 Annual Report
In accordance with the Amendment to IAS 1 - Presentation of Financial Statements - Capital Disclosures, the necessary information is given in the paragraph “Capital Management” on page 14 of the management report.
Consolidated regulatory capital calculated in accordance with regulation 90-02 of the Comité de la Réglementation Bancaire et Financière:
(in million euros) Dec. 31, 2008 Dec. 31, 2007 Dec. 31, 2006
Tier 1 capital
Consolidated equity 2,924 2,900 2,657
Unrealised capital gains on cash flow hedges (18) (32) (30)
Proposed dividend, PSA Peugeot Citroën Group (143) (167) (156)
Proposed dividend, minority interests - - -
Intangible assets (63) (61) (57)
Goodwill (81) (81) (81)
Other equity included in regulatory capital with the approval of the French banking regulator (Commission Bancaire) (1) - (1) 1
Total Tier 1 capital 2,619 2,558 2,334
Tier 2 capital
Subordinated debt - - -
Equity interests in credit institutions (26) (15) (13)
Guarantees granted to SPVs - - -
Total Tier 2 capital (26) (15) (13)
regulaTory capiTal 2,593 2,543 2,321
(1) Under Instruction 2006-01 of January 27, 2006, equity must be adjusted for the «internal credit risk» associated with debt measured using the fair value option. This debt was repaid in November 2008. At December 31, 2007, the cumulative impact of the change in issuer spread on this debt was an unrealised profit of €0.5 million net of tax. This amount was neutralised in equity.

BANQUE PSA FINANCE 2008 Annual Report 31BANQUE PSA FINANCE 2008 Annual Report
CoNSolIdAtEd FINANCIAl StAtEmENtS For thE yEArS ENdEd dECEmBEr 31, 2008 ANd 2007 22.4 - Consolidated statement of cash flows
2.4 Consolidated statement of cash flows
(in million euros) Dec. 31, 2008 Dec. 31, 2007
INCOME ATTRIBUTABLE TO EqUITy HOLDERS OF BANqUE PSA FINANCE 356 418
Minority interests in income of subsidiaries 2 3
Change in depreciation, amortisation and other provisions 16 11
Change in deferred taxes 63 38
CASH FLOw 437 470
Increase/decrease in:
- loans and advances to credit institutions (85) (3)
- deposits from credit institutions 1,843 931
Change in customer loans and receivables 66 (779)
Increase/decrease in:
- amounts due to customers (57) 23
- financial assets at fair value through profit or loss 2,223 (499)
- financial liabilities at fair value through profit or loss (49) (7)
- hedging instruments (17) (54)
- debt securities (3,817) 701
Change in other operating assets (18) (148)
Change in other operating liabilities 59 (122)
Net cash provided by operating activities 585 513
Acquisitions of subsidiaries (12) (3)
Purchases of fixed assets (26) (28)
Proceeds from disposals of fixed assets 12 10
Effect of changes in scope of consolidation 6 1
Net cash used by investing activities (20) (20)
Dividends paid to PSA Peugeot Citroën Group (167) (157)
Dividends paid to minority interests (3) -
Capital increase 3 -
Net cash used by financing activities (167) (157)
Effect of changes in exchange rates (64) (12)
Net change in cash and cash equivalents 334 324
Cash and cash equivalents at beginning of year 944 620
Cash, central banks, post office banks 21 43
Current account advances and loans and advances at overnight rates 923 577
cash and cash equivalents at end of period 1,278 944
Cash, central banks, post office banks 9 21
Current account advances and loans and advances at overnight rates 1,269 923

32 BANQUE PSA FINANCE 2008 Annual Report
CoNSolIdAtEd FINANCIAl StAtEmENtS For thE yEArS ENdEd dECEmBEr 31, 2008 ANd 20072notes to the consolidated financial statements for the years ended december 31, 2008 and 2007
BANQUE PSA FINANCE 2008 Annual Report
Note 1 Group structure 33
Note 2 Accounting policies 35
Note 3 Cash, central banks, post office banks 41
Note 4 Financial assets at fair value through profit or loss 42
Note 5 Hedging instruments (assets) 42
Note 6 Available-for-sale financial assets 43
Note 7 Loans and advances to credit institutions 43
Note 8 Customer loans and receivables 44
Note 9 Fair value adjustments to finance receivables portfolios hedged against interest rate risks 46
Note 10 Accruals and other assets 47
Note 11 Property and equipment and intangible assets 47
Note 12 Goodwill 48
Note 13 Financial liabilities at fair value through profit or loss 48
Note 14 Hedging instruments (liabilities) 49
Note 15 Deposits from credit institutions 49
Note 16 Due to customers 50
Note 17 Debt securities 51
Note 18 Fair value adjusments to debt portfolios hedged against interest rate risks 52
Note 19 Accruals and other liabilities 52
Note 20 Provisions 53
Note 21 Derivatives 55
Note 22 Analysis by maturity and liquidity risks 60
Note 23 Fair value of financial assets and liabilities 63
Note 24 Other commitments 64
Note 25 Interest and other revenue on assets at amortised cost 64
Note 26 Interest expense on hedging instruments 66
Note 27 Interest expense on customer transactions 66
Note 28 Other revenue and expense 67
Note 29 Interest on deposits from credit institutions 67
Note 30 Interest on debt securities 68
Note 31 General operating expenses 68
Note 32 Cost of risk 70
Note 33 Income taxes 72
Note 34 Analysis of key data by region 73
notes to the consolidated financial statements for the years ended december 31, 2008 and 2007

BANQUE PSA FINANCE 2008 Annual Report 33BANQUE PSA FINANCE 2008 Annual Report
CoNSolIdAtEd FINANCIAl StAtEmENtS For thE yEArS ENdEd dECEmBEr 31, 2008 ANd 2007 2notes to the consolidated financial statements for the years ended december 31, 2007 and 2008
Note 1 Group structure
A) Changes in Group structureSince December 2006, the subsidiary in Turkey, named BPF Pazarlama A.H.A.S., has been marketing financing products and related services in partnership with a local bank. It has been fully consolidated since January 2007.
On January 1, 2007, Locadin was merged into its sole shareholder, Crédipar. The merger had no impact on the Banque PSA Finance Group’s consolidated financial statements.
On October 1, 2007, the Austrian subsidiary PSA Finance Austria Bank A.G. was merged into Banque PSA Finance and converted into a branch, with retroactive effect from January 1, 2007. The merger had no impact on the Banque PSA Finance Group’s consolidated financial statements.
On January 29, 2007, the wholly-owned subsidiary Crédipar sold €1,250 million worth of automobile loans to the Auto ABS 2007-1 fund. The Auto ABS 2007-1 fund issued €1,181.25 million worth of rated preferred bonds and €68.75 million worth of rated subordinated bonds. Crédipar holds a retained interest of €10,000, entitling it to the bulk of the operating income generated by the receivables after payment of interest on the preferred and subordinated bonds. As a consequence, the fund has been fully consolidated since January 2007.
On July 25, 2007, Banque PSA Finance’s Italian branch sold €850 million worth of automobile loans to the Auto ABS S.r.l. 2007-2 fund, an Italian Special Purpose Vehicle (SPV). This SPV issued €816 million worth of rated preferred bonds, €34 million worth of rated subordinated bonds and €18.7 million worth of junior bonds subscribed by Banque PSA Finance’s Italian branch. This last issue created a reserve fund for the SPV, while at the same time allowing the branch to retain the bulk of the operating income generated by the receivables after payment of interest on the preferred and subordinated bonds. As a consequence, the fund has been fully consolidated since July 2007.
On July 23, 2007, PSA Renting Italia S.p.A. was set up to develop a rental business in Italy. PSA Renting Italia S.p.A. is wholly-owned by Banque PSA Finance and has been fully consolidated since July 2007.
On December 5, 2007, Crédipar purchased a new company, which was named Financière Greffuhle S.A.S. on January 28, 2008. The company’s corporate purpose is to participate in raising financing for the Banque PSA Finance Group by buying, selling, borrowing and lending financial instruments. It has been fully consolidated since January 2008.
On January 25, 2008, Crédipar and Banque PSA Finance’s Spanish branch repurchased the loans sold in 2002 to the
Auto ABS 2002-1 fund, representing less than €100 million at the repurchase date, and Auto ABS 2002-1 was wound up in advance. As the fund was consolidated, the transaction had no impact on the consolidated financial statements of Banque PSA Finance.
On January 23, 2008, BPF Financiranje d.o.o. was set up in Slovenia to develop Banque PSA Finance’s financing business in the local market. The company is a 50/50 joint subsidiary of PSA Financial Holding B.V., the Dutch subsidiary of Banque PSA Finance, and S.G. Consumer Finance S.A., a subsidiary of Société Générale S.A. It has been fully consolidated since May 2008.
On July 30, 2008, Banque PSA Finance’s German branch sold €1,000 million worth of automobile loans to the Auto ABS 2008-1 fund. The Auto ABS 2008-1 fund issued €970 million worth of rated preferred bonds and €30 million worth of rated subordinated bonds. The German branch holds a retained interest of €10,000, entitling it to the bulk of the operating income generated by the receivables after payment of interest on the preferred and subordinated bonds. As a consequence, the fund has been fully consolidated since July 2008.
On June 11, 2008, BPF Algérie was set up to develop Banque PSA Finance’s financing business in Algeria. The company is 98%-owned by PSA Financial Holding B.V. and 2% by Banque PSA Finance. It has been fully consolidated since October 2008.
In order to prepare the legal structures that will house the future insurance business, in June 2008, Banque PSA Finance increased the capital of its subsidiary PSA Assurances S.A.S. This subsidiary acts as the French holding company of an entity in Malta that owns two local insurance companies, one for the life business and the other for the non-life business. As their business will be launched during the first quarter of 2009, these companies have not been consolidated at December 31, 2008.
On July 18, 2008, PSA Financial d.o.o. was set up in Croatia. The company, which is wholly-owned by PSA Financial Holding B.V., was not consolidated at December 31, 2008 because its business volume was not material.
UK-based Arche Investment Limited was removed from the scope of consolidation because Banque PSA Finance has not been a shareholder since November 2008.
German-based Peugeot Commercial Paper Gmbh was also removed from the scope of consolidation at December 31, 2008, because it is in liquidation.
These two events had no impact on the consolidated financial statements of Banque PSA Finance.

34 BANQUE PSA FINANCE 2008 Annual Report
CoNSolIdAtEd FINANCIAl StAtEmENtS For thE yEArS ENdEd dECEmBEr 31, 2008 ANd 20072notes to the consolidated financial statements for the years ended december 31, 2008 and 2007
BANQUE PSA FINANCE 2008 Annual Report
B) list of consolidated companies
Companies Country% Direct interest
Indirect interest % interest at December 31
% Held by 2008 2007
BRANCHES
UK branch United Kingdom - - - -
Spanish branch Spain - - - -
Portuguese branch Portugal - - - -
Italian branch Italy - - - -
Polish branch Poland - - - -
Deutsch branch Germany - - - -
Austrian branch Austria - - - -
FULLy CONSOLIDATED COMPANIES
Sales financing in France
Sofira France 98 - 98 98
Crédipar France 100 - 100 100
CLV France - 100 Crédipar 100 100
Dicoma France - 99.98 Crédipar 99.98 99.98
Sales financing outside France
PSA wholesale ltd United Kingdom 100 - 100 100
PSA Finance Plc United Kingdom - 50 PSA wholesale ltd 50 50
PSA Finance Nederland B.V. Netherlands - 100 PSA Financial Holding B.V. 100 100
PSA Finance Belux Belgium 6.51 93.49 PSA Financial Holding B.V. 100 100
PSA Gestão Comercio E Aluguer de Veiculos Portugal 97 1 PSA Financial Holding B.V. 98 98
PSA Finance Suisse S.A. Switzerland 82.35 17.65 PSA Financial Holding B.V. 100 100
Banco PSA Finance Brasil S.A. Brazil 100 - 100 100
PSA Finance Arrendamento Mercantil S.A. Brazil 100 - 100 100
PSA Finance Argentina Compania Financiera S.A. Argentina 50 - 50 50
PSA Finance Polska Sp.zo.o. Poland 100 - 100 100
PSA Finance Ceska Republika S.r.o. Czech Republic 0.05 99.95 PSA Financial Holding B.V. 100 100
PSA Finance Hungaria R.T. Hungary 2.50 97.50 PSA Financial Holding B.V. 100 100
PSA Finance Slovakia S.r.o. Slovakia 0.16 99.84 PSA Financial Holding B.V. 100 100
Banque PSA Finance Mexico SA de CV SOFOL Mexico 2.52 97.48 PSA Finance Nederland B.V. 100 100
BPF Pazarlama A.H.A.S. Turkey 100 - 100 100
PSA Renting Italia S.p.A. Italy 100 - 100 100
BPF Financiranje d.o.o. Slovenia - 50 PSA Financial Holding B.V. 50 -
BPF Algérie Algeria 2 98 PSA Financial Holding B.V. 100 -
Other companies
Sofib France 100 - 100 100
SNDA France 100 - 100 100
GIE Foncier Crédipar France - - 100 100
Vernon wholesale Investment Company Ltd United Kingdom - 100 PSA wholesale Ltd 100 100
Peugeot Commercial Paper GmbH Germany - - - 100
PSA Financial Holding B.V. Netherlands 100 - 100 100
Peugeot Finance International N.V. Netherlands 100 - 100 100
PSA Factor Italia S.p.A Italy - 94.54 Italian branch 94.54 94.54
Arche Investment Limited United Kingdom - - - 100
PSA Finance S.C.S. Luxembourg 100 - 100 100
Financière Greffuhle S.A.S. France - 100 Crédipar 100 -
Special purpose entities
Auto ABS 2002-1 Fund France - - - 100
Auto ABS 2004-1 Fund France - - 100 100
Auto ABS 2006-1 Fund France - - 100 100
Auto ABS 2007-1 Fund France - - 100 -
Auto ABS S.r.l. 2007-2 Fund Italy - - 100 -
Auto ABS 2008-1 Fund France - - 100 -
COMPANIES ACCOUNTED FOR By THE EqUITy METHOD
Dongfeng Peugeot Citroën Auto Finance Company Ltd China - 25 PSA Finance Nederland B.V. 25 -

BANQUE PSA FINANCE 2008 Annual Report 35BANQUE PSA FINANCE 2008 Annual Report
CoNSolIdAtEd FINANCIAl StAtEmENtS For thE yEArS ENdEd dECEmBEr 31, 2008 ANd 2007 2notes to the consolidated financial statements for the years ended december 31, 2007 and 2008
Note 2 Accounting policies
In accordance with European Council Regulation 1606/2002/EC dated July 19, 2002 on the application of international accounting standards from January 1, 2005, Banque PSA Finance’s consolidated financial statements for the year ended December 31, 2008 have been prepared in accordance with the International Financial Reporting Standards (IFRSs) applicable and adopted by the European Union as of that date.
International Financial Reporting Standards (IFRSs) also include International Accounting Standards (IASs) and related interpretations issued by the International Financial Reporting Interpretations Committee (IFRIC) and the Standing Interpretations Committee (SIC).
The standards and interpretations applied at December 31, 2008 were unchanged compared with December 31, 2007 except for the adoption of standards and interpretations whose application was compulsory for the first time in 2008.
New IFRSs and IFRIC interpretations whose application was compulsory or optional in the fiscal year commencing January 1, 2008
Amendments to IAS 39 – Financial Instruments: Recognition •and Measurement and IFRS 7 – Financial Instruments: Disclosures, whose application is optional. These amendments allow certain financial assets to be reclassified retrospectively from July 1, 2008 in particular circumstances. Banque PSA Finance Group did not use the opportunity offered by these amendments.
Interpretation IFRIC 11 concerning IFRS 2: Group and Treasury •Share Transactions, applicable from the first annual period commencing on or after March 1, 2007. Banque PSA Finance Group is not concerned by this interpretation.
New IFRSs and IFRIC interpretations applicable after the fiscal year commencing January 1, 2008Banque PSA Finance has not early adopted any standards or interpretations.
IFRS 8 – Operating Segments, applicable from the first annual •period commencing on or after January 1, 2009. Application of IFRS 8 effective from the fiscal year commencing on January 1, 2009 is expected to have an impact on the presentation of the notes to the consolidated financial statements, mainly by adding a new specific note on segment information, as the business will be managed based on new segments corresponding to the portfolios or groups of portfolios defined for Basel II purposes.
Amendments to IAS 23 – Borrowing Costs, applicable from the •first annual period commencing on or after January 1, 2009. This amendment requires directly attributable borrowing costs to be capitalised as part of the cost of the related qualifying asset. This amendment should not have any impact on 2009 income.
IAS 1 (revised) – Presentation of Financial Statements. Under •the revised standard, companies May present components of profit or loss either as part of a single statement of comprehensive income or in a separate income statement. The Group has elected to present a single statement consisting of an income statement in the same format as in prior periods with the other components of comprehensive income shown in a new section at the bottom.
Amendment to IFRS 2 – Share Based Payment, clarifying the •terms “vesting conditions” and “cancellations”. The Group should not be concerned by this amendment.
Interpretation IFRIC 13 – Customer Loyalty Programmes. The •Group should not be concerned by this interpretation.
Interpretation IFRIC 14 of IAS 19 – The Limit on a Defined •Benefit Asset, Minimum Funding Requirements and their Interaction, applicable from January 1, 2009. This interpretation is likely to have no impact on the Group’s consolidated financial statements.
As no template is provided in IFRS, the consolidated financial statements are presented largely in accordance with Conseil National de la Comptabilité (CNC) recommendation 2004-R.03 on the format of the IFRS financial statements of companies governed by the Comité de la Réglementation Bancaire et Financière. Banque PSA Finance consolidated financial statements include prior year comparatives.
The consolidated financial statements include the financial statements of Banque PSA Finance and the French and foreign companies in the Banque PSA Finance Group, based on the consolidation methods described in note A below.
The individual statutory financial statements of Banque PSA Finance and its subsidiaries and branches are prepared in accordance with the accounting principles in force in the countries where they do business. These statements are adjusted to comply with Group accounting policies for inclusion in the consolidated financial statements.
Significant accounting policies applied by the Group are described in notes B to F below.
The term «related companies» refers to all companies that are fully consolidated in the PSA Peugeot Citroën Group consolidated financial statements.
The annual consolidated financial statements and Notes for Banque PSA Finance Group were approved by the Board of Directors on February 9, 2009.
A. Basis of consolidation
Consolidation methodsCompanies in which Banque PSA Finance directly or indirectly holds a majority interest are fully consolidated. The same method

36 BANQUE PSA FINANCE 2008 Annual Report
CoNSolIdAtEd FINANCIAl StAtEmENtS For thE yEArS ENdEd dECEmBEr 31, 2008 ANd 20072notes to the consolidated financial statements for the years ended december 31, 2008 and 2007
BANQUE PSA FINANCE 2008 Annual Report
is applied to companies where the majority of the risks and rewards of the business lie with the Group, directly or indirectly, as well as to companies owned jointly with a partner on a 50/50 basis, when Banque PSA Finance is in a position to control strategic financial and operating decisions relating to the business.
All significant intragroup transactions and balances are eliminated in consolidation.
Companies that are between 20% and 50% owned, directly or indirectly, over which Banque PSA Finance has significant influence are accounted for by the equity method.
Certain companies meeting the above criteria are not consolidated because they are not material in relation to the consolidated financial statements. Investments in these companies are recorded under “Available-for-sale assets” (see note C.4 below).
Translation of financial statements of foreign subsidiariesBalance sheets of foreign companies are translated at the year-end exchange rate. Income statement items of foreign companies are translated on a month-by-month basis at the average monthly rate.
Gains and losses resulting from translation of the financial statements of foreign subsidiaries are recorded in equity under “Translation reserve”.
Foreign currency transactionsTransactions in foreign currencies are measured and recognised in accordance with IAS 21 – The Effects of Changes in Foreign Exchange Rates. In compliance with this standard and also with banking regulations, transactions denominated in foreign currencies are recorded in the original currency. At each period-end, balance sheet items in foreign currencies are revalued at fair value at the closing exchange rate. The corresponding revaluation differences are recognised in the income statement under “Currency instruments”.
Foreign currency transactions are systematically hedged using currency derivatives which are recognised in the balance sheet and measured at fair value. Gains and losses arising from remeasurement of currency derivatives at fair value at each period-end are recognised in the income statement under “Currency instruments” and offset the gains and losses on the underlying transactions. Consequently, net exchange gains or losses are by definition not material.
Use of estimatesThe preparation of financial statements in accordance with IAS/IFRS requires management to make estimates and assumptions that affect the reported amounts of assets and liabilities, disclosure of contingent assets and liabilities at the date of the financial statements and the reported amounts of revenue and expenses
during the reporting period. Management believes that, in preparing the financial statements, it has applied the most appropriate and reasonable estimates and assumptions considering the Group’s business environment and past experience.
Due to the uncertainty of these valuations, actual results May differ from these estimates.
To limit this uncertainty, estimates and assumptions are reviewed periodically and any changes to reported amounts are recognised immediately, in accordance with IAS 8 – Accounting Policies, Changes in Accounting Estimates and Errors.
Estimates and assumptions are used in particular to measure the following:
fair value of financial assets and liabilities at fair value through •profit or loss;
fair value of hedging instruments; •
recoverable amount of customer loans and receivables; •
fair value adjustments to finance receivables and debt portfolios •hedged against interest rate risks;
deferred tax assets; •
value in use and useful lives of intangible assets and property •and equipment;
provisions; •
pension obligations. •
Main consolidation adjustments
Recognition and measurement of derivative instruments, hedge accounting (IAS 39)
In the financial statements of the individual subsidiaries, the fair value principle under IAS 39 – Financial Instruments: Recognition and Measurement, does not apply. Measurement at fair value of derivative instruments, financial assets and certain financial liabilities at fair value through profit or loss, and application of hedge accounting in accordance with IAS 39 therefore give rise to certain consolidation adjustments. The underlying principles are described in note C “Financial assets and liabilities”, below.
Deferred taxes
Certain adjustments to the accounts of subsidiaries to comply with Group accounting policies, and timing differences between the recognition of certain items of income and expense for statutory financial reporting and tax purposes or arising from consolidation adjustments, can generate temporary differences between the tax base and adjusted income. In accordance with IAS 12 – Income Taxes, deferred taxes are recognised in the consolidated financial statements for these differences using the liability method, where they can reasonably be expected to be recovered. Similarly, deferred tax assets are recognised for tax loss carryforwards when sufficient taxable profit can reasonably be expected to be generated to permit their utilisation.

BANQUE PSA FINANCE 2008 Annual Report 37BANQUE PSA FINANCE 2008 Annual Report
CoNSolIdAtEd FINANCIAl StAtEmENtS For thE yEArS ENdEd dECEmBEr 31, 2008 ANd 2007 2notes to the consolidated financial statements for the years ended december 31, 2007 and 2008
No provision has been made for deferred taxes on the undistributed earnings of subsidiaries, as these earnings are considered as having been permanently reinvested.
B. Fixed assets
B.1 Property and equipmentIn accordance with IAS 16 – Property, Plant and Equipment, property and equipment are stated at cost. Property and equipment other than land are depreciated by the straight-line method over the following estimated useful lives:
Buildings 20 to 30 yearsVehicles 4 yearsOther 4 to 10 years
The basis for depreciation is determined by deducting their residual value, if any. The Group’s assets are generally considered as having no residual value.
Estimated useful lives are reviewed at each year-end and adjusted where necessary.
B.2 Intangible assetsIn accordance with IAS 38 – Intangible Assets, the portion of the cost of developing software for internal use that corresponds to internal or external costs directly attributable to creating the software or improving its performance, is recognised as an intangible asset when it is probable that the costs will generate future economic benefits. The capitalised costs are amortised over the estimated useful life of the software, not to exceed 12 years. Other software purchases and development costs are recognised as an expense.
B.3 GoodwillGoodwill is the excess of the cost of shares in a consolidated company, including transaction expenses, over the Group’s equity in the fair value at the acquisition date of the identifiable assets and liabilities acquired. It was amortised on a straight-line basis over 20 years until December 31, 2003.
Effective from January 1, 2004, in accordance with IFRS 3 – Business Combinations, goodwill is no longer amortised, but is tested for impairment annually or more frequently if events or changes in circumstances indicate that it might be impaired (see note B.4 below).
Crédipar goodwillThe fair market value of Crédipar at December 31, 1998 was calculated in connection with the acquisition by Banque PSA Finance of the 50% interest in Crédipar held by Sovac S.C.A. Following final adjustments in 1999, as allowed under generally accepted accounting principles, the initial goodwill was determined to be €100 million. After deducting accumulated amortisation for the period to December 31, 2003, Crédipar goodwill amounted to €75 million at January 1, 2004.
Sofib goodwillSofib was acquired from PSA Peugeot Citroën on April 1, 1999. Goodwill arising on the acquisition totalled €7.6 million. After deducting accumulated amortisation for the period to December 31, 2003, Sofib goodwill recognised in the opening IFRS balance sheet at January 1, 2004 amounted to €6 million.
B.4 Impairment of long-lived assetsIn accordance with IAS 36 – Impairment of Assets, property and equipment and intangible assets are tested for impairment annually, or more frequently if events or changes in circumstances indicate that they might be impaired. Assets with indefinite useful lives must be tested for impairment at least once a year. Goodwill is the only indefinite-lived asset carried in the Group accounts.
Impairment tests are performed at the level of cash generating units (CGU), which are defined as the smallest identifiable group of assets that generates cash inflows that are largely independent of the cash inflows from other assets or groups of assets. Goodwill is allocated to the CGU to which it relates. The value in use of a CGU is measured as the net present value of estimated future cash flows. If this value is less than the CGU’s net book value, an impairment loss is recognised in operating income. The impairment loss is first recorded as an adjustment to the carrying amount of any goodwill allocated to the CGU and the remainder of the loss is allocated to the other assets of the unit.
At Banque PSA Finance, CGUs correspond to operations in each individual country.
C. Financial assets and liabilitiesFinancial assets and liabilities are recognised and measured in accordance with IAS 39. IAS 39 was adopted in part by the European Commission on November 19, 2004 (regulation 2086/2004/EC) with six amendments, mainly concerning the fair value option, and regulation 1864/2005/EC published on November 16, 2005, which allows companies to elect to measure certain liabilities at fair value. The Group has elected to use this option in certain instances (see paragraph C.3 below).
As allowed under IAS 39, the Group has elected to apply transaction date accounting to financial assets and liabilities. Consequently, when the transaction date (corresponding to the date when the commitment is entered into) is different from the settlement date, the purchase or sale of securities is recognised in the balance sheet on the transaction date (see end of paragraphs C2 and C7.2 below).
The Group is not concerned by the provisions of IAS 39 regarding the application of hedge accounting to demand deposits, which in their current formulation have not been adopted by the European Commission (carve out).
38 BANQUE PSA FINANCE 2008 Annual Report
CoNSolIdAtEd FINANCIAl StAtEmENtS For thE yEArS ENdEd dECEmBEr 31, 2008 ANd 20072notes to the consolidated financial statements for the years ended december 31, 2008 and 2007
BANQUE PSA FINANCE 2008 Annual Report
C.1 Derivative instruments – application of hedge accounting
C.1.1 Recognition and measurementAll derivative instruments are recognised in the balance sheet at fair value. Except for instruments designated as cash flow hedges (see below), gains and losses arising from remeasurement at fair value are recognised in profit or loss.
Derivative instruments may be designated hedging instruments in one of two types of hedging relationships:
fair value hedge, corresponding to a hedge of the exposure to •changes in fair value of an asset or liability due to changes in exchange rates or interest rates;
cash flow hedge, corresponding to a hedge of the exposure •to variability in cash flows from existing or future assets or liabilities.
Derivative instruments qualify for hedge accounting when:
at the inception of the hedge there is formal designation and •documentation of the hedging relationship;
the effectiveness of the hedging relationship is demonstrated •at its inception;
the actual effectiveness of the hedging relationship is also •demonstrated at each period end.
The effects of hedge accounting are as follows:
for fair value hedges of existing assets and liabilities, the •hedged portion of the asset or liability is recognised in the balance sheet and measured at fair value. Gains and losses arising from remeasurement at fair value are recognised in profit or loss, and are offset by the effective portion of the loss or gain arising from remeasurement at fair value of the hedging instrument. Fair value adjustments to hedged financial assets and liabilities are reported under “Cumulative gains and losses on portfolios hedged against interest rate risks”, in assets for hedged finance receivables and in liabilities for hedged debt;
for cash flow hedges, the effective portion of the gain or •loss arising from remeasurement at fair value of the hedging instrument is recognised in equity. The cumulative gains and losses recognised in equity are included in profit or loss when the hedged item affects profit or loss.
The ineffective portion of the gain or loss arising from remeasurement at fair value of both fair value and cash flow hedges is recognised in profit or loss.
C.1.2 Derivative financial instruments – financial statement presentation
Balance sheet:
derivative instruments are stated in the balance sheet at fair •value, net of accrued interest;
fair values of derivative instruments used as hedges are •recognised under «Hedging instruments», in assets when the fair value is positive and in liabilities when it is negative;
derivative instruments that do not qualify for hedge accounting •are included in «Financial assets at fair value through profit or loss» when the fair value is positive, and in «Financial liabilities at fair value through profit or loss» when it is negative.
Income statement:
gains and losses arising from remeasurement at fair value of •fair value hedges are recognised under the same caption as the losses and gains on the hedged items;
the ineffective portion of gains and losses arising from •remeasurement at fair value of cash flow hedges is reported under «Hedging gains and losses»;
gains and losses arising from remeasurement at fair value of •derivative financial instruments not designated as hedges are recognised under “Net gains (losses) on trading transactions”, with the exception of:
derivative financial instruments used to hedge short-term cash –investments: gains or losses are recognised under “Fair value adjustments to assets valued using the fair value option”,
derivative financial instruments used to hedge certain liabilities –valued using the fair value option: gains and losses are recognised under “Fair value adjustments to financing liabilities valued using the fair value option”.
C.2 Financial assets at fair value through profit or loss
Banque PSA Finance liquidity reserves are invested partly in fixed income securities indexed to Eonia. They are generally financed by debt indexed to Eonia. If not, they are swapped for the 3-month Euribor by means of economic hedges. In the interests of simplicity, these fixed income securities are accounted for using the fair value option, whereby changes in the fair value of the hedged securities are recognised directly in profit or loss, together with the offsetting change in fair value of the economic hedges. Liquidity reserves are also partly invested in mutual funds, whose units are not consolidated because they do not meet the criteria regarding control or rights in the majority of the benefits and corresponding risks (see IAS 27 – Consolidated financial statements and accounting for investments in subsidiaries and SIC 12 – Consolidation: Special Purpose entities).
BANQUE PSA FINANCE 2008 Annual Report 39BANQUE PSA FINANCE 2008 Annual Report
CoNSolIdAtEd FINANCIAl StAtEmENtS For thE yEArS ENdEd dECEmBEr 31, 2008 ANd 2007 2notes to the consolidated financial statements for the years ended december 31, 2007 and 2008
This caption also includes the positive fair value of other derivative instruments that do not qualify for hedge accounting under IAS 39.
This caption also includes securities receivable, which are recognised as from the transaction date.
C.3 Financial liabilities at fair value through profit or loss
This item comprises liabilities valued using the fair value option. The Group has elected to use this option in certain instances to improve the presentation of its financial statements by recognizing fair value adjustments to the liabilities symmetrically with the fair value adjustments made to the derivative financial instruments used to hedge the interest rate risk on those liabilities. Accordingly, the fair value adjustments include any changes in Banque PSA Finance’s issuer spread.
This caption also includes the negative fair value of other derivative instruments that do not qualify for hedge accounting under IAS 39, including interest rate derivative instruments intended to hedge financial assets or liabilities at fair value through profit or loss.
C.4 Available-for-sale assetsAvailable-for-sale assets consist mainly of investments in companies that are not yet consolidated. These investments are stated at fair value, which generally corresponds to their cost.
C.5 Held-to-maturity investmentsThese are fixed income securities that are acquired with the positive intention of being held to maturity. They are stated at amortised cost, corresponding to redemption value less amortisation of premiums and discounts. Premiums and discounts are amortised to profit or loss over the holding period.
C.6 Loans and receivablesIn the Notes to the financial statements, loans and receivables are analysed between:
retail financing, which includes installment sales, buyback •contracts and long-term leases; as explained in note C.6.1 below, buyback contracts and long-term leases are adjusted to present each transaction as a loan;
wholesale financing, corresponding to floor-plan or spare parts •financing for the Peugeot and Citroën captive and independent dealer networks;
other customer loans and receivables. •
Loans and receivables recognised in the balance sheet correspond to Banque PSA Finance’s net commitment in respect of these receivables. Therefore, as well as the outstanding principal and accrued interest, the carrying value of finance receivables also includes:
commissions paid to referral agents as well as external direct •administrative expenses, which are added to the outstanding principal;
contributions received from the marques and transaction fees, •which are deducted from the outstanding principal;
guarantee deposits received at the inception of finance leases, •which are deducted from the amount financed.
The carrying value of finance receivables does not reflect the impact of applying hedge accounting (see note C.6.2 below).
Interest income is allocated by the effective interest method, with the effective interest rate being the rate that exactly discounts estimated future cash receipts through the expected life of the loan.
C.6.1 Lease financingIn accordance with IAS 17 – Leases and IAS 39, vehicles leased to customers are treated as in-substance loans because the risks and rewards of ownership of the vehicle do not lie with Banque PSA Finance. Consequently, rental revenues and depreciation expense on the vehicles are adjusted in order to present each transaction as a loan.
C.6.2 Hedges of interest rate risks on outstanding loans and receivables
Outstanding loans are generally hedged against interest rate risks, using fair value hedges that qualify for hedge accounting. Accordingly, gains and losses arising from remeasurement at fair value of the hedged portion of the loans are recognised in profit or loss (see note C.1.1 “Derivative instruments – recognition and measurement”).
C.6.3 Impairment lossesImpairment losses on finance receivables are deducted from their carrying value in the balance sheet, as soon as a loss event occurs.
Impairment losses are identified separately under specific line items.
RetAIL FINANCINg ImpAIRmeNt LoSSeS:
Impairment losses on sound loans with past-due installments:
An impairment loss is recognised on sound loans when the borrower defaults on a single installment (loss event). Impairment is assessed based on the probability of the outstanding loan being classified as non-performing and on the discounted average loss rate.
Impairment losses on non-performing loans:
In accordance with French banking regulations, loans for which one or more installments are over 90 days past-due are automatically reclassified as non-performing. This period is increased to 150 days when the Group has no exposure to counterparty risk due to effective risk mitigation. Loans that do not have any installments over 90 days past-due but are flagged by the system as giving rise to an aggravated risk are classified as non-performing immediately.

40 BANQUE PSA FINANCE 2008 Annual Report
CoNSolIdAtEd FINANCIAl StAtEmENtS For thE yEArS ENdEd dECEmBEr 31, 2008 ANd 20072notes to the consolidated financial statements for the years ended december 31, 2008 and 2007
BANQUE PSA FINANCE 2008 Annual Report
This definition of non-performing loans is in line with the definition of “default” used for Basel II risk assessment purposes.
Banque PSA Finance has set up a database containing historical collection data for non-performing loans. These data are used to determine the discounted average loss rate, which serves as the basis for calculating impairment losses on non-performing and doubtful loans. The discounted average loss rate is calculated using the effective interest method.
Restructured performing loans:
These mainly concern retail customers in France who are in a situation of over-indebtedness and are the subject of plans to discharge their total debt (“Neiertz Act plans”). As soon as the Group is formally notified that loan repayments are being suspended while a debt discharge plan is put in place, the loan is classified as non-performing. At the end of the moratorium, if the customer complies with his or her repayment obligations, the loan is reclassified as sound and a provision is booked at the rate applied to sound loans with past-due installments. In the event of a subsequent default, the loan is immediately reclassified as non-performing.
Discounting retail financing recoveries leads to an increase in the impairment loss recognised upon occurrence of the loss event compared to the actual loss that will ultimately be recognised. This increase is linked to the passage of time. If the amount involved is material, this increase in the impairment loss is reversed over the average life of the loans by crediting “Cost of risk”.
NoN-RetAIL FINANCINg ImpAIRmeNt LoSSeS: CoRpoRAte (wHoLeSALe AND NoN wHoLeSALe), LoCAL ADmINIStRAtIoNS AND BANkS
These loans are classified as non-performing when one or more –installments are 90 days past-due, for Corporate loans, and 271 days past-due for loans to Local Administrations. These periods are increased to 452 days and 632 days respectively, when the Group has no exposure to counterparty risk due to effective risk mitigation. Loans that do not have any installments that are over 90 and 271 days past-due respectively, but are flagged by the system as giving rise to an aggravated risk, are reclassified as non-performing immediately.
When the first default occurs or at the latest when the above –periods have been exceeded, a ‘Flash Report’ is issued containing a detailed risk analysis and stipulating the amount of any necessary provision. Loans for which a ‘Flash Report’ has been issued are flagged in the system as giving rise to an aggravated risk.
When a finance receivable is considered as irrecoverable, it is written off through profit or loss. The previously-recognised impairment loss is also reversed through profit or loss. Any subsequent recoveries are credited to the income statement under “Cost of risk”.
C.7 Financing liabilitiesUpon initial recognition, financing liabilities are measured at the amount of the net proceeds received. Their carrying amount
therefore comprises the outstanding principal and accrued interest, plus:
debt issuance and set-up costs; •
issue or redemption premiums, if any. •
Interest expense is allocated by the effective interest method, with the effective interest rate being the rate that exactly discounts estimated future cash outflows through the expected life of the debt.
C.7.1 Hedges of interest rate risks on financing liabilities
Financing liabilities hedged by interest rate swaps are remeasured at fair value in accordance with hedge accounting principles applicable to fair value hedges. Gains and losses arising from remeasurement at fair value of the hedged portion of the liability are recognised in profit or loss and are offset by the effective portion of changes in the fair value of the swaps (see note C.1.1 “Derivative instruments – recognition and measurement”).
C.7.2 Debt securities
Debt securities include certificates of deposit, bonds, interbank instruments and money market securities, other than subordinated securities which are reported under “Subordinated debt”.
This caption also includes securities to be delivered, which are recognised as from the transaction date.
d. ProvisionsIn accordance with IAS 37 – Provisions, Contingent Liabilities and Contingent Assets, a provision is recorded when the Group has a present obligation towards a third party (legal or constructive) as a result of a past event, it is probable or certain that an outflow of resources embodying economic benefits will be required to settle the obligation, and no inflow of resources representing an equivalent amount is expected. Restructuring provisions are recorded only when the restructuring has been announced and the Group has drawn up or started to implement a detailed formal plan.
Provisions are discounted only when the impact is material.
E. Pension obligationsIn addition to standard pensions payable under local legislation, Group employees receive supplementary pension benefits and retirement bonuses (see Note 20.1). These benefits are paid under defined contribution and defined benefit plans.
The contributions paid under defined contribution plans are in full discharge of the Group’s liability and are recognised as an expense.
In accordance with IAS 19 – Employee Benefits, obligations under defined benefit plans are measured by independent actuaries using
BANQUE PSA FINANCE 2008 Annual Report 41BANQUE PSA FINANCE 2008 Annual Report
CoNSolIdAtEd FINANCIAl StAtEmENtS For thE yEArS ENdEd dECEmBEr 31, 2008 ANd 2007 2notes to the consolidated financial statements for the years ended december 31, 2007 and 2008
the projected unit credit method. This method sees each period of service as giving rise to an additional unit of benefit entitlement and measures each unit separately to build up the final obligation, which is then discounted to present value. The calculations mainly take into account:
an assumed retirement date; •
a discount rate; •
an inflation rate; •
assumptions concerning future salary levels and staff turnover •rates.
Actuarial valuations are performed every year for the main plans, and once every three years for the other plans, with more frequent valuations conducted if necessary to take account of changes in actuarial assumptions or significant changes in demographic data.
Changes in actuarial assumptions and experience adjustments - corresponding to the effects of differences between the previous actuarial assumptions and what has actually occurred – give rise to actuarial gains and losses on the benefit obligation or on the plan assets. These gains and losses are recognised in the income statement by the corridor method, which consists of recognizing a specified portion of the net cumulative actuarial gains and losses that exceeds the greater of 10% of the present value of the defined benefit obligation (before deducting plan assets) and 10% of the fair value of any plan assets at the balance sheet date.
The total projected benefit obligation, including the portion not recognised due to the deferral of actuarial gains and losses, is covered by external funds. Because of the deferral of actuarial gains and losses, in some cases the amount of these external funds
exceeds the recognised projected benefit obligation, leading to the recognition of an asset in “Other non-current assets” in an amount not exceeding the sum of net actuarial losses and unrecognised past service costs.
Other employee benefits covered by provisions mainly concern long-service awards payable by French subsidiaries and some foreign subsidiaries.
The Group no longer has any liability to make good any under-funding of the Banking Industry Pension Fund (CRPB), as the latest independent actuarial valuations performed in 2008 indicate that the vested benefit entitlements of employees are covered by the contributions paid to date.
F. Signature commitmentsIrrevocable commitments given or received by Group companies (irrevocable customer financing commitments – corresponding to the period between the loan offer and the date when the funds are released – and guarantees) are recognised in the balance sheet at fair value in accordance with IAS 39. As these commitments are made on market terms, they have a zero fair value.
Provisions are taken for impairment of financing or guarantee commitments in accordance with IAS 37. These signature commitments are reported at their nominal amount in Note 24 – Other commitments.
Derivative financial instrument commitments are described in note C.1 above.
Note 3 Cash, central banks, post office banks
(in million euros) Dec. 31, 2008 Dec. 31, 2007
Cash 1 1
Central banks and post office banks (deposits) 8 20
- of which compulsory reserves deposited with the Banque de France - 9
ToTal 9 21

42 BANQUE PSA FINANCE 2008 Annual Report
CoNSolIdAtEd FINANCIAl StAtEmENtS For thE yEArS ENdEd dECEmBEr 31, 2008 ANd 20072notes to the consolidated financial statements for the years ended december 31, 2008 and 2007
BANQUE PSA FINANCE 2008 Annual Report
Note 4 Financial assets at fair value through profit or loss
(in million euros) Dec. 31, 2008 Dec. 31, 2007
Marketable securities (1) 1,113 3,306
- of which units in Auto ABS securitisation vehicle 532 489
Other 46 46
Fair value adjustments (2) - -
Marketable securities at fair value 1,159 3,352
- of which accrued interest 2 21
Fair value of derivatives representing economic hedges of marketable securities (2) (4) - 1
Accrued income on derivatives representing economic hedges of liabilities valued using the fair value option - 3
Fair value of derivatives representing economic hedges of liabilities valued using the fair value option (4) - -
Accrued interest on derivatives held for trading - -
Assets held for trading at fair value (3) (4) - 40
ToTal 1,159 3,396
(1) The liquidity reserve, which amounted to €1,176 million at December 31, 2008, consists of mutual funds (€450 million) classified as «Financial assets at fair value through profit or loss», loans at overnight rates (€718 million) classified as «Loans and advances to credit institutions» (see Note 7) and reserves deposited with the Banque de France (€8 million) classified as «Cash, central banks, post office banks» (see Note 3).
(2) Marketable securities pay interest based on Eonia and are valued using the fair value option. In 2008, they were financed by Eonia-indexed debt. In 2007, the interest rate was swapped for the 3-month Euribor by means of economic hedges classified as «Financial assets at fair value through profit or loss» if their fair value was positive and as «Financial liabilities at fair value through profit or loss» if their fair value was negative. The fair value of the swaps adjusted the fair value of the marketable securities (cf. Note 21.5).
(3) Swaps classified as held for trading, mainly set up during securitisation transactions, represent closed positions that set each other off within homogeneous portfolios. They do not generate any material gains or losses (see Notes 13, 21.1 and 21.5).
(4) Fair value is determined by applying valuation techniques based for the most part on observable market data (level 2).
Note 5 hedging instruments (assets)
(in million euros) Dec. 31, 2008 Dec. 31, 2007
Cash Flow Hedges - 7
Purchased options (1) - 7
- of which intrinsic value of open swaptions - 1
Fair Value Hedges 526 194
Adjustment accounts - off-balance sheet transactions in foreign currencies (2) 329 45
Accrued income on swaps designated as hedges 39 27
- of which related companies 1 1
Positive fair value of instruments designated as hedges of (3)
- Borrowings 11 -
- EMTNs/BMTNs 12 1
- Bonds 130 42
- Certificates of deposit 2 -
- Other debts securities 1 -
- Retail finance receivables 2 79
ToTal 526 201
(1) Swaptions purchased as hedges of future loan originations. At December 31, 2008, all of these swaptions had matured.(2) Adjustement accounts are used to record fair value adjustments to currency swaps designated: - for the ones, s hedges of foreign currency customer loans refinanced in euros; these fair value adjustments, primarily a €151.8 million adjustement to the fair value of GBP
currency swaps at December 31, 2008, are offset by adjustments arising from the remeasurement of the foreign currency customer loans at period-end exchange rates (see Notes 8 and 14);
- for the others, as hedges of foreign currency financing liabilities; these fair value adjustments, primarily a €152.4 million adjustment to the fair value of JPY currency swaps at December 31, 2008, are offset by adjustments arising from the remeasurement of the underlying foreign currency financing liabilities at period-end exchange rates (see Notes 14 and 17).
(3) Fair value is determined by applying valuation techniques based for the most part on observable market data (level 2).
Hedging effectiveness is analysed in Note 21.4.

BANQUE PSA FINANCE 2008 Annual Report 43BANQUE PSA FINANCE 2008 Annual Report
CoNSolIdAtEd FINANCIAl StAtEmENtS For thE yEArS ENdEd dECEmBEr 31, 2008 ANd 2007 2notes to the consolidated financial statements for the years ended december 31, 2007 and 2008
Note 6 Available-for-sale financial assets
Available-for-sale financial assets consist mainly of investments in companies that are not yet consolidated, because the size of their business at the year-end is not material. Marketable securities are included in “Financial assets at fair value through profit or loss” (see Note 4).
No provision has been booked for start-up losses of companies that are not yet consolidated, because none of them are expected to remain in a loss-making position over the long-term.
Shares in non-consolidated companies amounted to €12 million at December 31, 2008 and mainly concerned the insurance holding subsidiary PSA Assurances S.A.S. (€8.7 million) and the Croatian subsidiary PSA Finance d.o.o. (€3,5 million). At December 31, 2007, they amounted to €3 million and mainly concerned the Slovenian subsidiary BPF Financiranje d.o.o., which has been consolidated since May 31, 2008 (see Note 1, changes in Group structure).
Note 7 loans and advances to credit institutions
Analysis of demand and time accounts
(in million euros) Dec. 31, 2008 Dec. 31, 2007
Demand accounts 1,269 923
Ordinary accounts in debit (1) 522 424
Securities to be delivered 29 -
Loans and advances at overnight rates (2) (3) 718 499
Time accounts (4) 70 2
Accrued interest 1 2
ToTal 1,340 927
(1) Corresponding to amounts debited from external bank accounts, which include the last direct debits on customer accounts for the period.(2) Primarily corresponding to Banque PSA Finance interbank loans in the form of repo transactions (€691 million) that are cancellable without notice.(3) The liquidity reserve, which amounted to €1,176 million at December 31, 2008, consists of mutual funds (€450 million) classified as «Financial assets at fair value
through profit or loss» (see Note 4), loans at overnight rates (€718 million) classified as «Loans and advances to credit institutions» and reserves deposited with the Banque de France (€8 million) classified as «Cash, central banks, post office banks» (see Note 3).
(4) Time accounts are analysed by maturity in Note 22.
Analysis of loans and advances to credit institutions (including accrued interest) between loans to related companies and loans to non-group institutions
(in million euros) Dec. 31, 2008 Dec. 31, 2007
Non-group institutions 1,340 927
ToTal 1,340 927
Analysis of loans and advances to credit institutions (including accrued interest) by geographical area
(in million euros) Dec. 31, 2008 Dec. 31, 2007
France 928 648
European Union (excluding France) 304 266
Other European countries 1 2
Latin America 107 11
ToTal 1,340 927

44 BANQUE PSA FINANCE 2008 Annual Report
CoNSolIdAtEd FINANCIAl StAtEmENtS For thE yEArS ENdEd dECEmBEr 31, 2008 ANd 20072notes to the consolidated financial statements for the years ended december 31, 2008 and 2007
BANQUE PSA FINANCE 2008 Annual Report
Note 8 Customer loans and receivables
8.1 Analysis by business
(in million euros) Dec. 31, 2008 Dec. 31, 2007
Retail financing
Installment contracts 9,646 10,550
- of which securitised (1) 3,136 2,673
Buyback contracts (2) 3,315 2,718
- of which securitised (1) 1,377 1,336
Unaccrued interest on buyback contracts (724) (423)
- of which securitised (1) (201) (186)
Long-term leases (2) 5,015 4,396
- Related companies 1 8
- Non-group companies 5,014 4,388
Unaccrued interest on long-term leases (415) (365)
Leasing deposits (59) (57)
Retail finance receivables, net (A - see Note 32.1 A) 16,778 16,819
Other finance receivables
Equipment loans 277 248
Other 565 512
Other finance receivables, net (B - see Note 32.1 B) 842 760
Deferred items included in amortised cost - Retail financing
Deferred acquisition costs 425 424
Deferred loan set-up costs (79) (83)
Deferred manufacturer and dealer contributions (241) (238)Total deferred items included in amortised cost 105 103
Wholesale financing
wholesale finance receivables 4,427 5,689
- Related companies 140 211
- Non-group companies 4,287 5,478
wholesale financing deposits (57) (83)
- Related companies (49) (78)
Wholesale finance receivables, net (C - see Note 32.1 C) 4,370 5,606
Ordinary accounts in debit
- Related companies 44 28
- Non-group companies 144 140
Ordinary accounts in debit, net 188 168ToTal loans and receivables aT amorTised cosT 22,283 23,456
(1) The Banque PSA Finance Group has set up several securitisation programs. All of these programs are being implemented through the Auto ABS special purpose vehicle created in June 2001, except in the case of Italy (see last paragraph below).
- On February 25, 2004, Banque PSA Finance’s German subsidiary PSA Finance Deutschland GmbH, which was converted into a branch on September 29, 2005, sold €1 billion worth of automobile loans to the Auto ABS 2004-1 fund. The Auto ABS 2004-1 fund issued €970 million worth of AAA/Aaa rated preferred asset-backed securities and €30 million worth of A/A2 rated subordinated asset-backed securities. PSA Finance Deutschland GmbH’s retained interest amounts to €10,000.
- On July 13, 2006, Crédipar sold €1,372 million worth of future finance lease revenues and related VAT to the Auto ABS 2006-1 fund. The Auto ABS 2006-1 fund issued €1,118 million worth of AAA/Aaa/AAA rated preferred bonds and €132 million worth of A/A2/A rated subordinated bonds. Crédipar’s retained interest amounts to €10,000.
- On January 29, 2007, Crédipar sold €1,250 million worth of automobile loans to the Auto ABS 2007-1 fund. The Auto ABS 2007-1 fund issued €1,181 million worth of AAA/Aaa rated preferred bonds and €69 million worth of A/Aa3 rated subordinated bonds. Crédipar’s retained interest amounts to €10,000.
- On July 25, 2007, Banque PSA Finance’s Italian branch sold €850 million worth of automobile loans to the Auto ABS S.r.l. 2007-2 fund, an Italian Special Purpose Vehicle (SPV). This SPV issued €816 million worth of AAA/Aaa rated preferred bonds, €34 million worth of A/A1 rated subordinated bonds and junior bonds subscribed by Banque PSA Finance’s Italian branch (€18.7 million).
- On July 30, 2008, Banque PSA Finance’s German branch sold €1 billion worth of automobile loans to the Auto ABS 2008-1 fund. The Auto ABS 2008-1 fund issued €970 million worth of AAA/aaa rated preferred bonds and €30 million worth of A/Aa3 rated subordinated bonds. The German branch’s retained interest amounts to €10,000.
These funds are special purpose vehicles which are fully consolidated by Banque PSA Finance to the extent that its subsidiaries retain the majority of the risks (principally credit risk) and rewards (net banking income generated by the SPV s) through their retained interest.
(2) Lease financing transactions (buyback contracts and long-term leases) are included in loans and receivables because they fulfill the criteria for classification as finance leases, since the risks and rewards of ownership of the vehicle do not lie with Banque PSA Finance.

BANQUE PSA FINANCE 2008 Annual Report 45BANQUE PSA FINANCE 2008 Annual Report
CoNSolIdAtEd FINANCIAl StAtEmENtS For thE yEArS ENdEd dECEmBEr 31, 2008 ANd 2007 2notes to the consolidated financial statements for the years ended december 31, 2007 and 2008
8.2 Analysis by geographical area
(in million euros) Dec. 31, 2008 Dec. 31, 2007
Net loans and receivables
France 8,428 8,594
European Union (excluding France) 12,627 13,774
Other European countries 327 307
Latin America 901 781
ToTal 22,283 23,456
8.3 Analysis by currency
(in million euros) Dec. 31, 2008 Dec. 31, 2007
Net loans and receivables
Euros 18,605 19,175
Pounds sterling (1) 1,789 2,539
Brazilian reals 742 651
Swiss francs 419 364
Polish zloty 249 244
Czech koruny 154 139
Mexican pesos 69 74
Danish kroner 41 77
Hungarian forints 42 45
Slovak kurony 55 41
Argentinian pesos 91 55
Swedish kronor 19 11
Norwegian kroner 8 41
ToTal 22,283 23,456
(1) The adjustments arising from the remeasurement of foreign currency customer loans refinanced in euros at period-end exchange rates, primarily a €151.8 million adjustment to the fair value of GBP customer loans at December 31, 2008, are offset by the fair value adjustments to the fair value of currency swaps hedging foreign currency customer loans (see Notes 5 and 14).
8.4 Analysis by maturity
Maturities of Retail finance receivables
(in million euros) Dec. 31, 2008 Dec. 31, 2007
Not broken down 666 481
0 to 3 months 1,694 1,839
3 months to 1 year 4,908 4,458
1 to 5 years 9,510 10,179
Over 5 years 336 155
ToTal, gross 17,114 17,112
Guarantee deposits (lease financing) (59) (57)
Impairment (277) (236)
neT 16,778 16,819

46 BANQUE PSA FINANCE 2008 Annual Report
CoNSolIdAtEd FINANCIAl StAtEmENtS For thE yEArS ENdEd dECEmBEr 31, 2008 ANd 20072notes to the consolidated financial statements for the years ended december 31, 2008 and 2007
BANQUE PSA FINANCE 2008 Annual Report
Maturities of other finance receivables
(in million euros) Dec. 31, 2008 Dec. 31, 2007
Not broken down 55 46
0 to 3 months 146 117
3 months to 1 year 185 162
1 to 5 years 437 408
Over 5 years 39 44
ToTal, gross 862 777
Impairment (20) (17)
neT 842 760
Maturities of Wholesale finance receivables
(in million euros) Dec. 31, 2008 Dec. 31, 2007
Not broken down 104 65
0 to 3 months 2,384 2,790
3 months to 1 year 1,531 2,851
1 to 5 years 410 -
Over 5 years 17 -
ToTal, gross 4,446 5,706
wholesale financing deposits (57) (83)
Impairment (19) (17)
neT 4,370 5,606
Note 9 Fair value adjustments to finance receivables portfolios hedged against interest rate risks
Hedging effectiveness is analysed in Note 21.4.
(in million euros) Dec. 31, 2008 Dec. 31, 2007
Fair value adjustments to
- Installment contracts 142 (43)
- Buyback contracts 30 (7)
- Long-term leases 41 (13)
ToTal (1) 213 (63)
(1) The sharp drop in market interest rates in 2008 led to significant positive fair value adjustments to fixed rate finance receivables, which were offset by negative fair value adjustments to financial instruments acquired as hedges of retail finance receivables (see Notes 5 and 14).
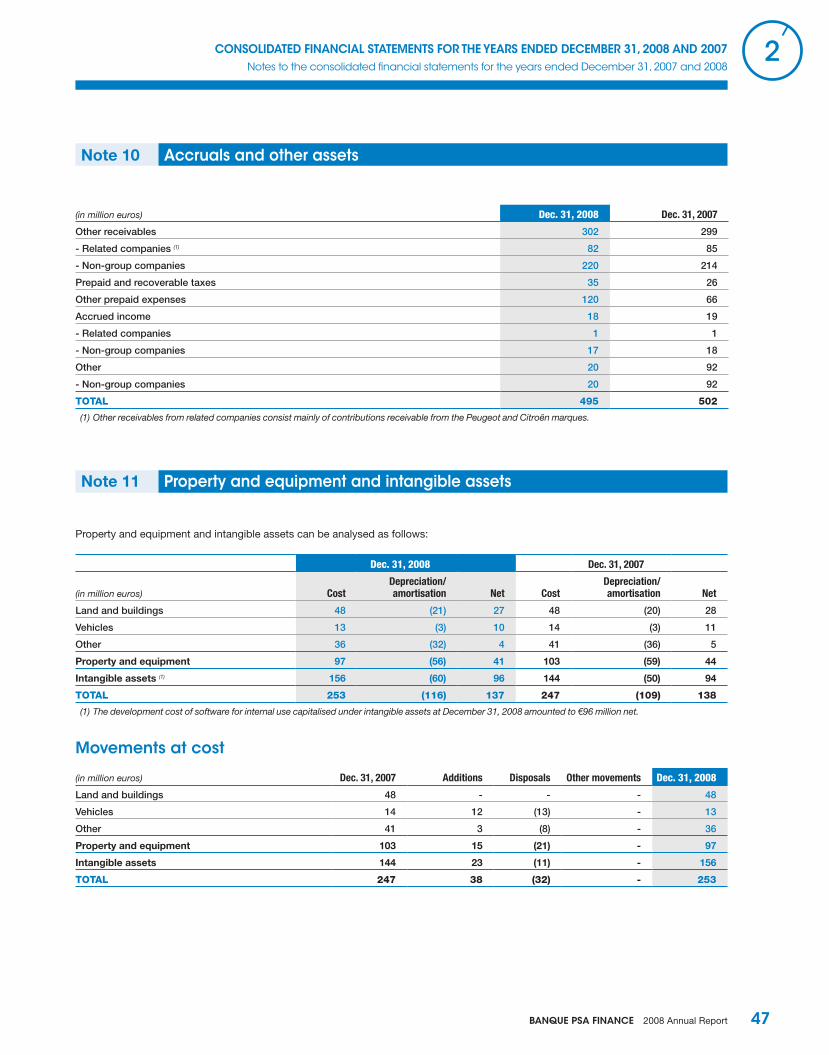
BANQUE PSA FINANCE 2008 Annual Report 47BANQUE PSA FINANCE 2008 Annual Report
CoNSolIdAtEd FINANCIAl StAtEmENtS For thE yEArS ENdEd dECEmBEr 31, 2008 ANd 2007 2notes to the consolidated financial statements for the years ended december 31, 2007 and 2008
Note 10 Accruals and other assets
(in million euros) Dec. 31, 2008 Dec. 31, 2007
Other receivables 302 299
- Related companies (1) 82 85
- Non-group companies 220 214
Prepaid and recoverable taxes 35 26
Other prepaid expenses 120 66
Accrued income 18 19
- Related companies 1 1
- Non-group companies 17 18
Other 20 92
- Non-group companies 20 92
ToTal 495 502
(1) Other receivables from related companies consist mainly of contributions receivable from the Peugeot and Citroën marques.
Note 11 Property and equipment and intangible assets
Property and equipment and intangible assets can be analysed as follows:
Dec. 31, 2008 Dec. 31, 2007
(in million euros) CostDepreciation/amortisation Net Cost
Depreciation/amortisation Net
Land and buildings 48 (21) 27 48 (20) 28
Vehicles 13 (3) 10 14 (3) 11
Other 36 (32) 4 41 (36) 5
Property and equipment 97 (56) 41 103 (59) 44
Intangible assets (1) 156 (60) 96 144 (50) 94
ToTal 253 (116) 137 247 (109) 138
(1) The development cost of software for internal use capitalised under intangible assets at December 31, 2008 amounted to €96 million net.
movements at cost
(in million euros) Dec. 31, 2007 Additions Disposals Other movements Dec. 31, 2008
Land and buildings 48 - - - 48
Vehicles 14 12 (13) - 13
Other 41 3 (8) - 36
Property and equipment 103 15 (21) - 97
Intangible assets 144 23 (11) - 156
ToTal 247 38 (32) - 253

48 BANQUE PSA FINANCE 2008 Annual Report
CoNSolIdAtEd FINANCIAl StAtEmENtS For thE yEArS ENdEd dECEmBEr 31, 2008 ANd 20072notes to the consolidated financial statements for the years ended december 31, 2008 and 2007
BANQUE PSA FINANCE 2008 Annual Report
Changes in depreciation and amortisation
(in million euros) Dec. 31, 2007 Additions Disposals Other movements Dec. 31, 2008
Land and buildings (20) (1) - - (21)
Vehicles (3) (3) 3 - (3)
Other (36) (2) 6 - (32)
Property and equipment (59) (6) 9 - (56)
Intangible assets (50) (9) - (1) (60)
ToTal (109) (15) 9 (1) (116)
Note 12 Goodwill
An impairment test carried out on December 31, 2008 revealed no impairment in the carrying amount of goodwill (see the comment on goodwill in Notes 2.B.3 and 2.B.4).
Note 13 Financial liabilities at fair value through profit or loss
(in million euros) Dec. 31, 2008 Dec. 31, 2007
Debt securities valued using the fair value option - 152
Fair value adjustments (1) - (3)
Total liabilities at fair value through profit or loss - 149
Accrued interest expense on derivatives representing economic hedges of marketable securities - 9
Accrued interest expense on derivatives representing economic hedges of liabilities valued using the fair value option - 1
Fair value of derivatives representing economic hedges of liabilities valued using the fair value option (3) - 2
Accrued expense on trading instruments - -
Fair value of trading instruments (2) (3) - 40
ToTal 0 201
(1) The Group elected to value this liability using the fair value option in order to recognize fair value adjustments to the liability symmetrically with fair value adjustments to the related hedging instruments. This debt was repaid in November 2008.
(2) Swaps classified as held for trading, mainly set up during securitisation transactions, represent closed positions that set each other off within homogeneous portfolios. They do not generate any material gains or losses (see Notes 4, 21.1 and 21.5).
(3) Fair value is determined by applying valuation techniques based for the most part on observable market data (level 2).

BANQUE PSA FINANCE 2008 Annual Report 49BANQUE PSA FINANCE 2008 Annual Report
CoNSolIdAtEd FINANCIAl StAtEmENtS For thE yEArS ENdEd dECEmBEr 31, 2008 ANd 2007 2notes to the consolidated financial statements for the years ended december 31, 2007 and 2008
Note 14 hedging instruments (liabilities)
(in million euros) Dec. 31, 2008 Dec. 31, 2007
Fair Value Hedges 419 113
Adjustment accounts - commitments in foreign currencies (1) 1 -
Unrealised gains on unclosed hedges - -
Accrued expenses on swaps designated as hedges 76 35
- of which related companies 4 4
Negative fair value of instruments designated as hedges of (2):
- Borrowings - 1
- EMTNs/BMTNs 3 29
- Bonds 130 42
- Certificates of deposit - 1
- Retail finance receivables 209 5
ToTal 419 113
(1) Adjustment accounts are used to record fair value adjustments to currency swaps designated as hedges of foreign currency customer loans refinanced in euros and foreign currency financing liabilities. These fair value adjustments are offset by adjustments arising from the remeasurement of the underlying foreign currency customer loans and financing liabilities at period-end exchange rates (see Notes 5, 8 and 17).
(2) Fair value is obtained thanks to valuation technicks using available datas on markets for the most significant of them (level 2).
Hedging effectiveness is analysed in Note 21.4.
Note 15 deposits from credit institutions
Analysis of demand and time accounts
(in million euros) Dec. 31, 2008 Dec. 31, 2007
Demand deposits (non-group institutions) 282 264
- Ordinary accounts in credit 272 262
- Accounts and deposits at overnight rates 9 -
- Other 1 2
Accrued interest 1 1
Time deposits (non-group institutions) (1) (2) 8,142 7,140
Debt issuing costs (deferred charges) (8) -
Accrued interest 119 74
ToTal 8,536 7,479
(1) Including €2,430 million at December, 2008 in short-term drawdowns on back-up lines corresponding to long-term financing commitments (see Note 24). Time deposits are analysed by maturity in Note 22.
(2) Including €446 million in deposits from Société de Financement de l’Economie Française (SFEF) that were received pursuant to the measures to finance the economy introduced in France’s amended Finance Act no.2008-1061 of October 16, 2008 (see Note 24 and section «Refinancing policy» on page 15 of the management report).

50 BANQUE PSA FINANCE 2008 Annual Report
CoNSolIdAtEd FINANCIAl StAtEmENtS For thE yEArS ENdEd dECEmBEr 31, 2008 ANd 20072notes to the consolidated financial statements for the years ended december 31, 2008 and 2007
BANQUE PSA FINANCE 2008 Annual Report
Analysis by repayment currency
(in million euros)
Dec. 31, 2008 Dec. 31, 2007
Demand deposits
Time deposits
Demand deposits
Time deposits
Euros 200 6,907 192 5,846
Pounds sterling 13 363 6 605
Brazilian reals - 552 - 423
Swiss francs 4 70 1 55
Czech koruny 3 121 3 103
Hungarian forints 20 - 18 2
Other 42 129 44 106
ToTal 282 8,142 264 7,140
Note 16 due to customers
(in million euros) Dec. 31, 2008 Dec. 31, 2007
Time accounts
Non-group companies (1) 17 11
Sub-total 17 11
Demand accounts
Related companies 59 93
- of which PSA Peugeot Citroën Group entities’ ordinary accounts in credit (2) 55 93
Non-group companies (independent dealers’ ordinary accounts in credit) 184 217
Sub-total 243 310
ToTal 260 321
(1) Time accounts are analysed by maturity in Note 22.(2) Primarily comprising subsidiaries’ payment accounts concerning transactions with the PSA Peugeot Citroën Group. In 2007, the higher amount is mainly due
to the cash surplus on the GIE PSA Tresorerie current account with SOFIB (€32 million).
Analysis of time accounts (excluding accrued interest) by repayment currency
(in million euros) Dec. 31, 2008 Dec. 31, 2007
Euros 14 9
Other 3 2
ToTal 17 11

BANQUE PSA FINANCE 2008 Annual Report 51BANQUE PSA FINANCE 2008 Annual Report
CoNSolIdAtEd FINANCIAl StAtEmENtS For thE yEArS ENdEd dECEmBEr 31, 2008 ANd 2007 2notes to the consolidated financial statements for the years ended december 31, 2007 and 2008
Note 17 debt securities
Analysis by type of security
(in million euros) Dec. 31, 2008 Dec. 31, 2007
Interbank instruments and money-market securities (non-group institutions) 7,840 11,950
- EMTNs 4,534 7,134
- BMTNs 10 25
- Certificates of deposit and “billets de trésorerie” 3,296 4,791
- of which paper in the process of being delivered 29 -
Accrued interest 41 65
Debt issuing costs (deferred charges) (13) (13)
Deferred gains 2 3
Bonds (1) 4,664 3,763
- of which securitisation: preferred and subordinated bonds (2)
- Related companies 25 -
- Non-group companies 4,226 3,350
Accrued interest 31 25
- of which securitisation 30 25
Other debt securities 431 878
- of which securitisation: preferred and subordinated bonds 310 738
Accrued interest 9 17
- of which securitisation - 4
ToTal 13,005 16,688
(1) Of which a €413 million 7-year bond issue launched by the subsidiary PSA Finance S.C.S. in December 2006.(2) Bonds issued by the Auto ABS 2006-1, 2007-1 and 2008-01 funds and the Italian 2007-02 fund.
maturity of debt securities (excluding accrued interest)
Dec. 31, 2008 Dec. 31, 2007
(in million euros) BondsMoney-market
securities Others BondsMoney-market
securities Others
0 to 3 months - 3,263 90 - 5,821 203
3 months to 1 year - 1,916 164 - 2,737 222
1 to 5 years 3,722 2,652 177 850 3,383 391
Over 5 years 942 9 - 2,913 9 62
ToTal 4,664 7,840 431 3,763 11,950 878
Analysis of debt securities by repayment currency (1)
Dec. 31, 2008 Dec. 31, 2007
(in million euros) BondsMoney-market
securities Others BondsMoney-market
securities Others
Euros 4,664 6,950 367 3,763 11,433 799
Pounds sterling - 157 - - 204 -
Brazilian reals - - 64 - - 79
Czech koruny - - - - 49 -
Japanese yen - 733 - - 264 -
ToTal 4,664 7,840 431 3,763 11,950 878
(1) Adjustments arising from the remeasurement of hedged foreign currency financing liabilities at period-end exchange rates (primarily a €152.4 million adjustment to the fair value of JPY debt at December 31, 2008) are offset by fair value adjustments to the corresponding currency swaps (see Notes 5 and 14).
Banque PSA Finance’s residual currency position is presented in Note 21.

52 BANQUE PSA FINANCE 2008 Annual Report
CoNSolIdAtEd FINANCIAl StAtEmENtS For thE yEArS ENdEd dECEmBEr 31, 2008 ANd 20072notes to the consolidated financial statements for the years ended december 31, 2008 and 2007
BANQUE PSA FINANCE 2008 Annual Report
Note 18 Fair value adjusments to debt portfolios hedged against interest rate risks
(in million euros) Dec. 31, 2008 Dec. 31, 2007
Fair value adjustments to borrowings (1) 12 (1)
Fair value adjustments to EMTNs/BMTNs (1) 10 (26)
Fair value adjustment to certificates of deposit 2 -
Fair value adjustments to bonds 1 (1)
ToTal 25 (28)
(1) The sharp drop in market interest rates in 2008 led to a significant reduction in the value of interest rate risk on these debts, while at the same time driving up the value of the borrowings and EMTN/BMTN hedges (see Notes 5 and 14).
Hedging effectiveness is analysed in Note 21.4.
Note 19 Accruals and other liabilities
(in million euros) Dec. 31, 2008 Dec. 31, 2007
Trade payables 199 222
- Related companies (1) 135 167
- Non-group companies 64 55
Accrued payroll and other taxes 53 45
Accrued charges 169 187
- Related companies 31 31
- Non-group companies 138 156
Deferred income 174 58
- Related companies 5 9
- Non-group companies 169 49
Other payables 18 18
- Related companies 3 2
- Non-group companies 15 16
Other 65 68
- Non-group companies 65 68
ToTal 678 598
(1) Representing the price of vehicles payable to the Peugeot and Citroën marques.

BANQUE PSA FINANCE 2008 Annual Report 53BANQUE PSA FINANCE 2008 Annual Report
CoNSolIdAtEd FINANCIAl StAtEmENtS For thE yEArS ENdEd dECEmBEr 31, 2008 ANd 2007 2notes to the consolidated financial statements for the years ended december 31, 2007 and 2008
Note 20 Provisions
(in million euros)Dec. 31,
2007 Charges UtilisedReversals Unutilised
Reclassifications, currency effect
Dec. 31, 2008
Provisions for pensions and other post-retirement benefits 25 3 (3) - - 25
Provisions for doubtful wholesale commitments 5 - (1) - - 4
Provisions for losses on sales of used cars (1) 12 5 (3) - (3) 11
Provision for leasing risk in Portugal 5 - - - - 5
Provision for self-insurance risk 2 - - - - 2
Provisions for sub-contracted long term leases 1 - - - - 1
Other 6 1 - (1) - 6
ToTal 56 9 (7) (1) (3) 54
(1) The majority of these provisions are intended to cover losses on vehicles recovered or to be recovered in the United Kingdom, under contracts that give the borrower the option of returning the vehicle early without penalty.
20.1 Pension obligations
A. Plan descriptionGroup employees in certain countries are entitled to supplementary pension benefits, paid annually, or to a lump-sum length-of-service award paid when the employee retires. The corresponding plans include both defined benefit and defined contribution plans. The Group’s liability under defined contribution plans is limited to the payment of contributions, which are recognised as an expense in the payment year. The main countries with defined benefit plans are France and the United Kingdom.
In France, defined benefit obligations concern:
statutory length-of-service awards payable to employees when •they retire;
supplementary pension benefits payable to excecutives. The •obligation corresponds to the portion not transferred to an external fund in 2002. The plan is closed to new participants.
In the United Kingdom, defined benefit plans have been closed to new participants since May 2002.
B. AssumptionsThe actuarial assumptions used in the last two years to measure projected benefit obligations were as follows:
Euro zone United Kingdom
Discount rate
2008 5.50% 6.00%
2007 5.25% 5.75%
2006 4.50% 5.10%
Inflation rate
2008 2.00% 3.00%
2007 2.00% 3.10%
2006 2.00% 2.80%
Expected return on external funds
2008 5.25% 7.00%
2007 6.00% 7.00%
2006 6.00% 7.00%
Assumptions concerning future salary levels reflect, for each country, projected inflation rates and assumptions related to individual pay increases. The calculations are based on inflation plus 1% in 2009 and inflation plus 0.5% in subsequent years for France, and inflation plus 1.5% for the United Kingdom.
Mortality and staff turnover assumptions are based on the specific economic conditions of each Group company or the country in which they operate.
Sensitivity of assumptions: a 0.25-point increase or decrease in the actuarial rate (discount rate – inflation rate) would lead to an increase or decrease in the projected benefit obligation of 2.4% for French plans and 5.4% for UK plans.
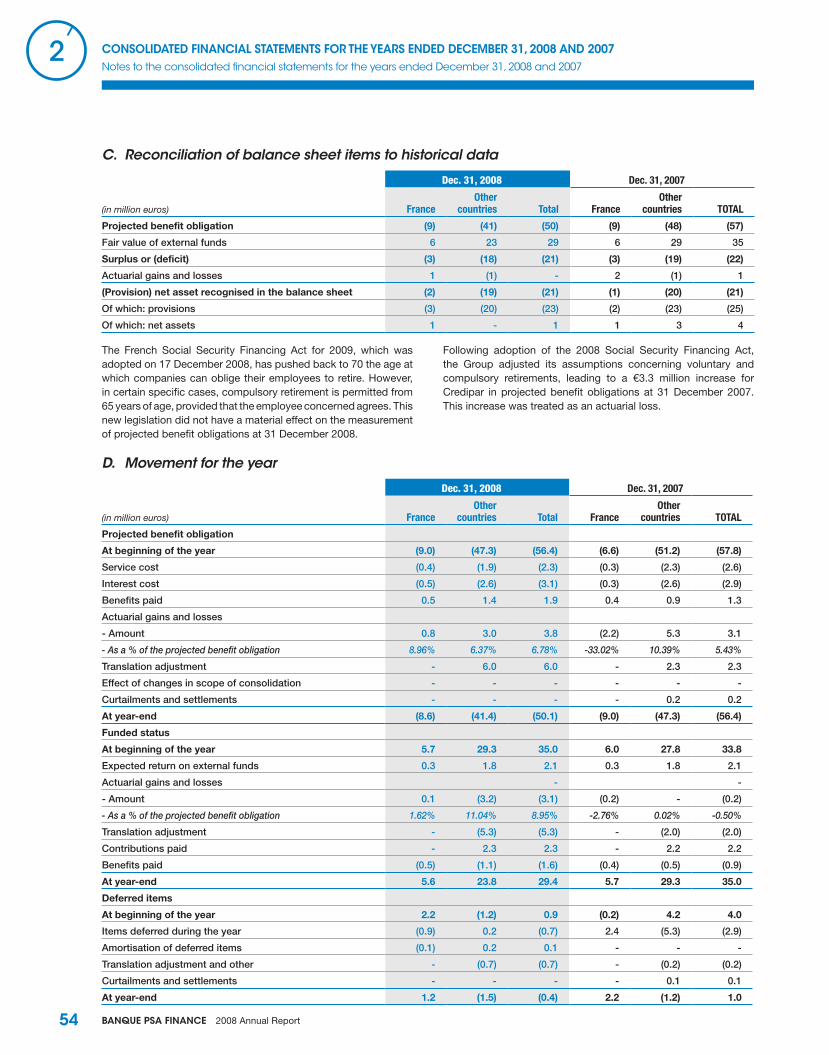
54 BANQUE PSA FINANCE 2008 Annual Report
CoNSolIdAtEd FINANCIAl StAtEmENtS For thE yEArS ENdEd dECEmBEr 31, 2008 ANd 20072notes to the consolidated financial statements for the years ended december 31, 2008 and 2007
BANQUE PSA FINANCE 2008 Annual Report
C. Reconciliation of balance sheet items to historical data
(in million euros)
Dec. 31, 2008 Dec. 31, 2007
FranceOther
countries Total FranceOther
countries TOTAl
Projected benefit obligation (9) (41) (50) (9) (48) (57)
Fair value of external funds 6 23 29 6 29 35
Surplus or (deficit) (3) (18) (21) (3) (19) (22)
Actuarial gains and losses 1 (1) - 2 (1) 1
(Provision) net asset recognised in the balance sheet (2) (19) (21) (1) (20) (21)
Of which: provisions (3) (20) (23) (2) (23) (25)
Of which: net assets 1 - 1 1 3 4
The French Social Security Financing Act for 2009, which was adopted on 17 December 2008, has pushed back to 70 the age at which companies can oblige their employees to retire. However, in certain specific cases, compulsory retirement is permitted from 65 years of age, provided that the employee concerned agrees. This new legislation did not have a material effect on the measurement of projected benefit obligations at 31 December 2008.
Following adoption of the 2008 Social Security Financing Act, the Group adjusted its assumptions concerning voluntary and compulsory retirements, leading to a €3.3 million increase for Credipar in projected benefit obligations at 31 December 2007. This increase was treated as an actuarial loss.
D. Movement for the year
(in million euros)
Dec. 31, 2008 Dec. 31, 2007
FranceOther
countries Total FranceOther
countries TOTAl
Projected benefit obligation
At beginning of the year (9.0) (47.3) (56.4) (6.6) (51.2) (57.8)
Service cost (0.4) (1.9) (2.3) (0.3) (2.3) (2.6)
Interest cost (0.5) (2.6) (3.1) (0.3) (2.6) (2.9)
Benefits paid 0.5 1.4 1.9 0.4 0.9 1.3
Actuarial gains and losses
- Amount 0.8 3.0 3.8 (2.2) 5.3 3.1
- As a % of the projected benefit obligation 8.96% 6.37% 6.78% -33.02% 10.39% 5.43%
Translation adjustment - 6.0 6.0 - 2.3 2.3
Effect of changes in scope of consolidation - - - - - -
Curtailments and settlements - - - - 0.2 0.2
At year-end (8.6) (41.4) (50.1) (9.0) (47.3) (56.4)
Funded status
At beginning of the year 5.7 29.3 35.0 6.0 27.8 33.8
Expected return on external funds 0.3 1.8 2.1 0.3 1.8 2.1
Actuarial gains and losses - -
- Amount 0.1 (3.2) (3.1) (0.2) - (0.2)
- As a % of the projected benefit obligation 1.62% 11.04% 8.95% -2.76% 0.02% -0.50%
Translation adjustment - (5.3) (5.3) - (2.0) (2.0)
Contributions paid - 2.3 2.3 - 2.2 2.2
Benefits paid (0.5) (1.1) (1.6) (0.4) (0.5) (0.9)
At year-end 5.6 23.8 29.4 5.7 29.3 35.0
Deferred items
At beginning of the year 2.2 (1.2) 0.9 (0.2) 4.2 4.0
Items deferred during the year (0.9) 0.2 (0.7) 2.4 (5.3) (2.9)
Amortisation of deferred items (0.1) 0.2 0.1 - - -
Translation adjustment and other - (0.7) (0.7) - (0.2) (0.2)
Curtailments and settlements - - - - 0.1 0.1
At year-end 1.2 (1.5) (0.4) 2.2 (1.2) 1.0

BANQUE PSA FINANCE 2008 Annual Report 55BANQUE PSA FINANCE 2008 Annual Report
CoNSolIdAtEd FINANCIAl StAtEmENtS For thE yEArS ENdEd dECEmBEr 31, 2008 ANd 2007 2notes to the consolidated financial statements for the years ended december 31, 2007 and 2008
E. Expense for the yearPension costs are recognised as follows:
the service cost and amortisation of deferred items are •recognised in General operating expenses (Personnel costs);
the interest cost, corresponding to the discounting adjustment •to benefit obligations, is recognised under “Interest cost on pension obligations”;
the expected return on external funds is recognised under •“Expected return on external pension funds”;
exceptionally, in “Other non-operating items” for the effects of •restructuring plans.
Pension costs break down as follows:
(in million euros)
Dec. 31, 2008 Dec. 31, 2007
FranceOther
countries Total FranceOther
countries TOTAl
Service cost (0.4) (1.9) (2.3) (0.3) (2.3) (2.6)
Amortisation of deferred items (0.1) 0.2 0.1 - - -
Interest cost (0.5) (2.6) (3.1) (0.3) (2.6) (2.9)
Expected return on external funds 0.3 1.7 2.0 0.3 1.8 2.1
Other - - - - 0.3 0.3
ToTal (0.7) (2.6) (3.3) (0.3) (2.8) (3.1)
Note 21 derivatives
Group interest rate management policy(see section “Financial Risk Management” on page 18 of the Management Report)
Interest rate risk: Bank policy aims at neutralizing the effects of changes in interest rates on each entity’s operating margin by using appropriate financial instruments to match interest rate structures between assets and liabilities.
In the period up to the third quarter 2008, in order to cap the refinancing cost of new retail financing granted in euros, Banque PSA Finance purchased swaptions (options on interest rate swaps - see paragraph 21.2 below).
Currency risk: Banque PSA Finance does not take currency positions. The assets and liabilities of each entity are matched through the use of appropriate financial instruments.
Counterparty risk: Banque PSA Finance’s exposure to counterparty risk is limited to its use of derivatives governed by standard FBF or ISDA agreements and very short term cash investments with leading counterparties. Customer credit risk is discussed in Note 32.
The bank does not incur any exposure from the implementation of its investment policy. Available cash is invested solely in very short-term retail certificates of deposits and in mutual funds with a capital guarantee and a guaranteed yield.
Liquidity risk: see Note 22 below.

56 BANQUE PSA FINANCE 2008 Annual Report
CoNSolIdAtEd FINANCIAl StAtEmENtS For thE yEArS ENdEd dECEmBEr 31, 2008 ANd 20072notes to the consolidated financial statements for the years ended december 31, 2008 and 2007
BANQUE PSA FINANCE 2008 Annual Report
21.1 Banque PSA Finance interest rate position at december 31, 2008
(in million euros) 0 to 1 year 1 to 5 years +5 yearsTotal on
Dec. 31, 2008Financial assetswholesale financing 4,351 - - 4,351Fixed rate Retail financing 6,799 10,329 - 17,128Other adjustable rate loans and receivables 804 - - 804Fixed rate financial assets - - - -Other financial assets 2,503 - - 2,503Total financial assets (a) 14,457 10,329 - 24,786Other financial assets (derivatives and fair value adjustments to hedged finance receivables portfolios) 740 - - 740Non financial assetsFixed assets and goodwill - 218 - 218Other non financial assets 626 - - 626Total non financial assets 626 218 - 844Total assets 26,370Financial liabilitiesHedged fixed rate debt (1,795) (1,752) (55) (3,602)Hedged adjustable rate debt (17,476) - - (17,476)Other borrowings and deposits (543) - - (543)Total financial liabilities (b) (19,814) (1,752) (55) (21,621)Other financial liabilities (derivatives and fair value adjustments to hedged debt portfolios) (444) - - (444)Non financial liabilitiesNon financial liabilities (1,381) - - (1,381)Total non financial liabilities (1,381) - - (1,381)Equity (3) - (2,924) - (2,924)Total equity and liabilities (26,370)NET POSITION BEFORE HEDGING = (a) + (b) (5,357) 8,577 (55) 3,165Derivatives - Notional amountsDerivatives hedging financial assetsSwaps hedging fixed rate retail financing, borrowing leg (Fair Value Hedge) (5,883) (7,003) - (12,886)Swaps hedging fixed rate retail financing, lending leg (Fair Value Hedge) 12,886 - - 12,886Swaps hedging marketable securities, borrowing leg (economic hedges of marketable securities) - - - -Swaps hedging marketable securities, lending leg (economic hedges of marketable securities) - - - -Total derivatives hedging financial assets (c) 7,003 (7,003) - -Derivatives hedging financial liabilitiesSwaps hedging fixed rate debt, lending leg (Fair Value Hedge) (2) 1,702 1,568 55 3,325Swaps hedging fixed rate debt, borrowing leg (Fair Value Hedge) (2) (3,325) - - (3,325)Total derivatives hedging financial liabilities (d) (1,623) 1,568 55 -Trading transactions (e) (1) - - - -derivaTives neT posiTion = (c) + (d) + (e) 5,380 (5,435) 55 -Net position after hedging (3) 23 3,142 - 3,165
(1) There were no isolated open swap positions in the trading portfolio at December 31, 2008. Swaps classified as held for trading, mainly set up during securitisation transactions, represent closed positions that set each other off within homogeneous portfolios for a notional amount of €310 million. They do not generate any material gains or losses (see Notes 4 and 13).
(2) Including €4.251 million of hedging swaps closed at consolidated level.(3) The net position after hedging, with maturities ranging from 0 to 1 year, is not significant. The net position after hedging, with maturities ranging from 1 to 5 years,
amounts to €3.142 million and is hedged by equity.
This table analyzes financial assets and liabilities based on their maturity, for fixed rate items, or the next repricing date, for adjustable rate items.
In the section dealing with derivatives, the lending leg of swaps and other derivative transactions are reported as a positive amount and the borrowing leg is reported as a negative amount.

BANQUE PSA FINANCE 2008 Annual Report 57BANQUE PSA FINANCE 2008 Annual Report
CoNSolIdAtEd FINANCIAl StAtEmENtS For thE yEArS ENdEd dECEmBEr 31, 2008 ANd 2007 2notes to the consolidated financial statements for the years ended december 31, 2007 and 2008
21.2 hedges of interest rate risks on future lending transactions
In the period up to the third quarter 2008, in order to cap the refinancing cost of new retail financing granted in euros, Banque PSA Finance purchased swaptions (options on interest rate swaps). The notional amounts of the swaps and their maturities (which range from one to five years) match the forecast amounts and maturities of new retail financing expected to be originated in the same period. At December 31, 2008, the loss resulting
from time decay since the beginning of the year was €8 million, including €3.5 million in positive fair value adjustments.
The change in intrinsic value of €11.6 million was recognised directly in equity under “Deferred gains or losses on financial instruments”. The deferred portion of the intrinsic value released to income during the period, to offset changes in the intrinsic value of the underlying, was €32.5 million. Deferred gains or losses amount to €27.6 million (€18.1 million net of deferred tax - see “Consolidated statement of changes in equity”).
Swaptions designated as cash flow hedges
(in million euros)Dec. 31,
2007
Change in intrinsic
valueGains or
lossesTransfer
to incomeChange in
deferred taxDec. 31,
2008
Intrinsic value of open swaptions 1.0 11.6 (12.6) - -
Hedging gains or losses 47.5 - 12.6 (32.5) 27.6
Deferred gains or losses recognised in equity (gross) 48.5 11.6 - (32.5) - 27.6
Deferred tax (16.7) 7.2 (9.5)
Deferred gains or losses recognised in equity (net) 31.8 11.6 - (32.5) 7.2 18.1
Timing of impacts on income
(in million euros) Dec. 31, 2008 Dec. 31, 2007
0 to 3 months 0.5 8.5
3 months to 1 year 8.2 20.8
1 to 5 years 18.9 19.2
Over 5 years - -
ToTal deferred gains on swapTions 27.6 48.5
Timing of hedged future retail financing
(in million euros) Dec. 31, 2008 Dec. 31, 2007
0 to 3 months - -
3 months to 1 year - 91
1 to 5 years - 2,431
Over 5 years - -
ToTal deferred gains on swapTions (1) - 2,522
(1) At December 31, 2008, all the swaptions are at maturity.

58 BANQUE PSA FINANCE 2008 Annual Report
CoNSolIdAtEd FINANCIAl StAtEmENtS For thE yEArS ENdEd dECEmBEr 31, 2008 ANd 20072notes to the consolidated financial statements for the years ended december 31, 2008 and 2007
BANQUE PSA FINANCE 2008 Annual Report
21.3 Banque PSA Finance residual positions in foreign currencies at december 31, 2008
A. Operational positions in foreign currencies
external parent’s positions
(in million euros) JPY USD CZK SKK CHF HUF PlN MXN GBP
Assets 3 - 3 6 270 17 164 44 1,200
Liabilities (735) - (1) - - - - - (163)
Net position before hedging (732) - 2 6 270 17 164 44 1,037
Hedging assets - - (2) (6) (270) (17) (164) (44) (1,037)
Hedging liabilities 732 - - - - - - - -
Hedging position 732 - (2) (6) (270) (17) (164) (44) (1,037)
Net position after hedging 2008 - - - - - - - - -
Note: net position after hedging 2007 - - - - - - - - -
external subsidiaries’ positions
(in million euros) EUR/GBP EUR/CHF USD/EUR EUR/BRl CHF/HUF EUR/PNl EUR/DKK EUR/NOK EUR/SEK
Assets - - - - 7 - 41 8 19
Liabilities - - - (32) (7) - - - -
Net position before hedging - - - (32) - - 41 8 19
Hedging assets - - - 32 - - - - -
Hedging liabilities - - - - - - (41) (8) (19)
Hedging position - - - 32 - - (41) (8) (19)
Net position after hedging - - - - - - - - -
Note: net position after hedging 2007 - - - - - - - - -
These positions are hedged using currency swaps, cross currency swaps and foward foreign exchange contracts.
B. Structural positions in foreign currenciesStructural positions (investments in subsidiaries and the branches’ dotation capital) and future profits and losses are not hedged using
derivative financial instruments. As the business of subsidiaries and branches will, by definition, continue for an indefinite period, any such hedges would represent long-term open positions.
Position at Dec. 31,2008 CZK HUF MXN SKK CHF GBP USD (1) PlN HRK CNY TRY TOTAl
(in million euros) 15 10 7 4 11 143 120 48 3 13 1 375
(1) The structural position in US dollars arises from the financing in dollars of the bank’s net investment in its Brazilian and Argentine subsidiaries.

BANQUE PSA FINANCE 2008 Annual Report 59BANQUE PSA FINANCE 2008 Annual Report
CoNSolIdAtEd FINANCIAl StAtEmENtS For thE yEArS ENdEd dECEmBEr 31, 2008 ANd 2007 2notes to the consolidated financial statements for the years ended december 31, 2007 and 2008
21.4 Analysis of hedging effectiveness
(in million euros) Dec. 31, 2008 Dec. 31, 2007Fair value
adjustments
Ineffective portion
recognised in profit or loss
Fair value adjustments to retail loans (see Note 9)
- Installment contracts 142 (43)
- Buyback contracts 30 (7)
- Long-term leases 41 (13)
ToTal valuaTion, neT 213 (63) 276
Derivatives designated as hedges of retail loans
- Assets (see Note 5) 2 79
- Liabilities (see Note 14) (209) (5)
ToTal valuaTion, neT (207) 74 (281) (5)
Ineffective portion of gains and losses on outstanding hedging transactions (1) 6 11 (5)Fair value adjustments to hedged debt (see Note 18)
Valuation (12) 1
ToTal valuaTion, neT (12) 1 (13)
Derivatives designated as hedges of debt
- Assets (see Note 5) 11 -
- Liabilities (see Note 14) - (1)
ToTal valuaTion, neT 11 (1) 12 (1)
Ineffective portion of gains and losses on outstanding hedging transactions (1) 0 (1)Fair value adjustments to hedged EMTNs/BMTNs (see Note 18)
Valuation (10) 26
ToTal valuaTion, neT (10) 26 (36)
Derivatives designated as hedges of EMTNs/BMTNs
- Assets (see Note 5) 12 1
- Liabilities (see Note 14) (3) (29)
ToTal valuaTion, neT 9 (28) 37 1
Ineffective portion of gains and losses on outstanding hedging transactions (1) (2) 1
Fair value adjustments to hedged bonds (see Note 18)
Valuation - -
ToTal valuaTion, neT - - -
Derivatives designated as hedges of bonds
- Assets (see Note 5) 130 42
- Liabilities (see Note 14) (130) (42)
ToTal valuaTion, neT - - - 0
Ineffective portion of gains and losses on outstanding hedging transactions 0 0 0
Fair value adjustments to hedged certificates of deposits (see Note 18)
Valuation (2) -
ToTal valuaTion, neT (2) - (2)
Derivatives designated as certificates of deposits
- Assets (see Note 5) 2 -
- Liabilities (see Note 14) - -
ToTal valuaTion, neT 2 - 2 0
Ineffective portion of gains and losses on outstanding hedging transactions 0 0 0
Fair value adjustments to other hedged debt securities (see Note 18)
Valuation (1) 1
ToTal valuaTion, neT (1) 1 (2)
Derivatives designated as hedges of other debt securities
- Assets 1 -
- Liabilities (see Note 14) - (1)
ToTal valuaTion, neT 1 (1) 2 0
Ineffective portion of gains and losses on outstanding hedging transactions 0 0 0
(1) Due to the sharp drop in interest rates since the beginning of the year, the portion of hedges of fixed rate loans that was structurally ineffective amounted to a negative €5 million in 2008 versus a positive €1 million in 2007.
Swaptions held to hedge future retail loans are not included in the hedging effectiveness table as the loans do not yet exist (see paragraph 21.2 above).

60 BANQUE PSA FINANCE 2008 Annual Report
CoNSolIdAtEd FINANCIAl StAtEmENtS For thE yEArS ENdEd dECEmBEr 31, 2008 ANd 20072notes to the consolidated financial statements for the years ended december 31, 2008 and 2007
BANQUE PSA FINANCE 2008 Annual Report
21.5 Financial assets and liabilities at fair value
(in million euros) Dec. 31, 2008 Dec. 31, 2007Fair value
adjustments
Financial assets at fair value (see Note 4)
- Fair value adjustments to marketable securities - - -
- Fair value of derivatives representing economic hedges of marketable securities - 1 (1)
- Fair value of derivatives representing economic hedges of liabilities valued using the fair value option - - -
- Fair value of trading derivatives - 40 (40)
ToTal valuaTion, neT - 41 (41)
Financial liabilities at fair value (see Note 13)
- Fair value adjustments to liabilities valued using the fair value option - 3 (3)
- Fair value of derivatives representing economic hedges of liabilities valued using the fair value option - (2) 2
- Fair value of trading derivatives - (40) 40
ToTal valuaTion, neT - (39) 39
Impact in profit or loss (2)
Note 22 Analysis by maturity and liquidity risks
Liquidity risk is assessed based on a detailed breakdown of assets and liabilities analysed by maturity, with maturities defined in the same way as for the calculation of Banque PSA Finance’s consolidated liquidity ratio.
Derivative instruments designated as hedges of future contractual interest payments are not analysed by maturity.
Equity is not analysed by maturity as it is considered as having no fixed maturity.

BANQUE PSA FINANCE 2008 Annual Report 61BANQUE PSA FINANCE 2008 Annual Report
CoNSolIdAtEd FINANCIAl StAtEmENtS For thE yEArS ENdEd dECEmBEr 31, 2008 ANd 2007 2notes to the consolidated financial statements for the years ended december 31, 2007 and 2008
For 2008
(in million euros)Not broken
down 0 to 3 months3 months to 1 year 1 to 5 years Over 5 years Dec. 31, 2008
Assets
Cash, central banks, post office banks (1) - 9 - - - 9
Financial assets at fair value through profit or loss (1) 48 1,111 - - - 1,159
Hedging instruments 526 526
Available-for-sale financial assets 12 12
Loans and advances to credit institutions (1) 1 1,339 - - - 1,340
Customer loans and receivables (1) 686 4,224 6,623 10,358 392 22,283
Fair value adjustments to finance receivables portfolios hedged against interest rate risks 213 213
Held-to-maturity investments - -
Current tax assets 35 35
Deferred tax assets 66 66
Accruals and other assets 495 495
Investments in associates and joint ventures 14 14
Property and equipment 41 41
Intangible assets 96 96
Goodwill 81 81
ToTal asseTs 2,314 6,683 6,623 10,358 392 26,370
Equity and liabilities
Central banks, post office banks - -
Financial liabilities at fair value through profit or loss (1) - -
Hedging instruments 419 419
Deposits from credit institutions (1) 112 3,439 2,166 2,819 - 8,536
Due to customers (1) - 243 15 2 - 260
Debt securities (1) 70 3,353 2,080 6,551 951 13,005
Fair value adjustments to debt portfolios hedged against interest rate risks 25 25
Current tax liabilities 27 27
Deferred tax liabilities 442 442
Accruals and other liabilities 678 678
Provisions 54 54
Subordinated debt - -
Equity 2,924 2,924
ToTal equiTy and liabiliTies 4,751 7,035 4,261 9,372 951 26,370

62 BANQUE PSA FINANCE 2008 Annual Report
CoNSolIdAtEd FINANCIAl StAtEmENtS For thE yEArS ENdEd dECEmBEr 31, 2008 ANd 20072notes to the consolidated financial statements for the years ended december 31, 2008 and 2007
BANQUE PSA FINANCE 2008 Annual Report
For 2007
(in million euros)Not broken
down 0 to 3 months3 months to 1 year 1 to 5 years Over 5 years Dec. 31, 2007
Assets
Cash, central banks, post office banks (1) - 21 - - - 21
Financial assets at fair value through profit or loss (1) 111 2,737 - - 548 3,396
Hedging instruments 201 201
Available-for-sale financial assets 3 3
Loans and advances to credit institutions (1) 2 925 - - - 927
Customer loans and receivables (1) 453 4,746 7,471 10,587 199 23,456
Fair value adjustments to finance receivables portfolios hedged against interest rate risks (63) (63)
Held-to-maturity investments - -
Current tax assets 37 37
Deferred tax assets 28 28
Accruals and other assets 502 502
Investments in associates and joint ventures 12 12
Property and equipment 44 44
Intangible assets 94 94
Goodwill 81 81
ToTal asseTs 1,505 8,429 7,471 10,587 747 28,739
Equity and liabilities
Central banks, post office banks - -
Financial liabilities at fair value through profit or loss (1) 201 201
Hedging instruments 113 113
Deposits from credit institutions (1) 75 4,565 1,233 1,606 - 7,479
Due to customers (1) - 311 8 2 321
Debt securities (1) 97 6,024 2,959 4,624 2,984 16,688
Fair value adjustments to debt portfolios hedged against interest rate risks (28) (28)
Current tax liabilities 55 55
Deferred tax liabilities 356 356
Accruals and other liabilities 598 598
Provisions 56 56
Subordinated debt - -
Equity 2,900 2,900
ToTal equiTy and liabiliTies 4,423 10,900 4,200 6,230 2,986 28,739
(1) The analysis by maturity is based on the following principles: - Non-performing loans and accrued interest are reported in the “not broken down” column, in line with the principle applied for the calculation of the Bank’s
consolidated liquidity ratio; - Overnight loans and borrowings are reported in the “0 to 3 months” column.

BANQUE PSA FINANCE 2008 Annual Report 63BANQUE PSA FINANCE 2008 Annual Report
CoNSolIdAtEd FINANCIAl StAtEmENtS For thE yEArS ENdEd dECEmBEr 31, 2008 ANd 2007 2notes to the consolidated financial statements for the years ended december 31, 2007 and 2008
Note 23 Fair value of financial assets and liabilities
(in million euros)
Fair value (6) Book value Deferred gain or loss
Dec. 31, 2008 Dec. 31, 2007 Dec. 31, 2008 Dec. 31, 2007 Dec. 31, 2008 Dec. 31, 2007
Assets
Cash, central banks, post office banks 9 21 9 21 0 0
Financial assets at fair value through profit or loss (1) 1,159 3,396 1,159 3,396 0 0
Hedging instruments (1) 526 201 526 201 0 0
Available-for-sale financial assets (2) 12 3 12 3 0 0
Loans and advances to credit institutions (3) 1,340 927 1,340 927 0 0
Customer loans and receivables (4) 22,140 23,255 22,496 23,393 (356) (138)
Liabilities
Central banks, post office banks - - - 0 0
Financial liabilities at fair value through profit or loss (1) - 201 - 201 0 0
Hedging instruments (1) 419 113 419 113 0 0
Deposits from banks (5) 8,524 7,467 8,536 7,479 (12) (12)
Due to customers (5) 260 321 260 321 0 0
Debt securities (5) 13,051 16,643 13,030 16,660 21 (17)
The main measurement methods applied are as follows:(1) The fair values of financial assets at fair value through profit or loss and hedging instruments are measured based on Euribor or other interbank market rates and
on the daily exchange rates set by the European Central Bank.(2) The fair value of investments in companies that are not yet consolidated, which are included in “Available-for-sale financial assets”, corresponds to their amortised
cost.(3) The fair value of very short-term loans and advances to banks is close to their amortised cost.(4) Customer loans and receivables are stated at amortised cost. They are generally hedged against interest rate risks (fair value hedge) and are therefore remeasured
at the hedging rate (swap rate), in accordance with hedge accounting principles. Cumulative gains and losses arising from remeasurement are added to or deducted from their amortised cost. The fair value presented above has been estimated by discounting future cash flows at the rate at which similar loans were granted at the year-end.
(5) Financing liabilities are stated at amortised cost. Hedge accounting is applied to liabilities hedged by interest rate swaps (fair value hedge), leading to their remeasurement at the discounted financing cost. Cumulative gains and losses arising from remeasurement are added to or deducted from their amortised cost. The fair value presented above therefore corresponds mainly to the change in the spread (premium over the risk-free rate) paid by Banque PSA Finance on its financial market borrowings.
(6) Fair value is determined by applying valuation techniques based for the most part on observable market data (level 2).
The other balance sheet items not listed above are either non-financial items, or very short-term assets and liabiities whose fair value is not materially different from their book value.

64 BANQUE PSA FINANCE 2008 Annual Report
CoNSolIdAtEd FINANCIAl StAtEmENtS For thE yEArS ENdEd dECEmBEr 31, 2008 ANd 20072notes to the consolidated financial statements for the years ended december 31, 2008 and 2007
BANQUE PSA FINANCE 2008 Annual Report
Note 24 other commitments
(in million euros) Dec. 31, 2008 Dec. 31, 2007
Financing commitments
Commitments received from credit institutions (1) 6,116 6,739
Commitments given to customers (2) 1,356 1,337
- of which Crédipar Group 906 997
Guarantee commitments
Commitments received from credit institutions 831 1,343
- guarantees received in respect of customer loans 581 432
- guarantees received in respect of securities held 250 911
Guarantees given to credit institutions (3) 683 -
Commitments given to customers 126 161
- Spanish branch 28 58
- Sofib 85 85
- Sofira 5 5
- Italian branch 8 13
Other commitments received
Securities received as collateral 5 7
(1) Including €44 million at December 31, 2008 in unused bilateral back-up lines corresponding to long-term financing commitments (see Note 15).(2) Commitments on preliminary credit offers made to retail customers are taken into account. The approved wholesale lines of credit that can be cancelled at
any time are not taken into account.(3) Corresponding to receivables given as collateral to Société de Financement de l’Économie Française (SFEF) pursuant to the measures to finance the
economy introduced in France’s amended Finance Act no.2008-1061 of October 16, 2008 (see Note 15).
Note 25 Interest and other revenue on assets at amortised cost
(in million euros) Dec. 31, 2008 Dec. 31, 2007
Installment contracts 979 976
Buyback contracts 245 208
Long-term leases (1) 352 302
Other 25 25
Total interest and other revenue from retail financing activities 1,601 1,511
- of which related companies 167 186
Interest and other revenue from wholesale financing activities (2) 436 389
- of which related companies 264 263
Interest and other revenue from other activities (cards, current accounts, guarantees) 18 13
- of which related companies 1 1
Commissions paid to referral agents (285) (283)
- Installment contracts (186) (192)
- Buyback contracts (48) (46)
- Long-term leases (51) (45)
Other business acquisition costs (34) (29)
ToTal 1,736 1,601
(1) In the published financial statements at December 31, 2007, ending contract indemnities were included in “Interest and other revenue on assets at amortised cost”. They are now included in “Other revenue and expense” in the amount of €4 million at December 31, 2007 (see Note 28).
(2) In the published financial statements at December 31, 2007, interest refunded to the network by Sofira in cases where the vehicle was paid during the interest-free period was included in “Interest expense on customer transactions”. It is now included in “Interest and other revenue on assets at amortised cost” in the amount of €12 million at December 31, 2007 (see Note 27).
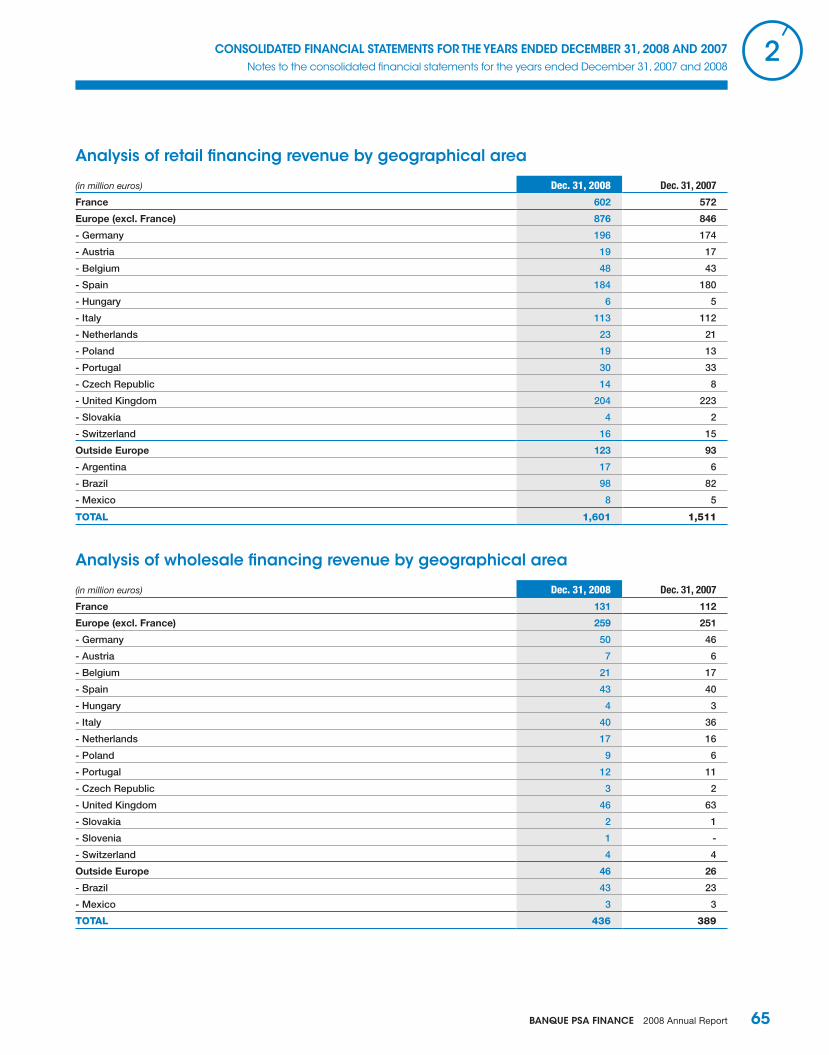
BANQUE PSA FINANCE 2008 Annual Report 65BANQUE PSA FINANCE 2008 Annual Report
CoNSolIdAtEd FINANCIAl StAtEmENtS For thE yEArS ENdEd dECEmBEr 31, 2008 ANd 2007 2notes to the consolidated financial statements for the years ended december 31, 2007 and 2008
Analysis of retail financing revenue by geographical area
(in million euros) Dec. 31, 2008 Dec. 31, 2007
France 602 572
Europe (excl. France) 876 846
- Germany 196 174
- Austria 19 17
- Belgium 48 43
- Spain 184 180
- Hungary 6 5
- Italy 113 112
- Netherlands 23 21
- Poland 19 13
- Portugal 30 33
- Czech Republic 14 8
- United Kingdom 204 223
- Slovakia 4 2
- Switzerland 16 15
Outside Europe 123 93
- Argentina 17 6
- Brazil 98 82
- Mexico 8 5
ToTal 1,601 1,511
Analysis of wholesale financing revenue by geographical area
(in million euros) Dec. 31, 2008 Dec. 31, 2007
France 131 112
Europe (excl. France) 259 251
- Germany 50 46
- Austria 7 6
- Belgium 21 17
- Spain 43 40
- Hungary 4 3
- Italy 40 36
- Netherlands 17 16
- Poland 9 6
- Portugal 12 11
- Czech Republic 3 2
- United Kingdom 46 63
- Slovakia 2 1
- Slovenia 1 -
- Switzerland 4 4
Outside Europe 46 26
- Brazil 43 23
- Mexico 3 3
ToTal 436 389

66 BANQUE PSA FINANCE 2008 Annual Report
CoNSolIdAtEd FINANCIAl StAtEmENtS For thE yEArS ENdEd dECEmBEr 31, 2008 ANd 20072notes to the consolidated financial statements for the years ended december 31, 2008 and 2007
BANQUE PSA FINANCE 2008 Annual Report
Analysis of commissions paid to referral agents and other business acquisition costs, by geographical area
(in million euros) Dec. 31, 2008 Dec. 31, 2007
France (138) (134)
Europe (excl. France) (155) (156)
- Germany (12) (11)
- Austria (1) (1)
- Belgium (4) (4)
- Spain (38) (40)
- Hungary (2) (1)
- Italy (33) (35)
- Netherlands (3) (3)
- Poland (3) (2)
- Portugal (7) (7)
- Czech Republic (8) (5)
- United Kingdom (41) (45)
- Slovenia (1) -
- Switzerland (2) (2)
Outside Europe (26) (22)
- Argentina (2) -
- Brazil (23) (22)
- Mexico (1) -
ToTal (319) (312)
Note 26 Interest expense on hedging instruments
(in million euros) Dec. 31, 2008 Dec. 31, 2007
Swaps hedging retail financing (Fair Value Hedge) 94 93
Amortisation of premiums on open swaptions (Time Decay) (5) (13)
Deferred intrinsic value of terminated swaptions released to the income statement (1) 33 27
ToTal 122 107
(1) See Note 21.2.
Note 27 Interest expense on customer transactions
(in million euros) Dec. 31, 2008 Dec. 31, 2007
Interest expense on ordinary accounts in credit (1) (1)
Interest expense on transactions with the independent dealer network (1) (4) (3)
Interest expense on transactions with the captive dealer network (1) (2) (1)
ToTal (7) (5)
(1) In the published financial statements at December 31, 2007, interest refunded to the network by Sofira in cases where the vehicle was paid for during the interest-free period was included in “Interest expense on customer transactions”. It is now included in “Interest and other revenue on assets at amortised cost” in the amount of €12 million (€6 million for the independent dealer network and €6 million for the captive dealer network) at December 31, 2007 (see Note 25).
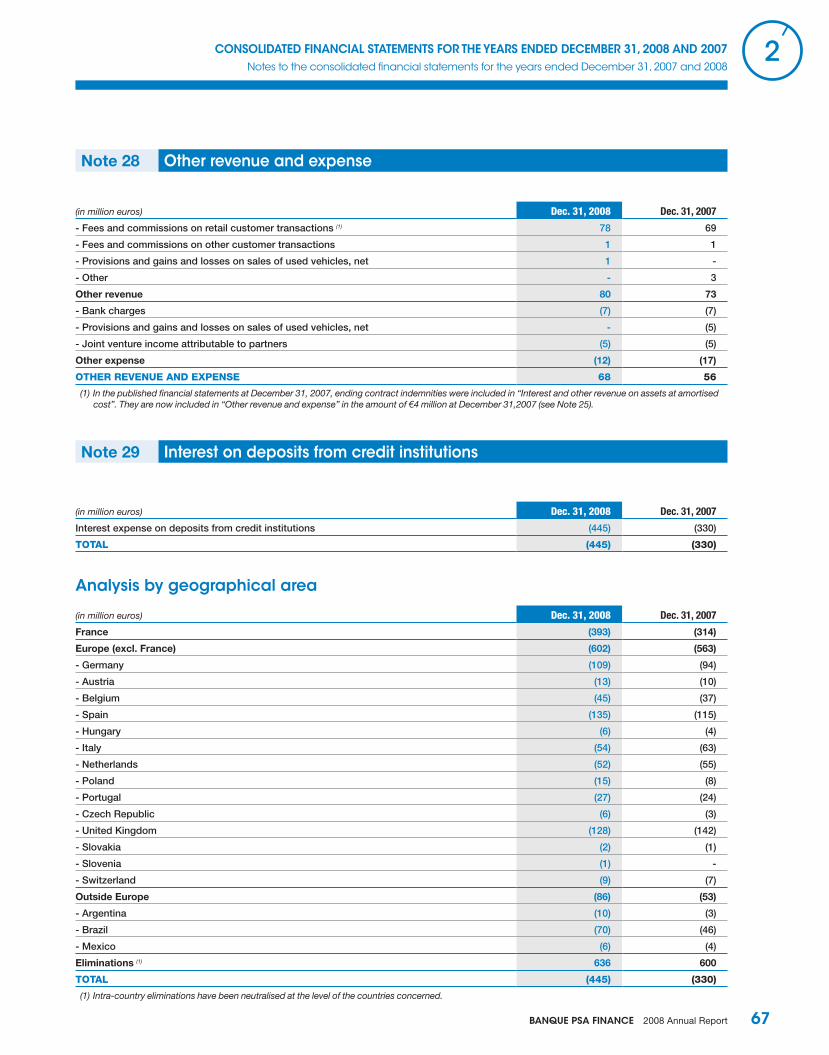
BANQUE PSA FINANCE 2008 Annual Report 67BANQUE PSA FINANCE 2008 Annual Report
CoNSolIdAtEd FINANCIAl StAtEmENtS For thE yEArS ENdEd dECEmBEr 31, 2008 ANd 2007 2notes to the consolidated financial statements for the years ended december 31, 2007 and 2008
Note 28 other revenue and expense
(in million euros) Dec. 31, 2008 Dec. 31, 2007
- Fees and commissions on retail customer transactions (1) 78 69
- Fees and commissions on other customer transactions 1 1
- Provisions and gains and losses on sales of used vehicles, net 1 -
- Other - 3
Other revenue 80 73
- Bank charges (7) (7)
- Provisions and gains and losses on sales of used vehicles, net - (5)
- Joint venture income attributable to partners (5) (5)
Other expense (12) (17)
oTher revenue and expense 68 56
(1) In the published financial statements at December 31, 2007, ending contract indemnities were included in “Interest and other revenue on assets at amortised cost”. They are now included in “Other revenue and expense” in the amount of €4 million at December 31,2007 (see Note 25).
Note 29 Interest on deposits from credit institutions
(in million euros) Dec. 31, 2008 Dec. 31, 2007
Interest expense on deposits from credit institutions (445) (330)
ToTal (445) (330)
Analysis by geographical area
(in million euros) Dec. 31, 2008 Dec. 31, 2007
France (393) (314)
Europe (excl. France) (602) (563)
- Germany (109) (94)
- Austria (13) (10)
- Belgium (45) (37)
- Spain (135) (115)
- Hungary (6) (4)
- Italy (54) (63)
- Netherlands (52) (55)
- Poland (15) (8)
- Portugal (27) (24)
- Czech Republic (6) (3)
- United Kingdom (128) (142)
- Slovakia (2) (1)
- Slovenia (1) -
- Switzerland (9) (7)
Outside Europe (86) (53)
- Argentina (10) (3)
- Brazil (70) (46)
- Mexico (6) (4)
Eliminations (1) 636 600
ToTal (445) (330)
(1) Intra-country eliminations have been neutralised at the level of the countries concerned.

68 BANQUE PSA FINANCE 2008 Annual Report
CoNSolIdAtEd FINANCIAl StAtEmENtS For thE yEArS ENdEd dECEmBEr 31, 2008 ANd 20072notes to the consolidated financial statements for the years ended december 31, 2008 and 2007
BANQUE PSA FINANCE 2008 Annual Report
Note 30 Interest on debt securities
(in million euros) Dec. 31, 2008 Dec. 31, 2007
Interest expense on debt securities (501) (531)
Interest expense on bonds and other fixed income securities (209) (140)
ToTal (710) (671)
Analysis by geographical area
(in million euros) Dec. 31, 2008 Dec. 31, 2007
France (586) (582)
Europe (excl. France) (167) (117)
- Germany (47) (38)
- Spain - (5)
- Italy (42) (17)
- Luxembourg (21) (18)
- Netherlands (54) (36)
- United Kingdom (3) (3)
Outside Europe (12) (8)
- Brazil (12) (8)
Eliminations 55 36
ToTal (710) (671)
Note 31 General operating expenses
(in million euros) Dec. 31, 2008 Dec. 31, 2007
wages and salaries (96) (96)
Payroll taxes (31) (31)
Employee profit sharing and profit-related bonuses (3) (5)
Total personnel costs (130) (132)
Other general operating expenses (175) (175)
- of which related companies (72) (86)
ToTal (305) (307)

BANQUE PSA FINANCE 2008 Annual Report 69BANQUE PSA FINANCE 2008 Annual Report
CoNSolIdAtEd FINANCIAl StAtEmENtS For thE yEArS ENdEd dECEmBEr 31, 2008 ANd 2007 2notes to the consolidated financial statements for the years ended december 31, 2007 and 2008
General operating expenses by geographical area
(in million euros) Dec. 31, 2008 Dec. 31, 2007
France (119) (124)
Europe (excl. France) (170) (170)
- Germany (32) (34)
- Austria (5) (6)
- Belgium (12) (12)
- Spain (29) (27)
- Hungary (4) (4)
- Italy (24) (23)
- Netherlands (8) (8)
- Poland (7) (6)
- Portugal (8) (8)
- Czech Republic (3) (3)
- United Kingdom (31) (33)
- Slovakia (1) (1)
- Slovenia (1) -
- Switzerland (5) (5)
Outside Europe (16) (13)
- Argentina (2) (1)
- Brazil (11) (9)
- Mexico (2) (2)
- Turkey (1) (1)
ToTal (305) (307)
Number of employees by geographical area
Dec. 31, 2008 Dec. 31, 2007
France 786 806
Europe (excl. France) 1,391 1,326
- Germany 239 244
- Austria 34 33
- Belgium 83 79
- Spain 255 244
- Hungary 22 19
- Italy 158 158
- Netherlands 77 79
- Poland 103 60
- Portugal 64 66
- Czech Republic 19 18
- United Kingdom 285 283
- Slovakia 11 9
- Slovenia 10 -
- Switzerland 31 34
Outside Europe 75 59
- Algeria 5 -
- Argentina 17 12
- Brazil 44 39
- Turkey 9 8
ToTal 2,252 2,191
Legal staff directly employed by Banque PSA Finance’s subsidiaries and branches.

70 BANQUE PSA FINANCE 2008 Annual Report
CoNSolIdAtEd FINANCIAl StAtEmENtS For thE yEArS ENdEd dECEmBEr 31, 2008 ANd 20072notes to the consolidated financial statements for the years ended december 31, 2008 and 2007
BANQUE PSA FINANCE 2008 Annual Report
Note 32 Cost of risk
The tables below present the cost of risk by customer category, as no significant loss has been incurred on other financial assets.
32.1 Changes in loans
(in million euros)Balance at
Dec. 31, 2007
Net new loans and currency
impact (1)
Cost of risk
Cost of risk for the period
Balance at Dec. 31, 2008Charges Reversals Credit losses
Recoveries on loans written off in
prior periods
Retail financing
Sound loans with no past-due installments 16,315 (122) - - - - - 16,193
Sound loans with past-due installments 413 35 - - - - - 448
Guarantee deposits (lease financing) (57) (2) - - - - - (59)
Non-performing loans 384 153 - - (64) - (64) 473
Total 17,055 64 - - (64) - (64) 17,055
Impairment of sound loans with past-due installments (46) 1 (19) 21 - - 2 (43)
Impairment of non-performing loans (190) 5 (88) 39 - - (49) (234)
Total impairment (1) (236) 6 (107) 60 - - (47) (277)
Net book value (A - see Note 8 A) 16,819 70 (107) 60 (64) - (111) 16,778
Recoveries on loans written off in prior periods - - - 32 32
Retail cost of risk (107) 60 (64) 32 (79)
Other financing
Sound loans with no past-due installments 742 81 - - - - - 823
Sound loans with past-due installments 5 (1) - - - - - 4
Non-performing loans 31 8 - - (4) - (4) 35
Total 778 88 - - (4) - (4) 862
Impairment of sound loans with past-due installments - - - - - - - -
Impairment of non-performing loans (18) 1 (6) 3 - - (3) (20)
Total impairment (1) (18) 1 (6) 3 - - (3) (20)
Net book value (B - see Note 8 B) 760 89 (6) 3 (4) - (7) 842
Recoveries on loans written off in prior periods - - - 1 1
Other cost of risk (6) 3 (4) 1 (6)
Wholesale financing
Sound loans with no past-due installments 5,673 (1,310) - - - - - 4,363
Guarantee deposits (84) 27 - - - - - (57)
Non-performing loans 35 58 - - (10) - (10) 83
Total 5,624 (1,225) - - (10) - (10) 4,389
Impairment of non-performing loans (18) 2 (24) 21 - - (3) (19)
Total impairment (1) (18) 2 (24) 21 - - (3) (19)
Net book value (C - see Note 8 C) 5,606 (1,223) (24) 21 (10) - (13) 4,370
Recoveries on loans written off in prior periods - - - - -
Impairment of doubtful commitments - - - - -
Wholesale cost of risk (24) 21 (10) - (13)
Total loans
Sound loans with no past-due installments 22,730 (1,351) - - - - - 21,379
Sound loans with past-due installments 418 34 - - - - - 452
Guarantee deposits (lease financing) (141) 25 - - - - - (116)
Non-performing loans 450 219 - - (78) - (78) 591
Total 23,457 (1,073) - - (78) - (78) 22,306
Impairment of sound loans with past-due installments (46) 1 (19) 21 - - 2 (43)
Impairment of non-performing loans (226) 8 (118) 63 - - (55) (273)
Total impairment (1) (272) 9 (137) 84 - - (53) (316)
Net book value 23,185 (1,064) (137) 84 (78) - (131) 21,990
Recoveries on loans written off in prior periods - - - 33 33
Impairment of doubtful commitments - - - - -
ToTal cosT of risk (137) 84 (78) 33 (98)
(1) The currency impact is due to the fact that balance sheets of foreign companies are translated at the year-end exchange whereas their income statement items are translated on a month-by-month basis at the average monthly rate (see Note 2 paragraph “Translation of financial statements of foreign subsidiaries”).
For impaired loans, the cost of risk includes interest invoiced and recognised under “Interest revenue on customer transactions”.

BANQUE PSA FINANCE 2008 Annual Report 71BANQUE PSA FINANCE 2008 Annual Report
CoNSolIdAtEd FINANCIAl StAtEmENtS For thE yEArS ENdEd dECEmBEr 31, 2008 ANd 2007 2notes to the consolidated financial statements for the years ended december 31, 2007 and 2008
32.2 Change in cost of risk
(in million euros) Dec. 31, 2008 Dec. 31, 2007
Known credit risk (sound loans with past-due installments)
Charges (19) (15)
Reversals 21 19
Known credit risk (non-performing loans)
Charges (118) (57)
Reversals 63 131
Doubtful commitments
Charges - -
Reversals - 2
Credit losses (78) (164)
Recoveries on loans written off in prior periods 33 33
cosT of risk (1) (98) (51)
(1) Banque PSA Finance has a historical database which enables it to measure the probability of default on sound loans with past-due installments, as well as the average loss given default on non-performing loans discounted at the effective interest rate. This database covers the five IRBA countries (France, United Kingdom, Germany, Spain and Portugal).
For each non-IRBA country: - the probability of default is tracked separately for each country; - the average loss rate is determined by multiplying a) the average of the discounted outstandings-weighted average loss rates of the five IRBA countries by
b) the non-IRBA country’s loss rate on collections divided by the loss rate on collections of the five IRBA countries.
In 2007, default probabilities and average loss given defaults were updated (leading to provision reversals of €13.5 million), new rules were applied to restructured loans (such as loans subject to France’s “Neiertz Act” plans for families in a situation of over-indebtedness), allowing them to be reclassified as sound in certain circumstances (leading to provision reversals of €5.6 million) and portfolios of loans that had been written down in full were sold (leading to the recognition of recoveries of €7.1 million). Excluding these impacts, which represented a total of €27 million, the net cost of risk representative of normal collection rates would be €(78) million in 2007 (representing 0.34% of average net outstanding loans).
The main events in 2008 were as follows: - default probabilities and average loss rates were updated, leading to a €2 million increase in provisions; - in the United Kingdom, recoveries on loans written off in prior periods of €6.4 million were recorded, corresponding to VAT refunded on these loans; - in France and Germany, recoveries on loans written off in prior periods of €3.6 million were recorded, corresponding to sales of these loan; - in the five IRBA countries (France, United Kingdom, Germany, Spain and Portugal), the passage of time was taken into account in loss rates discounted over
60 months by amortizing the discounting adjustment included in the initial calculation of the loss rate over the life of an average loan by borrower category. Amortisation of this adjustment, which has the effect of overstating impairment provisions, led to €8 million being reversed from impairment provisions at December 31, 2008.
Excluding these impacts, which represented a total of €16 million, the cost of risk representative of normal collection rates would be €114 million (representing 0.48% of average net outstanding loans).
The Bank’s credit risk management policy is described in the Management Report (page 20).

72 BANQUE PSA FINANCE 2008 Annual Report
CoNSolIdAtEd FINANCIAl StAtEmENtS For thE yEArS ENdEd dECEmBEr 31, 2008 ANd 20072notes to the consolidated financial statements for the years ended december 31, 2008 and 2007
BANQUE PSA FINANCE 2008 Annual Report
32.3 Information about defaults not covered by provisions
(in million euros) <= 90 days>90 days
<= 180 days> 180 days
<= 1 year > 1 yearTotal
Dec. 31, 2008
Sound loans with past-due installments not covered by provision 107 30 116 90 343
Corporate loans with one or more installments that are 90 days past due and loans to Local Administrations with one or more installments that are 270 days past due are not classified as non-
performing as the delays are due to payment incidents or claims, and do not reflect a default risk.
Note 33 Income taxes
Income taxes currently payable represent the amounts paid or currently due to the tax authorities for the period, calculated in accordance with the tax rules and rates in effect in the various countries.
Deferred income taxes relate to timing differences between the recognition of certain items of income and expense for consolidated financial reporting and tax purposes. These differences relate principally to the accounting treatment of leasing and long-term rental transactions, and impairment of non-performing loans.
(in million euros) Dec. 31, 2008 Dec. 31, 2007
Current taxes (137) (149)
Deferred taxes (60) (37)
ToTal (197) (186)
Banque PSA Finance tax proof
(in million euros) Dec. 31, 2008 Dec. 31, 2007
Pre-tax income 555 607
Permanent differences 6 (9)
Taxable income 561 598
Theoretical tax (193) (206)
Theoretical rate 34.433% 34.433%
Impact of differences in foreign tax rates 19 9
Impact of changes in tax rates - 14
Allowances on Brazilian deferred tax assets (12) -
Adjustment of the deferred tax calculation at Vernon wholesale Investment Company Ltd to take into account the currency effect (3) -
Allocated tax saving transfered back to PSA Peugeot Citroën (7) (4)
Other (1) 1
acTual Tax payable (197) (186)
Effective rate 35.091% 31.078%

BANQUE PSA FINANCE 2008 Annual Report 73BANQUE PSA FINANCE 2008 Annual Report
CoNSolIdAtEd FINANCIAl StAtEmENtS For thE yEArS ENdEd dECEmBEr 31, 2008 ANd 2007 2notes to the consolidated financial statements for the years ended december 31, 2007 and 2008
deferred tax assets on tax loss carryforwards
(in million euros) Dec. 31, 2007 New tax lossesTax losses utilised
in the year Dec. 31, 2008
Deferred tax assets on tax loss carryforwards 50 12 (4) 58
Not previously recognised (3) - - (3)
Valuation allowances (29) (12) - (41)
ToTal 18 - (4) 14
Note 34 Analysis of key data by region
34.1 Net banking revenue
(in million euros) Dec. 31, 2008 Dec. 31, 2007
France 407 399
Europe (excluding France) 512 543
- o/w Germany 124 120
- o/w Spain 83 92
- o/w Italy 51 58
- o/w United Kingdom 133 152
Rest of world 57 39
ToTal 976 981
34.2 General operating expenses
(in million euros) Dec. 31, 2008 Dec. 31, 2007
France (119) (124)
Europe (excluding France) (170) (170)
- o/w Germany (32) (34)
- o/w Spain (29) (27)
- o/w Italy (24) (23)
- o/w United Kingdom (31) (33)
Rest of world (16) (13)
ToTal (305) (307)

74 BANQUE PSA FINANCE 2008 Annual Report
CoNSolIdAtEd FINANCIAl StAtEmENtS For thE yEArS ENdEd dECEmBEr 31, 2008 ANd 20072notes to the consolidated financial statements for the years ended december 31, 2008 and 2007
34.3 Cost of risk
(in million euros) Dec. 31, 2008 Dec. 31, 2007
France (34) (20)
Europe (excluding France) (57) (31)
- o/w Germany (8) (9)
- o/w Spain (25) -
- o/w Italy (6) (10)
- o/w United Kingdom (12) (4)
Rest of world (7) -
ToTal (98) (51)
34.4 operating income
(in million euros) Dec. 31, 2008 Dec. 31, 2007
France 246 248
Europe (excluding France) 278 336
- o/w Germany 81 74
- o/w Spain 26 64
- o/w Italy 20 24
- o/w United Kingdom 90 114
Rest of world 33 24
ToTal 557 608
34.5 Key balance sheet items
Total assets Customer loans and receivables Refinancing (1)
(in million euros) Dec. 31, 2008 Dec. 31, 2007 Dec. 31, 2008 Dec. 31, 2007 Dec. 31, 2008 Dec. 31, 2007
France 10,919 12,471 8,428 8,594 17,204 20,239
Europe (excluding France) 14,403 15,435 12,954 14,081 3,575 3,308
- o/w Germany 4,020 3,709 3,341 3,275 1,324 661
- o/w Spain 2,679 2,990 2,591 2,875 - 76
- o/w Italy 2,111 2,306 1,873 2,121 858 858
- o/w United Kingdom 1,956 2,871 1,789 2,539 378 685
Rest of world 1,048 833 901 781 762 620
ToTal 26,370 28,739 22,283 23,456 21,541 24,167
(1) Refinancing includes “Deposits from credit institutions” and “Debt securities” (see Notes 15 and 17). It concerns the Group’s external refinancing, mainly issued by Banque PSA Finance.

Design and realization:
Paper from forests managed in a sustainable way.

1_ Close-up of wheel on the Citroën C4 By Loeb
2_ Close-up of cabinon the Citroën Hypnos HYbrid4
3_ Close-up of grille on the Peugeot 407
4_ Close-up of rear light on the Peugeot Prologue
BANQUE PSA FINANCE
Société Anonyme, Share capital: €177,408,000
Registered office - 75, avenue de la Grande Armée - 75116 Paris
Registered in Paris under no. 325 952 224 - Siret 325 952 224 00013
APE business identifier code: 6419 Z
Interbank code: 13168N
Phone: 33 (1) 1 46 39 66 33 - Fax: 33 (1) 1 46 39 54 03
1
3
2
4


