Predicting Protein Molecular Function Barbara Elizabeth Engelhardt Electrical Engineering and Computer Sciences University of California at Berkeley Technical Report No. UCB/EECS-2007-171 http://www.eecs.berkeley.edu/Pubs/TechRpts/2007/EECS-2007-171.html December 20, 2007
Transcript
Predicting Protein Molecular Function
Barbara Elizabeth Engelhardt
Electrical Engineering and Computer SciencesUniversity of California at Berkeley
Permission to make digital or hard copies of all or part of this work forpersonal or classroom use is granted without fee provided that copies arenot made or distributed for profit or commercial advantage and that copiesbear this notice and the full citation on the first page. To copy otherwise, torepublish, to post on servers or to redistribute to lists, requires prior specificpermission.
One of the most challenging problems of central importance in the post-genome era
is the prediction of protein molecular function. Challenging problems in computa-
tional biology such as this require the integration of an informed biological framework,
powerful bioinformatics tools, and high-quality experimental data. In recent years,
new insights into the diverse biological processes underlying the evolution of protein
function have provided a powerful framework for automating protein function predic-
tion. Phylogenomics [Eisen, 1998] formalizes how assumptions of molecular function
evolution can be exploited to improve function prediction and to dramatically re-
duce the systematic errors from pairwise annotation transfer methods, the standard
protocol for protein functional annotation [Sjolander, 2004; Brown and Sjolander,
2006]. This area at the intersection of phylogenetics and genomics includes method-
ological contributions from diverse backgrounds; it extends beyond the specific fo-
cus of this thesis, which is molecular function prediction, to include phylogenomic
approaches to reconstructing species evolution, predicting features of protein ter-
1
Chapter 1. Introduction to Phylogenomics
tiary structure, inferring the cellular localization and biochemical pathways of extant
and ancestral genes, and, moreover, reconstructing the evolutionary mechanisms by
which novelty arose for each of these protein features [Thornton and LaSalle, 2000;
Delsuc et al., 2005]. In this introduction, we review the fundamental evolutionary
processes underlying protein family functional diversification and the computational
methods available for inferring these evolutionary events. We identify the challenges
for functional phylogenomics in order to motivate the main aim of this dissertation,
which is a statistical method for functional phylogenomics.
1.1.1 Annotation transfer
One standard approach to protein molecular function prediction employs annotation
transfer, assigning the function of a characterized protein to a query protein whose
function is unknown based on a significant score in database search. In this approach,
homologs to the query protein are identified by searching a sequence database (typ-
ically using a computationally efficient approach such as the Basic Local Alignment
Search Tool (BLAST) [Altschul et al., 1990]). If the scores of the top annotated
hits are significant, the implied homology, or evolutionary relationship, enables the
annotations to be transferred directly to the query protein. This protocol is broadly
used because it is straightforward to justify, implement, and run. Unfortunately,
it is known to be prone to systematic error. The fundamental assumptions of an-
notation transfer are that sequence similarity implies an evolutionary relationship,
and that evolution conserves function; biologists then infer that two proteins sharing
statistically significant sequence similarity share a common function.
Many factors confound this apparently straightforward methodology. The most
significant database hit may have a different function due to single point mutations,
gene duplication, or domain shuffling [Eisen, 1998; Bork and Koonin, 1998; Galperin
2
Chapter 1. Introduction to Phylogenomics
and Koonin, 1998]. The most significant database hit may also be misannotated,
and transferring this incorrect annotation propagates the annotation errors [Brenner,
1999; Devos and Valencia, 2000]. Furthermore, sequence similarity may be due to
parallel evolution – evolution towards the same sequence from evolutionarily unrelated
proteins – rather than an evolutionary relationship, especially if the significance of
the hit is questionable. As many authors have pointed out (e.g., [Reeck et al., 1987]),
two proteins are either homologous, meaning related by a common ancestor, or they
are not. There is no single E-value cutoff to describe where homology ends and non-
homology begins. For a particular query protein, such a cutoff may not exist: a search
may rank non-homologs higher than homologs at certain places in the search results.
Furthermore, annotation transfer based on pairwise sequence similarity does not
take into account rate variation. If we assume that function generally evolves parsi-
moniously within a phylogeny (where we are defining parsimonious as each function
being active within all of the proteins descendant from a single common ancestor),
then the branching structure of a phylogeny is more relevant for annotation transfer
than path length within the phylogeny. But lineage-specific rate variation, which is
complex phenomenon prevalent across a wide range of protein families [Thomas et
al., 2006], means that the most similar sequences according to blast (i.e., those with
the shortest path length in the tree) are not necessarily most likely to share a com-
mon function. One such scenario is illustrated in Figure 1.1, where path length and
branching order from a query protein rank the remaining proteins differently because
the phylogeny exhibits lineage-specific rate variation. This problem grows worse as
more proteins are added to a tree. Specifically, additional proteins that are siblings
of protein B1 (in the figure) with a similar branch length will provide increasingly
strong support for the incorrect function transfer to the query protein. This means
that the blast most significant hits approach is systematically flawed and may yield
increasingly erroneous results as data increase. Use of a phylogeny explicitly incorpo-
3
Chapter 1. Introduction to Phylogenomics
A1 B2
?
A2
B1
Figure 1.1: Sequence similarity does not directly reflect phylogeny. A phy-logenetic tree shows where sequence similarity measures, such as blast fail to makecorrect functional assignments. The proteins in this tree are either molecular function Aor B, with a duplication event indicated by a red square. We wish to predict the functionof the protein denoted by “?”. Its most significant blast hit will be B1, because thepath length in the phylogeny from the query protein is the shortest. Thus blast willtransfer annotation B to the unannotated protein. However, this conflicts with the mostlikely molecular function scenario. It is more likely that the tree has only one functionalchange, in which ancestral function B mutated to function A on the left-hand side ofthe bifurcation. Thus A is a more likely annotation for the unannotated protein. Thephylogenomics approach reaches this conclusion naturally. Adapted from [Eisen, 1998].
rates the evolutionary history and minimizes problems due to rate variation, because
the branching structure is considered, instead of just branch lengths.
1.1.2 Phylogenomic analysis is designed to address these issues
Phylogenomic inference of molecular function is actually an annotation transfer pro-
tocol, but it avoids many of the errors of standard annotation transfer through the
explicit inclusion of an evolutionary model of functional evolution overlaid on a phylo-
genetic tree. Phylogenetic methods have long been preferred to pairwise comparison
methods for taxonomic data analysis (e.g., [Farris, 1982]) based on both theoretical
4
Chapter 1. Introduction to Phylogenomics
and practical arguments. The phylogenomic protocol is the phylogenetic approach to
annotation transfer. Phylogenomics additionally relies on accurate orthology analysis,
which also benefits from a phylogenetic approach.
Phylogenomics allows biologists to exploit the variable evolutionary persistence
of different types of protein functional attributes to provide nuanced predictions
of protein function. We use the term evolutionary persistence to reflect the vari-
able endurance of protein attributes over different evolutionary distances. For in-
stance, the structure, or three-dimensional shape, of a protein is maintained over
long evolutionary distances between homologous proteins: two proteins can have
vanishingly low sequence identity and still have obviously similar three-dimensional
structures [Krissinel, 2007]. Basic chemical function is often maintained over long
evolutionary distances as well, such as the Nudix hydrolases [Bessman et al., 1996],
as are general mechanisms of enzyme catalysis [Glasner et al., 2007]. On the other
hand, the precise biochemical function of a protein can be significantly affected by
a small number of mutations. Mutations at an enzyme catalytic site can completely
disrupt function, while mutations at nearby binding pocket positions may modify
the substrate upon which the enzyme acts. As an example, in Halobacterium sali-
narium, bacteriorhodopsin (light-driven proton pumps) and halorhodopsin (chloride
ion pumps) are homologous; mutation of an aspartic acid to a threonine changes
this light-driven proton pump to a chloride ion pump [Sasaki et al., 1995]. Cellular
localization, like structure, has a long evolutionary persistence in the absence of do-
main shuffling [Chen and Rost, 2002]. Like molecular function, small evolutionary
changes can drastically impact particular localizations. For example, a protein that
is secreted from the cell may change to one that is cytoplasmic based on the presence
or absence of short signal peptides [Tagaya et al., 1997], and transmembrane local-
ization may change to localization in the Golgi apparatus after a small number of
residue changes [Wong et al., 1992]. Phylogenomics takes into account the variable
5
Chapter 1. Introduction to Phylogenomics
evolutionary persistence of different protein features to enable a more precise and
nuanced prediction of those features than a simple pairwise comparison of individual
proteins.
The basic procedure for a phylogenomic analysis of a protein superfamily, or a fam-
ily of proteins generated from a common ancestor by gene duplication and speciation
events, is as follows (as in Figure 1.2): Starting with a query sequence, homologous
sequences are gathered according to some criteria. A multiple sequence alignment
is constructed for these sequences and is used as the basis for estimating a protein
superfamily phylogeny. Reconciliation of the rooted superfamily tree and a trusted
phylogeny of the species is then used to localize gene duplication and speciation
events at the internal nodes of the superfamily phylogeny [Goodman et al., 1979;
Page, 1998]. These events enable identification of subtrees in the protein superfam-
ily phylogeny that correspond to orthologous proteins (proteins related by speciation
events). Molecular function annotations derived from an experiment are then overlaid
on the tree, highlighting functional shifts within the superfamily. The reconciled tree
including molecular function annotations can then be used as the basis of annotation
transfer. This introductory chapter will serve to motivate this general protocol. The
remainder of the dissertation will introduce a particular method for inferring molec-
ular function from a reconciled tree overlaid with molecular function annotations,
and show results and additional methods that can be used in conjunction with this
phylogenomic protocol.
1.2 Overview of protein superfamily evolution
The basic events in protein family evolution include single nucleic acid changes (in-
cluding mutation, insertion, and deletion), gene duplication and deletion, and domain
shuffling (including repetition, insertion, deletion, and exchange of protein domains).
Step 5: Function overlayMUTS_PASMUMUTS_HAEINMUTS_CHLPNMUTS_BACHDMSH1_SCHPOMSH7_ARATHMSH6_DROMEMSH3_MOUSEMSH3_HUMANMUTS_BORBU
Step 1: Find homologs>MUTS_BACHD
SSIKEVVLSPGWTEED
>MUTS_PASMU
ISPVELLYCEDFVDMA
>MUTS_HAEIN
IAPVELLYCEEFNEMA
>MSH3_HUMAN
LQPVELLLPSALSEQK
Step 0: Query protein>MUTS_BACHD
SSIKEVVLSPGWTEED
Step 2: Sequence alignmentSSIKEVVLSPGWTEED
ISPVELLYCEDFVDM-
IAPVELLYCEEFNEMA
LQPVELLLPSALSEQK
LAPSEVLSCNKFNKET
ISPREIVLDESLKSFT
VSPKEIIYETSGLSKG
BLASTPSI-BLASTPfam
ClustalXMUSCLEHMMER
NJMPML
ManuallyGeneTreeForester
GOA DBExperimentalSwiss-prot
OrthologsStatistically
Figure 1.2: The basic pipeline for phylogenomic inference of molecular func-tion. Beginning with a query protein sequence, the phylogenomic approach builds areconciled tree and overlays molecular function annotations to infer the function of thequery protein.
Speciation and gene duplication events are the two branching processes that generate
protein superfamilies in combination. A few terms developed elsewhere are helpful
in categorizing relationships within protein superfamilies, and we define and illus-
trate each of them in Figure 1.3. Proteins that are related by duplication events
at their most recent common ancestor are paralogs, whereas proteins related by spe-
ciation events at their most recent common ancestor are orthologs. Zmasek and
Eddy [Zmasek and Eddy, 2002] define additional terms based on analysis of a rooted,
strictly bifurcating tree. Ultra-paralogs are proteins in the same species that have only
duplication events on the internal nodes of their direct tree path. Super-orthologs are
two proteins in different species that have only speciation events on the internal
nodes of their direct tree path. Subtree-neighbors of order k are all descendants other
than the protein itself of the closest k ancestors of a protein (where k is generally
2). In general application, subtree-neighbors can be used as the basis of annotation
transfer across members of a clade, assuming consistent annotations. O’Brien and col-
leagues [O’Brien et al., 2005] further define inparalogs as proteins in the same species
that are most recently related through a duplication event within that species, and
7
Chapter 1. Introduction to Phylogenomics
1_SHARK 1_FROG 1_CHICK 2_CHICK 3_RAT 3_HUMAN
Figure 1.3: Homology relationships defined. In this phylogeny, the red squaresrepresent duplication events, and the proteins are named by their copy number followedby a species. Proteins 1 CHICK and 2 CHICK are paralogs, as are proteins 2 CHICKand 3 HUMAN. Proteins 3 RAT and 3 HUMAN are orthologs, and so are proteins 3 RATand 1 FROG. Proteins 2 CHICK and 1 CHICK are the only ultra-paralogs in the fig-ure. Proteins 3 RAT and 3 HUMAN are super-orthologs, as are proteins 1 SHARK and1 FROG. Proteins 3 RAT and 3 HUMAN are subtree-neighbors of protein 2 CHICK, asis protein 1 CHICK. Proteins 1 CHICK and 2 CHICK are inparalogs, and proteins 3 RATand 2 CHICK are outparalogs (as are proteins 3 HUMAN and 2 CHICK).
outparalogs as proteins in different species related via a duplication event at their most
recent common ancestor, that have more recently undergone a speciation event (and
perhaps additional duplication events). These definitions will help in the discussion
of orthology.
1.3 Gene duplication and orthology
The inference of orthology is of great interest in functional genomics due to the
assumption that orthologs are likely to share a common function. This has resulted in
the development of databases of predicted orthologs or orthologous groups of proteins
(e.g., COGs [Tatusov et al., 2000], TOGA [Lee et al., 2002], InParanoid [O’Brien
8
Chapter 1. Introduction to Phylogenomics
et al., 2005]). Gene duplication provides a central evolutionary mechanism enabling
functional innovations in protein superfamilies. Following gene duplication, selective
pressures on the original copy of a gene can diminish; one or both of the proteins
may modify their molecular function, either as a result of neutral evolutionary drift
or selection. The mechanistic details of gene duplication, however, are quite complex
and poorly understood, and much recent research has attempted to extrapolate these
details from the examples of gene duplication events.
1.3.1 Evolution of molecular function
Sequence evolution, on one hand, is constrained by a protein’s role in the survival
and fitness of an organism, and on the other hand is subject to forces of evolutionary
change, including mutation, duplication, and deletion events. In order to understand
better this evolutionary dynamic, we briefly review the current literature on molecular
evolution as it relates to molecular function and evolutionary constraints. The terms
gene and protein (i.e., gene product) are used somewhat interchangeably, ignoring
some subtleties that do not broadly impact this discussion.
Although the rate of molecular evolution does not directly determine the rate
of molecular function evolution, the phylogenomic assumption that sequences and
molecular functions evolve at proportional rates will guide our discussion. In par-
ticular, although much work has been done on the rates of molecular evolution for
particular proteins (and many open questions still exist), much less work has been
done on the rates of molecular function evolution. Generally, we wish to identify
which characteristics of proteins (and the evolutionary history of these proteins) lead
to a faster rate of molecular function evolution. This will enable a model for the
approximate localization of functional mutations in the phylogenetic history of a set
of homologous proteins.
9
Chapter 1. Introduction to Phylogenomics
1.3.1.1 Essentiality, dispensibility, and expression levels may correlate with a
slower rate of evolution
Researchers have attempted to find correlations between the evolutionary rate of
proteins (as a measure of how strong evolutionary constraints are on this protein)
and different features of the protein in vivo. One such feature is protein essentiality,
which describes whether or not a protein is critical to the survival and viability
of the organism. The knockout rate hypothesis negatively correlates the impact of
knockout on the fitness of the organism with rate of evolution [Wilson et al., 1977].
Eukaryotic genes that are essential to the viability of an organism appeared to be
more constrained by selection, and also appeared to arise farther back in evolutionary
time [Decottignies et al., 2003], as observed in a large-scale knockout study of genes
in S. pombe and S. cerevisiae. This general hypothesis was challenged in a study in
mouse and rats, which showed that sequence mutation rates were not correlated with
essentiality of the gene [Hurst and Smith, 1999].
More sophisticated studies have measured the impact of gene dispensibility on
mutation rates for that gene, where dispensibility is often measured by growth rates
of an organism with the particular gene deleted. The general idea is that, for genes
that are not essential to the organism’s survival but contribute to organismal fitness,
most mutations would be considered within the range of neutral. Thus, because they
have fewer selective constraints than essential genes, the rate of evolution should
be higher in genes that contribute less to the overall fitness of the organism. This
hypothesis is hard to test directly because the fitness of a particular protein to an
organism is difficult to quantify.
Hirsh and Fraser found a significant correlation between protein dispensibility
and evolutionary rate, and note in their results that gene essentiality has not been
definitively correlated with evolutionary rate (in their own measurements in yeast
10
Chapter 1. Introduction to Phylogenomics
and in the previously cited mouse study [Hurst and Smith, 1999]) because the dis-
tinction between essential and non-essential genes was not precise enough [Hirsh
and Fraser, 2001]. In particular, when a gene knock-out results in a very slow
rate of organismal growth, the individual has such poor fitness that evolutionarily
the gene can be considered almost equivalent to essential. Yang and colleagues fol-
lowed this up with a similar experiment in yeast and C. albicans that found a weak
correlation between dispensibility and evolutionary rate, but noted that the corre-
lation disappeared when duplicate genes were not considered [Yang et al., 2003a].
They also hypothesize that structural constraints influence the rate of evolution
more than dispensibility. Wall and colleagues further corroborated these findings
in a study that found evidence for independent correlations between the rate of
molecular evolution and both gene dispensibility and expression levels [Wall et al.,
2005]. Although they argue based on their own findings that dispensibility is cor-
related with the rate of evolution, they cite two previous studies ( [Pal et al., 2003;
Rocha and Danchin, 2004]) that both conclude that the correlation between dispen-
sibility and the rate of evolution is not significant when expression level (or, as in the
second study, expression levels and molecular function type) is taken into account.
1.3.1.2 Pleiotropy constrains evolutionary rate
In 1930, Fisher proposed that pleiotropy constrains evolution [Fisher, 1930]. Pleiotropy
means that a single gene is responsible for multiple phenotypes. It could be that a
single gene has multiple molecular functions, is involved in multiple pathways, or
interacts with different proteins depending on tissue type.
Much more recent studies of the yeast protein interaction network have shown
correlations between the number of proteins interactions for a given protein and evo-
lutionary constraints. One such study found a correlation between number of protein
interactions with decreased viability of the organism after knockout [Jeong et al.,
11
Chapter 1. Introduction to Phylogenomics
2001]. Another study showed that a protein that is more central in a genetic pathway
tends to be more critical and have a slower rate of evolution [Hahn et al., 2005].
Krylov introduced the propensity for gene loss (PGL) measure, which is computed by
comparing the phylogenetic profile to the species phylogeny, and showed that PGL is
more negatively correlated with gene essentiality (as measured by knockout analyses)
and number of interaction partners than the rate of sequence evolution [Krylov et al.,
2003].
Returning again to Fisher’s hypothesis, proteins involved in more protein-protein
interactions have been shown to have a slower evolutionary rate not because of their
essentiality to the organism, but because a larger proportion of amino acids in the
protein are involved in functional interactions, thus those amino acids will evolve
at a slower rate [Fraser et al., 2002]. A specific amino acid might be involved in
a functional interaction either directly, through involvement in direct bonds with
functional molecules, or indirectly, through their role in protein structural stability.
As the number of interactions of a particular protein grows, so does the number of
sites that are explicitly constrained.
1.3.1.3 Gene duplicability
The evolutionary role of gene duplication, beyond creating novel proteins, still re-
mains unclear. One alternative role might be as a compensating mechanism for gene
deletion. In yeast single-gene-deletion mutants, one study estimated that one quarter
of the deletions showed no phenotype because of compensation from a duplicated
gene in the genome [Gu, 2003]. Furthermore, as the sequence similarity between gene
duplicates decreases, their ability to compensate for a deleted copy decreases, pre-
sumably because the function diverges. The surprising result, though, is that even
evolutionarily distant gene duplicates (i.e., those that do not obviously have the same
molecular function) may compensate for a deleted gene.
12
Chapter 1. Introduction to Phylogenomics
One alternative way to explain these data is that critical genes are duplicated
at a much lower frequency. Gene duplicability is defined as the tendency of a gene
to duplicate and subsequently be fixed in that species. This hypothesis implies that
what appears to be gene compensation is actually just a correlation between non-
critical genes and duplications, and was supported in a set of yeast gene knockout
studies [He and Zhang, 2006]. This hypothesis came from two observations. First,
genes involved in large protein complexes have lower duplicability because changing
(e.g., doubling) the concentration of the molecules involved in the interactions may
detrimentally impact the functional products of the interaction network [Jeong et
al., 2001]. There is substantial evidence to suggest that proteins involved in more
interactions will be, on average, more critical to organism survival as measured by
knockout phenotype [Yang et al., 2003b].
A final study in this vein postulates that when genes that are more biologically
important duplicate, they are retained at a much higher rate than duplicates of genes
that are less biologically important in eukaryotes [Jordan, 2004]. This observation
comes from evidence that, despite an initial increase in evolutionary rate following a
duplication, the evolutionary rate of the retained duplicate genes dramatically slows,
possibly because of the high number of selective constraints on these more important
proteins.
This leaves us with a number of open questions about how gene duplication relates
to pleiotropy, biological importance, and evolutionary rate. Many details of these
correlations still remain to be resolved among the studies presented here in order to
understand better the details of how duplication contributes to functional diversity
in proteins. In many cases, it is not even clear how hypotheses can be tested given
our limited data and indirect observation of duplication.
13
Chapter 1. Introduction to Phylogenomics
1.3.2 Gene duplication events
There are several scenarios of how gene duplication events lead to functional diver-
gence, illustrated in Figure 1.4. The majority of gene duplications result in nonfunc-
tionalization, where one copy of the gene acquires neutral mutations, converting it into
a pseudogene. Neofunctionalization, proposed by Ohno [Ohno, 1972], hypothesizes
that, after a duplication event, one copy of the gene maintains the original func-
tion, while the other acquires a novel, adaptive function through positive selection.
One example of neofunctionalization is the sensory-neuron-specific (SNSR) subclass
of G-protein coupled receptors (GPCRs), in which researchers have observed that
the ligand-binding residues underwent positive selection following gene duplication
resulting in functional divergence of the paralogs [Choi and Lahn, 2003].
An alternative theory, known as subfunctionalization, or the duplication-degeneration-
complementation (DDC) model, postulates that mutations accumulate via neutral
evolution in each copy of a gene, resulting in complementary functions [Force et
al., 1999; Lynch and Force, 2000]. Two subfunctionalization scenarios exist. In
the first scenario, specifically the DDC model, complementary functions are lost in
the duplicate genes. One example is the sex-linked α4 proteasome subunit genes in
Drosophila melanogaster, in which two copies of the gene, both expressed at different
times during spermatogenesis, are each missing different functional regions [Torger-
son and Singh, 2004]. In the second subfunctionalization scenario, a protein with a
general enzymatic function, possibly working on a large range of substrates, develops
complementary substrate specificity in the duplicate genes. In corn, phytochrome
genes were observed to have developed overlapping but differentiated functions due
to this type of subfunctionalization [Sheehan et al., 2007]. For more information on
this topic, many good reviews of gene duplication exist (e.g., [Roth et al., 2007;
Conrad and Antonarakis, 2007]). These scenarios all lead to the conclusion that
Figure 1.4: Three different theories of functional diversification following agene duplication event. Nonfunctionalization, shown in (A), is the most biologicallycommon of the three events, in which a duplicated gene’s function is lost by neutralmutations. Neofunctionalization, shown in (B), shows one copy evolving an independentfunction. Subfunctionalization, shown in (C), shows the duplicated genes losing comple-mentary functions.
changes in molecular function will often co-occur with duplication events when both
copies of the gene are retained as expressed proteins.
Domain shuffling, illustrated in Figure 1.5, is another evolutionary mechanism for
functional mutation that played a significant role in the evolution of eukaryotic or-
ganisms [Liu and Grigoriev, 2004; Babushok et al., 2007]. Phylogenetic studies in
protein families with domain shuffling, such as the DNA-binding domain KilA-N
found in bacterial and eukaryotic DNA viruses [Iyer et al., 2002], show the extent
of rearrangement of homologous domains in these families and the impact on do-
main architecture and molecular function. In addition, there are two complementary
evolutionary mechanisms, gene fusion events, which fuse two separate genes or do-
mains, and gene fission events, which split a single gene into two genes, illustrated in
Figure 1.6.
The NitFhit protein in D. melanogaster and C. elegans, for example, is a histidine
triad homolog fused with a nitrilase homolog; evidence suggests that the two domains
may have fused because they both have nonessential functions and are involved in the
same signaling pathway [Semba et al., 2006]. Domain shuffling and gene fission/fusion
events generate proteins with a different domain structure than the original protein,
15
Chapter 1. Introduction to Phylogenomics
(A) (B) (C)
Figure 1.5: Domain shuffling events. Four events result in changing protein domainstructure: exchange, repetition, insertion, and deletion (exchange is not shown here).Panel (A) shows repetition leading to a different domain structure in the resulting protein.Panel (B) shows a new (red) domain inserted between the two domains of the originalprotein. Panel (C) displays the result of deletion of the blue domain. Although thisfigure shows shuffling events respecting domain boundaries, this is often not the case;furthermore, the resulting hybrid genes may be modified by subsequent gene fusion orfission events. These four events in combination have the effect of producing the fullrange of protein domain structures.
Figure 1.6: Gene fission/fusion events. The grey background represents the ex-pressed protein boundaries. The up arrow represents a gene fusion event, where twoseparate proteins are fused into a single gene product; the down arrow represents a genefission event, where a single protein with three domains is split into two separate proteins.
modifying the tertiary structure of the protein and often the molecular function,
sometimes fairly dramatically [Pasek et al., 2006]. Although it is clear that domain
shuffling and gene fusion/fission events play a role in the evolution of molecular func-
tion [Ashby and Houmard, 2006; Alm et al., 2006] and protein networks [Amoutzias
et al., 2004], most automated phylogenomic methods do not explicitly account for
these evolutionary mechanisms. Both domain shuffling and gene fission and fusion
result from recombination events [Kummerfeld et al., 2004].
16
Chapter 1. Introduction to Phylogenomics
1.4 Fundamental assumptions of phylogenomic analy-
sis
Two assumptions about protein molecular function evolution are of critical impor-
tance for phylogenomic analysis. The first critical assumption is that molecular
function evolves in parallel with protein sequence. In other words, the phylogeny
reconstructed for a set of homologous molecules based on sequence information is a
satisfactory proxy for the evolution of molecular function and structure in those pro-
teins. The second critical assumption is that discrete changes in molecular function
most often co-occur with gene duplication events. These two assumptions allow us to
develop a model of molecular function evolution to generate experimentally testable
hypotheses.
The two assumptions should be examined carefully. The first assumption re-
quires (a) the availability of an accurate phylogenetic tree reconstruction for a pro-
tein superfamily, and (b) that the inferred branches of this phylogeny along which
the greatest change in protein sequence occurred are, in general, the same branches
along which the greatest change in protein molecular function occurred (taking into
account the locations of duplication events). We will defer examination of (a) un-
til the discussion of tree reconstruction methods; (b), however, is only a general
tendency, which is often violated for particular superfamilies. For example, sin-
gle nucleotide mutations may produce discrete changes in molecular function, ex-
plicitly violating this assumption, as in the case of the lactate dehydrogenase pro-
tein from T. vaginalis, evolved from a malate dehydrogenase, where a single amino
acid mutation is thought to be responsible for the functional change [Madern, 2002;
Wu et al., 1999]. Parallel functional evolution, or a single molecular function which
arises independently in different locations in the phylogeny (also a less common def-
inition of convergent evolution), although it violates an assumption of maximally
17
Chapter 1. Introduction to Phylogenomics
parsimonious evolution, does not explicitly violate this assumption.
Although we are unaware of any genome-scale studies comparing the rate of func-
tional change after gene duplication versus after speciation events, one study found
that, for a particular functional type (i.e., defense genes), the function itself was more
determinant of a higher rate of evolution than the existence of a paralogous gene in
humans [Nembaware et al., 2002]. This might indicate that the factors contributing
to duplication of a protein (i.e., its duplicability), such as the molecular function and
the length of the protein, may more directly impact functional change than dupli-
cation itself. These hypotheses imply a modified phylogenomic methodology that
uses additional protein features that impact duplicability, including length of a pro-
tein sequence and the type of functions being inferred, to more accurately estimate
evolutionary persistence of function within a multigene phylogeny.
1.5 A simple phylogenomic analysis
We outline the basic steps involved in a phylogenomic analysis of a set of protein
sequences in Figure 1.2, given the basic assumptions outlined above. We assume
that the process is initiated with a query protein sequence of unknown function. We
motivate each step, and describe methods that may be used and how those methods
perform in practice. We focus on a few potential sources of noise or error that may
be relevant to a phylogenomic analysis, areas for improvement, and open research
questions.
18
Chapter 1. Introduction to Phylogenomics
1.5.1 Step 1: Identify a set of homologous proteins
1.5.1.1 Motivation, definition, and methods
We would like to gather a set of proteins homologous to the query protein in order
to transfer a functional annotation according to the phylogenomic protocol. The
selection of sequences in the first step of a phylogenomic analysis has a significant
impact on the resulting functional inferences. There are three basic approaches to
this task: selecting sequences based on individual alignments of database hits to the
sequences of interest, selecting homologous sequences from databases that cluster
homologous proteins (including Pfam [Bateman et al., 2002], SCOP [Andreeva et
al., 2004], COG [Tatusov et al., 2000]), and selecting sequences found to have the
same domain architecture as the sequences of interest. Standard homolog clustering
methods (e.g., BLAST [Altschul et al., 1990] and PSI-BLAST [Altschul et al., 1997])
are optimized for the detection of local matches to a query sequence. PSI-BLAST
constructs a profile HMM from a multiple sequence alignment of sequences with
significant BLAST scores to detect remote homologs, but including non-homologs
(or partial homologs) accidentally can generalize the profile so that non-homologous
sequences are found using the profile. The homology databases often rely on these
sequence search methods (e.g,. COGs uses triangles of mutually-consistent, genome-
specific best hits from BLAST) for populating their clusters.
One might also restrict sequences to those that share a common domain ar-
chitecture with the query sequence, when these sequences include a broad enough
sampling of experimentally-annotated sequences with homology at functional regions
of interest. The programs FlowerPower and CDART are designed specifically to
cluster sequences having the same domain architecture [Krishnamurthy et al., 2007;
Geer et al., 2002]. FlowerPower is similar to PSI-BLAST [Altschul et al., 1997], but
instead of using a single profile to expand the existing cluster, FlowerPower uses a set
19
Chapter 1. Introduction to Phylogenomics
of HMMs: a general HMM for the family as a whole, and a subfamily HMM (SHMM)
for each predicted subfamily. The Conserved Domain Architecture Retrieval Tool
(CDART) also performs searches for proteins with identical domain architecture [Geer
et al., 2002] using Reverse PSI-BLAST (RPS-BLAST) to search domain profiles built
from the Conserved Domain Database [Marchler-Bauer et al., 2002], with additional
processing to handle redundant or closely-related domains.
1.5.1.2 Limitations and considerations
In selecting homologs, investigators must strike a balance between a conservative
selection of close homologs and retrieval of more divergently related sequences. Re-
stricting the set to close homologs with common domain architecture can produce
good alignments and accurate tree topologies, but may result in insufficient informa-
tion for function inference due to the sparse nature of experimental data. Including
distant homologs and more diverse domain architecture can increase the available ex-
perimental data, but can lead to errors in alignment and tree topology, and result in
incorrect or overly general functional predictions. Functional inferences based on dis-
tant homologs must be made with caution, as estimation of evolutionary persistence
is difficult over long evolutionary distances.
1.5.2 Step 2: Align the sequences
1.5.2.1 Motivation, definition, and methods
The multiple sequence alignment (MSA) is the source of phylogenetic signal, and
so plays an important role in phylogenomic analysis. Numerous multiple sequence
alignment packages are available that are both computationally efficient and produce
high-quality alignments. These include MUSCLE [Edgar, 2004] and MAFFT [Katoh
et al., 2002] for large multigene families, and PROBCONS [Do et al., 2005] for smaller
20
Chapter 1. Introduction to Phylogenomics
families. All have produced outstanding results on benchmark datasets comparing
sequence and structural alignments [Edgar and Batzoglou, 2006]. Alternatively, given
a hidden Markov model (HMM) profile for this particular protein or domain, HMM
alignment methods such as hmmalign [Eddy, 1998] can be used to quickly align the
sequences given the profile. Post-processing of the MSA may further improve the
signal, and includes alignment masking, deleting poorly-alignable sequences, using
three-dimensional structure to improve the alignment, or cropping an alignment to a
conserved core.
1.5.2.2 Limitations and considerations
There are dramatic differences between the characteristics of single-gene (ortholo-
gous) groups and groups of genes related by gene duplication (multi-gene families),
particularly when these groups span large taxonomic distances. The former often
have high sequence identity, and their phylogeny will resemble the species phylogeny.
The latter often contain divergent sequences with low sequence identity (e.g., some
pairs may not be more identifiably similar than two random sequences), regions where
the alignments are unreliable and the proteins may not even be structurally superpos-
able, or extreme variability in site- and lineage-specific mutation rates [Saier, 1996].
All of these protein superfamily features strain the core assumptions of multiple se-
quence alignment methods, which attempt to create a sequence of columns that are
each evolved from a common ancestor amino acid. This implies that, superposing the
three-dimensional structures from this family, each position of the superposed com-
plex is a single column of the alignment. When the structures cannot be superposed,
it is possible that these assumptions are violated.
To address this issue, masking is often employed. Alignment masking removes
columns in the multiple sequence alignment that appear to be uninformative. Of-
ten in masking, columns of a multiple sequence alignment are removed when, for
21
Chapter 1. Introduction to Phylogenomics
example, greater than 75% of the column is gaps instead of informative characters.
However, this practice removes information that may be important in reconstructing
phylogenetic lineages. For instance, sequence motifs that uniquely identify family
subtypes may be targeted for masking prior to phylogenetic tree reconstruction, but
their functional importance and evolutionary signal to differentiate subtypes could be
exploited in phylogenetic tree reconstruction.
1.5.3 Step 3: Reconstruct a phylogeny
1.5.3.1 Motivation, definition, and methods
The choice of phylogenetic reconstruction method depends on the computational re-
sources available and the size of the dataset to be analyzed. Distance methods (e.g.,
UPGMA and neighbor-joining (NJ) [Felsenstein, 1989]) are widely used when com-
putational efficiency is an issue, as in construction of phylogenies for each protein
in a genome. Many different variants of the standard NJ protocol have been devel-
oped into programs and evaluated on a range of protein families [Hollich et al., 2005].
Character methods include maximum parsimony (MP), maximum likelihood (ML),
and Bayesian methods. MP methods are significantly slower to reconstruct than the
distance methods, and are often less accurate than standard distance methods using
a high-quality distance metric (e.g., [Atteson, 1997; Felsenstein, 1978]). It has been
noted that MP methods perform particularly poorly when there are long branches
in the phylogeny [Felsenstein, 1978]. ML methods are more accurate than both dis-
tance methods and MP methods on simulation studies [Kuhner and Felsenstein, 1994;
Tateno et al., 1994], but are also computationally slower than both. The computa-
tionally slowest algorithms for phylogeny reconstruction are the Bayesian methods,
and although they may confer a small performance advantage over ML methods, their
applicability is limited to very small families [Mar et al., 2005; Hall, 2005].
22
Chapter 1. Introduction to Phylogenomics
The PHYLIP [Felsenstein, 1989] resource includes a compilation of numerous tools
for phylogenetic reconstruction. Other popular resources include PHYML [Guindon
and Gascuel, 2003], which is a recent maximum likelihood tree reconstruction method
designed for computational efficiency, PAUP∗ [Swofford, 2001], which includes MP,
ML, distance methods, and bootstrapping capabilities, and MrBayes [Huelsenbeck
and Ronquist, 2001], which takes a Bayesian approach to tree construction, perform-
ing a Markov chain Monte Carlo search through the space of possible phylogenies.
Rooting a phylogeny, or identifying the branch that contains the most recent com-
mon ancestor of each of the phylogeny leaves (which implicitly makes each branch
directed) is required to localize gene duplication events, but many phylogenetic tree
construction programs produce unrooted trees. Selecting outgroup sequences in a
phylogenetic reconstruction is standard practice for rooting species phylogenies, but
is often not possible in multi-gene families (i.e., genes from outgroup species may ap-
pear in multiple subtrees in the reconstructed phylogeny, or the root may be an ancient
duplication event making it difficult to identify an outgroup) [Felsenstein, 2003]. Mid-
point rooting places the root at the midpoint of the longest span in the tree and can be
applied to multi-gene families [Felsenstein, 2003]. This approach assumes a molecular
clock, which may not be a reasonable assumption in many protein superfamilies due to
the potential for lineage-specific rate variation following gene duplication. A related
method with the same assumption places the root to minimize the difference in path
lengths from the root to terminal nodes across the tree [Felsenstein, 2003]. Parsimony-
based rooting places the root of an unrooted gene tree so as to minimize the number
of gene duplications and gene losses in the tree [Berglund-Sonnhammer et al., 2006;
Thornton and LaSalle, 2000]. This is method appears to be more robust to lineage-
specific rate variation, but assumes that data being analyzed come from fully se-
quenced genomes. In contrast, mid-point rooting can be applied to phylogenomic
analysis of sequences retrieved from partially sequenced genomes.
23
Chapter 1. Introduction to Phylogenomics
Another type of method that is often employed computes statistical measures of
subtree reliability. The measurement should reflect how evidence in the MSA supports
this particular evolutionary topology. Bootstrap analysis can be used to estimate the
support for subtrees [Felsenstein, 1985]. Measures based on the bootstrap, including
the approximately unbiased test [Shimodaira, 2002], are often more powerful (and
more easily implemented) than the standard bootstrap in evaluating overall phylogeny
confidence. There are many possible alternative probabilistic measures of subtree
reliability, including posterior probabilities based on Bayesian analysis [Huelsenbeck,
1995] or approximate likelihood ratio tests [Anisimova and Gascuel, 2006]. These
measures can be used to estimate overall tree reliability, and may be helpful to factor
into the final phylogenomics-based predictions, perhaps to down-weight predictions
based on an inaccurate subtree as in Orthostrapper [Storm and Sonnhammer, 2002]
and RIO [Zmasek and Eddy, 2002].
1.5.3.2 Limitations and considerations
The quality of phylogenetic tree reconstructions is commensurate with the quality
of the input multiple sequence alignment, where the problems caused by multigene
families have been studied in detail. In general, phylogenetic tree reconstruction
methods have been developed for reconstructing the evolutionary history of single-
gene families; while their accuracy in reconstructing single-gene family phylogenies
is approximately known (primarily through simulation studies, e.g., [Huelsenbeck,
1995]), their accuracy in reconstructing phylogenies of multi-gene families is not well
understood.
One assumption that is strained in multi-gene families is positional homology, i.e.,
that the characters in a multiple sequence alignment column descend from a single
ancestral character. Positional homology is a fundamental assumption in character
based phylogenetic tree reconstruction methods, which assumes that the characters in
24
Chapter 1. Introduction to Phylogenomics
each column of an alignment evolved independently and identically distributed (IID).
However, structural studies have shown that, as two proteins diverge from a common
ancestor, their structures also diverge at a slower rate [Baker and Sali, 2001]. As evo-
lutionary distances increase, the sequence similarity can become extremely low, even
when the core structural elements are maintained. Constructing a reliable multiple
sequence alignment for such divergent sequences is difficult. The lack of structural
superposability across all positions in homologous proteins often violates the posi-
tional homology assumption for the multiple sequence alignments (e.g., insertions in
loop regions). Detailed comparisons of alignment methods applied to divergently re-
lated sequences have shown that no alignment methods produce high-accuracy results
when sequence identities fall below 30% [Baker and Sali, 2001]. These issues are not
problematic in the analysis of single-gene families, where sequence identity rarely falls
below 30% [Thompson et al., 1999].
Phylogenetic tree reconstruction is also sensitive to the specific region of align-
ment. When highly divergent sequences from multi-domain protein superfamilies
are aligned, phylogenetic signal can be non-uniform across the MSA. Estimating a
phylogeny from each region separately can produce different topologies, supporting
distinct predictions of function for members of the family. One example of this is
for large-subunit ribosomal DNA, where removing any portion of the alignment re-
sults in a modified (and incorrect) phylogenetic tree topology regardless of the tree
reconstruction method [Mugridge et al., 2000].
A consequence of the relative sparseness of genome sequencing in phylogenetic
reconstruction is that long branches (indicating a large evolutionary distance) may
be incorrectly placed. Long-branch attraction is a related problem: if there are
two or more rapidly evolving sequences, some phylogenetic reconstruction algorithms
will characterize them as siblings rather than as long branches from more distant
ancestors [Bergsten, 2005]. A more thorough sampling of taxa can sometimes alleviate
25
Chapter 1. Introduction to Phylogenomics
A A ABB BC CC
Figure 1.7: Ambiguity in coarse branching order can influence phylogenomicinference. Subtrees A, B and C represent orthologous groups, and are found consistentlyacross all trees estimated for these taxa. In this illustration, subtree A does not includeany sequence with experimentally determined function, but subtrees B and C have ex-perimental data supporting distinct functions. If we use the subtree-neighbor approachto infer function, in the first tree (from left), subtree A is predicted to have a functionsimilar to that of subtree B. In the middle subtree, it is not clear which function subtree Ahas. In the subtree at right, subtree A is predicted to have a function similar to C. If onlyone tree is included in the analysis, the ambiguity in tree topologies (and hence inferredfunction) will not be taken into account.
these problems, but may not be possible.
A final issue for phylogenetic tree reconstruction methods, with implications to
phylogenomic inference, is ambiguity in coarse branching order. A single method
may produce trees with different coarse branching orders in different runs; this is
mostly because there is generally less evolutionary signal to estimate the branching
order near the root of the tree. These differences in tree topologies can result in
different predictions of function for subclades with no experimental functional evi-
dence, as illustrated in Figure 1.7. For a good review of these issues and detailed
recommendations see [Thornton and LaSalle, 2000].
1.5.4 Step 4: Identify duplication events
1.5.4.1 Motivation, definition, and methods
The most rigorous automated methods for localizing gene duplication events on a
tree reconcile the gene tree and a reference species tree [Goodman et al., 1979], such
as Forester [Zmasek and Eddy, 2001a] and GeneTree [Page, 1998], as illustrated in
26
Chapter 1. Introduction to Phylogenomics
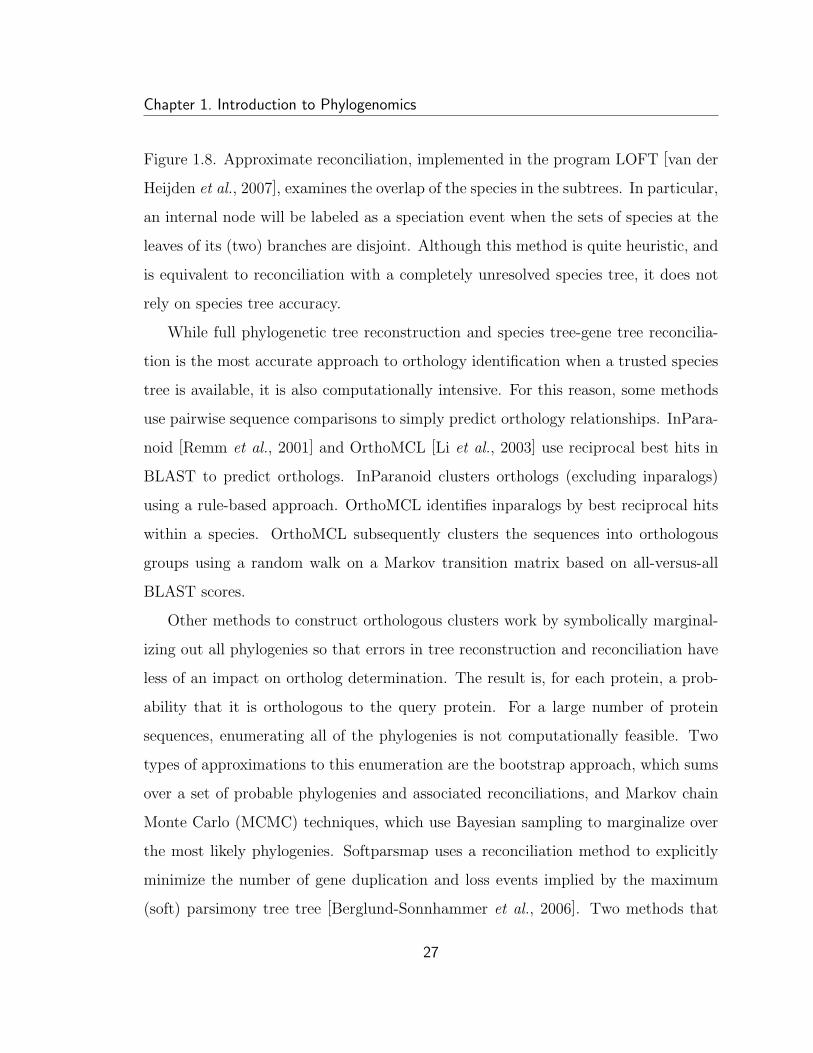
Figure 1.8. Approximate reconciliation, implemented in the program LOFT [van der
Heijden et al., 2007], examines the overlap of the species in the subtrees. In particular,
an internal node will be labeled as a speciation event when the sets of species at the
leaves of its (two) branches are disjoint. Although this method is quite heuristic, and
is equivalent to reconciliation with a completely unresolved species tree, it does not
rely on species tree accuracy.
While full phylogenetic tree reconstruction and species tree-gene tree reconcilia-
tion is the most accurate approach to orthology identification when a trusted species
tree is available, it is also computationally intensive. For this reason, some methods
use pairwise sequence comparisons to simply predict orthology relationships. InPara-
noid [Remm et al., 2001] and OrthoMCL [Li et al., 2003] use reciprocal best hits in
BLAST to predict orthologs. InParanoid clusters orthologs (excluding inparalogs)
using a rule-based approach. OrthoMCL identifies inparalogs by best reciprocal hits
within a species. OrthoMCL subsequently clusters the sequences into orthologous
groups using a random walk on a Markov transition matrix based on all-versus-all
BLAST scores.
Other methods to construct orthologous clusters work by symbolically marginal-
izing out all phylogenies so that errors in tree reconstruction and reconciliation have
less of an impact on ortholog determination. The result is, for each protein, a prob-
ability that it is orthologous to the query protein. For a large number of protein
sequences, enumerating all of the phylogenies is not computationally feasible. Two
types of approximations to this enumeration are the bootstrap approach, which sums
over a set of probable phylogenies and associated reconciliations, and Markov chain
Monte Carlo (MCMC) techniques, which use Bayesian sampling to marginalize over
the most likely phylogenies. Softparsmap uses a reconciliation method to explicitly
minimize the number of gene duplication and loss events implied by the maximum
(soft) parsimony tree tree [Berglund-Sonnhammer et al., 2006]. Two methods that
27
Chapter 1. Introduction to Phylogenomics
take the bootstrap approach, Resampled Inference of Orthologs (RIO) [Zmasek and
Eddy, 2002] and Orthostrapper [Storm and Sonnhammer, 2002], are described in
detail below.
There are many programs that identify putative orthologs automatically, including
InParanoid [Remm et al., 2001], OrthoMCL [Li et al., 2003], Softparsmap [Berglund-
Sonnhammer et al., 2006], Forester [Zmasek and Eddy, 2001a], GeneTree [Page, 1998],
and LOFT [van der Heijden et al., 2007]. Although these methods are automatic,
they have a high false positive rate due to many confounding factors, including the
approximations employed, sensitivity to errors in the protein phylogeny (except for
InParanoid and OrthoMCL, because they do not use phylogeny), and the selected set
of homologs.
The methods that perform approximate reconciliation are fast relative to phylo-
genetic tree reconstruction methods. Due to the high rate of false positives, often
manually incorporating knowledge of large-scale duplication events in the history of
a collection of species (e.g., [Eisen and Hanawalt, 1999]) and identifying obvious re-
dundant genes in sequence databases improves the accuracy of the duplication events.
1.5.4.2 Limitations and considerations
Simple sequence similarity-based orthology inference is not expected to be as reliable
as inference based on full phylogenetic tree reconstruction [Searls, 2003]:
Tree reconciliation is the most reliable method for identifying orthologous
subgroups, despite dependencies on the inherently noisy processes of mul-
tiple sequence alignment and tree reconstruction. Joint analysis of a phy-
logenetic tree, experimental data, alignment and structure also provides a
framework for identifying the actual sequence and structural changes re-
sponsible for protein function mutations. Furthermore, orthologous clus-
28
Chapter 1. Introduction to Phylogenomics
Figure 1.8: Gene tree/species tree reconciliation. On the left is a species treewith four taxa colored to distinguish orthologous genes related by speciation events. Du-plication events connect the three gene trees within the species tree. On the right is areconciled gene tree, showing the three different clades of orthologous proteins, connectedby duplication events (represented by purple squares). Species A has one protein in thisparticular protein family, species B has three proteins, species C has two proteins, andspecies D has three proteins. The gene tree for these homologous proteins is shown on theright. Note that you need two duplication events to explain every repeat of the speciestree, as shown in purple squares in the gene tree, where the repeated species trees (somewith gene losses) are the red, green, and blue clades.
29
Chapter 1. Introduction to Phylogenomics
ters should not be naively assumed to be functional equivalents. The bi-
ological complexities force us to consider functional mutation in a more
structured, probabilistic light.
A more empirical justification for reconciliation methods was performed in a re-
cent study [Chen et al., 2007], in which pairwise comparison methods appeared to
have higher sensitivity in ortholog identification, but the reconciliation methods ap-
pear to have higher specificity. It is unclear whether their method of evaluation
(using latent class analysis) favors one type of method over another, and in particular
Automated protein function prediction is an exceptional challenge for computational
biologists because protein function is difficult to describe and represent, protein
databases are littered with annotation errors, and our understanding of how molecular
functions arise and mutate over evolutionary time is far from complete.
The sequences of over 107 proteins are known, and a diverse array of functional
descriptions have been attributed to these proteins, including 7466 molecular func-
tion terms from Gene Ontology [Ashburner et al., 2000]. However, fewer than 0.2%
of the annotations for UniProt proteins involved human curation in the Gene On-
tology Annotation (GOA) database [Apweiler et al., 2004; Camon et al., 2004], and
even fewer involved an experimental assay. Because biologists depend upon protein
function annotations for insight and analysis, automated methods have been used
to compensate for the relative dearth of experimental characterizations. Unfortu-
nately these methods are commonly assessed based on annotation quantity rather
than quality, resulting in a burgeoning of methods that increase the number of false
positive function predictions. These results contaminate protein analyses and pollute
38
Chapter 2. Sifter: Statistical Inference of Function Through Evolutionary Relationships
databases [Galperin and Koonin, 1998; Brenner, 1999].
A decade ago, when the protein sequence databases were small and mostly man-
ually curated, Eugene Koonin estimated that the majority of errors in protein func-
tion annotation are actually propagations of existing database errors [Koonin et al.,
1996]. That is, the protein to be annotated has the same function as that of the
matched database protein, but the protein in the database had been incorrectly de-
scribed. This problem could be managed in part by having every protein annotation
supported by traceable evidence. This would allow each protein annotation to be
associated with a degree of confidence and would allow propagation of corrections to
follow propagated errors. An important step in this direction is the GOA database,
which incorporates the GO evidence codes and provides functional information for
millions of proteins [Camon et al., 2004]. The task of incorporating all literature
evidence into the databases is immense and ongoing, but vital. Function prediction
methods that incorporate evidence codes and provide reliability measures would seem
less prone to error propagation.
Some automated methods have improved the quality of annotations by explicitly
sacrificing functional specificity, making predictions at intermediate nodes of GO
rather than at the leaves (e.g., GOtcha [Martin et al., 2004]). These approaches are
promising, though it remains to be seen whether the GO directed acyclic graph (DAG)
is a satisfactory representation for generalizing molecular function and evolutionarily
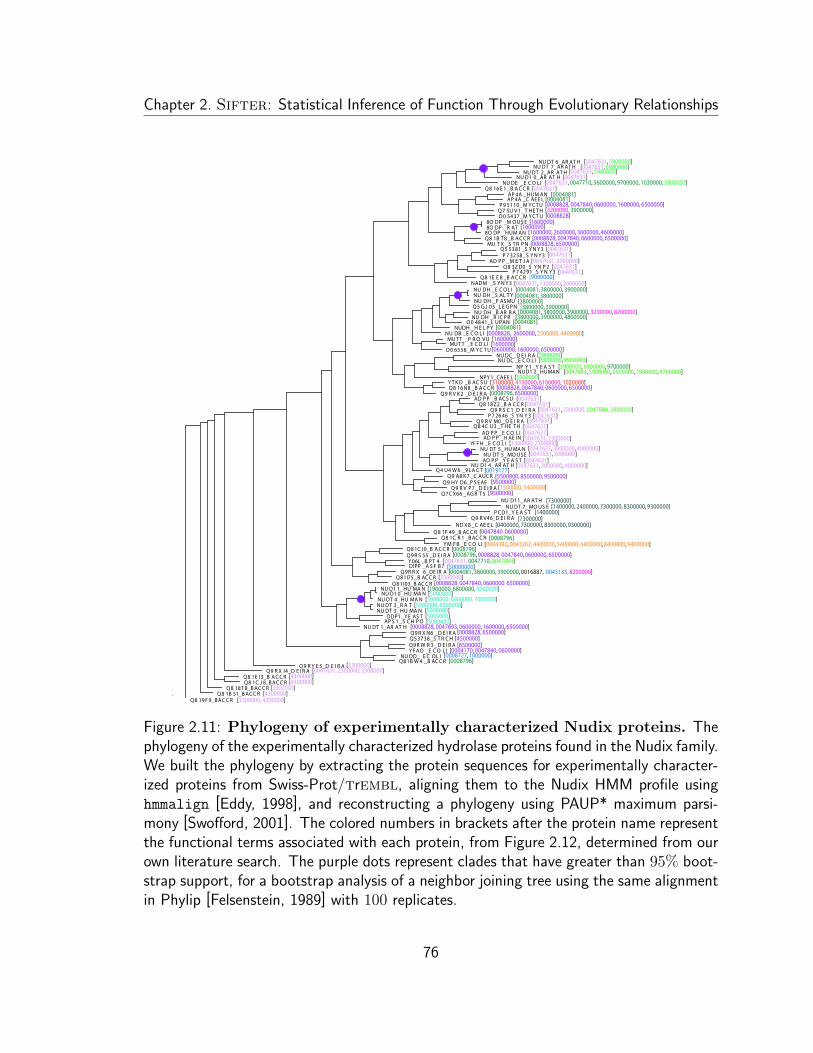
accessible functional variability. Our functional analysis of the Nudix protein family
illustrates that the GO term coverage and hierarchical structure is incomplete and
ineffective for some protein families.
39
Chapter 2. Sifter: Statistical Inference of Function Through Evolutionary Relationships
2.1.2 Phylogenomics review
Phylogenomics has been proposed as a powerful approach for meeting the chal-
lenges of protein function prediction, as discussed in the introduction [Eisen, 1998;
Brown and Sjolander, 2006]. The phylogenomic methods that we focus on in the
remainder of this thesis use a full reconciled phylogenetic history of a protein family
to make protein function predictions, rather than pairwise sequence comparisons as
for predictions obtained from blast. This protocol relies on the observation that
functional divergence often follows a gene duplication event, because protein redun-
dancy will allow mutation events that otherwise would have been selected against.
Duplication events are annotated at the internal nodes of a phylogenetic tree by rec-
onciling inconsistencies between the gene tree and the associated species tree, which
identifies the likely nodes in the gene tree of duplication events [Goodman et al., 1979;
Page, 1998].
2.1.2.1 Phylogenomics versus pairwise annotation transfer methods
The phylogenomic approach to protein function annotation has many advantages
over pairwise annotation transfer methods, a few of which were discussed in the
introduction. In general, a phylogeny suggests an evolutionarily-principled means of
integrating functional evidence, and in particular ways of specifying how accurate
each data point is believed to be with respect to the query protein. Since orthology
is not a transitive relationship, organizing groups of proteins in orthologous groups
based on this pairwise relationship does not guarantee that all of the members of
the group will be related by speciation events as opposed to gene duplication events.
Instead of pairwise comparisons, a tree is the natural structure to specify and explore
protein homology and functional relationships.
40
Chapter 2. Sifter: Statistical Inference of Function Through Evolutionary Relationships
2.1.2.2 Phylogenomic methods
While originally applied manually, phylogenetically-motivated protein function pre-
diction has now been deployed in automated methods. One such method, Orthos-
trapper [Storm and Sonnhammer, 2002], uses bootstrapping to identify statistically-
supported orthologous clusters of proteins, and transfers function annotations within
each of these clusters. The statistically-supported clusters tend to encompass a subset
of the sequences in a few large clusters, so often multiple annotations are transferred
within each large cluster. Further, as there is little experimental evidence for pro-
tein functions, Orthostrapper makes relatively few annotations when restricted to
experimental evidence, but those predictions it makes usually include the correct an-
notation. EnsEMBL now also uses a tree for more accurate function transfer among
orthologs [Hubbard et al., 2006].
The method presented in this thesis, sifter (Statistical Inference of Function
Through Evolutionary Relationships), is also based on phylogenomic principles, which
we formalize within a probabilistic framework [Engelhardt et al., 2005; Engelhardt et
al., 2006; Engelhardt et al., submitted]. Sifter uses a statistical model of molecular
function evolution to incorporate annotations throughout an evolutionary tree, mak-
ing predictions supported by posterior probabilities for every protein. Phylogenomics
is predicated on the explicit assumption that a phylogeny reconstructed from pro-
tein sequence represents also how molecular function evolved within those sequences.
Thus, we fix the tree structure to the phylogeny reconstructed from sequence data
and employ a conditional probability model describing molecular function evolution.
This statistical graphical model of molecular function evolution enables access to a
broad set of statistical tools for computation of posterior probabilities of the molecular
functions and parameter estimation.
Predictions from statistical graphical models are generally quite robust, which this
41
Chapter 2. Sifter: Statistical Inference of Function Through Evolutionary Relationships
problem requires. In particular, each protein family has sparse functional annotations
and noise in both the annotations and the reconstructed phylogeny, so the selected
model must be robust to the input data. The graphical model architecture is by nature
flexible in terms of integrating various data types from different sources in a natural
and coherent way. We currently represent molecular function in Gene Ontology terms,
enabling some understanding of how the terms are related through the directed acyclic
graph (DAG) structure organizing the terms hierarchically, although this is not a
requirement of the approach. We rely on the evidence codes in the GOA database as
an indication of the reliability the functional annotations.
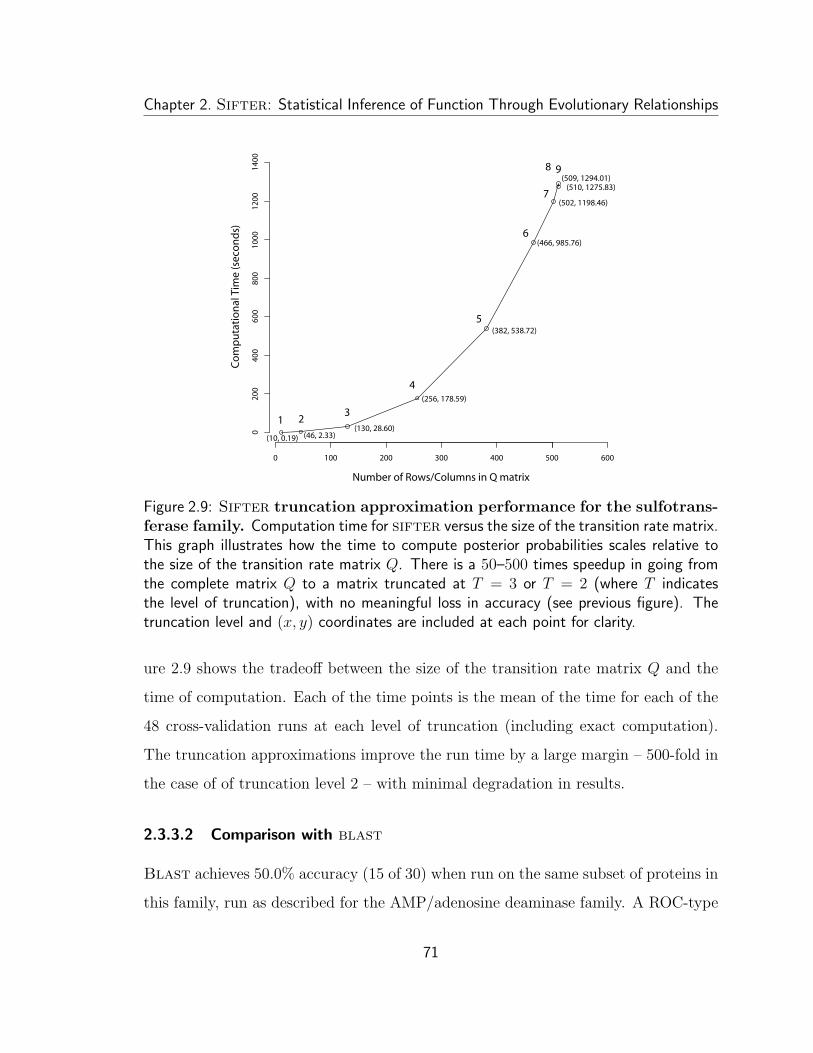
The challenge of functionally diverse protein families
Protein families such as the Nudix family are a challenge for any molecular function
prediction method because of the large number of proteins, the enormous diversity
of molecular function in the family as a whole, and the sparsity of available experi-
mental characterizations. Figure 2.1 summarizes protein family size and functional
diversity in the Pfam protein family database [Bateman et al., 2002]. In Pfam re-
lease 20.0, there are 8164 protein families, 519 of which have more than 1000 member
proteins. We anticipate that these numbers will continue to grow, with a single re-
cent project roughly doubling the number of known peptides [Yooseph et al., 2007].
Although 5411 of the families have no experimental molecular function characteri-
zations from the GOA database, there are 1887 families with at least two different
molecular functions based on experimental evidence. Sifter could be applied to
each of these families, producing predictions for more than one candidate molecular
function. Of those families, 619 families (32.8%) have six or more different molecular
functions characterized within the family’s proteins. The sifter model nominally
has exponential computational complexity in the number of candidate proteins, so
42
Chapter 2. Sifter: Statistical Inference of Function Through Evolutionary Relationships
Figure 2.1: Numerous and diverse protein families in the Pfam Database.Statistics from Pfam release 20.0 show large and functionally diverse protein families, mo-tivating an approximate version of sifter. Panel (a) shows the proportion of the 8164protein families in Pfam that have the specified number of protein members, where 67families have over 5000 members. Panel (b) represents the proportion of proteins withexperimental annotations from the GOA database in each family within Pfam, including5411 families with zero experimental annotations, and 388 families with more than 10%of their members with experimental characterizations. Panel (c) illustrates the functionaldiversity of the 1887 families with two or more different experimental function characteri-zations. Note that almost a third of those families have six or more functions, and wouldbe computationally infeasible for sifter version 1.1.
most of these functionally diverse families are computationally infeasible for the pre-
vious version of sifter. This motivated the construction of a fast approximation of
sifter to analyze these functionally diverse families with phylogenomic methods for
more complete coverage of Pfam protein families. We predict that as the number of
proteins with experimental characterizations increases, so will the relative diversity of
the families (despite the experimental bias towards characterizing proteins with the
same molecular function as evolutionarily close, characterized proteins).
This most recent version of sifter uses a simple but effective approximation that
enables tractable computation of function predictions in functionally diverse families.
The approximation essentially truncates the number of molecular function combina-
tions that are considered during computation of the posterior probabilities. Despite
43
Chapter 2. Sifter: Statistical Inference of Function Through Evolutionary Relationships
the simplicity of the approach, prediction quality does not appear to degrade until the
lowest truncation is reached (and then only slightly), even for multifunction proteins.
We validated this approach on the previously studied AMP/adenosine deaminase
family of proteins, and then we applied it to two functionally diverse protein families,
the sulfotransferase family and the Nudix family, the latter of which was previously
computationally infeasible for sifter.
In this version of sifter, we designed the model of molecular function evolution
to be flexible enough to enable the encoding of prior biological knowledge and to
allow us to construct the transition rate matrix in a semantically meaningful way
from a smaller set of parameters that can be estimated from the data. The model for
evolution that fulfills these requirements is a generic continuous-time Markov chain.
This also simplifies the machinery required to compute posterior probabilities and to
estimate the model parameters.
2.2 The sifter method
Sifter incorporates data from many different sources to reconstruct a phylogeny
and compute posterior probabilities. Here we describe the data integration, then
we present the Markov chain model and the approximate computation of posterior
probabilities.
2.2.1 From database data to a tree
The data used by sifter currently comes from a number of different sources. We
extracted the families studied here from the Pfam database [Bateman et al., 2002],
and we used the manually-curated alignment found in Pfam for phylogeny recon-
struction. Trees were built using different methods depending on the family size as
44
Chapter 2. Sifter: Statistical Inference of Function Through Evolutionary Relationships
Evidence Code Full Name Probability
IDA Inferred by direct assay 0.9TAS Traceable author statement 0.9IMP Inferred by mutant phenotype 0.8IGI Inferred from genetic interaction 0.8IPI Inferred from physical interaction 0.8ISS Inferred by sequence or structural similarity 0.4RCA Inferred from reviewed computational analysis 0.4IGC Inferred from genetic interaction 0.4IEP Inferred from expression pattern 0.4IC Inferred by curator 0.4NR Not recorded 0.3NAS Non-traceable author statement 0.3ND No biological data available 0.3IEA Inferred by electronic annotation 0.2
Table 2.1: The Gene Ontology evidence codes and corresponding sifter probabilities ofcorrectness. These probabilities were elicited from a domain expert.
described below. All trees were reconciled using the Forester v.1.92 program [Zmasek
and Eddy, 2001a]; the reference species tree is from the Pfam database. As input
evidence, we used all annotations in the GOA database [Camon et al., 2004] with
experimental evidence codes IDA, IMP, and TAS. Where we independently found
experimental characterizations in the literature, we labeled that annotation with a
Traceable Author Statement (TAS ) evidence code. The probability of correctness for
each of the evidence codes is shown in Table 2.1. These probabilities were elicited
from a domain expert (Professor Steven Brenner).
In the model, each protein i is associated with a Boolean random vector Xi, where
each Boolean random variable represents a candidate function that takes value 1 when
protein i has that particular molecular function and 0 if that function is not active in
protein i. The candidate terms and associated annotations from the GOA database
are identified and converted to the random vectors Xi in the tree associated with each
45
Chapter 2. Sifter: Statistical Inference of Function Through Evolutionary Relationships
protein i through the following process. We eliminate the molecular function term
dependencies and reduce the number of candidate functions by annotating the GO
DAG terms with experimental evidence codes for the entire family of proteins, and
first pruning all (possibly annotated) ancestors of annotated nodes, then pruning all
non-annotated nodes. This leaves a set of candidate functions that are neither ances-
tors nor descendants of each other, ensuring there are no deterministic dependencies
between them in terms of the semantic network. Then, for each protein with experi-
mental evidence, the annotations from the full GO DAG are propagated to the set of
descendant candidate functions by effectively marginalizing out the ancestor terms.
Annotations are propagated to the candidate terms by assuming that the probability
that children terms have a value 1, when a parent term has value 1 and the edges
between related terms are all “is a” edges, is 1r|S| . In this equation, |S| is the size
of an arbitrary subset of children terms of the annotated term and r is the solution
to the equation∑
S∈S1
r|S| = 1, where S is the power set of all children terms of a
particular term. Note that we set the probability of the empty set to zero, effectively
assuming that if a protein has a particular function, it must also have at least one
of the function’s descendant terms related by “is a” edges. Marginalizing out all of
the non-candidate function terms eliminates all deterministic dependencies from the
random vector for each protein. The random vectors representing observations of
molecular function activity are set to the values from this computation for each leaf
protein with experimental evidence.
We then propagate the evidence throughout the phylogenetic tree to compute
posterior probabilities for all of the proteins in the tree. We do this by using a
Markov chain model representing how protein molecular function evolves to define
transition probabilities associated with the branches of the tree, and by applying
standard message passing techniques (e.g., [Felsenstein, 1989]) to compute posterior
probabilities at all nodes in the tree
46
Chapter 2. Sifter: Statistical Inference of Function Through Evolutionary Relationships
2.2.2 Markov chain model
The structure of the evolutionary model is given by the phylogenetic tree; we are
left to specify the conditional probabilities at each of the nodes in the tree. Sifter
employs a first-order Markov chain, which makes the Markov assumption that future
states are independent of past states given complete information about the present
state. In evolutionary terms, this means that predicting molecular function for a
protein based on only its immediate ancestor will be just as good as using all of
its ancestors. Similar assumptions have long been used to model the evolution of
molecular sequences (e.g., [Dayhoff et al., 1978; Henikoff and Henikoff, 1992]). Let
the number of candidate functions in the model be denoted M , and the number
of leaf proteins be denoted N . Our Markov chain has three sets of parameters.
Two parameters σspeciation and σduplication, as in earlier models, describe the scaling
of time after speciation versus duplication events; vector parameter α = {α1, ..., αM}
describes the rate for a single instantaneous time step of function i arising when none
of the candidate functions are observed in the ancestor protein; in matrix parameter
Φ = {φ11, φ12, ..., φMM}, the off-diagonal elements φij, i 6= j, describe the rate for
function i mutating to also perform function j, and the diagonal elements φii describe
the rate at which function i is lost.
Using parameters Φ and α, we can build the instantaneous transition rate matrix
Q for a Markov chain that describes the instantaneous rate of change in functional
activity from an ancestor to its descendant. For example, the matrix Q for two
candidate functions has on its rows (representing ancestor states) and columns (rep-
resenting descendant states) all of the possible combinations of two functions for the
parent and child proteins, namely {00, 01, 10, 11}. Call this power set S2, as above.
In this terminology, “01” (for example) means that the first candidate function is not
present (0) and the second candidate function is present (1) in a protein’s state.
47
Chapter 2. Sifter: Statistical Inference of Function Through Evolutionary Relationships
00 10 01 11
00 – α1 α2 010 φ11 – 0 φ12 + α2
01 φ22 0 – φ21 + α1
11 0 φ22 φ11 –
Table 2.2: Sifter rate transition matrix. This is the instantaneous transition ratematrix used in sifter for M = 2. The rows represent different sets of functions for theparent protein; the columns are child functions. Recall that αi is the rate of a function iarising, φij is the rate of a protein with function i mutating to also have function j, andφii is the rate of function i disappearing. The diagonal elements in this table are set suchthat the rows sum to 0.
A full transition rate matrix Q, defined by variables Φ and α, is shown in Table 2.2
for M = 2, and is constructed analogously for M > 2 candidate functions. We
will motivate and discuss this particular transition rate matrix further below. For
a thorough discussion of continuous-time Markov chains as related to evolutionary
processes, see [Felsenstein, 2003], Chapter 13.
We constrain the rows of the matrix Φ to positive values that sum to at most
M . Similarly, we constrain the α parameters to the M simplex. These constraints
must be respected by the parameter estimation procedure. Furthermore, we constrain
these parameters away from zero so as to avoid creating sink states or unreachable
states in the Markov chain when estimating parameters (specifically, all parameters
are greater than 0.01). Because the Φ matrix and vector α are used to construct
the transition rate matrix Q, each non-zero, off-diagonal entry in matrix Q implicitly
has a finite upper bound and positive lower bound by way of the constraints on the
matrix Φ and the vector α.
The conditional probability of a child configuration given a parent configuration
is as follows, from the definition of a continuous time Markov chain:
48
Chapter 2. Sifter: Statistical Inference of Function Through Evolutionary Relationships
p(Xi = sj|Xπi= sk, ti, Φ, σ) = {exp(tiσQ)}k,j.
In this equation, Xi is the random vector associated with protein i, Xπiis the
random vector associated with protein i’s immediate ancestor, ti is the length of the
branch between Xi and Xπi, j and k index the power set S, sj and sk ∈ S, and
exp is the matrix exponential function, exp(tQ) =∑∞
k=0(tQ)k
k!. Element (k, j) of the
transition probability matrix exp(tiσQ) is the probability that an ancestor protein in
state k mutates to state j in the descendant protein within the time period ti (here,
the phylogenetic branch length, which must be non-negative).
As in earlier models [Engelhardt et al., 2005; Engelhardt et al., 2006], the joint
probability of the complete tree is:
p(X|Φ, σ) = p(Xroot)∏
i∈tree
p(Xi|Xπi, ti, Φ, σ).
The parameters of this model can be estimated using generalized expectation max-
imization (GEM) [Gelman et al., 2003]. In particular, the E-step is the computation
of the posterior probabilities for each random variable, using the standard message
passing algorithm as in Felsenstein’s maximum likelihood tree estimation [Felsenstein,
1989]. Because there is no simple analytical expression for the matrix exponential
function of this transition rate matrix Q, we compute these values numerically for a
given Q using the jLapack library [Blount and Chatterjee, 1998].
The M-step is implemented using projected gradient ascent [Bertsekas, 1999] for
each of the parameters σ, Φ, and α, derived from the gradient of the expected complete
log likelihood of the model with respect to each of the parameters. Each step of the
gradient ascent is scaled by step size ρ. The parameter constraints mentioned above
define the space onto which the gradient steps are projected. The Φ and α parameters
are projected via normalization onto an M + 1 sided cone defined by the M simplex
49
Chapter 2. Sifter: Statistical Inference of Function Through Evolutionary Relationships
on M dimensions, and the scale parameters are projected back to 0.01 when they fall
below that value. Because the parameter gradients are unbounded objective functions
in this optimization, the constraints are necessary to bound these functions during
parameter estimation.
In practice, we take a single projected gradient step for each iteration of GEM.
We stop EM iterations when the sum of the absolute value of the total change in
parameters is less than some cutoff c. In our experiments here, we set the step size ρ
of the gradient ascent to 0.01 and the cutoff c to 0.0015 but these will vary based on
the size of the family and the number of observations.
2.2.3 Transition rate matrix assumptions and alternatives
We designed the instantaneous transition rate matrix Q with the following semantics.
In a single instant, the probability of more than one functional change (i.e., loss or
gain of a single function) in a protein is zero. Hence those instantaneous transition
rates are set to zero. Of course, the probability of these transitions will be non-zero
when time t > 0 has passed, according to the definition of the matrix exponential.
Another way to see this is that the probability of multiple transitions (creating a path
between the states with more than one functional change) will be non-zero when some
finite period of time has passed. Furthermore, some states are the result of one of
multiple possible events. For example, if a parent protein in state 01 transitions to
state 11 in the child, the appearance of the function 1 could be a result of function 2
mutating into function 1 while retaining function 2 as well (φ21) or the spontaneous
appearance of function 1 (α1). For transitions that could result from one of a number
of events, the rates for each possible event are summed.
This approach thus takes into account the possibility of a single change in func-
tion over a finite time period. This models the impact of various changes in protein
50
Chapter 2. Sifter: Statistical Inference of Function Through Evolutionary Relationships
sequence that control and modify function. An additional domain may be added to a
protein in a single mutation event (i.e., a gene duplication or domain shuffling event),
conferring an additional molecular function. Mutations of individual nucleic acids
(coding for this protein or related proteins) or a change in environment may accu-
mulate to confer enzymatic activity specific to an additional substrate, or yield (over
time) a different chemical reaction entirely. All of these possibilities are implicitly
modeled by our particular choice of matrix Q.
Other evolutionary possibilities are not modeled by our choice of matrix Q. In
particular, we have assumed that the instantaneous rate of transition between states
with more than one difference, e.g., a 01 state and a 10 state, has probability zero.
Of course this does not reflect all biological possibilities. There are examples of
single nucleotide mutations, an event that would be considered instantaneous, that
change specificity from one substrate to another. We have chosen to allow this case
to be subsumed by the transition paths implemented by the matrix exponential, in
particular a function gain followed by a complementary function loss.
A more general modeling concern may be the simplification of describing a protein
performing a certain function as a binary variable. Alternatively, we could model this
using a continuous variable capturing the tendency of a particular enzyme to catalyze
a particular reaction, such as Kcat. It would be possible to use diffusion theory to
model this variable as a continuous one, but we have chosen not to go this route for
a number of reasons. The primary reason is one of data: there is simply not enough
data available for particular enzymes to model this robustly. A more subtle question
is whether this feature of a protein evolves in parallel with protein sequence, which
impacts the appropriateness of phylogenetic methods for this modified problem.
51
Chapter 2. Sifter: Statistical Inference of Function Through Evolutionary Relationships
2.2.4 Sifter’s approximate computation
The time complexity of computing the posterior probabilities for the sifter model
is linear in the number of proteins, but exponential in the number of candidate func-
tions. The exponential complexity is due to the set of 2M possible combinations of
candidate functions for each protein, resulting in a transition rate matrix with (2M)2
entries. Computing matrix exponentials explicitly for each branch in the tree (after
storing intermediate results) has a computational complexity of O(N((2M)2·3) (the 3
comes from computing the matrix exponential of a matrix of size (2M)2). Thus, when
M is large, the time to compute posterior probabilities is dominated by the exponen-
tial complexity in the number of candidate functions. In the case of the Nudix family,
where the number of candidate functions is 66, this complexity would make the com-
putation impossible. But most of the configurations under consideration, especially
states with many functions having value 1, have a near-zero probability of occurring.
Therefore, we implemented a simple but effective approximation that truncates the
possible sets of molecular functions under consideration.
The power set truncation approximation simply limits the total number of can-
didate functions with value 1 in the transition rate matrix power set to a value T .
This shrinks the transition rate matrix to only consider transitions between all states
with T or fewer functions with value 1. In the binary representation above, the sum
of the candidate functions with value 1 (i.e., present in the protein) cannot exceed a
fixed value T , thus reducing the number of elements in the power set to∑T
i=1
(Mi
).
In the Nudix family, setting T = 1, the power set has 67 elements (each single can-
didate term and the empty set), and 4489 elements in the associated transition rate
matrix Q, where the power set truncated at 2 has 4356 elements, and a Q matrix with
18, 974, 736 elements. In contrast, without truncation, the Nudix power set has ap-
proximately 7.38 ∗ 1019 elements, and the corresponding Q matrix has approximately
52
Chapter 2. Sifter: Statistical Inference of Function Through Evolutionary Relationships
5.44 ∗ 1039 elements. Computation time is reduced from infeasibly long to seconds,
as illustrated in the results section.
2.3 Results and discussion
We first compare the performance of sifter (version 1.2) on a previously studied fam-
ily (the AMP/adenosine deaminases) to the performance of sifter version 1.1 [En-
gelhardt et al., 2006]. We then present results on the sulfotransferase and Nudix
families to assess whether the model is able to predict molecular function accurately
for more functionally diverse protein families.
In these analyses, we define sifter accuracy as the percentage of experimentally
characterized proteins for which the functional term with the maximum posterior
probability is in the set of experimental characterizations. All experiments where
timing results were reported were run on Dell Precision 390 Workstation computers
with Intel Core2Duo 2.6 GHZ processors and 2 Gb RAM.
2.3.1 Comparative function annotation methods
Before presenting the results, we explain how we ran each of the function annota-
tion methods used for comparison. In general we ran these methods giving them
the benefit of the doubt, choosing parameter settings to to make the comparison
as fair as possible. Of the three methods involved in the comparison, blast and
GOtcha both transfer function annotations based on pairwise sequence comparisons;
Orthostrapper comes from a family of methods that rely on phylogenomic assump-
tions, transferring annotations between proteins that have pairwise orthology with
bootstrap significance.
The blast version 2.2.4 [Altschul et al., 1990] assessment was performed on the
53
Chapter 2. Sifter: Statistical Inference of Function Through Evolutionary Relationships
non-redundant (nr) set of proteins downloaded from the NCBI website on December
11, 2006. We ran blastp with an E-value cutoff of 0.01. For each query protein in
the selected families we searched the blast output with the most significant E-value
(probability of the alignment score based on an extreme value distribution for aligning
protein sequences at random) removing any exact matches from the same species to
ensure that the query protein did not receive its own database annotation (emulating
a leave-one-out type of experiment). We transferred the candidate functional term
associated with the most significant blast hit that had an annotation within the set
of candidate functions defined by sifter for a particular protein family. In other
words, if the top blast hit was not annotated, we found the next most significant
hit with a candidate function annotation to transfer. If there were multiple proteins
annotated with candidate functions that shared the same E-value, we transferred all
of the associated annotations. Historically, when researchers use blast for large-
scale protein molecular function annotation, either the most significant non-identity
hit or the most significant non-identity annotated hit is transferred to the query
protein, often leading to no prediction or an incorrect (or overly general) prediction.
Here we transfer annotation from the most significant hit with a candidate term
using a keyword extraction script. This process increases the overall accuracy of
the blast predictions and enables a comparative ROC-type analysis. This problem
requires a ROC-type analysis that allows for the possibility of multiple true positive
functional predictions and multiple true negative functional predictions, instead of
the usual binary classification. Specifically, the ROC-type analysis was performed by
determining true positive and false positive annotations for E-value cutoffs between
0 and 0.01.
We ran the first publicly available version of the GOtcha software [Martin et
al., 2004]. GOtcha predicts protein function using a statistical algorithm applied
to blast searches. The blast searches are performed on a manually-constructed
54
Chapter 2. Sifter: Statistical Inference of Function Through Evolutionary Relationships
database containing complete GO annotations of seven genomes, including GO evi-
dence codes. Because the annotation database is precompiled for fast querying, we
could not ensure that a query protein was not being annotated from its own annota-
tion in the database; thus our results for GOtcha are likely to be overly optimistic.
For one set of experiments (labeled GOtcha), we made predictions using annotations
with both experimental and electronic evidence codes. For another set of experiments
(labeled GOtcha-exp), we made predictions given only annotations with experimental
evidence codes. The output is a numerically ranked list of GO terms; we extracted
the ranked list of candidate functions from this complete set, breaking ties in favor
of the correct term. The ROC-type analysis was performed by determining true pos-
itive and false positive annotations for cutoff values between 100 and 0 (maximum
and minimum ranking scores, respectively).
We ran the Orthostrapper [Storm and Sonnhammer, 2002] version from February
6, 2002. We split the proteins in each family with experimental GO annotations into
proteins from eukaryotes and non-eukaryotes, which was used to determine orthology
or paralogy using an approximate gene tree/species tree reconciliation method. We
clustered the bootstrap analysis according to the cluster program in Orthostrapper,
using a bootstrap cutoff of 750 and then using a cutoff of 1, resulting in statisti-
cally significant clusters (Orthostrapper-750) and non-statistically significant clusters
(Orthostrapper-1). In each cluster, we transferred all experimental GO annotations
from member proteins onto the remaining proteins without experimental characteriza-
tions. If a protein was present in multiple clusters, it received annotations transferred
within all of those clusters. This method yields an unranked set of predictions for
each protein; multiple annotations were manually resolved in favor of the correct
one. We performed cross-validation for each protein by removing its annotations and
transferring the remaining annotations to make a prediction for the held-out protein.
The ROC-type analysis was performed by determining true positive and false positive
55
Chapter 2. Sifter: Statistical Inference of Function Through Evolutionary Relationships
annotations for all clusters generated by bootstrap cutoffs between 1000 and 0.
2.3.2 AMP/adenosine deaminase family
We applied sifter version 1.2 to the Pfam adenosine/AMP deaminase family (PF00962),
which contains 251 proteins in Pfam 18.0. Proteins in this family are responsible for
removing an amine group from the purine base of three possible substrates: adenine,
adenosine, and AMP. As shown in Figure 2.2, there are four candidate functions for
this family, three of which are deaminase activity with different substrates. Addi-
tionally, a subset of proteins within this family show growth factor activity, and are
commonly known as adenosine deaminase-related growth factors [Maier et al., 2005].
The GOA database contained experimental GO annotations for 13 proteins, a
literature search revealed experimental annotations for an additional 20 proteins,
including our experimental characterization of an adenosine deaminase protein in
Plasmodium falciparum [Engelhardt et al., 2005], resulting in 33 proteins with ex-
perimental annotations. A phylogeny for these 33 proteins, in Figure 2.2, shares the
branching structure with the reconstructed phylogeny in a previous study [Maier et
al., 2005] regarding the relative positions of the adenosine deaminases, adenine deam-
inases, AMP deaminases, and adenosine deaminase-related growth factors. Both this
phylogeny and the phylogeny for the full set of proteins was built using PAUP*
version 4.0b10 maximum parsimony with the BLOSUM50 matrix [Swofford, 2001;
Henikoff and Henikoff, 1992]. The alignments for both phylogenies were from the
Pfam alignment.
Besides being an important protein family in the study of human immunodefi-
ciency disease [Hirschhorn and Ellenbogen, 1986], this family is interesting in the
molecular function context because the active site residues are shared across all of
the different types of substrates (i.e., in all cases the site binds to an amine) [Ribard
56
Chapter 2. Sifter: Statistical Inference of Function Through Evolutionary Relationships
Q8S T 69_DR OME
Q9V741_DR OME
Q9 VV K5 _DRO ME
Q26642_S AR PE
Q9NC 65_LUT LO
Q9U7C 5_G LOMR
Q9U7C 6_G LOMR
Q9V F S 0_DR OME
Q9V F S 1_DR OME
Q9G R E 6_DR OME
Q8IQR 3_DR OME
Q8IHF 6_DR OME
ADA_B OVIN
ADA_HUMAN
ADA_MOUS E
ADA_R AT
ADD_E C OLI
ADD_E C O57
ADD_E C OL6
Q8X1T 6_E ME NI
Q9P 6I7_S C HP O
ADA_Y E AS T
ADD_S T R VG
Q8IJ A9_P LAF 7
AMP D_S C HP O
AMP D_Y E AS T
AMP D3_MOUS E
AMP D3_R AT
AMP D3_HUMAN
AMP D1_HUMAN
AMP D1_R AT
AMP D2_R AT
AMP D2_HUMAN
GO:0000034 : adenine deaminase
GO:0003876 : AMP deaminase
GO:0004000 : adenosine deaminase
GO:0008083 : growth factor activity
growth factor activity + adenosine deaminase
Gene Ontology Functions Terms for AMP/Adenosine Deaminases
Figure 2.2: Phylogeny of experimentally characterized AMP/adenosinedeaminase proteins. The phylogeny of the experimentally characterized set of pro-teins from the AMP/adenosine deaminase family. We built the phylogeny by extractingthe protein sequences for the experimentally annotated proteins from Swiss-Prot/trembl,aligning them to the A deaminase HMM profile using hmmalign [Eddy, 1998], and recon-structing a phylogeny using PAUP* parsimony. The branching structure is the same asthat of the full tree used in the experiments at the top levels of the phylogeny. The colorsindicate experimentally characterized protein functions, as described explicitly in the key.This tree was drawn using the ATV program [Zmasek and Eddy, 2001b] (as were all ofthe remaining trees presented here).
57
Chapter 2. Sifter: Statistical Inference of Function Through Evolutionary Relationships
et al., 2003]; substrate specificity in this protein is modified by molecular changes in
areas not associated with amine binding. Thus a closer look at the active site will not
result in better discrimination of the protein substrate, only a general evolutionary
divergence. A similar situation is also observed in the protein structures of the Nudix
hydrolases.
We ran leave-one-out cross-validation on the experimental annotations, using the
full phylogeny of 251 proteins in this family. In general, cross-validation assesses
the ability of the method to generalize to unobserved data. Each iteration of cross-
validation involved estimating the model parameters using GEM after removing evi-
dence associated with one of the proteins in the model, simulating unobserved data.
We call the prediction correct when the function with the maximum posterior proba-
bility for the held-out protein, computed using the estimated parameters, is one of its
experimentally characterized functions. The starting values of the parameters were
φii = 0.5, φij = 1.0 for i 6= j, σspeciation = 0.5, σduplication = 0.8, and αi = 1.0.
Leave-one-out cross-validation on the experimental annotations yields 93.9% accu-
racy (31 out of 33 proteins with one of the associated experimental annotations having
the maximum posterior probability). Of the two proteins with incorrect sifter pre-
dictions, one protein (Q9NC65 LUTLO) with adenosine deaminase activity located
near the growth factor activity clade is incorrectly predicted to have growth factor
activity [Charlab et al., 2000], and one protein (ADD STRVG) with adenosine deam-
inase activity is incorrectly predicted to have adenine activity. It is hypothesized
that adenosine deaminase activity confers growth factor activity through the destruc-
tion of adenosine, which induces apoptosis in some types of cells [Maier et al., 2001],
so the experimental annotations for the proteins with only growth factor activity
annotations may be incomplete.
58
Chapter 2. Sifter: Statistical Inference of Function Through Evolutionary Relationships
2.3.2.1 Comparison of annotation methods
We ran blast, GOtcha, and Orthostrapper on the set of experimentally characterized
AMP/adenosine deaminase proteins. The comparison on the experimental annota-
tions show that blast and GOtcha-exp (i.e., GOtcha transferring only experimen-
tal annotations) achieve 66.7% accuracy (22 of 33), GOtcha (using all annotations)
achieves 87.9% accuracy (29 of 33), and Orthostrapper-1 [Storm and Sonnhammer,
2002] (bootstrap cutoff of 1, meaning only one out of 1000 bootstrap trees must la-
bel two proteins as orthologs to put them in an orthologous cluster) achieves 78.8%
accuracy (26 of 33). For GOtcha-exp, we broke ties in favor of the correct function
14 times over the 33 proteins.
The ROC-type analysis in Figure 2.3 is a better method for comparison in this
multifunction family. Our measure of accuracy only takes into account the molecular
function prediction with the highest posterior probability, and does not account for
other highly ranked molecular functions. Instead, the ROC-type analysis evaluates
true positives as compared with the percentage of false positives across all cutoff val-
ues, where a positive prediction is one that has a posterior probability above the cutoff.
This explicitly accounts for all of a protein’s experimentally characterized functions
in a multifunction protein family when measuring performance. In the figure, sifter
outperforms all of the methods on this family at all error rates except for a small
section where Orthostrapper-1 has slightly better performance. Within the area of
high specificity, which is often the most relevant area for quantifying performance on
biological sequence analysis, sifter’s performance advantage is striking.
2.3.2.2 Parameter estimation
We ran GEM to estimate the parameters for the AMP/adenosine deaminase family,
including all of the available experimental annotations. Examination of the parame-
59
Chapter 2. Sifter: Statistical Inference of Function Through Evolutionary Relationships
0.0
0.2
0.4
0.6
0.8
1.0
0.01 0.1 1.0
GOtcha-exp
BLASTGOtcha
Orthostrapper
SIFTER
TP+FN
TP
FP+TN
FP
FP+TN
Figure 2.3: Functional annotation methods comparison on AMP/adenosinedeaminase family. A comparison of results for sifter and other annotations methodson the AMP/adenosine deaminase family of proteins. This ROC-type analysis shows therate of false positives versus true positives as the acceptance cutoff varies from admittingno annotations to admitting all annotations. Sifter performs well relative to the pairwiseannotation methods under this criterion. Note that the x-axis is on a log scale.
60
Chapter 2. Sifter: Statistical Inference of Function Through Evolutionary Relationships
ter estimates for this family gives no obvious insight into how the functions evolved,
and one should be wary of interpreting these estimated parameters in an evolutionary
light. In particular, the parameter governing the spontaneous appearance of growth
factor activity is estimated to be over 4 times lower than the corresponding parame-
ter for the other three functions (0.288 versus 1.233 for adenine, 1.204 for AMP, and
1.275 for adenosine). It appears that the growth factors share a novel sequence motif,
where two of the four conserved residues are also found in the adenosine and adenine
deaminase proteins [Maier et al., 2005]. This does not differentiate the evolutionary
appearance of growth factor activity from substrate evolution in this family. It is
possible that the parameter estimates imply that growth factor activity should not
be modeled as arising spontaneously, but instead be modeled as evolving from a par-
ticular deaminase activity (in this family, adenosine). The scale factors σspeciation and
σduplication did not provide any evolutionary insight, as they both converged quickly
to the boundary 0.01. On one hand, this suggests that the central role of gene dupli-
cation in phylogenomics may be overemphasized relative to the evolutionary history
of actual function mutations; on the other hand, the large number of false positive
gene duplication events in the reconciled trees produced through automated pipelines
appears to mitigate or altogether eliminate their signal.
2.3.2.3 Comparison with previous sifter
We compared the version of sifter presented here(version 1.2) with the previous ver-
sion of sifter (version 1.1) [Engelhardt et al., 2006] on the AMP/adenosine deami-
nase protein family. We computed the accuracy for leave-one-out cross-validation on
the deaminase protein family (running EM for each iteration, with no truncation),
where sifter version 1.1 had 93.9% accuracy (31 of 33) and sifter version 1.2 had
93.9% accuracy (31 of 33), missing the same two proteins. The performance of the
two methods are almost identical and show no relevant differences in the ROC-type
61
Chapter 2. Sifter: Statistical Inference of Function Through Evolutionary Relationships
analysis (Figure 2.4).
0.0
0.2
0.4
0.6
0.8
1.0
0.01 0.1 1.0
SIFTER v 1.1SIFTER v 1.2
TP+FN
TP
FP+TN
FP
FP+TN
Figure 2.4: ROC-type comparison of sifter version 1.1 and sifter version 1.2on AMP/adenosine deaminase family. A comparison of sifter version 1.2 withsifter version 1.1 on the AMP/adenosine deaminase family of proteins. The ROC-typeanalysis shows the rate of false positives versus true positives as the acceptance cutoffvaries from admitting no annotations to admitting all annotations. The ROC-type curvefor sifter version 1.1, as described in [Engelhardt et al., 2006], is almost identical tothat of sifter version 1.2, as described here. Note that the x-axis is on a log scale.
In terms of computation speed, sifter version 1.1 averaged 296.2ms with 41.6ms
standard deviation for 10 iterations of exact computation on the deaminase family,
whereas sifter version 1.2 averaged 455.3ms with 55.3ms standard deviation for
identical 10 runs on the same computer. The maximization step for EM averaged
11.4ms for sifter version 1.1, and 13.8ms for sifter version 1.2. The comparative
results for this particular family show that the performance of the two models are of
similar magnitude.
62
Chapter 2. Sifter: Statistical Inference of Function Through Evolutionary Relationships
2.3.2.4 Power set truncation approximation results
We used the AMP/adenosine deaminase family to test the power set truncation ap-
proximation. We computed posterior probabilities based on the parameters previously
estimated with no truncation from the complete experimental data set, truncating
the number of possible functions associated with a single protein at 1, 2 and 3. Fig-
ure 2.5a shows the number of predictions at the leaf proteins that differed (regardless
of correctness) from the algorithm with no truncation (i.e., truncation level 4), for
each of the three possible levels of truncation. Figure 2.5b shows the mean difference
and variance in posterior probabilities for the leaf proteins at each level of truncation,
as compared to the posterior probabilities computed without truncation at the leaf
proteins. Figure 2.5c shows the average running time for all of the four possible levels
of truncation, with the number of rows and columns of the transition rate matrix
embedded in the bars. The impact on the posterior probabilities and corresponding
functional predictions for a fixed set of parameters at all but level 1 appears modest.
An alternative test of the truncation approximation is to run leave-one-out cross-
validation, estimating the parameters with the truncated algorithm at each iteration,
for each of the truncation levels. Truncation levels 4, 3 and 2 all achieved 93.9%
accuracy (31 of 33), whereas truncation level 1 achieved 90.9% accuracy (30 of 33),
missing the additional prediction for protein Q26642 SARPE (predicting adenosine
deaminase activity when it has only a growth factor activity experimental annotation).
The ROC-type analysis is illustrated in Figure 2.6. As with the results from the
previous analysis, the impact of the truncation on all but level 1 appears minimal.
Even at level 1 the results are comparable, and the quality of the results is superior
to traditional pairwise approaches such as blast.
63
Chapter 2. Sifter: Statistical Inference of Function Through Evolutionary Relationships
05
10
15
20
25
30
Nu
mb
er o
f Dif
fere
nce
s in
An
no
tati
on
(33
To
tal P
rote
ins)
3 2 1
Tim
e (m
s) t
o c
om
pu
te p
ost
erio
rs
Truncation Level3 2 14
(no truncation)
15
11
5
0.00
0.05
0.10
0.15
0.20
0.25
0.30
Post
erio
r Pr
ob
abili
ty D
iffer
ence
Truncation Level
3 2 1
0.35
Truncation Level
(a) (b) (c)
010
020
030
040
050
060
0
1615
11
5
Figure 2.5: Truncation approximation performance in the AMP/adenosinedeaminase family. Impact of truncation levels on the deaminase family. Recall thereare four candidate functions for the AMP/adenosine deaminase family. Panel (a) showsthe number of differences in molecular function predictions for every protein at the leavesof the phylogeny, truncating at each of the three possible levels for a maximum of 251possible differences. This does not evaluate whether the predictions on the entire familyof proteins were correct or not, only that the predictions matched. Panel (b) shows themean L1 (absolute value) difference between the approximate posterior probabilities andthe exact posterior probabilities, including the standard deviation of that difference. Thisfigure also is for proteins at the leaves of the phylogeny, and includes bars for each of thethree possible levels of truncation as compared to exact computation. Panel (c) showsthe average time to compute posterior probabilities for all levels of truncation (includingno truncation), averaged over 10 runs. The numbers inside the bars in figure (c) indicatethe number of rows and columns of the matrix Q.
64
Chapter 2. Sifter: Statistical Inference of Function Through Evolutionary Relationships
0.0
0.2
0.4
0.6
0.8
1.0
0.01 0.1 1.0
SIFTER - 1SIFTER - 3
SIFTER - 2
SIFTER - 4
TP+FN
TP
FP+TN
FP
FP+TN
Figure 2.6: Truncation approximation accuracy in the AMP/adenosinedeaminase family. Impact of truncation levels on cross-validation with expectationmaximization. This figure shows the results of the ROC-type analysis on sifter leave-one-out cross-validation runs on the AMP/adenosine deaminase family of proteins. In thefigure the curves are labeled SIFTER-TN where N is the level of truncation (4 is exactcomputation). Recall there are four candidate functions for the deaminase family. Levels4, 3, and 2 all achieved the same accuracy (93.9%, or 31 out of 33), and level 1 achieved90.9% accuracy (30 of 33) for leave-one-out cross-validation, where each run estimatesthe model parameter using EM. Note that the x-axis is on a log scale.
65
Chapter 2. Sifter: Statistical Inference of Function Through Evolutionary Relationships
2.3.3 Sulfotransferase family
We applied sifter version 1.2 to the sulfotransferase family of enzymes (PF00685)
from Pfam release 20.0. We used 539 proteins in this family, 48 of which have exper-
imentally characterized molecular functions recorded in the GOA database. There
are nine different candidate functions in sifter, eight of which are sulfotransferases
acting on the specific compound involved in the enzymatic reaction, and the last of
which is the non-specific label nucleotide binding. Generally, these enzymes are re-
sponsible for the transfer of sulfate groups to specific compounds. Researchers have
shown their critical role in mediation of intercellular communication in multicellular
organisms [Bowman and Bertozzi, 1999]. Human sulfotransferases are extensively
studied because of their role in metabolizing steroids, hormones, and environmental
toxins [Allai-Hassani et al., 2007], and because they are biologically linked to ag-
ing [Feyzi et al., 1998], Alzheimer’s disease [Bongioanni et al., 1996], and neuronal
development and maintenance [Gibbs et al., 2006], and in the past ten years have
been studied as therapeutic targets. Plasmodium falciparum, the causative agent of
malaria, makes use of its own sulfotransferase proteins as cell-surface receptors to en-
ter into the host, thus these proteins are a target for malaria prevention drugs [Chai
et al., 2002]. Similarly, sulfotransferases in Mycobacterium tuberculosis are thought
to be possible virulence factors [Mougous et al., 2004], and thus are a potential target
for tuberculosis drugs or vaccines.
The phylogeny for this family, showing the 48 proteins with experimental func-
tional annotations from the GOA database, appears in Figure 2.7. This figure gives
us some insight into molecular function evolution in the sulfotransferase family. In-
terestingly, all of the proteins in this family with experimental annotations from the
GOA database are from vertebrate species. In general, these proteins are annotated
as acting principally on a single class of compounds, thus, at a general level, they
66
Chapter 2. Sifter: Statistical Inference of Function Through Evolutionary Relationships
appear to be single function proteins. Moreover, it appears in the phylogeny that
each different molecular function most likely arose from a single mutation event, so
there is no indicated parallel functional evolution in this family. Thus, this family
tests sifter’s ability to annotate a functionally diverse family, as opposed to its per-
formance on a family with significant parallel functional evolution or multifunction
proteins.
We see in Figure 2.7 that 18 of the 48 family members have only sulfotransferase
annotations, which is not specific enough to be included in our studies. More pre-
cisely, all members of this family will be annotated with the general sulfotransferase
function if we consider the sifter annotations implicitly propagated to this parent
term via the “is a” edges in the ontology, so we focus instead on the sulfotransferase
terms associated with specific compounds. Two of the remaining 30 proteins have
a nucleotide binding molecular function annotation, and the remaining 28 have one
of eight specific sulfotransferase functional annotations. Five of these specific sulfo-
transferase functions appear only once in the tree. Generally, there are three major
functional clades in the pruned phylogeny in Figure 2.7: the aryl sulfotransferases at
the top of the figure, the heparin-glucosamine 3-O-sulfotransferases in the lower half,
and the N-acelylglocosamine 6-O-sulfotransferases at the bottom of the figure. The
five singleton candidate functions within these clades necessarily have incorrect anno-
tations in leave-one-out cross-validation in this particular setup of the experiments,
as no similar experimental observation is available for transfer within the tree and
the model parameters do not facilitate function mutations to unobserved molecular
functions in the leave-one-out-type analyses.
We chose not to estimate parameters because the number of parameters for this
family, based on its functional diversity, is larger than the number of available ob-
servations, making estimation unproductive. Instead, the parameter values were
fixed to φii = 0.5, φij = 1.0 for i 6= j, σspeciation = 0.03, σduplication = 0.05, and
67
Chapter 2. Sifter: Statistical Inference of Function Through Evolutionary Relationships
S T 2S 2_B R AR E
S T 1S 3_B R AR E
S T 1S 1_B R AR E
S T 1A3_HUMAN
S T 1A1_HUMAN
S T 1A2_HUMAN
S T 1A1_R AT
Q91W 19_MOUS E
S T 1A1_MOUS E
S T 1C 1_MOUS E
S T 1C 1_HUMAN
S T 1B 1_HUMAN
S T 1B 1_MOUS E
S T 1B 1_R AT
S T 1E 1_HUMAN
Q3T V 15_MOUS E
Q6NZD1_MOUS E
O35401_MOUS E
Q9R 2C 2_MOUS E
Q3UZZ6_MOUS E
Q8B T 67_MOUS E
Q49IK 6_B R AR ES T 4A1_MOUS E
Q8B QV 8_MOUS E
S T 2A1_HUMAN
S T 2B 1_MOUS E
S T 2B 1_HUMAN
OS T 1_HUMAN
OS T 5_HUMAN
OS T 2_HUMAN
OS T 2_R AT
OS T 6_MOUS E
Q3UIC 7_MOUS E
OS T 3A_HUMAN
OS T 3B _HUMAN
OS T 3B _MOUS E
Q3T A92_MOUS E
C HS T 7_HUMAN
Q3V 2H8_MOUS E
C HS T 2_MOUS E
C HS T 2_HUMAN
C HS T 1_HUMAN
C HS T 3_HUMAN
C HS T 3_R AT
C HS T 4_HUMAN
C HS T 5_HUMAN
C HS T 5_MOUS E
C HS T 6_HUMAN
GO:0003674 : molecular_function
GO:0003824 : catalytic activity
GO:0016740 : transferase activity
GO:0016782 : transferase activity, transferring sulfur-containing groups
Gene Ontology Function Terms for Sulfotransferases
Figure 2.7: Phylogeny of experimentally characterized sulfotransferase pro-teins. The phylogeny of the experimentally characterized proteins found in the sulfo-transferase family. We built this phylogeny by extracting the protein sequences for theexperimentally characterized proteins from Swiss-Prot/Trembl, aligning them using thesulfotransferase HMM profile with hmmalign [Eddy, 1998], and reconstructing a phy-logeny using PAUP* maximum parsimony [Swofford, 2001]. The 18 proteins with onlythe general sulfotransferase annotation (colored pink in the phylogeny) were not includedin the results because their annotations were not specific.
68
Chapter 2. Sifter: Statistical Inference of Function Through Evolutionary Relationships
αi = 1.0. Leave-one-out cross-validation, using exact computation of posterior prob-
abilities (but not estimating parameters), yields 70.0% accuracy (21 of 30) when
considering the 30 proteins with experimental annotations more specific than sulfo-
transerases and those with nucleotide binding experimental annotations. The swiss-
prot identification numbers for the incorrectly annotated proteins from exact com-
putation are ST1E1 HUMAN, ST2B1 HUMAN, CHST1 HUMAN, CHST3 HUMAN,
CHST3 RAT, ST1A3 HUMAN, Q91W19 MOUSE, ST1A1 MOUSE, and
Q8BT67 MOUSE, which include the five proteins with unique annotations (the first
five on this list) as anticipated.
2.3.3.1 Power set truncation approximation results
We ran exact (non-truncated) leave-one-out cross-validation with a fixed set of pa-
rameters on the sulfotransferase family, and compared the performance with each of
the eight possible approximations, one at each level of truncation. Figure 2.8 shows
the non-truncated computation (labeled SIFTER-T9) versus three different levels of
truncation: 6, 2 and 1. The ROC-type curves for the omitted levels of truncation
were too similar to those of level 6 and non-truncated computation to be included.
The figure makes clear that the impact of the truncation is minimal at all but level
1, and even then the impact is small.
Alternatively, we can compare the accuracy of the leave-one-out cross-validation,
where non-truncated computation achieves 70.0% (21 of 30) accuracy. Levels 8
through 3 achieve the same level of accuracy as the non-truncated algorithm, missing
the same set of proteins, whereas levels 2 and 1 achieve 66.7% accuracy (20 of 30). At
level 1, sifter makes an incorrect prediction for the protein OST5 HUMAN, whereas
level 2, sifter predicts Q8BT67 MOUSE correctly, but makes incorrect predictions
for ST1B1 MOUSE and ST1C1 MOUSE.
Additionally, we measured the time associated with these computations. Fig-
69
Chapter 2. Sifter: Statistical Inference of Function Through Evolutionary Relationships
0.0
0.2
0.4
0.6
0.8
1.0
0.01 0.1 1.0
SIFTER-1
FP+TN
FP
FP+TN
TP
TP+FN
SIFTER-2
SIFTER-9SIFTER-6
Figure 2.8: Sifter truncation approximation comparisons for the sulfotrans-ferase family. A comparison of different levels of truncation in the sifter truncationapproximation for the sulfotransferase family of proteins. This ROC-type analysis showsthe rate of false positives versus true positives as the acceptance cutoff varies from admit-ting no annotations to admitting all annotations. Sifter’s performance does not appearto degrade meaningfully from exact computation until truncation reaches level 1, and eventhen performance is still reasonable. Note that the x-axis is on a log scale.
70
Chapter 2. Sifter: Statistical Inference of Function Through Evolutionary Relationships
0 100 200 300 400 500
02
00
40
06
00
80
01
00
0
Number of Rows/Columns in Q matrix
12
00
Co
mp
uta
tio
nal
Tim
e (
seco
nd
s)
14
00
600
(10, 0.19) (46, 2.33)(130, 28.60)
(256, 178.59)
(382, 538.72)
(466, 985.76)
(502, 1198.46)
(509, 1294.01)(510, 1275.83)
1
8 9
7
6
5
4
32
Figure 2.9: Sifter truncation approximation performance for the sulfotrans-ferase family. Computation time for sifter versus the size of the transition rate matrix.This graph illustrates how the time to compute posterior probabilities scales relative tothe size of the transition rate matrix Q. There is a 50–500 times speedup in going fromthe complete matrix Q to a matrix truncated at T = 3 or T = 2 (where T indicatesthe level of truncation), with no meaningful loss in accuracy (see previous figure). Thetruncation level and (x, y) coordinates are included at each point for clarity.
ure 2.9 shows the tradeoff between the size of the transition rate matrix Q and the
time of computation. Each of the time points is the mean of the time for each of the
48 cross-validation runs at each level of truncation (including exact computation).
The truncation approximations improve the run time by a large margin – 500-fold in
the case of of truncation level 2 – with minimal degradation in results.
2.3.3.2 Comparison with blast
Blast achieves 50.0% accuracy (15 of 30) when run on the same subset of proteins in
this family, run as described for the AMP/adenosine deaminase family. A ROC-type
71
Chapter 2. Sifter: Statistical Inference of Function Through Evolutionary Relationships
0.01 0.1 1.0
0.0
0.2
0.4
0.6
0.8
1.0
BLAST
SIFTER
FP+TN
FP
FP+TN
TP
TP+FN
Figure 2.10: Sifter-blast sulfotransferase comparison. A comparison of blastand sifter for the sulfotransferase family of proteins. This ROC-type analysis shows therate of false positives versus true positives as the acceptance cutoff varies from admittingno annotations to admitting all annotations. sifter consistently dominates blast-typeannotations under this criterion. Note that the x-axis is on a log scale.
analysis comparing the blast performance versus exact computation in sifter per-
formance is shown in Figure 2.10, where sifter performs much better than blast at
all levels of false positives. Blast made correct predictions for six proteins that were
missed by sifter, including ST1A3 HUMAN, ST1E1 HUMAN, Q8BT67 MOUSE,
ST2B1 HUMAN, CHST1 HUMAN, and CHST3 HUMAN, four of which are proteins
with unique function annotations. This opens the door to the possibility of using
blast output when the blast-predicted function is not in sifter’s set of candidate
molecular functions.
2.3.3.3 Non-experimental annotations
As discussed above, five proteins could not possible be correctly predicted by sifter
in the leave-one-out cross-validation, because they are the only protein with their par-
72
Chapter 2. Sifter: Statistical Inference of Function Through Evolutionary Relationships
ticular experimental annotation. We investigated whether including non-experimental
annotations might enable these to be predicted correctly in these experiments. In-
cluding non-experimental annotations as observations does not improve the results
dramatically. We ran leave-one-out cross-validation on the set of proteins with ex-
perimental annotations and electronic (i.e., IEA, with a probability of correctness set
to 0.2) annotations at truncation level 2, yielding 73.3% accuracy (22 of 30). This
experiment predicted proteins ST1A3 HUMAN and ST2B1 HUMAN correctly, and
CHST7 HUMAN incorrectly, as compared to the non-truncated experiments using
only experimental evidence. Although ideally including electronic annotations would
mitigate the problems associated with unique experimental annotations by including
some of the same electronic annotations, for this diverse protein family we did not
find this to be the case for all but one of the proteins with unique experimental an-
notations (ST2B1 HUMAN). This may be because, in certain families such as this
one, GO experimental evidence is often for a more specific term in the GO hierarchy
than the non-experimental evidence, thus there are still few or no examples of the
appropriately specific term.
2.3.4 Nudix family
The family of enzymes termed Nudix hydrolases (PF00293) includes members found
in all kingdoms: eukaryotes, bacteria, archaea, and viruses [McLennan, 2006; Koonin,
1993]. Characterized by the highly conserved 23 amino acid motif
GX5EX7REUXEEGU (where U is a hydrophobic residue and X is any amino
acid), Nudix hydrolases are so named because of their initially discovered activity
on nucleoside diphosphates linked to some other moiety named X; a number of non-
nucleoside substrates have since been identified [Koonin, 1993; Bessman et al., 1996].
Activity has been reported on coenzymes (such as CoA, FAD, and NADH), nucleotide
73
Chapter 2. Sifter: Statistical Inference of Function Through Evolutionary Relationships
sugars, dinucleoside and diphosphoinositol polyphosphates, capped RNA, and canon-
ical and oxidized (deoxy)ribonucleoside di- and triphosphates. These functions sug-
gest roles in nucleotide pool sanitation, the removal of toxic metabolic intermediates,
mRNA stability, and signaling [McLennan, 2006; Galperin et al., 2006]. While the
Nudix motif forms a loop-α helix-loop structure that provides a general scaffold for
coordinating cation binding and catalysis, residues that lie outside of the motif govern
substrate specificity [Koonin, 1993; Mildvan et al., 2005].
2.3.4.1 Family discussion
The Nudix family contains 3703 member proteins in Pfam release 20.0. We used
the alignment for this family from Pfam (which aligned the Nudix motif), and re-
constructed the phylogeny from the neighbor joining algorithm in PAUP* [Swofford,
2001] because of the large size of the family.
The Nudix family poses a particular problem because sequence diversity degrades
the alignment quality of these homologous proteins. The low-quality alignment in
turn degrades the quality of the tree reconstruction. A bootstrap analysis of the
alignment used to build the maximum parsimony phylogeny in Figure 2.11 for the
experimentally characterized proteins had an average bootstrap support of 38%, and
all of the clades with more than 95% bootstrap support are noted by purple circles
in the figure (there are only five such clades containing at most five proteins). This
overall lack of support indicates how little information is contained in the alignment
that is useful in reconstructing the sequence phylogeny. Attempts have been made
to perform structural alignments and use this as a scaffold, but these too suffer from
the family’s diversity [Ranatunga et al., 2004]. The impact on sifter is noise in the
tree reconstruction with some consistent errors in annotation. Furthermore, the tree
shows numerous examples of possible parallel functional evolution, and many of these
proteins have multiple functions. Nonetheless, even with an inaccurate tree, sifter’s
74
Chapter 2. Sifter: Statistical Inference of Function Through Evolutionary Relationships
phylogenomic approach performs well in comparison to a pairwise method (blast)
as shown below.
Our own manual literature search revealed 97 proteins with experimentally charac-
terized function (some the same as the GOA experimental annotations), meaning that
2.6% of the proteins in this family have experimental annotations. The phylogeny of
the subset of Nudix proteins with experimental evidence of molecular function is illus-
trated in Figure 2.11. There are 37 proteins in this family with experimentally-derived
annotations in the GOA database, but comparing those annotations against our own
literature search yielded a number of apparent mistakes in the GOA database, so we
used only the annotations from our literature search. We also found the set of GO
terms for this family incomplete, so we augmented the ontology with 98 additional
molecular function terms. Furthermore, we found some errors and inconsistencies in
the hierarchical structure, so we rearranged the hierarchy slightly for biochemical ac-
curacy (reorganized or renamed terms denoted with an asterisk in the figure). Each of
the added terms are found in the literature experimentally characterizing a member of
the Nudix family, and are descendant from the hydrolase activity term. The complete
reconstructed GO subgraph of functional terms is shown in Figure 2.12. We restricted
our search and GO augmentation to experimentally characterized hydrolases. Details
of this analysis will be provided elsewhere.
In Figure 2.11, the sequences were aligned using hmmalign [Eddy, 1998] with
the Nudix HMM profile from Pfam release 20.0. The phylogeny was built using
PAUP* maximum parsimony [Swofford, 2001]. This phylogeny is used for illustrative
purposes only, and was not actually used in sifter (instead, the full neighbor joining
phylogeny including all 3703 proteins was used in sifter). Function annotations
were assigned to each protein from the literature by contrasting different levels of
experimental evidence for a given hydrolase to prune the less specific substrates from
a larger list of assayed compounds.
75
Chapter 2. Sifter: Statistical Inference of Function Through Evolutionary Relationships
NU DT 6_AR AT HNU DT 7_AR AT H
NU DT 2_AR AT HNU D1 0_ AR AT H
NU DE _E C O LIQ8 16 E 1 _B A C C R
AP 4A _HUM ANAP 4A _C AEE L
P 9 5110_M Y CT UQ7 5U V 1 _T HE T HO0 54 37 _M Y CT U
Figure 2.11: Phylogeny of experimentally characterized Nudix proteins. Thephylogeny of the experimentally characterized hydrolase proteins found in the Nudix family.We built the phylogeny by extracting the protein sequences for experimentally character-ized proteins from Swiss-Prot/trembl, aligning them to the Nudix HMM profile usinghmmalign [Eddy, 1998], and reconstructing a phylogeny using PAUP* maximum parsi-mony [Swofford, 2001]. The colored numbers in brackets after the protein name representthe functional terms associated with each protein, from Figure 2.12, determined from ourown literature search. The purple dots represent clades that have greater than 95% boot-strap support, for a bootstrap analysis of a neighbor joining tree using the same alignmentin Phylip [Felsenstein, 1989] with 100 replicates.
76
Chapter 2. Sifter: Statistical Inference of Function Through Evolutionary Relationships
Figure 2.12: Functional terms for the Nudix hydrolases. Functional hydrolaseterms that have been positively experimentally characterized in proteins from the Nudixfamily. This image captures the GO directed acyclic graph representing terms that aredescendants of hydrolase activity in the molecular function ontology (noting that thisparticular subgraph is a strict tree, meaning that these nodes have only single parents).The terms with GO numbers greater than 1, 000, 000 are ones that we have added tocomplete the spectrum of molecular functions that are experimentally found among theNudix hydrolases. The terms with GO numbers less than 1, 000, 000 are existing GOterms. Terms with an asterisk are existing GO terms for which we have either modifiedthe name to reflect the chemical function more appropriately or reclassified within thehierarchy. The DAG can be read off from this image (here, a tree) by taking eachterm with more indentation than the previous term to be an ancestor of that term. Thesecond column starts as an immediate ancestor of the pyrophosphatase activity term. Thecoloring is used as a tool to cluster the terms visually into groups with related substratesand corresponding related chemical activity.
77
Chapter 2. Sifter: Statistical Inference of Function Through Evolutionary Relationships
The 66 candidate functions and large family size (compared to the other families
studied here) produced a rich phylogeny with intriguing possibilities for further in-
vestigation. One observation is that many proteins with identical or similar functions
cluster tightly in certain areas in the tree, in particular nucleotide-sugar diphos-
coenzyme A diphosphatase (gray terms), and diadenosine polyphosphate hydrolase
activities (forest green terms). NAD diphosphatase activities are interestingly split
into two clades, one of which is composed of proteins that are predominantly specific
only for NAD-related compounds, while the other is made up of hydrolases that are
also active on ADP-ribose and other dinucleoside polyphosphates. A grouping of
mostly ADP-ribose diphosphatases in the middle of the tree is unique in that it clus-
ters tightly, it is distant from other nucleotide sugar diphosphatases, and, moreover,
within this clade the eukaryotic and bacterial/viral hydrolases are in two distinct
groupings. In addition, most non-ADP-ribose diphosphatases cluster distantly from
ADP-ribose diphosphatases.
A few particular proteins are worth noting. DIPP ASFB7 is the only diphos-
phoinositol polyphosphate diphosphatase that does not cluster with other proteins
of the same function, but instead is closely aligned with another viral hydrolase
demonstrating quite different functions (Y06L BPT4). Another protein of note is
Q9RVP7 DEIRA, a nucleoside diphosphate diphosphatase that is closely related to
three nucleoside triphosphate diphosphatases, perhaps pointing to a similar catalytic
mechanism for these four proteins.
There are 66 candidate functions for this family, so choosing a candidate func-
tion at random would yield on average about 1.5% accuracy for the single function
proteins. Because there is a prohibitively large number of candidate functions for
sifter with no truncation, we computed posterior probabilities approximately with
truncation at one, yielding 67 possible functions (including none). Truncating at two,
78
Chapter 2. Sifter: Statistical Inference of Function Through Evolutionary Relationships
as a comparison, yields 4356 possible functions or function pairs, and takes on the
order of a week of time to compute posterior probabilities.
2.3.4.2 Results of cross-validation with sifter
We ran leave-one-out cross-validation on this family and computed the accuracy of
sifter on the held-out protein with experimental evidence using a fixed set of pa-
rameters. Because of the size of the tree and the number of candidate terms, we did
not attempt to estimate the large number of parameters for this family; instead, the
parameters were set to the following: σduplication = 0.05, σspeciation = 0.03, α = 1.0 and
φij = 1.0 for i 6= j and φii = 0.5. Although these parameter settings are arbitrary
and use little biological information other than crude intuition, they satisfy all of the
parameter constraints mentioned in the Methods section. We set the truncation level
to T = 1 for all of the Nudix experiments. Sifter achieves 47.4% accuracy (46 out
of 97 proteins annotated correctly) in this experiment.
With truncation at one, the 66 candidate functions have a matrix of size 67 by 67.
The average time for computing posteriors on these machines was 146.78 seconds with
a standard deviation of 0.62 second, as averaged over the 97 computations involved
in the leave-one-out cross-validation.
2.3.4.3 Functional diversity in the Nudix family
The large functional diversity in this protein family is the main reason for difficulty in
inferring molecular function. In this family, our data include five proteins (Q4U4W6,
Q53738, Q81EE8, P32056, and O35013) with single, unique functions (i.e., they are
the only protein in the tree to have that experimental annotation). In the case of
protein O35013, it is labeled with four functions that are all unique to this family.
From the perspective of the functional terms, as shown in Figure 2.13, most of them
79
Chapter 2. Sifter: Statistical Inference of Function Through Evolutionary Relationships
Number of occurrences of function term
Fre
qu
en
cy (
ou
t o
f 6
6)
1 10 26
01
02
03
04
05
0
5
Figure 2.13: Functional diversity in Nudix family. Diversity of molecular functionsin the Nudix family. This histogram illustrates the number of occurrences of each of the 66different candidate functional terms in the 97 experimentally characterized proteins. Manyof them occur only once; ADP-ribose diphosphatase occurs 26 times. This histogramrepresents the available characterizations and should not be used to interpret the relativecounts of the functions in the entire family, as these counts may be skewed significantlyby protein choice, assay difficulty, etc.
occur experimentally in this family once or twice, with the single extreme example
of ADP-ribose diphosphatase activity occurring experimentally in 26 proteins in the
family. The small number of proteins with common functional activity indicates
that methods that predict molecular function via annotation transfer will encounter
difficulty.
2.3.4.4 Generalizing functions
We wanted to examine the tradeoff between predicting molecular function at a more
general level of the GO hierarchy and sensitivity. Within a family, we can selectively
generalize some of the functional terms to improve our sensitivity when, for exam-
ple, there exist characterization assays that provide a general screen for particular
types of hydrolases. Although developing a method to automatically determine the
80
Chapter 2. Sifter: Statistical Inference of Function Through Evolutionary Relationships
appropriate level of generalization is beyond the scope of this thesis, we manually gen-
eralized these functions to examine the impact on sifter’s performance. Specifically,
we generalized all of the terms in Figure 2.12 that are not colored blue, representing
each set of non-blue terms by a single term. Viewed the blue terms as being already
generalized, as they do not group according to biochemistry in a natural way and
also occur closer to the root of the hierarchy relative to the set of terms we chose to
generalize. After generalization there were 15 candidate molecular functions, 10 of
which are generalized terms and the rest of which are original (blue) functional terms.
We ran leave-one-out cross-validation at truncation level 1, achieving 78.4% ac-
curacy (76 of 97). Because the generalization reduced the diversity of this family
extensively, we also ran leave-one-out cross-validation at truncation level 2, and it
also achieved 78.4% accuracy (76 of 97). The ROC-type analysis for this experiment
is shown in Figure 2.14, where sifter predicts 69.2% annotations correctly at 99%
specificity. These experiments tell us that, when a biologist does not require a pre-
diction to be as specific as the set of candidate functions, they may choose to trade
term specificity for higher prediction accuracy.
2.3.4.5 Comparison with blast
We ran the Nudix sequences with experimental evidence through blast [Altschul
et al., 1990] on the non-redundant (nr) database with E-value cutoff 0.01. As in
the two families discussed earlier, the blast output files were filtered through a
keyword extraction script to convert the functional annotations from nr into GO
terms (including our augmentations specific to the Nudix hydrolases), removing hits
that were identical in species and sequence to the query sequence. This is the analog
of a leave-one-out cross-validation experiment performed in sifter. Blast uses
all the proteins in the nr database with textual annotations describing any of the
candidate functions, as opposed to sifter, which uses Pfam Nudix family member
81
Chapter 2. Sifter: Statistical Inference of Function Through Evolutionary Relationships
0.001 0.01 0.1 1.0
0.2
0.4
0.6
0.8
1.0
TP
TP+FN
FP
FP+TN
0.0
SIFTER
BLAST
Figure 2.14: Sifter-blast Nudix comparison. A comparison of blast and sifterfor the Nudix family of proteins. The sifter-C line is the evaluation of sifter on theNudix family using the 15 generalized Nudix hydrolase terms as experimental annotations.This ROC-type analysis shows the rate of false positives versus true positives as theacceptance cutoff varies from admitting no annotations to admitting all annotations.sifter consistently dominates blast-type annotations under this criterion. Note thatthe x-axis is on a log scale.
82
Chapter 2. Sifter: Statistical Inference of Function Through Evolutionary Relationships
proteins with experimentally verified annotations found in the GOA database. We
included all functional terms associated with the set of annotated proteins that share
the most significant E-value, and consider a protein’s blast annotation correct if one
of the functions is in the set of experimental annotations for that particular protein.
Blast correctly annotated 33 of the 97 proteins at the level of the experimental
characterizations, achieving 34.0% accuracy.
A more thorough comparison can be made between sifter and blast for the
Nudix family using a ROC-type analysis, as in Figure 2.14. In the figure, which
uses the results from sifter leave-one-out cross-validation and the blast output
described above, we see that sifter outperforms blast at all levels of false positives.
The sifter curve shows that, although functional diversity inhibits performance
within this family, sifter still performs well, especially at low levels of false positives.
While overall accuracy appears fairly high for blast, the ROC-type analysis shows
a general weakness of the blast results. Specifically, blast only identifies 23.3% of
correct terms in the entire set of protein hits with E-value less than 0.01. In other
words, including all predicted terms at any E-value (not just the most significant),
only 23.3% of the Nudix terms show up at all in this set of blast predicted terms.
This percentage is lower than the total number of correctly annotated proteins be-
cause 48 of the proteins have multiple functional terms that have been experimentally
characterized. Although 34.0% of proteins had at least one of these terms correctly
predicted, only 23.3% of the total set of terms was associated with the appropriate
proteins, even at E-value cutoff of 0.01. At 99% specificity, approximately 2.4% of
annotations are correct in blast, whereas for sifter, at 99% specificity, 24.4% of
the annotations are correct.
83
Chapter 2. Sifter: Statistical Inference of Function Through Evolutionary Relationships
2.3.4.6 Evaluating the value of observations
To evaluate sifter’s sensitivity to data sampling, we left out multiple characterized
proteins’ annotations at each round of cross-validation. Specifically, we ran 2-, 3-,
5-, 10− and 20-fold cross-validation on this data set. In this type of cross-validation
experiment, the data are randomly split into K disjoint sets (or folds), and the exper-
iment is performed K times, leaving out one of the K subsets on each iteration during
the posterior probability computation, and testing the accuracy of predictions on the
held-out set. For 2-fold cross-validation, in which one half of the experimental anno-
tations are removed at random for each run, sifter achieves 36.2% accuracy (35.1 of
97), as averaged over ten runs. For 20-fold cross-validation, in which approximately 5
of the experimental annotations are removed at random for each run, sifter achieves
46.1% accuracy (44.7 out of 97), as averaged over ten runs. As expected, as more
evidence becomes available to sifter, the annotations improve up to a certain point,
as shown in Figure 2.15. At 20-fold cross-validation, the accuracy is slightly less than
leave-one-out cross-validation, quantifying the value of four additional observations
out of the 97 total.
2.4 Basic sifter conclusions
We built the sifter methodology to work on large and functionally diverse protein
families through a simple graphical model. We use a continuous time Markov chain
and reduce the exponential time complexity through a straightforward but effective
truncation of possible function combinations within each protein. Sifter version
1.2 accuracy is comparable to sifter version 1.1, as shown on the AMP/adenosine
deaminase protein family. The truncation approximation has excellent performance
up to and including the final level of truncation on the AMP/adenosine deaminase
84
Chapter 2. Sifter: Statistical Inference of Function Through Evolutionary Relationships
01
02
03
04
0
2 3 5 10 20
Number of cross-validation folds
Nu
mb
er
of
Pro
tein
s C
orr
ec
t (o
ut
of
97
)
50
Figure 2.15: Value of observations in sifter. Number of correct annotations forsifter on the Nudix family of proteins across different numbers of folds. The x-axis ofthis figure represents five different partitions for cross-validation, from 2-fold to 20-foldcross-validation. The y-axis represents the average number of proteins for which siftercorrectly predicted the function for each of the different cross-validation tests. The barsshown are the standard deviation for each partition. The dotted line at y = 46 representsthe performance of leave-one-out cross-validation. All of the different partitions were runten times.
85
Chapter 2. Sifter: Statistical Inference of Function Through Evolutionary Relationships
family and the sulfotransferases. The sulfotransferases provide a good example of
sifter’s performance on a functionally diverse family of proteins that do not have
any confounding evolutionary traits such as multifunction proteins or obvious parallel
evolution. The new gold-standard data set for the Nudix family of proteins was built
from a manual literature search. Sifter performed well as compared to blast on
the Nudix family, which is an exceptionally difficult family for function prediction
methods.
86
Chapter 3
Choosing which Protein to
Characterize
3.1 Introduction
The momentum behind automated methods for protein function annotation is pri-
marily motivated by the costly, open-ended problem of experimentally characterizing
protein molecular function. While DNA sequencing has become inexpensive and ac-
curate, and finding protein structures is a well-defined (although costly) problem,
experimentally characterizing protein molecular function requires some idea of the
molecular function of a particular protein in order to select the appropriate assay, and
even then the number of possible protein molecular functions is enormous. Proteins
will sometimes perform multiple functions in vivo; examples include multidomain
proteins such as heat shock protein 90 (HSP90) [Scheibel et al., 1998], moonlighting
proteins as in the aldolase proteins [Sriram et al., 2005], or enzymes active on mul-
tiple substrates, such as many proteins in the Nudix family [Bessman et al., 1996].
Thus identifying one type of molecular function does not rule out the possibility that
87
Chapter 3. Choosing which Protein to Characterize
the protein has other functions with greater relative activity and that the identi-
fied function is not biologically relevant. It is possible that what we do not know
about a protein family could be more important than what we do know; a recent pa-
per suggested that single-gene disorders with Mendelian inheritance, including some
metabolic disorders, may be due to mutations in moonlighting proteins for which we
do not know the additional molecular functions of the responsible protein, and thus
that protein would not be considered in the set of candidate genes [Sriram et al.,
2005]. We already use automated methods to perform molecular function annotation
for biochemists on a large scale; how can automated methods help biochemists se-
lect which protein to characterize and which of the costly functional characterization
experiments to perform (or not to perform)?
Experimental design (and the subfield of active learning) is a class of methods
designed to answer this question. Designing a biological experiment requires defining
all of the experimental variables, then selecting values for each of those variables. The
experimental variables may include, for example, which proteins to characterize, the
concentration of a particular substrate in a functional characterization experiment,
or the duration of the measurements. Here we are concerned with selecting the
minimal number of experiments that characterize a single protein with a specific
molecular function activity such that the confidence of the functional predictions for
the remaining unannotated proteins is maximized.
3.1.1 Active learning
Active learning is a subfield of experimental design in which an active learner interacts
with the world to collect additional information in order to improve a supervised
classification method. The framework of an active learning problem is as follows. An
active learner is able to query the world and receive a response before outputting
88
Chapter 3. Choosing which Protein to Characterize
its predictions. The active learner is responsible for selecting the query. The learner
cannot impact the response to the query. There are two general methods for selecting
the query: choosing to query the data with the most uncertain classification given
the current model and parameters, and choosing to query the data that appear to be
most informative with respect to a gain function.
Historically, many different algorithms and intuitions have been developed to de-
cide how the query should be chosen. Query by Committee [Seung et al., 1992;
Freund et al., 1997] puts a prior distribution over the classification hypotheses, and
samples a set of classifiers from that distribution. Then the learner chooses to query
one of the data points on which the classifiers maximally disagree. Uncertainty sam-
pling [Lewis and Catlett, 1994] queries the data point that the current classifier is
most uncertain about. This method is relatively easy to implement in many of the
common classifiers, such as support vector machines where the point with the most
uncertainty is the point closest to the margin.
Choosing an optimal query in the information-theoretic sense was formalized in
the early 1990’s [MacKay, 1992]. Three different query selection criteria were devel-
oped in this paper based on information theory for the purpose of maximizing the
expected informativeness of the query responses. MacKay also noted a general draw-
back of active learning (and model-based methods more generally): the hypothesis
space must be correct, or at least approximately correct, in order for these meth-
ods to effectively measure the value of the information. The first criterion that he
presents selects the query where the classification has the highest variance given a
set of observations. The second criterion selects a query in an area of interest that
indirectly minimizes the mean marginal entropy of that particular class. The third
criterion chooses queries such that the Gaussian distributions representing two dif-
ferent classes will tend to have maximally separated means and maximally different
variances. The change in entropy of the parameters is used to validate each of these
89
Chapter 3. Choosing which Protein to Characterize
approaches. None of these criteria directly address the goal of our active learner,
which is that each query should, on average, maximally reduce the uncertainty about
the functional predictions of the unobserved random variables.
Sequential design, which is a possible implementation of the active learning meth-
ods above, assumes that the model parameters are not known exactly and that mul-
tiple queries are possible [Pronzato, 2000]. The active learner makes a single query
at a time, where each query is chosen based on the current data set and the current
parameters, under the assumption that this may be the final query. In a single iter-
ation, a data point is selected to query, the single query is performed, and the model
parameters are updated based on the query response. This is repeated until no more
queries are allowed.
We will use sequential experimental design methods to determine which molecular
function assay to perform on which protein among a set of homologous proteins to
maximize the value of that experimental outcome. The value of a particular assay
is measured using mutual information, or the reduction in uncertainty for all of the
remaining proteins’ functions given the possible outcomes for the subsequent experi-
ment. We attempt to find, at each iteration of active learning, the single experiment
that maximizes the mutual information for a protein family, so as to be maximally
confident in the sifter predictions for the unannotated proteins in the protein family
using a minimal number of experimental assays.
3.2 Mutual information
The amount of information associated with a particular protein functional character-
ization given a set of observations can be described as the reduction in uncertainty
about the remaining, unobserved random variables. Mutual information quantifies
the dependence of two random variables X and Y , or how much knowing the value
90
Chapter 3. Choosing which Protein to Characterize
of one variable reduces our uncertainty about the value of the other variable:
I(X; Y ) =∑y∈Y
∑x∈X
p(x, y) log2
p(x, y)
p(x)p(y).
From this equation, when X and Y are independent then p(x, y) = p(x)p(y), and
the value is zero. However, when they are the same event, and knowing X eliminates
uncertainty about Y , then p(x, y) = p(x) = p(y) and the mutual information function
reaches its maximum value at the entropy of X (or, equivalently, Y ).
Given the sifter model of how molecular function evolves in a protein phylogeny,
we can select the assay that maximizes the mutual information within the tree. In
particular, if we let X be the available experimental evidence, Y be a molecular
function for a specific protein we might assay, and Φ be the model parameters, we
must compute p(X|Φ), p(Y |Φ) (the prior probability of Y ), and p(X, Y |Φ). If we note
that p(X, Y |Φ) = p(Y |X, Φ)p(X|Φ) using the chain rule, the two equations on the
right hand side are just the posterior probability of Y and the probability of X, which
we can compute explicitly using our model. Thus, the computation of the mutual
information is trivial: given the posterior and the prior probabilities of all of the leaf
variables and the probability of the given set of protein functional observations, we
can explicitly compute the mutual information for each possible experiment.
3.3 Evaluation techniques
Because of the prohibitively large cost of performing the actual molecular function
characterizations, and the expertise involved in designing the assays and perform-
ing the experiments, we evaluated these methods using computational techniques.
For each protein family used in validation, we initialized the data set to include one
experimental observation (either IDA, IMP, or TAS ) for each candidate function as-
91
Chapter 3. Choosing which Protein to Characterize
sociated with that family. These observations were chosen at random from the set
of possible experimental annotations. We computed posterior probabilities, condi-
tioning on these M observations, and then ranked all of the possible experiments
as observations based on an experimental design criterion. The highest ranking ex-
periment with an actual experimental characterization was selected for inclusion in
the set of observations, ensuring that a single characterization was not selected more
than once (although a protein with more than one experimental observation would
eventually have all of the experiments selected). At each iteration of the sequential
experiment, we recorded the posterior probabilities of the proteins with unobserved
experimental annotations. The experimental design criterion in our validation was
mutual information criterion described above.
We also ran the same procedure where, at each iteration, we included an obser-
vation at random. In our experiments on a set of protein families, we compare the
mutual information criterion against random inclusion, to determine which criterion
reduces uncertainty maximally, while relying on the fewest experiments. We run each
of these active learners 100 times for each family with random seed observations, to
quantitatively compare the two active learning criteria.
3.4 Results on the AMP/adenosine deaminase family
Because of our previous work with this family and the relatively large set of experi-
mental functional annotations available in our gold-standard data set [Engelhardt et
al., 2006], this family provides a baseline for the comparison of the mutual information
criterion and random inclusion.
Figure 3.1 shows one feature for comparing the two types of active learners. In
particular, at each cycle of the sequential active learner, as a single new observation
is added to the set of observations for sifter, we computed the average posterior
92
Chapter 3. Choosing which Protein to Characterize
0 5 10 15 20 25 30
0.02.0
4.06.0
8 .00.1
2.1
Iteration of Query SelectionAve
rage
Pos
terio
r Pro
babi
lity
of C
orre
ct A
nnot
atio
ns
Figure 3.1: The average posterior probability of the correct functional annotations thathave not been added as an observation in sifter’s computation of the posterior prob-ability on the AMP/adenosine deaminase gold-standard data set. This plot shows theaverage posterior probability of the correct, held-out functional annotations for the activelearner selecting observations to add at random (solid lines) and for the active learnerselecting observations to add using mutual information criterion (dotted lines), includingthe error bars for each representing the standard deviation.
probability of the held-out correct experimental functional annotations. The scenario
depicted in the figure illustrates the power of the active learner using the mutual
information criterion. It shows that, after including four additional functional char-
acterizations, the average posterior probability of the held-out functional annotations
is 0.860, whereas, including functional annotations at random, it takes 28 functional
characterizations to reach an average posterior probability of 0.857 and 29 charac-
terizations to reach an average of 0.866. In other words, with just four additional
experiments selected using the mutual information criterion, we are equally certain
about the remaining functional predictions in the tree as if we had randomly func-
tionally characterized 28 additional proteins. This succinctly illustrates the power of
active learning to select proteins to characterize.
93
Chapter 3. Choosing which Protein to Characterize
3.5 Results on the sulfotransferase family
The sulfotransferase family is functionally diverse, and this particular family con-
strains the active learner significantly. Specifically, since there are nine candidate
functions in all across this family, and five of those nine functions occur experimen-
tally in only one protein in the family, those five proteins will always be among the
set that are included a priori to the active learner as described in the experiment
setup. Thus, the set of proteins for characterization is much smaller relative to the
number of characterized proteins in the sulfotransferases than in the other families
described here.
The results on this family are shown in Figure 3.2, which compares the posterior
probabilities of the correct, held-out annotations after each iteration of the sequential
active learner for the mutual information criterion versus random inclusion. Unlike
the AMP/adenosine deaminase family, these results do not suggest that the active
learner has chosen appropriate experiments for this family. The active learner us-
ing mutual information criterion is at most 0.05 greater than the average posterior
probability using random inclusion, and the largest difference in the averages is 0.21
(at the second to last iteration), where using random inclusion generates the higher
of the two average posterior probabilities. The standard deviations are comparable
throughout the experiment. The active learner using mutual information criterion
initially performs worse than random inclusion, and towards the final iterations again
performs worse than random inclusion. This may be a result of insufficient positive
experimental annotations relative to the functional diversity of this family. The five
proteins with unique molecular function annotations reduce the average posterior
probability overall, and selecting the queries to identify the remaining four functions
correctly may require more (or different) observations than are currently available
in this family. Thus this experiment may not reach the point where the mutual
94
Chapter 3. Choosing which Protein to Characterize
0 5 10 15 20
0.02.0
4.06.0
8.00.1
2.1
Iteration of Query Selection
Aver
age
Post
erio
r Pro
babi
lity o
f Cor
rect
Ann
otat
ions
4321 9876 14131211 16 21191817 22
Figure 3.2: The average posterior probability of the correct functional annotations thathave not been added as an observation in sifter’s computation of the posterior proba-bility on the sulfotransferase functional data set. This plot shows the average posteriorprobability of the correct, held-out functional annotations for the active learner selectingobservations to add at random (solid lines) and for the active learner selecting observa-tions to add using mutual information criterion (dotted lines), including the error bars foreach representing the standard deviation.
information criterion shows much advantage over random inclusion.
3.6 Results on the aminotransferase family
The aminotransferase protein family (PF00155) is a member of the pyridoxal 5’-
phosphate- (PLP-) dependent aminotransferase superfamily, responsible for convert-
ing an amino acid into its α-keto acid. This particular family is grouped accord-
ing to specificity to two different amino acid substrates, aspartate aminotransferases
(AATases) and tyrosine aminotransferases (TATases). Substrate specificity is actually
defined as a preference for a particular substrate, meaning that the relative activity
of a protein on one substrate is greater than the activity of that protein on another
substrate, although in vivo it may actually act on both (or neither) of the substrates.
In this particular family, the ratio of activities for the two substrates was, overall,
much closer to one than many enzyme families (i.e., the actual substrate preference
95
Chapter 3. Choosing which Protein to Characterize
in vivo was, in a few cases, not obvious) [Muratore et al., 2007]. Furthermore, this
family exhibits quite a few instances of observed parallel evolution, meaning that the
preferred substrate mutates independently at more than one branch in the phylogeny
for this family. We can observe this in the phylogeny of a subset of aminotransferases
(Figure 3.3).
This family provides a different experiment than the previous two, because a
subset of proteins in this family were selected to functionally characterize in order
to maximally diversify the proteins that had functional information throughout the
family [Muratore et al., 2007]. This selection was performed in a different way, with a
different goal, and from a different starting point than the sifter active learner, but
it does provide an alternative comparison to the random approach. For completeness
and consistency, we first present basic sifter results on this family, then we discuss
the application of active learning to this family.
3.6.1 Sifter results for the aminotransferase family
Sifter was applied to this aminotransferase Iα family of proteins. We reconstructed
a phylogenetic tree from the SATCHMO [Edgar and Sjolander, 2003] alignment of
the family using PAUP* maximum parsimony [Swofford, 2001] and identified possible
duplication events in the evolutionary history by reconciling the resulting tree using
the Forester v.1.92 program [Zmasek and Eddy, 2001a] with a reference species tree
from Pfam release 20.0 [Bateman et al., 2002] for a subset of the aminotransferase
superfamily PF00155 (specifically, the aminotransferase Iα family). We ran sifter
including the set of functional characterizations in the gold-standard dataset created
by Kathryn Muratore [Muratore et al., 2007], as represented in the phylogeny in
figure 3.3.
We ran sifter on the phylogenetic tree for the aminotransferase Iα family. Using
96
Chapter 3. Choosing which Protein to Characterize
PHHC _P S E AEAT T Y _R HI ME
Q8 D7 33_V IB VUQ9 K M 75_V IBC H
T Y R B _P AR DEQ8 E E H6_S HE ON
O53137_M OR S PQ8 DA F 6_V IBV UQ9K S G 3 _V IBC H
AA T _E C OL IQ8XD F 3_E C O 57Q8F J99_E C O L6AA T _S A LT IAA T _S A LT Y
Q8 ZG 95_Y E R P EQ8 D050_Y E R P E
Q9 J V S 3_N E I MAQ9 K 0P 5_N E I MB
AA T _HA E I NQ8 E E M8 _S HE ON
Q8 X5V 1_E C O 57T Y R B _E C O LIQ8 F B 17_E C O L6
T Y R B _S AL T YQ8Z1S 9_S AL T I
O8 5746_K LE P NQ8 ZJ09_Y E R P E
Q9 J YA1_N E IMBQ9 J T83_N E IMA
AA T _P S E A EQ9 XC 57_PS E AE
Q8 Y 0N3_RALS OQ8 P E 84_XAN C P
Q8 P R 41_XAN ACO8 4642_CHL T RQ9 P LU0_CHL MU
Q9 Z7G 5 _CHL P NO9 6142_PLAF 7
A AT M _ YE AS TQ9 64F0_9TR YP
Q9 N102_SHE E PAA T M _B OV INAA T M _P IGAA T M _M OU S EAA T M _R AT
AA T M _H UMANAA T M _H OR S E
AA T M _C HI C KQ4 3305_PAN MIQ4 3057_PAN MIAA T 1_AR AT H
Q4 2803_SOY B NO9 4320_SC HP O
AA T C _Y E AS TO42652_SC H P O
Q964E 9_GIALAAA T C _B OV IN
AA T C _P IGAA T C _H OR S E
AA T C _H UMANAA T C _R AT
AA T C _M OU S EAA T C _C HIC K
Q9 5V P 1_BR UMAAA T C _C AE E L
Q9 64F 1_9 T R Y PQ9 64 F 2 _C R IF A
AA T 1_ME D S AO4 8548_S OY B N
Q4 0107_LUP ANQ4 0108_LUP ANQ9 3W X7_9 F AB A
Q4 3781_LOT J AQ8 L7N7_AR A T HAA T 2_AR A T H
AA T 4_AR A T HAA T 3_AR A T H
AA T C _DAU C AAA T C _O R Y S A
Q4 2391_P AN MIQ4 2425_P AN MI
AA T 5_AR A T HO2 2618_LOT C O
Q4 2794_S OY B NQ4 1199_S OY B NQ8 HQQ0 _P HA VUP 93763_C AN LI
O2 0099_C ANLIAA T M _LUPAN
Q4 0325_M E D S A
Aspartate aminotransferase
Tyrosine aminotransferase
Figure 3.3: The phylogeny for the aminotransferase family, showing our gold-standardfunctional annotations for this family. The proteins with functional annotations foundfrom a literature search and also experimentally characterized earlier [Muratore et al.,2007] are colored based on a preference for one of two substrates, aspartate and tyrosine.Note that there appears to have been many more than one change of substrate preferencein this tree.
97
Chapter 3. Choosing which Protein to Characterize
the default parameter values for sifter, described in Chapter 2, sifter achieves
73.7% accuracy (14 of 19 correct predictions). The figure shows that there may be at
least four (or possibly more) locations in the phylogeny where the substrate specificity
changed independently from aspartate to tyrosine. However, the annotations are not
dense enough, nor are the methods for gene tree/species tree reconciliation accurate
enough, to attempt to co-localize duplication events with branches where substrate
specificity may have changed. Although parallel evolution does not preclude the use of
phylogenomic analysis, it does indicate that, for these sequences, molecular function
does not consistently evolve in parallel with protein sequence; in other words, small
changes in sequence do not always correspond to small changes in molecular function,
and large changes in sequence do not always correspond to large changes in function.
The specific amino acids that are responsible for determining substrate specificity in
this family of proteins is discussed further elsewhere [Muratore et al., 2007].
3.6.2 Mutual information criterion versus random inclusion
The comparison between using mutual information to select experiments and per-
forming experiments at random is striking for this particular family. This is because
a single protein, O84642 CHLTR, is always added last when the active learner with
mutual information criterion was used, so the variance of the posterior probabilities
for both the correct and the incorrect annotations are small (zero for the single re-
maining positive annotation from O84642 CHLTR) relative to the variance of the
average posterior probabilities for random inclusion for both the correct and incor-
rect substrates. These comparisons are shown in Figures 3.4 and 3.5. Figure 3.4
shows that the average posterior probability of the set of correct, unobserved anno-
tations when the experiments are added using mutual information is overall higher
than adding experiments at random, despite the large amount of parallel evolution
98
Chapter 3. Choosing which Protein to Characterize
0 5 10 15
0.02.0
4.06.0
8.00. 1
Iteration of Query Selection
Ave
rage
Pos
terio
r Pro
babi
lity
of C
orre
ct A
nnot
atio
ns
4321 9876 14131211 16
Figure 3.4: The average posterior probability of the correct functional annotations thathave not been added as an observation in sifter’s computation of the posterior proba-bility. This plot shows the average posterior probability of the correct, held-out functionalannotations for the active learner selecting observations to add at random (solid lines)and for the active learner selecting observations to add using mutual information criterion(dotted lines), including the error bars for each representing the standard deviation.
in this family. Figure 3.5 shows that, while the average posterior probabilities of the
incorrect annotations for the random addition of experiments declines steadily, the
same for the addition of experiments using mutual information criterion plateaus and
then drops below the average for the random criterion after approximately half of
the correct annotations are added. The variance of the posterior probabilities for the
incorrect annotations is, except for the first position, smaller for the mutual informa-
tion criterion than for random inclusion, reflecting an induced ordering of proteins
using the mutual information criterion.
3.6.3 Prioritizing the proteins
To determine how each protein, on average, impacted the mutual information for the
unobserved proteins, we found the average position (out of 17, since two proteins are
added to the initial set of observations) that each protein was added to the set of
99
Chapter 3. Choosing which Protein to Characterize
0.02.0
4.06. 0
8.00. 1
0 5 10 15Iteration of Query Selection
Ave
rage
Pos
terio
r Pro
babi
lity
of In
corr
ect A
nnot
atio
ns
4321 9876 14131211 16
Figure 3.5: The average posterior probability of incorrect functional annotations. Thisplot shows the average posterior probability of the set of incorrect functional annotationsfor the active learner selecting observations to add at random (solid lines) and for theactive learner selecting observations to add using mutual information criterion (dottedlines), including the error bars for each representing the standard deviation.
observations. In computing the average, we did not include the runs for which the
protein was added to the initial observations.
The results for the aminotransferase family are dramatic as compared to the
average position of inclusion, shown in Figure 3.6. Where the dotted line shows
the average position of a protein in this rank order (using random inclusion, ev-
ery protein’s average position of inclusion was very close to the average, results not
shown), there are four proteins above the average (including their standard devia-
tions), indicating less informative proteins, and eight proteins below the line, indi-
cating more informative proteins. In particular, the four proteins above the average
are O84642 CHLTR, O96142 PLAF7, PHHC PSEAE, and AATM CHICK, where
O84642 CHLTR is particularly interesting as it was added last in every case. The
eight proteins that are below the average line are Q964E9 GIALA, TYRB ECOLI,
Figure 3.6: The average position of inclusion for each of the 19 aminotransferase proteins.The dotted line shows the average position of inclusion, and each protein has its averagewith standard deviation error bars for the 100 runs of the mutual information active learner.If a protein is included earlier, this is indicative of the protein being informative for thetree as a whole; if a protein is included later, this is indicative of the protein being lessinformative.
If we look at where each of these proteins occur in reference to each other in the
aminotransferase phylogeny, we see that there are clusters of proteins whose particular
observations are considered more or less informative. In particular, the two proteins
with the least informative annotations are near each other in the phylogeny in terms of
the number of branch traversals, namely O8642 CHLTR and O96142 PLAF7. These
two proteins both have the same substrate preference (aspartate). On the other
hand, two of the proteins with the most informative annotations, Q964E9 GIALA and
AATC YEAST, are also close together phylogenetically but have conflicting substrate
preferences.
We can compare these “rankings” with rankings for a subset of these proteins
through another method for finding a set of proteins to characterize [Muratore et al.,
2007], shown in Table 3.1. The Muratore scores compute the sequence similarity of
this protein to other proteins in different subclades of the phylogeny. The higher the
score, the greater the sequence distance, and thus the more informative the protein
Table 3.1: A comparison of the Muratore scores as compared to the average position ofentry in the sifter active learning analysis. In this table, the proteins are ranked bysifter score. The scores have the reverse significance; in particular, for the Muratorescores, the higher the score, the more informative a protein should be relative to theavailable annotations, whereas for the sifter average position of entry, the lower theaverage position, the more informative the protein’s particular annotation is.
is predicted to be. But the method assumes that both substrates are to be tested
rather than ranking a single experiment, whereas the sifter active learner ranks
the specific substrate experiment for the protein in question. To be clear, the mu-
tual information criterion includes both the possibility of a positive and a negative
experimental outcome, weighted by the probability of each given the current set of
observed annotations. But we do not include negative experiments in the set of pos-
sible experiments for the active learner because currently sifter cannot incorporate
the negative results of these experiments as observations in the posterior probability
computation. If sifter could incorporate negative annotations as observations, we
would have included the available negative characterizations in the set of possible
queries for the active learner ([Muratore et al., 2007] report most of these negative
results).
Of note in the comparison is, first, that the protein O84642 CHLTR has both the
highest score in the Muratore scores and the latest position of entry in the sifter
102
Chapter 3. Choosing which Protein to Characterize
active learner, making the most informative and the least informative protein in this
subset for the methods respectively. Using Spearman’s rank correlation test, we get
ρ = −0.59 which is not below the 0.05 level of significance (at −0.68) for the anti-
correlation of these two measures. Thus, the two measures appear anti-correlated,
but not at a significant level. The sifter active learner would also have to evaluate
the expected value of the negative experiment for each protein to compare the two
relative rankings more directly.
3.7 Experimental design discussion
Each of the families above shows a different quality of the active learner using mutual
information criterion, and using these results, we may extrapolate on other, less well
studied families how the active learner might perform, and more generally, the number
of protein characterizations required for confident electronic prediction of functions
for the remainder of the family.
The deaminase example is a straightforward example of the benefit of active
learning. With only four additional, well-chosen experiments, we have equivalent
confidence for functional predictions across the whole family as with 28 additional
experiments at random. Although this family has proteins with multiple functions,
this does not appear to be a limitation for the active learner.
Since sifter does not perform well in families with parallel evolution and min-
imal experimental evidence supporting the particular substrate preference in each
functional clade, we do not expect active learning with sifter to perform particu-
larly well on these families. As in the aminotransferase family, it appears that a fairly
small set of characterizations will create equivalent confidence in the annotations for
the remainder of the tree, although the confidence was not monotonically increasing.
This is intuitive, as the locations of each of the mutations must be defined by at
103
Chapter 3. Choosing which Protein to Characterize
least two different functional annotations, so characterizations of new functions in a
particular region of the tree may add uncertainty to those regions temporarily. What
this family does tell us, though, is that the choice of which proteins and functions to
characterize is important, and some proteins are simply not important to characterize
in high-confidence portions of the phylogeny (or equivalently because we are already
so confident in the outcome of the proposed experiment).
For both the aminotransferase family and the sulfotransferase family, which has
the largest functional diversity of the protein families used in validation, it is possible
that this data set still lacks sufficient numbers of characterized proteins to find the
benefit of the mutual information criterion over the random inclusion. In particular,
perhaps it will take twice as many characterizations as are currently available to
sufficiently define the locations of the functional mutations in these trees because of
the parallel evolution. Since we have a limited set of annotations, we do not (and,
in practice, will not) know when we have evidence for every instance of change of
substrate preference in the tree, although we can attempt to estimate when are at a
plateau in the uncertainty of the unobserved random variables.
Overall, using sifter’s active learner with a mutual information criterion appears
to work well in protein families with some functional diversity and possibly with mul-
tifunction proteins. Families with high functional diversity or parallel evolution may
benefit less from a sequential active learning approach because of the large number
of functional characterizations required to confidently predict molecular function for
the unannotated proteins in the family. It is hard to quantify the benefit of active
learning in such families using the small gold-standard data sets that are currently
available.
104
Chapter 3. Choosing which Protein to Characterize
3.8 Conclusions
In this work, we developed a sequential active learner using a mutual information
criterion to select the next protein to functionally characterize (along with the spe-
cific function to characterize). We evaluated this method on three different protein
families, the AMP/adenosine deaminase family, the sulfotransferase family, and the
aminotransferase family, finding that in the AMP/adenosine deaminase family and the
aminotransferase family, and less so in the sulfotransferase families, the active learner
using mutual information criterion selects a small number of protein functional ex-
periments required to reach the same level of functional prediction confidence relative
to selecting these protein functional experiments at random.
105
Chapter 4
Fungal Genomes
4.1 Introduction
Fungal organisms may account for as much as 25% of the world’s biomass [Gess-
ner, 1997], and are important to study for a number of reasons. Fungi play a large
role in our ecosystem, where they are responsible for decomposing and recycling vas-
cular plants. Some species of fungi are either plant or animal pathogens. These
include the rice blast fungus Magnaporthe grisea and human pathogens, which come
from the genera Aspergillius, Candida, and Histoplasma. The human pathogens
often infect immuno-compromised humans to cause serious diseases, but may also
infect healthy individuals and are responsible for less serious diseases such as ath-
lete’s food or ringworm. Fungi are also useful for humans in a number of ways,
namely in food and alcohol production through Baker’s yeast, soy sauce produc-
tion through Aspergillius oryzae, and the production of antibiotics. There are cur-
rently 46 fully sequenced fungal genomes, and more than 50 in progress. These
represent a small fraction of the hypothesized number of existing fungal species,
estimated to be somewhere between 712, 000 and 9.9 million [Hawksworth, 2004;
106
Chapter 4. Fungal Genomes
Schmit and Mueller, 2007].
Fungal species are interesting for scientists for a number of more technical reasons.
Their genomes encode approximately 10, 000 genes each, which makes them less than
half of the size of the human genome. However, because they are eukaryotes, although
they are structurally much simpler organisms (sometimes not multicellular), their cells
look crudely similar to human cells in terms of the organelles and basic functionality.
Because of this, the set of proteins critical to fungal organisms overlaps broadly with
the set of proteins critical to animals. The species tree is fairly well understood,
despite the sparse sampling of fungal species [James and et al, 2006; Fitzpatrick et
al., 2006]. One problem with reconstructing this tree using sparsely sampled species
is that fungal species evolution is full of examples of convergent or parallel evolution,
including at least four different times when the flagella were lost [James and et al,
2006], so morphological data does not guide the reconstruction.
4.2 Methods
The genomes from 46 different fungal species had been sequenced as of June 2006.
Gene finding was performed in each of these genomes using a number of different
methods, including GeneWise [Birney et al., 2004], FgenesH+ [Salamov and Solovyev,
2000], and GLEAN [Mackey et al., 2007]; for more specific details of their training and
application, see [Stajich, 2006]. This resulted in 427, 324 protein sequences from the
different fungal genomes. We searched each of the resulting genes for Pfam domains
using hmmsearch [Eddy, 1998] for the Pfam-A domains available in Pfam version
20.0 [Bateman et al., 2002]. We aligned the set of fungal genomes corresponding to
each Pfam domain by performing a hidden Markov model (HMM) alignment using
hmmalign based on the Pfam-A HMM profile for that domain [Eddy, 1998]. We
reconstructed phylogenies for each of the domains with PAUP* [Swofford, 2001], using
107
Chapter 4. Fungal Genomes
maximum parsimony with a BLOSUM50 matrix [Henikoff and Henikoff, 1992] when
the size of the alignment file was less than 10000 kb, and neighbor joining when the
size of the file exceeded that cutoff. We reconciled the trees against the species tree
shown in Figure 4.1 using Forester version 1.92 [Zmasek and Eddy, 2001a]. Domains
with fewer than four protein sequences from the 46 fungal genomes were eliminated.
This resulted in 2800 phylogenies representing as many different sets of homologous
protein domains within the fungal genomes.
Of the original set of proteins from the 46 fungal genomes, there were 236, 854 pro-
teins that contained at least one Pfam-A domain and a family with greater than four
members. We gathered molecular function annotations for each of the Pfam-A do-
mains from the Gene Ontology Annotation (GOA) database in the following way. We
ran blast version 2.2.4 [Altschul et al., 1990] for each of the fungal proteins against
the swiss-prot and trembl fasta files, downloaded September 23, 2006 [Apweiler
et al., 2004], with an E -value cutoff of 1e − 100. We looked for exact hits in order
to match the swiss-prot identifiers to the proteins in our set of fungal genomes.
In particular, we selected a protein’s exact swiss-prot or trembl hit as the most
significant hit from either database with E -value less than 1e − 110 and identical
species. These identifiers enabled us to extract the molecular function annotations
from the GOA database downloaded September 24, 2006 [Camon et al., 2004].
4.2.1 Application of sifter
We applied sifter to each of these functionally annotated phylogenies. In particu-
lar, we computed posterior probabilities for all members of every tree, conditioned on
the available evidence in the tree. We used both experimentally- and electronically-
derived annotations as observations because of the sparsity of the experimental anno-
tations. Trees with neither experimental nor electronic annotations were eliminated,
108
Chapter 4. Fungal Genomes
C r y p t o c o c c u s g a t t i i
S a c c h a r o m y c e s p a r a d o x u sS a c c h a r o m y c e s c e r e v i s i a eS a c c h a r o m y c e s m i k a t a eS a c c h a r o m y c e s k u d r i a v z e v i iS a c c h a r o m y c e s b a y a n u sC a n d i d a g l a b r a t aS a c c h a r o m y c e s c a s t e l l i iK l u y v e r o m y c e s l a c t i sAshbya gossypiiS a c c h a r o m y c e s k l u y v e r i
P i c h i a s t i p i t i sC a n d i d a g u i l l i e r m o n d i iDebaryomyces hanseniiC a n d i d a l u s i t a n i a eC a n d i d a a l b i c a n sC a n d i d a d u b l i n i e n s i sC a n d i d a t r o p i c a l i sY a r r o w i a l i p o l y t i c aS c h i z o s a c c h a r o m y c e s p o m b e
Aspergillus oryzaeAspergillus terreusAspergillus nigerAspergillus fumigatusA s p e r g i l l u s n i d u l a n sC o c c i d i o i d e s i m m i t i sUncinocarpus reesiiHistoplasma capsulatum
B o t r y t i s c i n e r a eS c l e r o t i n i a s c l e r o t i o r u mS t a g o n o s p o r a n o d o r u m
C h a e t o m i u m g l o b o s u mP o d o s p o r a a n s e r i n aNeurospora crassaMagnaporthe griseaF u s a r i u m g r a m i n e a r u mF u s a r i u m v e r t i c i l l i o i d e sN e c t r i a h a e m a t o c o c c aT r i c h o d e r m a r e e s e i
Laccaria bicolorP h a n e r o c h a e t e c h r y s o s p o r i u m
C r y p t o c o c c u s n e o f o r m a n s J E S 2 1
Ustilago maydis
R h i z o p u s o r y z a e
C r y p t o c o c c u s n e o f o r m a n s v a r g r u b i i H 9 9
CUG
WGD
Figure 4.1: The set of fungal species with complete genomes sequences used in thisstudy. The actual branch lengths were not estimated, and gene-species tree reconciliationdoes not use branch lengths. This tree was derived from tree reconstruction methodsbased on concatenating the sequences of 42 genes common to the set of fungal species,and then correcting for an instance of long branch attraction in the Aspergillus clade, asoriginally in [Fitzpatrick et al., 2006]. We compared this tree to those found in two othersources [Stajich, 2006; James and et al, 2006] to build this consensus tree and to correctlyinsert the species in this study that were not in the original phylogeny.
109
Chapter 4. Fungal Genomes
as a sifter analysis of these families would be meaningless, leaving 2389 of the
2800 protein families for analysis, including 23 families with only a single candidate
function (or 10 families if we only consider electronic annotations). We generated
parameters for each of the families using the following defaults: the scale parameters
σspeciation = 0.05, σduplication = 0.03, the α parameters were all set to 1.0, and the
Φ matrix had 0.5 on the diagonal, and 1.0 off-diagonal. The sifter runs were per-
formed exactly for all proteins with fewer than nine functions; otherwise they were
truncated at 2 for 9 to 19 candidate functions and at 1 for 20 or more candidate
functions.
We ran sifter twice for each family. The first run included only experimental
evidence for that particular family (i.e., including evidence with IDA, IMP, and TAS
evidence codes), if available. The second run included all available evidence. Of the
the 2389 families run on sifter, 552 had experimental evidence associated with one or
more proteins, and 1837 had electronic evidence associated with one or more proteins.
This yielded three possible types of experiments. The first type of experiment was
on a protein family with both electronic and experimental evidence for which we
predicted function given only the experimental evidence. The second type was on a
protein family with both electronic and experimental evidence for which we predicted
molecular function given both the electronic and experimental evidence. The third
type was on a protein family with only electronic evidence for which we predicted
molecular function given only the electronic evidence (i.e., there was no experimental
evidence available). We report results for each type of experiment.
4.2.2 Limitations to methods
We see two limitations to the analysis performed here. For the less-well studied
genomes, gene-finding is the primary source of the protein sequences as opposed to
110
Chapter 4. Fungal Genomes
any evidence of transcription or translation. The resulting hypothesized proteins
will often differ from the actual expressed proteins in an insertion or deletion of
multiple sequential amino acids. This is also true, to a lesser extent, for proteins from
better-studied organisms hypothesized using espressed sequence tags, which identify
transcribed, spliced nucleotide sequences. Thus, the blast searches for proteins with
Gene Ontology (GO) annotations were not exact (i.e., requiring an E-value of 0.0),
but instead used a low E-value (1e−110) cutoff. Since blast (as its name implies) is
a local alignment tool, a sequence with an insertion or deletion of multiple, sequential
base pairs relative to the query sequence will have a more significant E-value than a
sequence with multiple, nonsequential mismatches. A second limitation is that the
the families were built using Pfam-A release 20.0, where we used the profile HMMs
for each of the Pfam-A domains to search for domains in each species’ set of non-
redundant hypothetical proteins. The implication of this is twofold: first, we will have
missed identifying protein families that do not appear in Pfam-A or do not co-occur
with a Pfam-A domain. Second, each family’s proteins were identified by domain
similarity, which is not always a guarantee of global homology.
4.3 Results
4.3.1 Fungal species
The collection of 46 fungal species used in this phylogenomic analysis is shown in
Figure 4.1. The phylogeny of the species represents the best current understanding
of the evolution of these species, despite such a sparse sampling of the species [Fitz-
patrick et al., 2006]. There are a few interesting clades in this tree that deserve a
brief mention.
First, the fungal species in the clade labeled CUG are interesting in that they
111
Chapter 4. Fungal Genomes
use the codon CUG (i.e., CTG in DNA) to code for serine rather than leucine, as
is the universal code in most other organisms [Laplazaa et al., 2006; Ohama et al.,
1993]. This clade is interesting in that this particular characteristic appears to have
evolved a single time in this tree, unlike many other fungal characteristics, such as
sexual reproduction, multicellularity, and existence of a flagella. A second clade of
note is the one labeled WGD in the figure, which includes species that are thought
to have undergone a whole genome duplication (WGD) event [Kellis et al., 2004;
Fitzpatrick et al., 2006] at the branch with the label.
Table 4.1 summarizes the set of fungal species used in this study, including the
number of genes identified by gene finding methods and subsequently used in this
study.
The average percentage of genes with a Pfam domain for the 46 fungal genomes
is 57.0%, the highest percentage is Schizosaccharomyces pombe with 75.0% and the
lowest percentage is 31.3% in Laccaria bicolor. After running these families through
the sifter pipeline, which filters out families with fewer than four members and
with no GOA database annotations, the average percentage of genes in a genome
with results drops slightly.
4.3.2 A diverse set of protein families
We first investigated some of the properties of this landscape of protein families within
the 46 fungal genome data set.
Of the 2800 phylogenies built, there were 2389 Pfam fungal families that had ev-
idence from the GOA database and so were run on sifter. Of those families, the
largest one was MFS 1 (Major Facilitator Superfamily) with 8729 member proteins,
which is one of two types of transporter proteins that occur in all known organisms
(the other being the ATP-Binding Cassette (ABC) superfamily, which has 1946 mem-
Table 4.1: The 46 fungal species in the sifter study. Note that the number of predictionsis slightly higher than the number of proteins in all of the fungal families, as the predictionscount each prediction for each protein once (and for every family that a protein is a memberof it receives a prediction), whereas the proteins in the families count proteins in multiplefamilies only once.
113
Chapter 4. Fungal Genomes
bers in this data set). The average number of proteins in a fungal family was 165.3,
with a standard deviation of 416.5, reflecting the enormous variability in size of these
families. The total number of proteins in these families was 302, 683, or 236, 854 if we
do not count proteins multiple times that appear in more than one family. There are
slightly more internal nodes of the reconstructed phylogenies reconciled against the
species tree shown above that are predicted to be associated with speciation events
(52.6%), as compared to the number of internal nodes that are predicted to be asso-
ciated with duplication events (48.4%). This is considerably more duplication events
than one might expect, illustrating the large number of false positives associated with
approximate tree reconciliation based on possibly erroneous trees.
On average, 35.3% of the proteins within a family had a matching sequence in
swiss-prot or trembl. Of those with database matches, on average 77.3% had
annotations in the GOA database (meaning that 27.0% of the proteins in a family
on average had at least one annotation from the GOA database). The somewhat
astounding figure is the average number of annotations for an annotated protein from
the GOA database was 3.5. This implies a “rich get richer” scheme within the GOA
database (or perhaps biology in general) where a protein with a functional annotation
appears more likely to accumulate additional (possibly redundant) annotations as
compared to unannotated proteins. For experimental annotations from GOA, there
are only 5336 experimental annotations in proteins in these families, meaning that the
average number of experimental annotations for an annotated protein is 0.065. The
average number of experimental annotations from the GOA database over the fungal
families run on sifter is 1.7%. Of the 2389 families run on sifter, 23 have a single
candidate function (when we include both experimental and electronic annotations),
and 552 have experimental annotations for at least one of the member proteins.
114
Chapter 4. Fungal Genomes
4.3.3 Sifter results
A few general observations about sifter’s performance on these families will be men-
tioned. Then prediction results for the fungal species overall and individual families
are discussed.
4.3.3.1 Timing
By far the most time-intensive step of the phylogenomic analysis was the phylogenetic
tree reconstruction; this step would not have been as computationally intensive if we
had chosen to use neighbor-joining trees at a much lower family size threshold. We
computed the time for the sifter runs, given the reconciled phylogeny for a family
and the associated GOA database annotations. When run on Dell Precision 390
Workstation computers with Intel Core2Duo 2.6 GHZ processors and 2 Gb RAM,
the entire set of sifter runs took under seven hours. This could have been sped up
considerably if we had truncated the computation of posterior probabilities in families
with more than five candidate functions, as the majority of time was spent on the
exact computations of families with five to eight candidate functions. As expected,
the largest amount of time was spent on the families with greater functional diversity.
As a whole, the 1837 families with only electronic annotations from the GOA
database took approximately 59.2 minutes, and the 552 families with experimental
annotations from the GOA database took 47.8 minutes, whereas the same 552 fam-
ilies, including both electronic and experimental annotations, took 4 hours and 25.5
minutes. The average number of candidate functions is 9.4 in the families with both
electronic and experimental annotations whereas the average number of candidate
functions in the families with only electronic annotations is 3.7 and the average num-
ber of candidate functions in the families using only experimental annotations is 3.5,
which explains why the average run time per experiment is over ten times higher from
115
Chapter 4. Fungal Genomes
the families using only electronic annotations to the families using both electronic and
experimental annotations.
4.3.3.2 Identical versus consistent predictions
We can assess the accuracy of sifter using two different types of agreement between
annotations and predictions, both represented using GO terms. We call a functional
prediction identical or correct when it agrees exactly with the annotation term for
that protein. We call a prediction consistent when it is a descendant of the GO di-
rected acyclic graph (DAG) of the protein’s functional annotation. In other words,
a prediction is consistent with an annotation when the annotation is a more general
descriptor of the predicted functional term, since the annotation does not rule out the
possibility that the more specific term is a function of this protein. Because sifter
gathers the set of candidate functions from the most specific annotations available,
and predictions are from the set of candidate functions, we do not see sifter predic-
tions that are ancestors of the functional annotations. Because of time limitations,
we did not run leave-one-out cross-validation methods, but simply computed identi-
cal and consistent predictions relative to the annotations that were input to sifter.
Therefore, the most appropriate measures of accuracy in these experiments are those
that were trained using only experimental evidence and tested on the held-out elec-
tronic evidence.
While the average percentage of identical predictions for the runs including both
experimental and electronic annotations was 56.3%, the average percentage of consis-
tent predictions for the same set of runs was 90.9%. Similarly, the average percentage
of identical predictions for the runs including only experimental annotations was
20.1%, whereas the average percentage of consistent predictions for those runs was
80.1%. The set of experiments for the families with only electronic annotations yielded
66.1% predictions identical and 96.4% predictions consistent with the electronic an-
116
Chapter 4. Fungal Genomes
notations. A more detailed account of these data appears in Figure 4.2, which shows,
for each family, an overall histogram of identical and consistent predictions for all
three types of experiments.
There are many more non-identical annotations than inconsistent annotations for
all types of experiments. The reason for this is clear: the annotations in the GO
DAG occur at many possible levels of the hierarchy. If we are only predicting func-
tional terms at the most specific level of the hierarchy, then counting only exact term
matches as identical means that predictions that are consistent with the current an-
notation (but not identical) are considered wrong. This seems like an inappropriate
measure, and GO is designed specifically to enable more sophisticated measures of
consistency. For the experiments including both experimental and electronic annota-
tions, it is possible that as many as 34.6% of the annotated proteins in this data set on
average were annotated at a less specific level than the sifter candidate functions,
assuming that this reason alone accounts for the difference between the identical and
consistent accuracy.
There are three basic sources of error, causing either non-identical or inconsistent
predictions. The first is an error of omission, meaning that proteins with a particular
molecular function have neither electronic nor experimental evidence in the GOA
database. Second is an annotation error in the GOA database, where the functional
annotation associated with a protein is incorrect. The third is an error in sifter’s
predictions. Each of the three experiments has some combination of these sources
of error, and it would be useful to determine what percentage each source of error
contributed to the non-identical or inconsistent predictions.
For all three types of experiments, the non-identical predictions signify places
where the GOA annotation disagrees with the sifter prediction. This could be due
to errors of omission. Biologically, this may happen for multifunction proteins, as
in the AMP/adenosine deaminase family from Chapter 2, or moonlighting proteins.
117
Chapter 4. Fungal Genomes
Individual Fungal Families
Fra
ctio
n o
f C
orr
ect
/Con
sist
en
t P
red
ictio
ns
(A) Correct, Experimental Annotations Only
0.02.0
4.06.0
8.00.1
(B) Consistent, Experimental Annotations Only
(C) Correct, Experimental and Electronic Annotations
(D) Consistent, Experimental and Electronic Annotations
(E) Correct, Electronic Annotations Only
(F) Consistent, Electronic Annotations Only
0.02.0
4.06.0
8.00.1
0.02.0
4.06.0
8.00.1
0.02.0
4.06.0
8.00.1
0.02.0
4.06.0
8.00.1
0.02.0
4.06.0
8.00.1
Figure 4.2: Six graphs showing the percentage of correct or consistent predictions forthe three types of experiments. The percentage correct or consistent is colored black,whereas the percentage incorrect or inconsistent is colored grey. The bars do not reflectprotein family size. Panel (A) shows the percentage of identical predictions for the experi-ments using only experimental annotations. Panel (B) shows the percentage of consistentpredictions for the experiments using only experimental annotations. Panel (C) showsthe percentage of identical predictions for the experiments using both experimental andelectronic annotations. Panel (D) shows the percentage of consistent predictions for theexperiments using both experimental and electronic annotations. Panel (E) shows thepercentage of identical predictions for the experiments using the electronic annotations,for families without any experimental predictions. Panel (F) shows the percentage of con-sistent predictions for the experimental using electronic annotations, for families withoutany experimental predictions. Note in the final two that there is an interesting plateauaround 0.5.
118
Chapter 4. Fungal Genomes
Another reason for non-identical predictions in this experiment is because of an error
in sifter’s predictions, perhaps because the evolutionary persistence of a function
may be different than predicted by sifter. This is unfortunately a problem with the
phylogenomic method more generally. Parallel evolution will often manifest as a short
evolutionary persistence of a particular function, possibly at multiple locations in the
tree. Incorrect alignments and incorrect phylogenies may also manifest similarly.
Non-identical and inconsistent annotations may also be due to errors in the GOA
database annotations. A manual phylogenomic analysis performed on those families
may determine which source of error is responsible for the inaccuracies.
The experiments including only experimental annotations have higher rates of
non-identity and inconsistency because the predictions based on experimental anno-
tations were held-out from sifter’s prediction. For these situations, it would also be
desirable to determine which source of error the inconsistency or non-identity stems
from.
4.3.3.3 Experimental annotations use more specific terms than electronic an-
notations
Using GO enables us to examine how specific or how general the terms used in an-
notations and subsequent predictions are. In particular, the root of the GO directed
acyclic graph (at level 0, which is the term molecular function) is the most general
term in the hierarchy, and as we traverse to subsequent levels in the hierarchy, the
terms become more and more specific, for example, including substrate or cofactor
information. The specificity of sifter’s predictions in the fungal protein families
reflects the specificity of different types of annotations in Pfam release 20.0. The
histograms representing the average depth of the candidate functions across the set
of fungal protein families is shown in Figure 4.3. The average level in the GO DAG
of the candidate functions derived from experimental predictions is 6.52, whereas the
119
Chapter 4. Fungal Genomes
Histogram of Candidate Function Average Depth
Average Depth of Candidate Functions0 5 10 15 20 25
Experiments with only electronic annotations
Experiments with experimental and electronic annotations
Experiments using only experimental annotations
Yellow is transparent and at front; other colors in the graph are combinations of the yellow with red and blue
Rel
ativ
e Fr
eque
ncy
Figure 4.3: Histogram of average level of candidate functions for sifter runs with ex-perimental annotations and experimental and electronic annotations. This figure showsthe normalized histograms of the three different sifter experiment’s candidate functionsoverlaid on top of each other. The histogram at the front (the yellow histogram, repre-senting experiments with only electronic annotations) was made transparent so that thered and blue bars could be visible at the same time, appearing orange or green. Theexperiments using only experimental annotations dominate the histogram at average levelsix and larger.
average level in the GO DAG of the candidate functions derived from experimental
and electronic predictions is 5.92, implying that experimentally validated functional
annotations may be on average more specific than electronic annotations. In addition,
there are 326 families in which the predictions from the set of experimental annota-
tions are more specific than the predictions from all of the annotations, whereas there
are 184 families in which the reverse is true. In the remaining 42 families, the two
sets are at identical levels in the GO DAG.
If we consider the families for which the average level of the candidate functions
from the experimental annotations indicates more specific terms than the average
level of the candidate functions derived from both the experimental and electronic
120
Chapter 4. Fungal Genomes
annotations, this appears to occur because the experimental annotations are, in gen-
eral, more specific than the electronic annotations. The glycotransferase-34 family
includes this scenario; when only using experimental annotations, there are two leaves
at level six of the GO DAG (alpha-1,6-mannosyltransferase activity and alpha-1,2-
galactosyltransferase activity), and these annotation only occur in the proteins as
experimental annotations. When the family is run with both experimental and elec-
tronic annotations, however, there are five candidate functions: the two functions
from the experimental annotations, and three additional functions from the elec-
tronic annotations (heme binding at level four, iron ion binding at level six, and
monooxygenase activity at level four). The reverse situation, where the average level
of the candidate functions from the experimental annotations indicates more general
predictions than is indicated from the average level of the candidate functions from
both the experimental and electronic annotations, most often occurs as a result of
omission, specifically when there were no experimental characterizations of a particu-
lar function within a family. There are many examples of this in this data set, as more
than two-thirds of the families with annotations lacked any experimental annotations.
4.3.3.4 Overall functional diversity
We examine the diversity of functional predictions for each of the species in this fun-
gal data set. For each protein in each family, we computed the fraction of sifter
predictions descending from each of the molecular function terms at the most general
level (the children of the node molecular function) of the GO DAG. We computed
these figures for the experiments using both experimental and electronic annotations
(Figure 4.4) and the experiments using electronic annotations with no available exper-
imental annotations (Figure 4.5; the experiments using only experimental annotations
give similar fractions to the experiments using both experimental and electronic, and
are not shown).
121
Chapter 4. Fungal Genomes
0.0
2.0
4.0
6.0
8.0
0.1
AS
PF
U
EM
EN
I
AS
PO
R
BO
TC
I
CA
ND
U
CH
AG
L
CO
CIM
CR
YN
V
CR
YG
A
CA
NT
R
GIB
ZE
AJE
CA
LA
CB
I
NE
UC
R
PO
DA
N
PIC
ST
SA
CB
A
YE
AS
T
SA
CK
U
SA
CP
A
SC
HP
O
TR
IRE
9E
UR
O
AS
HG
O
AS
PN
G
AS
PT
E
CA
NA
L
CA
NG
A
PIC
GU
CL
AL
S
CR
YN
E
CR
YG
A
DE
BH
A
GIB
MO
KL
UL
A
MA
GG
R
FU
SS
O
PH
AC
H
RH
IOR
SA
CC
A
SA
CK
L
SA
CM
I
PH
AN
O
SC
LS
C
US
TM
A
YA
RL
I
GO:0005488 -- Binding
GO:0003824 -- Catalytic activity
GO:0030234 -- Enzyme regulator activity
GO:0060089 -- Molecular transducer activity
GO:0030528 -- Transcription regulator activity
GO:0045182 -- Translation regulator activity
GO:0005198 -- Structural molecule activity
GO:0005215 -- Transporter activity
Figure 4.4: Overall functional prediction diversity for the fungal species. This figureshows the fraction of proteins found in each species that have sifter predictions in oneof eight general molecular function categories. The names of each species are the firstthree letters of their genus concatenated with the first two letters of their species (e.g.,Aspergillus fumigatus becomes ASPFU), with a few exceptions, including S. cerevisiae,which is abbreviated YEAST, and Aspergillus nidulans, which is abbreviated EMENI, bothby swiss-prot convention.
The proportions from the sifter predictions using only electronic annotations
show a slightly higher proportion of catalytic activity predictions relative to binding
predictions, possibly reflecting the experimental bias that it is easier to show binding
experimentally than many of the other functional classes.
The similarity between the fractions of each general molecular function for the
proteins species does not trivially appear to correspond to the evolutionary similarity,
with a few obvious exceptions. The fractions for Candida albicans and Candida
dubliniensis, which have a recent common ancestor, appear very similar. In contrast,
Laccaria bicolor, which appears to have a relatively large fraction of binding proteins,
does not share this trait with Phanerochaete chrysosporium, the species most closely
122
Chapter 4. Fungal Genomes
0.0
2.0
4.0
6.0
8.0
0.1
GO:0005488 -- Binding
GO:0003824 -- Catalytic activity
GO:0030234 -- Enzyme regulator activity
GO:0060089 -- Molecular transducer activity
GO:0030528 -- Transcription regulator activity
GO:0045182 -- Translation regulator activity
GO:0005198 -- Structural molecule activity
GO:0005215 -- Transporter activity
AS
PF
U
EM
EN
I
AS
PO
R
BO
TC
I
CA
ND
U
CH
AG
L
CO
CIM
CR
YN
V
CR
YG
A
CA
NT
R
GIB
ZE
AJE
CA
LA
CB
I
NE
UC
R
PO
DA
N
PIC
ST
SA
CB
A
YE
AS
T
SA
CK
U
SA
CP
A
SC
HP
O
TR
IRE
9E
UR
O
AS
HG
O
AS
PN
G
AS
PT
E
CA
NA
L
CA
NG
A
PIC
GU
CL
AL
S
CR
YN
E
CR
YG
A
DE
BH
A
GIB
MO
KL
UL
A
MA
GG
R
FU
SS
O
PH
AC
H
RH
IOR
SA
CC
A
SA
CK
L
SA
CM
I
PH
AN
O
SC
LS
C
US
TM
A
YA
RL
I
Figure 4.5: Overall functional prediction diversity for the fungal species for the set ofprotein families that only have electronic evidence. This figure shows the fraction of pro-teins found in each species that have sifter predictions in one of eight general molecularfunction categories. The names of each species are the first three letters of their genus con-catenated with the first two letters of their species (e.g., Aspergillus fumigatus becomesASPFU), with a few exceptions, including S. cerevisiae, which is abbreviated YEAST, andAspergillus nidulans, which is abbreviated EMENI, both by swiss-prot convention.
123
Chapter 4. Fungal Genomes
related to it in this particular data set, although this could be an artifact due to the
low number of genes found in L. bicolor or possibly a long branch length between
them. Whether this lack of correspondence is an actual biological phenomenon, or
whether it is a result of sifter errors or problems in gene finding, needs further
investigation.
4.3.4 Specific families
We examined four specific families in this data set, two large and two small, to
illustrate the power of function prediction using phylogenomic analysis. For each
family, we describe the molecular functions within the family and the species that
appear to have over- or under-represented numbers of proteins in these families to
try to determine why duplications or deletions may have occurred in these organisms
for this particular domain type. We also describe our literature reviews for these
particular families and mention conclusions that may be drawn from our phylogenomic
analyses of these families.
4.3.4.1 Tyrosine protein kinase family
The tyrosine protein kinase domain (Pkinase Tyr, PF07714) has has 4772 members in
this fungal data set and 24 candidate proteins (using only experimental data). There
are two major clades in the protein kinase phylogeny, defined by their substrate speci-
ficity: one clade contains proteins that are serine/threonine specific, and the other
contains proteins that are tyrosine-specific [Hanks et al., 1988]. It is thought that
tyrosine specificity is a more recent development, around the same time as multicel-
lular organisms developed, and is important in cell-cell communication [Hanks et al.,
1988].
The two organisms that appear to have an over-representation of tyrosine protein
124
Chapter 4. Fungal Genomes
kinase domains are both pathogens. The average species has approximately 104
proteins with this domain in its genome. Candida albicans is a diploid fungus and a
human parasite, causing thrush and, in immunocompromised patients, Candidiasis.
C. albicans has 173 proteins with this domain in its genome. While normally a
unicellular organism, C. albicans will change phenotype to become a multicellular
organism (using both tyrosine protein kinase proteins [Cassola et al., 2004] and SIR2
proteins [Perez-Martin et al., 1999], also over-represented in the C. albicans lineage)
in response to environmental factors [Cassola et al., 2004]. A recent study showed that
doubling the concentration of tyrosine protein kinase proteins reduces the growth rate
of cells by two-fold [Cassola et al., 2004], which does not explain why this apparently
toxic protein recently appears to have had a large number of duplications in this
organism.
No additional information was found on the role of tyrosine protein kinase proteins
in the multicellular plant (and opportunistic human) pathogen Rhizopus oryzae, or
any indications for why there appears to be an overrepresentation (244 copies) of the
tyrosine protein kinase domain in this organism.
In the sifter analysis of this family, it appears that the fraction of proteins with
predictions for each of the candidate functions was in general similar to the fractions
of proteins specific to both R. oryzae and C. albicans with predictions for each of
the candidate functions. A possible exception is that the percentage of proteins with
protein histidine kinase activity predictions was slightly lower in both of these species
than in the family as a whole. R. oryzae had 5.3% and C. albicans had 4.6% of their
proteins predicted to have protein histidine kinase activity, as compared to the overall
family that had 10.5% of proteins predicted to have protein histidine kinase activity.
Overall, we can conclude that the recent duplications in both of these families do not
appear to have occurred in a specific functional clade.
125
Chapter 4. Fungal Genomes
4.3.4.2 Major facilitator superfamily
Major Facilitator Superfamily (MFS) domain (MFS 1, PF) has 8729 members in
this fungal data set and 31 candidate molecular functions using only experimental
evidence in sifter. MFS proteins and the ABC transporters are the two types of
transporters that occur in almost all organisms.
MFS proteins have the function of transporting potentially toxic substances out
of the cell, but also for pathogenic species such as some of the fungal species in this
set, these proteins can also facilitate the transport of toxins into the host cells.
The average number of proteins with this domain in a fungal genome in this data
set is 190. It appears that there is significant over-representation of this domain in
two clades of the fungal tree. Specifically, MFS appears to be over-represented in
the three species Aspergillus niger (471), Aspergillus terreus (442), and Aspergillus
oryzae (517), all forming a single clade. MFS is also over-represented in a second
clade with three species: Nectria haematococca (674), Fusarium verticillioides (482),
and Fusarium graminearum (379). Furthermore, this domain appears to be slightly
under-represented in two species, Laccaria bicolor (121) and Rhizopus oryzae (125),
but it is possible that this could be false negatives during the gene finding step.
The large amount of redundancy of MFS and related ABC and multi-drug resis-
tance (MDR) protein domains has been documented in the Aspergillus genera, and
is thought to be a cause of its development of resistance to a drug used for these
human pathogens, triazoles, as these proteins have been found to reduce the overall
intracellular accumulation of the drug [Ferreira et al., 2005].
In the sifter predictions for the MFS proteins in two of the three of these As-
pergillus species, it appears that there is a slight overabundance of predictions for
spermine transmembrane transporter proteins (13.9% in A. oryzae and 16.6% in A.
niger versus 10.0% in the family as a whole). In fungal organisms, spermine trans-
126
Chapter 4. Fungal Genomes
membrane transporters generally inhibit cell growth by excreting polyamines, which
are charged molecules that are necessary for different reactions in the cell, but are
cytotoxic in high concentrations [Tachihara et al., 2005]. A number of studies have
found that proteins with this function also play a role in salt ion transportation [Porat
et al., 2005]. In general, though, it appears that the recent duplications were found
in many places in the phylogeny, and not in one specific clade.
The garden pea pathogen N. haematococca and the corn pathogen F. verticillioides
are both well-studied pathogens, for which a great deal of information about how they
infect their host is known. Although MFS proteins have been studied specifically in
F. verticillioides [Lopez-Errasquin et al., 2006], it is still not clear why this particular
set of pathogens has duplicated the MFS domain so frequently. One possible thought
is that a specific feature of these plant pathogens is that they are only pathogenic on
a very limited set of specific host plants [Straney et al., 2002], thus it is possible that
they have duplicated the proteins required to transport the pathogens to the host in
order to evolutionarily discover the optimal way to infect the host.
In the sifter predictions for the MFS proteins in these two species, it appears
that there is no difference in the proportion of function predictions relative to the
proportions for the MFS family as a whole. The largest difference is in spermine
transmembrane transporters, which is predicted for 6.8% of the N. haematococca
proteins and 7.2% for the F. verticillioides proteins, as compared to 10.0% for the
full set of fungal species. In other words, it appears that the recent duplications were
found across the phylogeny, and not in clades with specific molecular functions.
4.3.4.3 Spermine/spermidine synthase
Phylogenomic analysis of the spermine/spermidine synthase family explores some
questions about whether these particular functions are essential to the fungal or-
ganisms. In this anaylsis, we are assuming that both the reconciled phylogeny and
127
Chapter 4. Fungal Genomes
the sifter predictions are correct. Spermine/spermidine synthase proteins are used
in the cell to synthesize spermine and spermidine. In particular, polyamines such
as spermidine are required for cell growth, and spermidine synthases are the pro-
teins responsible for spermidine synthesis. There are two experimental annotations
in this tree, both for proteins found in S. cerevisiae, and one of which is spermine
synthase activity (GO:0016768), the other of which is spermidine synthase activity
(GO:0004677). The phylogeny is shown in Figure 4.6, with the portions of the tree
that sifter predicts as spermine synthase and spermidine synthase colored appro-
priately.
The phylogeny for this family shows that the two recent duplications of this partic-
ular protein domain in C. albicans may have occurred in the two different functional
clades of this family phylogeny. It also appears that the duplication events may have
happened very recently, as the sequence similarity of both sets of inparalogs is high.
Because we performed an analysis on the set of nonredundant proteins for each of
these species, though, we can be confident that these are not, in fact, the same protein
in different strains of C. albicans.
There are a number of papers on whether or not these particular proteins are
essential for the organisms. It appears that spermine synthase is not essential in S.
cerevisiae [Hamasaki-Katagiri et al., 1998], but spermidine synthase is essential for
growth in both S. cerevisiae [Hamasaki-Katagiri et al., 1997] and S. pombe [Chat-
topadhyay et al., 2002]. The latter of these papers also indicates that the sifter
prediction for SPEE SCHPO is correctly spermidine synthase. This is interesting in
terms of the phylogeny; since it appears that there are the same number of inparalogs
(i.e., recent duplication events) in this tree in the essential spermidine clade (one in-
paralog, the C. albicans proteins) as compared to the spermine clade (one inparalog,
the C. albicans proteins), it may be possible that there is no dosage requirement for
the particular protein, as it appears that redundancy of the essential protein is al-
128
Chapter 4. Fungal Genomes
Sper
min
e Sy
nth
ases
Sper
mid
ine
Syn
thas
es
calb_calb_20216_g40.1.p1.blastp_CANAL
calb_calb_20143_g19.1.p1_CANAL
Figure 4.6: Spermine/spermidine synthase tree, with sifter’s predictions overlaid. Thered stars indicate the locations of the two proteins with experimental evidence; the arrowspoint to the proteins from species discussed in the text.
129
Chapter 4. Fungal Genomes
lowed. Three possible reasons that the spermine synthase clade may be much smaller
than the spermidine synthase clade is that either the spermine synthases were lost at
a much higher rate, the spermine synthases underwent a functional mutation, or the
spermidine synthases were allowed to duplicate more easily. Since the small number
of spermine synthases appear to be almost entirely self-contained within a clade of
the species tree, it is possible that there were actually only a few gene losses in this
clade following the original gene duplication and subsequent functional mutation from
a spermidine synthase protein to a spermine synthase protein.
This may be an example of gene duplicability being positively correlated or uncor-
related with essentiality in this particular protein family, in contrast to some recent
studies that see a negative correlation between gene essentiality and duplicability
across a wide range of protein families (e.g., [He and Zhang, 2006]). Another in-
teresting follow-up experiment would be to test whether the subset of faster-evolving
spermidine synthase proteins, as indicated by longer branch lengths, are non-essential
in their associated species or have a distinct molecular function, both of which may
be indicated by their apparent faster rate of mutation.
4.3.4.4 Glycotransferase-34
Phylogenomic analysis of the glycotransferase 34 protein family gives some insight
into recent duplication events in this tree. Glycotransferase 34 proteins are involved
in a key post-translational modification required for protein secretion. This family
is interesting to study for two reasons. First, while different functional subtypes
have been identified, few members have experimentally determined function. Second,
the fungal organism Schizosaccharomyces pombe (which has a comparatively small
genome size) has seven proteins in its genome with a glycotransferase domain, whereas
most other fungal organisms have many fewer proteins with this domain. In addition
to the sifter analysis, we performed a blast analysis to briefly compare the two
130
Chapter 4. Fungal Genomes
methods and attempt to confirm sifter’s predictions.
Inspection of annotations retrieved from the GOA database shows that four pro-
teins in this tree contain experimentally supported functions (MNN10 YEAST,
MNN11 YEAST, GMA12 SCHPO, and GMH3 SCHPO); these annotations were con-
firmed through examination of associated literature references. We ran sifter on
the resulting reconciled tree using the set of experimental annotations; the recon-
ciled phylogeny and the sifter predictions are all illustrated in Figure 4.7. In this
figure we see that the S. pombe sequences are denoted with red stars: our phy-
logenomic analysis gives us the additional information that, of the seven S. pombe
glycotransferase 34 proteins, five are predicted to be in the smaller clade containing
alpha-1,2-galactosyltransferases, and are the result of three recent duplication events
(inparalogs).
For a second functional analysis, we applied blast to the collection of sequences
generated from the HMM search to perform pairwise annotation transfer for each
of the members of this family. On the set of 48 proteins in the family that are
contained in the UniProt database, blast failed to annotate three UniProt proteins,
Q4HU91 GIBZE, Q6C434 YARLI, and Q5BGV8 EMENI (no mannosyltransferase or
galactosyltransferase annotations for any proteins in the NR data set with an E-value
less than or equal to 0.01). The annotations derived from blast (including the three
unannotated proteins) differed from the sifter predictions for eleven proteins out of
the 48 UniProt proteins, or 23%, with one obvious clustering on the phylogeny of these
inconsistent predictions (the clade containing the UniProt proteins Q0U0N0 PHANO,
Q4HU91 GIBZE, and Q6C434 YARLI, all three of which are either not predicted by
blast or have inconsistent predictions between blast and sifter).
The phylogenomic analysis shed light on the important role of galactotransferase
proteins in S. pombe. One way in which S. pombe differs from S. cerevisiae is in
that its glycoproteins contain both D-mannose and D-galactose, whereas S. cerevisiae
Figure 4.7: Glycotransferase-34 tree, with sifter’s predictions overlaid. The red starsindicate the S. pombe proteins in this family.
132
Chapter 4. Fungal Genomes
glycoproteins contain only D-mannose. Thus, in order for protein glycosylation to
occur in S. pombe, protein galactosylation must be performed at various locations
in the cell. To facilitate this task, it appears that S. pombe duplicated additional
galactotransferases that localize to different areas of the cell and have distinct but
overlapping galactosylation functions [Yoko-o et al., 1998].
4.4 Conclusion
The sifter method was applied to perform phylogenomic analyses on all of the
protein families found in 46 fully-sequenced fungal genomes, resulting in 2389 protein
families run on sifter. We described the overall information gained from the sifter
predictions for these genomes. We present four specific examples of phylogenomic
analyses of individual protein families, illustrating the broad power of phylogenomic
analyses and phylogenomic functional prediction on a genomic scale.
133
Chapter 5
Thesis Conclusion
The goal of this thesis is to introduce a statistical method for protein molecular
function prediction, including motivating the model itself, presenting applications of
this method including a large-scale comparative genomic application, and describing
an extension to the basic model that enables active learning. In the Introduction, we
review the current literature on how and why molecular function evolves in proteins.
This review describes and motivates the phylogenomic methodology upon which we
develop the actual statistical method in Chapter 2.
In Chapter 2, we describe how we generate the input data from a database of func-
tional annotations and protein families, and we discuss the fundamentals of the model
and the semantics of the model parameters. We show how results from this method,
statistical inference of function through evolutionary relationships (sifter), com-
pare with the most frequently used method for protein function annotation, blast,
and two other function annotation methods, GOtcha and Orthostrapper. We show
the result of applying sifter to three protein families, the AMP/adenosine deam-
inase family, the sulfotransferase family, and the Nudix family, of which the latter
two are functionally diverse. For each of these three protein families, we assembled
134
Chapter 5. Thesis Conclusion
a gold-standard set of functional annotations derived from experimental methods
from a manual literature search. We present data to validate the truncation ap-
proximation for computing the posterior probability predictions on two families, the
AMP/adenosine deaminase family and the sulfotransferase family.
In Chapter 3, we motivate the development of an experimental design method to
extend sifter in terms of the actual cost of performing manual experiments. We
describe our simple, information theoretic metric for sequentially selecting a protein
to characterize that will maximally reduce prediction uncertainty for the unannotated
proteins in the family. We show the results of applying the experimental design to
three families with gold-standard molecular function annotation data sets, including
the AMP/adenosine deaminase family, the sulfotransferase family, and the amino-
transferase family. For the aminotransferase family, presented for the first time here,
we also include basic sifter results, and we compare our sequential selection of pro-
teins with the selection of proteins via an alterative method, and it appears that the
two method produce slightly anti-correlated results. Based on good results for the
AMP/adenosine deaminase family and the sulfotransferase family, and inconclusive
results for the aminotransferase family, we find that this type of active learning ap-
pears to work well in cases where the general phylogenomic technique works well.
Specifically, the experimental design appears to work well for single- and multifunc-
tion protein families of increasing functional diversity, but has similar difficulty as the
general phylogenomic method with sparse annotation data when there is extensive
parallel evolution in the family, as in the aminotransferases.
Chapter 4 describes a large-scale application of the sifter method to 46 fully-
sequenced fungal genomes. The main purpose of this exercise was to determine
whether sifter could be applied to genome-wide data sets. Sifter was applied
to this large data set and we describe the overall information gained from the brief
comparative genomic analysis of these genomes. We further present four examples of
135
Chapter 5. Thesis Conclusion
phylogenomic analyses on specific functional domains within this data set, illustrating
the broad power of phylogenomic analyses and also indicating the value of functional
prediction using phylogenomic analyses on a genome-wide scale.
In conclusion, this simple statistical model of the phylogenomic methodology is
effective and robust for molecular function prediction on both individual protein fam-
ilies and genome-wide data sets, and can be used to guide selection of proteins to
functionally characterize.
136
Bibliography
[Allai-Hassani et al., 2007] A Allai-Hassani, P W Pan, L Dombrovski, R Naj-manovich, W Tempel, A Dong, P Loppnau, F Martin, J Thonton, A M Edwards,A Bochkarev, A N Plotnikov, M Vedadi, and C H Arrowsmith. Structural andchemical profiling of human cytosolic sulfotransferases. PLoS Biology, 5(5):e97,April 2007.
[Alm et al., 2006] E Alm, K Huang, and A Arkin. The evolution of two-componentsystems in bacterial reveals different strategies for niche adaptation. PLoS Com-putational Biology, 2(11):e143, November 2006.
[Altschul et al., 1990] S F Altschul, W Gish, W Miller, E W Myers, and D J Lipman.Basic local alignment search tool. Journal of Molecular Biology, 215:403–410, 1990.
[Altschul et al., 1997] S F Altschul, T L Madden, A A Schaffer, J Zhang, Z Zhang,W Miller, and D J Lipman. Gapped BLAST and PSI-BLAST: a new generationof protein database search programs. Nucleic Acids Research, 25:3389–3402, 1997.
[Amoutzias et al., 2004] G D Amoutzias, D L Robertson, S G Oliver, andE Bornberg-Bauer. Convergent evolution of gene networks by single-gene dupli-cations in higher eukaryotes. European Molecular Biology Organization Reports,5(3):274–279, Feb 2004.
[Andreeva et al., 2004] A Andreeva, D Howorth, S E Brenner, T J P Hubbard,C Chothia, and A G Murzin. Scop database in 2004: refinements integrate struc-ture and sequence family data. Nucleic Acids Research, 32:D226–D229, 2004.
[Anisimova and Gascuel, 2006] M Anisimova and O Gascuel. Approximatelikelihood-ratio test for branches, a fast, accurate, and powerful alternative. Sys-tematic Biology, 55:539–552, 2006.
[Apweiler et al., 2004] R Apweiler, A Bairoch, C H Wu, W C Barker, B Boeckmann,S Ferro, E Gasteiger, H Huang, R Lopez, M Magrane, M J Martin, D A Natale,
137
BIBLIOGRAPHY
C O’Donovan, N Redaschi, and L S Yeh. UniProt: the universal protein knowl-edgebase. Nucleic Acids Research, 32(D):D115–D119, January 2004.
[Arvestad et al., 2003] L Arvestad, A C Berglund, J Lagergren, and B Sennblad.Bayesian gene/species reconciliation and orthology analysis using MCMC. Bioin-formatics, 19:i7–i15, 2003.
[Ashburner et al., 2000] M Ashburner, C A Ball, J A Blake, D Botstein, H Butler,J M Cherry, A P Davis, K Dolinski, S S Dwight, and J T Eppig. Gene ontology:Tool for the unification of biology. the gene ontology consortium. Nature Genetics,25:25–29, 2000.
[Ashby and Houmard, 2006] M K Ashby and J Houmard. Cyanobacterial two-component proteins: Structure, diversity, distribution, and evolution. Microbiologyand Molecular Biology Review, 70(2):472–509, June 2006.
[Atteson, 1997] K Atteson. The performance of the NJ method of phylogeny recon-struction. In S. Roberts and A. Rzhetsky, editors, Mathematical hierarchies andbiology, page 133, Providence, RI, 1997.
[Babushok et al., 2007] D V Babushok, E M Ostertag, and H H Kazazian. Currenttopics in genome evolution: Molecular mechanisms of new gene formation. Cellularand Molecular Life Sciences, 64(5):542–554, March 2007.
[Baker and Sali, 2001] D Baker and A Sali. Protein structure prediction and struc-tural genomics. Science, 294(5540):93–96, Oct 2001.
[Bateman et al., 2002] A Bateman, E Birney, L Cerruti, R Durbin, L Etwiller, S REddy, S Griffiths-Jones, K L Howe, M Marshall, and E L Sonnhammer. The Pfamprotein families database. Nucleic Acids Research, 30:276–280, 2002.
[Berglund-Sonnhammer et al., 2006] A-C Berglund-Sonnhammer, P Steffansson, M JBetts, and D A Liberles. Optimal gene trees from sequences and species trees usinga soft interpretation of parsimony. Journal of Molecular Evolution, 63(2):240–250,August 2006.
[Bergsten, 2005] J Bergsten. A review of long-branch attraction. Cladistics, 21:163–193, Feb 2005.
[Bertsekas, 1999] D P Bertsekas. Nonlinear Programming. Athena Scientific, NewHampshire, USA, 2nd edition, 1999.
138
BIBLIOGRAPHY
[Bessman et al., 1996] M J Bessman, D N Frick, and S F O’Handley. The MutTproteins or ”nudix” hydrolases, a family of versatile, widely distributed, ”house-cleaning” enzymes. J Biol Chem, 271(41):25059–25062, Oct 1996.
[Birney et al., 2004] E Birney, M Clamp, and R Durbin. GeneWise and genomewise.Genome Research, 14(5):988–995, 2004.
[Blount and Chatterjee, 1998] B Blount and S Chatterjee. An evaluation of java fornumerical computing. In ISCOPE, pages 35–46, 1998.
[Bongioanni et al., 1996] P Bongioanni, C Mondino, B Boccardi, M Borgna, andM Castagna. Monoamine oxidase molecular activity in platelets of parkinsonianand demented patients. Neurodegeneration, 5(4):339–350, December 1996.
[Bork and Koonin, 1998] P Bork and E V Koonin. Predicting functions from proteinsequences – where are the bottlenecks? Nature Genetics, 18:313–318, 1998.
[Bowman and Bertozzi, 1999] K G Bowman and C R Bertozzi. Carbohydrate sul-fotransferases: Mediators of extracellular communication. Chemistry & Biology,6:9–22, January 1999.
[Brenner, 1999] S E Brenner. Errors in genome annotation. Trends Genet, 15:132–133, 1999.
[Brown and Sjolander, 2006] D Brown and K Sjolander. Functional classification us-ing phylogenomic inference. PLoS Computational Biology, 2(6):e77, June 2006.
[Camon et al., 2004] E Camon, M Magrane, D Barrell, V Lee, E Dimmer, J Maslen,D Binns, N Harte, R Lopez, and R Apweiler. The gene ontology annotation (GOA)database: sharing knowledge in uniprot with gene ontology. Nucleic Acids Research,32:262–266, 2004.
[Cassola et al., 2004] A Cassola, M Parrot, S Silberstein, B B Magee, S Passeron,L Giasson, and M L Canatore. Candida albicans lacking the gene encoding theregulatory subunit of protein kinase a displays a defect in hyphal formation andan altered localization of the catalytic subunit. European Molecular Biology Orga-nization Journal, 3:190–199, 2004.
[Chai et al., 2002] W Chai, J G Beeson, and A Lawson. The structural motif inchondroitin sulfate for adhesion of Plasmodium falciparum-infected erythrocytescomprises disaccharide units of 4-o-sulfated and non-sulfated n-acetylgalactosaminelinked to glucuronic acid. Journal of Biological Chemistry, 277(25):22438–22446,June 2002.
139
BIBLIOGRAPHY
[Charlab et al., 2000] R Charlab, E D Rowton, and J M C Ribeiro. The salivaryadenosine deaminase from the sand fly. Experimental Parasitology, 95:45–53, 2000.
[Chattopadhyay et al., 2002] M K Chattopadhyay, C W Tabor, and H Tabor. Abso-lute requirement of spermidine for growth and cell cycle progression of fission yeastSchizosaccharomyces pombe. Proceedings of the National Academy of Science U SA, 99:10330–10334, 2002.
[Chen and Rost, 2002] C P Chen and B Rost. Long membrane helices and short loop.Protein Science, 11(12):2766–2773, Dec 2002.
[Chen et al., 2007] F Chen, A J Mackey, J K Vermunt, and D S Roos. Assessingperformance of orthology detection strategies applied to eukaryotic genomes. PLoSONE, 2(4):e383, Apr 2007.
[Choi and Lahn, 2003] S S Choi and B T Lahn. Adaptive evolution of MRG, aneuron-specific gene family implicated in nociception. Genome Research, 13:2252–2259, 2003.
[Conrad and Antonarakis, 2007] B Conrad and S E Antonarakis. Gene duplication:A drive for phenotypic diversity and cause of human disease. Annual Review ofGenomics and Human Genetics, 8(2):2.1–2.19, March 2007.
[Crosby et al., 2007] M A Crosby, J L Goodman, P Strelets, V B Zhang, W M Gel-bart, and the FlyBase Consortium. Flybase: genomes by the dozen. Nucleic AcidsResearch, 35:D486–D491, 2007.
[Dayhoff et al., 1978] M O Dayhoff, R M Schwartz, and Orcutt B C. A model ofevolutionary change in proteins. In MO Dayhoff, editor, Atlas of Protein Sequenceand Structure, pages 345–352, 1978.
[Decottignies et al., 2003] A Decottignies, I Sanchez-Perez, and P Nurse. Schizosac-charomyces pombe essential genes: A pilot study. Genome Research, 13:399–406,2003.
[Delsuc et al., 2005] F Delsuc, H Brinkmann, and H Philippe. Phylogenomics andthe reconstruction of the tree of life. Nature Reviews Genetics, 6(5):361–375, May2005.
[DeLuca et al., 2006] T F DeLuca, I H Wu, J Pu, T Monaghan, L Peshkin, S Singh,and D P Dennis. Roundup: a multi-genome repository of orthologs and evolution-ary distances. Bioinformatics, 22(16):2044–2046, Jun 2006.
140
BIBLIOGRAPHY
[Devos and Valencia, 2000] D Devos and A Valencia. Practical limits of functionprediction. Proteins, 41:98–107, 2000.
[Do et al., 2005] C B Do, M S P Mahabhashyam, M Brudno, and S Batzoglou. Prob-cons: probabilistic consistency-based multiple sequence alignment. Genome Re-search, 15:330–340, 2005.
[Eddy, 1998] S R Eddy. Profile hidden markov models. Bioinformatics, 14:755–763,1998.
[Edgar and Batzoglou, 2006] R C Edgar and S Batzoglou. Multiple sequence align-ment. Current Opinion in Structural Biology, 16:368–373, May 2006.
[Edgar and Sjolander, 2003] R C Edgar and K Sjolander. SATCHMO: sequencealignment and tree construction using hidden markov models. Bioinformatics,19:1404–1411, 2003.
[Edgar, 2004] R C Edgar. MUSCLE: multiple sequence alignment with high accuracyand high throughput. Nucleic Acids Research, 32:1792–1797, 2004.
[Eisen and Hanawalt, 1999] J A Eisen and P C Hanawalt. A phylogenomics study ofDNA repair genes, proteins, and processes. Mutation Research, 3:171–213, 1999.
[Eisen, 1998] J A Eisen. Phylogenomics: improving functional predictions for un-characterized genes by evolutionary analysis. Genome Research, 8:163–167, 1998.
[Engelhardt et al., 2005] B E Engelhardt, M I Jordan, K E Muratore, and S E Bren-ner. Protein molecular function prediction by bayesian phylogenomics. PLoS Com-putational Biology, 1:e45, 2005.
[Engelhardt et al., 2006] B E Engelhardt, M I Jordan, and S E Brenner. A graph-ical model for predicting protein molecular function. In Proceedings of the 23rdInternational Conference on Machine Learning (ICML), 2006.
[Engelhardt et al., submitted] B E Engelhardt, M I Jordan, and S E Brenner. Scalingsifter to annotate large, functionally diverse protein families. 1, submitted.
[Farris, 1982] J S Farris. Simplicity and informativeness in systematics and phylogeny.Systematic Zoology, 31(4):413–444, 1982.
[Felsenstein, 1978] J Felsenstein. Cases in which parsimony or compatability methodswill be positively misleading. Systematic Zoology, 27:401–410, 1978.
[Felsenstein, 1985] J Felsenstein. Confidence limits on phylogenies: an approach usingthe bootstrap. Evolution, 39:783–791, 1985.
[Ferreira et al., 2005] M E Ferreira, A L Colombo, I Paulsen, Q Ren, J Wortman,J Huang, M H Goldman, and G H Goldman. The ergosterol biosynthesis pathway,transporter genes, and azole resistance in Aspergillus fumigatus. Medical Mycology,43(S1):S313–S319, 2005.
[Feyzi et al., 1998] E Feyzi, T Saldeen, E Larsson, U Lindahl, and M Salmivirta.Age-dependent modulation of heparan sulfate structure and function. Journal ofBiological Chemistry, 273(22):13395–13398, May 1998.
[Fisher, 1930] R A Fisher. The Genetical Theory of Natural Selection. The ClarendonPress, 1930.
[Fitzpatrick et al., 2006] D A Fitzpatrick, M E Logue, J E Stajich, and G Butler.A fungal phylogeny based on 42 complete genomes derived from supertree andcombined gene analysis. BMC Evolutionary Biology, 6:99–114, 2006.
[Force et al., 1999] A Force, M Lynch, F B Pickett, A Amores, Y Yan, and J Postelth-wait. Preservation of duplicate genes by complementary, degenerative mutations.Genetics, 151:1531–1545, April 1999.
[Fraser et al., 2002] H B Fraser, A E Hirsh, L M Steinmetz, C Scharfe, and M WFeldman. Evolutionary rate in the protein interaction network. Science, 296:750–752, 2002.
[Freund et al., 1997] Y Freund, H S Seung, E Shamir, and N Tishby. Selective sam-pling using the query by committee algorithm. Machine Learning, 28(2-3):133–168,1997.
[Galperin and Koonin, 1998] M Y Galperin and E V Koonin. Sources of systematicerror in functional annotation of genomes: domain rearrangement, non-orthologousgene displacement, and operon disruption. In silico Biology, 1:55–67, 1998.
[Galperin et al., 2006] M Y Galperin, O V Moroz, K S Wilson, and A G Murzin.House cleaning, a part of good housekeeping. Mol Microbiol, 59:5–19, 2006.
[Garcia-Hernandez et al., 2002] M Garcia-Hernandez, T Z Berardini, G Chen,D Crist, A Doyle, E Huala, E Knee, M Lambrecht, N Miller, L A Mueller,
142
BIBLIOGRAPHY
S Mundodi, L Reiser, S Y Rhee, R Scholl, J Tacklind, D C Weems, Y Wu, I Xu,D Yoo, J Yoon, and P Zhang. Tair: a resource for integrated arabidopsis data.Functional and Integrative Genomics, 2(6):239, 2002.
[Geer et al., 2002] L Y Geer, M Domrachev, D J Lipman, and S H Bryant. Cdart:Protein homology by domain architecture. Genome Research, 12:1619–1623, 2002.
[Gelman et al., 2003] A Gelman, J B Carlin, H S Stern, and D B Rubin. BayesianData Analysis. Chapman & Hall/CRC, second edition, 2003.
[Gessner, 1997] M O Gessner. Fungal biomass, production and sporulation associatedwith particulate organic matter in streams. Limnetica, 13:33–44, 1997.
[Gibbs et al., 2006] T T Gibbs, S J Russek, and D H Farb. Sulfated steroids as en-dogenous neuromodulators. Pharmacology, Biochemistry and Behavior, 84(4):555–567, Oct 2006.
[Glasner et al., 2007] M E Glasner, J A Gerlt, and P C Babbitt. Mechanisms of pro-tein evolution and their application to protein engineering. Advances in Enzymologyand Related Areas of Molecular Biology, 75:193–239, 2007.
[Goodman et al., 1979] M Goodman, J Cselusniak, GW Moore, AE Romero-Herrera,and G Matsuda. Fitting the gene lineage into its species lineage: a parsimonystrategy illustrated by cladograms constructed from globin sequences. SystematicZoology, 28:132–168, 1979.
[Gu, 2003] X Gu. Evolution of duplicate genes versus genetic robustness against nullmutations. Trends in Genetics, 19:354–356, 2003.
[Guindon and Gascuel, 2003] S Guindon and O Gascuel. A simple, fast, and accu-rate algorithm to estimate large phylogenies by maximum likelihood. SystematicBiology, 52(5):696–704, 2003.
[Hahn et al., 2005] M W Hahn, T De Bie, J E Stajich, C Nguyen, and N Cristianini.Estimating the tempo and mode of family evolution from comparative genomicdata. Genome Research, 15:1153–1160, 2005.
[Hall, 2005] B G Hall. Comparison of the accuracies of several phylogenetic methodsusing protein and DNA sequences. Molecular Biology and Evolution, 22(3):792–802,2005.
[Hamasaki-Katagiri et al., 1997] N Hamasaki-Katagiri, C W Tabor, and H Tabor.Spermidine biosynthesis in Saccharomyces cerevisae: polyamine requirement of anull mutant of the SPE3 gene (spermidine synthase). Gene, 187(1):35–43, 1997.
143
BIBLIOGRAPHY
[Hamasaki-Katagiri et al., 1998] N Hamasaki-Katagiri, Y Katagiri, C W Tabor, andH Tabor. Spermine is not essential for growth of Saccharomyces cerevisiae: Iden-tification of the SPE4 gene (spermine synthase) and characterization of a SPE4deletion mutant. Gene, 210(2):195–201, 1998.
[Hanks et al., 1988] S K Hanks, A M Quinn, and T Hunter. The protein kinase fam-ily: conserved features and deduced phylogeny of the catalytic domains. Science,241(4861):42–52, 1988.
[Hawksworth, 2004] D L Hawksworth. Fungal diversity and its implication for geneticresource collections. Studies in Mycology, 50:9–18, 2004.
[He and Zhang, 2006] X He and J Zhang. Higher duplicability of less important genesin yeast genomes. Molecular Biology and Evolution, 23(1):144–151, January 2006.
[Henikoff and Henikoff, 1992] S Henikoff and J G Henikoff. Amino acid substitutionmatrices from protein blocks. Proceedings of the National Academy of Science U SA, 89(22):10915–10919, November 1992.
[Hirschhorn and Ellenbogen, 1986] R Hirschhorn and A Ellenbogen. Genetic hetero-geneity in adenosine deaminase (ADA) deficiency: five different mutations in fivenew patients with partial ADA deficiency. American Journal of Human Genetics,38:13–25, 1986.
[Hirsh and Fraser, 2001] A E Hirsh and H B Fraser. Protein dispensibility and rateof evolution. Nature, 411:1046–1049, Jun 2001.
[Hollich et al., 2005] V Hollich, L Milchert, L Arvestad, and E L L Sonnhammer. As-sessment of protein distance measures and tree-building methods for phylogenetictree reconstruction. Molecular Biology and Evolution, 22:2257–2264, 2005.
[Hubbard et al., 2006] T J Hubbard, B L Aken, K Beal, B Ballester, M Caccamo,Y Chen, L Clarke, G Coates, F Cunningham, T Cutts, T Down, S C Dyer,S Fitzgerald, J Fernandez-Banet, S Graf, S Haider, M Hammond, J Herrero, R Hol-land, K Howe, K Howe, N Johnson, A Kahari, D Keefe, F Kokocinski, E Kule-sha, D Lawson, I Longden, C Melsopp, K Megy, P Meidl, B Ouverdin, A Parker,A Prlic, S Rice, D Rios, M Schuster, I Sealy, J Severin, G Slater, D Smedley,G Spudich, S Trevanion, A Vilella, J Vogel, S White, M Wood, T Cox, V Curwen,R Durbin, X M Fernandez-Suarez, P Flicek, A Kasprzyk, G Proctor, S Searle,J Smith, A Ureta-Vidal, and E Birney. Ensembl 2007. Nucleic Acids Research,page epub, Dec 2006.
144
BIBLIOGRAPHY
[Huelsenbeck and Ronquist, 2001] J P Huelsenbeck and F Ronquist. MrBayes:Bayesian inference of phylogenetic trees. Bioinformatics, 17:754–755, 2001.
[Huelsenbeck, 1995] J P Huelsenbeck. Performance of phylogenetic methods in sim-ulation. Systems Biology, 44(1):17–48, Mar 1995.
[Hurst and Smith, 1999] L D Hurst and N G Smith. Do essential genes evolve slowly?Current Biology, 9:747–750, 1999.
[Iyer et al., 2002] L M Iyer, E Koonin, and L Aravind. Extensive domain shuffling intranscription regulators of DNA viruses and implications for the origin of fungalAPSES transcription factors. Genome Biology, 3:12.1 – 12.11, 2002.
[James and et al, 2006] T Y James and et al. Reconstructing the early evolution offungi using a six-gene phylogeny. BMC Evolutionary Biology, 443(7113):818–822,2006.
[Jeong et al., 2001] H Jeong, S P Mason, A L Barabasi, and Z N Oltvai. Lethalityand centrality in protein networks. Nature, 411:41–42, May 2001.
[Jordan, 2004] M I Jordan. An Introduction to Probabilistic Graphical Models. to bepublished, 2004.
[Katoh et al., 2002] K Katoh, K Misawa, K Kuma, and T Miyata. Mafft: a novelmethod for rapid multiple sequence alignment based on fast fourier transform.Nucleic Acids Research, 30:3059–3066, 2002.
[Kellis et al., 2004] M Kellis, B W Birren, and E S Lander. Proof and evolution-ary analysis of ancient genome duplication in the yeast Saccharomyces cerevisiae.Nature, 428:617–624, 2004.
[Koonin et al., 1996] EV Koonin, RL Tatusov, and KE Rudd. Protein sequence com-pairson at genome scale. Methods in Enzymology, 266:295–322, 1996.
[Koonin et al., 2001] E V Koonin, K S Makarova, and L Aravind. Horizontal genetransfer in prokaryotes: quantification and classification. Annual Reviews of Mi-crobiology, 55:709–742, 2001.
[Koonin, 1993] E V Koonin. A highly conserved sequence motif defining the familyof MutT-related proteins from eubacteria, eukaryotes, and viruses. Nucleic AcidsResearch, 21:4847, 1993.
[Krishnamurthy et al., 2007] N Krishnamurthy, D Brown, and K Sjolander. Flower-power: clustering proteins into domain architecture classes for phylogenomic infer-ence of protein function. BMC Evolutionary Biology, 7(S1):S12, Feb 2007.
145
BIBLIOGRAPHY
[Krissinel, 2007] E Krissinel. On the relationship between sequence and structuralsimilarities in proteomics. Bioinformatics, 23(6):717–723, Jan 2007.
[Krylov et al., 2003] D M Krylov, Y I Wolf, I B Rogozin, and Koonin E V. Gene loss,protein sequence divergence, gene dispensability, expression level, and interactivityare correlated in eukaryotic evolution. Genome Research, 13:2229–2235, 2003.
[Kuhner and Felsenstein, 1994] M K Kuhner and J Felsenstein. A simulation compar-ison of phylogeny algorithms under equal and unequal evolutionary rates. MolecularBiology and Evolution, 11:459–468, 1994.
[Kummerfeld et al., 2004] S K Kummerfeld, C Vogel, M Madera, M Pacold, and S ATeichmann. Evolution of multi-domain proteins by gene fusion and fission. In 12thInternational Conference on Intelligent Systems in Molecular Biology, Aug 2004.
[Laplazaa et al., 2006] J M Laplazaa, B R Torres, Y-S Jinc, and T J Jeffries. Shble and cre adapted for functional genomics and metabolic engineering of Pichiastipitis. Enzyme and Microbial Technology, 38:741–747, 2006.
[Lee et al., 2002] Y Lee, R Sultana, G Pertea, J Cho, S Karamycheva, J Tsai,B Parvizi, F Cheung, V Antonescu, J White, I Holt, F Liang, and J Quacken-bush. Cross-referencing eukaryotic genomes: TIGR orthologous gene alignments(TOGA). Genome Research, 12:493–502, 2002.
[Lewis and Catlett, 1994] D D Lewis and J Catlett. Heterogeneous uncertainty sam-pling for supervised learning. In William W. Cohen and Haym Hirsh, editors, Pro-ceedings of ICML-94, 11th International Conference on Machine Learning, pages148–156, New Brunswick, US, 1994. Morgan Kaufmann Publishers, San Francisco,US.
[Li et al., 2003] L Li, C J Stoeckert, and D S Roos. OrthoMCL: idenfication ofortholog groups for eukaryotic genomes. Genome Research, 13(9):2178–2189, 2003.
[Liu and Grigoriev, 2004] M Liu and A Grigoriev. Protein domains correlate stronglywith exons in multiple eukaryotic genomes – evidence of exon shuffling? Trends inGenetics, 20(9):399–403, September 2004.
[Lopez-Errasquin et al., 2006] E Lopez-Errasquin, M T Golzales-Jaen, C Callejas,and C Vazquez. A novel MFS transporter encoding gene in Fusarium verticil-lioides probably involved in iron-siderophore transport. Mycological Research,110(9):1102–1110, 2006.
[Lynch and Force, 2000] M Lynch and A Force. The probability of duplicate genepreservation by subfunctionalization. Genetics, 154:459–473, January 2000.
146
BIBLIOGRAPHY
[MacKay, 1992] D MacKay. Information-based objective functions for active dataselection. Neural Computation, 4(4):590–604, 1992.
[Mackey et al., 2007] A J Mackey, Q Liu, F C Pereira, and D S Roos. GLEAN:Improved eukaryotic gene prediction by statistical consensus of gene evidence. inpreparation, 2007.
[Madern, 2002] D Madern. Molecular evolution within the l-malate and l-lactatedehydrogenase super-family. Journal of Molecular Evolution, 54(6):825–840, 2002.
[Maier et al., 2001] S A Maier, L Podemski, S W Graham, H E McDermid, andJ Locke. Characterization of the adenosine deaminase-related growth factor(ADGF) gene family in Drosophila. Gene, 280:27–36, 2001.
[Maier et al., 2005] S A Maier, J R Galellis, and H E McDermid. Phylogenetic anal-ysis reveals a novel protein family closely related to adenosine deaminase. Journalof Molecular Evolution, 61(6):776–794, Dec 2005.
[Mar et al., 2005] J C Mar, T J Harlow, and M A Ragan. Bayesian and maximumlikeihood phylogenetic analyses of protein sequence data under relative branch-length differences and model violation. BMC Evolutionary Biology, 5:8–27, 2005.
[Marchler-Bauer et al., 2002] A Marchler-Bauer, A R Panchenko, B A Shoemaker,P A Thiessen, L Y Geer, and S H Bryant. CDD: A database of conserved do-main alignments with links to domain three-dimensional structure. Nucleic AcidsResearch, 30:281–283, 2002.
[Martin et al., 2004] D M A Martin, M Berriman, and G J Barton. Gotcha: a newmethod for prediction of protein function assessed by the annotation of sevengenomes. BMC Bioinformatics, 5:178–195, 2004.
[McLennan, 2006] A G McLennan. The nudix hydrolase superfamily. Cell Mol LifeSci, 63:123–143, 2006.
[Mildvan et al., 2005] A S Mildvan, Z Xia, H F Azurmendi, V Saraswat, P M Legler,M A Massiah, S B Gabelli, M A Bianchet, L-W Kang, and L M Amzel. Structuresand mechanisms of nudix hydrolases. Arch Biochem Biophys, 433:129–143, 2005.
[Mougous et al., 2004] J D Mougous, C J Petzold, R H Senaratne, D H Lee, D LAkey, F L Lin, S E Munchel, M R Pratt, L W Riley, J A Leary, J M Berger, andC R Bertozzi. Identification, function and structure of the mycobacterial sulfo-transferase that initiates sulfolipid-1 biosynthesis. Nature Structural & MolecularBiology, 11:721–729, August 2004.
147
BIBLIOGRAPHY
[Mugridge et al., 2000] N B Mugridge, D A Morrison, T Jakel, A R Heckeroth, A MTenter, and A M Johnson. Effects of sequence alignment and structural domainsof ribosomal DNA on phylogeny reconstruction for the protozoan family Sarcocys-tidae. Molecular Biology and Evolution, 17(12):1843–1853, 2000.
[Mulder et al., 2007] N J Mulder, R Apweiler, T K Attwood, A Bairoch, A Bateman,D Binns, P Bork, V Buillard, L Cerutti, R Copley, E Courcelle, U Das, L Daugh-erty, M Dibley, R Finn, W Fleischmann, J Gough, D Haft, N Hulo, S Hunter,D Kahn, A Kanapin, A Kejariwal, A Labarga, P S Langendijk-Genevaux, D Lons-dale, R Lopez, I Letunic, M Madera, J Maslen, C McAnulla, J McDowall, J Mistry,A Mitchell, A N Nikolskaya, S Orchard, O Orengo, R Petryszak, J D Selengut,C J A Sigrist, P D Thomas, F Valentin, D Wilson, C H Wu, and C Yeats. Newdevelopments in the InterPro database. Nucleic Acids Research, 35:D224–D228,Jan 2007.
[Muratore et al., 2007] K E Muratore, J R Srouji, M A Chow, and J F Kirsch. Recom-binant expression of twelve evolutionary diverse subfamily Iα aminotransferases.Protein Expression and Purification, 2007.
[Nembaware et al., 2002] V Nembaware, K Crum, J Kelso, and C Seoighe. Impact ofthe presence of paralogs on sequence divergence in a set of mouse-human orthologs.Genome Research, 12:1370–1376, 2002.
[O’Brien et al., 2005] K P O’Brien, M Remm, and E L L Sonnhammer. Inparanoid: acomprehensive database of eukaryotic orthologs. Nucleic Acids Research, 33:D476–D480, January 2005.
[Ohama et al., 1993] T Ohama, T Suzuki, M Mori, S Osawa, T Ueda, K Watanabe,and T Nakase. Non-universal decoding of the leucine codon CUG in several Candidaspecies. Nucleic Acids Research, 21(17):4039–4045, 1993.
[Ohno, 1972] S Ohno. Evolution by Gene Duplication. Springer-Verlag, 1972.
[Page, 1998] R D M Page. Genetree: comparing gene and species phylogenies usingreconciled trees. Bioinformatics, 14:819–820, 1998.
[Pal et al., 2003] C Pal, B Papp, and I D Hurst. Genomic function: rate of evolutionand gene dispensibility. Nature, 421:496–497, 2003.
[Pasek et al., 2006] S Pasek, J-L Risler, and P Brezellec. Gene fusion/fission is amajor contributor to evolution of multi-domain bacterial proteins. Bioinformatics,22(12):1418–1423, 2006.
148
BIBLIOGRAPHY
[Pegg et al., 2006] S C Pegg, S D Brown, S Ojha, J Seffernick, E C Meng, J HMorris, P J Chang, C C Huang, T E Ferrin, and P C Babbitt. Leveraging enzymestructure-function relationships for functional inference and experimental design:the structure-function linkage database. Biochemistry, 45(8):2545–2555, Feb 2006.
[Perez-Martin et al., 1999] J Perez-Martin, J A Uria, and A D Johnson. Phenotypicswitching in Candida albicans is controlled by a SIR2 gene. European MolecularBiology Organization Journal, 18:2580–2592, 1999.
[Porat et al., 2005] Z Porat, N Wender, O Erez, and C Kahana. Mechanism ofpolyamine tollerance in yeast: novel regulators and insights. Cellular and MolecularLife Sciences, 62(24):3016–3116, 2005.
[Pronzato, 2000] L Pronzato. Adaptive optimization and d-optimum experimentaldesign. The Annals of Statistics, 28(6):1743–1761, 2000.
[Ranatunga et al., 2004] W Ranatunga, E E Hill, J L Mooster, E L Holbrook,U Schulze-Gahmen, W L Xu, M J Bessman, S E Brenner, and S R Holbrook.Structural studies of the nudix hydrolase dr1025 from Deinococcus radioduransand its ligand complexes. Journal of Molecular Biology, 339:103–116, 2004.
[Reeck et al., 1987] G R Reeck, C de Haen, D C Teller, R F Doolittle, W M Fitch,R E Dickerson, P Chambon, A D McLachlan, E Margoliash, and T H Jukes.”Homology” in proteins and nucleic acids: a terminology muddle and a way out ofit. Cell, 50:667, 1987.
[Remm et al., 2001] M Remm, C E Storm, and E L Sonnhammer. Automatic clus-tering of orthologs and in-paralogs from pairwise species comparisons. Journal ofMolecular Biology, 314(5):1041–1052, December 2001.
[Ribard et al., 2003] C Ribard, M Rochet, B Labedan, B Daignan-Fornier, P Alzari,C Scazzocchio, and N Oestreicher. Sub-families of alpha/beta barrel enzymes: anew adenine deaminase family. Journal of Molecular Biology, 334:1117–1131, 2003.
[Rocha and Danchin, 2004] E P Rocha and A Danchin. An analysis of determinantsof amino acid substitution rates in bacterial proteins. Molecular Biology and Evo-lution, 21(1):108–116, Jan 2004.
[Roth et al., 2007] C Roth, S Rastogi, L Arvestad, K Dittmar, S Light, D Ekman,and D Liberles. Evolution after gene duplication: Models, mechanisms, sequences,systems, and organisms. Journal of Experimental Zoology (Molecular Developmentand Evolution), 306B:58–73, 2007.
149
BIBLIOGRAPHY
[Saier, 1996] M H Saier. Phylogenetic approaches to the identification and charac-terization of protein families and superfamilies. Microbial Comparative Genomics,1(3):129–150, 1996.
[Salamov and Solovyev, 2000] A A Salamov and V V Solovyev. Ab initio gene findingin drosophila genomic dna. Genome Research, 10(4):516, 2000.
[Sasaki et al., 1995] J Sasaki, L S Brown, Y S Chon, H Kandori, A Maeda, R Needle-man, and J K Lanyi. Conversion of bacteriorhodopsin into a chloride ion pump.Science, 269:73–75, Jul 1995.
[Scheibel et al., 1998] T Scheibel, T Weikl, and J Buchner. Two chaperone sites inHsp90 differing in substrate specificity and atp dependence. Proceedings of theNational Academy of Sciences U S A, 95:1495–1499, 1998.
[Schmit and Mueller, 2007] J Schmit and G Mueller. An estimate of the lower limitof global fungal diversity. Biodiversity and Conservation, 16:99–111, 2007.
[Schwarz et al., 2006] E M Schwarz, I Antoshechkin, C Bastiani, T Bieri, D Blasiar,P Canaran, J Chan, N Chen, W J Chen, P Davis, T J Fiedler, L Girard, T WHarris, E E Kenny, R Kishore, D Lawson, R Lee, H-M Muller, C Nakamura,P Ozersky, A Petcherski, A Rogers, W Spooner, M A Tuli, K Van Auken, D Wang,R Durbin, J Spieth, Stein L D, and P W Sternberg. Wormbase: better software,richer content. Nucleic Acids Research, 34:D475–478, 2006.
[Searls, 2003] D B Searls. Pharmacophylogenomics: Genes, evolution and drug tar-gets. Nature Reviews, 2(8):613–623, 2003.
[Semba et al., 2006] S Semba, S-Y Han, H R Qin, K A McCorkell, D Iliopoulous,Y Pekarsky, T Druck, F Trapasso, C M Croce, and K Huebner. Biologicalfunctions of the mammalian Nit1, the counterpart of the invertebrate NitFhitrosetta stone protein, a possible tumor supressor. Journal of Biological Chemistry,281(38):28244–28253, Sep 2006.
[Seung et al., 1992] H S Seung, M Opper, and H Sompolinsky. Query by committee.In Morgan Kaufmann, editor, Fifth Workshop on Computational Learning Theory,pages 287–294, 1992.
[Sheehan et al., 2007] M J Sheehan, L M Kennedy, D E Costich, and T P Brutnell.Subfunctionalization of PhyB1 and PhyB2 in the control of seedling and matureplant traits in maize. The Plant Journal, 49(2):338–353, January 2007.
[Shimodaira, 2002] H Shimodaira. An approximately unbiased test of phylogenetictree selection. Systems Biology, 51:492–508, 2002.
150
BIBLIOGRAPHY
[Sjolander, 2004] K Sjolander. Phylogenomics inference of protein molecular function:advances and challenges. Bioinformatics, 20:170–179, 2004.
[Sriram et al., 2005] G Sriram, J A Martinez, E R B McCabe, and K M Dipple.Single-gene disorders: what role could moonlighting enzymes play? AmericanJournal of Human Genetics, 76:911–924, 2005.
[Stajich, 2006] J E Stajich. A comparative genomic investigation of fungal genomeevolution. PhD thesis, Duke University, 2006.
[Storm and Sonnhammer, 2002] C E Storm and E L Sonnhammer. Automated or-tholog inference from phylogenetic trees and calculation of ortholog reliability.Bioinformatics, 18:92–99, 2002.
[Straney et al., 2002] D Straney, R Khan, R Tan, and S Bagga. Host recognition bypathogenic fungi through plant flavonoids. Advances in Experimental Medicine andBiology, 505:9–22, 2002.
[Swofford, 2001] D Swofford. PAUP∗: Phylogenetic Analysis Using Parsimony (*andother methods). Sinauer Associates, 2001.
[Tachihara et al., 2005] K Tachihara, T Uemura, K Kashiwagi, and K Igarashi. Ex-cretion of putrescine and spermidine by the protein encoded by ykl174c (tpo5)in Saccharomyces cerevisiae. The Journal of Biological Chemistry, 280(13):12637–12642, 2005.
[Tagaya et al., 1997] Y Tagaya, G Kurys, T A Thies, J M Losi, N Asimi, J A Hanover,R N Bamford, and T A Waldmann. Generation of secretable and nonsecretableinterleukin 15 isoforms through alternate usage of signal peptides. Proceedings ofthe National Academy of Sciences U S A, 94(26):14444–14449, Dec 1997.
[Tateno et al., 1994] Y Tateno, N Takezaki, and M Nei. Relative efficiencies of themaximum-likelihood, neighbor-joining, and maximum-parsimony methods whensubstitution rate varies with site. Molecular Biology and Evolution, 11:261–277,1994.
[Tatusov et al., 1997] R L Tatusov, E V Koonin, and D J Lipman. A genomic per-spective on protein families. Science, 278:631–637, 1997.
[Tatusov et al., 2000] R L Tatusov, M Y Galperin, D A Natale, and E V Koonin. Thecog database: a tool for genome-scale analysis of protein functions and evolution.Nucleic Acids Research, 28:33–36, 2000.
151
BIBLIOGRAPHY
[Thomas et al., 2006] J A Thomas, J J Welch, M Wollfit, and L Bromhan. There isno universal molecular clock for invertebrates, but rate variation does not scale withbody size. Proceedings of the National Academy of Sciences, 103(19):7366–7371,May 2006.
[Thompson et al., 1999] J D Thompson, F Plewniak, and O Poch. A comprehensivecomparison of multiple sequence alignment programs. Nucleic Acids Research,27(13):2682–2690, 1999.
[Thornton and LaSalle, 2000] J A Thornton and R LaSalle. Gene family evolutionand homology: genomics meets phylogenetics. Annual Review of Genomics andHuman Genetics, 1:41–73, 2000.
[Torgerson and Singh, 2004] D G Torgerson and R S Singh. Rapid evolution throughgene duplication and subfunctionalization of the testes-specific α4 proteasome sub-units in drosophila. Genetics, 168(3):1421–1432, November 2004.
[UniprotConsortium, 2007] UniprotConsortium. The universal protein resource(uniprot). Nucleic Acids Research, 35:D193–197, Jan 2007.
[van der Heijden et al., 2007] R T J M van der Heijden, Snel B, V van Noort, andM A Huynen. Orthology prediction at scalable resolution by phylogenetic treeanalysis. BMC Bioinformatics, 8(83–94):83, Mar 2007.
[Wall et al., 2005] D P Wall, A E Hirsh, H B Fraser, J Kumm, G Giaever, M B Eisen,and M W Feldman. Functional genomic analysis of the rates of protein evolution.Proceedings of the National Academy of Sciences, U S A, 102:5483–5488, 2005.
[Wilson et al., 1977] A C Wilson, S S Carlson, and T J White. Biochemical evolution.Annual Reviews in Biochemistry, 46:573–639, 1977.
[Wong et al., 1992] S H Wong, S H Low, and W Hong. The 17-residue transmembranedomain of b-galactoside a2,6-sialyltransferase is sufficient for golgi retention. TheJournal of Cell Biology, 117(2):245–258, Apr 1992.
[Wu et al., 1999] G Wu, A Fiser, B ter Kuile, A Sali, and M Muller. Convergent evo-lution of Trichomonas vaginalis lactate dehydrogenase from malate dehydrogenase.Proceeding of the National Academy of Sciences, U S A, 96:6285–6290, 1999.
[Yang et al., 2003a] J Yang, Z Gu, and W-H Li. Rate of protein evolution versusfitness effect of gene deletion. Molecular Biology and Evolution, 20(5):771–774,2003.
152
BIBLIOGRAPHY
[Yang et al., 2003b] J Yang, R Lusk, and W-H Li. Organismal complexity, proteincomplexity, and gene duplicability. Proceedings of the National Academy of SciencesU S A, 100(26):15661–16665, Dec 2003.
[Yoko-o et al., 1998] T Yoko-o, S K Roy, and Y Jigami. Differences in in vivo acceptorspecificity of two galactosyltransferases, the gmh3+ and gma12+ gene productsfrom Schizosaccharomyces pombe. European Journal of Biochemistry, 257(3):630–637, Nov 1998.
[Yooseph et al., 2007] S Yooseph, G Sutton, D B Rusch, A L Halpern, S JWilliamson, K Remington, J A Eisen, K B Heidelberg, G Manning, W Li,L Jaroszewski, P Cieplak, C S Miller, H Li, S T Mashiyama, M P Joachimiak,C van Belle, J M Chandonia, D A Soergel, Y Zhai, K Natarajan, S Lee, B JRaphael, V Bafna, R Friedman, S E Brenner, A Godzik, D Eisenberg, J E Dixon,S S Taylor, R L Strausberg, M Frazier, and J C Venter. The Sorcerer II globalocean sampling expedition: Expanding the universe of protein families. PLoS Bi-ology, 5(3):e16, March 2007.
[Zmasek and Eddy, 2001a] C M Zmasek and S R Eddy. A simple algorithm to infergene duplication and speciation events on a gene tree. Bioinformatics, 17:821–828,2001.
[Zmasek and Eddy, 2001b] C M Zmasek and S R Eddy. ATV: display and manipu-lation of annotated phylogenetic trees. Bioinformatics, 17:383–384, 2001.
[Zmasek and Eddy, 2002] C M Zmasek and S R Eddy. RIO: Analyzing proteomes byautomated phylogenomics using resampled inference of orthologs. BMC Bioinfor-matics, 3:14, 2002.