44
September 2017 Barclays Energy IPO Summit

September 2017
Barclays Energy IPO Summit

1
Statements made in these presentation slides and by representatives of Chaparral Energy (“Chaparral” or the “company”) during the course of this presentation that are not historical facts are “forward-looking statements.” These statements are based on certain assumptions and expectations made by the company, which reflect management’s experience, estimates and perception of historical trends, current conditions and anticipated future developments. Such statements are subject to a number of assumptions, risks and uncertainties, many of which are beyond the control of the company, which may cause actual results to differ materially from those implied or anticipated in the forward-looking statements. These include risks relating to financial performance and results, ability to improve our financial results and profitability following emergence from bankruptcy, availability of sufficient cash flow to execute our business plan, continued low or further declining commodity prices and demand for oil, natural gas and natural gas liquids, ability to hedge future production, ability to replace reserves and efficiently develop current reserves and the regulatory environment and other important factors that could cause actual results to differ materially from those anticipated or implied in the forward-looking statements. These and other important factors could cause actual results to differ materially from those anticipated or implied in the forward-looking statements. Please read “risk factors” in the company’s annual reports on form 10-K, quarterly reports on form 10-Q and other public filings. We undertake no obligation to publicly update any forward-looking statements, whether as a result of new information or future events.
Forward-Looking Statements and Risk Factors
Forward-Looking Statements and Risk Factors

General Overview

3
• Transforming into a premier pure-play STACK company
• Approximately 110,000 net acres• Strong pipeline of economic opportunities• Solid operating margins and returns, even in a
volatile commodity price environment
• Keys to superior performance• Strong assets – focused STACK player• Low-cost structure• Operational excellence• Prioritizing environmental, health and safety• Premier operating team
• Strong foundation capable of excelling in a $40 -$60 per barrel environment
Strong Assets, Low Cost Structure and Experienced Leadership with a Vision for Success
The New Chaparral

4
• Emerged from restructuring with a strong balance sheet• Equitized $1.2 billion in debt and reduced annual interest expense by
$110 million • Enterprise Value of approximately $1.2 billion • Post Emergence Debt/Adjusted LTM EBITDA of approximately 1.4x
• Recruited new, independent board with extensive industry experience
• Achieved total net production of 23.9 MBoe/d Q2 2017• 57% oil, 16% NGLs and 27% natural gas• 17% year-over-year increase in STACK production
• Maintained industry leading cost reductions in 2017• LOE/Boe of $3.87/Boe in Q2 2017 in the STACK• Significant G&A cost reductions
• Currently marketing EOR assets and other minor non-core assets
• Stock trading on the OTCQB market under the symbol CHPE
Continued Operational Excellence During Restructuring
Recent Achievements

5
74%
17%
9%
74% Oil, 83% Liquids
OIL GAS NGL
YE ‘16 Total Proved Reserves YE ‘16 Proved Reserves PV-10 Value
Reserve Category
Net Oil (MMBo) Net Gas (BCF) Net NGL (MMBo)
Net (MMBoe)
% of Total Proved
SEC Pricing(1)
$50.00 & $3.00
StripPricing(2)
$60.00 & $3.50
PDP 27.9 106.3 9.3 54.9 42% 408.6 560.6 533.3 768.8
PNP 0.7 2.5 0.0 1.1 1% 6.7 9.7 9.4 14.5PUD 68.0 26.6 2.8 75.2 57% 113.5 247.8 249.7 433.2Total Proved 96.6 135.4 12.1 131.3 100% 528.8 818.1 792.4 1,216.5
STACK 11.8 71.2 7.1 30.8 23% 151.7 211.7 204.0 289.9
EOR 72.2 0.0 0.0 72.2 55% 216.1 379.6 369.9 609.3OTHER 12.6 64.3 5.0 28.3 22% 160.9 226.7 218.4 317.2Total Proved 96.6 135.4 12.1 131.3 100% 528.8 818.1 792.4 1,216.5(1) At year-end 2016 SEC prices of $42.75 and $2.49(2) At NYMEX prices from August 28th, 2017; five-year average prices $48.66 and $2.88Note: Numbers may not add due to rounding
Of which, 60.5 MMBoe are NBU PUDs
Year End 2016 SEC Proved Reserves
54.9, 42%
1.1, 1%
75.2, 57%
131.3 MMBoe of Reserves(1)
PDP PDNP PUD
23%
55%
22%
Reserves by Area
STACK EOR OTHER

6
Total Debt and Annual Interest Expense Estimated to Be Lowered by Approximately 80%
Debt Reconciliation (millions)
YE 2016 March 21, 2017
Senior Notes $1,207 $0
RBL $445 $120
Term Loan $0 $150
Other Debt $26 $26
Total $1,678 $296
2016 2017E
Annual Interest Expense $131(1) $21(2)
(1) Based on 2016 total interest expense plus the high yield bond interest expense forgiven due to restructuring(2) Assumes three year average LIBOR curve of ~1%
$MM
Transformed Debt Structure
$1,207
$445
$150$120
$1,678
$26
$296
-
200
400
600
800
1,000
1,200
1,400
1,600
1,800
12/31/2016Total Debt
SeniorNotes
Converted
Old RBLElim
Other Debt(Real
Estate,Etc.)
New TermLoan
New RBL Est.3/21/2017Total Debt
Other Debt Term Loan RBL Senior Notes

7
2017 Strategy
•STACK position provides significant growth potential•Pursue strategic alternatives to monetize Enhanced Oil Recovery (EOR) assets
•Retained CIBC Griffis & Small to market EOR
Transition Chaparral to a Pure-Play STACK
Company
•Focus on oil-weighted, high-return STACK investments•Live within cash flow supplemented by asset sales proceeds
Capital and Financial Discipline
•Safely deliver repeatable results•Continue focus on driving down costs
Efficient and Effective Operations
•Expand premier STACK position•Allocate capital to Garfield County STACK and Merge acreage•Evaluate strategic alternatives for other non-STACK assets
Evaluate Portfolio and Growth Opportunities

8
• Monetize EOR assets as part of transition to pure-play STACK operator
• Currently evaluating bids• Ensure capital allocation to highest-return
opportunities• Provide ability to ramp up STACK
program, reducing leverage• Allow significant increase in production
growth
Strategic Plan
• Eight CO2 floods actively injecting CO2
• More than 300 miles of infrastructure
• Operated CO2 supply of 68 MMscf/d
Overview
(1) At year-end 2016 SEC prices of $42.75 and $2.49(2) Based on year-end 2016 reserves run on the August 28, 2017 NYMEX
EOR Assets
2016 Net Reserves(1) 72.2 MMBoe
2016 Net PUD Reserves(1) 61.4 MMBoe
2016 PDP PV10(2) ~$172 million
2016 Proved PV10(2) ~$370 million
2017E Net Production ~5,800 Boe/d
2016 Avg. LOE/Boe $17.76
2016 FLCF $42 million

9
STACK, 74%
EOR, 21%
Other, 5%
CAPEX
STACKEOROther
• Oil-weighted capital budget of $170 - $190 million• Approximately $130 million allocated to STACK
• Approximately 50% allocated to Kingfisher County and the Merge
• Approximately 33% allocated to non-operated• Approximately 17% allocated to Garfield County
• Multiple zones to develop/delineate• Meramec• Osage• Woodford• Oswego
• Currently running two rigs• Plan to drill 26 STACK wells in 2017• Potential to increase D&C budget in late 2017,
contingent upon divestiture proceeds and commodity prices
$170 - $190 million
(1)
2017 Oil & Gas Capital Budget Summary
(1) Numbers may not add due to rounding(2) Other capital excludes cap interest, PP&E and cap G&A of approximately $13 million
(1)
(2)

10
5,778 5,412 5,643 5,588 5,725
-
2,000
4,000
6,000
8,000
10,000
Q22016
Q32016
Q42016
Q12017
Q22017
FY2017E
Boe/d25,407
23,857 23,254 22,481 23,945
0
5,000
10,000
15,000
20,000
25,000
30,000
Q22016
Q32016
Q42016
Q12017
Q22017
FY2017E
Boe/d
Total production raised due to Op and Non-Op activity• Expect STACK production to grow ~25% from
2016 to 2017• 2017 STACK exit rate to increase ~45% from 2016
Total CompanyEOR
Production Growth
7,693 7,514 7,289
8,166
9,136
-
2,000
4,000
6,000
8,000
10,000
Q22016
Q32016
Q42016
Q12017
Q22017
FY2017E
Boe/d
STACK
9.1 Guidance Low
9.5 Guidance High
22.7 Guidance Low
23.8 Guidance High
5.6 Guidance Low
6.0 Guidance High

Asset Overview

12
• EOR• Self-funding at current pricing
levels• Highly leveraged to oil price
• Other• Stranded assets• Auction process underway
• Premier basin with industry-leading returns• Large contiguous acreage position with
exposure to all current economic reservoir targets
• Multi-year drilling inventory supporting significant future growth
• Early stages of play maturity
STACK
• Generates free cash flow to support STACK drilling program
• Averaged approximately 6.3 MBoe/d in Q2 2017
• $14.34/Boe gross margin in Q2 2017
Legacy
Non-Core Divestitures
Acreage as of June 30, 2017
Asset Overview

13
• Approximately 110,000 acres• 9.1 MBoe/d in Q2 2017• 65 operated producing wells as of Q2 2017
Asset Overview
County Acreage HBP %OP(2)OP WIAverage
NONOP WIAverage
Kingfisher ~25,000 ~90% 64% 64% 13%
Canadian ~23,000 ~99% 71% 61% 8%
Garfield ~40,000 ~23% 74% 60% 16%
Major ~7,000 ~67% 59% 52% 10%
Other ~15,000 ~99% 56% 50% 7%
• Chaparral acreage is primarily in the “black oil,” normal pressure window
• Lower well costs• Lower GOR• Excellent rates of return(1): 29 - 69%
• Significant experience and exposure to all targeted reservoirs within the play
• Meramec, Osage, Oswego and Woodford• Ability to accelerate development with short
cycle times and low drilling costs
Attributes/Characteristics
STACK Overview
(1) – Based on $50 per barrel of oil and $3 per MMBTU flat price deck (2) – Percent operated calculated as the sum of net acres in operated section divided by the total net acres in the county
STACK
WOODWARD
ALFAFAWOODS
KINGFISHER
MAJOR
DEWEY
CANADIANCUSTER
WASHITACADDO
GARFIELD
Chaparral Acreage

14
• Stacked reservoirs proximal to the world-class Woodford source rock
• Efficient hydrocarbon stratigraphic trap creates a continuous petroleum system
• Areas where a thick Woodford is adjacent to the horizontal targets enhances hydrocarbon charge
• Economic success realized throughout hydrocarbon column
• MERGE represents intersection of historical SCOOP/STACK play outlines
• Play attributes are identical – only rock thickness and GOR vary
STACK Attributes
GARFIELD COUNTY KINGFISHER COUNTY CANADIAN COUNTY
REGIONAL STACK CROSS SECTION 60 MILESN SSTACK MERGE
OSWEGO
MERAMEC
OSAGE
WOODFORDSOURCE
GRADY COUNTY
110’180’
350’
700’
Datum Break
One Petroleum System
STACK
N
SMERGE

15
• Significant A&D activity demonstrates value of Chaparral’s acreage position
• Staghorn & Payrock transactions were primarily in the “black oil,” normal pressure window of the play
2 3 4
4 3
2
Recent STACK Transactions
1 1
(1) – Does not include ~20,000 net acres in Major County
Sales Package/Seller Alta Mesa Staghorn PayRock Felix
Purchaser Silver Run II Chisholm Marathon Devon
Date 8/16/2017 1/16/2017 6/20/2016 12/7/2015
Purchase Price ($mm) $2,200 $613 $888 $1,900
Net Acres 120,000 41,386 61,000 80,000
Production (MBoe/d) 20 2.8 8.6 9
$/AcreNot Adjusted for Production $18,333 $14,812 $14,557 $23,750
$/Acre Adjusted for Production, $25,000/Boe/d
$17,158(1) $13,120 $11,033 $20,938

16
Meramec Overview• Approximately 92,000 acres• 3.1 MBoe/d in Q2 2017• 21 operated producing wells
Characteristics• Reservoir rock is present
from Garfield to Canadian County: 100’ - 400’ thickness
• 3 - 7% porosity• Multiple targets within
Meramec in Kingfisher and Canadian counties
• Good results from higher proppant concentration fracs
• Pre-Tax IRR(1): 67%
County Acreage
Kingfisher ~22,000
Canadian ~19,000
Garfield ~35,000
Other ~16,000
ICEMAN 1706 1UMH-33(Chaparral)
Spud Date: 4/25/16Peak IP-30: 621 Boe/d
Oil: 63%Lateral Length: 4,484’
BOWSER 1606 1UMH-9(Chaparral)
Spud Date: 6/2/16Peak IP-30: 953 Boe/d
Oil: 71%Lateral Length: 4,433’
CORNER POCKET 1707 1UMH-25
(Chaparral)Spud Date: 4/7/16
Peak IP-30: 748 Boe/dOil: 72%
Lateral Length: 4,176’
WHITE OAK 1UMH-36(Chaparral)
Spud Date: 5/7/17Current Rate: 600 Boe/d
Oil: 16%Lateral Length: 4,743’
CHARLENE 2305 1-29H(Sandridge)
Spud Date: 3/18/16Peak IP-30: 352 Boe/d
Oil: 57%Lateral Length: 4,364’
OPPEL 1H-17-20(Citizen)
Spud Date: 7/20/16Peak IP-30: 1,148 Boe/d
Oil: 62%Lateral Length: 7,750’
RIKELLA 2H-16-9 (Citizen)
Spud Date: 4/20/16Peak IP-30: 829 Boe/d
Oil: 65%Lateral Length: 6,179’
JOHNSTON 31-27-7 1H(Chesapeake)
Spud Date: 11/22/16Peak IP-30: 1,430 Boe/d
Oil: 28%Lateral Length: 9,875’
STACK Meramec Overview
LUIGI 1605 1UMH-19 (Chaparral)
Spud Date: 12/26/16Peak IP-30: 537 Boe/d
Oil: 74%Lateral Length: 4,751’
(1) – Economics based on STACK Meramec single well economics calculated at a flat price deck of $50 per barrel of oil and $3 per MMBTU and includes oil and gas differentialsNote: Garfield County Meramec has not been de-risked at this time
Operated well with 30-day IP
Industry well with 30-day IP
JESTER 1606 1UMH-3(Chaparral)
Spud Date: 3/22/17Peak IP-30: 755 Boe/d
Oil: 82%Lateral Length: 3,869’
CUTBOW 1307 1UMH-26(Chaparral)
Spud Date: 3/29/17Peak IP-30: 1,112 Boe/d
Oil: 55%Lateral Length: 4,672
WOODWARD
WOODS ALFAFA
MAJOR
GARFIELD
STACK KINGFISHER
CANADIAN
WASHITA
CADDOGRADY
DEWEY
CUSTER
BLAINE
STACK
Chaparral Acreage
HOSKINS 5-19-12 1H (Chesapeake)
Spud Date: 8/18/16Peak IP-30: 1,208 Boe/d
Oil: 57%Lateral Length: 4,972’
MEDILL 2015 1-27H(Sandridge)
Spud Date: 10/14/16Peak IP-30: 925 Boe/d
Oil: 77%Lateral Length: 4,681’
HRDY 1-11MH(Marathon)
Spud Date: 7/26/16Peak IP-30: 1,487 Boe/d
Oil: 31%Lateral Length: 4,935’
BIGHORN 18-09-33 1H(Staghorn)
Spud Date: 7/11/16Peak IP-30: 894 Boe/d
Oil: 61%Lateral Length: 4,524’
SCHOEPPEL 16-20-12 1H(Chesapeake)
Spud Date: 7/16/16Peak IP-30: 983 Boe/d
Oil: 46%Lateral Length: 4,764’
BIG TIMBER 1408 1UMH-2(Chaparral)
Spud Date: 6/4/2017Peak IP-30: 696 Boe/d
Oil: 71%Lateral Length: 4,623’

17
Osage Overview• Approximately 99,000 acres• 2.0 MBoe/d in Q2 2017• 26 operated producing wells
Characteristics• Thickness ranges from 30’ in
southern Canadian County to 400’ in Garfield County
• 2% - 7% porosity • Multiple targets within Osage
in Kingfisher, Canadian and Garfield counties
• Pre-Tax IRR(1): 65%
County AcreageKingfisher ~22,000
Canadian ~20,000
Garfield ~40,000
Other ~17,000
(1) – Economics based on STACK Osage Kingfisher single well economics calculated at a flat price deck of $50 per barrel of oil and $3 per MMBTU and includes oil and gas differentials
REDWOOD 2105 1MH-3(Chaparral)
Spud Date: 11/18/15Peak IP-30: 597 Boe/d
Oil: 62%Lateral Length: 4,566
LANKARD 1706 6-34MH(Alta Mesa)
Spud Date: 4/4/16Peak IP-30: 1,585 Boe/d
Oil: 69%Lateral Length: 4,879’
MARAL 20-07-33 1H(Chisholm)
Spud Date: 10/31/16Peak IP-30: 507 Boe/d
Oil: 79%Lateral Length: 4,722’
SCHILDE 1706 3-15MH(Alta Mesa)
Spud Date: 4/9/15Peak IP-30: 831 Boe/d
Oil: 80%Lateral Length: 4,966’
HOSKINS 1705 2-9MH(Alta Mesa)
Spud Date: 9/15/15Peak IP-30: 828 Boe/d
Oil: 89%Lateral Length: 4,893’
BORELLI 1705 4-8MH(Alta Mesa)
Spud Date: 2/10/15Peak IP-30: 1,200 Boe/d
Oil: 72%Lateral Length: 4,845’
ASH 1705 3-19MH(Alta Mesa)
Spud Date: 1/14/15Peak IP-30: 799 Boe/d
Oil: 73%Lateral Length: 4,810’
JACKSON 25-24-10-6 1XH(Linn)
Spud Date: 11/19/16Peak IP-30: 1,533 Boe/d
Oil: 50%Lateral Length: 9,769’
ROSEMARY 1H-1-36(Citizen)
Spud Date: 1/23/16Peak IP-30: 1,863 Boe/d
Oil: 68%Lateral Length: 7,600’
FARBER 2007 1MH-6(Chaparral)
Spud Date: 12/12/15Peak IP-30: 469 Boe/d
Oil: 76%Lateral Length: 4,316’
BUGABAGO 2006 1-31MH(Alta Mesa)
Spud Date: 3/5/17Peak IP-30: 347 Boe/d
Oil: 100%Lateral Length: 5,054’
STACK Osage Overview
MCNEFF 22-10-5-1H(Linn)
Spud Date: 9/26/16Peak IP-30: 961 Boe/d
Oil: 44%Lateral Length: 4,391’
ALFRED 1407 2-8MH(Marathon)
Spud Date: 11/20/16Peak IP-30: 741 Boe/d
Oil: 82%Lateral Length: 4,523’
DREAM COOLER 13-12-10-6 2XH (Linn)
Spud Date: 1/16/17Peak IP-30: 1,210 Boe/d
Oil: 22%Lateral Length: 9,637’ Operated well with 30-day IP
Industry well with 30-day IP
GOOSE 1606 1LHM-3(Chaparral)
Spud Date: 3/7/17Peak IP-30: 474 Boe/d
Oil: 82%Lateral Length: 3,888’
LOW VALLEY 1LMH-36(Chaparral)
Spud Date: 4/18/2017Peak IP-30: 1,174 Boe/d
Oil: 73%Lateral Length: 4,925’
HEDGES 6-21-5W 1MH(White Star)
Spud Date: 9/15/14Peak IP-30: 433 Boe/d
Oil: 31%Lateral Length: 4,858’
STACK
WOODWARD
ALFAFA
GARFIELD
WOODS
KINGFISHER
MAJOR
DEWEY
CANADIAN
GRADY
CUSTER
WASHITA
CADDO
STACK
Chaparral Acreage

18
Woodford Overview• Approximately 79,000 acres• 1.5 MBoe/d in Q2 2017• Two operated producing well
Characteristics• High TOC Shale: Approximately
10%• Canadian County: 30’ - 250’ thick• Garfield County: 50’ - 100’ thick• Pre-Tax IRR(1): 29%
County AcreageKingfisher ~14,000
Canadian ~19,000
Garfield ~37,000
Other ~9,000
STILES 1407 1-4H(Marathon)
Spud Date: 2/17/14Peak IP-30: 710 Boe/d
Oil: 86%Lateral Length: 4,587’
REDHEAD 1H-9XX(Newfield)
Spud Date: 5/2/15Peak IP-30: 1,227 Boe/d
Oil: 72%Lateral Length: 11,787’
OPPEL 1H-9(Citizen)
Spud Date: 8/4/16Peak IP-30: 896 Boe/d
Oil: 35%Lateral Length: 4,813’ ANDERSON 1206 1-33 WH
(Payrock)Spud Date: 12/9/15
Peak IP-30: 696 Boe/dOil: 72%
Lateral Length: 4,920’
HARDESTY 1H-22-15(Citizen)
Spud Date: 11/28/15Peak IP-30: 898 Boe/d
Oil: 17%Lateral Length: 7,465’
RIKELLA 1H-16-9(Citizen)
Spud Date: 3/17/16Peak IP-30: 697 Boe/d
Oil: 66%Lateral Length: 10,222’
SMITH D 34-21N-4W 1WH (White Star)
Spud Date: 5/9/14Peak IP-30: 630 Boe/d
Oil: 50%Lateral Length: 4,532’
DIVIDE-CLARK 28 21-14N-6W 1HX(Devon)
Spud Date: 7/4/16Peak IP-30: 962 Boe/d
Oil: 61%Lateral Length: 10,100’
JENNIFER 1H-35X(Newfield)
Spud Date: 7/28/16Peak IP-30: 896 Boe/d
Oil: 72%Lateral Length: 9,615’
STACK Woodford Overview
(1) – Economics based on STACK Woodford black oil single well economics calculated at a flat price deck of $50 per barrel of oil and $3.00 per MMBTU and includes oil and gas differentialsNote: Garfield County Woodford has not been de-risked at this time
WILLIAMS 1-24 WH(White Star)
Spud Date: 11/10/12Peak IP-30: 98 Boe/d
Oil: 66%Lateral Length: 2,720’
BARBOUR 12-10-7 1H (Linn)
Spud Date: 12/20/15Peak IP-30: 668 Boe/d
Oil: 29%Lateral Length: 4,209’
BRAUM 28-21-10-6 1XH(Linn)
Spud Date: 8/25/16Peak IP-30: 1,445 Boe/d
Oil: 13%Lateral Length: 10,206’
Operated well with 30-day IP
Industry well with 30-day IP
WOODWARD
ALFAFA
GARFIELD
WOODS
KINGFISHER
MAJOR
DEWEY
BLAINE
CANADIAN
GRADY
CUSTER
WASHITA
CADDO
STACK
STACK
Chaparral Acreage
CUTTHROAT 1307 1WH-13(Chaparral)
Spud Date: 2/11/17Peak IP-30: 456 Boe/d
Oil: 62%Lateral Length: 4,569’
SIEGRIST 1307 1-9WH(Marathon)
Spud Date: 7/29/15Peak IP-30: 961 Boe/d
Oil: 76%Lateral Length: 4,761’
MEYER 1106 1-21 WH(Marathon)
Spud Date: 11/18/14Peak IP-30: 764 Boe/d
Oil: 35%Lateral Length: 4,955’

19
KINGFISHER
Chaparral Acreage
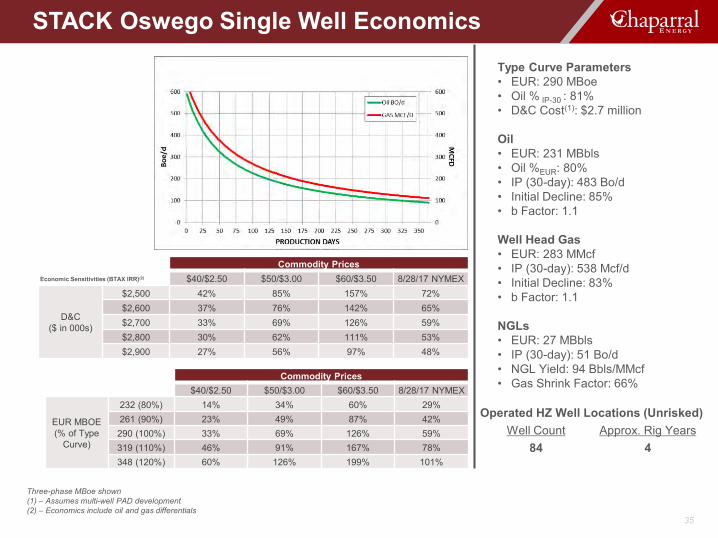
Oswego Overview• Approximately 20,000 acres• 1.4 MBoe/d in Q2 2017• 16 operated, producing wells
Characteristics• Economic target is geologic
dependent and primarily oolitic limestone
• Kingfisher County: 100’ - 150’ thick
• 2% - 20% porosity• Pre-Tax IRR(1): 69%
County Acreage
Kingfisher ~20,000
DU (LITHIUM) 1OH-28(Chaparral)
Spud Date: 4/3/14Peak IP-30: 396 Boe/d
Oil: 92%Lateral Length: 4,507’
SYDENA 1807 1OH-29(Chaparral)
Spud Date: 1/7/16Peak IP-30: 262 Boe/d
Oil: 90%Lateral Length: 3,825’
HUGHES TRUST 33-18-7 1H(Chesapeake)
Spud Date: 12/17/14Peak IP-30: 1,326 Boe/d
Oil: 95%
HASTY 3-18-6 1H(Chesapeake)
Spud Date: 5/28/16Peak IP-30: 1,033 Boe/d
Oil: 86%Lateral Length: 3,986
INGLE 32-18-6 1H(Chesapeake)
Spud Date: 6/8/16Peak IP-30: 801 Boe/d
Oil: 90%Lateral Length: 4,233
THEMER 6-17-6 1H(Chesapeake)
Spud Date: 4/21/16Peak IP-30: 832 Boe/d
Oil: 86%Lateral Length: 4,420’
DU (TRIFECTA) 1807 2OH-14-11(Chaparral)
Spud Date: 10/14/14Peak IP-30: 1,020 Boe/d
Oil: 92%Lateral Length: 5,577
DU (TRIFECTA) 1OH-14(Chaparral)
Spud Date: 3/10/14Peak IP-30: 838 Boe/d
Oil: 93%Lateral Length: 4,382
MUGGENBORG 7-17-6 1H(Chesapeake)
Spud Date: 5/4/16Peak IP-30: 664 Boe/d
Oil: 83%Lateral Length: 4,580’
STITT 7-17-6 3H(Chesapeake)
Spud Date: 10/17/16Peak IP-30: 666 Boe/d
Oil: 87%Lateral Length: 5,261’
STITT 7-17-6 2H(Chesapeake)
Spud Date: 10/31/16Peak IP-30: 682 Boe/d
Oil: 88%Lateral Length: 4,739’
STACK Oswego Overview
(1) – Economics based on STACK Oswego single well economics calculated at a flat price deck of $50 per barrel of oil and $3 per MMBTU and includes oil and gas differentials
FOSTER 31-17-5 Pad(Chesapeake – 3 Wells)
Spud Date: 1/26/17Peak IP-30: 487 Boe/d
Oil: 85%Lateral Length: 4,887’
MORRIS 31-18-6 Pad(Chesapeake – 2 Wells)
Spud Date: 11/9/16Peak IP-30: 900 Boe/d
Oil: 89%Lateral Length: 4,819’
DU OOID 1OH-24(Chaparral)
Spud Date: 6/24/13Peak IP-30: 1,543 Boe/d
Oil: 92%Lateral Length: 5,457
Operated well with 30-day IP
Industry well with 30-day IP
20
3,458 3,398 3,318 3,218 3,098
19 79 159 259 379
0
500
1,000
1,500
2,000
2,500
3,000
3,500
4,000
12/31/2017 12/31/2018 12/31/2019 12/31/2020 12/31/2021
STA
CK
Op
era
ted
Dri
llin
g In
ven
tory
STACK Operated Drilling Inventory by Type
Remaining Inventory Cumulative Drilled
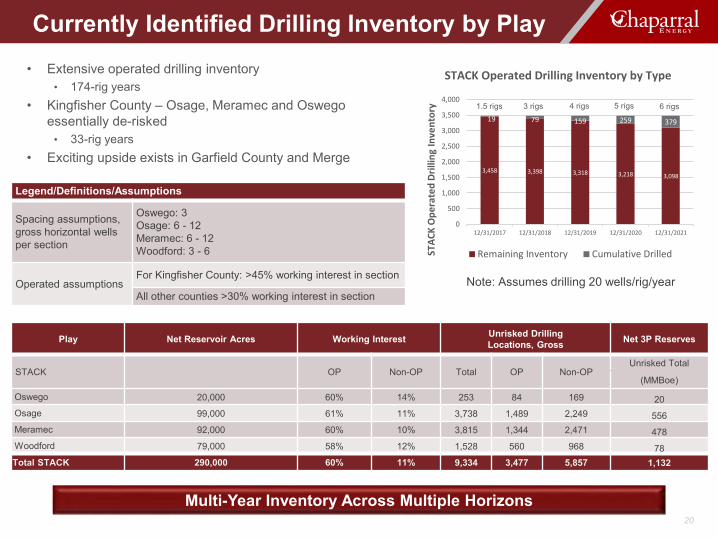
• Extensive operated drilling inventory• 174-rig years
• Kingfisher County – Osage, Meramec and Oswego essentially de-risked
• 33-rig years• Exciting upside exists in Garfield County and Merge
Legend/Definitions/Assumptions
Spacing assumptions, gross horizontal wells per section
Oswego: 3Osage: 6 - 12Meramec: 6 - 12Woodford: 3 - 6
Operated assumptionsFor Kingfisher County: >45% working interest in section
All other counties >30% working interest in section
Play Net Reservoir Acres Working Interest Unrisked Drilling Locations, Gross Net 3P Reserves
STACK OP Non-OP Total OP Non-OPUnrisked Total
(MMBoe)
Oswego 20,000 60% 14% 253 84 169 20Osage 99,000 61% 11% 3,738 1,489 2,249 556Meramec 92,000 60% 10% 3,815 1,344 2,471 478Woodford 79,000 58% 12% 1,528 560 968 78Total STACK 290,000 60% 11% 9,334 3,477 5,857 1,132
1.5 rigs 3 rigs 4 rigs 5 rigs 6 rigs
Multi-Year Inventory Across Multiple Horizons
Note: Assumes drilling 20 wells/rig/year
Currently Identified Drilling Inventory by Play

21
0
2
4
6
8
10
12
14
16
0
20
40
60
80
100
0 50 100 150 200 250 300 350 400 450 500
Enhanced Completions
233 MBO EUR (Oil Component of 578 MBOE Type Cuve)
Well Count
0
500
1,000
1,500
2,000
2,500
3,000
2014 2015 2016 2017
Pro
ppan
t / F
tChaparral Well Performance in STACK
Enhanced Completion Tests in the STACK
• Initiated enhanced completion program in Q2 2016 to test increased proppant loading in the normal pressured oil window of the STACK
• Currently 15 wells on production with increased proppant loading
MB
O
Demonstrated Performance Over Last 12 Months
• Increased proppant loading continues to support current type curve
• First operated Meramec test in Canadian County (Merge) exceeding type curve by approximately 40%
STACK Meramec Cumulative Oil Production
Well C
ount
DaysSpud Year
15 Wells

22
0.0
1.0
2.0
3.0
4.0
5.0
6.0
7.0
8.0
CHPE Peers
• Demonstrated D&C cost improvements• Average D&C cost of ~$3.5 million from Q1 2016 to Q2 2017• 2017 average Meramec D&C cost of ~$3.7 million, despite service cost inflation
Strong, Effective Focus on Cost Reduction/Control
Strong and Effective D&C Cost Focus
Operational Excellence – Drilling and Completions
$0
$1,000
$2,000
$3,000
$4,000
$5,000
$6,000
Q1 '13 Q1 '14 Q1 '15 Q1 '16 Q2 '17
D&
C C
ost (
M$)
Gross D&C CostQuarterly Average
Avg D&C Cost
$MM
Average D&C Cost by OperatorSTACK Meramec One-Mile Laterals

23
• Mature, lower decline legacy fields
• Low maintenance capital• Provides free cash flow to fuel
STACK growth• Potential strategic alternatives
Area
Net Production(1) Gross Margin(1) Net Proved Reserves
Boe/d % Oil $/Boe MMBoe(2) PV-10(2) ($MM) PV-10(3) ($MM)
Miss Lime 2,507 32% $16.20 8.5 57.5 72.2
Western Anadarko Basin 1,853 12% $11.57 6.7 28.6 41.9
Southern OK 1,925 58% $14.58 6.4 41.3 55.8
TOTAL 6,286 34% $14.34 22.0 127.4 169.8
TOTAL Incl. ARO 6,286 34% $14.34 22.0 122.0 164.4
(1) Based on Q2 2017(2) At YE 2016 SEC prices of $42.75 and $2.49(3) Based on YE 2017 reserves run on the August 28,2017 NYMEX: Five-year average prices $48.66 and $2.88
Non-Core Legacy Asset Overview

Financial Overview

25
• Maintain strong balance sheet• Converted all long-term debt to equity• As of June 30, 2017, approximately $103
million liquidity, which includes approximately $86 million available on revolver
• Maintain capital discipline• Live within cash flow supplemented by asset
sales proceeds
• Hedge significant production volumes to ensure cash flow
• Continue to focus on lowering cash operating costs per Boe
• Assets sales to fund additional STACK drilling• Legacy non-core EOR assets
• Stock currently trading on OTCQB market under the symbol CHPE
Financial Strategy

26
Common Equity • Approximately 45 million shares issued and outstanding at emergence
Term Loan
• $150 million outstanding at emergence
• Matures March 2021
• ABR Loans: ABR +6.75%
LIBOR Loans: LIBOR +7.75% (1% floor)
• Mandatory quarterly amortization payments
$1.2 million in 2017, $1.5 million in 2018, $3.75 million in 2019 and $6.75 million in 2020
$400 Million Revolver
• $400 million facility
• Current conforming borrowing base of $225 million - LIBOR +3 - 4%
• Matures in March 2021
• ABR Loans: ABR +2 - 3%
LIBOR Loans: LIBOR +3 - 4%
• Approximately $120 million drawn on RBL at emergence
• Redeterminations semi-annually every May 1 and November 1 starting 2018
Credit Facility Overview

27
Strong Financial Position and Liquidity• Strong financial position to support
accelerated STACK drilling program
• No near-term debt maturities until 2021
• Current debt/total capitalization of ~25%
• Eliminated approximately $1,382 million of debt through restructuring program
• Post emergence debt/adjusted LTM EBITDA of ~1.4x
• Proceeds from non-core asset sales will provide additional cash to fund capital plan
Chaparral Capitalization and Liquidity($ in Millions) As Reported
6/30/2017
Cash and Cash Equivalents $17
Revolving Credit Facility due March 2021(1) $138Term Loan due March 2021 150Other 25
Total Debt $313
Stockholder’s Equity $951
Total Capitalization $1,264
Total Debt / Total Capitalization 25%
Liquidity(1) $103
$0
$100
$200
$300
$400
$500
2017 2018 2019 2020 2021 2022 2023 2024 2025 2025+
Term Loan Revolver - Drawn Revolver - Availability
$86$139
$150
($ in Millions)
No maturities until 2021
Chaparral Debt Maturity Schedule
(1) Liquidity defined as revolver availability based on current commitments plus unrestricted cash less letters of credit

28
9,600
6,298
3,595
-
2,000
4,000
6,000
8,000
10,000
12,000
2017 2018 2019
Vo
lum
es
(bb
ls/d
)
Swaps Collars
Hedging Strategy Ensures Revenue to Execute Capital Plan
Oil Positions Natural Gas Positions
Hedge positions as of June 30, 2017
Hedging
$54.92
$54.26
$50.00 - $60.50
$54.97
24,957
16,058
9,100
-
5,000
10,000
15,000
20,000
25,000
30,000
2017 2018 2019
Vo
lum
es
(Mcf
/d)
Swaps
$3.34
$3.03
$2.86
29
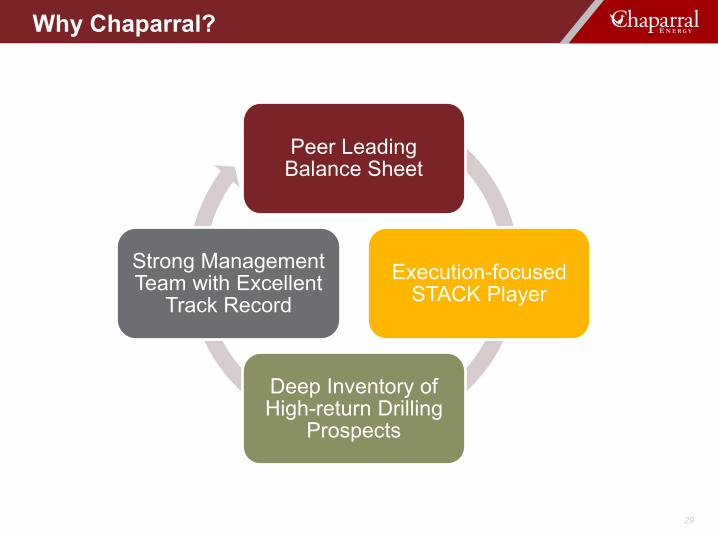
Peer Leading Balance Sheet
Execution-focused STACK Player
Deep Inventory of High-return Drilling
Prospects
Strong Management Team with Excellent
Track Record
Why Chaparral?
Why Chaparral?

Appendix

Type Curve Parameters• EUR: 578 MBoe• Oil %IP-30: 59%• D&C Cost(1): $3.5 million
Oil• EUR: 233 MBbls• Oil %EUR: 40%• IP (30-day): 442 Bo/d• Initial Decline: 85%• b Factor: 1.2
Well Head Gas• EUR: 1,592 MMcf• IP (30-day): 1,433 Mcf/d• Initial Decline: 64.5%• b Factor: 1.2
NGLs• EUR: 159 MBbls• IP (30-day): 143 Bbl/d• NGL Yield: 100 Bbls/MMcf• Gas Shrink Factor: 70%
Three-phase MBoe shown(1) – Assumes multi-well PAD development (2) – Economics include oil and gas differentials
Commodity Prices$40/$2.50 $50/$3.00 $60/$3.50 8/28/17 NYMEX
D&C($ in 000s)
$3,300 43% 77% 133% 69%$3,400 39% 72% 122% 64%$3,500 37% 67% 111% 59%$3,600 34% 62% 99% 55%$3,700 32% 58% 93% 52%
Commodity Prices$40/$2.50 $50/$3.00 $60/$3.50 8/28/17 NYMEX
EUR MBOE(% of Type
Curve)
482 (80%) 19% 36% 59% 32%542 (90%) 27% 50% 81% 45%578 (100%) 37% 67% 111% 59%663 (110%) 48% 86% 148% 76%723 (120%) 61% 112% 179% 95%
Economic Sensitivities (BTAX IRR)(2)
31
Operated HZ Well Locations (Unrisked)Well Count Approx. Rig Years
1,344 67
STACK Meramec Single Well Economics
*Note: Acreage outside of Kingfisher and Canadian counties has not been de-risked at this time

Type Curve Parameters• EUR: 540 MBoe• Oil % IP-30 : 67%• D&C Cost(1): $3.3 million
Oil• EUR: 235 MBbls• Oil %EUR: 44%• IP (30-day): 403 Bo/d• Initial Decline: 80.7%• b Factor: 1.1
Well Head Gas• EUR: 1,409 Mmcf• IP (30-day): 912 Mcf/d• Initial Decline: 50%• b Factor: 1.1
NGLs• EUR: 141 MBbls• IP (30-day): 91 Bo/d• NGL Yield: 100 Bbls/MMcf• Gas Shrink Factor: 70%
Three-phase MBoe shown(1) – Assumes multi-well PAD development (2) – Economics include oil and gas differentials
Commodity Prices$40/$2.50 $50/$3.00 $60/$3.50 8/28/17 NYMEX
D&C($ in 000s)
$3,100 42% 76% 129% 67%$3,200 39% 70% 117% 62%$3,300 36% 65% 105% 58%$3,400 33% 60% 96% 54%$3,500 31% 56% 90% 50%
Commodity Prices$40/$2.50 $50/$3.00 $60/$3.50 8/28/17 NYMEX
EUR MBOE(% of Type
Curve)
432 (80%) 18% 35% 58% 31%486 (90%) 26% 49% 79% 44%540 (100%) 36% 65% 105% 58%594 (110%) 47% 83% 143% 74%648 (120%) 59% 106% 174% 92%
Economic Sensitivities (BTAX IRR)(2)
Operated HZ Well Locations (Unrisked)Well Count Approx. Rig Years
416 21
32
STACK Osage Kingfisher Single Well Economics

Type Curve Parameters• EUR : 599 MBoe• Oil % IP-30 : 46%• D&C Cost(1): $3.3 million
Oil• EUR: 174 MBbls• Oil %EUR: 29%• IP (30-day): 259 Bo/d• Initial Decline: 83.6%• b Factor: 1.4
Well Head Gas• EUR: 2,045 Mmcf• IP (30-day): 1,483 Mcf/d• Initial Decline: 61.6%• b Factor: 1.4
NGLs• EUR: 193 MBbls• IP (30-day): 140 Bo/d• NGL Yield: 94 Bbls/MMcf• Gas Shrink Factor: 68%
Three-phase MBoe shown(1) – Assumes multi-well PAD development (2) – Economics include oil and gas differentials
Commodity Prices$40/$2.50 $50/$3.00 $60/$3.50 8/28/17 NYMEX
D&C($ in 000s)
$3,100 20% 35% 53% 31%$3,200 19% 32% 49% 29%$3,300 18% 30% 46% 28%$3,400 17% 28% 43% 26%$3,500 16% 27% 40% 24%
Commodity Prices$40/$2.50 $50/$3.00 $60/$3.50 8/28/17 NYMEX
EUR MBOE(% of Type
Curve)
479 (80%) 9% 17% 27% 16%539 (90%) 13% 23% 36% 21%599 (100%) 18% 30% 46% 28%659 (110%) 22% 38% 58% 35%719 (120%) 28% 47% 71% 42%
Economic Sensitivities (BTAX IRR)(2)
Operated HZ Well Locations (Unrisked)Well Count Approx. Rig Years
1,073 54
33
STACK Osage Garfield Single Well Economics
Type Curve Parameters• EUR: 575 MBoe• Oil % IP-30 : 55%• D&C Cost(1): $4 million
Oil• EUR:233 MBbls• Oil %EUR: 41%• IP (30-day):298 Bo/d• Initial Decline:73%• b Factor: 1.1
Well Head Gas• EUR: 1,540 MMcf• IP (30-day): 1,081 Mcf/d• Initial Decline: 58%• b Factor: 1.3
NGLs• EUR: 181 MBbls• IP (30-day): 126 Bbl/d• NGL Yield: 117 Bbls/MMcf• Gas Shrink Factor: 63%
Three-phase MBoe shown(1) – Assumes multi-well PAD development (2) – Economics include oil and gas differentials
Commodity Prices$40/$2.50 $50/$3.00 $60/$3.50 8/28/17 NYMEX
D&C($ in 000s)
$3,800 17% 33% 53% 30%$3,900 16% 30% 50% 28%$4,000 15% 29% 47% 27%$4,100 14% 27% 45% 25%$4,200 13% 26% 42% 24%
Commodity Prices$40/$2.50 $50/$3.00 $60/$3.50 8/28/17 NYMEX
EUR MBOE(% of Type
Curve)
460 (80%) 7% 16% 27% 15%518 (90%) 10% 22% 36% 20%575 (100%) 15% 29% 47% 27%633 (110%) 19% 37% 59% 34%690 (120%) 25% 46% 73% 41%
Economic Sensitivities (BTAX IRR)(2)
Operated HZ Well Locations (Unrisked)Well Count Approx. Rig Years
560 28
34
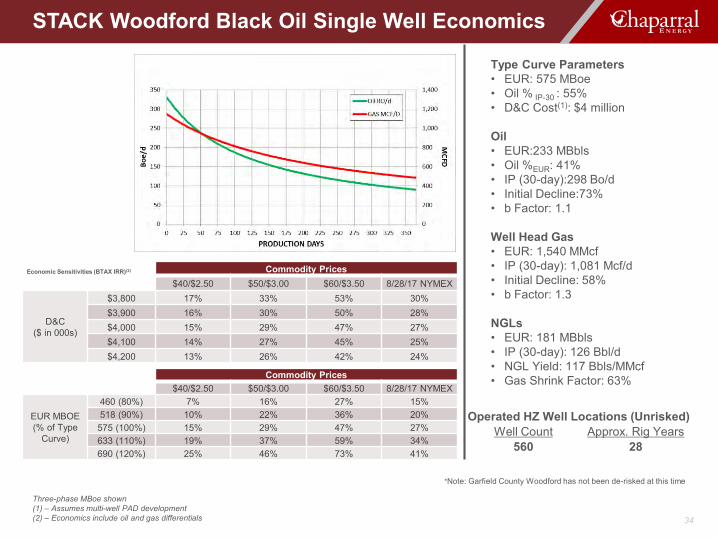
STACK Woodford Black Oil Single Well Economics
*Note: Garfield County Woodford has not been de-risked at this time
Type Curve Parameters• EUR: 290 MBoe• Oil % IP-30 : 81%• D&C Cost(1): $2.7 million
Oil• EUR: 231 MBbls• Oil %EUR: 80%• IP (30-day): 483 Bo/d• Initial Decline: 85%• b Factor: 1.1
Well Head Gas• EUR: 283 MMcf• IP (30-day): 538 Mcf/d• Initial Decline: 83%• b Factor: 1.1
NGLs• EUR: 27 MBbls• IP (30-day): 51 Bo/d• NGL Yield: 94 Bbls/MMcf• Gas Shrink Factor: 66%
Three-phase MBoe shown(1) – Assumes multi-well PAD development (2) – Economics include oil and gas differentials
Commodity Prices$40/$2.50 $50/$3.00 $60/$3.50 8/28/17 NYMEX
D&C($ in 000s)
$2,500 42% 85% 157% 72%$2,600 37% 76% 142% 65%$2,700 33% 69% 126% 59%$2,800 30% 62% 111% 53%$2,900 27% 56% 97% 48%
Commodity Prices$40/$2.50 $50/$3.00 $60/$3.50 8/28/17 NYMEX
EUR MBOE(% of Type
Curve)
232 (80%) 14% 34% 60% 29%261 (90%) 23% 49% 87% 42%290 (100%) 33% 69% 126% 59%319 (110%) 46% 91% 167% 78%348 (120%) 60% 126% 199% 101%
Economic Sensitivities (BTAX IRR)(2)
Operated HZ Well Locations (Unrisked)Well Count Approx. Rig Years
84 4
35
STACK Oswego Single Well Economics
36
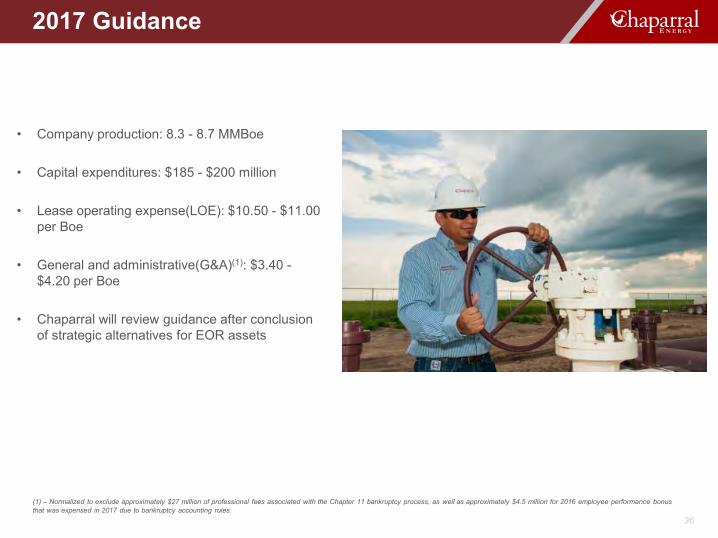
• Company production: 8.3 - 8.7 MMBoe
• Capital expenditures: $185 - $200 million
• Lease operating expense(LOE): $10.50 - $11.00 per Boe
• General and administrative(G&A)(1): $3.40 -$4.20 per Boe
• Chaparral will review guidance after conclusion of strategic alternatives for EOR assets
2017 Guidance
(1) – Normalized to exclude approximately $27 million of professional fees associated with the Chapter 11 bankruptcy process, as well as approximately $4.5 million for 2016 employee performance bonus that was expensed in 2017 due to bankruptcy accounting rules.
2017 Guidance
37
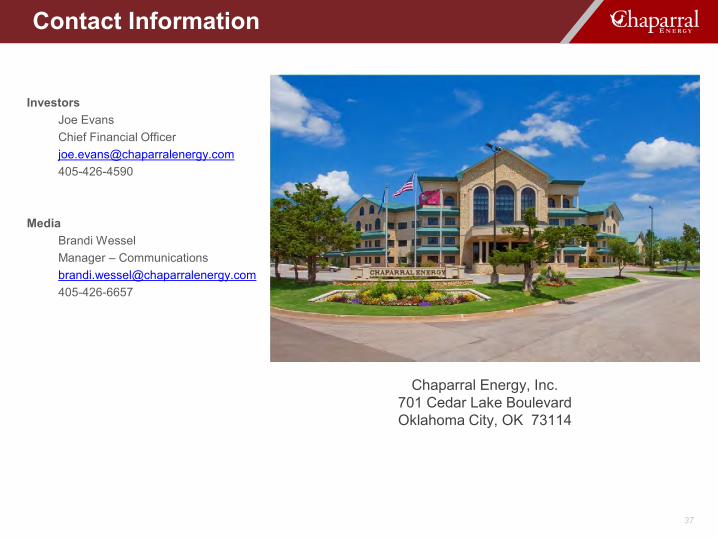
InvestorsJoe EvansChief Financial Officer [email protected]
MediaBrandi WesselManager – [email protected]
Contact Information
Contact Information
Chaparral Energy, Inc. 701 Cedar Lake BoulevardOklahoma City, OK 73114

James M. Miller, Sr. Vice President - OperationsMr. Miller joined Chaparral in 1996 as an operations engineer and has since been promoted to positions of increasing responsibility ,including his current role as senior vice president of operations. Prior to joining the company, Mr. Miller worked as a petroleum engineer for KEPCO Operating Inc. and Robert A Mason, where he was named vice president of production.
Joseph O. Evans, Chief Financial Officer and Executive Vice PresidentMr. Evans joined Chaparral in 2005 as chief financial officer and executive vice president. Prior to joining Chaparral, he worked as a consultant and practiced public accounting with Evans Gaither & Assoc., served as senior vice president and financial advisor for First National Bank of Commerce and Deloitte & Touche, where he became an audit partner.
K. Earl Reynolds, Chief Executive Officer and DirectorMr. Reynolds joined Chaparral in 2011 as an executive vice president and chief operating officer before being named president in 2014 and chief executive officer in 2017. Prior to which, he served as the senior vice president of strategic development for Devon Energy, where he led the International Business Unit and was actively involved in strategic planning, as well as holding key leadership roles in domestic and international operations with Burlington Resources and Mobil Oil. Mr. Reynolds currently sits on the board for the Oklahoma City YMCA and the Oklahoma Independent Petroleum Association, where he serves as the Chairman of its Legislative Committee.
38
Executive Team
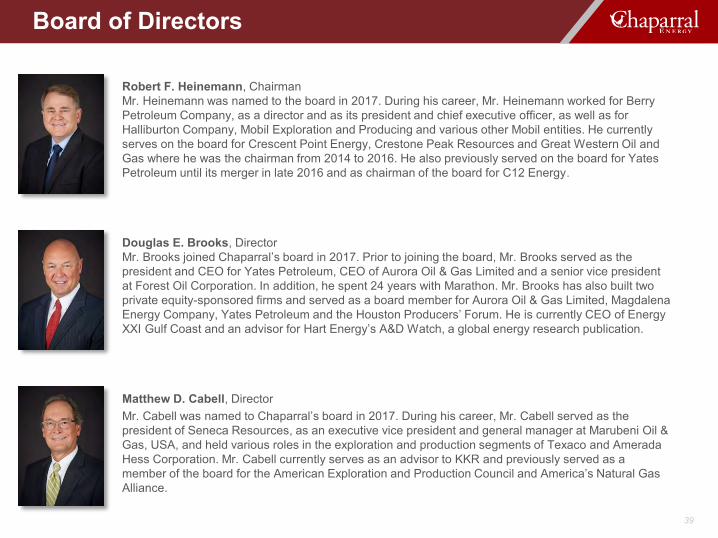
Matthew D. Cabell, DirectorMr. Cabell was named to Chaparral’s board in 2017. During his career, Mr. Cabell served as the president of Seneca Resources, as an executive vice president and general manager at Marubeni Oil & Gas, USA, and held various roles in the exploration and production segments of Texaco and Amerada Hess Corporation. Mr. Cabell currently serves as an advisor to KKR and previously served as a member of the board for the American Exploration and Production Council and America’s Natural Gas Alliance.
Douglas E. Brooks, DirectorMr. Brooks joined Chaparral’s board in 2017. Prior to joining the board, Mr. Brooks served as the president and CEO for Yates Petroleum, CEO of Aurora Oil & Gas Limited and a senior vice president at Forest Oil Corporation. In addition, he spent 24 years with Marathon. Mr. Brooks has also built two private equity-sponsored firms and served as a board member for Aurora Oil & Gas Limited, Magdalena Energy Company, Yates Petroleum and the Houston Producers’ Forum. He is currently CEO of Energy XXI Gulf Coast and an advisor for Hart Energy’s A&D Watch, a global energy research publication.
Robert F. Heinemann, ChairmanMr. Heinemann was named to the board in 2017. During his career, Mr. Heinemann worked for Berry Petroleum Company, as a director and as its president and chief executive officer, as well as for Halliburton Company, Mobil Exploration and Producing and various other Mobil entities. He currently serves on the board for Crescent Point Energy, Crestone Peak Resources and Great Western Oil and Gas where he was the chairman from 2014 to 2016. He also previously served on the board for Yates Petroleum until its merger in late 2016 and as chairman of the board for C12 Energy.
39
Board of Directors

Gysle Shellum, DirectorMr. Shellum was named to Chaparral’s board in 2017. He previously served as the chief financial officer of PDC Energy, Inc. from 2008 until his retirement in 2016. Prior to that time, he was the vice president of finance at CrossTex Energy (now EnLink Midstream). Mr. Shellum is currently an at-large director for the Independent Petroleum Association of America and serves on the University of Colorado Global Energy Management Graduate Program’s Advisory Council.
Kenneth W. Moore, DirectorMr. Moore joined Chaparral’s board in 2017. From 2004 to 2015, he served as a managing director at First Reserve Corporation, a global private equity firm, which invests exclusively in the energy industry. Prior to that time, he served as a vice president at Morgan Stanley New York and as a director for Enstar Group Limited, Chart Industries, Inc. and Dresser-Rand Group Inc. Mr. Moore is currently a member of the board of directors for Cobalt International and previously served on several other boards, including those for Enstar Group, Dresser Rand and Chart Industries.
Samuel Langford, DirectorMr. Langford was named to Chaparral’s board in 2017. He continues to serve as the principal for Langford Upstream Advisory, L.L.C., a position he has held since 2013. Prior to that time, he spent eight years with Newfield Exploration, including roles as the company’s vice president of corporate development, general manager and senior corporate advisor. Before joining Newfield, Mr. Langford spent time at Cockrell Oil Corporation, British Gas E&P, Tenneco Inc., Tenneco Oil Co. and Exxon USA. Mr. Langford is currently also a member of the board of directors for Basic Energy Services.
40
Board of Directors
41
Reserve EstimatesThe SEC permits oil and natural gas companies, in their filings with the SEC, to disclose only proved, probable and possible reserves that meet the SEC’s definitions for such terms. The company may use terms in this presentation that the SEC’s guidelines strictly prohibit in SEC filings, such as estimated ultimate recovery or EUR, resources, net resources, total resource potential and similar terms to estimate oil and natural gas that may ultimately be recovered. These estimates are by their nature more speculative than estimates of proved, probable and possible reserves as used in SEC filings and, accordingly, are subject to substantially greater uncertainty of being actually realized. These estimates have not been fullyrisked by management. Actual quantities that may be ultimately recovered will likely differ substantially from these estimates. Factors affecting ultimate recovery include the scope of the company’s actual drilling program, which will be directly affected by the availability of capital, drilling and production costs, commodity prices, availability of drilling services and equipment, lease expirations, transportation constraints, regulatory approvals, field spacing rules, actual drilling results and recoveries of oil and natural gas in place and other factors. These estimates may change significantly as the development of properties provides additional data.
PV-10PV-10 value is a non-GAAP measure that differs from the standardized measure of discounted future net cash flows in that PV-10 value is a pre-tax number, while the standardized measure of discounted future net cash flows is an after-tax number. We believe that the presentation of the PV-10 value is relevant and useful to investors because it presents the discounted future net cash flows attributable to our proved reserves prior to taking into account future corporate income taxes, and it is a useful measure of evaluating the relative monetary significance of our oil and natural gas properties. Further, investors mayutilize the measure as a basis for comparison of the relative size and value of our reserves to other companies. We use this measure when assessing the potential return on investment related to our oil and natural gas properties. However, PV-10 value is not a substitute for the standardized measure of discounted future net cash flows. Our PV-10 value measure and the standardized measure of discounted future net cash flows do not purport to present the fair value of our oil and natural gas reserves.
Reserve and Non-GAAP Information Statement

42
Reconciliations(in thousands) 2016 2015 2014Net (loss) income ($415,720) ($1,333,844) $209,293
Interest expense 64,242 112,400 104,241Income tax (benefit) expense (102) (177,219) 124,443Depreciation, depletion and amortization 122,928 216,574 245,908Non-cash change in fair value of non-hedge derivative instruments 176,607 88,317 (228,903)Proceeds from monetization of derivatives with a scheduled maturity date more than 12 months from the monetization date excluded from EBITDA (12,810) — —Upfront premiums paid on settled derivative contracts (20,608) — (664)Interest income (188) (192) (117)Stock-based compensation expense (5,238) (1,477) 3,172Loss (gain) on sale of assets 117 (1,584) (2,152)Gain on extinguishment of debt — (31,590) —Write-off of senior note issuance costs, discount and premium 16,970 — —Loss on impairment of oil and gas assets 281,079 1,491,129 —Loss on impairment of other assets 1,393 16,207 —Restructuring, reorganization and other 19,599 10,028 —
Adjusted EBITDA $228,269 $388,749 $455,221
(in thousands) 2016 2015 2014PV-10 value $528,781 $731,426 $2,547,204Present value of future income tax discounted at 10% — (46,737) (652,504)Standard measure of discounted future net cash flows $528,781 $684,689 $1,894,700
Reconciliations

ENERGIZINGAmerica’s Heartland


