Emissions from Natural Gas Production in the Barnett Shale Area and Opportunities for Cost-Effec tive Improvementsreport by: Al Armendariz, Ph.D. Department of Environmental and Civil Engineering Southern Methodist University P.O. Box 750340 Dallas, Texas, 75275-0340 for: Ramon Alvarez, Ph.D. Environmental Defense Fund 44 East Avenue Suite 304 Austin, Texas 78701 Version 1.1 January 26, 2009
Natural gas production in the Barnett Shale region of Texas has increased rapidly since 1999, and as of June 2008, over 7700 oil and gas wells had been installed and another 4700 wells were pending. Gasproduction in 2007 was approximately 923 Bcf from wells in 21 counties. Natural gas is a criticalfeedstock to many chemical production processes, and it has many environmental benefits over coal as a
fuel for electricity generation, including lower emissions of sulfur, metal compounds, and carbon dioxide.Nevertheless, oil and gas production from the Barnett Shale area can impact local air quality and releasegreenhouse gases into the atmosphere. The objectives of this study were to develop an emissionsinventory of air pollutants from oil and gas production in the Barnett Shale area, and to identify cost-effective emissions control options.
Emission sources from the oil and gas sector in the Barnett Shale area were divided into point sources,which included compressor engine exhausts and oil/condensate tanks, as well as fugitive and intermittentsources, which included production equipment fugitives, well drilling and fracing engines, wellcompletions, gas processing, and transmission fugitives. The air pollutants considered in this inventorywere smog-forming compounds (NOx and VOC), greenhouse gases, and air toxic chemicals.
For 2009, emissions of smog-forming compounds from compressor engine exhausts and tanks werepredicted to be approximately 96 tons per day (tpd) on an annual average, with peak summer emissions of 212 tpd. Emissions during the summer increase because of the effects of temperature on volatile organiccompound emissions from storage tanks. Emissions of smog-forming compounds in 2009 from all oil andgas sources were estimated to be approximately 191 tpd on an annual average, with peak summeremissions of 307 tpd. The portion of those emissions originating from the 5-counties in the D-FWmetropolitan area with significant oil and gas production was 165 tpd during the summer.
For comparison, 2009 emission inventories recently used by state and federal regulators estimated smog-forming emissions from all airports in the Dallas-Fort Worth metropolitan area to be 16 tpd. In addition,these same inventories had emission estimates for on-road motor vehicles (cars, trucks, etc.) in the 9-county Dallas-Fort Worth metropolitan area of 273 tpd. The portion of on-road motor vehicle emissions
from the 5-counties in the D-FW metropolitan area with significant oil and gas production was 121 tpd,indicating that the oil and gas sector likely has greater emissions than motor vehicles in these counties.
The emission rate of air toxic compounds (like benzene and formaldehyde) from Barnett Shale activitieswas predicted to be approximately 6 tpd on an annual average, and 17 tpd during peak summer days. Thelargest contributors to air toxic emissions were the condensate tanks, followed by the engine exhausts.
In addition, predicted 2009 emissions of greenhouse gases like carbon dioxide and methane wereapproximately 33,000 tons per day of CO2 equivalent. This is roughly equivalent to the expectedgreenhouse gas impact from two 750 MW coal-fired power plants. The largest contributors to the BarnettShale greenhouse gas impact were CO2 emissions from compressor engine exhausts and fugitive CH4 emissions from all source types.
Cost effective control strategies are readily available that can substantially reduce emissions, and in somecases, reduce costs for oil and gas operators. These options include:
• use of "green completions" to capture methane and VOC compounds during well completions,
• phasing in electric motors as an alternative to internal-combustion engines to drive compressors,
• the control of VOC emissions from condensate tanks with vapor recovery units, and
• replacement of high-bleed pneumatic valves and fittings on the pipeline networks with no-bleedalternatives.
The Barnett Shale is a geological formation that the Texas Railroad Commission (RRC) estimates toextend 5000 square miles in parts of at least 21 Texas counties. The hydrocarbon productive region of the
Barnett Shale has been designated as the Newark East Field, and large scale development of the naturalgas resources in the field began in the late 1990's. Figure 1 shows the rapid and continuing developmentof natural gas from the Barnett Shale over the last 10 years.(1)
0
200
400
600
800
1000
1200
1998 1999 2000 2001 2002 2003 2004 2005 2006 2007
N a t u r a l G a s P r o d u c t i o n
( b i l l i o n
c f )
Figure 1. Barnett Shale Natural Gas Production, 1998-2007.
In addition to the recent development of the Barnett Shale, oil and gas production from other geologicformations and conventional sources in north central Texas existed before 1998 and continues to thepresent time. Production from the Barnett Shale is currently the dominant source of hydrocarbonproduction in the area from oil and gas activities in the area. Emission sources for all oil and gas activitiesare considered together in this report.
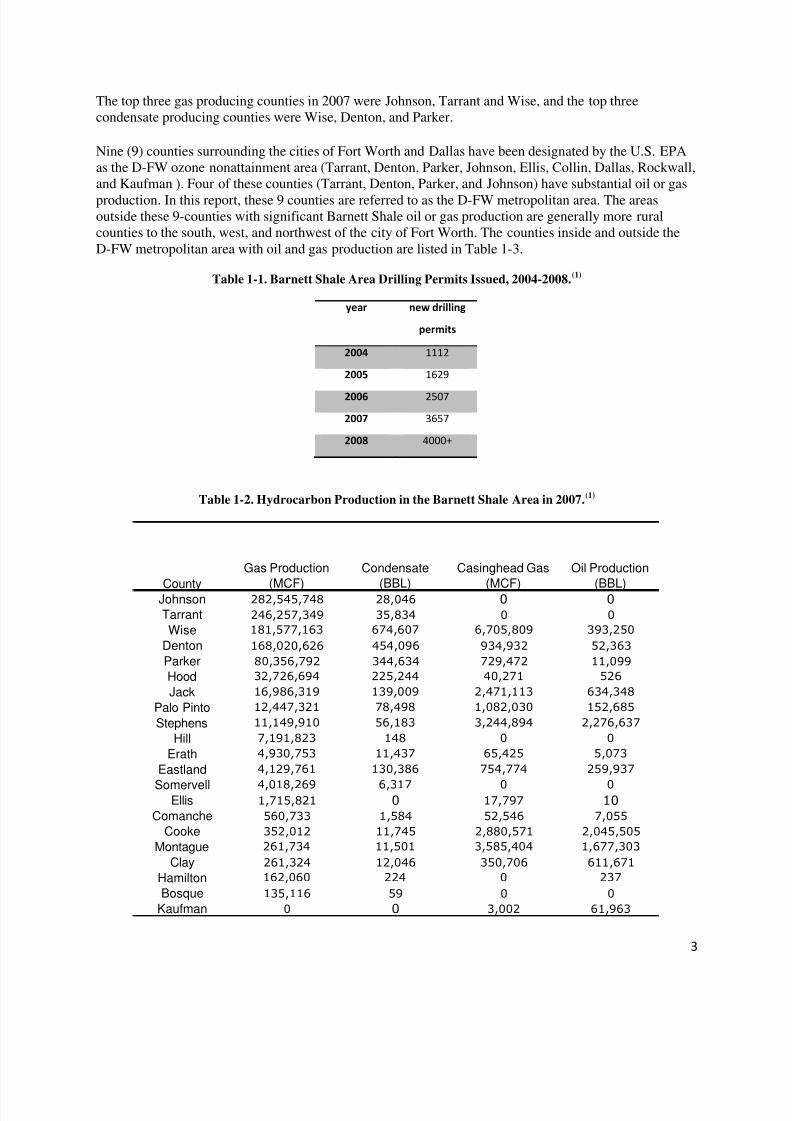
The issuance of new Barnett Shale area drilling permits has been following the upward trend of increasingnatural gas production. The RRC issued 1112 well permits in 2004, 1629 in 2005, 2507 in 2006, 3657 in
2007, and they are on-track to issue over 4000 permits in 2008. The vast majority of the wells and permitsare for natural gas production, but a small number of oil wells are also in operation or permitted in thearea, and some oil wells co-produce casinghead gas. As of June 2008, over 7700 wells had beenregistered with the RRC, and the permit issuance rates are summarized in Table 1-1.(1) Annual oil, gas,condensate, and casinghead gas production rates for 21 counties in the Barnett Shale area are shown inTable 1-2.(1) The majority of Barnett Shale wells and well permits are located in six counties near the cityof Fort Worth: Tarrant, Denton, Wise, Parker, Hood, and Johnson Counties. Figure 2 shows a RRC mapof wells and well permits in the Barnett Shale.(2)
The top three gas producing counties in 2007 were Johnson, Tarrant and Wise, and the top threecondensate producing counties were Wise, Denton, and Parker.
Nine (9) counties surrounding the cities of Fort Worth and Dallas have been designated by the U.S. EPAas the D-FW ozone nonattainment area (Tarrant, Denton, Parker, Johnson, Ellis, Collin, Dallas, Rockwall,and Kaufman ). Four of these counties (Tarrant, Denton, Parker, and Johnson) have substantial oil or gas
production. In this report, these 9 counties are referred to as the D-FW metropolitan area. The areasoutside these 9-counties with significant Barnett Shale oil or gas production are generally more ruralcounties to the south, west, and northwest of the city of Fort Worth. The counties inside and outside theD-FW metropolitan area with oil and gas production are listed in Table 1-3.
Table 1-1. Barnett Shale Area Drilling Permits Issued, 2004-2008.(1)
Table 1-2. Hydrocarbon Production in the Barnett Shale Area in 2007.(1)
2.2 Air Pollutants and Air Quality Regulatory Efforts
Oil and gas activities in the Barnett Shale area have the potential to emit a variety of air pollutants,including greenhouse gases, ozone and fine particle smog-forming compounds, and air toxic chemicals.The state of Texas has the highest greenhouse gas (GHG) emissions in the U.S., and future federal effortsto reduce national GHG emissions are likely to require emissions reductions from sources in the state.
The three anthropogenic greenhouse gases of greatest concern, carbon dioxide, methane, and nitrousoxide, are emitted from oil and gas sources in the Barnett Shale area.
At present, air quality monitors in the Dallas-Fort Worth area show the area to be in compliance with the1997 fine particulate matter (PM2.5) air quality standard, which is 15 micrograms per cubic meter (µg/m3)on an annual average basis. In 2006, the Clean Air Scientific Advisory Committee for EPA recommendedtightening the standard to as low as 13 µg/m3 to protect public health, but the EPA administrator kept thestandard at the 1997 level. Fine particle air quality monitors in the Dallas-Fort Worth area have beenabove the 13 µg/m3 level several times during the 2000-2007 time period, and tightening of the fineparticle standard by future EPA administrators will focus regulatory attention at sources that emit fineparticles or fine particle-forming compounds like NOx and VOC gases.
2.3 Primary Emission Sources Involved in Barnett Shale Oil and Gas Production
There are a variety of activities that potentially create air emissions during oil and gas production in theBarnett Shale area. The primary emission sources in the Barnett Shale oil and gas sector includecompressor engine exhausts, oil and condensate tank vents, production well fugitives, well drilling andhydraulic fracturing, well completions, natural gas processing, and transmission fugitives. Figure 3 showsa diagram of the major machinery and process units in the natural gas system.(3)
2.3.1 – Point Sources
i. Compressor Engine Exhausts
Internal combustion engines provide the power to run compressors that assist in the production of naturalgas from wells, pressurize natural gas from wells to the pressure of lateral lines, and power compressorsthat move natural gas in large pipelines to and from processing plants and through the interstate pipelinenetwork. The engines are often fired with raw or processed natural gas, and the combustion of the naturalgas in these engines results in air emissions. Most of the engines driving compressors in the Barnett Shalearea are between 100 and 500 hp in size, but some large engines of 1000+ hp are also used.
ii. Condensate and Oil Tanks
Fluids that are brought to the surface at Barnett Shale natural gas wells are a mixture of natural gas, othergases, water, and hydrocarbon liquids. Some gas wells produce little or no condensate, while othersproduce large quantities. The mixture typically is sent first to a separator unit, which reduces the pressure
of the fluids and separates the natural gas and other gases from any entrained water and hydrocarbonliquids. The gases are collected off the top of the separator, while the water and hydrocarbon liquids fallto the bottom and are then stored on-site in storage tanks. The hydrocarbon liquid is known as condensate.
Figure 3. Major Units in The Natural Gas Industry From Wells to Customers. (3)
The condensate tanks at Barnett Shale wells are typically 10,000 to 20,000 gallons and hydrocarbonsvapors from the condensate tanks can be emitted to the atmosphere through vents on the tanks.Condensate liquid is periodically collected by truck and transported to refineries for incorporation intoliquid fuels, or to other processors. At oil wells, tanks are used to store crude oil on-site before the oil istransported to refiners. Like the condensate tanks, oil tanks can be sources of hydrocarbon vaporemissions to the atmosphere through tank vents.
2.3.2 – Fugitive and Intermittent Sources
i. Production Fugitive Emissions
Natural gas wells can contain a large number of individual components, including pumps, flanges, valves,gauges, pipe connectors, compressors, and other pieces. These components are generally intended to betight, but leaks are not uncommon and some leaks can result in large emissions of hydrocarbons andmethane to the atmosphere. The emissions from such leaks are called "fugitive" emissions. These fugitiveemissions can be caused by routine wear, rust and corrosion, improper installation or maintenance, oroverpressure of the gases or liquids in the piping. In addition to the unintended fugitive emissions,pneumatic valves which operate on pressurized natural gas leak small quantities of natural gas by designduring normal operation. Natural gas wells, processing plants, and pipelines often contain large numbersof these kinds of pneumatic valves, and the accumulated emissions from all the valves in a system can besignificant.
ii. Well Drilling, Hydraulic Fracturing, and Completions
Oil and gas drilling rigs require substantial power to from wellbores by driving drill bits to the depths of hydrocarbon deposits. In the Barnett Shale, this power is typically provided by transportable dieselengines, and operation of these engines generates exhaust from the burning of diesel fuel. After thewellbore is formed, additional power is needed to operate the pumps that move large quantities of water,
sand/glass, or chemicals into the wellbore at high pressure to hydraulically fracture the shale to increaseits surface area and release natural gas.
After the wellbore is formed and the shale fractured, an initial mixture of gas, hydrocarbon liquids, water,sand, or other materials comes to the surface. The standard hardware typically used at a gas well,including the piping, separator, and tanks, are not designed to handle this initial mixture of wet and
abrasive fluid that comes to the surface. Standard practice has been to vent or flare the natural gas duringthis "well completion" process, and direct the sand, water, and other liquids into ponds or tanks. Aftersome time, the mixture coming to the surface will be largely free of the water and sand, and then the wellwill be connected to the permanent gas collecting hardware at the well site. During well completions, theventing/flaring of the gas coming to the surface results in a loss of potential revenue and also insubstantial methane and VOC emissions to the atmosphere.
iii. Natural Gas Processing
Natural gas produced from wells is a mixture of a large number of gases and vapors. Wellhead natural gasis often delivered to processing plants where higher molecular weight hydrocarbons, water, nitrogen, andother compounds are largely removed if they are present. Processing results in a gas stream that is
enriched in methane at concentrations of usually more than 80%. Not all natural gas requires processing,and gas that is already low in higher hydrocarbons, water, and other compounds can bypass processing.
Processing plants typically include one or more glycol dehydrators, process units that dry the natural gas.In addition to water, the glycol absorbent usually collects significant quantities of hydrocarbons, whichcan be emitted to the atmosphere when the glycol is regenerated with heat. The glycol dehydrators,pumps, and other machinery used in natural gas processing can release methane and hydrocarbons intothe atmosphere, and emissions also originate from the numerous flanges, valves, and other fittings.
iv. Natural Gas Transmission Fugitives
Natural gas is transported from wells in mostly underground gathering lines that form networks that can
eventually collect gas from hundreds or thousands of well locations. Gas is transported in pipelinenetworks from wells to processing plants, compressor stations, storage formations, and/or the interstatepipeline network for eventual delivery to customers. Leaks from pipeline networks, from microscopicholes, corrosion, welds and other connections, as well as from compressor intake and outlet seals,compressor rod packing, blow and purge operations, pipeline pigging, and from the large number of pneumatic devices on the pipeline network can result in large emissions of methane and hydrocarbonsinto the atmosphere and lost revenue for producers.
2.4 Objectives
Barnett Shale area oil and gas production can emit pollutants to the atmosphere which contribute to ozoneand fine particulate matter smog, are known toxic chemicals, or contribute to climate change. The
objectives of this study were to examine Barnett Shale oil and gas activities and : (1) estimate emissionsof volatile organic compounds, nitrogen oxides, hazardous air pollutants, methane, carbon dioxide, andnitrous oxide; (2) evaluate the current state of regulatory controls and engineering techniques used tocontrol emissions from the oil and gas sector in the Barnett Shale; (3) identify new approaches that can betaken to reduce emissions from Barnett Shale activities; and (4) estimate the emissions reductions andcost effectiveness of implementation of new emission reduction methods.
Estimates were made of 2007 and 2009 emissions of smog forming, air toxic, and greenhouse gascompounds, including nitrogen oxides (NOx), volatile organic compounds (VOCs), air toxics a.k.a.
hazardous air pollutants (HAPs), methane (CH4), nitrous oxide (N2O), and carbon dioxide (CO2). Volatileorganic compounds are generally carbon and hydrogen-based chemicals that exist in the gas phase or canevaporate from liquids. VOCs can react in the atmosphere to form ozone and fine particulate matter.Methane and ethane are specifically excluded from the definition of VOC because they react slower thanthe other VOC compounds to produce ozone and fine particles, but they are ozone-causing compoundsnonetheless. The HAPs analyzed in this report are a subset of the VOC compounds, and include thosecompounds that are known or believed to cause human health effects at low doses. An example of a HAPcompound is benzene, which is an organic compound known to contribute to the development of cancer.
Emissions of the greenhouse gases CO2, CH4, and N2O were determined individually, and then combinedas carbon dioxide equivalent tons (CO2e). In the combination, CH4 tons were scaled by 21 and N2O tonsby 310 to account for the higher greenhouse gas potentials of these gases.(4)
Emissions in 2009 were estimated by examining recent trends in Barnett Shale hydrocarbon production,and where appropriate, extrapolating production out to 2009.
State regulatory programs are different for compressor engines inside the D-FW 9-county metropolitanarea compared to outside. Engine emissions were determined separately for the two groups.
3.2 Hydrocarbon Production
Production rates in 2007 for oil, gas, casinghead gas, and condensate were obtained from the TexasRailroad Commission for each county in the Barnett Shale area.(5) The large amount of production fromwells producing from the Barnett Shale, as well as the smaller amounts of production from conventional
formations in the area were taken together. The area was analyzed in whole, as well as by counties insideand outside the D-FW 9-county metropolitan area. Production rates in 2009 were predicted by plottingproduction rates from 2000-2007 and fitting a 2nd-order polynomial to the production rates via the least-squares method and extrapolating out to 2009.
3.3 Compressor Engine Exhausts - Emission Factors and Emission Estimates
Emissions from the natural-gas fired compressor engines in the Barnett Shale were calculated for twotypes of engines: the generally large engines that had previously reported emissions into the TCEQ's PointSource Emissions Inventory (PSEI) prior to 2007 (a.k.a. PSEI Engines), and the generally smaller enginesthat had not previously reported emissions (a.k.a. non-PSEI Engines). Both these engine types are locatedin the D-FW 9-county metropolitan area (a.k.a. D-FW Metro Area), as well as in the rural counties
outside the metropolitan area (a.k.a. Outside D-FW Metro Area). The four categories of engines aresummarized in Figure 4 and the methods used to estimate emissions from the engines are described in thefollowing sections.
Large natural gas compressor engines, located primarily at compressor stations and also some at wellsites, have typically reported emissions to the Texas Commission on Environmental Quality (TCEQ) inannual Point Source Emissions Inventory (PSEI) reports. However, prior to 2007, many other stationaryengines in the Barnett Shale area had not reported emissions to the PSEI and their contribution to regionalair quality was unknown. In late 2007, the TCEQ conducted an engine survey for counties in the D-FWmetropolitan area as part as efforts to amend the state clean air plan for ozone. Engine operators reportedengine counts, engine sizes, NOx emissions, and other data to TCEQ. Data summarized by TCEQ from
the survey was used for this report to estimate emissions from natural gas engines in the Barnett Shalearea that had previously not reported emissions into the annual PSEI.(6) Data obtained from TCEQincluded total operating engine power in the metropolitan area, grouped by rich vs. lean burn engines, andalso grouped by engines smaller than 50 hp, between 50 - 500 hp, and larger than 500 hp.
Regulations adopted by TCEQ and scheduled to take effect in early 2009 will limit NOx emissions in theD-FW metropolitan area for engines larger than 50 horsepower.(7) Rich burn engines will be restricted to0.5 g/hp-hr, lean burn engines installed or moved before June 2007 will be restricted to 0.7 g/hp-hr, andlean burn engines installed or moved after June 2007 will be limited to 0.5 g/hp-hr. For this report,emissions in 2009 from the engines in the metropolitan area subject to the new rules were estimatedassuming 97% compliance with the upcoming rules and a 3% noncompliance factor for enginescontinuing to emit at pre-2009 levels.
Emissions for 2007 were estimated using NOx emission factors provided by operators to TCEQ in the2007 survey.(6) Emissions of VOCs were determined using TCEQ-determined emission factors, andemissions of HAPs, CH4, and CO2 were determined using emission factors from EPA's AP-42document.(8,9) In AP-42, EPA provides emission factors for HAP compounds that are created byincomplete fuel combustion. For this report only those factors which were judged by EPA to be of highquality, "A" or "B" ratings, were used to estimate emissions. Emission factors for the greenhouse gas N2Owere from an emissions inventory report issued by the American Petroleum Institute.(10)
Beginning in 2009, many engines subject to the new NOx limits are expected to reduce their emissionswith the installation of non-selective catalytic reduction units (NSCR), a.k.a. three-way catalysts. NSCRunits are essentially modified versions of the "catalytic converters" that are standard equipment on every
gasoline-engine passenger vehicle in the U.S.
A likely co-benefit of NSCR installation will be the simultaneous reduction of VOC, HAP, and CH4 emissions. Emissions from engines expected to install NSCR units were determined using a 75%emissions reduction factor for VOC, HAPs, and CH4. Conversely, NSCR units are known to increase N2Oemissions, and N2O emissions were estimated using a 3.4x factor increase over uncontrolled emissionfactors.(10) Table 2 summarizes the emission factors used to calculate emissions from the compressorengines identified in the 2007 survey.
notes:a: email from TCEQ to SMU, August 1, 2008, summary of results from 2007 engine survey
(reference 6).b: email from TCEQ to SMU, August 6, 2008 (reference 8).c: EPA, AP-42, quality A and B emission factors; rich engine HAPs = benzene, formaldehyde,
toluene, xylene (reference 9).d: EPA, AP-42 (reference 9).e: EPA, AP-42 (reference 9).f: API Compendium Report (reference 10).g: engines installed or moved before June 2007 - TCEQ regulations establish different regulatory
limits for engines installed or moved before or after June 2007 (reference 7).h: engines installed or moved after June 2007 - TCEQ regulations establish different regulatory
limits for engines installed or moved before or after June 2007 (reference 7).i: rich (<50) factor from email from TCEQ to SMU, August 1, 2008 (reference 6); rich (50-500),
j: rich (<50) from email from TCEQ to SMU (reference 8); rich (50-500) and rich (>500)estimated with 75% NSCR control VOC co-benefit; lean EFs from email from TCEQ to SMU(reference 8). Large lean engine VOC emission factor adjusted from 1.6 to 1.45 to account forthe effects of NSPS JJJJ rules on VOC emissions.
k: EPA, AP-42 (reference 9); rich (50-500) and rich (>500) estimated with 75% control co-benefit.l: EPA, AP-42 (reference 9); rich (50-500) and rich (>500) estimated with 75% control co-benefit.m: EPA, AP-42 (reference 9).n: API Compendium Report (reference 10); rich (50-500) and rich (>500) estimated with 3.4x
Annual emissions from the engines identified in the 2007 survey were estimated using the pollutant-specific emission factors from Table 1 together with Equation 1,
M E,i = 1.10E-06 * E i * Pcap * F hl (1)
where M E,i was the mass emission rate of pollutant i in tons per year, E i was the emission factor for
pollutant i in grams/hp-hr, Pcap is installed engine capacity in hp, and F hl is a factor to adjust for annualhours of operation and typical load conditions.
Installed engine capacity in 2007 was determined for six type/size categories using TCEQ estimates fromthe 2007 engine survey - two engine types (rich vs. lean) and three engine size ranges (<50, 50-500, >500hp) were included.(6) TCEQ estimates of the average engine sizes and the numbers of engines in each sizecategory were used to calculate the installed engine capacity for each category, as shown in Table 3. TheF hl factor was used to account for typical hours of annual operation and average engine loads. A F hl valueof 0.5 was used for this study, based on 8000 hours per year of average engine operation (8000/8760 =0.91) and operating engine loads of 55% of rated capacity, giving an overall hours-load factor of 0.91x0.55 = 0.5.(11)
Table 3. Installed Engine Capacity in 2007 D-FW Engine Survey by Engine Type and Size
engine type engine size(hp)
number of enginesq
typical sizeq
(hp)installed
capacityr (hp)
rich <50 12 50 585
rich 50-500 724 140 101,000
rich >500 200 1400 280,000
leano <500 14 185 2540
leanp <500 13 185 2400
leano >500 103 1425 147,000
leanp >500 103 1425 147,000
notes:o: engines installed or moved before June 2007 - TCEQ regulations establish different regulatory
limits for engines installed or moved before or after June 2007 (reference 7).p: engines installed or moved after June 2007 - TCEQ regulations establish different regulatory
limits for engines installed or moved before or after June 2007 (reference 7).q: rich (<50) installed capacity based on HARC October 2006 H68 report which found that small
rich burn engines comprise no more than 1% of engines in East Texas; rich (50-500) and rich(>500) installed capacity from email TCEQ to SMU in August 1, 2008 (reference 6); lean burninstalled capacity from email TCEQ to SMU in August 1, 2008 (reference 6) along with RRCdata suggesting that 50% of engines in 2009 will be subject to the post-June 2007 NOx rule.
r: installed capacity = number of engines x typical size
ii. PSEI Engines in D-FW Metropolitan Area
In addition to the engines identified in the 2007 TCEQ survey of the D-FW 9-county metropolitan area,many other stationary engines are also in use in the area. These include engines that had already beenreporting annual emissions to TCEQ in the PSEI, which are principally large engines at compressorstations.(12)
Emissions of NOx from large engines in the D-FW metropolitan area that were reporting to the TCEQPSEI were obtained from the 2006 Annual PSEI, the most recent calendar year available.(12) Emissions for2007 and 2009 were estimated by extrapolating 2006 emissions upward to account for increases in gasproduction and compression needs from 2006-2009. For NOx emissions in 2006 and 2007, an averageemission factor of 0.9 g/hp-hr was obtained from TCEQ.(8) Emissions in 2009 were adjusted byaccounting for the 0.5 g/hp-hr TCEQ regulatory limit scheduled to take effect in early 2009 for the D-FW
metropolitan area.(7)
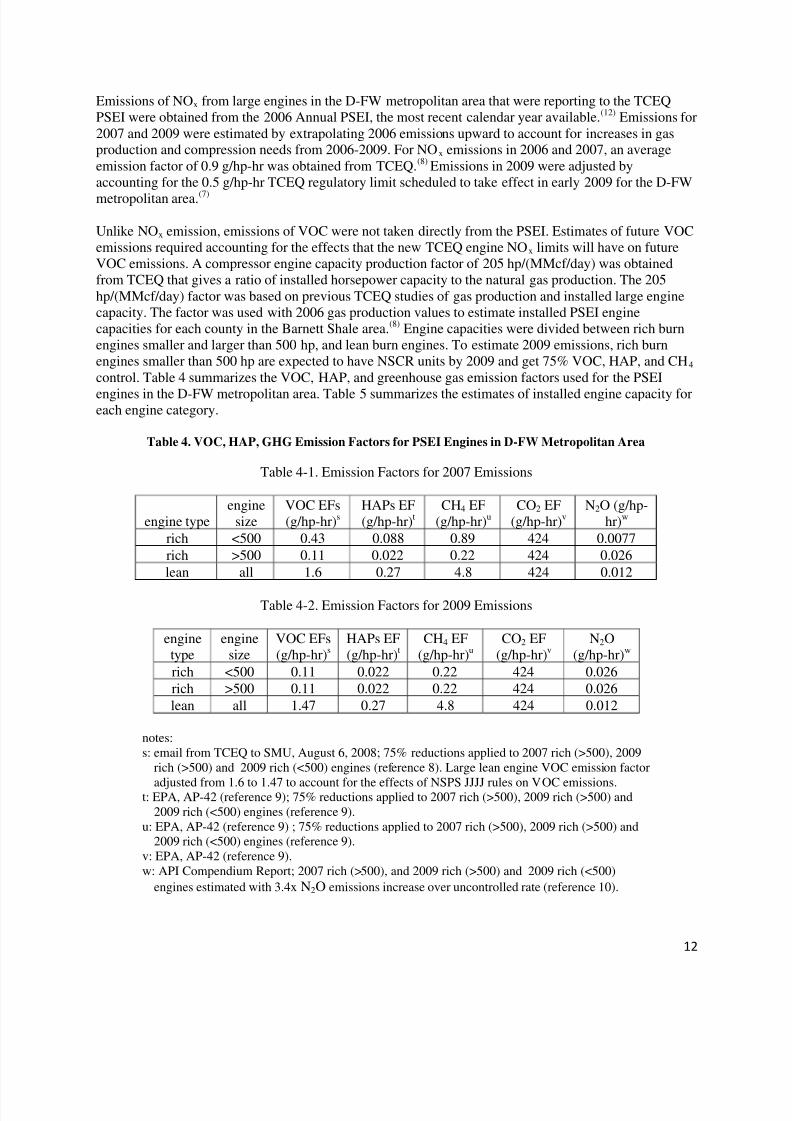
Unlike NOx emission, emissions of VOC were not taken directly from the PSEI. Estimates of future VOCemissions required accounting for the effects that the new TCEQ engine NOx limits will have on futureVOC emissions. A compressor engine capacity production factor of 205 hp/(MMcf/day) was obtainedfrom TCEQ that gives a ratio of installed horsepower capacity to the natural gas production. The 205hp/(MMcf/day) factor was based on previous TCEQ studies of gas production and installed large enginecapacity. The factor was used with 2006 gas production values to estimate installed PSEI enginecapacities for each county in the Barnett Shale area.(8) Engine capacities were divided between rich burnengines smaller and larger than 500 hp, and lean burn engines. To estimate 2009 emissions, rich burnengines smaller than 500 hp are expected to have NSCR units by 2009 and get 75% VOC, HAP, and CH4 control. Table 4 summarizes the VOC, HAP, and greenhouse gas emission factors used for the PSEI
engines in the D-FW metropolitan area. Table 5 summarizes the estimates of installed engine capacity foreach engine category.
Table 4. VOC, HAP, GHG Emission Factors for PSEI Engines in D-FW Metropolitan Area
notes:s: email from TCEQ to SMU, August 6, 2008; 75% reductions applied to 2007 rich (>500), 2009
rich (>500) and 2009 rich (<500) engines (reference 8). Large lean engine VOC emission factor
adjusted from 1.6 to 1.47 to account for the effects of NSPS JJJJ rules on VOC emissions.t: EPA, AP-42 (reference 9); 75% reductions applied to 2007 rich (>500), 2009 rich (>500) and2009 rich (<500) engines (reference 9).
Table 5. Installed Engine Capacity in 2007 for PSEI Engines Inside D-FW Metropolitan Area
enginetype
engine size(hp)
installedcapacity
(%)x
installedcapacity
(hp)y
rich <500 0.14 59,500
rich >500 0.52 221,000lean all 0.34 144,000
notes:x: distribution of engine types and sizes estimated from October 2006 HARC study (reference 13).y: estimated as the installed capacity (%) x the total installed capacity based on the TCEQ
compressor engine capacity production factor of 205 hp/(MMcf/day) (references 5,8).
iii. PSEI Engines Outside D-FW Metropolitan Area
Emissions of NOx from large engines outside the D-FW metropolitan area reporting to the TCEQ wereobtained from the 2006 PSEI.(12) Emissions for 2007 and 2009 were estimated by extrapolating 2006emissions upward to account for increases in gas production from 2006-2009. Unlike engines inside the
metropolitan area, the engines outside the metropolitan area are not subject to the new D-FW engine rulesscheduled to take effect in 2009.
In addition to the D-FW engine rules, in 2007 the TCEQ passed the East Texas Combustion Rule thatlimited NOx emissions from rich-burn natural gas engines larger than 240 hp in certain east Texascounties. Lean burn engines and engines smaller than 240 hp were exempted. The initial proposed rulewould have applied to some counties in the Barnett Shale production area, including Cooke, Wise, Hood,Somervell, Bosque, and Hill, but in the final version of the rule these counties were removed fromapplicability, with the exception of Hill, which is still covered by the rule. Since gas production from HillCounty is less than 3.5% of all the Barnett Shale area gas produced outside the D-FW metropolitan area,the East Texas Combustion Rule has limited impact to emissions from Barnett Shale area activity.
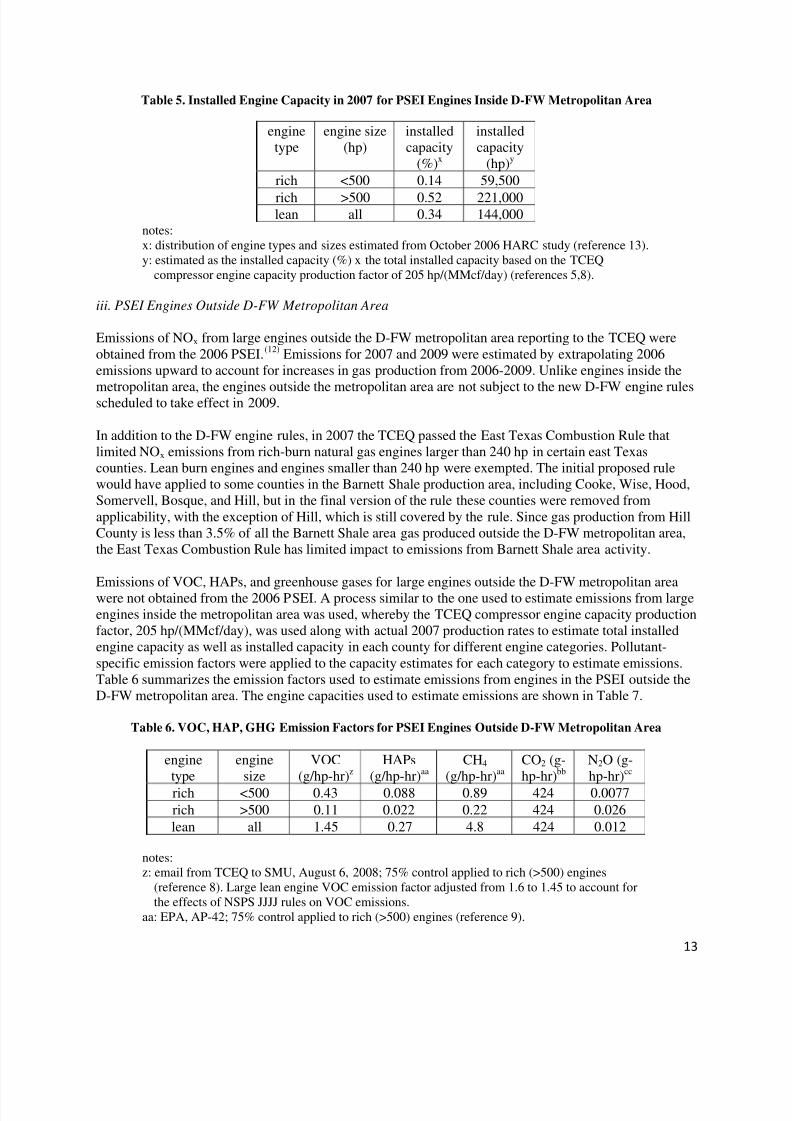
Emissions of VOC, HAPs, and greenhouse gases for large engines outside the D-FW metropolitan areawere not obtained from the 2006 PSEI. A process similar to the one used to estimate emissions from largeengines inside the metropolitan area was used, whereby the TCEQ compressor engine capacity productionfactor, 205 hp/(MMcf/day), was used along with actual 2007 production rates to estimate total installedengine capacity as well as installed capacity in each county for different engine categories. Pollutant-specific emission factors were applied to the capacity estimates for each category to estimate emissions.Table 6 summarizes the emission factors used to estimate emissions from engines in the PSEI outside theD-FW metropolitan area. The engine capacities used to estimate emissions are shown in Table 7.
Table 6. VOC, HAP, GHG Emission Factors for PSEI Engines Outside D-FW Metropolitan Area
enginetype
enginesize
VOC(g/hp-hr)z
HAPs(g/hp-hr)aa
CH4 (g/hp-hr)aa
CO2 (g-hp-hr)bb
N2O (g-hp-hr)cc
rich <500 0.43 0.088 0.89 424 0.0077
rich >500 0.11 0.022 0.22 424 0.026
lean all 1.45 0.27 4.8 424 0.012
notes:z: email from TCEQ to SMU, August 6, 2008; 75% control applied to rich (>500) engines
(reference 8). Large lean engine VOC emission factor adjusted from 1.6 to 1.45 to account forthe effects of NSPS JJJJ rules on VOC emissions.
aa: EPA, AP-42; 75% control applied to rich (>500) engines (reference 9).
bb. EPA, AP-42 (reference 9).cc. API Compendium Report; rich (>500) engines estimated with 3.4x N2O emissions increase
over uncontrolled rate (reference 10).
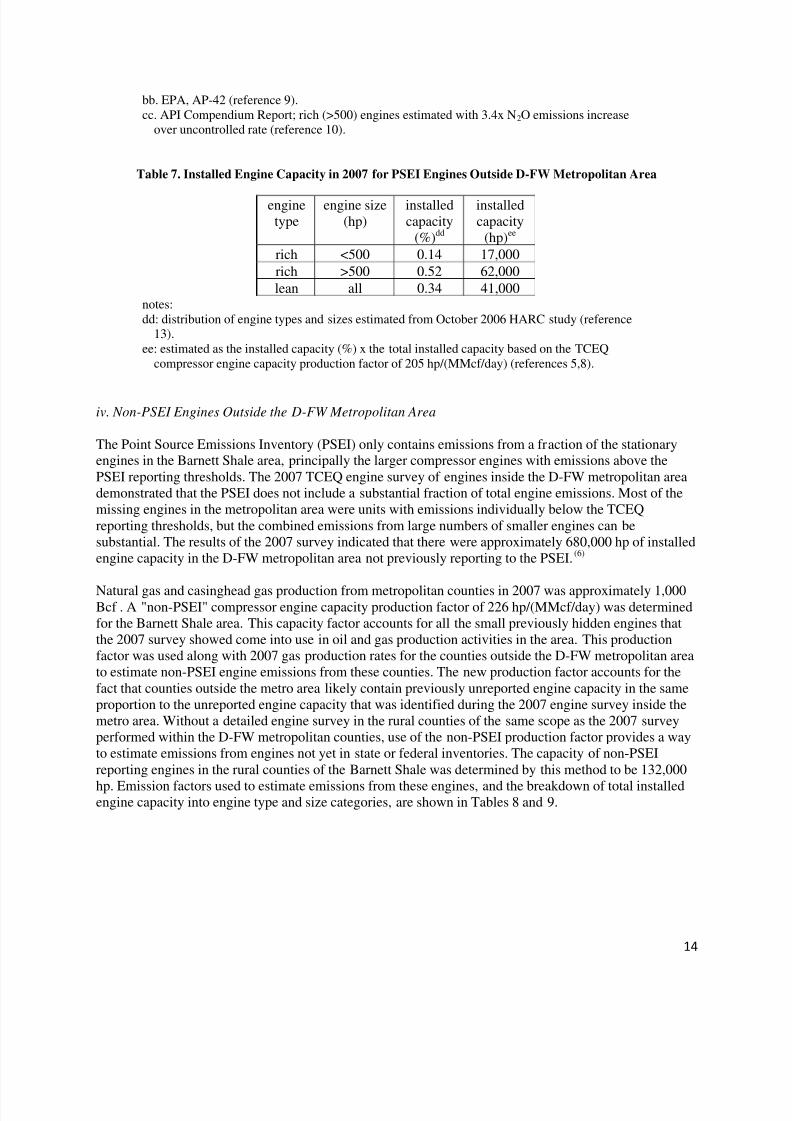
Table 7. Installed Engine Capacity in 2007 for PSEI Engines Outside D-FW Metropolitan Area
enginetype
engine size(hp)
installedcapacity
(%)dd
installedcapacity
(hp)ee
rich <500 0.14 17,000
rich >500 0.52 62,000
lean all 0.34 41,000notes:dd: distribution of engine types and sizes estimated from October 2006 HARC study (reference
13).ee: estimated as the installed capacity (%) x the total installed capacity based on the TCEQ
compressor engine capacity production factor of 205 hp/(MMcf/day) (references 5,8).
iv. Non-PSEI Engines Outside the D-FW Metropolitan Area
The Point Source Emissions Inventory (PSEI) only contains emissions from a fraction of the stationaryengines in the Barnett Shale area, principally the larger compressor engines with emissions above thePSEI reporting thresholds. The 2007 TCEQ engine survey of engines inside the D-FW metropolitan areademonstrated that the PSEI does not include a substantial fraction of total engine emissions. Most of themissing engines in the metropolitan area were units with emissions individually below the TCEQreporting thresholds, but the combined emissions from large numbers of smaller engines can besubstantial. The results of the 2007 survey indicated that there were approximately 680,000 hp of installedengine capacity in the D-FW metropolitan area not previously reporting to the PSEI.(6)
Natural gas and casinghead gas production from metropolitan counties in 2007 was approximately 1,000Bcf . A "non-PSEI" compressor engine capacity production factor of 226 hp/(MMcf/day) was determinedfor the Barnett Shale area. This capacity factor accounts for all the small previously hidden engines thatthe 2007 survey showed come into use in oil and gas production activities in the area. This productionfactor was used along with 2007 gas production rates for the counties outside the D-FW metropolitan areato estimate non-PSEI engine emissions from these counties. The new production factor accounts for thefact that counties outside the metro area likely contain previously unreported engine capacity in the sameproportion to the unreported engine capacity that was identified during the 2007 engine survey inside themetro area. Without a detailed engine survey in the rural counties of the same scope as the 2007 surveyperformed within the D-FW metropolitan counties, use of the non-PSEI production factor provides a wayto estimate emissions from engines not yet in state or federal inventories. The capacity of non-PSEIreporting engines in the rural counties of the Barnett Shale was determined by this method to be 132,000
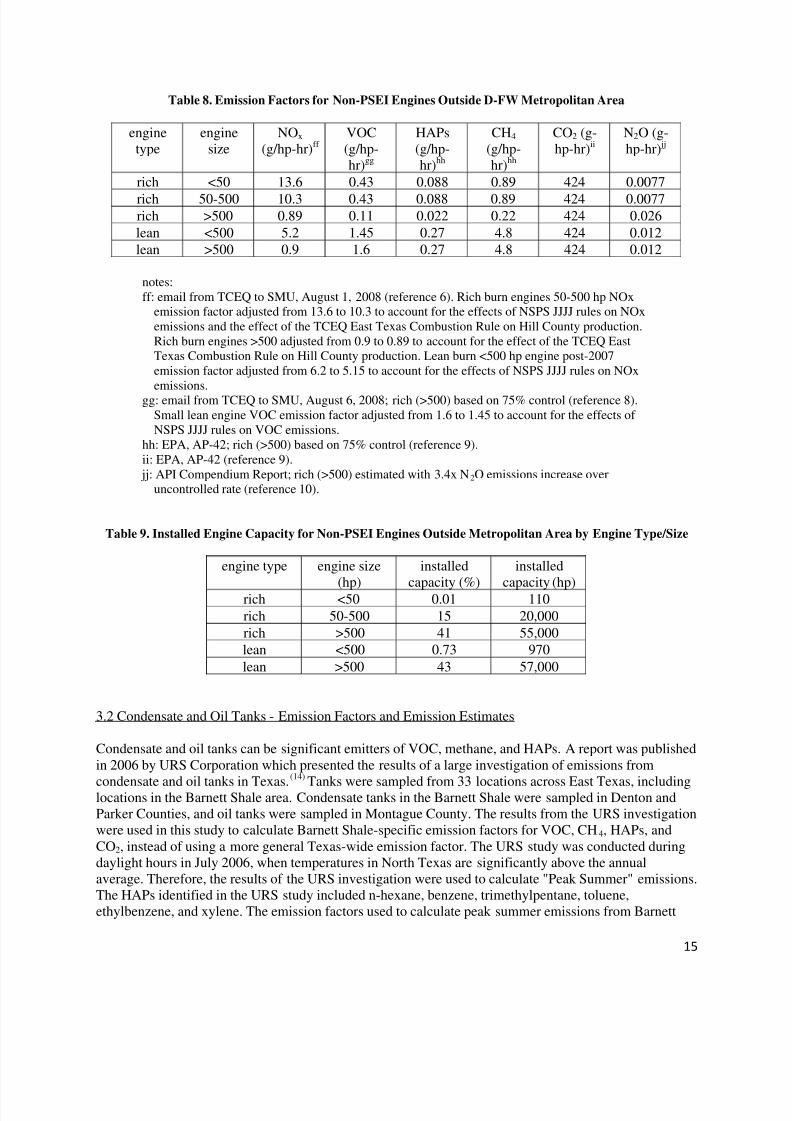
hp. Emission factors used to estimate emissions from these engines, and the breakdown of total installedengine capacity into engine type and size categories, are shown in Tables 8 and 9.
notes:ff: email from TCEQ to SMU, August 1, 2008 (reference 6). Rich burn engines 50-500 hp NOx
emission factor adjusted from 13.6 to 10.3 to account for the effects of NSPS JJJJ rules on NOxemissions and the effect of the TCEQ East Texas Combustion Rule on Hill County production.Rich burn engines >500 adjusted from 0.9 to 0.89 to account for the effect of the TCEQ EastTexas Combustion Rule on Hill County production. Lean burn <500 hp engine post-2007emission factor adjusted from 6.2 to 5.15 to account for the effects of NSPS JJJJ rules on NOxemissions.
gg: email from TCEQ to SMU, August 6, 2008; rich (>500) based on 75% control (reference 8).Small lean engine VOC emission factor adjusted from 1.6 to 1.45 to account for the effects of NSPS JJJJ rules on VOC emissions.
hh: EPA, AP-42; rich (>500) based on 75% control (reference 9).ii: EPA, AP-42 (reference 9). jj: API Compendium Report; rich (>500) estimated with 3.4x N2O emissions increase over
uncontrolled rate (reference 10).
Table 9. Installed Engine Capacity for Non-PSEI Engines Outside Metropolitan Area by Engine Type/Size
engine type engine size
(hp)
installed
capacity (%)
installed
capacity
(hp)rich <50 0.01 110
rich 50-500 15 20,000
rich >500 41 55,000lean <500 0.73 970
lean >500 43 57,000
3.2 Condensate and Oil Tanks - Emission Factors and Emission Estimates
Condensate and oil tanks can be significant emitters of VOC, methane, and HAPs. A report was publishedin 2006 by URS Corporation which presented the results of a large investigation of emissions from
condensate and oil tanks in Texas.(14)
Tanks were sampled from 33 locations across East Texas, includinglocations in the Barnett Shale area. Condensate tanks in the Barnett Shale were sampled in Denton andParker Counties, and oil tanks were sampled in Montague County. The results from the URS investigationwere used in this study to calculate Barnett Shale-specific emission factors for VOC, CH4, HAPs, andCO2, instead of using a more general Texas-wide emission factor. The URS study was conducted duringdaylight hours in July 2006, when temperatures in North Texas are significantly above the annualaverage. Therefore, the results of the URS investigation were used to calculate "Peak Summer" emissions.The HAPs identified in the URS study included n-hexane, benzene, trimethylpentane, toluene,ethylbenzene, and xylene. The emission factors used to calculate peak summer emissions from Barnett
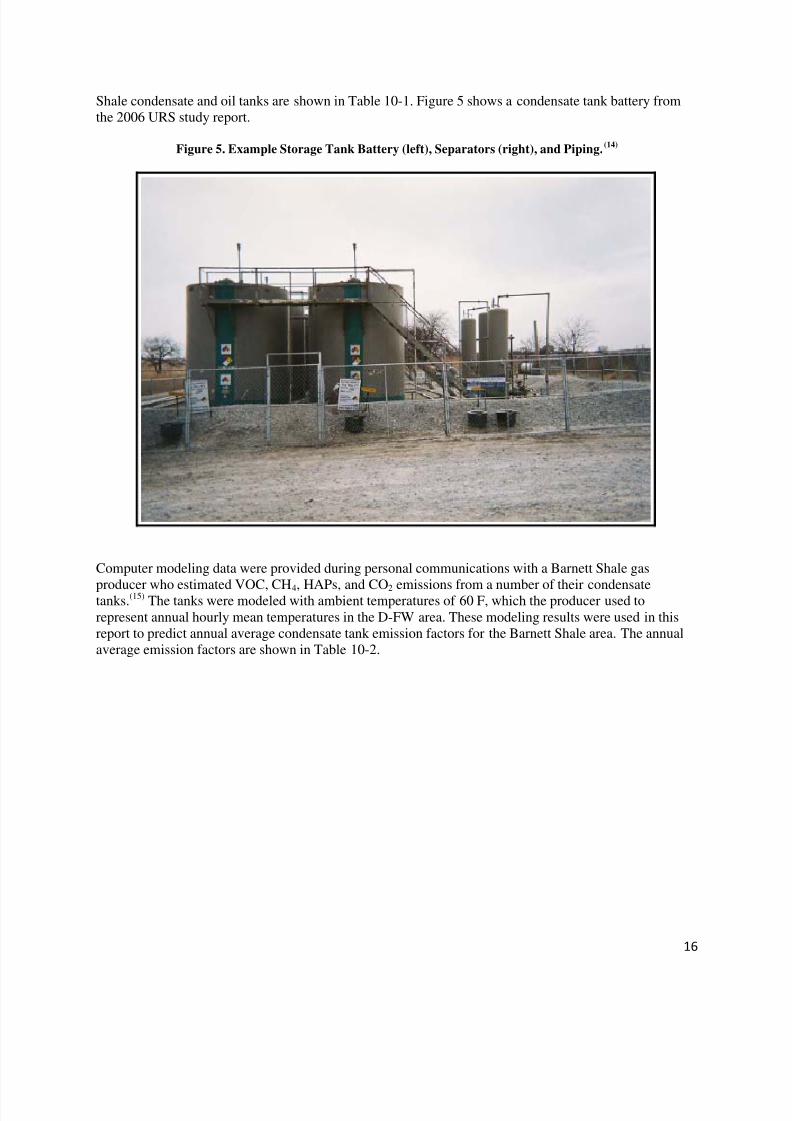
Shale condensate and oil tanks are shown in Table 10-1. Figure 5 shows a condensate tank battery fromthe 2006 URS study report.
Figure 5. Example Storage Tank Battery (left), Separators (right), and Piping.(14)
Computer modeling data were provided during personal communications with a Barnett Shale gas
producer who estimated VOC, CH4, HAPs, and CO2 emissions from a number of their condensatetanks.(15) The tanks were modeled with ambient temperatures of 60 F, which the producer used torepresent annual hourly mean temperatures in the D-FW area. These modeling results were used in thisreport to predict annual average condensate tank emission factors for the Barnett Shale area. The annualaverage emission factors are shown in Table 10-2.
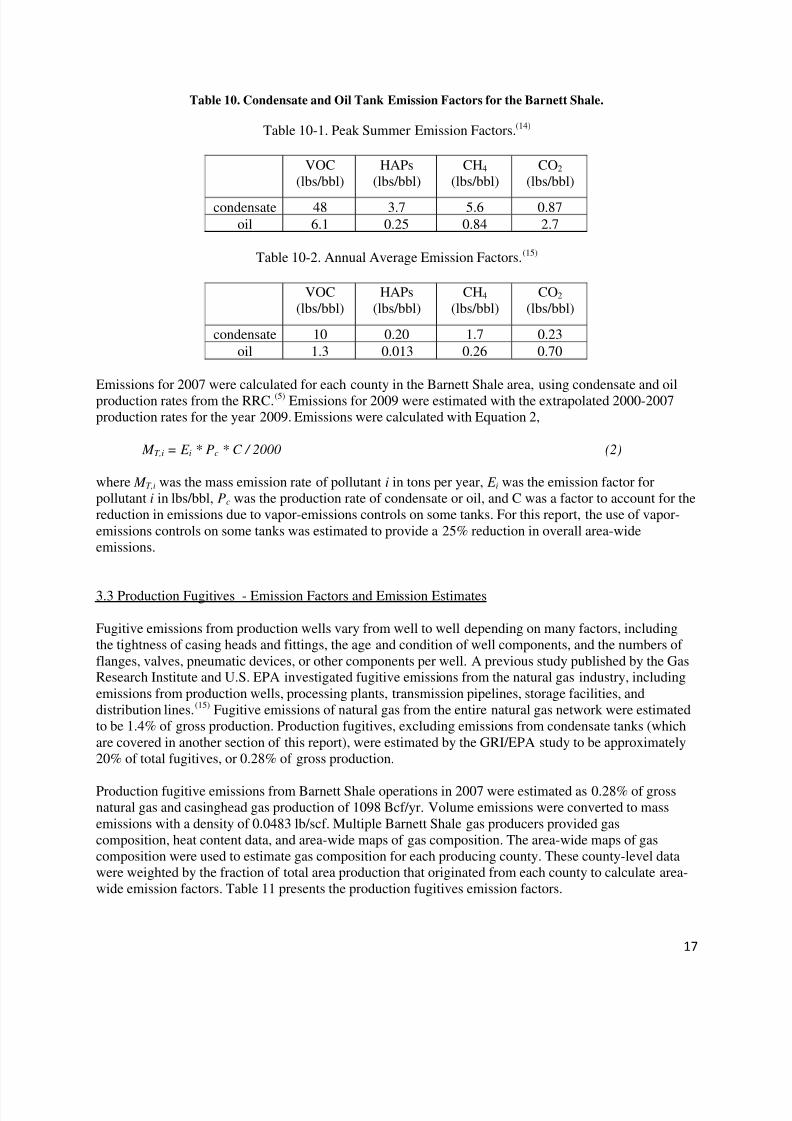
Table 10. Condensate and Oil Tank Emission Factors for the Barnett Shale.
Table 10-1. Peak Summer Emission Factors.(14)
VOC(lbs/bbl)
HAPs(lbs/bbl)
CH4 (lbs/bbl)
CO2 (lbs/bbl)
condensate 48 3.7 5.6 0.87
oil 6.1 0.25 0.84 2.7
Table 10-2. Annual Average Emission Factors.(15)
VOC(lbs/bbl)
HAPs(lbs/bbl)
CH4 (lbs/bbl)
CO2 (lbs/bbl)
condensate 10 0.20 1.7 0.23
oil 1.3 0.013 0.26 0.70
Emissions for 2007 were calculated for each county in the Barnett Shale area, using condensate and oilproduction rates from the RRC.(5) Emissions for 2009 were estimated with the extrapolated 2000-2007production rates for the year 2009. Emissions were calculated with Equation 2,
M T,i = E i * Pc * C / 2000 (2)
where M T,i was the mass emission rate of pollutant i in tons per year, E i was the emission factor forpollutant i in lbs/bbl, Pc was the production rate of condensate or oil, and C was a factor to account for thereduction in emissions due to vapor-emissions controls on some tanks. For this report, the use of vapor-emissions controls on some tanks was estimated to provide a 25% reduction in overall area-wideemissions.
3.3 Production Fugitives - Emission Factors and Emission Estimates
Fugitive emissions from production wells vary from well to well depending on many factors, includingthe tightness of casing heads and fittings, the age and condition of well components, and the numbers of flanges, valves, pneumatic devices, or other components per well. A previous study published by the GasResearch Institute and U.S. EPA investigated fugitive emissions from the natural gas industry, includingemissions from production wells, processing plants, transmission pipelines, storage facilities, anddistribution lines.(15) Fugitive emissions of natural gas from the entire natural gas network were estimatedto be 1.4% of gross production. Production fugitives, excluding emissions from condensate tanks (whichare covered in another section of this report), were estimated by the GRI/EPA study to be approximately20% of total fugitives, or 0.28% of gross production.
Production fugitive emissions from Barnett Shale operations in 2007 were estimated as 0.28% of grossnatural gas and casinghead gas production of 1098 Bcf/yr. Volume emissions were converted to massemissions with a density of 0.0483 lb/scf. Multiple Barnett Shale gas producers provided gascomposition, heat content data, and area-wide maps of gas composition. The area-wide maps of gascomposition were used to estimate gas composition for each producing county. These county-level datawere weighted by the fraction of total area production that originated from each county to calculate area-wide emission factors. Table 11 presents the production fugitives emission factors.
Table 11. Production Fugitives Emission Factors for the Barnett Shale.
VOC(lbs/MMcf)
HAPs(lbs/MMcf)
CH4 (lbs/MMcf)
CO2 (lbs/MMcf)
11 0.26 99 1.9
Emissions were calculated with Equation 3,
M F,i = E i * Pg / 2000 (3)
where M F,i was the mass emission rate of pollutant i in tons per year, E i was the emission factor forpollutant i in lbs/MMcf, and Pg was the production rate of natural and casinghead gas. The area-wideunprocessed natural gas composition based on data from gas producers was 74% CH4, 8.2% VOC, 1.4%CO2, and 0.20% HAPs, on a mass % basis. HAPs in unprocessed natural gas can include low levels of n-hexane, benzene, or other compounds.
3.4 Well Drilling, Hydraulic Fracturing Pump Engines, and Well Completions - Emission Factors andEmission Estimates
Emissions from the diesel engines used to operate well drilling rigs and from the diesel engines thatpower the hydraulic fracturing pumps were estimated based on discussions with gas producers and otherpublished data. Well drilling engine emissions were based on 25 days of engine operation for a typicalwell, with 1000 hp of engine capacity, a load factor of 50%, and operation for 12 hours per day.Hydraulic fracturing engine emissions were based on 4.5 days of operation for a typical well, with 1000hp of capacity, a load factor of 50%, and operation for 12 hours per day. Some well sites in the D-FW arebeing drilled with electric-powered rigs, with electricity provided off the electrical grid. Engines emissionestimates in this report were reduced by 25% to account for the number of wells being drilled withoutdiesel-engine power.
In addition to emissions from drilling and fracing engines, previous studies have examined emissions of natural gas during well completions. These studies include one by the Williams gas company, whichestimated that a typical well completion could vent 24,000 Mcf of natural gas.(18) A report by the EPANatural Gas Star program estimated that 3000 Mcf could be produced from typical well completions.(19) Areport by ENVIRON published in 2006 describes emission factors used in Wyoming and Colorado toestimate emissions from well completions, which were equivalent to 1000 to 5000 Mcf naturalgas/well.(20) Another report published in the June 2005 issue of the Journal of Petroleum Technologyestimated that well completion operations could produce 7,000 Mcf. (21) Unless companies bring specialequipment to the well site to capture the natural gas and liquids that are produced during wellcompletions, these gases will be vented to the atmosphere or flared.
Discussions with Barnett Shale gas producers that are currently employing “green completion” methodsto capture natural gas and reduce emissions during well completions suggests that typical wellcompletions in the Barnett Shale area can release approximately 5000 Mcf of natural gas/well. This value,which is very close to the median value obtained from previous studies (References 18-21), was used toestimate well completion emissions in this report.
The number of completed gas wells reporting to the RRC was plotted for the Feb. 2004 – Feb. 2008 timeperiod.(22) A least-squares regression line was fit to the data, and the slope of the line provides the
approximate number of new completions every year. A value of 1042 completions/year was relativelysteady throughout the 2004-2008 time period (linear R2 = 0.9915). Emissions in 2007 and 2009 from wellcompletions were estimated using 1000 new well completions/year for each year. Emission estimateswere prepared for the entire Barnett Shale area, as well as inside and outside the D-FW metropolitan area.The data from 2004-2008 show that 71 percent of new wells are being installed in the D-FW metropolitanarea, 29 percent of new wells are outside the metropolitan area, and the rate of new completions has been
steady since 2004. Emissions of VOC, HAPs, CH4, and CO2 were estimated using the same natural gascomposition used for production fugitive emissions.
Some gas producers are using green completion techniques to reduce emissions, while others destroynatural gas produced during well completions by flaring. To account for the use of green completions andcontrol by flaring, natural gas emission estimates during well completions were reduced by 25% in thisreport.
3.5 Processing Fugitives - Emission Factors and Emission Estimates
Fugitive emissions from natural gas processing will vary from processing plant to processing plant,
depending on the age of the plants, whether they are subject to federal rules such as the NSPS SubpartKKK requirements, the chemical composition of the gas being processed, the processing capacity of theplants, and other factors. A previous study published by the Gas Research Institute and U.S. EPAinvestigated fugitive emissions from the natural gas industry, including emissions from production wells,processing plants, transmission pipelines, storage facilities, and distribution lines.(15) Fugitive emissions of natural gas from the entire natural gas industry were estimated to be 1.4% of gross production. Processingfugitives, excluding compressor engine exhaust emissions that were previously addressed in this report,were estimated to be approximately 9.7% of total fugitives, or 0.14% of gross production.
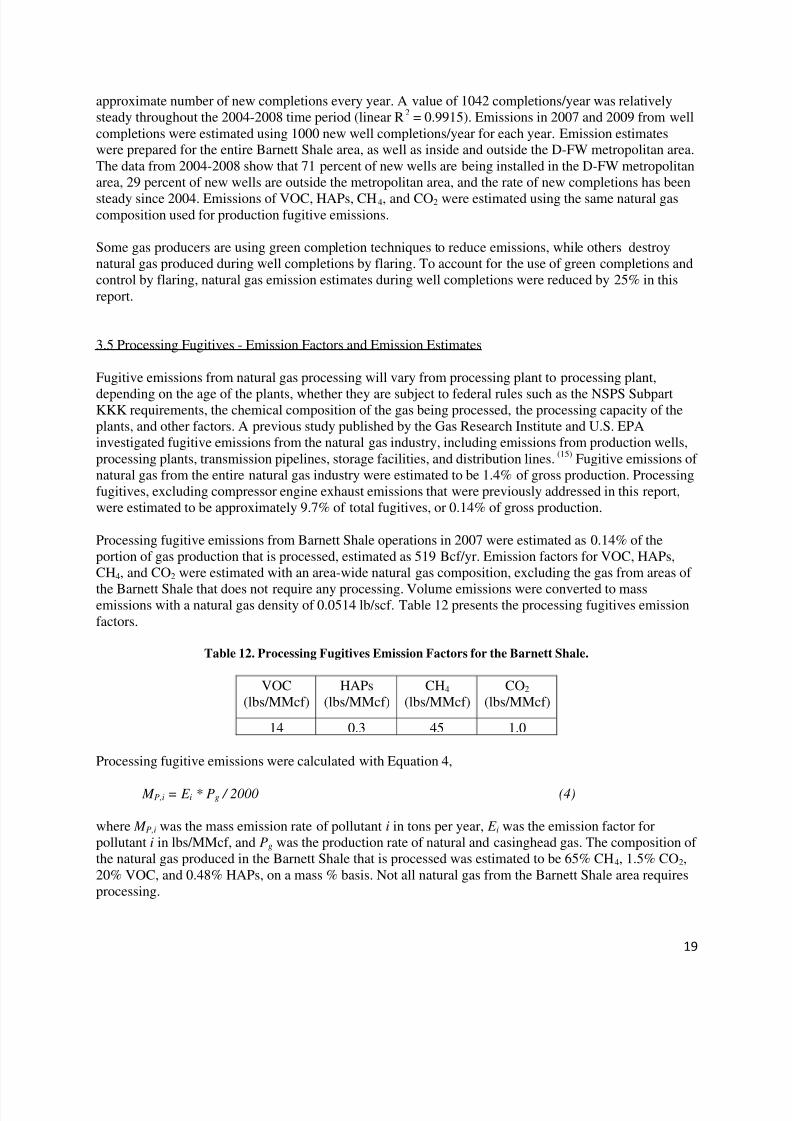
Processing fugitive emissions from Barnett Shale operations in 2007 were estimated as 0.14% of theportion of gas production that is processed, estimated as 519 Bcf/yr. Emission factors for VOC, HAPs,CH4, and CO2 were estimated with an area-wide natural gas composition, excluding the gas from areas of
the Barnett Shale that does not require any processing.
Volume emissions were converted to massemissions with a natural gas density of 0.0514 lb/scf. Table 12 presents the processing fugitives emissionfactors.
Table 12. Processing Fugitives Emission Factors for the Barnett Shale.
VOC(lbs/MMcf)
HAPs(lbs/MMcf)
CH4 (lbs/MMcf)
CO2 (lbs/MMcf)
14 0.3 45 1.0
Processing fugitive emissions were calculated with Equation 4,
M P,i = E i * Pg / 2000 (4)
where M P,i was the mass emission rate of pollutant i in tons per year, E i was the emission factor forpollutant i in lbs/MMcf, and Pg was the production rate of natural and casinghead gas. The composition of the natural gas produced in the Barnett Shale that is processed was estimated to be 65% CH4, 1.5% CO2,20% VOC, and 0.48% HAPs, on a mass % basis. Not all natural gas from the Barnett Shale area requiresprocessing.
3.6 Transmission Fugitives - Emission Factors and Emission Estimates
Fugitive emissions from the transmission of natural gas will vary depending on the pressure of pipelines,the integrity of the piping, fittings, and valves, the chemical composition of the gas being transported, thetightness of compressor seals and rod packing, the frequency of blow down events, and other factors. Aprevious study published by the Gas Research Institute and U.S. EPA investigated fugitive emissions
from the natural gas industry, including emissions from production wells, processing plants, transmissionpipelines, storage facilities, and distribution lines.(15) Fugitive emissions of natural gas from the entirenatural gas industry were estimated to be 1.4% of gross production. Transmission fugitives, excludingcompressor engine exhaust emissions that were previously addressed in this report, were estimated to beapproximately 35% of total fugitive emissions, or 0.49% of gross production. Transmission includes themovement of natural gas from the wells to processing plants, and the processing plants to compressorstations. It does not include flow past the primary metering and pressure regulating (M&PR) stations andfinal distribution lines to customers. Final distribution of gas produced in the Barnett Shale can happenanywhere in the North American natural gas distribution system, and fugitive emissions from these linesare beyond the scope of this report.
Transmission fugitive emissions from Barnett Shale operations in 2007 were estimated as 0.49% of gross
natural gas and casinghead gas production of 1098 Bcf/yr. Emission factors for VOC, HAPs, CH4, andCO2 were developed considering that a significant portion of the gas moving through the network doesnot require processing, while the portion of the gas with higher molecular weight compounds will gothrough processing. In addition, all gas will have a dry (high methane) composition after processing as itmoves to compressor stations and then on to customers. Overall area-wide transmission fugitiveemissions were calculated with a gas composition of 76% CH4, 5.1% VOC, 1.4% CO2, and 0.12% HAPs,by mass %. Table 13 presents the transmission fugitives emission factors.
Table 13. Transmission Fugitives Emission Factors for the Barnett Shale.
VOC
(lbs/MMcf)
HAPs
(lbs/MMcf)
CH4
(lbs/MMcf)
CO2
(lbs/MMcf)12 0.28 175 3.3
Transmission fugitive emissions were calculated with Equation 5,
M tr,i = E i * Pg / 2000 (5)
where M tr,i was the mass emission rate of pollutant i in tons per year, E i was the emission factor forpollutant i in lbs/MMcf, and Pg was the production rate of natural and casinghead gas.
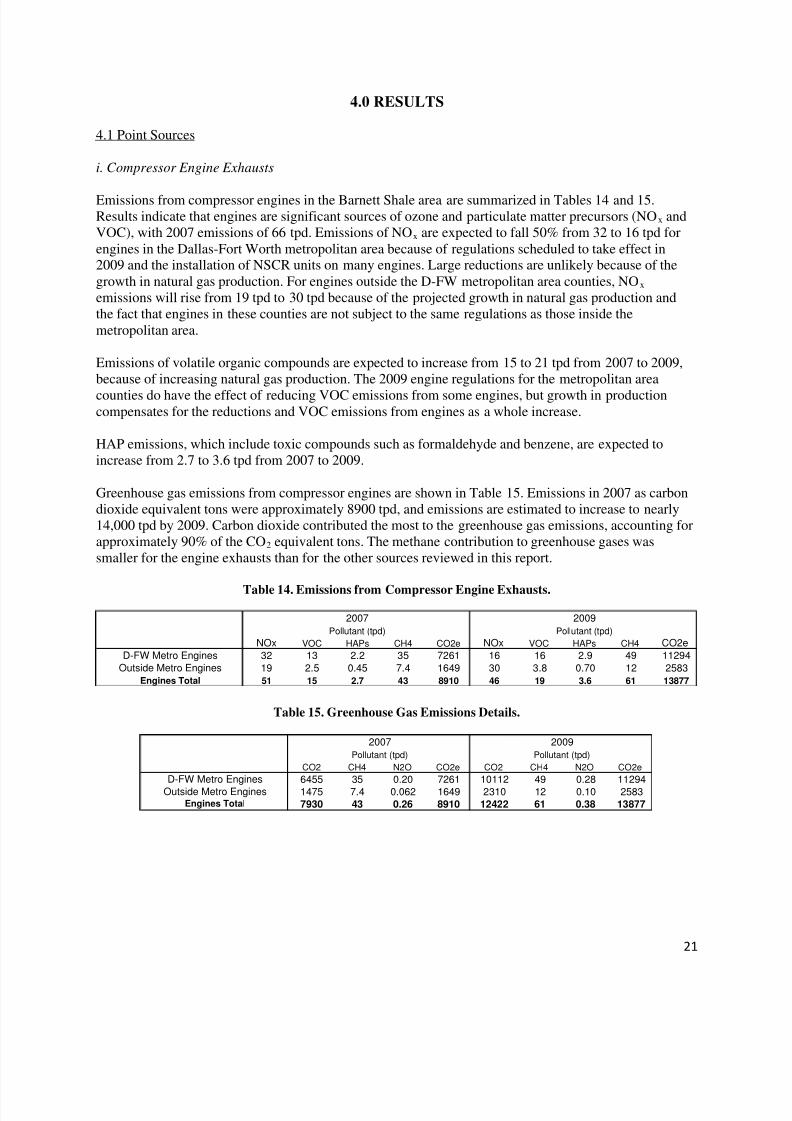
Emissions from compressor engines in the Barnett Shale area are summarized in Tables 14 and 15.Results indicate that engines are significant sources of ozone and particulate matter precursors (NOx andVOC), with 2007 emissions of 66 tpd. Emissions of NOx are expected to fall 50% from 32 to 16 tpd forengines in the Dallas-Fort Worth metropolitan area because of regulations scheduled to take effect in2009 and the installation of NSCR units on many engines. Large reductions are unlikely because of thegrowth in natural gas production. For engines outside the D-FW metropolitan area counties, NOx emissions will rise from 19 tpd to 30 tpd because of the projected growth in natural gas production andthe fact that engines in these counties are not subject to the same regulations as those inside themetropolitan area.
Emissions of volatile organic compounds are expected to increase from 15 to 21 tpd from 2007 to 2009,because of increasing natural gas production. The 2009 engine regulations for the metropolitan area
counties do have the effect of reducing VOC emissions from some engines, but growth in productioncompensates for the reductions and VOC emissions from engines as a whole increase.
HAP emissions, which include toxic compounds such as formaldehyde and benzene, are expected toincrease from 2.7 to 3.6 tpd from 2007 to 2009.
Greenhouse gas emissions from compressor engines are shown in Table 15. Emissions in 2007 as carbondioxide equivalent tons were approximately 8900 tpd, and emissions are estimated to increase to nearly14,000 tpd by 2009. Carbon dioxide contributed the most to the greenhouse gas emissions, accounting forapproximately 90% of the CO2 equivalent tons. The methane contribution to greenhouse gases wassmaller for the engine exhausts than for the other sources reviewed in this report.
Table 14. Emissions from Compressor Engine Exhausts.
Emissions from condensate and oil tanks are shown in Tables 16-1 and 16-2. Annual average emissionsare shown in Table 16-1, and peak summer emissions are shown in Table 16-2.
On an annual average, emissions of VOCs from the tanks were 19 tpd in 2007, and emissions will
increase to 30 tpd in 2009. Because of the effects of temperature on hydrocarbon liquid vapor pressures,peak summer emissions of VOC were 93 tpd in 2007, and summer emissions will increase to 146 tpd in2009.
Substantial HAP emissions during the summer were determined for the tanks, with 2007 emissions of 7.2tpd and 2009 emissions of 11 tpd. Greenhouse gas emissions from the tanks are almost entirely from CH4,with a small contribution from CO2. Annual average greenhouse gas emissions were 95 tpd in 2007, andwill increase to 149 tpd in 2009.
Table 16. Emissions from Condensate and Oil Tanks.
Emissions from fugitive sources at Barnett Shale production sites are shown in Table 17. Productionfugitives are significant sources of VOC emissions, with VOC emissions expected to grow from 2007 to2009 from 17 to 26 tpd. Production fugitives are also very large sources of methane emissions, leading tolarge CO2 equivalent greenhouse gas emissions. Greenhouse gas emissions were 3100 tpd in 2007 andwill be 4900 tpd in 2009.
Table 17. Emissions from Production Fugitives.
VOC HAPs CH4 CO2e VOC HAPs CH4 CO2e
D-FW Metro Production Fugitives 11 0.27 102 2147 18 0.43 160 3363
Outside Metro Production Fugitives 5.2 0.12 46 971 8.1 0.19 72 1521
Production Fugitives Total 17 0.40 148 3118 26 0.62 232 4884
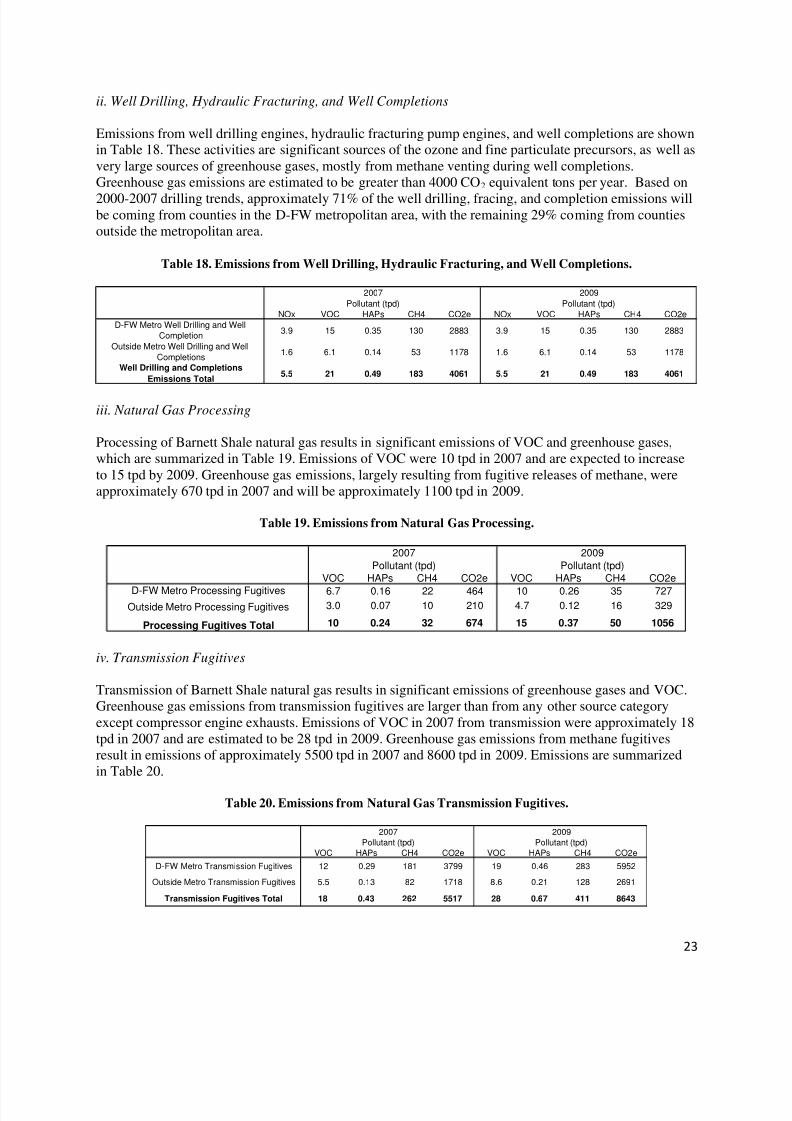
ii. Well Drilling, Hydraulic Fracturing, and Well Completions
Emissions from well drilling engines, hydraulic fracturing pump engines, and well completions are shownin Table 18. These activities are significant sources of the ozone and fine particulate precursors, as well asvery large sources of greenhouse gases, mostly from methane venting during well completions.Greenhouse gas emissions are estimated to be greater than 4000 CO2 equivalent tons per year. Based on
2000-2007 drilling trends, approximately 71% of the well drilling, fracing, and completion emissions willbe coming from counties in the D-FW metropolitan area, with the remaining 29% coming from countiesoutside the metropolitan area.
Table 18. Emissions from Well Drilling, Hydraulic Fracturing, and Well Completions.
Processing of Barnett Shale natural gas results in significant emissions of VOC and greenhouse gases,which are summarized in Table 19. Emissions of VOC were 10 tpd in 2007 and are expected to increaseto 15 tpd by 2009. Greenhouse gas emissions, largely resulting from fugitive releases of methane, wereapproximately 670 tpd in 2007 and will be approximately 1100 tpd in 2009.
Transmission of Barnett Shale natural gas results in significant emissions of greenhouse gases and VOC.Greenhouse gas emissions from transmission fugitives are larger than from any other source categoryexcept compressor engine exhausts. Emissions of VOC in 2007 from transmission were approximately 18tpd in 2007 and are estimated to be 28 tpd in 2009. Greenhouse gas emissions from methane fugitivesresult in emissions of approximately 5500 tpd in 2007 and 8600 tpd in 2009. Emissions are summarizedin Table 20.
Table 20. Emissions from Natural Gas Transmission Fugitives.
Emissions from all source categories in the Barnett Shale area are summarized in Table 21-1 on an annualaverage basis, and are summarized in Table 12-2 on a peak summer basis. Annual average emissions for2009 of ozone and particulate precursors (NOx and VOC) were approximately 191 tpd, and peak summeremissions of these compounds were 307 tpd. The portion of those emissions originating from the 5-
counties in the D-FW metropolitan area with significant oil and gas production was 133 tpd during thesummer (Tarrant, Denton, Parker, Johnson, and Ellis).
Estimates of greenhouse gas emissions from the sector as a whole were quite large, with 2009 emissionsof approximately 33,000 tpd. The greenhouse gas contribution from compressor engines was dominatedby carbon dioxide, while the greenhouse gas contribution from all other sources was dominated bymethane. Emissions of HAPs were significant from Barnett Shale activities, with emissions in 2009 of 6.4tpd in 2009 on an annual average, and peak summer emissions of 17 tpd.
Table 21. Emissions Summary for All Source Categories.
Table 21-1. Annual Average Emissions from All Sources.
Emissions of nitrogen oxides from oil and gas production in the Barnett Shale were dominated byemissions from compressor engines, with a smaller contribution from well drilling and fracing pump
engines. All source categories in the Barnett Shale contributed to VOC emissions, but the largest group of VOC sources was condensate tank vents. Figure 6 presents the combined emissions of NOx and VOCduring the summer from all source categories in the Barnett Shale.
Figure 6. Summer Emissions of Ozone & Fine Particulate Matter Precursors (NOx and VOC) from Barnett
Shale Sources in 2009.
4.4 Perspective on the Scale of Barnett Shale Air Emissions
Barnett Shale oil and gas production activities are significant sources of air emissions in the north-centralTexas area. To help put the levels of Barnett Shale emissions into context, recent government emissionsinventories for the area were reviewed, and emission rates of smog precursor emissions were examined.
The Dallas-Fort Worth area is home to two large airports, Dallas Love Field and Dallas-Fort Worth
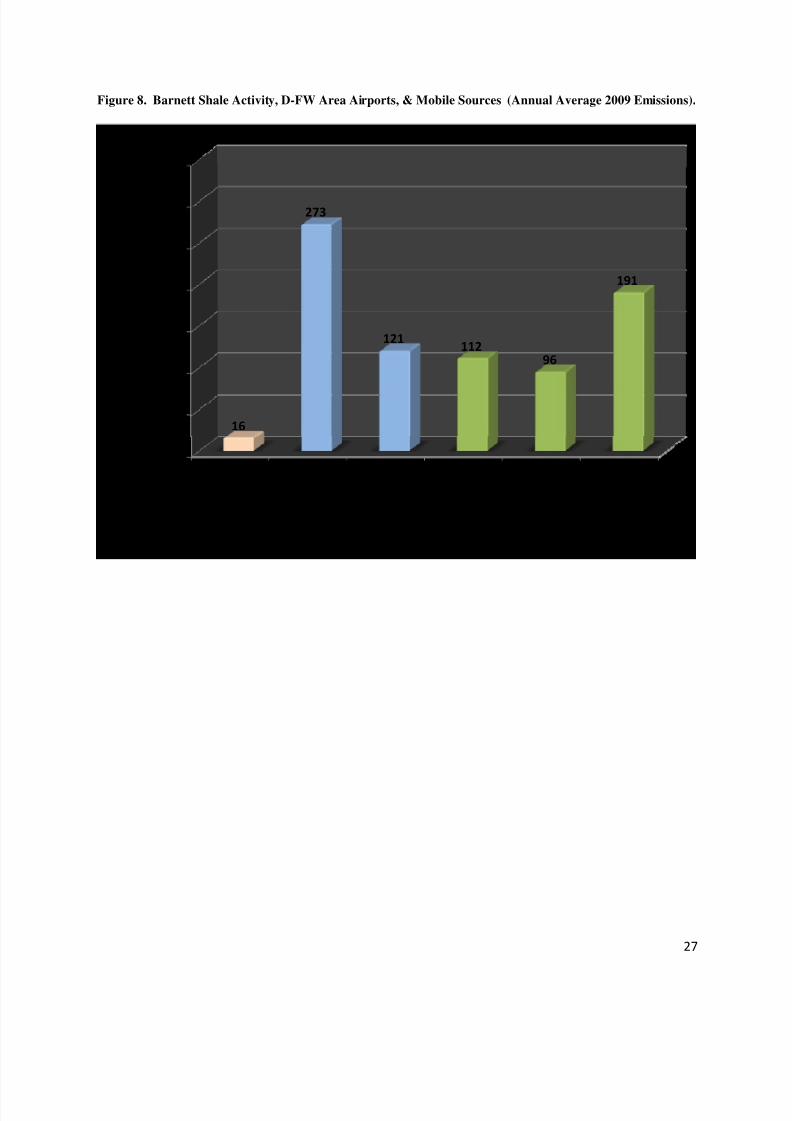
International Airport, plus a number of smaller airports. A recent emissions inventory has estimated 2009NOx emissions from all area airports to be approximately 14 tpd, with VOC emissions at approximately2.6 tpd, resulting in total ozone and particulate matter precursor emissions of approximately 16 tpd. (22-24)
For comparison, emissions of VOC + NOx in summer 2009 from just the compressor engines in theBarnett Shale area will be approximately 65 tpd, and summer condensate tanks emissions will beapproximately 146 tpd. In 2009, even after regulatory efforts to reduce NOx emissions from certaincompressor engine types, Barnett Shale oil and gas emissions will be many times the airports' emissions.
Recent state inventories have also compiled emissions from on-road mobile sources like cars, trucks, etc.,in the 9-county D-FW metropolitan area.(25) By 2009, NOx + VOC emissions from mobile sources in the9-county area were estimated by the TCEQ to be approximately 273 tpd. The portion of on-road motorvehicle emissions from the 5-counties in the D-FW metropolitan area with significant oil and gas
production was 121 tpd (Denton, Tarrant, Parker, Johnson, and Ellis). As indicated earlier, summer oiland gas emissions in the 5-counties of the D-FW metropolitan area with significant oil and gas productionwas estimated to be 165 tpd, indicating that the oil and gas sector likely has greater emissions than motorvehicles in these counties (165 vs. 121 tpd).
Emissions of NOx and VOC in the summer of 2009 from all oil and gas sources in the Barnett Shale 21-county area will exceed emissions from on-road mobile sources in the D-FW metropolitan area by morethan 30 tpd (307 vs. 273 tpd).
TransmissionFugitives = 28 tpd
Condensate andOil Tanks = 146 tpd
Gas Processing =15 tpd
Well Drilling andCompletions = 26tpd
CompressorEngines = 65 Production Fugi-tives = 26 tpd
Figure 7 summarizes summer Barnett Shale-related emissions, plus TCEQ emission estimates from theairports and on-road mobile sources. Figure 8 presents annual average emissions from these sources.
Figure 7. Barnett Shale Activity, D-FW Area Airports, & Mobile Sources (Summer 2009 Emissions).
The previous sections of this report have estimated the emission rates of ozone and particulate matterprecursor compounds, air toxic compounds, and greenhouse gases from different oil and gas sources inthe Barnett Shale area. For several of these source categories, off-the-shelf options are available whichcould significantly reduce emissions, resulting in important air quality benefits. Some of these emissions
reductions would also result in increased production of natural gas and condensate, providing aneconomic payback for efforts to reduce emissions.
5.1 Compressor Engine Exhausts
Compressors in oil and gas service in the Barnett Shale perform vital roles, to either help get oil and gasout of the shale, to increase pressures of gas at the surface, and to provide the power for the largeinterstate pipeline systems that move high volumes of gas from production to processing and tocustomers. At present, most of the work to operate the compressors comes from natural gas-fired internalcombustion engines, and these engines can be significant sources of emissions.
New TCEQ rules are scheduled to become effective in early 2009 and they will reduce NOx, VOC, and
other emissions from a subset of the engines in the Barnett Shale – those that are currently in the D-FWmetropolitan area that had typically not reported into the Texas point source emissions inventory formajor sources. These rules are a good first step in addressing emissions from these sources, which hadpreviously gone unnoticed in state emission inventory and regulatory efforts.
However, engines outside the D-FW metropolitan area are not subject to the rule. And even within themetropolitan area, the rule will not have the effect of greatly reducing emissions in 2009 compared to2007 levels, since growth in oil and gas production (and the new engines that are going to be required topower the growth) will begin to overtake the benefits that come from reducing emissions from the pre-2009 fleet (see Table 14).
Two available options for reducing emissions from engines in the Barnett Shale area are: (1) extending
the TCEQ 2009 engine regulation to all engines in the Barnett Shale, and (2) replacing internalcombustion engines with electric motors as the sources of compression power.
i. Extending the 2009 Engine Rule to Counties Outside the D-FW Metropolitan Area
Regulations adopted by TCEQ for the D-FW metropolitan area and scheduled to take effect in early 2009will limit NOx emissions from engines larger than 50 horsepower.(7) Rich burn engines will be restrictedto 0.5 g/hp-hr, lean burn engines installed or moved before June 2007 will be restricted to 0.7 g/hp-hr, andlean burn engines installed or moved after June 2007 will be limited to 0.5 g/hp-hr. Applying these rulesto engines outside the metropolitan area would reduce 2009 NOx emissions from a large number of engines, in particular, rich burn engines between 50 to 500 hp. Emissions of NOx in 2009 from theengines outside the metropolitan area would drop by approximately 6.5 tpd by extending the D-FW
engine rule, an amount greater than mobile source emissions in all of Johnson County (4 tpd), or morethan 50% of the emissions from Dallas-Fort Worth International Airport (12.6 tpd).
Extending the D-FW engine rule to counties outside the metropolitan area would likely result in manyengine operators installing NSCR systems on rich burn engine exhausts. These systems would not onlyreduce emissions of NOx, but they would also be expected to reduce emissions of VOC, the other ozoneand particulate matter precursor, by approximately 75% or greater.(26a) Additional co-benefits of NSCRinstallations would include lower emissions of organic HAP compounds like benzene and formaldehyde,lower emissions of methane, and lower emissions of carbon monoxide. The level of HAP, methane, and
carbon monoxide control would also be expected to be 75% or greater with typical NSCRinstallations.(26a)
Analyses of NSCR installations and operating costs by numerous agencies have indicated that thetechnology is very cost effective. For example, the Illinois Environmental Protection Agency estimated in2007 that NSCR could control NOx from 500 hp engines at approximately $330/ton.(26b) The U.S. EPA in
2006 estimated that NSCR could control NOx from 500 hp engines at approximately $92 to 105/ton.(27) A2005 report examining emissions reductions from compressor engines in northeast Texas estimated NOx cost effectiveness for NSCR at $112-183/ton and identified VOC reductions as an important co-benefit.(28) These costs are well under the cost effectiveness values of $10,000 to $20,000 per ton oftenused as upper limits in PM2.5, ozone, and regional haze (visibility) regulatory programs. The simultaneousHAPs and methane removal that would occur with NSCR use provide further justification for extendingthe D-FW engine rule to counties outside the metropolitan area.
ii. Electric Motors Instead of Combustion Engines for Compressor Power
When considering NOx, VOC, HAPs, and greenhouse gas emissions from compressor engines, it isimportant to understand that the work to move the gas in the pipelines is performed by the compressors,
which by themselves produce no direct combustion emissions. The emissions come from the exhaust of the internal combustion engines, which are fueled with a small amount of the available natural gas. Theseengines provide the mechanical power to run the compressors. The 2007 TCEQ engine survey and themost recent point source emissions inventory indicate that installed compressor engine capacitythroughout the Barnett Shale was approximately 1,400,000 hp in 2007, and capacity is likely to increaseto over 2,100,000 hp by 2009.
As an alternative to operating the compressors in the Barnett Shale with millions of hp of natural gasburning-engines, the compressors could be operated with electrically-driven motors. The electrification of the wellhead and compressor station engine fleet in the Barnett Shale area has the potential to deliversignificant reductions in emissions in North Central Texas. The use of electric motors instead of internalcombustion engines to drive natural gas compressors is not new to the natural gas industry, and numerous
compressors driven by electric motors are operational throughout Texas. Unfortunately, currentregulations have not yet required their use in the Barnett Shale.
A few of the many examples of electrically-driven natural gas compressors, positive technicalassessments, and industrial experience with their use in Texas and throughout the U.S., include:
• The Interstate Natural Gas Association of America: "One advantage of electric motors is theyneed no air emission permit since no hydrocarbons are burned as fuel. However, a highly reliablesource of electric power must be available, and near the station, for such units to be consideredfor an application." (29)
• The Williams natural gas company: "The gas turbine and reciprocating engines typically usenatural gas from the pipeline, where the electric motor uses power from an electric transmissionline. Selection of this piece of equipment is based on air quality, available power, and the type of compressor selected. Typically electric motors are used when air quality is an issue." (30)
• JARSCO Engineering Corp.: "The gas transmission industry needs to upgrade equipment formore capacity. The new high-speed electric motor technology provides means for upgrading, at afraction of the life cycle costs of conventional gas powered equipment."(31)
• Pipeline and Gas Journal, June 2007: "Important factors in favor of electric-driven compressorstations that should be considered in the feasibility analysis include the fact that the fuel gas for
gas turbine compressor stations will be transformed into capacity increase for the electrically-driven compressor station, and will therefore add revenue to this alternative..." (32)
• Prime mover example: Installations in 2007 at Kinder Morgan stations in Colorado of +10,000 hpelectric-driven compressor units. (33)
• Wellhead example: Installations in Texas of wellhead capacity (5 to 400 hp) electrically-driven
compressors. (34,35)
• Mechanical Engineering Magazine, December 1996: "Gas pipeline companies historically haveused gas-fired internal-combustion engines and gas turbines to drive their compressors. However,this equipment emits nitrogen oxides....According to the Electric Power Research Institute, it ismore efficient to send natural gas to a combined-cycle power plant to generate electricitytransmitted back to the pipeline compressor station than to burn the natural gas directly in gas-fired compressor engines."(36)
• The Dresser-Rand Corporation: "New DATUM-C electric motor-driven compressor providesquiet, emissions free solution for natural gas pipeline applications – An idea whose time hadcome." (37)
•
Occidental Oil and Gas Corporation: "Converting Gas-Fired Wellhead IC Engines to ElectricMotor Drives: Savings $23,400/yr/unit." (38)
The use of an electric motor instead of a gas-fired engine to drive gas compression eliminates combustionemissions from the wellhead or compressor station. Electric motors do require electricity from the grid,and in so far as electricity produced by power plants that emits pollutants, the use of electric motors is notcompletely emissions free. However, electric motor use does have important environmental benefitscompared to using gas-fired engines.
Modern gas-fired internal-combustion engines have mechanical efficiencies in the 30-35% range, valuesthat have been relatively static for decades. It is doubtful that dramatic increases in efficiency (forexample, to 80 or 90%) are possible anytime in the near future. This means that carbon dioxide emissions
from natural gas-fired engines at wellheads and compressor stations are not likely to drop substantiallybecause of efficiency improvements. In addition, the scrubbing technology that is used in some largeindustrial applications to separate CO2 from other gases also is unlikely to find rapid rollout to thethousands of comparatively-smaller exhaust stacks at natural gas wellheads and compressor stations. Thetwo facts combined suggest that the greenhouse gas impacts from using internal combustion engines todrive compressors are likely to be a fixed function of compression demand, with little opportunity forlarge future improvements.
In contrast, the generators of grid electric power are under increasing pressure to lower greenhouse gasemissions. Wind energy production is increasing in Texas and other areas. Solar and nuclear powerprojects are receiving renewed interest from investors and regulators. As the electricity in the grid isproduced by sources with lower carbon dioxide emissions, so then the use of electric motors to drive
natural gas pipelines becomes more and more climate friendly.
Stated another way, carbon dioxide emissions from gas-fired engines are unlikely to undergo rapiddecreases in coming years, whereas the electricity for operating electric motors is at a likely carbon-maximum right now. Electric-powered compression has a long-term potential for decreased climateimpact, as non-fossil fuel alternatives for grid electricity generation expand in the future.
Costs: Estimates were made of the costs were switching from IC engines to electric motors forcompression. Costs at sites in the Barnett Shale are highly time and site specific, depending on the cost of electricity and the value of natural gas, the numbers of hours of operation per year, the number and sizesof compressors operated, and other factors.
For this report, sample values were determined for capital, operating and maintenance, and operating
costs of 500 hp of either IC engine capacity or electric motor capacity for a gas compressor to operate for8000 hours per year at a 0.55 load factor. Electric power costs were based on $8/month/kW demandcharge, $0.08/kWh electricity cost, and 95% motor mechanical efficiency. Natural gas fuel costs werebased on $7.26/MMBtu wellhead natural gas price and a BSFC of 0.0085 MMBtu/hp-hr.
With these inputs, the wellhead value of the natural gas needed to operate a 500 hp compressor with an ICengine for 1 year is approximately $136,000. This is lower than the costs for electricity to run acomparable electric motor, which would be approximately $174,000. In addition to these energy costs, itis important to also consider operating and maintenance (O&M) and capital costs. With an IC engineO&M cost factor of $0.016/hp in 2009 dollars, O&M costs would be approximately $35,000. With anelectric motor O&M cost factor of $0.0036/kWh in 2009 dollars, O&M costs would be approximately$6200, providing a savings of nearly $30,000 per year in O&M costs for electrical compression, nearly
enough to compensate for the additional energy cost incurred from the additional price premium onelectricity in Texas compared to natural gas.
With an IC engine capital cost factor of $750/hp in 2009 dollars, the cost of a 500 hp compressor enginewould be approximately $370,000. With an electric motor cost factor of $700/kW, the cost of 500 hp of electrically-powered compression would be approximately $260,000.
The combined energy (electricity or natural gas), O&M, and capital costs for the two options are shown inTable 22, assuming a straight 5-year amortization of capital costs. The data show that there is little costdifference in this example, with a slight cost benefit of around $12,000/year for generating thecompression power with an electric motor instead of an IC engine. While this estimate would vary fromsite to site within the Barnett Shale, there appears to be cost savings, driven mostly by reduced initial
capital cost, in favor of electrical compression in the Barnett Shale. In addition to the potential costsavings of electrical compression over engine compression, the lack of an overwhelming economic driverone way or the other allows the environmental benefits of electric motors over combustion engines to bethe deciding factor on how to provide compression power in the area.
Table 22. Costs of IC Engine and Electric Motor Compression
Oil and condensate tanks in the Barnett Shale are significant sources of multiple air pollutants, especiallyVOC, HAPs, and methane. Multiple options exist for reducing emissions from oil and condensate tanks,including options that can result in increased production and revenue for well operators.(14) This sectionwill discuss two of these options: flares and vapor recovery units.
i. Vapor Recovery Units
Vapor recovery units (VRU) can be highly effective systems for capturing and separating vapors andgases produced by oil and condensate tanks. Gases and vapors from the tanks are directed to the inlet sideof a compressor, which increases the pressure of the mixture to the point that many of the moderate andhigher molecular weight compounds recondense back into liquid form. The methane and other light gasesare directed to the inlet (suction) side of the well site production compressors to join the main flow of natural gas being produced at the well. In this way, VRU use increases the total production of gas at thewell, leading to an increase in gas available for metering and revenue production. In addition, liquidsproduced by the VRU are directed back into the liquid phase in the condensate tank, increasingcondensate production and the income potential from this revenue stream. Vapor recovery units are
estimated to have control efficiencies of greater than 98%.(14)
The gases and vapors emitted by oil and condensate tanks are significant sources of air pollutants, and theescape of these compounds into the atmosphere also reduces income from hydrocarbon production. Witha wellhead value of approximately $7/MMBtu, the 7 tpd of methane that is estimated to be emitted in2009 from condensate tanks in the Barnett Shale have a value of over $800,000 per year. Even moresignificantly, a price of condensate at $100/bbl makes the 30 tpd of VOC emissions in 2009 from thetanks in the Barnett Shale potentially worth over $10 million per year.
While flaring emissions from tanks in the Barnett Shale would provide substantial environmentalbenefits, especially in terms of VOC and methane emissions, capturing these hydrocarbons and directingthem into the natural gas and condensate distribution systems would provide both an environmental
benefit and a very large potential revenue stream to oil and gas producers.
ii. Enclosed Flares
Enclosed flares are common pollution control and flammable gas destruction devices. Enclosed flares gettheir name because the flame used to ignite the gases is generated by burner tips installed within the stack well below the top. The flames from enclosed flares are usually not visible from the outside, exceptduring upset conditions, making them less objectionable to the surrounding community compared to open(unenclosed) flares.
Using a flare to control emissions from tanks involves connecting the vents of a tank or tank battery to thebottom of the flare stack. The vapors from oil and condensate tanks are sent to the flare, and air is also
added to provide oxygen for combustion. The vapors and air are ignited by natural gas pilot flames, andmuch of the HAP, VOC, and methane content of the tank vapors can be destroyed. The destructionefficiency for flares can vary greatly depending on residence time, temperature profile, mixing, and otherfactors. Properly designed and operated flares have been reported to achieve 98% destruction efficiencies.
Applying 98% destruction efficiency to the Barnett Shale oil and condensate tanks emissions estimatesshown in Table 16 results in potential emission reductions of 30 tpd of VOC, 0.6 tpd of HAPs, and 7 tpdof methane. These reductions are substantial and would provide large benefits to the ozone and PMprecursor, HAPs, and greenhouse gas emission inventory of the Barnett Shale area. The use of flares,
however, also has several drawbacks. One of these is that tank vapor flares need a continuous supply of pilot light natural gas, and reports have estimated pilot light gas consumption at around 20 scfh/flare.(14)
Table 23 presents a summary of the results of an economic analysis performed in 2006 by URSCorporation for using flares or vapor recovery units to control emissions from a tank battery in Texas.(14)
Capital costs were estimated by URS with a 5-year straightline amortization of capital. Flow from the
tank battery was 25Mscf/day and VOC emissions were approximately 211 tpy. Costs were in 2006dollars.
Table 23. Economics of Flares and Vapor Recovery Units.
*VRU produces positive revenue, resulting in zero cost for VOC control, a fter accounting for value of recovered products.
The URS analysis indicated that flares were able to cost effectively reduce VOC emissions at $40/ton,
while VRU units produced no real costs and quickly generated additional revenue from the productsrecovered by VRU operation. There was a less-than 1 year payback on the use of a VRU system, followedby years of the pollution control device becoming steady revenue source.
5.3 Well Completions
Procedures have been developed to reduce emissions of natural gas during well completions. Theseprocedures are known by a variety of terms, including "the green flowback process" and "greencompletions." (39,40) To reduce emissions, the gases and liquids brought to the surface during thecompletion process are collected, filtered, and then placed into production pipelines and tanks, instead of being dumped, vented, or flared. The gas cleanup during a "green" completion is done with specialtemporary equipment at the well site, and after a period of time (days) the gas and liquids being produced
at the well are directed to the permanent separators, tanks, and piping and meters that are installed at thewell site. Green completion methods are not complex technology and can be very cost effective in theBarnett Shale. The infrastructure is well-established and gathering line placement for the initial collectionof gas is not a substantial risk since wells are successfully drilled with a very low failure rate.
Emissions during well completions depend on numerous site-specific factors, including the pressure of the fluids brought to the surface, the effectiveness of on-site gas capturing equipment, the controlefficiency of any flaring that is done, the chemical composition of the gas and hydrocarbon liquids at thedrill site, and the duration of drilling and completion work before the start of regular production.
Some recent reports of the effectiveness of green completions in the U.S. are available, including one bythe U.S. EPA which estimated 70% capture of formerly released gases with green completions, and
another report by Williams Corporation which found that 61% to 98% of gases formerly released duringwell completions were captured with green completions.(40-41) Barnett Shale producer Devon Energy isusing green completions on its wells, and they reported $20 million in profits from natural gas andcondensate recovered by green completed wells in a 3 year period.(42)
If green completion procedures can capture 61% to 98% of the gases formerly released during wellcompletions, the process would be a more environmentally friendly alternative to flaring of the gases,since flaring destroys a valuable commodity and prevents its beneficial use. Green completions wouldalso certainly be more beneficial than venting of the gases, since this can release very large quantities of
methane and VOCs to the atmosphere. Another factor in favor of capturing instead of flaring is thatflaring can produce carbon dioxide (a greenhouse gas), carbon monoxide, polycyclic aromatichydrocarbons, and particulate matter (soot) emissions.
5.4 Fugitive Emissions from Production Wells, Gas Processing, and Transmission
Fugitive emissions from the production wells, gas processing plants, gas compressors, and transmissionlines in the Barnett Shale can be minimized with aggressive efforts at leak detection and repair. Unlikecontrolling emissions from comparatively smaller numbers of engines or tanks (numbering in thehundreds or low thousands per county), fugitive emissions can originate from tens of thousands of valves,flanges, pump seals, and numerous other leak points. While no single valve or flange is likely to emit asmuch pollution as a condensate tank or engine exhaust stack, the cumulative mass of all these fugitivescan be substantial. There are readily-available measures that can reduce fugitive emissions.
i. Enhanced Leak Detection and Repair Program
The federal government has established New Source Performance Standards for natural gas processingplants a.k.a. NSPS Subpart KKK.(43) These standards require regularly scheduled leak detection, and if
needed, repair activities for items such as pumps, compressors, pressure-relief valves, open-ended lines,vapor recovery systems, and flares. The NSPS applies to plants constructed or modified after January 20,1984. The procedures and standards in the processing plant NSPS are generally based on the standardsdeveloped for the synthetic organic manufacturing chemicals industry.(44)
Fugitive emissions from oil and gas wells, separators, tanks, and metering stations are not covered by theprocessing plant NSPS. Nonetheless, the leak detection and repair protocols established in the NSPScould certainly be used to identify fugitive emissions from these other items. Leak detection at processingplants covered by the NSPS is performed using handheld organic vapor meters (OVMs), and inspectionsare required to be done on a specified schedule. These same procedures could be used at every pointalong the oil and gas system in the Barnett Shale to identify and reduce emissions of VOCs and methane.Doing so would reduce emissions, and by doing so, increase production and revenue to producers.
It is difficult to estimate the exact degree of emission reductions that are possible with fugitive emissionreduction programs. The large and varied nature of fugitive emission points (valves, fittings, etc.) atproduction wells, processing plants, and transmission lines means that each oil and gas related facility inthe Barnett Shale will have different options for reducing fugitive emissions. In general, leak detectionand repair programs can help identify faulty units and greatly reduce their emissions.
ii. Eliminating Natural Gas-Actuated Pneumatic Devices
The State of Colorado is currently adopting and implementing VOC control strategies to reduce ambientlevels of ozone in the Denver metropolitan area and to protect the numerous national parks and wildernessareas in the state. As part of this effort, the state investigated the air quality impacts of oil and gas
development, including the impacts of the pneumatically-controlled valves and other devices that arefound throughout gas production, processing, and transmission systems. The State of Colorado confirmedthe basic conclusions arrived at earlier by EPA and GRI in 1995, that these pneumatic devices can besubstantial sources of CH4, VOC, and HAP emissions.(45,46) Much of the following information on thesedevices and the strategies to control emissions is based on a review of the recent work in Colorado.
Valves and similar devices are used throughout the oil and gas production, processing, and transmissionsystems to regulate temperature, pressure, flow, and other process parameters. These devices can beoperated mechanically, pneumatically, or electrically. Many of the devices used in the natural gas sector
are pneumatically operated. Instrument air (i.e. compressed regular air) is used to power pneumaticdevices at many gas processing facilities, but most of the pneumatic devices at production wells and alongtransmission systems are powered by natural gas.(46) Other uses of pneumatic devices are for shutoff valves, for small pumps, and with compressor engine starters.
As part of normal operation, most pneumatic devices release or “bleed”gas to the atmosphere. The release
can be either continuously or intermittently, depending on the kind of device. In 2003 U.S. EPA estimatedthat emissions from the pneumatic devices found throughout the production, processing, and transmissionsystems were collectively one of the largest sources of methane emissions in the natural gas industry.Some U.S. natural gas producers have reduced natural gas emissions significantly by replacing orretrofitting "high-bleed" pneumatic devices. High-bleed pneumatic devices emit at least 6 standard cubicfeet gas per hour.(46) Actual field experience is demonstrating that up to 80 percent of all high-bleeddevices in natural gas systems can be replaced or retrofitted with low-bleed equipment.
The replacement of high-bleed pneumatic devices with low-bleed or no-bleed devices can reduce naturalgas emissions to atmosphere by approximately 88 or 98 percent, respectively.(21, 47) Anadarko PetroleumCorporation estimated that VOC emissions from their pneumatic devices will be reduced by 464 tpy once548 of their pneumatic controllers are retrofitted in Colorado.(46)
It may not be possible, however, to replace all high-bleed devices with low or no bleed alternatives. In thestate of Colorado, it was estimates that perhaps up to 20 percent of high-bleed devices could not beretrofitted or replaced with low-bleed devices. Some of these included very large devices requiring fastand/or precise responses to process changes which could not yet be achieved with low-bleed devices.
But even for these devices that appear to require high-bleed operation, alternatives are available. Naturalgas emissions from both high bleed and low bleed devices can be reduced by routing pneumatic dischargeports into a fuel gas supply line or into a closed loop controlled system. Another alternative is replacingthe natural gas as the pneumatic pressure fluid with pressurized air. Instrument pressurized air systems aresometimes installed at facilities that have a high concentration of pneumatic devices, full-time operatorpresence, and are on a power grid. In an instrument pressurized air system, atmospheric air is compressed,
stored in a volume tank, filtered, and dried. The advantage of a pressurized air system for operatingpneumatic devices is that operation is the same whether they air or natural gas is used. Existing pneumaticgas supply piping, control instruments, and valve actuators can be reused when converting from naturalgas to compressed air.
The U.S. EPA runs a voluntary program, EPA Natural Gas STAR, for companies adopting strategies toreduce their methane emissions. Experience from companies participating in the program indicates thatstrategies to reduce emissions from pneumatic devices are highly cost effective, and many even pay forthemselves in a matter of months.(46) EPA reports that one company replaced 70 high-bleed pneumaticdevices with low-bleed devices and retrofitted 330 high-bleed devices, which resulted in an emissionreduction of 1,405 thousand cubic meters per year. At $105/m3, this resulted in a savings of $148,800 peryear. The cost, including materials and labor for the retrofit and replacement, was $118,500, and
therefore, the payback period was less than one year. Early replacement (replacing prior to projected end-of-service-life) of a high-bleed valve with a low-bleed valve is estimated to cost $1,350. Based on $3/m3 gas, the payback was estimated to take 21 months. For new installations or end of service lifereplacement, the incremental cost difference of high-bleed devices versus low-bleed devices was $150 to$250. Based on $3 per Mcf gas, the payback was estimated to take 5 to 12 months.(46)
Overall, cost-effective strategies are available for reducing emissions and enhance gas collection frompneumatic devices in Barnett Shale area operations. These strategies include:
Oil and gas production in the Barnett Shale region of Texas has increased rapidly over the last 10 years.The great financial benefits and natural resource production that comes from the Barnett Shale bringswith it a responsibility to minimize local, regional, and global air quality impacts. This report examinedemissions of smog forming compounds, air toxic compounds, and greenhouse gases from oil and gas
activity in the Barnett Shale area, and identified methods for reducing emissions.
Emissions of ozone and fine particle smog forming compounds (NOx and VOC) will be approximately191 tons per day on an annual average basis in 2009. During the summer, VOC emissions will increase,raising the NOx + VOC total to 307 tpd, greater than the combined emissions from the major airports andon-road motor vehicles in the D-FW metropolitan area.
Emissions in 2009 of air toxic compounds from Barnett Shale activities will be approximately 6 tpd on anannual average, with peak summer emissions of 17 tpd.
Emissions of greenhouse gases like carbon dioxide and methane will be approximately 33,000 CO2 equivalent tons per day. This is roughly comparable to the greenhouse gas emissions expected from two
750 MW coal-fired power plants.
Cost effective emission control methods are available with the potential to significantly reduce emissionsfrom many of the sources in the Barnett Shale area, including
• the use of "green completions" to capture methane and VOC compounds during wellcompletions,
• phasing in of electric motors as an alternative to internal-combustion engines to drive gascompressors,
• the control of VOC emissions from condensate tanks with vapor recovery units, and
• replacement of high-bleed pneumatic valves and fittings on the pipeline networks with no-bleedalternatives.
Large reductions in greenhouse gas emissions could be achieved through the use of green completionmethods on all well completions, with the potential to eliminate almost 200 tpd of methane emissionswhile increasing revenue for producers by recovering saleable gas. In addition, the replacement of internalcombustion engines with electric motors for compression power could reduce smog-forming emissions inthe D-FW metropolitan area by 65 tpd. Significant emission reductions could also be achieved with theuse of vapor recovery units on oil and condensate tanks, which could eliminate large amounts of VOCemissions. Vapor recovery units on condensate tanks would pay for themselves in a matter of months bygenerating additional revenue to producers from the gas and condensate that would be captured instead of released to the atmosphere. Fugitive emissions of methane, VOC, and HAPs could be reduced with aprogram to replace natural gas actuated pneumatic valves with units actuated with compressed air. Forthose devices in locations where compressed air is impractical to implement, connection of the bleedvents of the devices to sales lines also could greatly reduce emissions.
There are significant opportunities available to improve local and regional air quality and reducegreenhouse gas emissions by applying readily available methods to oil and gas production activities in theBarnett Shale.
1. Railroad Commission of Texas, "Barnett Shale Information – Updated July 30, 2008."on-line document: http://www.rrc.state.tx.us/barnettshale/index.html
2. Railroad Commission of Texas, "Newark, East (Barnett Shale) Field – Map – April 17, 2008." RRC
Geographic Information Systems, Austin, Texas.on-line database: http://www.rrc.state.tx.us/divisions/og/maps/index.html
3. U.S. Environmental Protection Agency and the Gas Research Institute, "Methane Emissions from theNatural Gas Industry." EPA/600/SR-96/080, GRI-94/0257. June 1996.on-line document: http://www.epa.gov/gasstar/documents/emissions_report/1_executiveummary.pdf andhttp://www.p2pays.org/ref%5C07/06348.pdf
4. U.S. Environmental Protection Agency, "Greenhouse Gases and Global Warming Potential Values –Excerpt from the Inventory of U.S. Greenhouse Emissions and Sinks: 1990-2000."April 2002.on-line document: http://www.epa.gov/climatechange/emissions/downloads/ghg_gwp.pdf
5. Railroad Commission of Texas, "Oil and Gas Production Data Query."on-line database: http://webapps.rrc.state.tx.us/PDQ/home.do
6. Personal communication: TCEQ to SMU, summary of results of 2007 Barnett Shale/D-FW compressorengine survey, August 1, 2008.
7. Texas Commission on Environmental Quality, "Revisions to the State Implementation Plan (SIP) forthe Control of Ozone Air Pollution – Dallas-Fort Worth Eight-Hour Ozone Nonattainment AreaAttainment Demonstration." Project No. 2006-013-SIP-NR. May 23, 2007. on-line document:http://www.tceq.state.tx.us/assets/public/implementation/air/sip/D-FW/D-FW_ad_sip_2007/2006013SIPNR_ado_Intro_052407.pdf
8. Personal communication: TCEQ to SMU, compressor engine emission factors, August 6, 2008.
9. U.S. Environmental Protection Agency, "Natural Gas-fired Reciprocating Engines." AP-42, FifthEdition, Volume I. July 2000.on-line document: http://www.epa.gov/ttn/chief/ap42/ch03/index.html
10. American Petroleum Institute, "Compendium of Greenhouse Gas Emissions Methodologies for theOil and Gas Industry." February 2004.on-line document: http://www.api.org/ehs/climate/new/upload/2004_COMPENDIUM.pdf
11. ENVIRON International Corporation, "A Pilot Project to Assess the Effectiveness of an Emission
Control System for Gas Compressor Engines in Northeast Texas – Final Report." November 4, 2005.on-line document:http://www.epa.gov/oar/ozonepollution/SIPToolkit/documents/NETAC_Compressor_Retrofit_Final_Report_110405.pdf
13. Eastern Research Group, "Natural Gas Compressor Engine Survey for Gas Production and ProcessingFacilities – H68 Final Report." a report prepared for the Houston Advanced Research Center. October 5,2006.on-line document: http://files.harc.edu/Projects/AirQuality/Projects/H068/H068FinalReport.pdf
14. Hendler A., Nunn J., Lundeen J., McKaskle R. "VOC Emissions from Oil and Condensate Storage
Tanks – Final Report," a report prepared for the Houston Advanced Research Center. October 31, 2006.on-line document: http://files.harc.edu/Projects/AirQuality/Projects/H051C/H051CFinalReport.pdf
15. Personal communication with Barnett Shale gas producer – condensate tank emissions modelingresults, 2008.
16. George D.L. "Preparation of Natural Gas Blends Used as Calibration Standards: Sources of Uncertainty and Best Preparation Practices – Final Report." Southwest Research Institute, San Antonio,Texas. April 2003.on-line document:http://www.mms.gov/tarprojects/278/calGasAccuracy_final.pdf
17. ENVIRON International Corporation, "Ozone Precursor Emission Inventory for San Juan and RioArriba Counties, New Mexico – Final Report." a report prepared for New Mexico EnvironmentDepartment. August 31, 2006.on-line document:http://www.nmenv.state.nm.us/aqb/projects/San_Juan_Ozone/NM_Area_Emissions_report.pdf
18. The Williams Companies, "Reducing Methane Emissions During Completion Operations." WilliamsProduction RMT – Piceance Basin Operations. 2007 Natural Gas Star - Production Technology TransferWorkshop. September 11, 2007.on-line document: http://www.epa.gov/gasstar/documents/workshops/glenwood-2007/04_recs.pdf
19. U.S. Environmental Protection Agency, "Green Completions." PRO Fact Sheet No. 703. EPA Natural
Gas Star, Partner Reported Opportunities for Reducing Methane Emissions. September 2004.on-line document:http://www.epa.gov/gasstar/documents/greencompletions.pdf
20. ENVIRON International Corporation, ""An Emission Inventory of Nonpoint Oil and Gas EmissionsSources in the Western Region," 15th Annual Emissions Inventory Conference, New Orleans, LA. May2006.on-line document: http://www.epa.gov/ttn/chief/conference/ei15/session12/russell.pdf
21. Fernandez R. et al, "Cost-Effective Methane Emissions Reductions for Small and Midsize NaturalGas Producers." Journal of Petroleum Technology, June 2005.on-line document: http://www.icfi.com/Markets/Environment/doc_files/methane-emissions.pdf
22. Texas Commission on Environmental Quality, "Dallas-Fort Worth Eight Hour Ozone StateImplementation Plan, Supplemental Information." letter from Susana M. Hildebrand to Thomas Diggs,April 23, 2008.on-line document:http://www.tceq.state.tx.us/assets/public/implementation/air/sip/D-FW/TCEQ_Response.pdf
23. Love Field Airport, "2005 Emission Inventory." November 3, 2006.
24. Dallas/Fort Worth International Airport, "D-FW Emissions Forecast." March 21, 2008.
25. ENVIRON International Corporation, "Ozone Impacts in D-FW from Revised Emission Controls inthe 2009 Future Year – Final Report." August 31, 2007.on-line report:http://www.tceq.state.tx.us/assets/public/implementation/air/am/docs/D-FW/p1/D-
FW_Control_Modeling_Final_Report-20070831.pdf
26a. Colorado Department of Public Health and Environment, Air Pollution Control District, "Control of Compressor Engine Emissions, Related Costs and Considerations." October 31, 2003.on-line report:http://apcd.state.co.us/documents/eac/reportoct31.doc
26b. Illinois Environmental Protection Agency, "Technical Support Document for Controlling NOxEmissions from Stationary Reciprocating Internal Combustion Engines and Turbines." Report AQPSTR07-01. March 19, 2007.on-line report:http://www.epa.state.il.us/air/rules/rice/tsd-rice.pdf
27. U.S. Environmental Protection Agency, "Draft Estimates of Cost Effectiveness of Non-SelectiveCatalytic Reduction for Rich-burn IC Engines (from March 21, 2006)." information from Jaime Pagan of OAQPS.
28. ENVIRON International Corporation, "Demonstration of NOx Emission Controls for Gas CompressorEngines – A Study for Northeast Texas." December 6, 2005.on-line document:http://www.epa.gov/air/ozonepollution/SIPToolkit/documents/12-20-05_rich-burn_engine_control_briefing.pdf
29. Interstate Natural Gas Association of America, "Interstate Gas Pipeline Systems - Prime
30. Williams Companies, "Compressor Facility - Project Overview and Facility Design."on-line document:http://engr.smu.edu/~aja/2007-ozone-report/Williams-Gas.pdf
31. Oliver J.A., Samotyj M.J. "Electrification of Natural Gas Pipelines – A Great Opportunity for TwoCapital Intensive Industries." IEEE Transactions on Energy Conversion, vol. 14, pp. 1502-1506,December 1999.on-line document:
32. Mokhatab S. "Compressor Station Design Criteria." Pipeline and Gas Journal, June 2007.on-line document:http://findarticles.com/p/articles/mi_m3251/is_/ai_n25008106?tag=artBody;col1
33. Ranger Plant Construction Company, Inc., Abilene, Texas.on-line document:http://www.rpcabilene.com/history-1.html
36. Valenti M. "Gas Pipelines Go Electric." Mechanical Engineering, December 1996.on-line document:http://www.memagazine.org/backissues/december96/features/gaspipe/gaspipe.html
37. Dresser-Rand Corporation, "New Datum-C Electric Motor-Driven Compressor Provides Quiet,Emission-Free Solution for Natural Gas Pipeline Applications." Dresser-Rand Insights, vol. 8, no. 1,2005.on-line document:http://www.dresser-rand.com/insight/v8n01/art_2.asp
38. Occidental Oil and Gas Corporation, "Technical Barriers to Emissions Reductions: Gas STAR CaseStudies." September 26, 2006.on-line document:http://www.ipieca.org/activities/climate_change/downloads/workshops/26sept_06/Session_3/Ravishanker.pdf
39. Integrated Production Services, "Green Flowback Process." presentation at Texas A&M University –Corpus Christi, Improved Profits Through Best Managed Practices.on-line document:http://www.epa.gov/gasstar/documents/workshops/houston-2005/green_flowback.pdf
40. U.S. Environmental Protection Agency, "Green Completions - Methane Emissions Reductions." PRO
Fact Sheet No. 703. EPA Natural Gas Star, Partner Reported Opportunities for Reducing MethaneEmissions. September 2004.on-line document:http://www.epa.gov/gasstar/documents/greencompletions.pdf
41. The Williams Companies, "Reducing Methane Emissions During Completion Operations –Economics Volume Recovered." Williams Production RMT – Piceance Basin Operations. 2007 NaturalGas Star - Production Technology Transfer Workshop. September 11, 2007.on-line document:http://www.epa.gov/gasstar/documents/workshops/glenwood-2007/04_recs.pdf
42. Devon Energy, "EPA Natural Gas Star Program – Economics of FWB RECs."
43. U.S. Environmental Protection Agency, "Standards of Performance for Equipment Leaks of VOCfrom Onshore Natural Gas Processing Plants." 40 CFR Part 60, Subpart KKK.
44. U.S. Environmental Protection Agency, "Standards of Performance for Equipment Leaks of VOC inthe Synthetic Organic Chemicals Manufacturing Industry for Which Construction, Reconstruction, orModification Commenced After January 5, 1981, and on or Before November 7, 2006." 40 CFR Part 60,Subpart VV.
45. ENVIRON International Corporation, "Development of Baseline 2006 Emissions from Oil and Gas
Activity in the Denver-Julesburg Basin." a report prepared for the Colorado Department of Public Healthand Environment. April 30, 2008.
46. Colorado Air Pollution Control Division, "High Bleed Pneumatic Devices." presented at the April 10,2008 RAQC Meeting.on-line document:http://www.cdphe.state.co.us/ap/ozone/RegDevelop/IssuePapers/April4-08/APCDOZISSUEPAPERpneumaticdevicesRev1.pdf
47. ENVIRON International Corporation, "WRAP Area Source Emissions Inventory Projections andControl Strategy Evaluation Phase II - Final Report," September 2007.on-line document:
A draft version of this report was prepared in September 2008 and distributed for review and comment to
oil and gas producers, state and federal regulators, authors of some of the references used in this report,
and others. The author appreciates the comments received by those reviewers and the time they took to
provide feedback. For the purpose of full disclosure, the author notes that he was an employee with
Radian International LLC working on projects for several gas industry clients, including the Gas Research Institute and gas pipeline companies, during the time that "Methane Emissions from the Natural
Gas Industry" (Reference 15) was published. The authors of Reference 15 were also employees of Radian
International LLC, working as contractors for the Gas Research Institute and the Environmental
Protection Agency. The author of this study notes that he did not work on or participate in the GRI/EPA
project performed by the other Radian International personnel.
Images on the cover page from the Texas Railroad Commission and the U.S. Department of Energy.
Some typos and spreadsheet errors fixed on 2/8/2009.
Finally, the statements and recommendations in this study are those of the author, and do not represent
the official positions of Southern Methodist University.