151
BARRIER GUIDE For Low Volume and Low Speed Roads Publication No. FHWA-CFL/TD-05-009 November 2005 Central Federal Lands Highway Division 12300 West Dakota Avenue Lakewood, CO 80228
BARRIER GUIDE For Low Volume and Low Speed Roads
Publication No. FHWA-CFL/TD-05-009 November 2005
Central Federal Lands Highway Division 12300 West Dakota Avenue
Lakewood, CO 80228


Technical Report Documentation Page 1. Report No. FHWA-CFL/TD-05-009
2. Government Accession No. 3. Recipient's Catalog No.
5. Report Date November 2005
4. Title and Subtitle
Barrier Guide for Low Volume and Low Speed Roads 6. Performing Organization Code
7. Author(s) Louis B. Stephens, Jr.
8. Performing Organization Report No.
10. Work Unit No. (TRAIS) 9. Performing Organization Name and Address PerformTech Inc. 810 King Street Alexandria, VA 22314
11. Contract or Grant No. DTFH68-05-R-0000213. Type of Report and Period Covered Final Report January 2005 – November 2005
12. Sponsoring Agency Name and Address Federal Highway Administration Central Federal Lands Highway Division 12300 W. Dakota Avenue, Suite 210 Lakewood, CO 80228
14. Sponsoring Agency Code HFTS-16.4
15. Supplementary Notes COTR: Victoria A. Brinkly, FHWA WFLHD. Advisory Panel Members: Scott Whittemore and James Asirifi, FHWA EFLHD; Ed Demming, Greg Schertz, and Mike Daigler, FHWA CFLHD; Cathy Satterfield, FHWA WVDIV. This project was funded under the FHWA Federal Lands Highway Coordinated Technology Implementation Program (CTIP). To provide comments concerning this document contact: Mr. Greg Schertz, FHWA FLH Safety Discipline Leader, (720)-963-3764, [email protected].
16. Abstract This Guide is intended to provide assistance in the warranting, selection, and design of roadside barriers. The Guide is prepared specifically for warranting, selecting, and designing barriers on Federal Lands Highways projects that are low volume and/or low speed facilities. The guidelines present practical and useful guidance for common conditions and situations encountered in the design of roadside barriers for Federal Lands Highway projects.
Warranting of roadside barriers is a process that involves determining the needed clear zone, identifying potential hazards, analyzing strategies for corrective action, and evaluating the use of roadside barriers. This process is designed to identify only the most severe hazards close to the roadway that are appropriate for shielding by barriers. It takes into account both the cost of a barrier and the expected crashes into that barrier. Local conditions, policies, and resources are also considered in this process. The barrier selection process includes consideration for speed, hazard offset and special design considerations for aesthetics and severe conditions. These considerations lead to a list of technically acceptable barriers for a specific site. Additional selection criteria are suggested for final barrier selection. Roadside design and placement criteria expand on the AASHTO Roadside Design Guide design process, making it more applicable to low volume, low speed rural conditions. An alternate design process is included for locations with restricted conditions or severe cost constraints.
17. Key Words BARRIER WARRANTS, BARRIER SELECTION, BARRIER DESIGN, LOW VOLUME, LOW SPEED, RURAL
18. Distribution Statement No restriction. This document is available to the public from the sponsoring agency at the website http://www.cflhd.gov.
19. Security Classif. (of this report) Unclassified
20. Security Classif. (of this page) Unclassified
21. No. of Pages 152
22. Price
Form DOT F 1700.7 (8-72) Reproduction of completed page authorized

SI* (MODERN METRIC) CONVERSION FACTORSAPPROXIMATE CONVERSIONS TO SI UNITS
Symbol When You Know Multiply By To Find Symbol
LENGTHin inches 25.4 millimeters mmft feet 0.305 meters myd yards 0.914 meters mmi miles 1.61 kilometers km
AREAin2 square inches 645.2 square millimeters mm2
ft2 square feet 0.093 square meters m2
yd2 square yard 0.836 square meters m2
ac acres 0.405 hectares hami2 square miles 2.59 square kilometers km2
VOLUMEfl oz fluid ounces 29.57 milliliters mLgal gallons 3.785 liters Lft3 cubic feet 0.028 cubic meters m3
yd3 cubic yards 0.765 cubic meters m3
NOTE: volumes greater than 1000 L shall be shown in m3
MASSoz ounces 28.35 grams g lb pounds 0.454 kilograms kg T short tons (2000 lb) 0.907 megagrams (or "metric ton") Mg (or "t")
TEMPERATURE (exact degrees)°F Fahrenheit 5 (F-32)/9 Celsius °C
or (F-32)/1.8
ILLUMINATIONfc foot-candles 10.76 lux lx fl foot-Lamberts 3.426 candela/m2 cd/m2
FORCE and PRESSURE or STRESS lbf poundforce 4.45 newtons Nlbf/in2 poundforce per square inch 6.89 kilopascals kPa
APPROXIMATE CONVERSIONS FROM SI UNITS
Symbol When You Know Multiply By To Find Symbol
LENGTHmm millimeters 0.039 inches inm meters 3.28 feet ftm meters 1.09 yards yd km kilometers 0.621 miles mi
AREAmm2 square millimeters 0.0016 square inches in2
m2 square meters 10.764 square feet ft2
m2 square meters 1.195 square yards yd2
ha hectares 2.47 acres ackm2 square kilometers 0.386 square miles mi2
VOLUMEmL milliliters 0.034 fluid ounces fl oz L liters 0.264 gallons galm3 cubic meters 35.314 cubic feet ft3
m3 cubic meters 1.307 cubic yards yd3
MASSg grams 0.035 ounces ozkg kilograms 2.202 pounds lbMg (or "t") megagrams (or "metric ton") 1.103 short tons (2000 lb) T
TEMPERATURE (exact degrees)°C Celsius 1.8C+32 Fahrenheit °F
ILLUMINATIONlx lux 0.0929 foot-candles fccd/m2 candela/m2 0.2919 foot-Lamberts fl
FORCE and PRESSURE or STRESSN newtons 0.225 poundforce lbfkPa kilopascals 0.145 poundforce per square inch lbf/in2
*SI is the symbol for the International System of Units. Appropriate rounding should be made to comply with Section 4 of ASTM E380.
(Revised March 2003)

Barrier Guide November 2005
_____________________________________________________________________List of Tables i
TABLE OF CONTENTS
Section Page
CHAPTER 1: INTRODUCTION 1.1 OBJECTIVES OF THIS GUIDE ...................................................................................1-1 1.2 CHALLENGES OF FEDERAL LANDS PROJECTS ....................................................1-2 1.3 THE ROADSIDE SAFETY PROBLEM.........................................................................1-3 1.4 LOW VOLUME ROAD ISSUES ...................................................................................1-5 1.5 LOW SPEED ROAD ISSUES ......................................................................................1-6 1.6 APPLICATIONS OF THIS GUIDE ...............................................................................1-7
CHAPTER 2: BARRIER WARRANTS 2.1 THE WARRANTING PROCESS..................................................................................2-1 2.2 DETERMINE THE NEEDED CLEAR ZONE................................................................2-2 2.2.1 The Clear Zone...............................................................................................2-2 2.2.2 Clear Zone Table............................................................................................2-2 2.2.3 Horizontal Curve Adjustment..........................................................................2-4 2.2.4 Opposing Traffic Clear Zone ..........................................................................2-5 2.2.5 Effects of Curb on the Clear Zone..................................................................2-5 2.2.6 Application of the Clear Zone .........................................................................2-6 2.3 IDENTIFY POTENTIAL HAZARDS..............................................................................2-8 2.3.1 Potential Hazards ...........................................................................................2-8 2.3.2 Crash History................................................................................................2-12 2.3.3 Innocent Bystander Warrant.........................................................................2-12 2.4 ANALYZE STRATEGIES ...........................................................................................2-13 2.4.1 Probability and Severity................................................................................2-13 2.4.2 Strategies for Corrective Action....................................................................2-14 2.4.3 Strategies for Specific Hazards ....................................................................2-15 2.5 ANALYZE THE NEED FOR ROADSIDE BARRIERS................................................2-16 2.5.1 Barrier Considerations..................................................................................2-16 2.5.2 Analytical Procedures...................................................................................2-17 2.5.3 Subjective Procedure ...................................................................................2-17 2.5.4 Bridge Rail Ends...........................................................................................2-18 2.6 EXAMPLE PROBLEMS .............................................................................................2-19
CHAPTER 3: BARRIER SELECTION 3.1 BARRIER TYPES ........................................................................................................3-1 3.2 BARRIER SELECTION................................................................................................3-8 3.3 BARRIER SELECTION TABLES ...............................................................................3-10 3.4 END TREATMENTS ..................................................................................................3-13 3.5 TRANSITION SECTIONS ..........................................................................................3-20 3.6 EXAMPLE PROBLEMS .............................................................................................3-23

Barrier Guide November 2005
TABLE OF CONTENTS (CONTINUED)
Section Page
_____________________________________________________________________Table of Contents ii
CHAPTER 4: BARRIER DESIGN AND PLACEMENT 4.1 OVERVIEW OF THE AASHTO ROADSIDE DESIGN GUIDE DESIGN PROCESS....4-1 4.1.1 Design Variables ............................................................................................4-1 4.1.2 Considerations for Selection L2 ......................................................................4-3 4.1.3 Design Criteria Tables....................................................................................4-5 4.1.4 Length of Need Determination........................................................................4-6 4.1.5 Opposition Traffic Length of Need..................................................................4-7 4.1.6 Length of Need on Horizontal Curves ............................................................4-8 4.1.7 Graphic Solution...........................................................................................4-10 4.1.8 Layout Requirements ...................................................................................4-11 4.2 ALTERNATE DESIGN PROCESS.............................................................................4-12 4.3 COMMON DESIGN AND LAYOUT CHALLENGES...................................................4-15 4.4 EXAMPLE PROBLEMS .............................................................................................4-17
APPENDIX A: ROADSIDE BARRIER WARRANTS
A.1 INTRODUCTION......................................................................................................... A-1 A.2 STEPS IN THE WARRANTING PROCESS................................................................ A-2 A.3 CALCULATION OF THE ADJUSTED TRAFFIC FACTOR......................................... A-3 A.4 APPLICATION OF THE WARRANTING TABLES...................................................... A-5 A.5 WARRANTING TABLES............................................................................................. A-6 A.6 SAMPLE PROBLEMS............................................................................................... A-26
APPENDIX B: BARRIER DATA TABLES

Barrier Guide November 2005
_____________________________________________________________________List of Tables iii
LIST OF TABLES
Figure Page
Table 1.1: Objects Most Commonly Struck in Fatal Crashes ..................................................1-3 Table 1.2: Deaths in Roadside Crashes, 2003 ........................................................................1-4
Table 2.1: Clear Zone Distances from Edge of Through Traveled Way (Metric) .....................2-3 Table 2.1: Clear Zone Distances from Edge of Through Traveled Way (U.S. Customary) .....2-4 Table 2.2: Horizontal Curve Adjustments ................................................................................2-5 Table 2.3: Fixed Objects ..........................................................................................................2-8 Table 2.4: Drainage Features ..................................................................................................2-9Table 2.5: Grading Features ..................................................................................................2-10Table 2.6: Other Features......................................................................................................2-11Table 2.7: Strategies for Corrective Actions ..........................................................................2-14 Table 2.8: Barrier Warrant Considerations ............................................................................2-18
Table 3.1: Roadside Barrier Systems ......................................................................................3-1 Table 3.2: Technically Acceptable Barriers, Normal Conditions ............................................3-10 Table 3.3: Technically Acceptable Barriers, Primary Design Issue: Aesthetics .....................3-11 Table 3.4: Technically Acceptable Barriers, Primary Design Issue: Severe Conditions ........3-12 Table 3.5: Available End Treatments.....................................................................................3-13 Table 3.6: Transition Sections ...............................................................................................3-21
Table 4.1: Suggested Runout Lengths, LR...............................................................................4-5 Table 4.2: Suggested Shy Line Offset Values, LS....................................................................4-5 Table 4.3: Suggested Maximum Flare Rates...........................................................................4-5 Table 4.4: Alternate LON Design for W-Beam and Thrie-Beam Systems .............................4-13 Table 4.5: Alternate LON Design for Log and Timber Rail Systems......................................4-14
Barrier Guide November 2005
_____________________________________________________________________Table of Contents iv
LIST OF FIGURES
Figure Page
Figure 2.1: Barrier Warranting Proccess....................................................................................2-1 Figure 2.2: Roadway with 2M (6 ft) to 2.4 M (8 ft) Clear Zone...................................................2-7 Figure 2.3: Unshielded Bridge Rail End.....................................................................................2-8 Figure 2.4: Vertical Drop and Boulders....................................................................................2-11 Figure 2.5: Delineation on a Horizontal Curve .........................................................................2-14
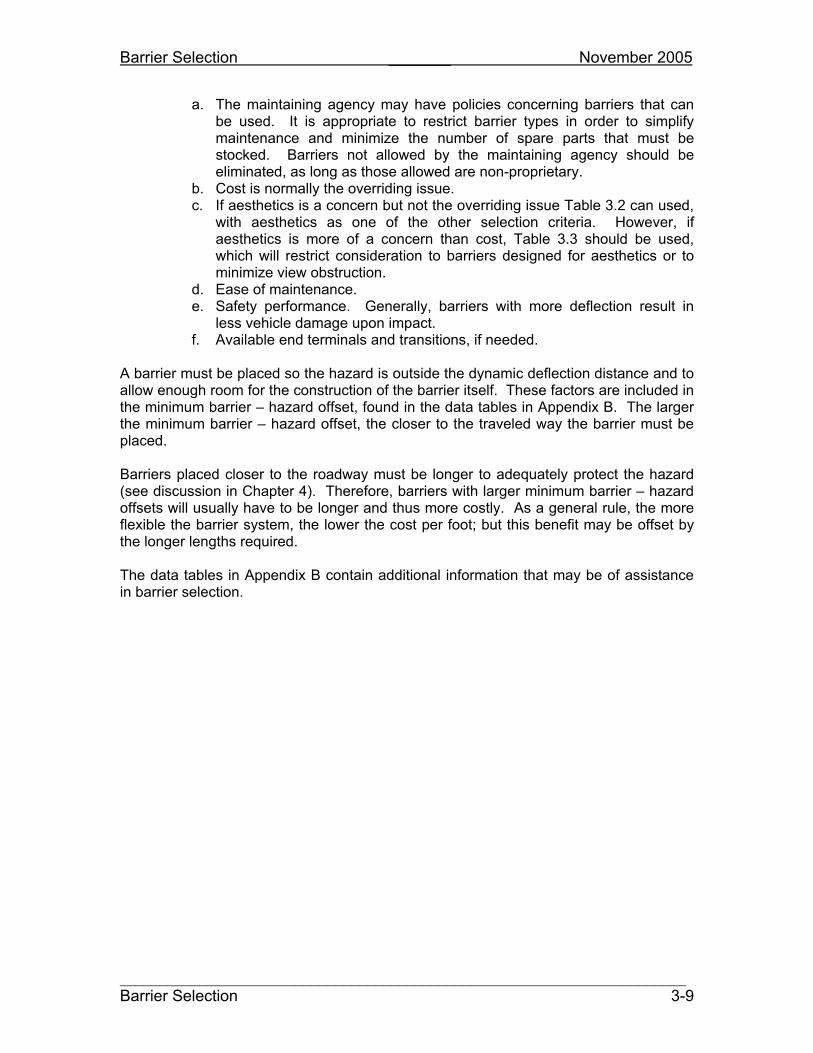
Figure 3.1: Three-Strand Cable, G1 ..........................................................................................3-2Figure 3.2: High Tension Cable, HTC........................................................................................3-2 Figure 3.3: Weak Post W-Beam, G2..........................................................................................3-3 Figure 3.4: Box Beam, G3 .........................................................................................................3-3 Figure 3.5: Strong Post W-Beam, G4 ........................................................................................3-4 Figure 3.6: Thrie Beam, G9 .......................................................................................................3-4 Figure 3.7: Concrete Safety Shape, CSS ..................................................................................3-5 Figure 3.8: Steel-Backed Log Rail, SBL ....................................................................................3-5 Figure 3.9: Steel-Backed Timber Rail, SBT ...............................................................................3-6 Figure 3.10: Precast Concrete Guardwall, PCG ........................................................................3-6 Figure 3.11: Stone Masonry Guardwall, SMG ...........................................................................3-7 Figure 3.12: Random Rubble Cavity Wall, RCW .......................................................................3-7 Figure 3.13: Wyoming Box Beam End Terminal ......................................................................3-15 Figure 3.14: W-Beam with MELT.............................................................................................3-15 Figure 3.15: W-Beam Buried in Backslope ..............................................................................3-16 Figure 3.16: W-Beam Flared End ............................................................................................3-16 Figure 3.17: W-Beam Tangent End .........................................................................................3-17 Figure 3.18: Concrete Safety Shape Buried in Backslope.......................................................3-17 Figure 3.19: Steel-Backed Timber Turned Down.....................................................................3-18 Figure 3.20: Steel-Backed Timber Buried in Backslope ..........................................................3-18 Figure 3.12: W-Beam Transition ..............................................................................................3-22Figure 3.22: W-Beam to Thrie-Beam Transition ......................................................................3-22
Figure 4.1: Barrier Design Variables..........................................................................................4-1Figure 4.2: Considerations for Selection L2 in Order of Importance...........................................4-3 Figure 4.3: Opposing Traffic Length of Need.............................................................................4-7 Figure 4.4: Length of Need on the Outside of a Horizontal Curve .............................................4-8 Figure 4.5: Length of Need on the Inside of a Horizontal Curve................................................4-9 Figure 4.6: Graphic Solution for LON of a Tangent Section ....................................................4-10 Figure 4.7: Curved Rail Guadrail .............................................................................................4-15Figure 4.8: Break in Barrier......................................................................................................4-16

Introduction November 2005
________________________________________________________________Objectives of This Guide 1-1
CHAPTER 1 INTRODUCTION
1.1 OBJECTIVES OF THIS GUIDE
This guide is intended to provide assistance in the warranting, selection and design of roadside barriers. This document is not intended to be a design standard. Rather it is a tool for Federal Lands design engineers and owner agency representatives. Since it is impossible to foresee all possible conditions and situations, these guidelines should not be used as a substitute for good engineering judgment. The guide is prepared specifically for warranting, selecting and designing barriers on Federal Lands projects that are low volume and/or low speed facilities. Finally, the guidelines present practical and useful guidance for common conditions and situations encountered in the design of roadside barriers for Federal Lands projects.

Introduction November 2005
________________________________________________________________1-2 Challenges of Federal Lands Projects
1.2 CHALLENGES OF FEDERAL LANDS PROJECTS
The Federal Lands Highway Divisions of the Federal Highway Administration partner with the National Park Service, the Forest Service, the Fish and Wildlife Service and other federal, state and local agencies to plan, design and build roads into and within federally owned lands. These roads are frequently low volume and low speed facilities. The character of Federal Lands projects frequently raises roadside safety concerns. Mountainous terrain, forests, boulders and water hazards are examples of common roadside features that may be considered serious hazards. These safety concerns are somewhat mitigated because these roads frequently have low nighttime traffic, may be closed during the winter and many have restrictions on commercial truck usage.
It is common for environmental, wildlife and aesthetic concerns to be in conflict with roadside safety concerns on Federal Lands projects. It is the responsibility of the Federal Lands Highway Division design engineer, in cooperation with the land management and road owner agency representatives, to find the proper balance of public values related to environmental, aesthetic, safety, mobility and sustainability concerns.
Context Sensitive Solutions (CSS) encourages flexibility in the application of design standards and guidelines to accommodate local concerns about issues such as community needs, environment and aesthetics. Federal Lands engineers have been practicing CSS for decades. Section 9 of the Project Development and Design Manual discusses the application of CSS on Federal Lands projects. This guide recognizes that the full clear zones and barrier warrants recommended in the AASHTO Roadside Design Guide may be impractical to achieve on rural low volume, low speed roads and offers guidelines to identify the most serious roadside hazards. In light of CSS, the best decision will not always be to implement a recommendation from this guide. Although it is legitimate to exercise flexibility in the application of design standards and guidelines, it is also important to have a clear understanding of the safety consequences of context sensitive decisions so that an appropriate balance can be achieved.

Introduction November 2005
________________________________________________________________The Roadside Safety Problem 1-3
1.3 THE ROADSIDE SAFETY PROBLEM
There are many reasons why vehicles leave the pavement and encroach onto the roadside, including:
Driver fatigue or inattention Excessive speed Driving under the influence of drugs or alcohol Crash avoidance Rebound off an initial crash within the roadway Environmental conditions such as ice, rain or poor visibility Vehicle component failure
Regardless of the reason, an encroachment into the roadside environment can lead to a serious crash. Roadside crashes represent approximately 20 percent of all motor vehicle fatal crashes, typically accounting for over 9,000 fatalities annually. These events involve a vehicle leaving the roadway, for whatever reason, and hitting a fixed object alongside the road. Of these crashes, 60 percent occur on rural roads. Forty-one percent of all roadside fatalities occur on horizontal curves.
Trees are by far the most commonly struck object type, accounting for almost half of all fixed object crashes. Table 1.1 lists the roadside objects most commonly struck in roadside fatal crashes, in descending order of frequency:
Table 1.1: Objects Most Commonly Struck in Fatal Crashes
1. Tree 2. Utility Pole 3. Boulder 4. Drainage Device 5. Embankment 6. Guardrail

Introduction November 2005
________________________________________________________________1-4 The Roadside Safety Problem
Although roadside fatalities occur more frequently at higher speeds, they can, in fact, occur at any speed, as shown below:
Table 1.2: Deaths in Roadside Crashes, 2003
Speed Limit Percent
50 km/h or less (30 mph or less) 12% 55 – 60 km/h (35 – 40 mph) 19% 70 – 80 km/h (45 – 50 mph) 17% 90 km/h or greater (55 mph or greater) 48% No Limit or Unknown 4% Total 100%
All of the crash statistics discussed in this section are from analysis of data from the Fatality Analysis Reporting System by the Insurance Institute for Highway Safety.

Introduction November 2005
________________________________________________________________Low Volume Road Issues 1-5
1.4 LOW VOLUME ROAD ISSUES
For purposes of this guide, low volume roads are defined as those with an annual average daily traffic (ADT) of under 2,000 vehicles per day (vpd). These roads present many challenges to highway engineers. The roadside crash fatality rate for rural minor roads is estimated to be three times the average roadside fatal crash rate for all roads in the United States. These types of roads typically have very restricted rights-of-way, little or no clear zones and substandard design features. Because there is less traffic, drivers are more likely to become inattentive and fatigued. Low volume roads have a fairly high bridge density, averaging approximately nine bridges every 100-centerline kilometers (14 bridges every 100-centerline miles). Because of restricted conditions and rigid rails, bridges always present roadside safety issues.
Specific design features that relate directly to increased roadside crashes include narrow lanes, little or no shoulders, curvilinear alignment, poor delineation and poor pavement conditions. Design inconsistencies can result in increased roadside crashes, such as exceptionally sharp curves on a fairly straight road, abrupt narrowing of lanes and varying shoulder widths and pavement conditions. All of these features, common on low volume roads, contribute to increased roadside crashes.
The American Association of State Highway and Transportation Officials (AASHTO) Roadside Design Guide (RDG) contains some guidance on low volume conditions, but there is very little detail. The AASHTO Guidelines for Geometric Design of Very Low Volume Local Roads (ADT < 400) also offers very little guidance for roadside design issues.
Roadside crashes can and do occur on low volume roads, but corrective actions can be difficult to justify economically. Although the probability of roadside crashes may be fairly high, the actual numbers can be very low, making the expenditure of funds difficult to justify.

Introduction November 2005
________________________________________________________________1-6 Low Speed Road Issues
1.5 LOW SPEED ROAD ISSUES
Low speed conditions, defined as 70 km/h (45 mph) or less, are not commonly associated with roadside crashes. In fact, the risk of death or serious injury in roadside crashes drops significantly as vehicle speeds are reduced. The probability of serious crashes can be estimated by the energy expended in a crash. The energy expended in a crash is an exponential relationship to velocity or speed. Significantly less energy is expended in low speed crashes compared to high speed crashes. Also, drivers in low speed situations are more likely to regain control of their vehicle and avoid a roadside crash than in a high speed situation. This is not to say, however, that serious roadside crashes cannot occur in low speed conditions, as shown in Table 1.2.
The RDG provides very little guidance for low speed roads. Generally, criteria are provided down to about 60 km/h (40 mph) with very little information for slower speeds. The National Cooperative Highway Research Program (NCHRP) Report 350 provides for low speed testing of roadside barriers and other safety devices, at 50 km/h (30 mph) (Test Level 1) and 70 km/h (45 mph) (Test Level 2). Because of concern about high speed conditions, Test Level 3, tested at 100 km/h (62 mph), devices are considered standard by many highway agencies. A number of Test Level 3 barriers have been tested and accepted. Test Level 3 devices work for Test Level 1 and 2 conditions as well as for high speed conditions. Some barriers have been tested and accepted only at Test Level 2 and Test Level 1.

Introduction November 2005
________________________________________________________________Applications of this Guide 1-7
1.6 APPLICATIONS OF THIS GUIDE
The recommendations in this document are not the result of crash testing or macro-analysis of crash data. The recommendations contained in this document were arrived at by review of literature, information and comments received from Federal Lands Highway Division engineers, logical extensions of published design criteria, engineering judgment and economic analysis. The recommendations are reasonable applications of good engineering practice to conditions commonly encountered on Federal Lands projects. However, it is impossible to anticipate every condition and situation. Engineers should use this guide as a tool, along with their experience, engineering judgment, other appropriate guides and standards and the needs and desires of owner agencies and the public. Frequently there will be good reasons for a designer to arrive at a solution that is not in conformance with the recommendations contained in this document.
The primary guideline for roadside barrier warranting, selection and design is the RDG. This Barrier Guide should be used as a supplement to that document for Federal Lands projects with existing traffic volumes below 2,000 and/or speeds 70 km/h (45 mph) or lower. The Project Development and Design Manual, Standard Drawings and the contract documents all tae precedence over this document.


Barrier Warrants ________ November 2005
________________________________________________________________________The Warranting Process 2-1
CHAPTER 2 BARRIER WARRANTS
2.1 THE WARRANTING PROCESS
Warranting of roadside barriers is difficult to quantify. It is more a process to ensure that all important issues are addressed rather than a “cookbook” approach. This process is summarized in Figure 2.1:
Figure 2.1: Barrier Warranting Process
1. Determine the needed clear zone.
2. Identify potential hazards.
3. Analyze strategies.
4. Evaluate roadside barriers.
Each of these steps is addressed in this chapter. This process is designed to identify only the most severe hazards close to the roadway that are appropriate for shielding by barriers. It takes into account both the cost of a barrier and the expected crashes into that barrier. Local conditions, policies and resources are also considered in this process.

Barrier Warrants ________ November 2005
________________________________________________________________________2-2 Determine the Needed Clear Zone
2.2 DETERMINE THE NEEDED CLEAR ZONE
2.2.1 The Clear Zone
The area adjacent to the edge of a traveled way available for the safe recovery of an errant vehicle is known as the clear zone. If adequate clear zone distance is available, there is a reasonable expectation that most drivers of vehicles that leave the roadway will have enough room to regain control and return to the pavement without a serious crash occurring. The desirable clear zones used for barrier design and evaluation purposes will not provide sufficient space for all vehicle departures. Some degree of risk is acceptable in the interest of economy. The first step in the warranting process is to determine the required clear zone because it is normally not necessary to shield hazards located outside the clear zone.
2.2.2 Clear Zone Table
Chapter 3 of the AASHTO Roadside Design Guide (RDG) contains charts and tables suggesting that the needed clear zone is a function of design speed (see the Project Development and Design Manual for a discussion of design speed), side slopes and horizontal curvature: all conditions that may work against the driver’s attempts to regain control of the vehicle. Additional modifications are made for low traffic volume as an economic consideration, recognizing that low volumes result in a lower crash probability. The RDG clear zone recommendations provide limited information for low speed conditions. Table 2.1 is an extension of the RDG table to account for speeds below 60 km/h (40 mph).
Table 2.1 is intended as an aid in determining what potential hazards should be considered for barrier warrants. Although it may be useful as suggested minimum clear zones for geometric design, Table 2.1 is not a design standard. Appropriate references for designing slopes are in Chapter 9 of the Project Development and Design Manualand the RDG. In general, slopes should be designed to avoid the need for barriers. Although foreslopes as steep as 1V: 3H are traversable, slopes steeper than 1V: 4H are not recoverable and are difficult to maintain. They should be considered marginal from a safety perspective. Ideally, foreslopes should be 1V: 4H or flatter. If that objective cannot be met, a combination (or “barn roof”) slope should be provided, with the top slope 1V: 4H or flatter then breaking to a steeper slope.

Barrier Warrants ________ November 2005
________________________________________________________________________Determine the Needed Clear Zone 2-3
Table 2.1: Clear Zone Distances from Edge of Through Traveled Way
(Metric Units)
FORESLOPES BACKSLOPES DESIGNSPEED
DESIGNADT 1V: 6H
or flatter 1V: 5H
to1V: 4H
1V: 3H 1V: 3H 1V: 5H to
1V: 4H
1V: 6H or flatter
30 km/h Under 750 750 - 1500
1500 - 6000 over 6000
0.5 - 2.0 1.0 - 2.0 1.5 - 2.5
2.0 – 3.0
1.0 - 2.0 1.5 - 2.5 2.0 - 3.0 2.0 - 3.0
**0.5 - 2.0 0.5 - 2.0 1.0 - 2.0 1.5 - 2.5
0.5 - 2.0 0.5 - 2.0 1.0 - 2.0 1.5 - 2.5
0.5 - 2.01.0 - 2.01.5 - 2.52.0 - 3.0
40 – 50 Km/h
Under 750 750 - 1500
1500 - 6000 over 6000
1.0 - 2.0 1.5 - 2.5 2.0 - 3.0 2.0 - 3.0
1.5 - 2.5 2.0 - 3.0 2.0 - 3.0 3.0 - 3.5
**0.5 - 2.0 1.0 - 2.0 1.5 - 2.5 2.0 - 3.0
0.5 - 2.0 1.0 - 2.0 1.5 - 2.5 2.0 - 3.0
1.0 - 2.01.5 - 2.52.0 - 3.02.0 - 3.0
55 km/h Under 750 750 - 1500
1500 - 6000 over 6000
1.5 - 2.5 2.0 - 3.0 3.0 - 3.5 3.4 - 4.5
2.0 - 3.0 2.0 - 3.5 3.5 - 4.5 4.5 - 5.0
**1.0 - 2.0 1.5 - 2.5 2.0 - 3.0 3.0 - 3.5
1.0 - 2.0 1.5 - 2.5 2.0 - 3.0 3.0 - 3.5
1.5 - 2.52.0 - 3.03.0 - 3.53.5 - 4.5
* See the AASHTO Roadside Design Guide for design speeds 60 km/h and higher.
** Foreslopes between 1V: 4H and 1V: 3H are traversable but non-recoverable. Since vehicles will not reduce speed or change direction on these slopes, the needed clear zone is determined by the slopes above and below the non-recoverable slope and extended by the width of the non-recoverable slope. See Chapter 3 of the RDG for more information on this procedure. Foreslopes steeper than 1V: 3H are considered hazards.

Barrier Warrants ________ November 2005
________________________________________________________________________2-4 Determine the Needed Clear Zone
Table 2.1: Clear Zone Distances from Edge of Through Traveled Way
(Continued) (U.S. Customary Units)
FORESLOPES BACKSLOPES DESIGNSPEED
DESIGNADT 1V: 6H
or flatter 1V: 5H
to1V: 4H
1V: 3H 1V: 3H 1V: 5H to
1V: 4H
1V: 6H or flatter
20 mph Under 750 750 - 1500
1500 - 6000 over 6000
2 - 6 3 - 7 5 - 8
7 - 10
3 – 7 5 - 8
6 - 10 7 - 10
**2 - 6 2 - 6 3 - 7 5 - 8
2 - 6 2 - 6 3 - 7 5 - 8
3 - 7 3 - 7 5 - 8
7 - 10 25 - 30
mphUnder 750 750 - 1500
1500 - 6000 over 6000
3 - 7 5 - 8
7 - 10 7 - 10
5 – 8 6 - 10 7 - 10
10 - 12
**2 - 6 3 - 7 5 - 8
7 - 10
2 - 6 3 - 7 5 - 8
7 - 10
3 - 7 5 - 8
7 - 10 7 - 10
35 mph Under 750 750 - 1500
1500 - 6000 over 6000
5 - 8 7 - 10
10 - 12 12 - 14
6 – 10 7 - 12
12 - 14 14 - 16
**3 - 7 5 - 8
7 - 10 10 - 12
3 - 7 5 - 8
7 - 10 10 - 12
5 - 8 7 - 10
10 - 12 12 - 14
* See the AASHTO Roadside Design Guide for design speeds 40 mph and higher.
** Foreslopes between 1V: 4H and 1V: 3H are traversable but non-recoverable. Since vehicles will not reduce speed or change direction on these slopes the needed clear zone is determined by the slopes above and below the non-recoverable slope and extended by the width of the non-recoverable slope. See Chapter 3 of the RDG for more information on this procedure. Foreslopes steeper than 1V: 3H are considered hazards.
2.2.3 Horizontal Curve Adjustment
On the outside of horizontal curves errant vehicles are likely to leave the roadway tangent to the curve. Consequently, additional clear zone is needed for recovery. Table 3.2 of the RDG suggests multipliers for adjusting clear zones on the outside of horizontal curves. The RDG recommends that this adjustment be used where there is reason to expect the curve to be a concern. A crash history, inadequate superelevation and serious hazards within the adjusted clear zone may be reasons to consider using an adjusted clear zone. Since roadside crashes are more likely to occur on the outside of horizontal curves, the use of these adjustments should always be considered. Adjustments on the inside of horizontal curves are not appropriate. Table 2.2 expands the RDG table to account for lower speeds.

Barrier Warrants ________ November 2005
________________________________________________________________________Determine the Needed Clear Zone 2-5
Table 2.2: Horizontal Curve Adjustments
KCZ (Curve Adjustment Factor) (Metric Units)
DESIGN SPEED (km/h) RADIUS (m) 30 40 50 55
350 1.2 300 1.2 1.2 250 1.2 1.2 1.2 200 1.2 1.2 1.3 150 1.3 1.3 1.4 100 1.4 1.4 1.5
KCZ (Curve Adjustment Factor) (U.S. Customary Units)
DESIGN SPEED (mph) RADIUS (ft) 20 25 30 35
1150 1.2 950 1.2 1.2 820 1.2 1.2 1.2 720 1.2 1.2 1.3 640 1.2 1.3 1.3 570 1.3 1.3 1.4 380 1.4 1.4 1.5
Note: The clear zone correction factor is applied to the outside of curves only. Curves with a radius greater than 350 M (1,150 ft) do not require an adjusted clear zone.
2.2.4 Opposing Traffic Clear Zone
For opposing traffic on a two-lane/two-way road, it is valid to consider the centerline as the edge of the travel way, so the near side lane is part of the opposing traffic clear zone. Therefore, the 1V: 6H or flatter foreslope column should be used in determining opposing traffic clear zones. For most low volume, low speed conditions hazards will be outside the opposing traffic clear zone except, possibly, on the outside of horizontal curves.
2.2.5 Effects of Curbs on the Clear Zone
Curbs offer little or no redirection for vehicles departing the roadway. Although generally a lower speed impact with a curb results in more redirection, crash tests and crash analyses find that curbs are frequently mounted by an impacting vehicle even at very low speeds. It is inappropriate to construct curbs for the purpose of avoiding or minimizing clear zone requirements. The decision to place curbs should be based on other factors including drainage, available right of way and land-use characteristics. The following guidance is for determining clear zone requirements if curbs are already present:

Barrier Warrants ________ November 2005
________________________________________________________________________2-6 Determine the Needed Clear Zone
At speeds of 40 km/h (25 mph) or lower, right-of-way is usually very restricted and roadside safety issues may not be a major design priority. In these cases it may be appropriate to eliminate or minimize the need for a clear zone if a vertical curb with a height of 150 mm (6 in) or higher is present. A minimum horizontal clearance of 0.5 m (1.5 ft) should be provided beyond the back of the curb.
At speeds of 50 km/h (30 mph) to 70 km/h (45 mph), the presence of curbs may be a consideration for using the minimum clear zones in the ranges shown in Table 2.1 of this guide.
At speeds of 80 km/h (50 mph) or higher, curbs will vault a vehicle causing it to become airborne. The severity of the vaulting is a function of the height of the curb and the slope of the face. If curbs with a height of 150 mm (6 in) or higher are present, the higher end of the clear zone range should be selected.
2.2.6 Application of the Clear Zone
The following list includes some helpful considerations for the selection of the clear zone:
The RDG clear zone recommendations are based on limited research, along with engineering judgment and experience. The clear zones as recommended in the RDG and in Table 2.1 of this guide are approximate ranges and are not precise. The designer must also consider site-specific conditions, operating speeds, location and practicality.
At very low volumes (under 400 ADT), it is common that rights-of-way are restricted, there are an overwhelming number of hazards and very little funds are available for corrective actions. Thus clear zones may appear impractical. Nevertheless, in these cases the clear zone concept can be used to make the roadway as safe as possible. As a minimum, a traversable consistent shoulder should be provided. As much as possible of the recommended clear zone (which is relatively small for low volume conditions) found in Table 2.1 should be provided. Figure 2.2 illustrates a low volume road with minimum clear zones. The use of the warranting process for the conditions discussed in this chapter helps identify the most serious hazards close to the roadway that may justify corrective actions. The barrier warranting procedure takes very low ADT conditions into account.
The approximate center of the range is suggested for average conditions. The high end of the range is appropriate for sites with higher risk conditions and the low end for less severe conditions.
Vehicles can and will encroach beyond the recommended clear zones. If severe hazards exist beyond these clear zones, they should be considered for protection.
Design speed should be used to determine the clear zone. When the design speed is unknown, it may be appropriate to use the posted speed. If the operating speed is greater than the design and posted speeds, it may be more appropriate to use the operating speed.

Barrier Warrants ________ November 2005
________________________________________________________________________Determine the Needed Clear Zone 2-7
If the roadway slopes vary, the slope conditions on the approach to the hazard are used rather than those at a cross section at the hazard to determine clear zone. The approach can be determined by using a 10-degree angle of departure from the edge of pavement.
See Section 3.3.4 and example problems F and G in the RDG for information on the calculation of clear zones for combination slopes.
Figure 2.2: Roadway with 2M (6 ft) to 2.4 M (8ft) Clear Zone
Barrier Warrants ________ November 2005
________________________________________________________________________2-8 Identify Potential Hazards
2.3 IDENTIFY POTENTIAL HAZARDS
2.3.1 Potential Hazards
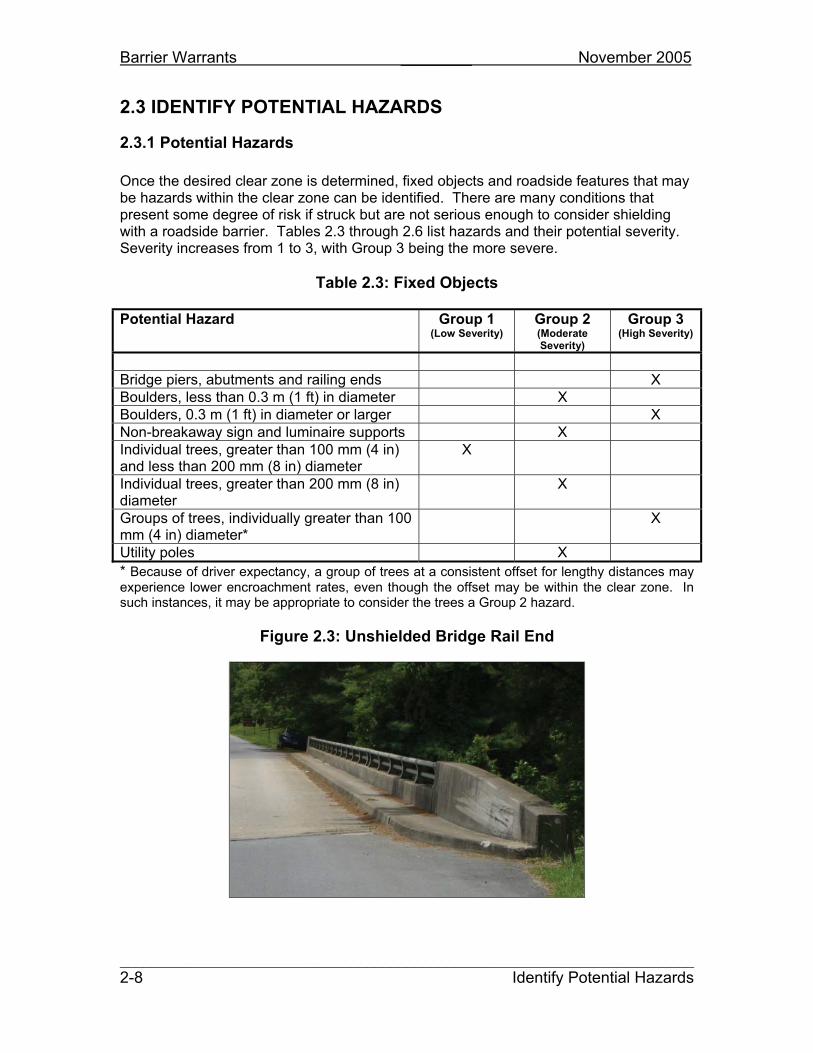
Once the desired clear zone is determined, fixed objects and roadside features that may be hazards within the clear zone can be identified. There are many conditions that present some degree of risk if struck but are not serious enough to consider shielding with a roadside barrier. Tables 2.3 through 2.6 list hazards and their potential severity. Severity increases from 1 to 3, with Group 3 being the more severe.
Table 2.3: Fixed Objects
Potential Hazard Group 1 (Low Severity)
Group 2 (Moderate Severity)
Group 3 (High Severity)
Bridge piers, abutments and railing ends X Boulders, less than 0.3 m (1 ft) in diameter X Boulders, 0.3 m (1 ft) in diameter or larger X Non-breakaway sign and luminaire supports X Individual trees, greater than 100 mm (4 in) and less than 200 mm (8 in) diameter
X
Individual trees, greater than 200 mm (8 in) diameter
X
Groups of trees, individually greater than 100 mm (4 in) diameter*
X
Utility poles X
* Because of driver expectancy, a group of trees at a consistent offset for lengthy distances may experience lower encroachment rates, even though the offset may be within the clear zone. In such instances, it may be appropriate to consider the trees a Group 2 hazard.
Figure 2.3: Unshielded Bridge Rail End

Barrier Warrants ________ November 2005
________________________________________________________________________Identify Potential Hazards 2-9
Table 2.4: Drainage Features
Potential Hazard Group 1 (Low Severity)
Group 2 (Moderate Severity)
Group 3 (High Severity)
Cross Drain Culvert Ends: Exposed culvert ends with no headwalls, 1 m (36 in) in diameter or less
X
Exposed culvert ends with no headwalls, greater than 1 m (36 in) in diameter
X
Sloped culvert ends, less than 1.2 m (4 ft) in diameter
X
Sloped culvert ends, greater than 1.2 m (4 ft) and less than 2.4 m (8 ft) in diameter
X
Sloped culvert ends, 2.4 m (8 ft) or greater in diameter
X
Vertical headwalls, less than 1.0 m (3 ft) in height
X
Vertical headwalls, 1 m (3 ft) or higher X Headwalls with parallel sloped wingwalls, 0.6 m (2 ft) or less height
X
Headwalls with parallel sloped wingwalls, greater than 0.6 m (2 ft) height
X
Headwalls with flared and sloped wing walls, 1.0 m (3 ft) or less height
X
Headwalls with flared and sloped wing walls, greater than 1.0 m (3 ft) height
X
Culvert end sections with crashworthy grates X Parallel Drain Culvert Ends: Exposed culvert ends with no headwalls, less than 0.6 m (2 ft) in diameter
X
Exposed culvert ends with no headwalls, 0.6m (2 ft) and less than 1.2 m (4 ft) in diameter
X
Exposed culvert ends, 1.2 m (4 ft) or greater in diameter
X
Mitered culvert ends, less than 1 m (3 ft) in diameter
X
Mitered culvert ends, 1 m (3 ft) or greater in diameter
X
Vertical headwalls, less than 1 m (3 ft) above ditch section
X
Vertical headwalls, 1 m (3 ft) or higher above ditch section
X
Barrier Warrants ________ November 2005
________________________________________________________________________2-10 Identify Potential Hazards
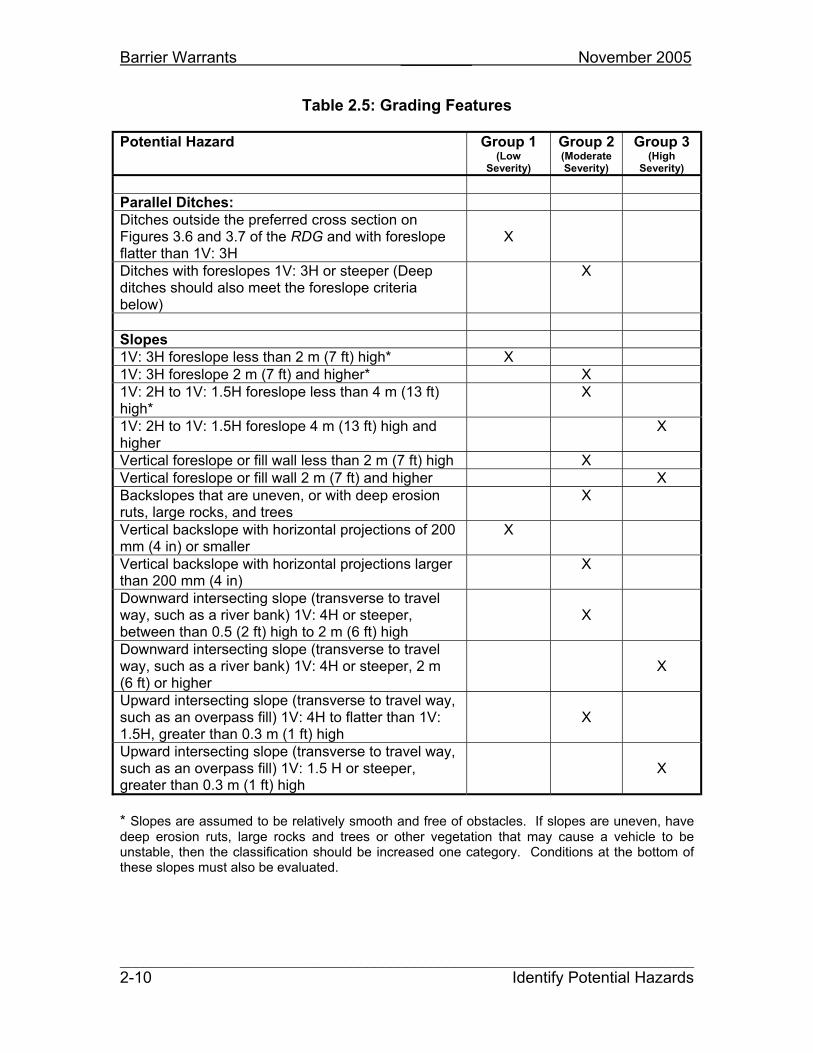
Table 2.5: Grading Features
Potential Hazard Group 1 (Low
Severity)
Group 2 (Moderate Severity)
Group 3 (High
Severity)
Parallel Ditches: Ditches outside the preferred cross section on Figures 3.6 and 3.7 of the RDG and with foreslope flatter than 1V: 3H
X
Ditches with foreslopes 1V: 3H or steeper (Deep ditches should also meet the foreslope criteria below)
X
Slopes 1V: 3H foreslope less than 2 m (7 ft) high* X 1V: 3H foreslope 2 m (7 ft) and higher* X 1V: 2H to 1V: 1.5H foreslope less than 4 m (13 ft) high*
X
1V: 2H to 1V: 1.5H foreslope 4 m (13 ft) high and higher
X
Vertical foreslope or fill wall less than 2 m (7 ft) high X Vertical foreslope or fill wall 2 m (7 ft) and higher X Backslopes that are uneven, or with deep erosion ruts, large rocks, and trees
X
Vertical backslope with horizontal projections of 200 mm (4 in) or smaller
X
Vertical backslope with horizontal projections larger than 200 mm (4 in)
X
Downward intersecting slope (transverse to travel way, such as a river bank) 1V: 4H or steeper, between than 0.5 (2 ft) high to 2 m (6 ft) high
X
Downward intersecting slope (transverse to travel way, such as a river bank) 1V: 4H or steeper, 2 m (6 ft) or higher
X
Upward intersecting slope (transverse to travel way, such as an overpass fill) 1V: 4H to flatter than 1V: 1.5H, greater than 0.3 m (1 ft) high
X
Upward intersecting slope (transverse to travel way, such as an overpass fill) 1V: 1.5 H or steeper, greater than 0.3 m (1 ft) high
X
* Slopes are assumed to be relatively smooth and free of obstacles. If slopes are uneven, have deep erosion ruts, large rocks and trees or other vegetation that may cause a vehicle to be unstable, then the classification should be increased one category. Conditions at the bottom of these slopes must also be evaluated.
Barrier Warrants ________ November 2005
________________________________________________________________________Identify Potential Hazards 2-11
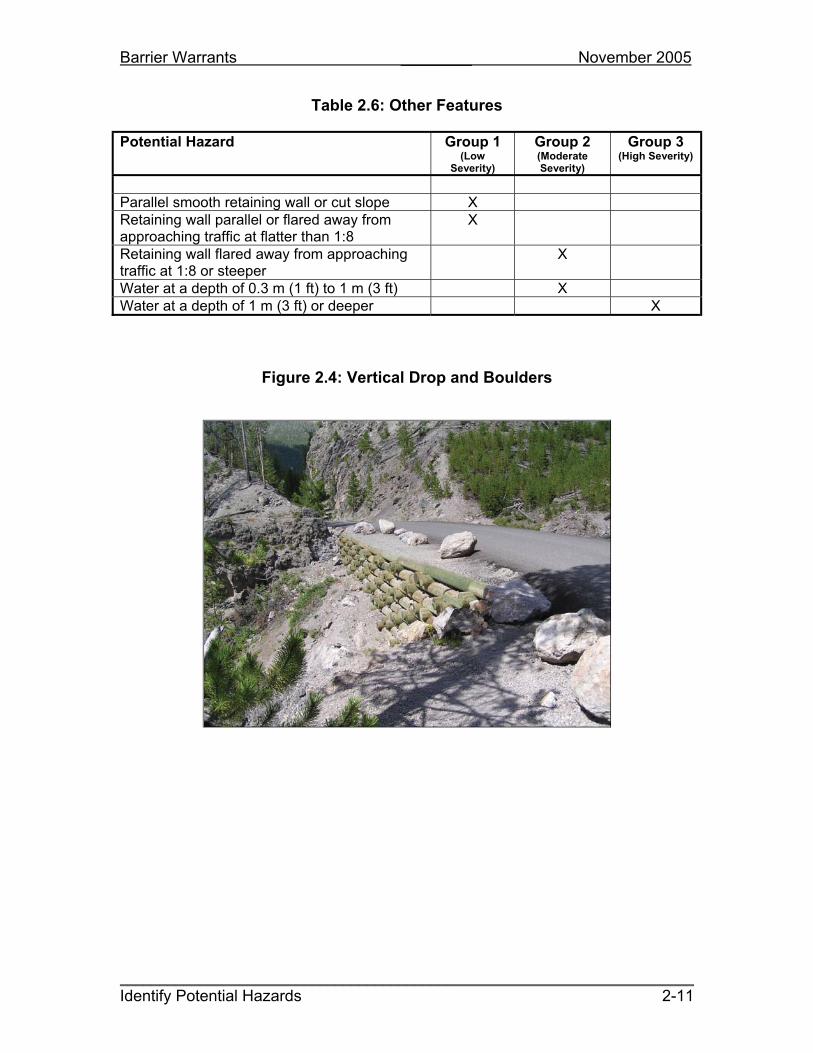
Table 2.6: Other Features
Potential Hazard Group 1 (Low
Severity)
Group 2 (Moderate Severity)
Group 3 (High Severity)
Parallel smooth retaining wall or cut slope X Retaining wall parallel or flared away from approaching traffic at flatter than 1:8
X
Retaining wall flared away from approaching traffic at 1:8 or steeper
X
Water at a depth of 0.3 m (1 ft) to 1 m (3 ft) X Water at a depth of 1 m (3 ft) or deeper X
Figure 2.4: Vertical Drop and Boulders

Barrier Warrants ________ November 2005
________________________________________________________________________2-12 Identify Potential Hazards
2.3.2 Crash History
Crash history, if available, can also be of assistance in identifying and evaluating hazards. In order to identify significant patterns, a history of several years is needed. Three to five years is usually sufficient, but even longer periods are useful for low volume roads. There is a certain amount of randomness with roadside crashes. Therefore, a crash analysis should look for patterns of crashes at several sites that share common characteristics, such as roadway features and hazard types. Care must be taken to avoid overreacting to one severe crash at a specific site when there is no established pattern. Otherwise, an expensive corrective action may be constructed to correct a problem that may never recur.
2.3.3 Innocent Bystander Warrant
A final consideration is what is known as the innocent bystander warrant. In this case the issue is not protecting the occupants of an errant vehicle, but protecting non-motorists or sensitive roadside conditions. Examples are a school playground that is within the needed clear zone, pedestrian facilities within the clear zone that will be used frequently by many pedestrians who may be inattentive to traffic or homes within the clear zone. Application of this warrant is difficult to quantify but it should follow the same general process discussed in this chapter, evaluating both risks and costs of placing or not placing barriers.

Barrier Warrants ________ November 2005
________________________________________________________________________Analyze Strategies 2-13
2.4 ANALYZE STRATEGIES
2.4.1 Probability and Severity
The concepts of probability and severity must be understood to effectively evaluate roadside safety alternatives. The probability (or likely frequency) of a vehicle striking any roadside object or condition (including barriers) is determined by a complex set of variables, including:
Traffic volume Speed Roadway characteristics (number and width of lanes, shoulders, divided or not, etc) Horizontal curvature Grade Size and offset of the hazard or barrier Rate of encroachment (affected by familiarity of drivers, driver distractions, driver
expectancy and design consistency of the roadway)
Severity is a measure of the consequences of crashes once a hazard or condition is struck, regardless of probability. Severity is a function of speed and the relative seriousness of crashes. Severity is measured by the mix of likely crash types: fatal, injury and property-damage-only. Severity can be measured by a severity index using a 0 to 10 scale. Appendix A of the RDG defines this scale using proportions of crash types. For example, of all the crashes that might occur with a roadside feature evaluated as a Severity Index of 5.0, 15 percent will be property-damage-only, 77 percent will be injury crashes and 8 percent will be fatal crashes.

Barrier Warrants ________ November 2005
________________________________________________________________________2-14 Analyze Strategies
2.4.2 Strategies for Corrective Action
Possible strategies are summarized in Table 2.7.
Table 2.7: Strategies for Corrective Actions
Strategy Possible Corrective Actions
Reduce the probability of vehicles leaving the roadway
Flatten horizontal curves Provide adequate superelevation Provide standard lane widths Pave with a skid-resistant surface Widen shoulders Pave shoulders Mark centerline and edge lines Delineate sharp curves Provide shoulder rumble strips
Eliminate the hazard Remove the hazard Relocate the hazard to outside the
clear zone Reduce the severity of the hazard Make the hazard crashworthy or
breakaway Shield with a barrier
Accept the risk and leave the hazard unprotected
Delineate the edge of traveled way Install object markers on the
hazard, if appropriate
Figure 2.5: Delineation on a Horizontal Curve

Barrier Warrants ________ November 2005
________________________________________________________________________Analyze Strategies 2-15
2.4.3 Strategies for Specific Hazards
Of the severity groups discussed in Section 2.3.1, Group 1 hazards are estimated to have a severity index of below 3.0 (fatalities are unlikely), Group 2 hazards have a severity index of 3.0 to 4.9 (some possibility of serious injury and fatality, but probably less severe than barriers) and Group 3 hazards have a severity index of 5.0 and higher (may be more severe than a crash into a barrier). Currently acceptable roadside barriers are estimated to have a severity index of 4.9. All these severity indices are estimated at 100 km/h (62mph), but generally will have the same relative meaning at lower speeds.
Group 2 hazards should be considered for the same corrective actions as Group 3 hazards if they have crash histories or are located so that a vehicle could strike more than one hazard in the same run-off-the-road event.
The following strategies are generally appropriate for the severity groups identified in Section 2.3:
Severity Group Possible Corrective Actions
Group 1 Accepting the risk and leaving the hazard is usually appropriate. Avoid placing these conditions in the clear zone or take simple, low-cost corrective actions if possible. Group 1 hazards commonly do not justify expenditure of substantial funds to correct.
Group 2 Consider cost-effective strategies to reduce probability, eliminate the hazard or reduce the severity of the hazard. Because these hazards generally do no warrant shielding with a roadside barrier, the cost of a corrective action should be less than the expected cost of a barrier. If a new road, avoid placing Group 2 hazards in the clear zone.
Group 3 Evaluate for possible use of roadside barriers if it is too expensive or impractical to eliminate either the hazard or make it crashworthy. If a barrier is found not to be warranted or if an alternate treatment is less expensive than a barrier, treat as a Group 2 hazard.
Solutions can include combinations of strategies. For instance, if a large cross drain culvert headwall is within the clear zone, a combination of effective corrective actions might be to improve the shoulders, add edge lines, extend the headwall to outside the clear zone, and remodel the headwall to make it more crashworthy.

Barrier Warrants ________ November 2005
________________________________________________________________________2-16 Analyze the Need for Roadside Barriers
2.5 ANALYZE THE NEED FOR ROADSIDE BARRIERS
2.5.1 Barrier Considerations
Barriers are not an ideal treatment for roadside hazards on low volume, low speed roads for a number of reasons, including the costs of installation, maintenance and repair as well as possible environmental and aesthetic impacts. The frequency of crashes into barriers will be larger than crashes into the hazard (simply because barriers are closer to the travel way and longer than the condition being shielded). Crashes into barriers can be serious events. For all these reasons, the alternate strategies and corrective actions discussed in Section 2.4 should be carefully evaluated before deciding on a barrier. Barriers should be considered only when other strategies are too costly or impractical and there is a reasonable expectation that the barrier will be a better choice than leaving the hazard unprotected.
The benefits, costs, impacts and risks of barriers should be considered, including:
Cost of construction, maintenance, and repair when struck. These costs can be estimated with a fair degree of certainty.
Probability and severity of striking the barrier compared to striking the hazard. This is more difficult to estimate because predicting potential outcomes is a very complicated evaluation considering many variables. Analytical tools that can quantify potential impacts on both the hazard and the corrective action are available to assist in this analysis. Otherwise, judgment based on experience and training must be applied.
Aesthetic impacts of the barrier. In parks and similar settings the aesthetics of some roadside barriers may be a valid concern. One concern may be the barrier itself and another may be view obstruction. Chapter 3 discusses both rustic-appearing barriers that have been developed specifically to mitigate aesthetic concerns and barriers that minimize view obstruction.
Environmental impacts of the barrier. There are two types of environmental impacts commonly associated with the installation of roadside barriers. Widening of a relatively flat area beyond the shoulder is frequently necessary to accommodate the width of a barrier. That widening could create environmental concerns. Also concrete and masonry barrier systems that are solid walls may restrict the movement of small animals. Environmental impacts that might be associated with barriers are usually quite small. Neither aesthetic nor environmental impacts can be quantified for direct comparison with other factors, but they should be considered when appropriate.

Barrier Warrants ________ November 2005
________________________________________________________________________Analyze the Need for Roadside Barriers 2-17
2.5.2 Analytical Procedures
Economic analysis is useful in evaluating the need for barriers. The computerized Roadside Safety Analysis Program (RSAP) quantifies all the concerns discussed except aesthetics and environmental. RSAP evaluates the probabilities and severities of roadside hazards and barriers, along with construction, maintenance and repair costs to determine the benefit/cost ratio of a corrective action such as a roadside barrier.
Although RSAP can provide a very site-specific analysis, there are problems with the system, particularity as applied to low volume roads. An alternative warranting process based on RSAP analysis is presented in Appendix A. The application of this process ensures consistent assumptions and does not require any knowledge of the RSAP system. It is designed to eliminate some of the concerns with RSAP.
2.5.3 Subjective Procedure
If either RSAP or the procedure discussed in Appendix A is not used, a subjective evaluation can be made by following these steps:
1. Determine the needed clear zone.
2. From Tables 2.3 through 2.6, identify hazards within the clear zone that may warrant barriers. Hazards that may warrant barriers include those in Group 2 if there is a clear crash history or multiple hazards serve to increase the severity. All hazards in Group 3 may warrant barriers.
3. Evaluate the use of barriers using the considerations listed in Table 2.8. Although this is a subjective analysis, it can lead to a reasonable decision concerning the use of roadside barriers.

Barrier Warrants ________ November 2005
________________________________________________________________________2-18 Analyze the Need for Roadside Barriers
Table 2.8: Barrier Warrant Considerations
Consideration Barrier is more warranted if:
Barrier is less warranted if:
Speed 70 km/h (45 mph) or higher 40 km/h (25 mph) or lower
Hazard on outside of horizontal curve
350 m (1,150 ft) or smaller radius
Radius larger than 400 m (1,430 ft)
Hazard does not fit the descriptions in Tables
2.3 through 2.6
Hazard is more severe Hazard is less severe
Size of hazard Very large Very small Traffic volume Above 1,000 vpd Below 400 vpd
Hazard on inside of horizontal curve
350 m (1,150 ft) or smaller radius
Radius larger than 400 m (1,430 ft)
Hazard on a downgrade
5 percent or greater Less than 3 percent
Crash history Clear crash pattern No crash pattern Anticipated cost of
barriersExpected costs are low Expected costs are high
Roadway cross section
Severe section elements Good section elements
Multiple hazards exist at the site
Many additional hazards
Aesthetic impacts Serious concerns Environmental impacts Serious concerns
Table 2.8 is intended as a guideline for barrier considerations. It is likely that specific sites will have some considerations identified in both columns and some in neither column. The considerations are not necessarily equal in importance.
Appendix A contains a more quantifiable procedure that is based on economic analysis.
2.5.4 Bridge Rail Ends
Bridge rail ends on the right side of approaching traffic (near side) are rigid objects, frequently very near the traveled way. Because of their severity, they should never be considered “not warranted.” Even though the warranting tables in Appendix A might indicate a bridge rail is not warranted, it should be considered “possibly warranted” and at least considered for shielding. The far side bridge rail will usually be outside the clear zone of opposing traffic for most low volume and low speed conditions. When the far side is outside the clear zone it still should be considered for shielding if any of the following conditions exist:
The travel lanes are 3 m (10 ft) or less. Passing is allowed and expected. There is a crash pattern.

Barrier Warrants ________ November 2005
________________________________________________________________________Example Problems 2-19
2.6 EXAMPLE PROBLEMS
The following are example applications of the warranting process described in this chapter. Appendix A includes the same example problems using the warranting procedures described in the appendix.
Problem 1
Roadway data: A two-lane road, with 3.6 m (12 ft) lanes and 1.2 m (4 ft) paved shoulders. There is a tangent section and a 46 m (150 ft)-long horizontal curve on a 240 m (800 ft) radius. The whole section is on a 3 percent downward grade.
Traffic data: 400 present ADT with a 3 percent annual growth factor. Design speed is 50 km/h (30 mph). On the tangent section actual speeds may exceed the design speed.
Hazard data: The hazard is a 1V: 2H foreslope 18 m (60 ft) high, offset 1.8 m (6 ft) from the edge of travel way on the outside of the horizontal curve. The slope is 150 m (500 ft) parallel to the road, including both the horizontal curve and the tangent section. There are some scattered trees and small boulders on the slope.
Other issues: Because of the remote location, barrier construction is expected to be costly. There are no crash data available. There are no aesthetic or environmental issues.
Solution:
1. The hazard is at an offset of 1.2 m (6 ft). From Table 2.1, the clear zone range is 1.0 - 2.0 m (3 - 7 ft). From Table 2.2, the horizontal curve adjustment factor is 1.2. The higher end of the range is selected as the desired clear zone because of the seriousness of the hazard. Therefore, the slope is within the clear zone in both the tangent and curved sections. The slope is outside the clear zone for opposing traffic.
2. From Table 2.5, the slope is a Category 3 hazard so a barrier should be considered.
3. From Table 2.8, the following considerations apply to the possible use of barriers:
Reasons to Use Barriers
a. The hazard is on the outside of a horizontal curve (for some of the section)
b. The hazard is more severe that the description in Table 2.4 c. The hazard is large d. There are multiple hazards at the site
Reasons Not to Use Barriers

Barrier Warrants ________ November 2005
________________________________________________________________________2-20 Example Problems
a. The hazard is on a tangent (on some of the section) b. The traffic volume is low c. The downgrade is not very steep d. Costs of a barrier are expected to be high e. Roadway section elements are good
Because of the hazardousness of the site, it appears that a barrier is warranted at least on the horizontal curve section of this road. Barriers may be appropriate on the tangent, but the warrant is less clear.
Problem 2
Roadway data: A two-lane road, with 3.6 m (11 ft) lanes and 0.6 m (2 ft) paved shoulders. This is a flat and tangent section. The roadway approaches a bridge across a river. On the approach the road leaves a cut section with a 1V; 6H foreslope to a ditch, and then approaches the bridge on a fill with 1V: 3H side slopes. The slope break for the fill is 0.6 m (2 ft) from the edge of the shoulder. The fill is approximately 2.4 m (8 ft) high. On the far side a similar fill extends 60 m (200 ft) where the fill flattens to 1V: 4H. There are no pavement markings on the road or the bridge.
Traffic data: 1,100 present ADT with a 1 percent annual growth factor. Design speed is 70 km/h (45 mph).
Hazard data: An 8.5 m (28 ft) wide bridge crosses a river with water depths of approximately 1.5 m (5 ft). The bridge rail is a vertical concrete wall.
Other issues: This roadway is in a park with serious aesthetic concerns.
Solution:
1. Table 2.1 shows the clear zone range is 4.5 - 5.0 m (14 - 16 ft). Assuming 3.3 M (11 ft) lanes on the bridge, the bridge rail is located 1.0 m (3 ft) from the traveled way and is in the clear zone. The bridge rail on the opposing traffic side is outside the clear zone. The 1V: 3H slope is traversable but not recoverable, so the approach clear zone is (using the mid-point of the range):
CZ = 4.7 + (3 * 2.4) = 11.9 m
Or, CZ = 15 + (3 * 8) = 39 ft
The river is also in the clear zone.
2. Tables 2.3 and 2.6 indicate that both the bridge rail and the river are Category 3 hazards so a barrier should be considered.

Barrier Warrants ________ November 2005
________________________________________________________________________Example Problems 2-21
3. From Table 2.8, the following considerations apply to the possible use of barriers:
Reasons to Use Barriers
a. Speed is high b. The hazards are more severe that the description in Table 2.4 c. Traffic volume is high d. There are multiple hazards at the site
Reasons Not to Use Barriers
a. The hazard is on a tangent b. There is no downgrade c. There are aesthetic concerns
Barriers are recommended for both approach sides to the bridge. Barriers are not needed on the far sides because the bridge rails are outside the opposing traffic clear zones.


Barrier Selection _______ November 2005
_______________________________________________________________________Barrier Types 3-1
CHAPTER 3 BARRIER SELECTION
3.1 BARRIER TYPES
There are a number of barrier types available for use by the Federal Lands Division, each with unique performance, cost, aesthetic and maintenance characteristics. Barriers discussed in this section are listed below. The data tables in Appendix B contain detailed information about each barrier system.
Table 3.1: Roadside Barrier Systems
System Designation Test Level
Three-Strand Cable G1 TL-3 High-Tension Cable HTC TL-3 Weak Post W-Beam G2 TL-2 Box Beam G3 TL-3 Strong Post W-Beam G4 TL-3 Thrie-Beam G9 TL-3 Modified Thrie-Beam G9M TL-4 Concrete Safety Shape CSS TL-4 Steel-Backed Log Rail SBL TL-2 Steel-Backed Timber Rail
SBT TL-3
Precast Concrete Guardwall, Type 1
PCG TL-3
Stone Masonry Guardwall
SMG TL-3
Random Rubble Cavity Wall
RCW TL-1
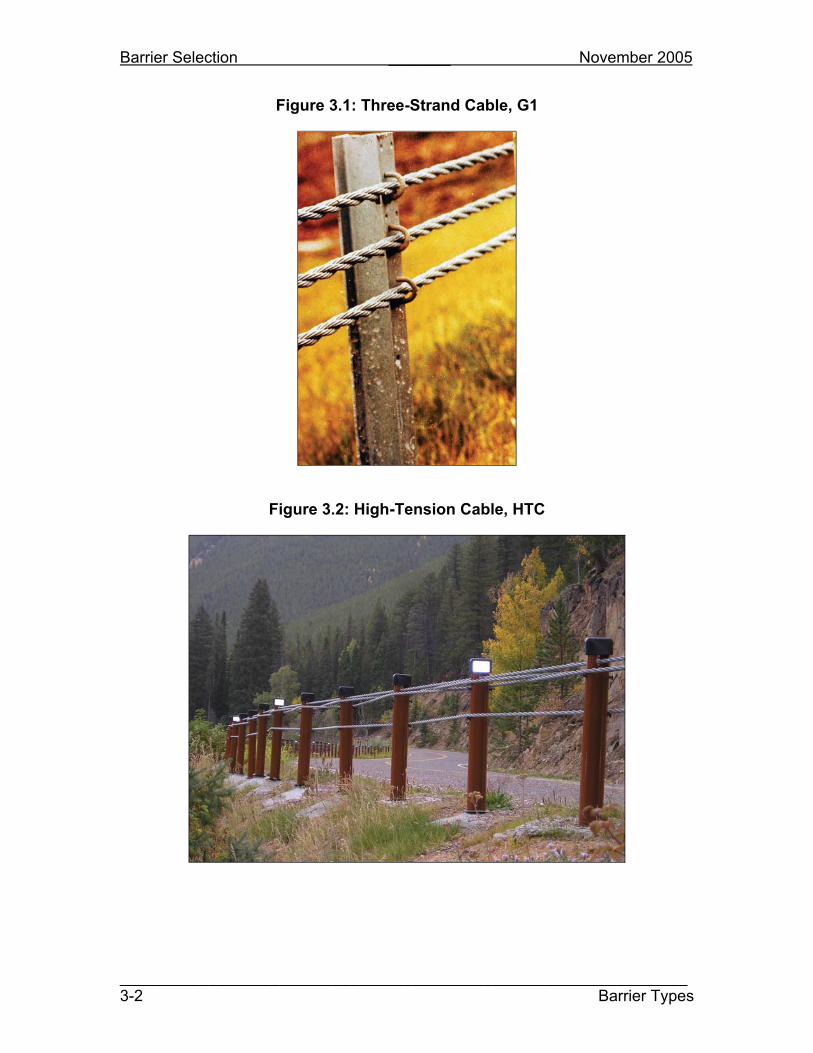
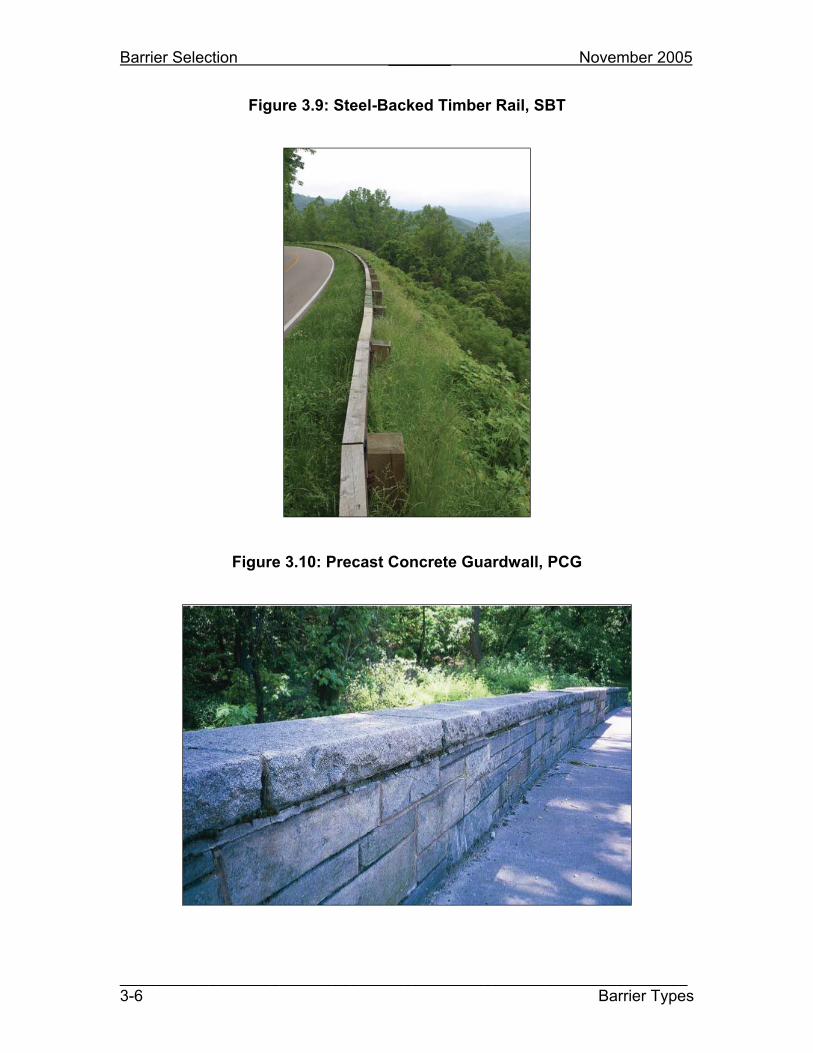
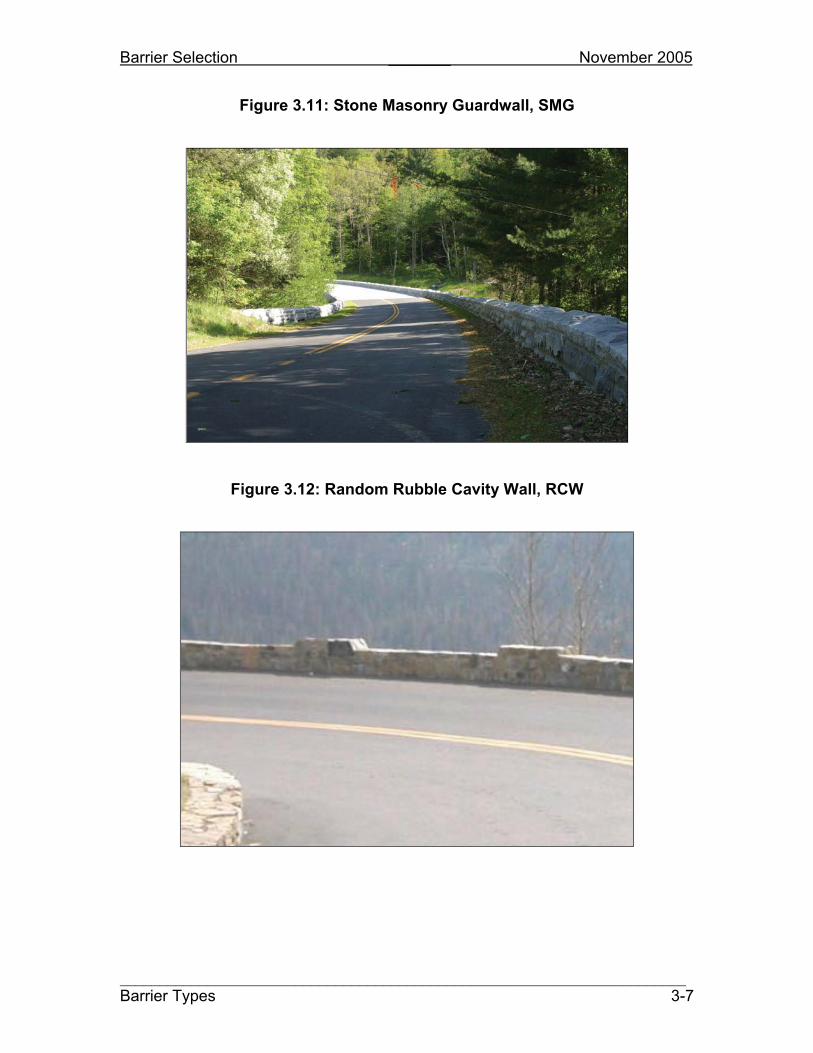
TL-1barriers are tested at 50 km/h (30 mph), TL-2 barriers are tested at 70 km/h (45 mph) and TL-3 barriers are tested at 100 km/h (62 mph). TL-4 barriers meet TL-3 conditions and are also tested with an 8000 kg (17,600 lb) single unit truck at 80 km/h (50 mph). All of the above barriers are crashworthy for the conditions that they were tested under.
Photographs of many of these systems follow.
Barrier Selection _______ November 2005
________________________________________________________________3-2 Barrier Types
Figure 3.1: Three-Strand Cable, G1
Figure 3.2: High-Tension Cable, HTC

Barrier Selection _______ November 2005
_______________________________________________________________________Barrier Types 3-3
Figure 3.3: Weak Post W-Beam, G2
Figure 3.4: Box Beam, G3

Barrier Selection _______ November 2005
________________________________________________________________3-4 Barrier Types
Figure 3.5: Strong Post W-Beam, G4
Figure 3.6: Thrie-Beam, G9

Barrier Selection _______ November 2005
_______________________________________________________________________Barrier Types 3-5
Figure 3.7: Concrete Safety Shape, CSS
Figure 3.8: Steel-Backed Log Rail, SBL
Barrier Selection _______ November 2005
________________________________________________________________3-6 Barrier Types
Figure 3.9: Steel-Backed Timber Rail, SBT
Figure 3.10: Precast Concrete Guardwall, PCG
Barrier Selection _______ November 2005
_______________________________________________________________________Barrier Types 3-7
Figure 3.11: Stone Masonry Guardwall, SMG
Figure 3.12: Random Rubble Cavity Wall, RCW

Barrier Selection _______ November 2005
________________________________________________________________3-8 Barrier Selection
3.2 BARRIER SELECTION
Selection of the most appropriate barrier system for the conditions at a specific site involves the following steps:
1. Identify special selection issues. Normal selection issues include costs, maintainability, repair, barrier size, dynamic deflection and available end treatments. At times, however, one of two other issues may be very important:
a. Aesthetics. Aesthetics of a barrier system may be more important than the cost of the system. There are two aesthetic issues to consider. First is the appearance of the barrier itself. Barriers are available that have a rustic appearance that may be compatible with park and forest settings. Because some of these barriers are considerably more expensive than conventional barriers, their selection may affect the barrier warrant, as discussed in Chapter 2. Second is view obstruction. Some barriers are less obstructive than others.
b. Severe Conditions. A large percentage of heavy trucks, high frequency of severe crashes and other significant safety concerns may be the overriding issue in some situations.
2. Determine the design speed. If the design speed is not known, it is acceptable to use the posted speed. However, it may be appropriate to use the operating speed if the actual speeds exceed the design or posted speeds. Operating speed is usually defined as the 85th percentile speed in free flow conditions. The operating speed can be obtained through a traffic engineering study and can be approximated by driving with free flowing traffic.
3. Determine the hazard offset. The hazard offset is the distance between the hazard closest to the roadway and the edge of the traveled way. The hazard offset must allow adequate room for a barrier to be constructed and the dynamic deflection of the barrier system. This issue is most important for hazards that protrude above the ground such as trees and other fixed objects. Barrier offset is discussed in depth in Chapter 4. One of the most important issues in selecting barrier offset is side slope condition. At speeds of 50 km/h (30 mph) or higher, slopes should be 1V: 6H or flatter in front of cable barriers and 1V: 10H for all other barrier systems. At speeds of 40 km/h (25 mph) or less, 1V: 10H slopes are ideal, but all barriers may perform satisfactorily on slopes as steep as 1V: 6H.
4. Identify technically acceptable barriers. Tables 3.2, 3.3 and 3.4 provide guidance for the identification of technically acceptable roadside barriers, using the primary design issue, design speed and available hazard offset. All barriers found in the selection tables are crashworthy and are technically acceptable alternatives for the selected conditions of speed and hazard offset.
5. Select the most appropriate barrier. The following issues should be considered when selecting the most appropriate barrier from the technically acceptable list:
Barrier Selection _______ November 2005
_______________________________________________________________________Barrier Selection 3-9
a. The maintaining agency may have policies concerning barriers that can be used. It is appropriate to restrict barrier types in order to simplify maintenance and minimize the number of spare parts that must be stocked. Barriers not allowed by the maintaining agency should be eliminated, as long as those allowed are non-proprietary.
b. Cost is normally the overriding issue. c. If aesthetics is a concern but not the overriding issue Table 3.2 can used,
with aesthetics as one of the other selection criteria. However, if aesthetics is more of a concern than cost, Table 3.3 should be used, which will restrict consideration to barriers designed for aesthetics or to minimize view obstruction.
d. Ease of maintenance. e. Safety performance. Generally, barriers with more deflection result in
less vehicle damage upon impact. f. Available end terminals and transitions, if needed.
A barrier must be placed so the hazard is outside the dynamic deflection distance and to allow enough room for the construction of the barrier itself. These factors are included in the minimum barrier – hazard offset, found in the data tables in Appendix B. The larger the minimum barrier – hazard offset, the closer to the traveled way the barrier must be placed.
Barriers placed closer to the roadway must be longer to adequately protect the hazard (see discussion in Chapter 4). Therefore, barriers with larger minimum barrier – hazard offsets will usually have to be longer and thus more costly. As a general rule, the more flexible the barrier system, the lower the cost per foot; but this benefit may be offset by the longer lengths required.
The data tables in Appendix B contain additional information that may be of assistance in barrier selection.

Barrier Selection _______ November 2005
________________________________________________________________3-10 Barrier Selection Tables
3.3 BARRIER SELECTION TABLES
The following tables can be used to identify technically acceptable barriers, based on the primary design issue, speed and available hazard offset.
Table 3.2: Technically Acceptable Barriers, Normal Conditions
Speed Minimum Available Hazard Offset Meters (Feet)
Metric U.S. Customary
0.6(2)
1.0(3)
1.2(4)
1.5 - 2.0 (5 - 6)
2.1(7)
2.4 - 3.5(8 - 11)
3.6+(12+)
30 - 50 km/h
20 - 30 mph G4G9
G4G9
G1HTCG2G3G4G9
G1HTCG2G3G4G9
G1HTCG2G3G4G9
G1HTCG2G3G4G9
G1HTCG2G3G4G9
55 - 70 km/h
35 - 45 mph G41
G9G4G9
G4G9
HTCG2G3G4G9
HTCG2G3G4G9
G1HTCG2G3G4G9
G1HTCG2G3G4G9
80+km/h
50+mph
G41
G9G4G9
G4G9
HTCG3G4G9
HTCG3G4G9
G1HTCG3G4G9
Notes:1. Modifications to the G4 system are available to reduce deflection. 2. General note: steel elements in barriers can be supplied with weathering steel, adding an
aesthetic element to barriers primarily selected for cost. 3. See Table 3.1 for definitions of acronyms.

Barrier Selection _______ November 2005
_______________________________________________________________________Barrier Selection Tables 3-11
Table 3.3: Technically Acceptable Barriers, Primary Design Issue: Aesthetics
Speed Minimum Available Hazard Offset Meters (Feet)
Metric U.S. Customary
0.6(2)
1.0(3)
1.2(4)
1.5 - 2.0 (5 - 6)
2.1(7)
2.4 - 3.5 (8 - 11)
3.6+(12+)
30 – 50 km/h
20 - 30 mph
RCW SBL SBTRCW
G1HTCG3
SBLSBTPCGSMGRCW
G1HTCG3
SBLSBTPCGSMGRCW
G1HTCG3
SBLSBTPCGSMGRCW
G1HTCG3
SBLSBTPCGSMGRCW
G1HTCG3
SBLSBTPCGSMGRCW
55 – 70 km/h
35 - 45 mph
SBL SBT
SBLSBTPCGSMG
HTCG3
SBLSBTPCGSMG
HTCG3
SBLSBTPCGSMG
G1HTCG3
SBLSBTPCGSMG
G1HTCG3
SBLSBTPCGSMG
80+km/h
50+mph
SBT PCGSMG
SBTPCGSMG
HTCG3
SBTPCGSMG
HTCG3
SBTPCGSMG
G1HTCG3
SBTPCGSMG
Notes: 1. G1, HTC and G3 systems are listed because of minimized view obstruction rather than
the aesthetics of the barrier itself. 2. See Table 3.1 for definitions of acronyms.

Barrier Selection _______ November 2005
________________________________________________________________3-12 Barrier Selection Tables
Table 3.4: Technically Acceptable Barriers, Primary Design Issue: Severe Conditions
Speed Minimum Available Hazard Offset Meters (Feet)
Metric U.S. Customary
0.6(2)
1.0(3)
1.2 - 2.1 (4 - 7)
2.4+(8+)
30 - 50 km/h
20 – 30 mph
G9CSS
G4G9
CSS
HTCG4G9
CSS
HTCG4G9
CSS55 - 80 km/h
35 – 50 mph
CSS G9M CSS
G9MCSS
HTCG9MCSS
Notes: 1. General note: steel elements in barriers can be supplied with weathering steel, adding an
aesthetic element to barriers primarily selected for cost. 2. See Table 3.1 for definitions of acronyms.

Barrier Selection _______ November 2005
_______________________________________________________________________End Treatments 3-13
3.4 END TREATMENTS
The end treatment of a roadside barrier is a key element in ensuring that the system is as safe as possible. Selection of a satisfactory end treatment that meets the requirements of the situation must be part of the barrier selection process. End treatments for the various barrier types are discussed below.
Table 3.5: Available End Treatments
Barrier System End Treatment Test Level Reference
Three-Strand Cable (G1)
Three-Strand Cable Terminal
TL-3 RDG
High-Tension Cable (HTC)
Manufacturerspecific
TL-3 See Supplier Data
Turned-down Must be flared
outside CZ
RDGWeak Post W-Beam (G2)
Buried in Backslope TL-2 STD 617-17 Wyoming Box
Beam End TerminalTL-3 RDGBox Beam (G3)
Turned Down End Must be flared
outside CZ
RDG
MELT TL-2 STD 617-12 Low Speed
TerminalTL-2 STD 617-14
Buried in Backslope TL-3 STD 617-17 Flared Terminal TL-3 STD 617-19
Strong Post W-Beam (G4)
Tangent Terminal TL-3 STD 617-20 Thrie-Beam (G9) None available.
Transition to G-4, then use
appropriate end treatment.
Modified Thrie-Beam (G9M)
None available.Transition to G-4,
then use appropriate end
treatment.

Barrier Selection _______ November 2005
________________________________________________________________3-14 End Treatments
Table 3.5: Available End Treatments(Continued)
Barrier System End Treatment Test Level Reference
Buried in Backslope TL-3 RDGCrash Cushion TL-3 RDG
Sloped Terminal Must be flared
outside CZ
Concrete Safety Shape(CSS)
Transition to G-4, then use
appropriate end treatment
Turned-Down Must be flared
outside CZ
STD 617-61 Steel-Backed Log Rail (SBL)
Buried in Backslope TL-3 STD 617-62
Turned-Down TL-2 STD 617-82 Steel-Backed Timber Rail (SBT) Buried in Backslope TL-2
Turned-Down Must be flared
outside CZ
STD 618-3 Precast Concrete Guardwall, Type 1
(PCG)Transition to G-4,
then use appropriate end
treatmentBuried Terminal TL-3 STD 620-3
Stand Alone Terminal
Must be flared
outside CZ
STD 620-3 Stone Masonry
Guardwall(SMG)
Transition to G-4, then use
appropriate end treatment
Buried Terminal TL-1 Random Rubble Cavity Wall (RCW) Stand Alone
TerminalMust be flared
outside CZ
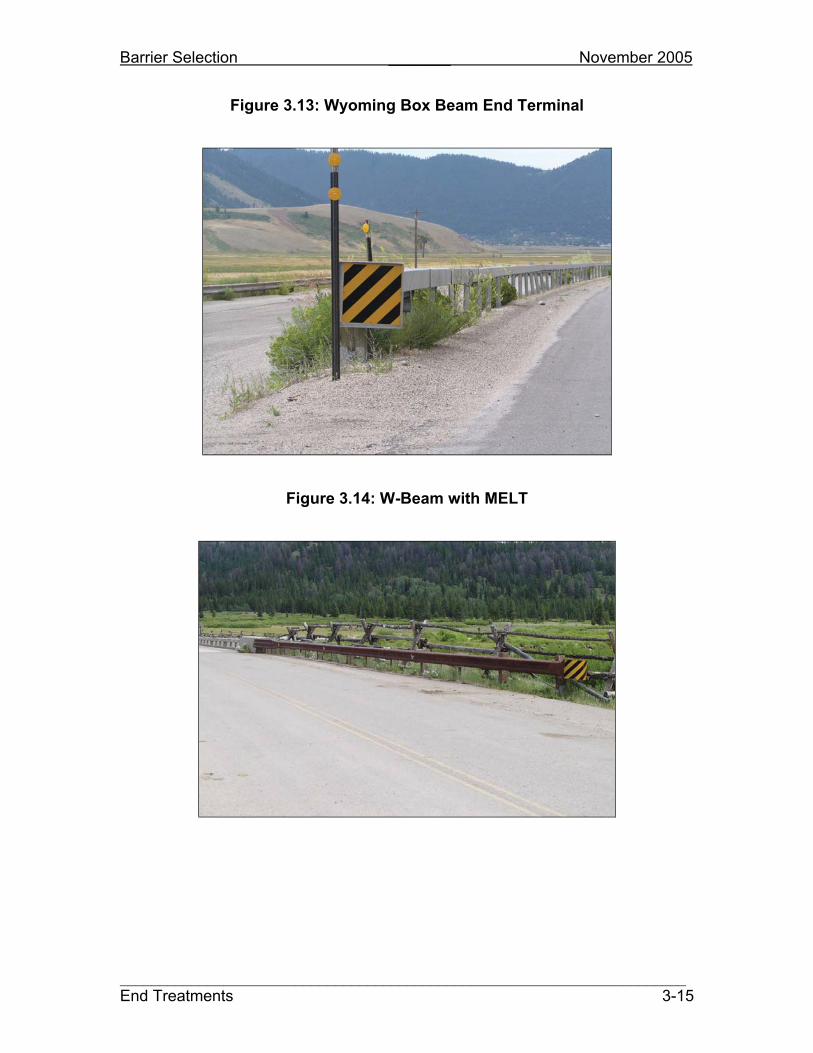
Barrier Selection _______ November 2005
_______________________________________________________________________End Treatments 3-15
Figure 3.13: Wyoming Box Beam End Terminal
Figure 3.14: W-Beam with MELT

Barrier Selection _______ November 2005
________________________________________________________________3-16 End Treatments
Figure 3.15: W-Beam Buried in Backslope
Figure 3.16: W-Beam Flared End

Barrier Selection _______ November 2005
_______________________________________________________________________End Treatments 3-17
Figure 3.17: W-Beam Tangent End
Figure 3.18: Concrete Safety Shape Buried in Backslope

Barrier Selection _______ November 2005
________________________________________________________________3-18 End Treatments
Figure 3.19: Steel-Backed Timber Turned Down
Figure 3.20: Steel-Backed Timber Buried in Backslope

Barrier Selection _______ November 2005
_______________________________________________________________________End Treatments 3-19
Whenever a backslope is available a buried in backslope end treatment should be considered. A buried in backslope end is usually preferable because the end is not exposed, the length of need described in Chapter 4 is not an issue because the hazard is completely cut off, it is not as sensitive to side slope conditions and it is less expensive than most other end treatments. It may be appropriate to extend a barrier for a short distance in order to reach a backslope in order to take advantage of these benefits.
When selecting an end treatment the terrain surrounding the end and possible grading requirements should be considered. The following are issues that should be considered:
Advance Terrain. The terrain in advance of the end should be flat (1V: 10H) and unobstructed. End treatments that require more flare will also require larger platforms of flat area around the end. Grading platforms built to accommodate the end treatment must be smoothly transitioned to the existing side slope so that the entire approach to the end remains traversable (1V: 3H or flatter).
Adjacent Terrain. The area immediately around the end should be essentially flat and free of obstructions so that a vehicle striking the end will not be in a roll, pitch or yaw. Other devices, including those that are breakaway, should not be placed in this region. The recommended dimensions are shown in figures 8.1 and 8.2 of the RDG.Care must be taken to avoid building a slope steeper than 1V: 3H immediately upstream and behind the terminal in order to accommodate these dimensions. Extending the barrier to a flatter area may be the only solution in this case. This issue is not as important for ends that are buried in backslopes.
Immediate Downstream Terrain. All of the end treatments, with the exception of those buried in a backslope, are gating terminals, meaning that an angular hit by a vehicle right at the end will result in the vehicle passing through the system. Generally the end will swing, or gate, around the third post. Therefore, a clear zone, traversable and unobstructed, should be available behind the end treatment. For high speed conditions this should be an area 20 meters (75 feet) long and 6 meters (20 feet) wide. At lower speeds, as much clear zone behind the end treatment should be provided as possible. The width should be at least consistent with that available on the approach to the end treatment. This issue is not important for ends buried in backslopes and may not be as important for the W-beam tangent end treatment.

Barrier Selection _______ November 2005
________________________________________________________________3-20 Transition Sections
3.5 TRANSITION SECTIONS
Another important component of a roadside barrier is the transition section. Transitions are necessary when a barrier is connected to another type of barrier system with a different dynamic deflection. A very common transition situation is a bridge approach barrier. When a barrier system transitions to another system with less deflection, as in the case of a strong post w-beam to a concrete bridge rail, the corner of the more rigid barrier must be shielded. This is accomplished by increasing the stiffness of the approaching system, generally through reduced post spacing and increased beam strength. Rubrail, extra beam depth from a thrie-beam or curb, is also needed in order to avoid the potential for a wheel snagging at the corner of the rigid rail.
When the more rigid system transitions to a less rigid system, as in the case of a downstream rail at the end of a bridge rail, the need is to ensure that the downstream system has adequate tensile strength at the connection.
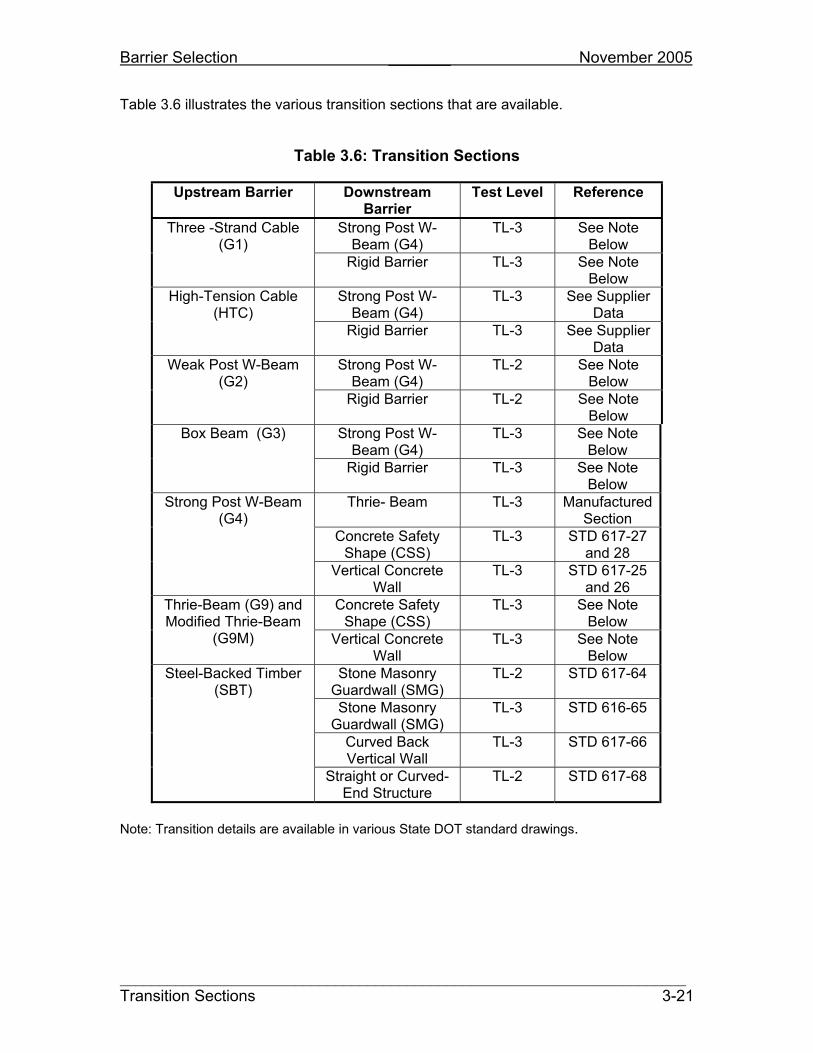
Barrier Selection _______ November 2005
_______________________________________________________________________Transition Sections 3-21
Table 3.6 illustrates the various transition sections that are available.
Table 3.6: Transition Sections
Upstream Barrier Downstream Barrier
Test Level Reference
Strong Post W-Beam (G4)
TL-3 See Note Below
Three -Strand Cable (G1)
Rigid Barrier TL-3 See Note Below
Strong Post W-Beam (G4)
TL-3 See Supplier Data
High-Tension Cable (HTC)
Rigid Barrier TL-3 See Supplier Data
Strong Post W-Beam (G4)
TL-2 See Note Below
Weak Post W-Beam (G2)
Rigid Barrier TL-2 See Note Below
Strong Post W-Beam (G4)
TL-3 See Note Below
Box Beam (G3)
Rigid Barrier TL-3 See Note Below
Thrie- Beam TL-3 Manufactured Section
Concrete Safety Shape (CSS)
TL-3 STD 617-27 and 28
Strong Post W-Beam (G4)
Vertical Concrete Wall
TL-3 STD 617-25 and 26
Concrete Safety Shape (CSS)
TL-3 See Note Below
Thrie-Beam (G9) and Modified Thrie-Beam
(G9M) Vertical Concrete Wall
TL-3 See Note Below
Stone Masonry Guardwall (SMG)
TL-2 STD 617-64
Stone Masonry Guardwall (SMG)
TL-3 STD 616-65
Curved Back Vertical Wall
TL-3 STD 617-66
Steel-Backed Timber (SBT)
Straight or Curved-End Structure
TL-2 STD 617-68
Note: Transition details are available in various State DOT standard drawings.
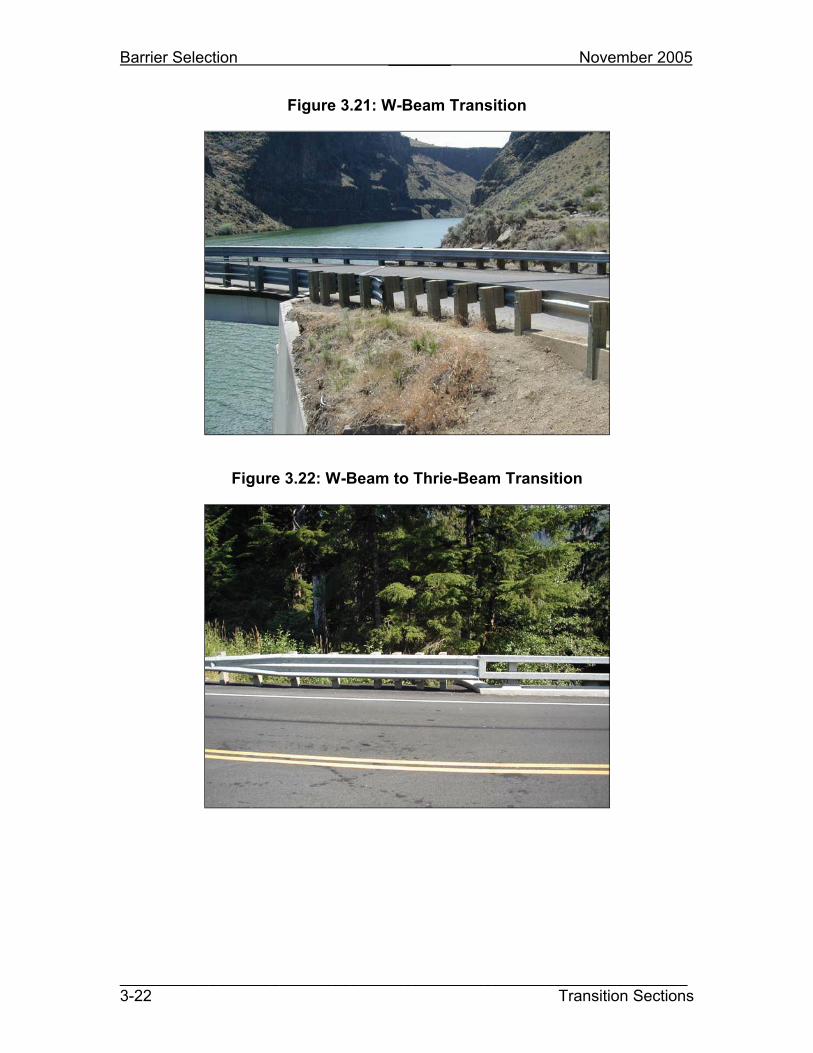
Barrier Selection _______ November 2005
________________________________________________________________3-22 Transition Sections
Figure 3.21: W-Beam Transition
Figure 3.22: W-Beam to Thrie-Beam Transition

Barrier Selection _______ November 2005
_______________________________________________________________________Example Problems 3-23
3.6 EXAMPLE PROBLEMS
The following are example applications of the barrier selection process described in this chapter.
Problem 1. This problem is the same as Problem 1 of Chapter 2.
Roadway data: A two-lane road, with 3.6 m (12 ft) lanes and 1.2 m (4 ft) paved shoulders. There is a tangent section and a 46 m (150 ft)-long horizontal curve on a 240 m (800 ft) radius. The whole section is on a 3 percent downward grade.
Traffic data: Present ADT is 400 with a 3 percent annual growth factor. Design speed is 50 km/h (30 mph). On the tangent section actual speeds may exceed the design speed.
Hazard data: The hazard is a 1V: 2H foreslope 18 m (60 ft) high; offset is 1.8 m (6 ft) from the edge of traveled way on the outside of the horizontal curve. The slope is 150 m (500 ft) parallel to the road, including both the horizontal curve and the tangent section. There are some scattered trees and small boulders on the slope.
Other issues: Because of the remote location, barrier construction is expected to be costly. There is no crash data available. There are no aesthetic or environmental issues.
PreviousRecommendations: A barrier is warranted on both the tangent and horizontal curve
sections.
Solution: Neither aesthetics nor severe conditions are the overriding concerns in this situation, so Table 3.2 applies. The available hazard offset is 1.8 m (6 ft) from the edge of traveled way. For 50 km/h (30 mph), the following barriers are technically acceptable: HTC, G2, G3, G4 and G9. Of these systems, the client agency only uses the G4 and G9. The G4 is the least expensive and is therefore the selected barrier.

Barrier Selection _______ November 2005
________________________________________________________________3-24 Example Problems
Problem 2. This problem is the same as Problem 2 of Chapter 2.
Roadway data: A two-lane road, with 3.6 m (11 ft) lanes and .4 m (2 ft) paved shoulders. This is a flat and tangent section. The roadway approaches a bridge across a river. On the approach the road leaves a cut section and approaches the bridge on a fill with 1V: 3H side slopes. The slope break for the fill is 0.6 m (2 ft) from the edge of the shoulder. The fill is approximately 2.4 m (8 ft) high. On the far side a similar fill extends 60 (200 ft) where the fill flattens to 1V: 4H. There are no pavement markings on the road or the bridge.
Traffic data: Present ADT is 1,100 with a one percent annual growth factor. Design speed is 70 km/h (45 mph).
Hazard data: An 8.5 m (28 ft)-wide bridge crosses a river with water depths of approximately 1.5 m (5 ft). The bridge rail is a vertical concrete wall.
Other issues: This roadway is in a park with serious aesthetic concerns.
PreviousRecommendations: The clear zone is 11.9 m (39 ft). A barrier is warranted on the
near sides of both approached to the bridge.
Solution: Aesthetics is an important issue in this case, so Table 3.3 applies. The available hazard offset is 1.0 m (3 ft) from the edge of traveled way. For 70 km/h (45 mph), SBL and SBT barriers are technically acceptable. The SBL system, a TL-2 system, does not have a transition design available so the SBT system is recommended.

Barrier Design and Placement November 2005
________________________________________________________________________Overview of AASHTO Roadside Design Guide Design Process 4-1
CHAPTER 4 BARRIER DESIGN AND PLACEMENT
4.1 OVERVIEW OF THE AASHTO ROADSIDE DESIGN GUIDE DESIGN PROCESS
Chapter 5 of the AASHTO Roadside Design Guide (RDG) contains roadside barrier layout and design guidance. It is important to understand the philosophy behind the design process presented in the RDG. If a vehicle leaves the roadway at approximately 10 degrees in the vicinity of the upstream end of a roadside barrier and the driver then attempts to correct and return to the pavement, the vehicle could be traveling parallel and behind the barrier. This design process is intended to allow sufficient room for a vehicle to come to a stop before striking the hazard if it should get into this situation. An important part of the layout process is to allow a clear zone behind the barrier upstream of the hazard. This is also an important concept to remember in the construction and maintenance of the roadway.
4.1.1 Design Variables
Figure 4.1 shows the variables that are considered in the RDG design process.
Figure 4.1: Barrier Design Variables
The variables used in the design process are defined below:
HAZARD
Edge of Traveled Way
LC
Clear Zone
LA
L3
L2 LS
LR
Y
L1
X
ba
Length of Need when Flared
Length of Need when Straight

Barrier Design and Placement November 2005
________________________________________________________________________4-2 Overview of the AASHTO Roadside Design Guide Design Process
LA is the lateral distance from the edge of the traveled way to the back of the hazard.
LC is the clear zone width, measured from the edge of the traveled way. LC serves as a check on LA. It is not necessary to shield a hazard beyond the clear zone, so LA
does not have to be greater than LC.
L3 is the lateral distance from the edge of the traveled way to the front edge of the hazard.
L2 is the offset of the roadside barrier, measured from the edge of the traveled way to the front face of the barrier. The designer must select the barrier offset. Factors to consider in selecting L2 are listed in Section 4.1.2.
LR is the runout length, measured longitudinally from the upstream extent of the hazard along the edge of pavement. LR is the stopping distance off the pavement. LR values are found in Table 4.1.
LS is the shy line offset. Rigid objects such as roadside barriers close to the pavement tend to intimidate drivers, causing them to slow down or shift positions. This may result in a loss in capacity that can be a concern for high volume roads. Although it is preferable to locate barriers at or beyond the shy line offset, it is seldom an important factor for low volume conditions. Shy line values are found in Table 4.2.
If the barrier is placed on a flare, the flare is described as a: b in the RDG. Placing a barrier on a flare is a design decision. Benefits are that less barrier is needed (improving both safety and costing less) and the end treatment is moved further away from traffic. The ability to include a flare is usually limited by the site terrain. Slopes in front of a barrier should be 1V: 10H or flatter, which is often difficult to achieve. The flare a: b is in the standard section of the barrier and is not related to any flare that may be required for an end treatment. End treatments must be laid out from the projection of the barrier at the point of beginning of the end treatment. If a barrier is laid out on the maximum flare, it may be necessary to exceed the maximum flare because an additional flare for the end treatment is introduced. It is acceptable to exceed the maximum flare rate for this purpose. When possible, very flat flare rates should be used when the barrier is located within the shy line offset. Chapter 5 of the RDG has more detail on suggested flare rates in this case.
If a flare in the standard section is used, L1 is the tangent length of the barrier and defines the beginning point of the flare, measured from the upstream limit of the hazard. L1 is a design tool that allows the flare point to be reactive to specific site requirements. The only requirement for L1 is that a flare should not begin within a transition section.

Barrier Design and Placement November 2005
________________________________________________________________________Overview of the AASHTO Roadside Design Guide Design Process 4-3
4.1.2 Considerations for Selecting L2
The designer determines the barrier offset, L2, taking into consideration a number of issues. Table 4.1 lists these considerations, in order of importance.
Figure 4.2: Considerations for Selecting L2 In Order of Importance
a. Available hazard offset
b. Slopes in front of the barrier
c. Presence of curbs
d. Soil Support Behind the Barrier
e. Available Shoulder
f. Shy Line Offset
g. Location
Each of these considerations is discussed below:
Available Hazard Offset. Tables 3.2, 3.3 and 3.4 match appropriate barrier types with the available hazard offset. The hazard offset includes both the deflection distance and the depth of the barrier system. This criterion is not as important for hazards that go down, such as steep downward slopes, as for hazards that protrude upwards.
Slopes in Front of the Barrier. Maintain a slope of 1V: 10H or flatter in front of the barrier. This should include any flare in the barrier and the approach to the end treatment. Conventional cable and some of the high-tension cable systems have been successfully tested on 1V: 6H slopes. Although the flatter slopes are preferable, it may be a reasonable trade-off to accept slopes as steep as 1V: 6H in front of barriers if the speeds are 40 km/h (25 mph) or lower.
Presence of Curbs. Avoid placing barriers if curbs are present. Specific criteria include:
1. It is preferable to not use barriers with curbs at speeds 80 km/h (50 mph) and higher. If necessary, the best location for the barrier is in front of the curb. If the curb is sloped and no higher than 100 mm (4 in) the barrier may be placed flush with the face of the curb. Do not place a wall-type

Barrier Design and Placement November 2005
________________________________________________________________________4-4 Overview of the AASHTO Roadside Design Guide Design Process
(CSS, PCG, or SMG) barrier on top of a curb. Remove the curb if necessary. A shoulder gutter design may be good option to a curb.
2. Avoid placing barriers with curb present at speeds 50 km/h (30 mph) to 70 km/h (45 mph). If necessary, the best location for the barrier is in front of the curb. If the curb is sloped and no higher than 150 mm (6 in) the barrier may be placed flush with the face of the curb. Do not place a wall-type (CSS, PCG, or SMG) barrier on top of a curb. Remove the curb if possible. A shoulder gutter design may be good option to a curb.
3. It is acceptable to place curbs in line with the face of a barrier at speeds 40 km/h (25 mph) and lower.
Soil Support Behind the Barrier Post. For strong post systems, ensure that at least 0.6 m (2 ft) are present from behind the posts to a slope hinge. At speeds 50 km/h (30 mph) and lower this criterion can be reduced to 0.3 m (1 ft). This criterion ensures the soil support necessary for the posts to resist deflection. This is not an important issue for either rigid or flexible systems. If this criterion cannot be achieved, 2.1 m (7 ft)-long posts or halved post spacing can be used to mitigate the loss of soil support. If this criterion cannot be achieved, then the strong post system will deflect more than indicated in Chapter 3 and Appendix B.
Available Shoulder. If possible, the full shoulder should be provided plus at least 0.6 m (2 ft). This allows the shoulder to function as designed and allows a vehicle to park on the shoulder and occupants to exit out the passenger door.
Shy Line Offset. The shy line offset, as discussed earlier, should be provided if possible. This is not usually an important issue on low volume roads.
Location. Locate the barrier as far from the road as possible, taking into consideration all the above criteria. The further away from the edge of the traveled way, the more recovery area is available for errant vehicles and there is less barrier to build and maintain.

Barrier Design and Placement November 2005
________________________________________________________________________Overview of the AASHTO Roadside Design Guide Design Process 4-5
4.1.3 Design Criteria Tables
Tables 4.1, 4.2 and 4.3 list criteria that are used in the AASHTO RDG design method.
Table 4.1: Suggested Runout Lengths, LR
Traffic Volume (ADT) Over 6000 vpd 2000 – 6000
vpd800 – 2000 vpd Under 800 vpd
Design Speed
Km/h mph Runout Length
LR
m ft
Runout Length LR
m ft
Runout Length LR
m ft
Runout Length LR
m ft
40 25 40 125 35 115 30 100 27 90 30 20 30 100 27 90 24 80 20 70
* See the AASHTO Roadside Design Guide for design speeds 50 km/h (30 mph) and higher.
Table 4.2: Suggested Shy Line Offset Values
Design Speed km/h mph
Shy Line Offset, LS
m ft
40 25 0.8 2.5 30 20 0.6 2.0
* See the AASHTO Roadside Design Guide for design speeds 50 km/h (30 mph) and higher.
Table 4.3: Suggested Maximum Flare Rates
Design Speed km/h mph
Rigid Barriers Semi-Rigid Barriers
40 25 7:1 6:1 30 20 7:1 6:1
* See the AASHTO Roadside Design Guide for design speeds 50 km/h (30 mph) and higher.

Barrier Design and Placement November 2005
________________________________________________________________________4-6 Overview of the AASHTO Roadside Design Guide Design Process
4.1.4 Length of Need Determination
The length of need, or distance upstream from the hazard necessary to adequately shield the hazard, is determined by the following formula:
X = LA + (b/a)(L1) – L2 ___________________
(b/a) + (LA/LR)
If there is no flare, the formula simplifies to:
X = (LR)(LA – L2) _____________
LA
The lateral offset of the end of the length of need is determined by the following formula:
Y = LA – (LA)(X) ______
LR
If there is no flare in the barrier, then Y is equal to L2.

Barrier Design and Placement November 2005
________________________________________________________________________Overview of the AASHTO Roadside Design Guide Design Process 4-7
4.1.5 Opposing Traffic Length of Need
If the hazard is within the opposing traffic clear zone on a two-lane/ two-way road, a downstream length of need should be provided. The edge of pavement in this case is the centerline, as shown in Figure 4.3 (Figure 5.27 of the RDG). Usually, however, the hazard is outside the opposing traffic clear zone on low volume and low speed roads.
If the hazard is outside the opposing traffic clear zone but the barrier is within the clear zone, then a crashworthy end treatment should be used on the downstream end. If the barrier is also outside the opposing traffic clear zone, an end treatment is not required but should be considered. In general, features installed on the roadside for safety purposes should be safe for all foreseeable conditions. The relatively small investment for a crashworthy end could prove to be very worthwhile.
Figure 4.3: Opposing Traffic Length of Need
HAZARD
Edge of Traveled Way
LC
Clear Zone
LA
L3
L2
LR
Y
L1
X
ba
Length of Needwhen Flared

Barrier Design and Placement November 2005
________________________________________________________________________4-8 Overview of the AASHTO Roadside Design Guide Design Process
4.1.6 Length of Need on Horizontal Curves
Figure 5.32 of the RDG, shown below as Figure 4.4, illustrates a graphic solution for a barrier length of need on the outside of a horizontal curve. The barrier length is a function of the distance it is located from the edge of the traveled way and can most readily be obtained graphically by scaling. Additional information concerning this procedure can be found in the RDG discussion accompanying Figure 5.32. Section 4.1.7 of this Guide discusses a graphic solution for length of need of a barrier on a tangent section of road.
Figure 4.4: Length of Need on the Outside of A Horizontal Curve
HAZARD

Barrier Design and Placement November 2005
________________________________________________________________________Overview of the AASHTO Roadside Design Guide Design Process 4-9
To determine the length of need on the inside of a horizontal curve, locate the point on the hazard closest to the roadway and draw an arc with a radius of LR. Then draw a line from the center of the arc (the closest point to the roadway) to where the arc intersects the edge of traveled way. Barrier is then laid out to intersect this line. This process ensures that there will be at least LR, or stopping distance, to the hazard if a vehicle should leave the roadway and get behind the barrier. This is illustrated in Figure 4.5.
Figure 4.5: Length of Need on the Inside of a Horizontal Curve

Barrier Design and Placement November 2005
________________________________________________________________________4-10 Overview of the AASHTO Roadside Design Guide Design Process
4.1.7 Graphic Solution
The length of need on tangent sections can be determined graphically, as with horizontal curves. This involves laying out a sketch to scale of the roadway and hazard, then identifying a point of departure on the edge of the traveled way by measuring a distance LR upstream of the hazard. A line is then drawn from that point to the back of the hazard or the clear zone, whichever is less distance from the edge of traveled way. Alternative barrier designs can now be laid out using different values for L1, L2 and with or without flares. This graphic process, shown in Figure 4.6, yields the same length of need as the formulae.
Figure 4.6: Graphic Solution for LON of a Tangent Section

Barrier Design and Placement November 2005
________________________________________________________________________Overview of the AASHTO Roadside Design Guide Design Process 4-11
4.1.8 Layout Requirements
The length of need, either by formula or graphical design, determines the approximate point at which the barrier must be able to resist penetration by a vehicle. Therefore, the gating portion of an end treatment must be outside this point. The length of need is normally measured to the third post of the end treatment. Standard sections of barrier should not be cut to meet this exact point. Designers should round up to the closest full length of barrier. For W-Beam guardrail, this would be 3.8 m (12 ft-6 in) and for SBT and SBL barriers, this is 3.0 m (10 ft).
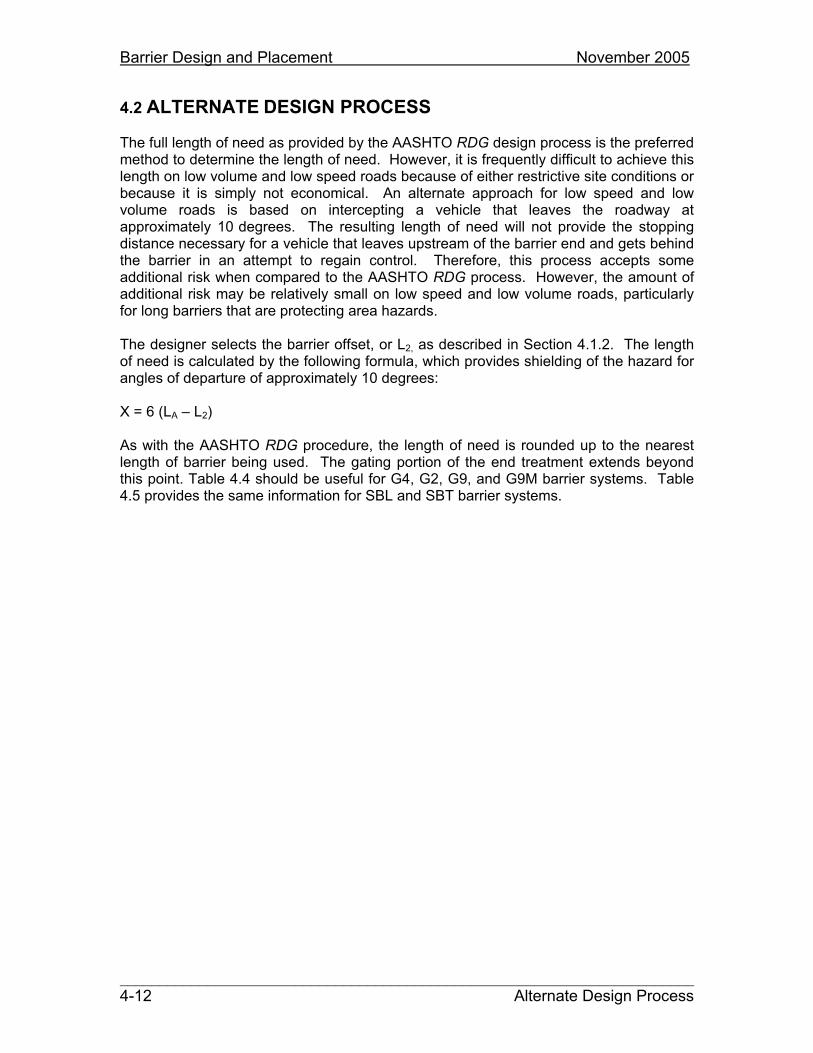
Barrier Design and Placement November 2005
________________________________________________________________________4-12 Alternate Design Process
4.2 ALTERNATE DESIGN PROCESS
The full length of need as provided by the AASHTO RDG design process is the preferred method to determine the length of need. However, it is frequently difficult to achieve this length on low volume and low speed roads because of either restrictive site conditions or because it is simply not economical. An alternate approach for low speed and low volume roads is based on intercepting a vehicle that leaves the roadway at approximately 10 degrees. The resulting length of need will not provide the stopping distance necessary for a vehicle that leaves upstream of the barrier end and gets behind the barrier in an attempt to regain control. Therefore, this process accepts some additional risk when compared to the AASHTO RDG process. However, the amount of additional risk may be relatively small on low speed and low volume roads, particularly for long barriers that are protecting area hazards.
The designer selects the barrier offset, or L2, as described in Section 4.1.2. The length of need is calculated by the following formula, which provides shielding of the hazard for angles of departure of approximately 10 degrees:
X = 6 (LA – L2)
As with the AASHTO RDG procedure, the length of need is rounded up to the nearest length of barrier being used. The gating portion of the end treatment extends beyond this point. Table 4.4 should be useful for G4, G2, G9, and G9M barrier systems. Table 4.5 provides the same information for SBL and SBT barrier systems.
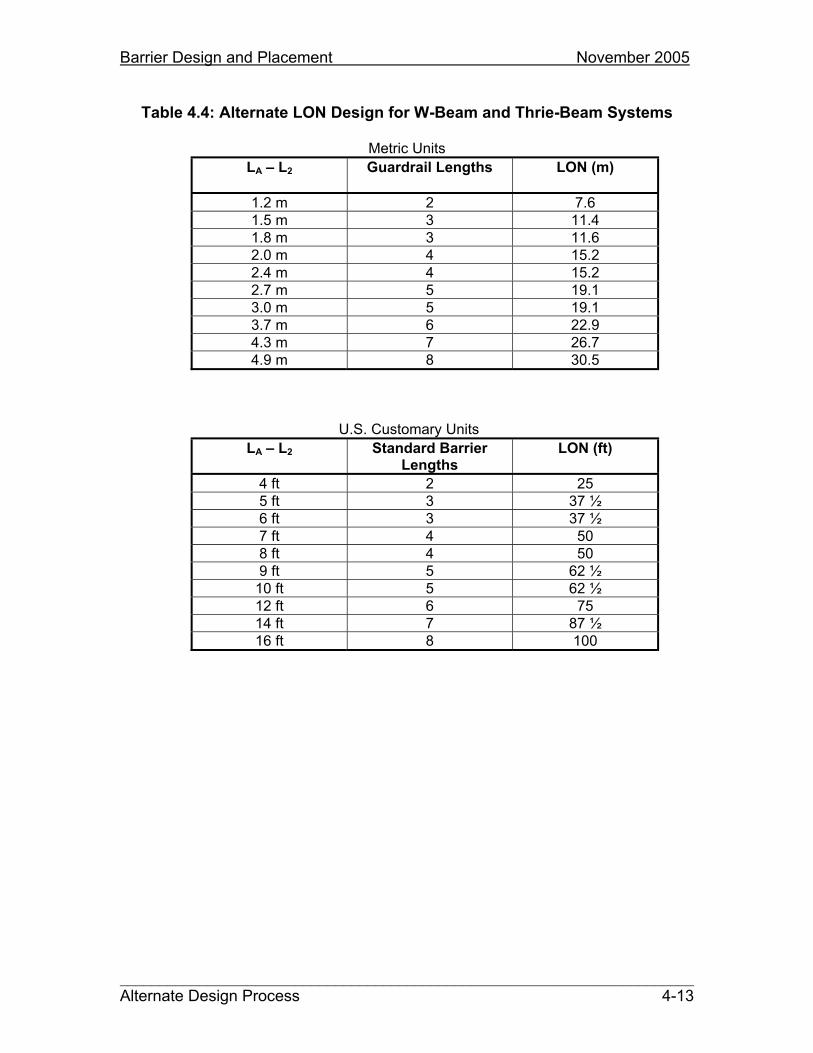
Barrier Design and Placement November 2005
________________________________________________________________________Alternate Design Process 4-13
Table 4.4: Alternate LON Design for W-Beam and Thrie-Beam Systems
Metric Units
LA – L2 Guardrail Lengths LON (m)
1.2 m 2 7.6 1.5 m 3 11.4 1.8 m 3 11.6 2.0 m 4 15.2 2.4 m 4 15.2 2.7 m 5 19.1 3.0 m 5 19.1 3.7 m 6 22.9 4.3 m 7 26.7 4.9 m 8 30.5
U.S. Customary Units
LA – L2 Standard Barrier Lengths
LON (ft)
4 ft 2 25 5 ft 3 37 ½ 6 ft 3 37 ½ 7 ft 4 50 8 ft 4 50 9 ft 5 62 ½
10 ft 5 62 ½ 12 ft 6 75 14 ft 7 87 ½ 16 ft 8 100

Barrier Design and Placement November 2005
________________________________________________________________________4-14 Alternate Design Process
Table 4.5: Alternate LON Design of Log and Timber Rail Systems
Metric Units
LA – L2 Standard Barrier Lengths
LON (m)
1.2 m 3 9.1 1.5 m 3 9.1 1.8 m 4 12.2 2.0 m 5 15.2 2.4 m 5 15.2 2.7 m 6 18.3 3.0 m 6 18.3 3.7 m 8 24.6 4.3 m 9 27.4 4.9 m 10 30.5
U.S. Customary Units
LA – L2 Standard Barrier Lengths
LON (ft)
4 ft 3 30 5 ft 3 30 6 ft 4 40 7 ft 5 50 8 ft 5 50 9 ft 6 60
10 ft 6 60 12 ft 8 80 14 ft 9 90 16 ft 10 100

Barrier Design and Placement November 2005
________________________________________________________________________Common Design and Layout Challenges 4-15
4.3 COMMON DESIGN AND LAYOUT CHALLENGES
Site conditions commonly create problems in the design and layout of roadside barriers. Some common situations include the following:
Multiple Hazards. Although a barrier may be placed to shield a specific hazard, the designer should be aware of other serious hazards present and provide adequate shielding for all. An example may be an approach to a bridge passing over a river. As the bridge approach increases in height, the side slopes become steeper than 3: 1. In this case there are three hazards: the bridge rail end, the river and the steep foreslope. The barrier layout should provide appropriate shielding for all three.
Intersecting Roads. Frequently intersecting roads interrupt a barrier. The Curved Rail Guardrail (CRG) was developed for this application. The CRG connects G4 barrier on the mainline to a barrier or appropriate end treatment on a side road or driveway. Details of the CRG are shown in Standard Drawings 617-21 and 627-22. An important feature of the CRG is the provision of the indicated clear zone behind the barrier. If the G4 barrier transitions to a bridge end on the mainline, the full transition section must be provided. If there is not room for a completed transition and the CRG as shown in the Standard Drawing, then the CRG is not an appropriate design to use and a crashworthy end or crash cushion must be used.
Figure 4.7: Curved Rail Guardrail
Barrier Design and Placement November 2005
________________________________________________________________________4-16 Common Design and Layout Challenges
End Treatment. The layout of a barrier must take into account the operating characteristics of the selected end treatment. The slopes in front of, immediately behind and approaching the end treatment must be relatively flat and unobstructed. Care must be taken not to create a hazardous slope in the construction of the platform necessary to provide these flat slopes. Frequently the only solution to this problem is to extend the barrier upstream to a point where the existing foreslopes are flat enough to install the end treatment properly. Because of the cost, long extensions may affect the barrier warrant. See Section 3.4 for a discussion on the grading requirements associated with end treatments.
Buried in Backslope Terminal. If a buried in backslope terminal is used, a length of need determination is not necessary because the end treatment prevents a vehicle from proceeding beyond the terminal. Therefore, the only design and layout issue with a barrier using this terminal is to extend the barrier to an appropriate burial point.
Breaks in a Barrier. If a break in a barrier is needed for pedestrian or wildlife access, the exposed end of the barrier must have either an appropriate end treatment or must be shielded by the downstream end. A 30-degree angle is adequate to provide this shielding, as illustrated in Figure 4.8. This layout is only appropriate when the barrier is outside the opposing traffic clear zone. If the barrier is in the opposing traffic clear zone then crashworthy end treatments on both terminals is needed.
Figure 4.8: Break in Barrier

Barrier Design and Placement November 2005
________________________________________________________________________Example Problems 4-17
4.4 EXAMPLE PROBLEMS
The following are example applications of the barrier design process described in this chapter.
Problem 1. This problem is the same as Problem 1 discussed in Chapters 2 and 3.
Roadway data: A two-lane road, with 3.6 m (12 ft) lanes and 1.2 m (4 ft) paved shoulders. There is a tangent section and a 46 m (150 ft) long horizontal curve on a 240 m (800 ft) radius. The whole section is on a 3 percent downward grade.
Traffic data: 400 present ADT with a 3 percent annual growth factor. Design speed is 50 km/h (30 mph). On the tangent section actual speeds may exceed the design speed.
Hazard data: The hazard is a 1V: 2H foreslope 18 m (60 ft) high, offset 1.8 m (6 ft) from the edge of travel way on the outside of the horizontal curve. The slope is 150 m (500 ft) parallel to the road, including both the horizontal curve and the tangent section. There are some scattered trees and small boulders on the slope.
Other issues: Because of the remote location, barrier construction is expected to be costly. There are no crash data available. There are no aesthetic or environmental issues.
PreviousRecommendations: A barrier is warranted on both the tangent and horizontal curve
sections. The selected barrier system is G4.
Solution:
1. Select the barrier offset, L2. Using the criteria listed in Section 4.1.2, the following considerations apply:
a. Available hazard offset. The available hazard offset is 1.8 m (6 ft). b. Slopes in front of the barrier. The slope in front of the hazard is 1V: 10H
or flatter, so this is not an issue. c. Curbs. No curbs are present. d. Soil Support Behind the Barrier. Because of the low speed, the barrier
could be located so that the back of the barrier is 0.3 m (1 ft) from the slope break.
e. Available Shoulder. The only way to achieve the criterion of the shoulder plus 0.6 m (2 ft) is to add additional fill to flatten the slope by approximately 0.6 m (2 ft), allowing the shoulder plus 0.6 m (2 ft), 0.3 m (1 ft) for the barrier depth and 0.6 m (1 ft) for soil support. Such widening is impractical in this case, so this criterion must be violated.
f. Shy Line Offset. From Table 4.2 the desired shy line offset is 1.1 m (3.6 ft).

Barrier Design and Placement November 2005
________________________________________________________________________4-18 Example Problems
g. Locate as Far as Possible. In this case there is no flexibility to locate the barrier any further than the slope break.
Locating the barrier face 1.2 m (4 ft) from the edge of the traveled way will meet all the above criteria except the shoulder plus 0.6 m (2 ft). Violation of this criterion will have some negative impact on the usability of the shoulder but will not affect barrier performance.
2. A flare is not practical at this location because of the existing slopes.
3. Using the AASHTO RDG design method, the design variables are as follows:
LA is 38 m (126 ft). From Table 2.1, LC is 2.0 m (7 ft). This is using the 1V: 4H slope upstream of
the hazard. LC will be used in the calculations. L3 is 1.8 m (6 ft). The selected L2 is 1.2 m (4 ft). From Table 4.1, LR is 40 m (130 ft).
4. The length of need is (in metric units):
X = LA + (b/a)(L1) – L2 ___________________
(b/a) + (LA/LR)
X = (LR)(LA – L2) _____________
LA
X = (40)(2.0 – 1.2) 2.0
X = 16 m
This rounds to 5 lengths of guardrail, or 19.0 m
The length of need is (in U.S. customary units):
X = (130)(7 – 4) 7
X = 55.7 ft
This rounds to 5 lengths of guardrail, or 62.5 ft.
Barrier Design and Placement November 2005
________________________________________________________________________Example Problems 4-19
5. The hazard is outside the clear zone for opposing traffic, so no length of need is necessary on the downstream end. Forty lengths of guardrail are needed to shield the hazard, or 152 m. The total guardrail length is: 152 + 19 m = 171 m. In U.S. customary units, the total guardrail length is 500 + 62.5 = 562.5 ft.
6. A tangent terminal would be most appropriate in this case because the existing slopes make it difficult to accommodate a flared terminal. The barrier is outside the opposing traffic clear zone, so a downstream terminal is not required but should be considered.
If the alternate design process is used, the length of need is:
X = 6 (LA – L2)
X = 6 (2.0 – 1.2)
X = 4.8 m
This rounds to 2 lengths of guardrail, or 7.6 m for the length of need.
In U.S. customary units:
X = 6 (LA – L2)
X = 6 (7 – 4)
X = 18 ft
This rounds to 2 lengths of guardrail, or 25 ft for the length of need. All other considerations are the same as the AASHTO RDG method.
If the site conditions make it difficult to install the four lengths of guardrail for the full length of need, it could be shortened to two sections. The shortened sections allow a larger degree of risk of a vehicle getting behind the upstream end of the barrier and not being able to come to a stop before hitting the hazardous slope.
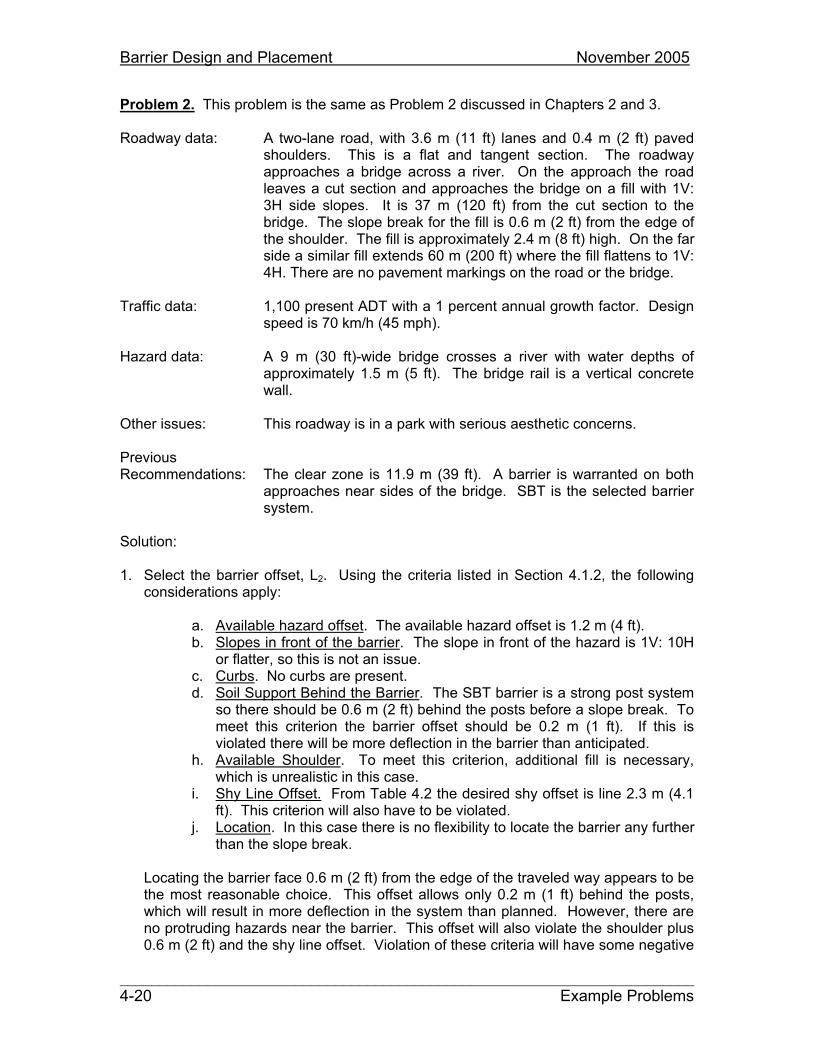
Barrier Design and Placement November 2005
________________________________________________________________________4-20 Example Problems
Problem 2. This problem is the same as Problem 2 discussed in Chapters 2 and 3.
Roadway data: A two-lane road, with 3.6 m (11 ft) lanes and 0.4 m (2 ft) paved shoulders. This is a flat and tangent section. The roadway approaches a bridge across a river. On the approach the road leaves a cut section and approaches the bridge on a fill with 1V: 3H side slopes. It is 37 m (120 ft) from the cut section to the bridge. The slope break for the fill is 0.6 m (2 ft) from the edge of the shoulder. The fill is approximately 2.4 m (8 ft) high. On the far side a similar fill extends 60 m (200 ft) where the fill flattens to 1V: 4H. There are no pavement markings on the road or the bridge.
Traffic data: 1,100 present ADT with a 1 percent annual growth factor. Design speed is 70 km/h (45 mph).
Hazard data: A 9 m (30 ft)-wide bridge crosses a river with water depths of approximately 1.5 m (5 ft). The bridge rail is a vertical concrete wall.
Other issues: This roadway is in a park with serious aesthetic concerns.
PreviousRecommendations: The clear zone is 11.9 m (39 ft). A barrier is warranted on both
approaches near sides of the bridge. SBT is the selected barrier system.
Solution:
1. Select the barrier offset, L2. Using the criteria listed in Section 4.1.2, the following considerations apply:
a. Available hazard offset. The available hazard offset is 1.2 m (4 ft). b. Slopes in front of the barrier. The slope in front of the hazard is 1V: 10H
or flatter, so this is not an issue. c. Curbs. No curbs are present. d. Soil Support Behind the Barrier. The SBT barrier is a strong post system
so there should be 0.6 m (2 ft) behind the posts before a slope break. To meet this criterion the barrier offset should be 0.2 m (1 ft). If this is violated there will be more deflection in the barrier than anticipated.
h. Available Shoulder. To meet this criterion, additional fill is necessary, which is unrealistic in this case.
i. Shy Line Offset. From Table 4.2 the desired shy offset is line 2.3 m (4.1 ft). This criterion will also have to be violated.
j. Location. In this case there is no flexibility to locate the barrier any further than the slope break.
Locating the barrier face 0.6 m (2 ft) from the edge of the traveled way appears to be the most reasonable choice. This offset allows only 0.2 m (1 ft) behind the posts, which will result in more deflection in the system than planned. However, there are no protruding hazards near the barrier. This offset will also violate the shoulder plus 0.6 m (2 ft) and the shy line offset. Violation of these criteria will have some negative

Barrier Design and Placement November 2005
________________________________________________________________________Example Problems 4-21
impact on the usability of the shoulder and traffic capacity but will not affect barrier performance.
2. A flare is not practical at this location because of the existing slopes.
3. Using the AASHTO RDG design method, the design variables are as follows:
From Chapter 2, LC for this problem is 11.9 m (39 ft). LC will be used for LA
in the calculations. L3 is 1.0 m (3 ft). The selected L2 is 0.6 m (2 ft). From Table 4.1, LR is 60 m (200 ft).
4. The length of need is (in metric units):
X = LA + (b/a)(L1) – L2 ___________________
(b/a) + (LA/LR)
X = (LR)(LA – L2) _____________
LA
X = (60)(11.9 – 0.6) 11.9
X = 57.0 m
This rounds to 19 lengths of SBT rail, or 58 m
The length of need in U.S. customary units:
X = (200)(39 – 2) 39
X = 190 ft, which rounds to 19 lengths of SBT rail, or 190 ft.
5. Because of the higher speeds and traffic volumes, it was decided not to use the alternate design procedure.
6. The barrier should be flared back and buried in the cut section at approximately 130 ft from the bridge. Although this does not provide the length of need, the buried end prevents a vehicle from striking the river. Standard Drawing 617-61 requires that the turned-down terminal be flared back 0.6 m (2 ft), and that a flat area be provided 1.5 m (5 ft) beyond the back of the end. The additional fill required by this design would result in slopes steeper than 1V: 3H if it were constructed at the end of the length of need. Therefore, the barrier must be extended to the 1V: 4H slopes, 60 m [200 ft] away from the bridge. The flared end treatment is over a distance of 10 meters (30 ft), so the total barrier length is 70 m (230 ft).


Roadside Barrier Warrants November 2005
APPENDIX A
ROADSIDE BARRIER WARRANTS


Roadside Barrier Warrants November 2005
________________________________________________________________________Table Contents A-i
Table of Contents
ROADSIDE BARRIER WARRANTS................................................................. A-1 A.1 INTRODUCTION .................................................................................... A-1A.2 STEPS IN THE WARRANTING PROCESS............................................ A-2A.3 CALCULATION OF THE ADJUSTED TRAFFIC FACTOR ..................... A-3 A.4 APPLICATION OF THE WARRANTING TABLES .................................. A-5A.5 WARRANTING TABLES......................................................................... A-6 A.6 SAMPLE PROBLEMS .......................................................................... A-26
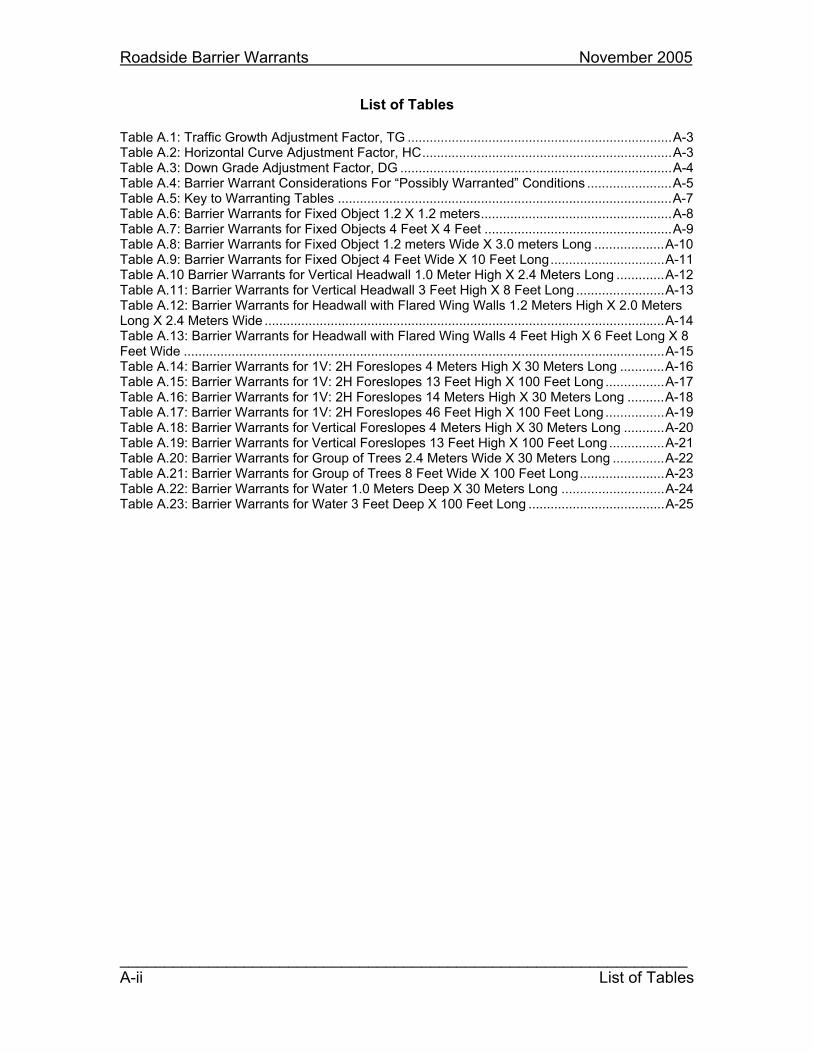
Roadside Barrier Warrants November 2005
________________________________________________________________A-ii List of Tables
List of Tables
Table A.1: Traffic Growth Adjustment Factor, TG ........................................................................A-3 Table A.2: Horizontal Curve Adjustment Factor, HC....................................................................A-3 Table A.3: Down Grade Adjustment Factor, DG ..........................................................................A-4 Table A.4: Barrier Warrant Considerations For “Possibly Warranted” Conditions .......................A-5 Table A.5: Key to Warranting Tables ...........................................................................................A-7Table A.6: Barrier Warrants for Fixed Object 1.2 X 1.2 meters....................................................A-8 Table A.7: Barrier Warrants for Fixed Objects 4 Feet X 4 Feet ...................................................A-9 Table A.8: Barrier Warrants for Fixed Object 1.2 meters Wide X 3.0 meters Long ...................A-10 Table A.9: Barrier Warrants for Fixed Object 4 Feet Wide X 10 Feet Long...............................A-11Table A.10 Barrier Warrants for Vertical Headwall 1.0 Meter High X 2.4 Meters Long .............A-12 Table A.11: Barrier Warrants for Vertical Headwall 3 Feet High X 8 Feet Long ........................A-13 Table A.12: Barrier Warrants for Headwall with Flared Wing Walls 1.2 Meters High X 2.0 Meters Long X 2.4 Meters Wide .............................................................................................................A-14 Table A.13: Barrier Warrants for Headwall with Flared Wing Walls 4 Feet High X 6 Feet Long X 8 Feet Wide ...................................................................................................................................A-15 Table A.14: Barrier Warrants for 1V: 2H Foreslopes 4 Meters High X 30 Meters Long ............A-16 Table A.15: Barrier Warrants for 1V: 2H Foreslopes 13 Feet High X 100 Feet Long ................A-17 Table A.16: Barrier Warrants for 1V: 2H Foreslopes 14 Meters High X 30 Meters Long ..........A-18 Table A.17: Barrier Warrants for 1V: 2H Foreslopes 46 Feet High X 100 Feet Long ................A-19 Table A.18: Barrier Warrants for Vertical Foreslopes 4 Meters High X 30 Meters Long ...........A-20 Table A.19: Barrier Warrants for Vertical Foreslopes 13 Feet High X 100 Feet Long ...............A-21 Table A.20: Barrier Warrants for Group of Trees 2.4 Meters Wide X 30 Meters Long ..............A-22 Table A.21: Barrier Warrants for Group of Trees 8 Feet Wide X 100 Feet Long.......................A-23 Table A.22: Barrier Warrants for Water 1.0 Meters Deep X 30 Meters Long ............................A-24 Table A.23: Barrier Warrants for Water 3 Feet Deep X 100 Feet Long .....................................A-25

Roadside Barrier Warrants November 2005
________________________________________________________________________Introduction A-1
APPENDIX AROADSIDE BARRIER WARRANTS
A.1 INTRODUCTION
The warranting process described in this appendix was developed using the Roadside Safety Analysis Program (RSAP). A number of assumptions were made concerning factors such as roadway type, cross section elements, hazards and barrier cost. These assumptions reduced the number of variables normally considered to the following:
Hazard type and size Hazard offset Traffic volume Traffic growth Horizontal curvature Grade Speed
Traffic volume, traffic growth, horizontal curvature and grade are taken into account by a factor termed “Adjusted Traffic Factor” (ATF). ATF is calculated by modifying the initial average daily traffic (ADT) with adjustments for traffic growth, horizontal curvature and grade. The ATF is then used in warranting tables for each hazard type. Speed and hazard offset are considered in the warranting tables.
RSAP was run using these variables to determine the ATF required to yield a benefit/cost (b/c) ratio of both 1.0 and 4.0. If the b/c was less than 1.0, a barrier is clearly not warranted. If the b/c was greater than 4.0 a barrier is warranted. The b/c of 4.0 allowed for barrier systems more expensive than the strong post w-beam (other than the concrete safety shape, stone masonry and precast concrete systems). The range of ATF that resulted in b/c of between 1.0 and 4.0 indicated that barriers are possibly warranted. Some guidelines are provided to assist in the application of engineering judgment concerning the use of barriers in this range.

Roadside Barrier Warrants November 2005
________________________________________________________________A-2 Steps in the Warranting Process
A.2 STEPS IN THE WARRANTING PROCESS
The steps to determine warrants for roadside barriers on low speed and low volume roads using this procedure are:
1. Determine the needed clear zone, as described in Section 2.2.
2. Using Tables 2.3, 2.4, 2.5 and 2.6, identify hazards within the clear zone that may warrant barriers. Hazards that may warrant barriers include those in Group 2 if there is a clear crash history or if multiple hazards serve to increase the severity. All hazards in Group 3 may warrant barriers.
3. Collect the necessary data to perform the analysis. Such data include the length and width of the hazard; the offset of the hazard from the roadway; speed, present traffic volume and anticipated traffic growth factor of the road; curve radius and grade of the road, if appropriate; available crash data and other concerns such as environmental and aesthetic impacts.
4. Calculate the ATF using information from Tables A.1, A.2 and A.3 and the formula presented below. The factors in these tables adjust the initial ADT to account for expected traffic growth and the effects of horizontal curves and grade.
5. Select the warranting table or tables (summarized in Table A.5) that most closely approximate the actual hazard. Since it is impossible to anticipate all possible roadside hazards, it may be necessary to use two closely associated tables and interpolate the results.
6. Using the ATF with the warranting tables, classify possible roadside barriers as either not warranted, possibly warranted or warranted. If roadside barriers are possibly warranted, consider the factors in Table A.4 to evaluate the need for barriers at that location.
Concrete safety shape, precast concrete guardwall, and the stone masonry guardwall barrier systems are very expensive. The warranting tables do not fully take into account the expense of these systems. Usually there must be a barrier warrant based on safety to justify these systems and also an exceptional need such as aesthetics or an unusual safety concern.

Roadside Barrier Warrants November 2005
________________________________________________________________________Calculation of the Adjusted Traffic Factor A-3
A.3 CALCULATION OF THE ADJUSTED TRAFFIC FACTOR
The Adjusted Traffic Factor (ATF) used in the warranting tables is determined by the following formula:
ATF = Initial ADT * TG * HC * DG
The factors TG, HC, and DG are found in Tables A.1, A.2 and A.3 respectively.
Table A.1: Traffic Growth Adjustment Factor, TG
Annual Growth Factor
AdjustmentFactor
0% 1.00 1% 1.10 2% 1.21 3% 1.34 4% 1.49 5% 1.65
Table A.2: Horizontal Curve Adjustment Factor, HC
Radius Adjustment Factor (HC) Meters Feet Hazard on Outside of
CurveHazard on Inside of
Curve
586 or greater 1,911 or greater 1.00 1.00 441 – 585 1,431 – 1,910 1.50 1.25 351 – 440 1,151 – 1,430 2.50 1.50 291 – 350 951 – 1,150 3.50 1.75 290 or less 950 or less 4.00 2.00

Roadside Barrier Warrants November 2005
________________________________________________________________A-4 Calculating of the Adjusted Traffic Factor
Table A.3: Down Grade Adjustment Factor, DG
Percent Down Grade Adjustment Factor (DG)
0 – 2% 1.00 2.1% – 3.0% 1.10 3.1% – 4.0% 1.40 4.1% – 5.0% 1.70 5.1% – 6.0% 1.90
6.1% and larger 2.00
For example, a road has an initial ADT of 350 and a projected annual growth factor of two percent. The hazard being analyzed is on the outside of a 500 m (1,700 ft)-horizontal curve and on a downgrade of four percent. The ATF is:
ATF = Initial ADT * TG * HC * DG
ATF = 350 * 1.21 * 1.50 * 1.40
ATF = 889

Roadside Barrier Warrants November 2005
________________________________________________________________________Application of the Warranting Tables A-5
A.4 APPLICATION OF THE WARRANTING TABLES
The warranting tables will yield one of three results:
1. A barrier is not warranted. 2. A barrier is possibly warranted. 3. A barrier is warranted.
If the result is that a barrier is “possibly warranted”, the decision to place barriers cannot be clearly quantified and additional considerations must be made. Table A.4 lists the considerations that might be applied in this evaluation.
Table A.4: Barrier Warrant Considerations For “Possibly Warranted” Conditions
Consideration Barrier is more warranted if: Barrier is less warranted if:
Adjusted Traffic Factor ATF is at the high end of range ATF is at the low end of rangeRoadway cross section
Section elements are more severe than assumed
Section elements are less severe than assumed
Size of hazard does not fit the assumption
Hazard is larger Hazard is smaller
Hazard does not fit the description in the warrant table
Hazard is more severe Hazard is less severe
Expected cost of barrier
Expected costs will be low Expected costs will be high
Multiple hazards exist at the site
Many additional hazards
Operating speed Likely to exceed design speed At or below design speed Crash history Clear crash pattern No crash pattern Aesthetic impacts Serious concerns Environmental impacts Serious concerns
It is difficult to quantify the considerations outlined in Table A.4 if more than one consideration is applicable. This table is intended to aid in the necessary exercise of professional judgment.
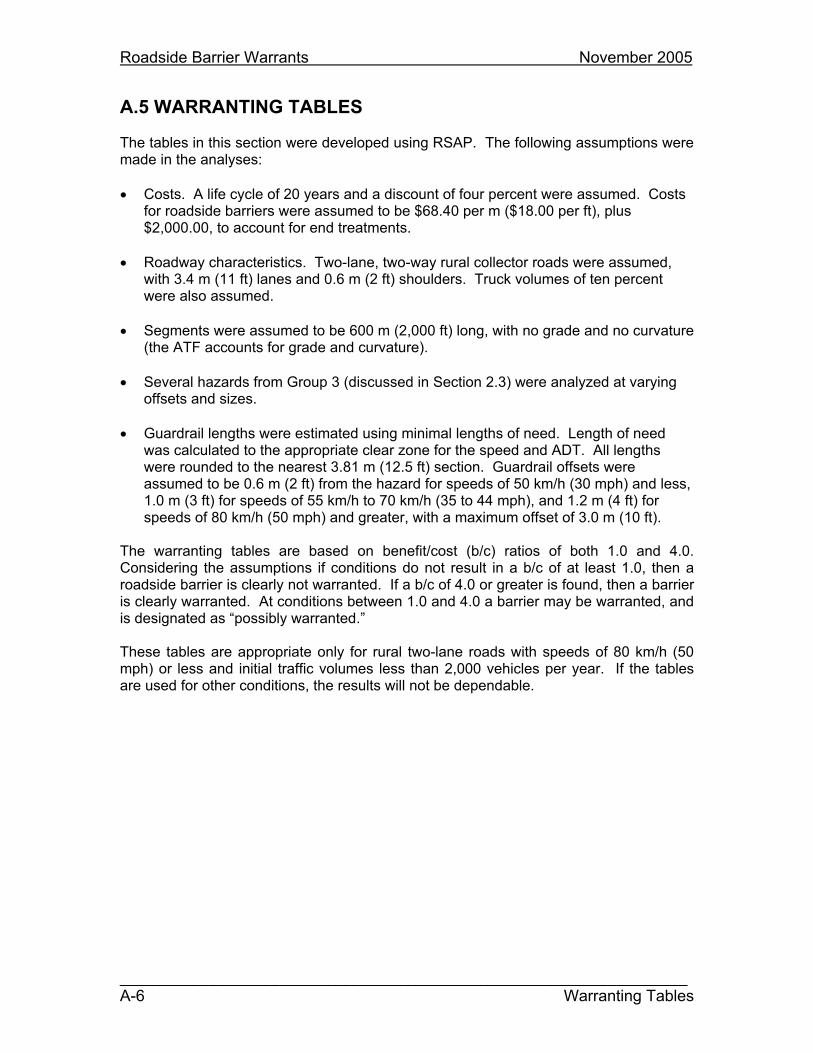
Roadside Barrier Warrants November 2005
________________________________________________________________A-6 Warranting Tables
A.5 WARRANTING TABLES
The tables in this section were developed using RSAP. The following assumptions were made in the analyses:
Costs. A life cycle of 20 years and a discount of four percent were assumed. Costs for roadside barriers were assumed to be $68.40 per m ($18.00 per ft), plus $2,000.00, to account for end treatments.
Roadway characteristics. Two-lane, two-way rural collector roads were assumed, with 3.4 m (11 ft) lanes and 0.6 m (2 ft) shoulders. Truck volumes of ten percent were also assumed.
Segments were assumed to be 600 m (2,000 ft) long, with no grade and no curvature (the ATF accounts for grade and curvature).
Several hazards from Group 3 (discussed in Section 2.3) were analyzed at varying offsets and sizes.
Guardrail lengths were estimated using minimal lengths of need. Length of need was calculated to the appropriate clear zone for the speed and ADT. All lengths were rounded to the nearest 3.81 m (12.5 ft) section. Guardrail offsets were assumed to be 0.6 m (2 ft) from the hazard for speeds of 50 km/h (30 mph) and less, 1.0 m (3 ft) for speeds of 55 km/h to 70 km/h (35 to 44 mph), and 1.2 m (4 ft) for speeds of 80 km/h (50 mph) and greater, with a maximum offset of 3.0 m (10 ft).
The warranting tables are based on benefit/cost (b/c) ratios of both 1.0 and 4.0. Considering the assumptions if conditions do not result in a b/c of at least 1.0, then a roadside barrier is clearly not warranted. If a b/c of 4.0 or greater is found, then a barrier is clearly warranted. At conditions between 1.0 and 4.0 a barrier may be warranted, and is designated as “possibly warranted.”
These tables are appropriate only for rural two-lane roads with speeds of 80 km/h (50 mph) or less and initial traffic volumes less than 2,000 vehicles per year. If the tables are used for other conditions, the results will not be dependable.

Roadside Barrier Warrants November 2005
________________________________________________________________________Warranting Tables A-7
Table A.5: Key to Warranting Tables
Hazard Table
Fixed object, 1.2 m (4 ft) X 1.2 m (4 ft) A.6 Fixed object, 1.2 m (4 ft) X 3.0 m (10 ft) A.7 Vertical headwall, 1.0 m (3 ft) high A.8 Headwall with flared wing walls, 1.2 m (4 ft) high A.9 1V: 2H foreslopes, 4m (13 ft) high A.10 1V: 2H foreslopes, 14m (46 ft) high A.11 Vertical foreslope, 4m (13 ft) high A.12 Group of trees, 30 m (100 ft) long A.13
Water, 1 m (3 ft) deep A-14
In the warranting tables, length is measure parallel to the road and width is perpendicular to the road.
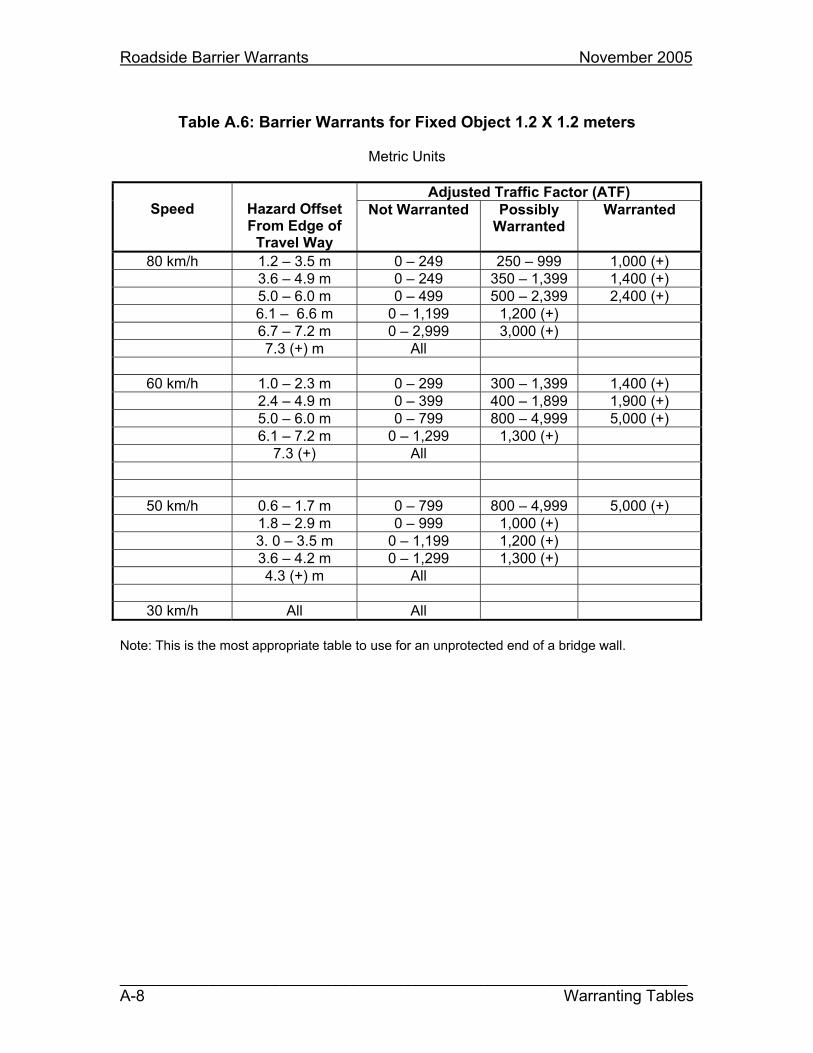
Roadside Barrier Warrants November 2005
________________________________________________________________A-8 Warranting Tables
Table A.6: Barrier Warrants for Fixed Object 1.2 X 1.2 meters
Metric Units
Adjusted Traffic Factor (ATF) Speed Hazard Offset
From Edge of Travel Way
Not Warranted Possibly Warranted
Warranted
80 km/h 1.2 – 3.5 m 0 – 249 250 – 999 1,000 (+) 3.6 – 4.9 m 0 – 249 350 – 1,399 1,400 (+) 5.0 – 6.0 m 0 – 499 500 – 2,399 2,400 (+) 6.1 – 6.6 m 0 – 1,199 1,200 (+) 6.7 – 7.2 m 0 – 2,999 3,000 (+) 7.3 (+) m All
60 km/h 1.0 – 2.3 m 0 – 299 300 – 1,399 1,400 (+) 2.4 – 4.9 m 0 – 399 400 – 1,899 1,900 (+)
5.0 – 6.0 m 0 – 799 800 – 4,999 5,000 (+) 6.1 – 7.2 m 0 – 1,299 1,300 (+) 7.3 (+) All
50 km/h 0.6 – 1.7 m 0 – 799 800 – 4,999 5,000 (+) 1.8 – 2.9 m 0 – 999 1,000 (+) 3. 0 – 3.5 m 0 – 1,199 1,200 (+) 3.6 – 4.2 m 0 – 1,299 1,300 (+) 4.3 (+) m All
30 km/h All All
Note: This is the most appropriate table to use for an unprotected end of a bridge wall.

Roadside Barrier Warrants November 2005
________________________________________________________________________Warranting Tables A-9
Table A.7: Barrier Warrants for Fixed Objects 4 Feet X 4 Feet
Continued, U.S. Customary Units
Adjusted Traffic Factor (ATF) Speed Hazard Offset
From Edge of Travel Way
Not Warranted Possibly Warranted
Warranted
50 mph 4 – 11 ft. 0 – 249 250 – 999 1,000 (+) 12 – 15 ft 0 – 249 350 – 1,399 1,400 (+) 16 – 19 ft 0 – 499 500 – 2,399 2,400 (+) 20 – 21 ft 0 – 1,199 1,200 (+) 22 – 23 ft 0 – 2,999 3,000 (+) 24 (+) ft All
40 mph 3 – 7 ft 0 – 299 300 – 1,399 1,400 (+) 8 – 15 ft 0 – 399 400 – 1,899 1,900 (+) 16 – 19 ft 0 – 799 800 – 4,999 5,000 (+) 20 – 23 ft 0 – 1,299 1,300 (+) 24 (+) ft All
30 mph 2 – 5 ft 0 – 799 800 – 4,999 5,000 (+) 6 – 9 ft 0 – 999 1,000 (+) 10 – 11 ft 0 – 1,199 1,200 (+) 12 – 13 ft 0 – 1,299 1,300 (+) 14 ft (+) All
20 mph All All
Note: This is the most appropriate table to use for an unprotected end of a bridge wall.
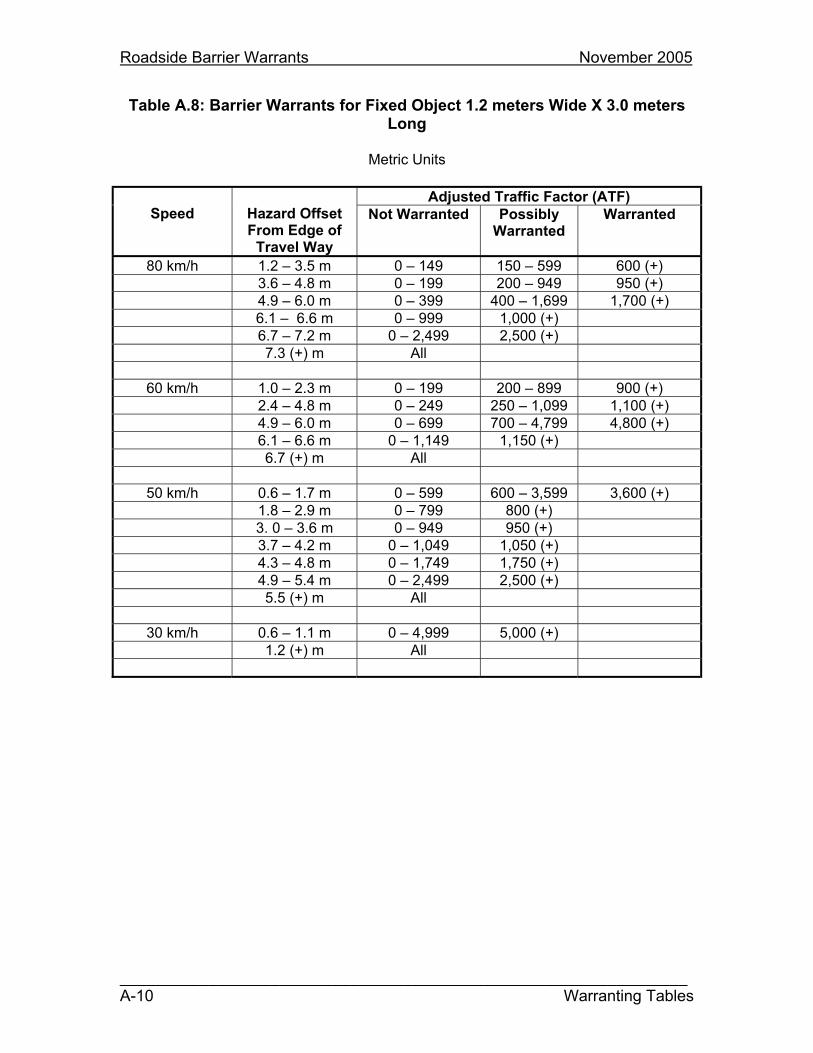
Roadside Barrier Warrants November 2005
________________________________________________________________A-10 Warranting Tables
Table A.8: Barrier Warrants for Fixed Object 1.2 meters Wide X 3.0 meters Long
Metric Units
Adjusted Traffic Factor (ATF) Speed Hazard Offset
From Edge of Travel Way
Not Warranted Possibly Warranted
Warranted
80 km/h 1.2 – 3.5 m 0 – 149 150 – 599 600 (+) 3.6 – 4.8 m 0 – 199 200 – 949 950 (+) 4.9 – 6.0 m 0 – 399 400 – 1,699 1,700 (+) 6.1 – 6.6 m 0 – 999 1,000 (+) 6.7 – 7.2 m 0 – 2,499 2,500 (+) 7.3 (+) m All
60 km/h 1.0 – 2.3 m 0 – 199 200 – 899 900 (+) 2.4 – 4.8 m 0 – 249 250 – 1,099 1,100 (+)
4.9 – 6.0 m 0 – 699 700 – 4,799 4,800 (+) 6.1 – 6.6 m 0 – 1,149 1,150 (+) 6.7 (+) m All
50 km/h 0.6 – 1.7 m 0 – 599 600 – 3,599 3,600 (+) 1.8 – 2.9 m 0 – 799 800 (+) 3. 0 – 3.6 m 0 – 949 950 (+) 3.7 – 4.2 m 0 – 1,049 1,050 (+) 4.3 – 4.8 m 0 – 1,749 1,750 (+) 4.9 – 5.4 m 0 – 2,499 2,500 (+) 5.5 (+) m All
30 km/h 0.6 – 1.1 m 0 – 4,999 5,000 (+) 1.2 (+) m All
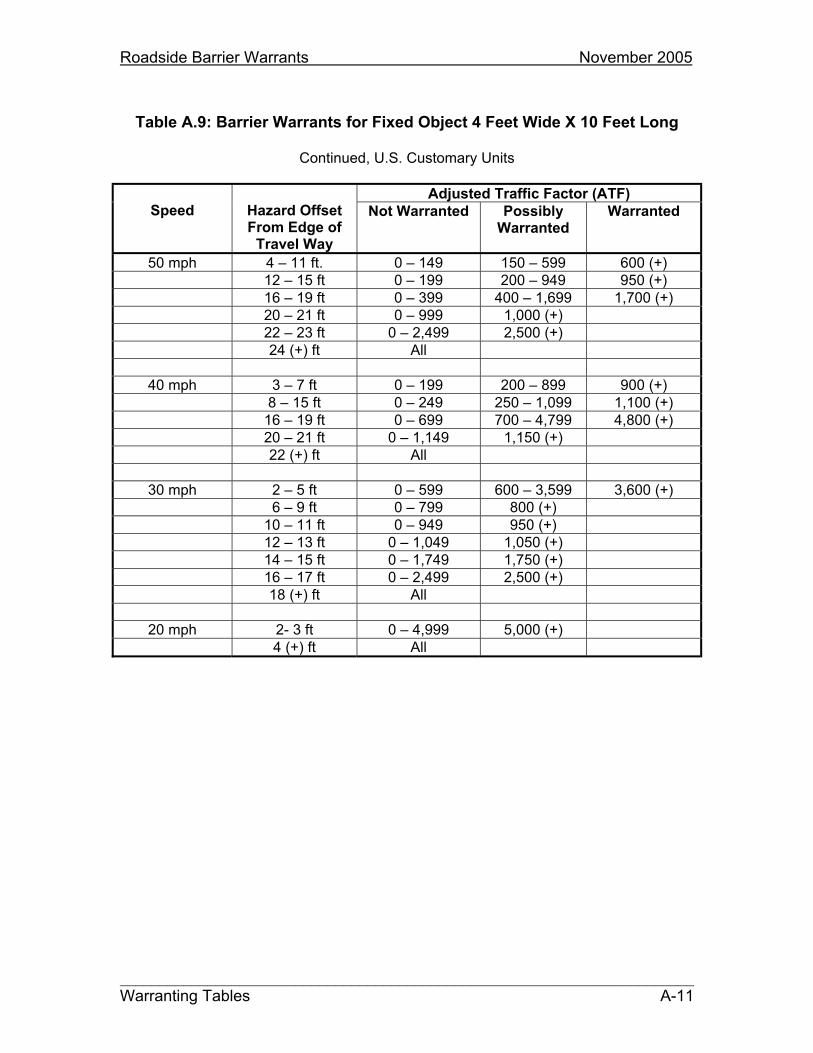
Roadside Barrier Warrants November 2005
________________________________________________________________________Warranting Tables A-11
Table A.9: Barrier Warrants for Fixed Object 4 Feet Wide X 10 Feet Long
Continued, U.S. Customary Units
Adjusted Traffic Factor (ATF) Speed Hazard Offset
From Edge of Travel Way
Not Warranted Possibly Warranted
Warranted
50 mph 4 – 11 ft. 0 – 149 150 – 599 600 (+) 12 – 15 ft 0 – 199 200 – 949 950 (+) 16 – 19 ft 0 – 399 400 – 1,699 1,700 (+) 20 – 21 ft 0 – 999 1,000 (+) 22 – 23 ft 0 – 2,499 2,500 (+) 24 (+) ft All
40 mph 3 – 7 ft 0 – 199 200 – 899 900 (+) 8 – 15 ft 0 – 249 250 – 1,099 1,100 (+) 16 – 19 ft 0 – 699 700 – 4,799 4,800 (+) 20 – 21 ft 0 – 1,149 1,150 (+) 22 (+) ft All
30 mph 2 – 5 ft 0 – 599 600 – 3,599 3,600 (+) 6 – 9 ft 0 – 799 800 (+) 10 – 11 ft 0 – 949 950 (+) 12 – 13 ft 0 – 1,049 1,050 (+) 14 – 15 ft 0 – 1,749 1,750 (+) 16 – 17 ft 0 – 2,499 2,500 (+) 18 (+) ft All
20 mph 2- 3 ft 0 – 4,999 5,000 (+) 4 (+) ft All

Roadside Barrier Warrants November 2005
________________________________________________________________A-12 Warranting Tables
Table A.10 Barrier Warrants for Vertical Headwall 1.0 Meter High X 2.4 Meters Long
Metric Units
Adjusted Traffic Factor (ATF) Speed Hazard Offset Not Warranted Possibly
WarrantedWarranted
80 km/h 1.2 – 2.3 m 0 – 299 300 – 1,199 1,200 (+) 2.4 – 3.6 m 0 – 349 350 – 1,499 1,500 (+) 3.7 – 4.8 m 0 – 399 400 – 1,899 1,900 (+) 4.9 – 5.4 m 0 999 1,000 (+) 5.5 – 6.0 m 0 – 1,799 1,800 (+) 6.1 (+) m All
60 km/h 1.0 – 2.3 m 0 – 599 600 – 3,199 3,200 (+) 2.4 – 3.6 m 0 – 699 700 – 4,999 5,000 (+) 3.7 – 4.8 m 0 – 899 900 (+) 4.9 – 5.4 m 0 – 2,999 3,000 (+) 5.5 (+) m All
50 km/h 0.6 – 1.7 m. 0 – 1,700 1,800(+) 1.8 – 2.3 m 0 – 1,999 2,000 (+) 2.4 – 2.9 m 0 – 2,199 2,200 (+) 3.0 – 3.6 m 0 – 2,399 2,400 (+) 3.7 (+) m All
30 km/h All All

Roadside Barrier Warrants November 2005
________________________________________________________________________Warranting Tables A-13
Table A.11: Barrier Warrants for Vertical Headwall 3 Feet High X 8 Feet Long
Continued, U.S. Customary Units
Adjusted Traffic Factor (ATF) Speed Hazard Offset Not Warranted Possibly
WarrantedWarranted
50 mph 4 – 7 ft. 0 – 299 300 – 1,199 1,200 (+) 8 – 11 ft 0 – 349 350 – 1,499 1,500 (+) 12 – 15 ft 0 – 399 400 – 1,899 1,900 (+) 16 – 17 ft 0 – 999 1,000 (+) 18 – 19 ft 0 – 1,799 1,800 (+) 20 (+) ft All
40 mph 3 – 7 ft. 0 – 599 600 – 3,199 3,200 (+) 8 – 11 ft 0 – 699 700 – 4,999 5,000 (+) 12 – 15 ft 0 – 899 900 (+) 16 – 17 ft 0 – 2,999 3,000 (+) 18 (+) ft All
30 mph 2 – 5 ft. 0 – 1,700 1,800(+) 6 – 7 ft 0 – 1,999 2,000 (+) 8 – 9 ft 0 – 2,199 2,200 (+) 10 – 11 ft 0 – 2,399 2,400 (+) 12 (+) ft All
20 mph All All
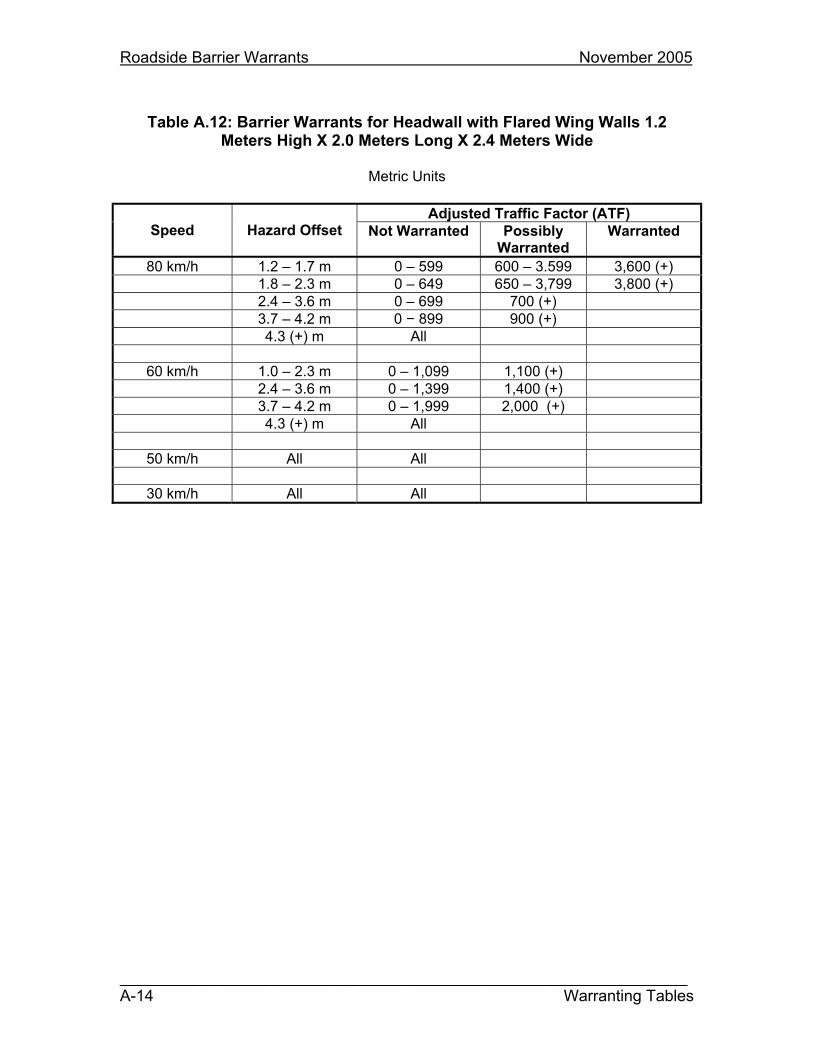
Roadside Barrier Warrants November 2005
________________________________________________________________A-14 Warranting Tables
Table A.12: Barrier Warrants for Headwall with Flared Wing Walls 1.2 Meters High X 2.0 Meters Long X 2.4 Meters Wide
Metric Units
Adjusted Traffic Factor (ATF) Speed Hazard Offset Not Warranted Possibly
WarrantedWarranted
80 km/h 1.2 – 1.7 m 0 – 599 600 – 3.599 3,600 (+) 1.8 – 2.3 m 0 – 649 650 – 3,799 3,800 (+) 2.4 – 3.6 m 0 – 699 700 (+) 3.7 – 4.2 m 0 899 900 (+) 4.3 (+) m All
60 km/h 1.0 – 2.3 m 0 – 1,099 1,100 (+) 2.4 – 3.6 m 0 – 1,399 1,400 (+) 3.7 – 4.2 m 0 – 1,999 2,000 (+) 4.3 (+) m All
50 km/h All All
30 km/h All All

Roadside Barrier Warrants November 2005
________________________________________________________________________Warranting Tables A-15
Table A.13: Barrier Warrants for Headwall with Flared Wing Walls 4 Feet High X 6 Feet Long X 8 Feet Wide
Continued, U.S. Customary Units
Effective ADT Speed Hazard Offset Not Warranted Possibly
WarrantedWarranted
50 mph 4 – 5 ft. 0 – 599 600 – 3.599 3,600 (+) 6 – 7 ft 0 – 649 650 – 3,799 3,800 (+) 8 – 11 ft 0 – 699 700 (+) 12 –13 ft 0 899 900 (+) 14 (+) ft All
40 mph 3 – 7 ft. 0 – 1,099 1,100 (+) 8 – 11 ft 0 – 1,399 1,400 (+) 12 – 13 ft 0 – 1,999 2,000 (+) 14 (+) ft All
30 mph All All
20 mph All All

Roadside Barrier Warrants November 2005
________________________________________________________________A-16 Warranting Tables
Table A.14: Barrier Warrants for 1V: 2H Foreslopes 4 Meters High X 30 Meters Long
Metric Units
Adjusted Traffic Factor (ATF) Speed Hazard Offset
From Edge of Travel Way
Not Warranted Possibly Warranted
Warranted
80 km/h 1.2 – 2.3 m 0 – 549 550 – 2,999 3,000 (+) 2.4 – 3.6 m 0 – 599 600 – 3,599 3,600 (+) 3.7 – 4.8 m 0 – 749 750 – 4,999 5,000(+) 4.9 – 5.4 m 0 – 1,399 1,400 (+) 5.5 – 6.0 m 0 – 3,999 4,000(+) 6.1 (+) m All
60 km/h 1.0 – 3.4 m 0 – 949 950(+) 2.4 – 3.6 m 0 – 1,049 1,050 (+) 3.7 – 4.2 m 0 – 1,249 1,250 (+) 4.3 – 4.8 m 0 – 1,499 1,500 (+) 4.9 – 5.4 m 0 – 3,199 3,200 (+) 5.5 (+) m All
50 km/h 0.6 – 2.3 m 0 – 2,149 2,150 (+) 2.4 – 2.9 m 0 – 2,349 2,350 (+) 3.0 – 3.6 m 0 – 3,399 3,400 (+) 3.7 (+) m All
30 km/h All All

Roadside Barrier Warrants November 2005
________________________________________________________________________Warranting Tables A-17
Table A.15: Barrier Warrants for 1V: 2H Foreslopes 13 Feet High X 100 Feet Long
Continued, U.S. Customary Units
Adjusted Traffic Factor (ATF) Speed Hazard Offset
From Edge of Travel Way
Not Warranted Possibly Warranted
Warranted
50 mph 4 – 7 ft. 0 – 549 550 – 2,999 3,000 (+) 8 – 11 ft 0 – 599 600 – 3,599 3,600 (+) 12 – 15 ft 0 – 749 750 – 4,999 5,000(+) 16 – 17 ft 0 – 1,399 1,400 (+) 18 – 19 ft 0 – 3,999 4,000(+) 20 (+) ft All
40 mph 3 – 7 ft 0 – 949 950(+) 8 – 11 ft 0 – 1,049 1,050 (+) 12 – 13 ft 0 – 1,249 1,250 (+) 14 – 15 ft 0 – 1,499 1,500 (+) 16 – 17 ft 0 – 3,199 3,200 (+) 18 (+) ft All
30 mph 2 – 7 ft 0 – 2,149 2,150 (+) 8 – 10 ft 0 – 2,349 2,350 (+) 10 – 11 ft 0 – 3,399 3,400 (+) 12 (+) ft All
20 mph All All
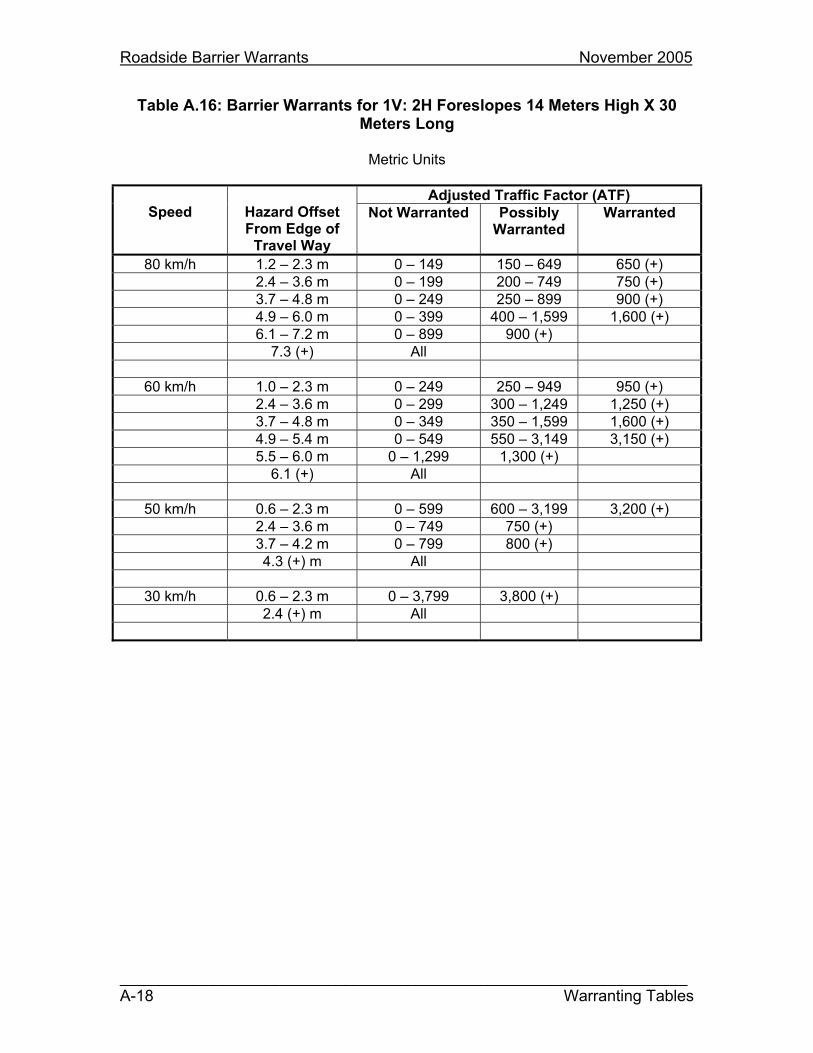
Roadside Barrier Warrants November 2005
________________________________________________________________A-18 Warranting Tables
Table A.16: Barrier Warrants for 1V: 2H Foreslopes 14 Meters High X 30 Meters Long
Metric Units
Adjusted Traffic Factor (ATF) Speed Hazard Offset
From Edge of Travel Way
Not Warranted Possibly Warranted
Warranted
80 km/h 1.2 – 2.3 m 0 – 149 150 – 649 650 (+) 2.4 – 3.6 m 0 – 199 200 – 749 750 (+) 3.7 – 4.8 m 0 – 249 250 – 899 900 (+) 4.9 – 6.0 m 0 – 399 400 – 1,599 1,600 (+) 6.1 – 7.2 m 0 – 899 900 (+) 7.3 (+) All
60 km/h 1.0 – 2.3 m 0 – 249 250 – 949 950 (+) 2.4 – 3.6 m 0 – 299 300 – 1,249 1,250 (+) 3.7 – 4.8 m 0 – 349 350 – 1,599 1,600 (+) 4.9 – 5.4 m 0 – 549 550 – 3,149 3,150 (+) 5.5 – 6.0 m 0 – 1,299 1,300 (+) 6.1 (+) All
50 km/h 0.6 – 2.3 m 0 – 599 600 – 3,199 3,200 (+) 2.4 – 3.6 m 0 – 749 750 (+) 3.7 – 4.2 m 0 – 799 800 (+) 4.3 (+) m All
30 km/h 0.6 – 2.3 m 0 – 3,799 3,800 (+) 2.4 (+) m All
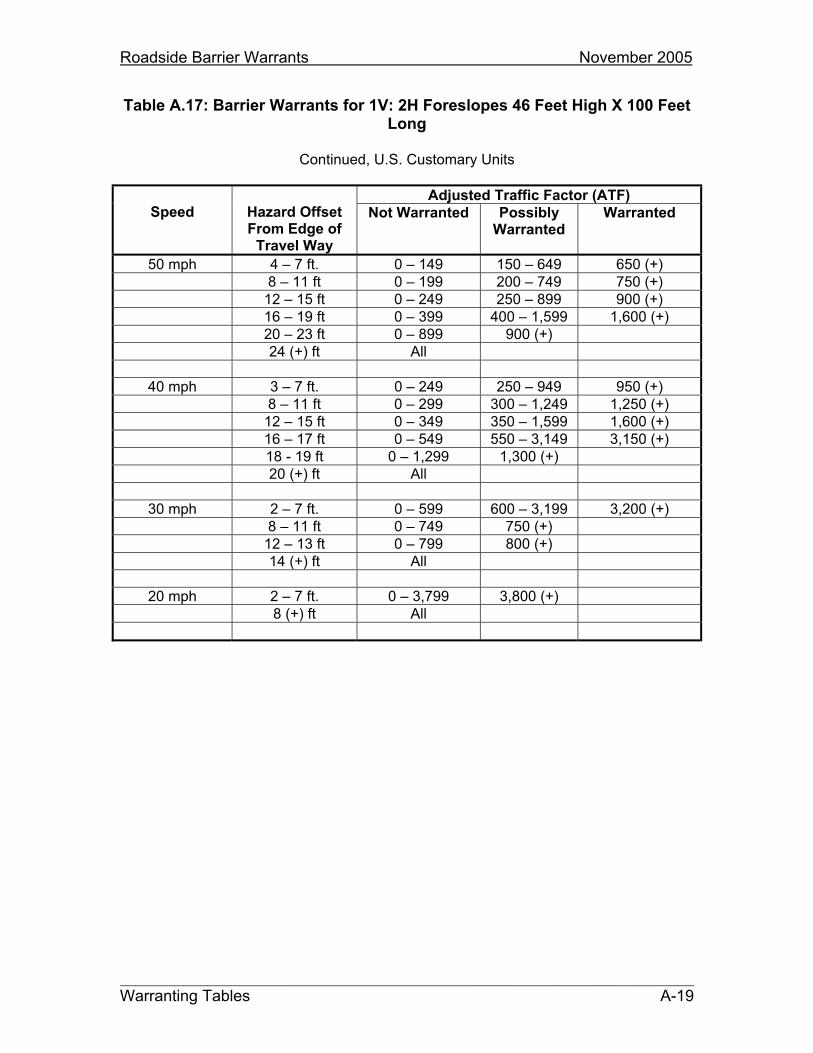
Roadside Barrier Warrants November 2005
________________________________________________________________________Warranting Tables A-19
Table A.17: Barrier Warrants for 1V: 2H Foreslopes 46 Feet High X 100 Feet Long
Continued, U.S. Customary Units
Adjusted Traffic Factor (ATF) Speed Hazard Offset
From Edge of Travel Way
Not Warranted Possibly Warranted
Warranted
50 mph 4 – 7 ft. 0 – 149 150 – 649 650 (+) 8 – 11 ft 0 – 199 200 – 749 750 (+) 12 – 15 ft 0 – 249 250 – 899 900 (+) 16 – 19 ft 0 – 399 400 – 1,599 1,600 (+) 20 – 23 ft 0 – 899 900 (+) 24 (+) ft All
40 mph 3 – 7 ft. 0 – 249 250 – 949 950 (+) 8 – 11 ft 0 – 299 300 – 1,249 1,250 (+) 12 – 15 ft 0 – 349 350 – 1,599 1,600 (+) 16 – 17 ft 0 – 549 550 – 3,149 3,150 (+) 18 - 19 ft 0 – 1,299 1,300 (+) 20 (+) ft All
30 mph 2 – 7 ft. 0 – 599 600 – 3,199 3,200 (+) 8 – 11 ft 0 – 749 750 (+) 12 – 13 ft 0 – 799 800 (+) 14 (+) ft All
20 mph 2 – 7 ft. 0 – 3,799 3,800 (+) 8 (+) ft All
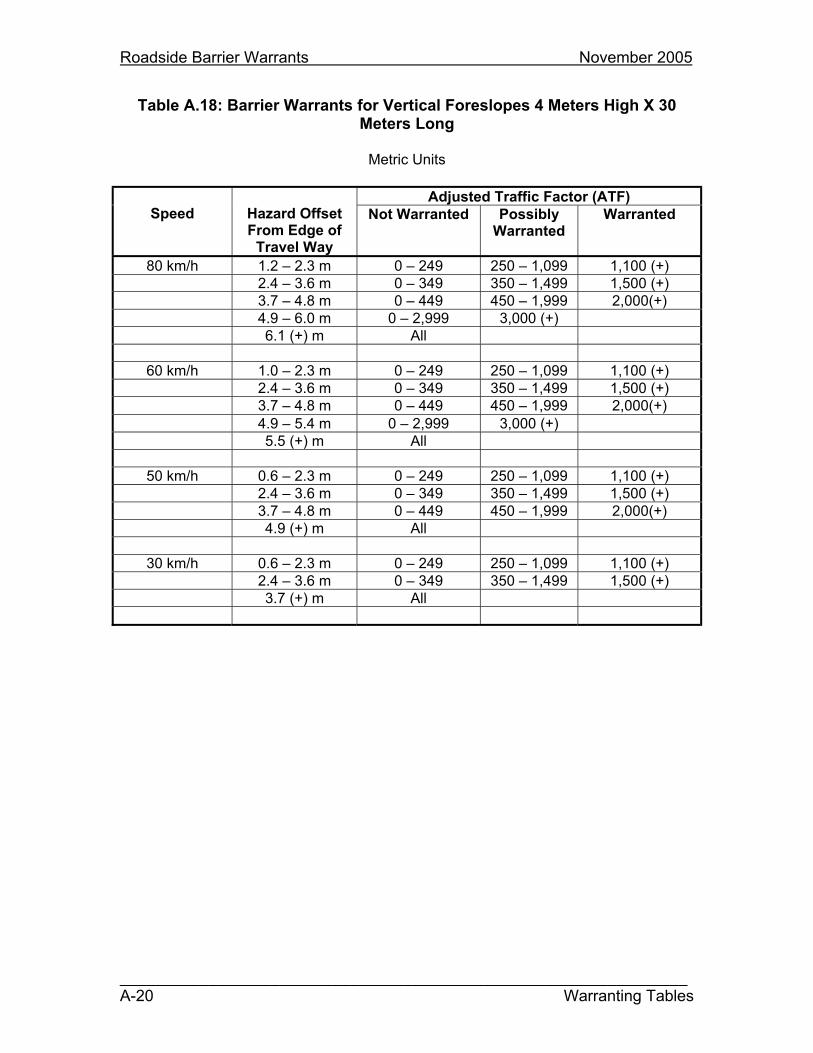
Roadside Barrier Warrants November 2005
________________________________________________________________A-20 Warranting Tables
Table A.18: Barrier Warrants for Vertical Foreslopes 4 Meters High X 30 Meters Long
Metric Units
Adjusted Traffic Factor (ATF) Speed Hazard Offset
From Edge of Travel Way
Not Warranted Possibly Warranted
Warranted
80 km/h 1.2 – 2.3 m 0 – 249 250 – 1,099 1,100 (+) 2.4 – 3.6 m 0 – 349 350 – 1,499 1,500 (+) 3.7 – 4.8 m 0 – 449 450 – 1,999 2,000(+) 4.9 – 6.0 m 0 – 2,999 3,000 (+) 6.1 (+) m All
60 km/h 1.0 – 2.3 m 0 – 249 250 – 1,099 1,100 (+) 2.4 – 3.6 m 0 – 349 350 – 1,499 1,500 (+) 3.7 – 4.8 m 0 – 449 450 – 1,999 2,000(+) 4.9 – 5.4 m 0 – 2,999 3,000 (+) 5.5 (+) m All
50 km/h 0.6 – 2.3 m 0 – 249 250 – 1,099 1,100 (+) 2.4 – 3.6 m 0 – 349 350 – 1,499 1,500 (+) 3.7 – 4.8 m 0 – 449 450 – 1,999 2,000(+) 4.9 (+) m All
30 km/h 0.6 – 2.3 m 0 – 249 250 – 1,099 1,100 (+) 2.4 – 3.6 m 0 – 349 350 – 1,499 1,500 (+) 3.7 (+) m All
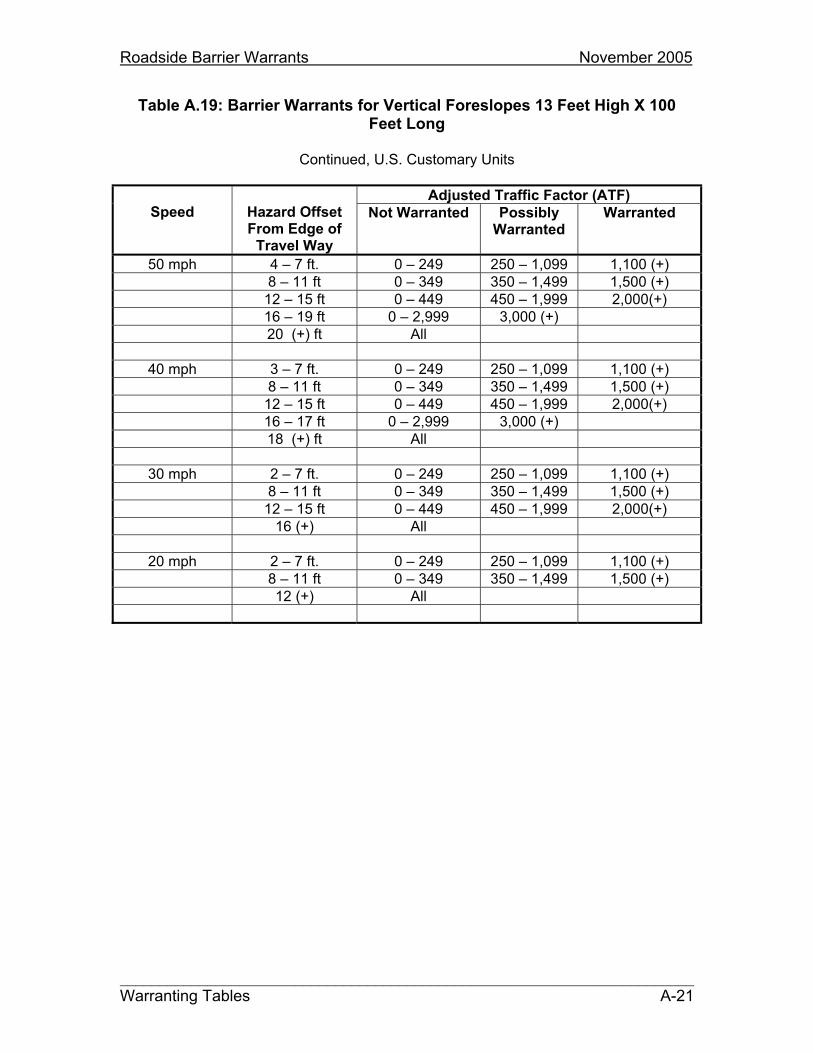
Roadside Barrier Warrants November 2005
________________________________________________________________________Warranting Tables A-21
Table A.19: Barrier Warrants for Vertical Foreslopes 13 Feet High X 100 Feet Long
Continued, U.S. Customary Units
Adjusted Traffic Factor (ATF) Speed Hazard Offset
From Edge of Travel Way
Not Warranted Possibly Warranted
Warranted
50 mph 4 – 7 ft. 0 – 249 250 – 1,099 1,100 (+) 8 – 11 ft 0 – 349 350 – 1,499 1,500 (+) 12 – 15 ft 0 – 449 450 – 1,999 2,000(+) 16 – 19 ft 0 – 2,999 3,000 (+) 20 (+) ft All
40 mph 3 – 7 ft. 0 – 249 250 – 1,099 1,100 (+) 8 – 11 ft 0 – 349 350 – 1,499 1,500 (+) 12 – 15 ft 0 – 449 450 – 1,999 2,000(+) 16 – 17 ft 0 – 2,999 3,000 (+) 18 (+) ft All
30 mph 2 – 7 ft. 0 – 249 250 – 1,099 1,100 (+) 8 – 11 ft 0 – 349 350 – 1,499 1,500 (+) 12 – 15 ft 0 – 449 450 – 1,999 2,000(+) 16 (+) All
20 mph 2 – 7 ft. 0 – 249 250 – 1,099 1,100 (+) 8 – 11 ft 0 – 349 350 – 1,499 1,500 (+) 12 (+) All

Roadside Barrier Warrants November 2005
________________________________________________________________A-22 Warranting Tables
Table A.20: Barrier Warrants for Group of Trees 2.4 Meters Wide X 30 Meters Long
Metric Units
Adjusted Traffic Factor (ATF) Speed Hazard Offset
From Edge of Travel Way
Not Warranted Possibly Warranted
Warranted
80 km/h 1.2 – 2.3 m 0 – 149 150 – 549 550 (+) 2.4 – 3.6 m 0 – 199 200 – 749 750 (+) 3.7 – 4.8 m 0 – 249 250 – 899 900 (+) 4.9 – 6.0 m 0 – 349 350 – 1,499 1,500 (+) 6.1 – 7.2 m 0 – 749 750 (+) 7.3 (+) All
60 km/h 1.0 – 2.3 m 0 – 249 250 – 999 1,000 (+) 2.4 – 3.6 m 0 – 299 300 – 1,249 1,250 (+) 3.7 – 4.8 m 0 – 349 350 – 1,649 1,650 (+) 4.9 – 5.4 m 0 – 599 600 – 3,199 3,200 (+) 5.5 – 6.0 m 0 – 799 800 (+) 6.1 (+) All
50 km/h 0.6 – 2.3 m 0 – 449 450 – 2,149 2,150 (+) 2.4 – 3.6 m 0 – 599 600 – 2,999 3,000 (+) 3.7 – 4.2 m 0 – 799 800 (+) 4.3 (+) m All
30 km/h 0.6 – 2.3 m 0 – 2,599 2,600 (+) 2.4 – 2.9 m 5,000 (+) 3.0 (+) m
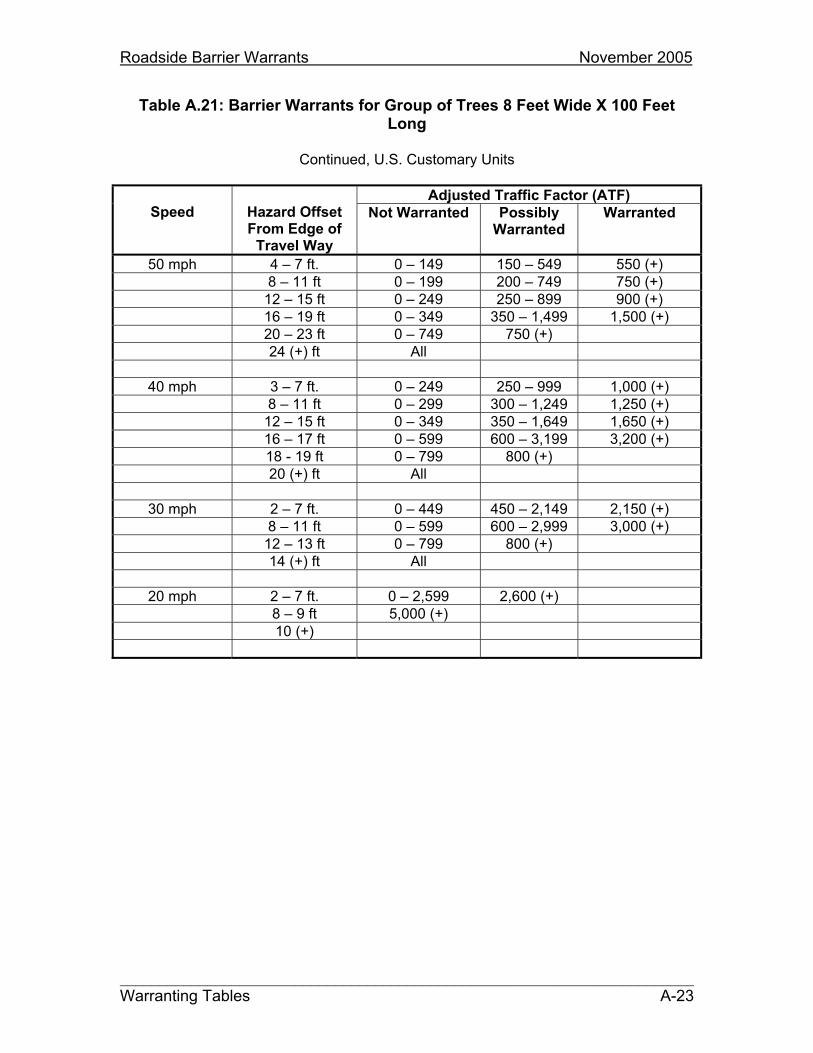
Roadside Barrier Warrants November 2005
________________________________________________________________________Warranting Tables A-23
Table A.21: Barrier Warrants for Group of Trees 8 Feet Wide X 100 Feet Long
Continued, U.S. Customary Units
Adjusted Traffic Factor (ATF) Speed Hazard Offset
From Edge of Travel Way
Not Warranted Possibly Warranted
Warranted
50 mph 4 – 7 ft. 0 – 149 150 – 549 550 (+) 8 – 11 ft 0 – 199 200 – 749 750 (+) 12 – 15 ft 0 – 249 250 – 899 900 (+) 16 – 19 ft 0 – 349 350 – 1,499 1,500 (+) 20 – 23 ft 0 – 749 750 (+) 24 (+) ft All
40 mph 3 – 7 ft. 0 – 249 250 – 999 1,000 (+) 8 – 11 ft 0 – 299 300 – 1,249 1,250 (+) 12 – 15 ft 0 – 349 350 – 1,649 1,650 (+) 16 – 17 ft 0 – 599 600 – 3,199 3,200 (+) 18 - 19 ft 0 – 799 800 (+) 20 (+) ft All
30 mph 2 – 7 ft. 0 – 449 450 – 2,149 2,150 (+) 8 – 11 ft 0 – 599 600 – 2,999 3,000 (+) 12 – 13 ft 0 – 799 800 (+) 14 (+) ft All
20 mph 2 – 7 ft. 0 – 2,599 2,600 (+) 8 – 9 ft 5,000 (+) 10 (+)

Roadside Barrier Warrants November 2005
________________________________________________________________A-24 Warranting Tables
Table A.22: Barrier Warrants for Water 1.0 Meters Deep X 30 Meters Long
Metric Units
Adjusted Traffic Factor (ATF) Speed Hazard Offset
From Edge of Travel Way
Not Warranted Possibly Warranted
Warranted
80 km/h 1.2 – 2.3 m 0 – 249 250 – 1,099 1,100 (+) 2.4 – 3.6 m 0 – 349 350 – 1,499 1,500 (+) 3.7 – 4.8 m 0 – 449 450 – 1,999 2,000(+) 4.9 – 6.0 m 0 – 2,999 3,000 (+) 6.1 (+) m All
60 km/h 1.0 – 2.3 m 0 – 249 250 – 1,099 1,100 (+) 2.4 – 3.6 m 0 – 349 350 – 1,499 1,500 (+) 3.7 – 4.8 m 0 – 449 450 – 1,999 2,000 (+) 4.9 – 5.4 m 0 – 2,999 3,000 (+) 5.5 (+) m All
50 km/h 0.6 – 2.3 m 0 – 599 600 – 3,199 3,200 (+) 2.4 – 3.6 m 0 – 749 750 (+) 3.7 – 4.2 m 0 – 799 800 (+) 4.3 (+) m All
30 km/h 0.6 – 2.3 m 0 – 3,799 3,800 (+) 2.4 (+) m All

Roadside Barrier Warrants November 2005
________________________________________________________________________Warranting Tables A-25
Table A.23: Barrier Warrants for Water 3 Feet Deep X 100 Feet Long
Continued, U.S. Customary Units
Adjusted Traffic Factor (ATF) Speed Hazard Offset
From Edge of Travel Way
Not Warranted Possibly Warranted
Warranted
50 mph 4 – 7 ft. 0 – 249 250 – 1,099 1,100 (+) 8 – 11 ft 0 – 349 350 – 1,499 1,500 (+) 12 – 15 ft 0 – 449 450 – 1,999 2,000(+) 16 – 19 ft 0 – 2,999 3,000 (+) 20 (+) ft All
40 mph 3 – 7 ft. 0 – 249 250 – 1,099 1,100 (+) 8 – 11 ft 0 – 349 350 – 1,499 1,500 (+) 12 – 15 ft 0 – 449 450 – 1,999 2,000 (+) 16 – 17 ft 0 – 2,999 3,000 (+) 18 (+) ft All
30 mph 2 – 7 ft. 0 – 599 600 – 3,199 3,200 (+) 8 – 11 ft 0 – 749 750 (+) 12 – 13 ft 0 – 799 800 (+) 14 (+) ft All
20 mph 2 – 7 ft. 0 – 3,799 3,800 (+) 8 (+) ft All

Roadside Barrier Warrants November 2005
________________________________________________________________A-26 Sample Problems
A.6 SAMPLE PROBLEMS
The following are example applications of the warranting process described in this Appendix.
Problem 1. This problem is the same as Problem 1 of Chapter 2.
Roadway data: A two-lane road, with 3.6 m (12 ft) lanes and 1.2 m (4 ft) paved shoulders. There is a tangent section and a 46 m (150 ft)-long horizontal curve on a 240 m (800 ft) radius. The whole section is on a 3 percent downward grade.
Traffic data: 400 present ADT with a 3 percent annual growth factor. Design speed is 50 km/h (30 mph). On the tangent section actual speeds may exceed the design speed.
Hazard data: The hazard is a 1V: 2H foreslope 18 m (60 ft) high, offset 1.8 m (6 ft) from the edge of travel way on the outside of the horizontal curve. The slope is 150 m (500 ft) parallel to the road, including both the horizontal curve and the tangent section. There are some scattered trees and small boulders on the slope.
Other issues: Because of the remote location, barrier construction is expected to be costly. There are no crash data available. There are no aesthetic or environmental issues.
Solution:
1. The hazard is at an offset of 1.2 m (6 ft). From Table 2.1, the clear zone range is 1.0 - 2.0 m (3 - 7 ft). From Table 2.2, the horizontal curve adjustment factor is 1.2. The higher end of the range is selected as the desired clear zone because of the seriousness of the hazard. Therefore, the slope is within the clear zone in both the tangent and curved sections. The slope is outside the clear zone for opposing traffic.
2. From Table 2.5, the slope is a Category 3 hazard so a barrier should be considered.
3. The following ADT adjustment factors were obtained from Tables A.1, A.2 and A.3:
TG = 1.34 HC = 1.00 for the tangent section and 4.00 for the curved section. DG = 1.10
Roadside Barrier Warrants November 2005
________________________________________________________________________Sample Problems A-27
4. The Adjusted Traffic Factor (ATF) for the tangent section is:
ATF = ADT * TG * HC * DG
AFT = 400 * 1.34 * 1.00 * 1.10
ATF = 590
5. The Adjusted Traffic Factor (ATF) for the curved section is:
ATF = ADT * TG * HC * DG
ATF = 400 * 1.34 * 4.00 * 1.10
ATF = 2,358
6. From Table A.11, guardrail is possibly warranted on the tangent section and is clearly warranted on the curved section.
7. For the curved section, the following issues from Table A.4 are considered in determining to place a roadside barrier:
Reasons to use a barrier:
a. The hazard is larger than assumed in Table A.11. b. The hazard is more severe than assumed in Table A.11. a. There are multiple hazards, although only a few. b. Actual speeds may exceed the design speed.
Reasons to not use a barrier:
c. The roadway cross section elements are less severe than assumed. d. The barrier will probably cost more than assumed.
In this case a roadside barrier is recommended for the horizontal curve and not for the tangent sections. Client agency desires and budget concerns should be considered before a final decision is made.

Roadside Barrier Warrants November 2005
________________________________________________________________A-28 Sample Problems
Problem 2. This is the same as Problem 2 in Chapter 2.
Roadway data: A two-lane road, with 3.6 m (11 ft) lanes and 0.6 m (2 ft) paved shoulders. This is a flat and tangent section. The roadway approaches a bridge across a river. On the approach the road leaves a cut section with a 1V: 6H foreslope to a ditch, and then approaches the bridge on a fill with 1V: 3H side slopes. The slope break for the fill is 0.6 m (2 ft) from the edge of the shoulder. The fill is approximately 2.4 m (8 ft) high. On the far side a similar fill extends 60 m (200 ft) where the fill flattens to 1V: 4H. There are no pavement markings on the road or the bridge.
Traffic data: 1,100 present ADT with a 1 percent annual growth factor. Design speed is 70 km/h (45 mph).
Hazard data: An 8.5 m (28 ft) wide bridge crosses a river with water depths of approximately 1.5 m (5 ft). The bridge rail is a vertical concrete wall.
Other issues: This roadway is in a park with serious aesthetic concerns.
Solution:
1. Table 2.1 shows the clear zone range is 4.5 - 5.0 m (14 - 16 ft). Assuming 3.3 M (11 ft) lanes on the bridge, the bridge rail is located 1.0 m (3 ft) from the traveled way and is in the clear zone. The bridge rail on the opposing traffic side is outside the clear zone. The 1V: 3H slope is traversable but not recoverable, so the approach clear zone is (using the mid-point of the range):
a. + (3 * 2.4) = 11.9 m
or 15 + (3 * 8) = 39 ft.
The river is also in the clear zone.
2. Tables 2.3 and 2.6 indicate that both the bridge rail and the river are Category 3 hazards so a barrier should be considered.
3. The following ADT adjustment factors were obtained from Tables A.1, A.2 and A.3:
TG = 1.10 HC = 1.00 DG = 1.00

Roadside Barrier Warrants November 2005
________________________________________________________________________Sample Problems A-29
4. The Adjusted Traffic Factor (ATF) for the tangent section is:
ATF = ADT * TG * HC * DG
ATF = 1,100 * 1.10 * 1.00 * 1.00
ATF = 1,210
5. Table A.6 provides the closet description of the hazard. Interpolating between 80 km/h (50 mph) and 60 km/h (40 mph), a barrier is warranted at an ATF of at least 1,200. A barrier is recommended for the bridge rail.
Barrier is recommended for both approach sides to the bridge. Barrier is not needed on the far sides because the bridge rails are outside the opposing traffic clear zones.
Problem 3.
Roadway data: A two-lane road, with 3.6 m (11 ft) lanes and .4 m (2 ft) paved shoulders. The section being studied for roadside safety improvements is approximately 16 km (10 miles) long, with many horizontal curves of varying radii. There are no grades steeper than 2.0 percent.
Traffic data: 500 present ADT with a 1 percent annual growth factor. Design speed is 60 km/h (40 mph).
Hazard data: The primary hazards present are 1V: 1.5H side slopes from 9 m (30 ft) to 12 m (40 ft) high. The slopes are from 1.2 m (4 ft) to 2 m (6 ft) from the edge of travel way. These slopes are intermittent but occur on both sides of horizontal curves.
Warrant Issue: What curves warrant shielding with barriers?
Solution:
Table A.11 is for 1V: 2H foreslopes, 14 m (46 ft) high. The actual hazard is slightly steeper and lower than this table. Table A.11 indicates that:
Barriers are not warranted at an Adjusted Traffic Factor (ATF) below 250. Barriers are possibly warranted at ATFs from 250 to 949. Barriers are warranted at an ATF of 950 and above.
The ATF is:
ATF = Initial ADT * TG * HC * DG
ATF = 500 * 1.10 * HC * 1.00

Roadside Barrier Warrants November 2005
________________________________________________________________A-30 Sample Problems
Barriers warranted if the ATF is 950 or above. Therefore, the horizontal curve factor that will result in barriers being warranted is:
950 = 500 * 1.10 * HC * 1.00
HC = 1.73 or greater
From Table A.2 for hazards on the outside of the curve, the first HC greater than 1.73 is 2.50, for curves with a radius smaller than 440 m (1,430 ft). For hazards on the inside of the horizontal curve, the first HC greater than 1.73 is 1.75, for curves smaller than 350 m (1,150 ft).
Therefore, on this project, barriers are warranted for the following conditions:
Slopes on the outside of horizontal curves with a radius smaller than 440 m (1,430 ft).
Slopes on the inside of horizontal curves with a radius smaller than 350 m (1,150 ft).
Using the same process, barriers for 1V: 1.5H slopes at all other locations are possibly warranted on this project so should be considered.

Barrier Data Tables November 2005
APPENDIX B
BARRIER DATA TABLES

Barrier Data Tables November 2005
________________________________________________________________________Table of Contents B-i
Table of Contents
BARRIER DATA TABLES................................................................................. B-1

Barrier Data Tables November 2005
________________________________________________________________________B-ii List of Figures
List of Figures
Figure B.1: Three-Strand Cable Guardrail, G1 ................................................. B-3 Figure B.2: High Tension Cable, HTC............................................................... B-5 Figure B.3: Weak Post W-Beam, G2 ................................................................ B-7 Figure B.4: Box Beam, G3 ................................................................................ B-9 Figure B.5: Strong Post W-Beam, G4............................................................. B-11 Figure B.6: Thrie-Beam, G9............................................................................ B-13 Figure B.7: Concrete Safety Shape, CSS ....................................................... B-17Figure B.8: Steel-Backed Log Rail, SBL ......................................................... B-19Figure B.9: Steel-Backed Timber Rail, SBT.................................................... B-21Figure B.10: Precast Concrete Guardwall Type 1, PCG................................. B-23 Figure B.11: Stone Masonry Guardwall, SMG ................................................ B-25 Figure B.12: Random Rubble Cavity Wall, RCW ............................................ B-27

Barrier Data Tables November 2005
________________________________________________________________________List of Tables B-iii
List of Tables
Table B.1: Barrier Data Tables ......................................................................... B-1 Table B.2: Three-Strand Cable Guardrail, G1................................................... B-2 Table B.3: High Tension Cable, HTC................................................................ B-4 Table B.4: Weak Post W-Beam, G2.................................................................. B-6 Table B.5: Box Beam, G3 ................................................................................. B-8 Table B.6: Strong Post W-Beam, G4 .............................................................. B-10 Table B.7: Thrie-Beam, G9 ............................................................................. B-12 Table B.8: Modified Thrie-Beam, G9M............................................................ B-14 Table B.9: Concrete Safety Shape, CSS ........................................................ B-16Table B.10: Steel-Backed Log Rail, SBL ........................................................ B-18Table B.11: Steel-Backed Timber Rail, SBT ................................................... B-20Table B.12: Precast Concrete Guardwall Type 1, PCG .................................. B-22 Table B.13: Stone Masonry Guardwall, SMG ................................................. B-24 Table B.14: Random Rubble Cavity Wall, RCW ............................................. B-26


Barrier Data Tables November 2005
________________________________________________________________________Barrier Data Tables B-1
APPENDIX B BARRIER DATA TABLES
The tables contained in this appendix provide detailed data on each system that may be useful in barrier selection. Table B.1 can be used as a key to the barrier data tables.
Table B.1: Barrier Data Tables
System Designation Data Table Three – Strand Cable G1 B.2 High-Tension Cable HTC B.3 Weak Post W-Beam G2 B.4 Box Beam G3 B.5 Strong Post W-Beam G4 B.6 Thrie-Beam G9 B.7 Modified Thrie-Beam G9M B.8 Concrete Safety Shape CSS B.9 Steel-Backed Log Rail SBL B.10 Steel-Backed Timber Rail
SBT B.11
Precast Concrete Guardwall, Type 1
PCG B.12
Stone Masonry Guardwall
SMG B.13
Random Rubble Cavity Wall
RCW B.14

Barrier Data Tables November 2005
________________________________________________________________________B-2 Barrier Data Tables
Table B.2: Three-Strand Cable Guardrail, G1
Test Level: 3
Standards Reference: AASHTO Roadside Design Guide
Description: Three strands of cable are mounted on breakaway posts. Penetration of a vehicle is prevented by the tensile strength of the cable.
Metric Units
Cost Range ($ / m) Minimum Barrier – Hazard Offset (m)
Low High Speed: 30 –50 km/h 55 – 70 km/h 80 (+) km/h
$20.00 $26.00 Deflection 1.1 * 2.3 * 3.5
System Depth 0.2 0.2 0.2
Total 1.3 2.5 3.7
Beam Description: 19 mm diameter steel cables.
Post Description: S75 x 8.5 steel, 1600 mm long at 5000 mm spacing 9 kg/m steel u-channel, 1525 mm long at 5000 mm spacing 140 mm diameter wood, 1830 mm long at 3800 mm spacing
Compatibility: A terminal is available. Although transitions are difficult, one is available.
* Estimated values
U.S. Customary Units
Cost Range ($ / ft) Minimum Barrier – Hazard Offset (ft)
Low High Speed: 20 – 30 mph 35 – 45 mph 50 (+) mph
$6.00 $8.00 Deflection 3.5 * 7.5 * 11.5
System Depth 0.5 0.5 0.5
Total 4 * 8 * 12
Beam Description: ¾ inch diameter steel cables.
Post Description: S3 x 5.7 steel, 5 ft-3 inch long at 16 ft spacing 4 lb/ft steel u-channel, 5 ft long at 16 ft spacing 5 ½ inch diameter wood, 6 ft long at 11 ft-6 inch spacing
Compatibility: A terminal is available. Although transitions are difficult, one is available.
* Estimated values
Notes: Weathering steel posts are available. Reduced post spacing is recommended for tight curves (3.8 m spacing for radii up to 135 m and 4.9 m for radii up to 220 m) (12 ft spacing for radii up to 440 ft and 16 ft for radii up to 720 ft). Closer post spacing can reduce lateral deflection to some extent.
Potential Benefits: Low cost, very little rebound of impacting vehicles, no drifting of snow, no view obstruction.
Potential Problems: Even minor impacts can cause maintenance problems, the high deflections limit application, spare parts must be available and crews trained in repair and maintenance.
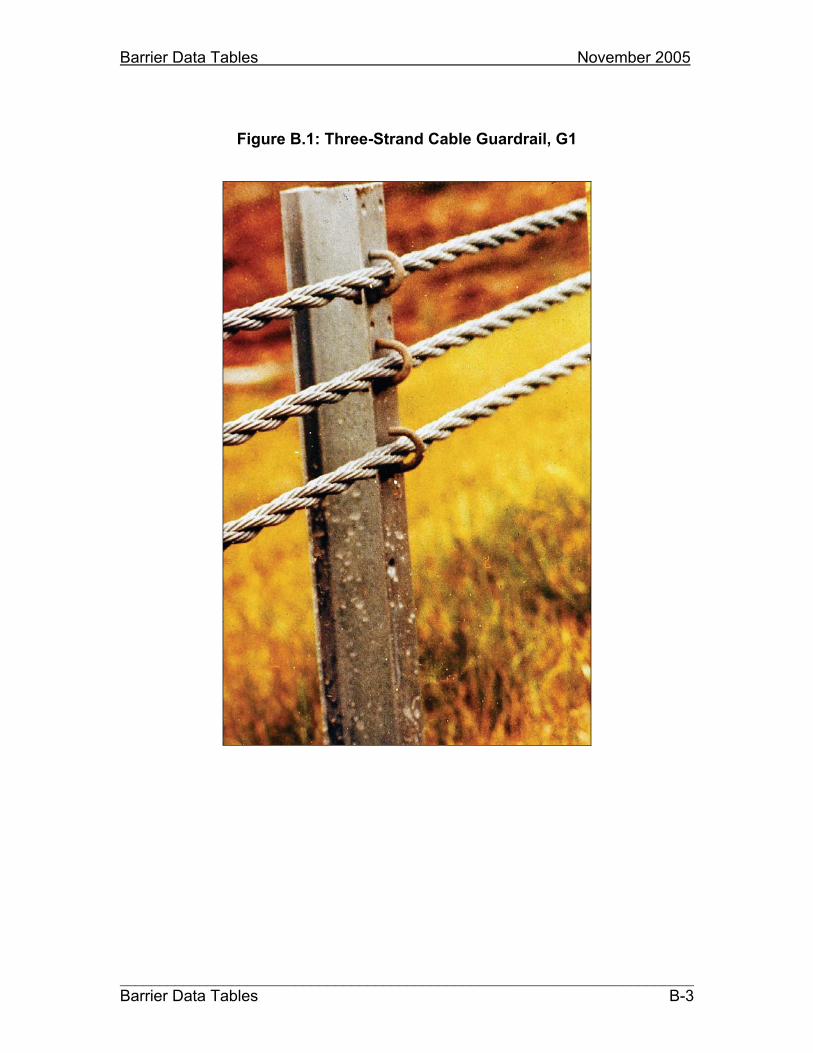
Barrier Data Tables November 2005
________________________________________________________________________Barrier Data Tables B-3
Figure B.1: Three-Strand Cable Guardrail, G1
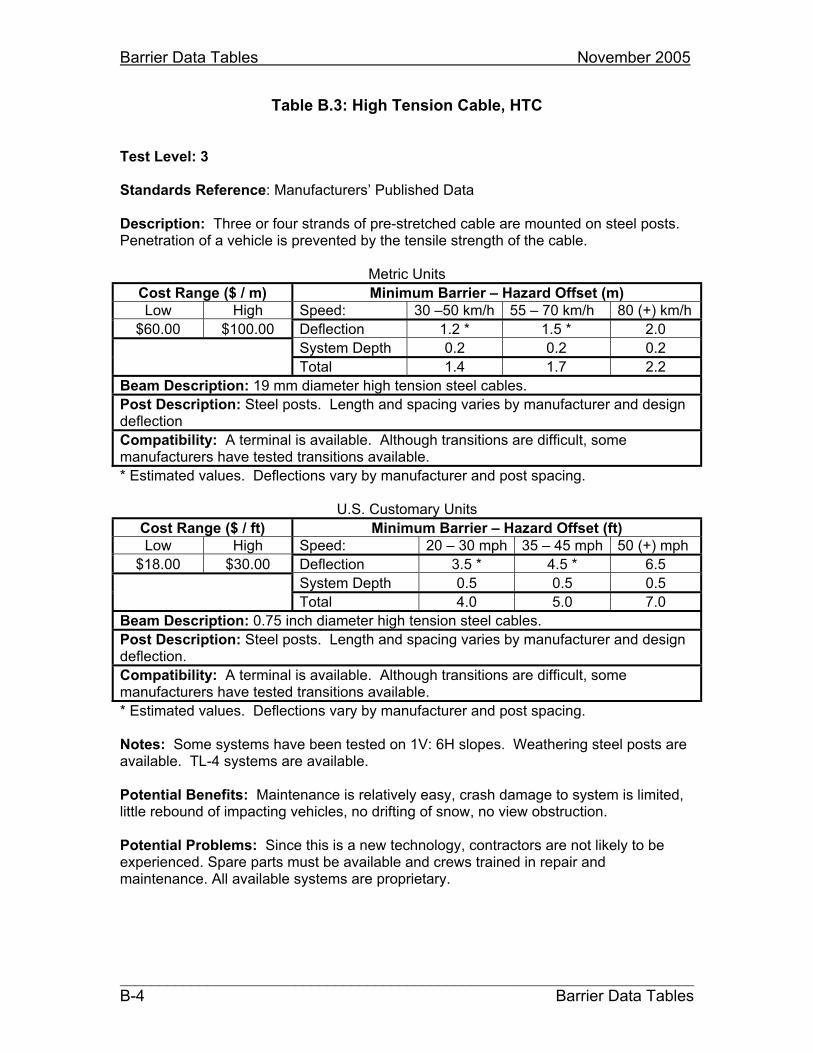
Barrier Data Tables November 2005
________________________________________________________________________B-4 Barrier Data Tables
Table B.3: High Tension Cable, HTC
Test Level: 3
Standards Reference: Manufacturers’ Published Data
Description: Three or four strands of pre-stretched cable are mounted on steel posts. Penetration of a vehicle is prevented by the tensile strength of the cable.
Metric Units
Cost Range ($ / m) Minimum Barrier – Hazard Offset (m) Low High Speed: 30 –50 km/h 55 – 70 km/h 80 (+) km/h
$60.00 $100.00 Deflection 1.2 * 1.5 * 2.0
System Depth 0.2 0.2 0.2
Total 1.4 1.7 2.2
Beam Description: 19 mm diameter high tension steel cables.
Post Description: Steel posts. Length and spacing varies by manufacturer and design deflection
Compatibility: A terminal is available. Although transitions are difficult, some manufacturers have tested transitions available.
* Estimated values. Deflections vary by manufacturer and post spacing.
U.S. Customary Units
Cost Range ($ / ft) Minimum Barrier – Hazard Offset (ft) Low High Speed: 20 – 30 mph 35 – 45 mph 50 (+) mph
$18.00 $30.00 Deflection 3.5 * 4.5 * 6.5
System Depth 0.5 0.5 0.5
Total 4.0 5.0 7.0
Beam Description: 0.75 inch diameter high tension steel cables.
Post Description: Steel posts. Length and spacing varies by manufacturer and design deflection.
Compatibility: A terminal is available. Although transitions are difficult, some manufacturers have tested transitions available.
* Estimated values. Deflections vary by manufacturer and post spacing.
Notes: Some systems have been tested on 1V: 6H slopes. Weathering steel posts are available. TL-4 systems are available.
Potential Benefits: Maintenance is relatively easy, crash damage to system is limited, little rebound of impacting vehicles, no drifting of snow, no view obstruction.
Potential Problems: Since this is a new technology, contractors are not likely to be experienced. Spare parts must be available and crews trained in repair and maintenance. All available systems are proprietary.
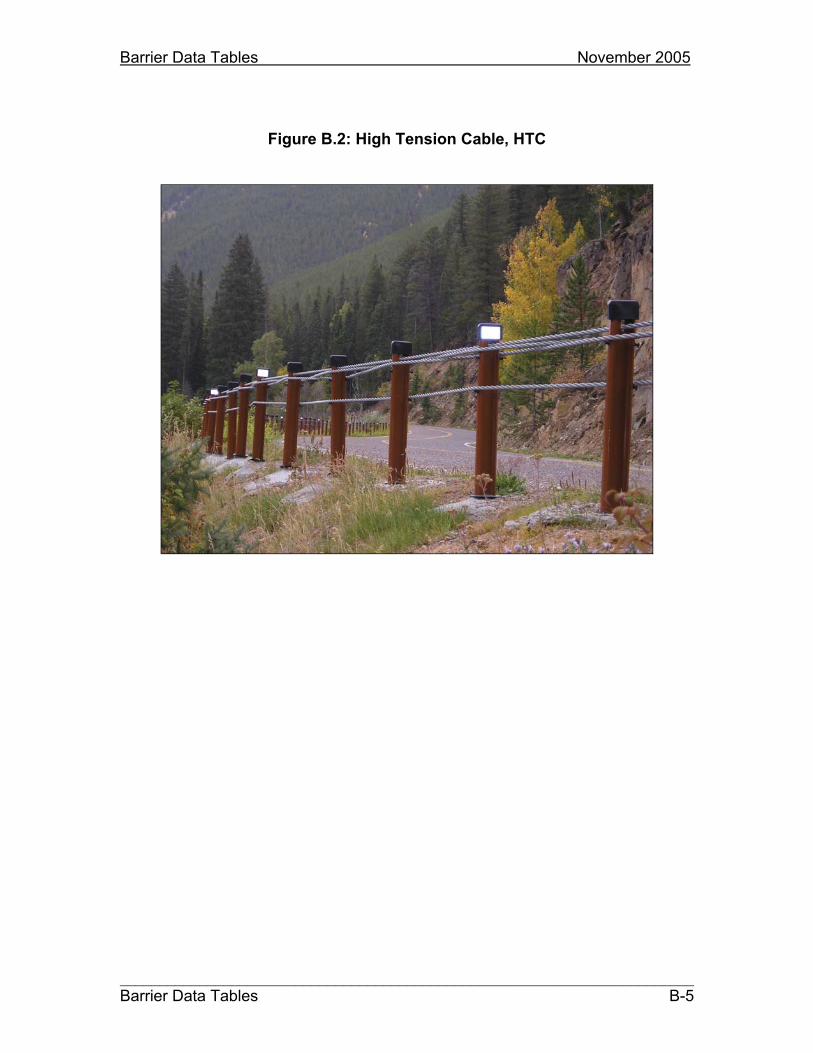
Barrier Data Tables November 2005
________________________________________________________________________Barrier Data Tables B-5
Figure B.2: High Tension Cable, HTC
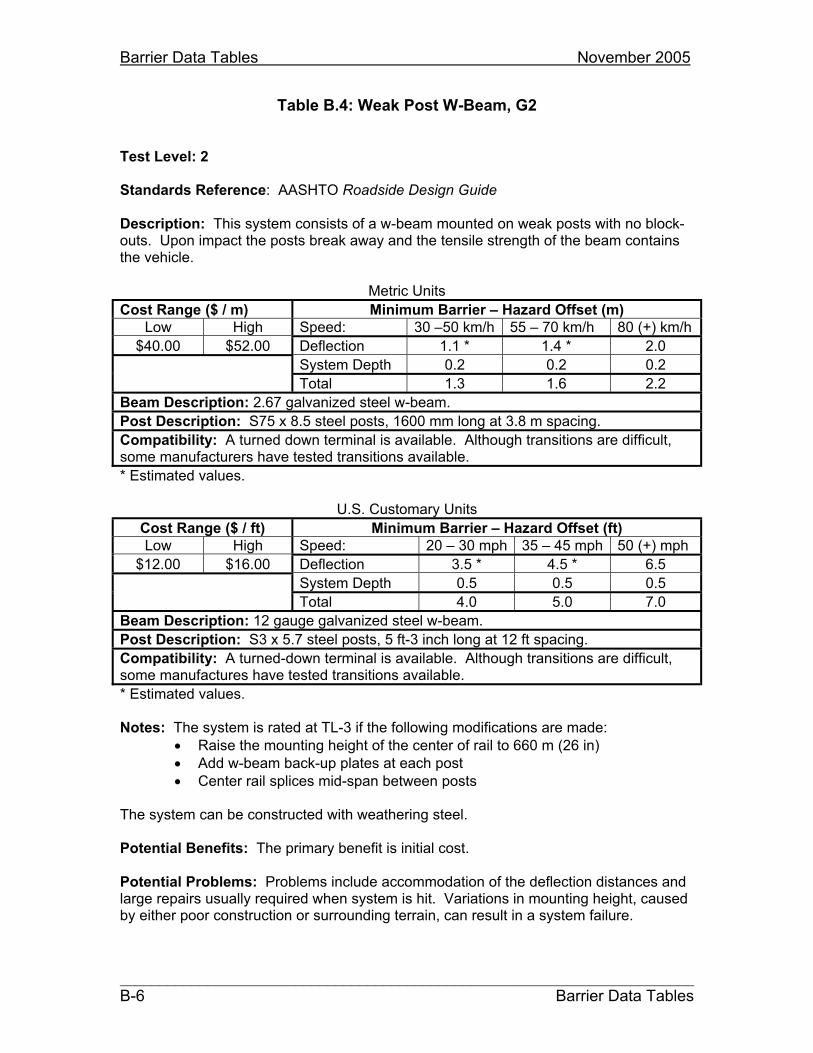
Barrier Data Tables November 2005
________________________________________________________________________B-6 Barrier Data Tables
Table B.4: Weak Post W-Beam, G2
Test Level: 2
Standards Reference: AASHTO Roadside Design Guide
Description: This system consists of a w-beam mounted on weak posts with no block-outs. Upon impact the posts break away and the tensile strength of the beam contains the vehicle.
Metric Units
Cost Range ($ / m) Minimum Barrier – Hazard Offset (m) Low High Speed: 30 –50 km/h 55 – 70 km/h 80 (+) km/h
$40.00 $52.00 Deflection 1.1 * 1.4 * 2.0
System Depth 0.2 0.2 0.2
Total 1.3 1.6 2.2
Beam Description: 2.67 galvanized steel w-beam.
Post Description: S75 x 8.5 steel posts, 1600 mm long at 3.8 m spacing.
Compatibility: A turned down terminal is available. Although transitions are difficult, some manufacturers have tested transitions available.
* Estimated values.
U.S. Customary Units
Cost Range ($ / ft) Minimum Barrier – Hazard Offset (ft) Low High Speed: 20 – 30 mph 35 – 45 mph 50 (+) mph
$12.00 $16.00 Deflection 3.5 * 4.5 * 6.5
System Depth 0.5 0.5 0.5
Total 4.0 5.0 7.0
Beam Description: 12 gauge galvanized steel w-beam.
Post Description: S3 x 5.7 steel posts, 5 ft-3 inch long at 12 ft spacing.
Compatibility: A turned-down terminal is available. Although transitions are difficult, some manufactures have tested transitions available.
* Estimated values.
Notes: The system is rated at TL-3 if the following modifications are made: Raise the mounting height of the center of rail to 660 m (26 in) Add w-beam back-up plates at each post Center rail splices mid-span between posts
The system can be constructed with weathering steel.
Potential Benefits: The primary benefit is initial cost.
Potential Problems: Problems include accommodation of the deflection distances and large repairs usually required when system is hit. Variations in mounting height, caused by either poor construction or surrounding terrain, can result in a system failure.

Barrier Data Tables November 2005
________________________________________________________________________Barrier Data Tables B-7
Figure B.3: Weak Post W-Beam, G2
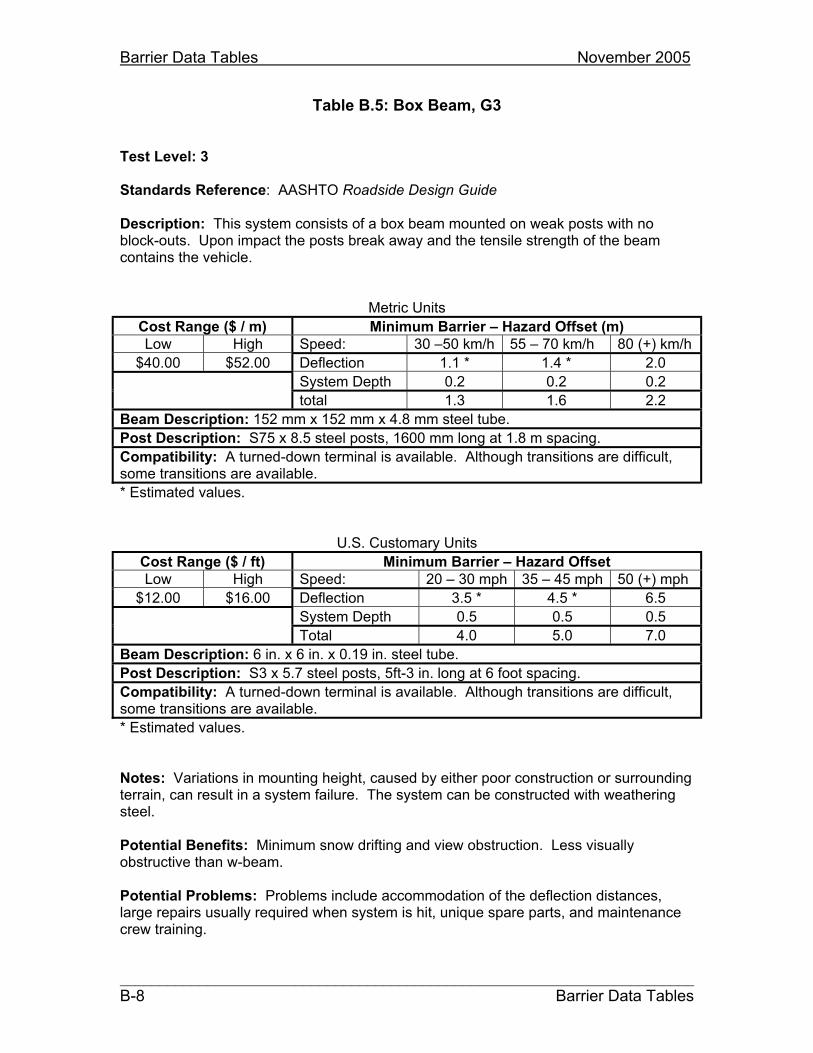
Barrier Data Tables November 2005
________________________________________________________________________B-8 Barrier Data Tables
Table B.5: Box Beam, G3
Test Level: 3
Standards Reference: AASHTO Roadside Design Guide
Description: This system consists of a box beam mounted on weak posts with no block-outs. Upon impact the posts break away and the tensile strength of the beam contains the vehicle.
Metric Units
Cost Range ($ / m) Minimum Barrier – Hazard Offset (m) Low High Speed: 30 –50 km/h 55 – 70 km/h 80 (+) km/h
$40.00 $52.00 Deflection 1.1 * 1.4 * 2.0
System Depth 0.2 0.2 0.2
total 1.3 1.6 2.2
Beam Description: 152 mm x 152 mm x 4.8 mm steel tube.
Post Description: S75 x 8.5 steel posts, 1600 mm long at 1.8 m spacing.
Compatibility: A turned-down terminal is available. Although transitions are difficult, some transitions are available.
* Estimated values.
U.S. Customary Units
Cost Range ($ / ft) Minimum Barrier – Hazard Offset Low High Speed: 20 – 30 mph 35 – 45 mph 50 (+) mph
$12.00 $16.00 Deflection 3.5 * 4.5 * 6.5
System Depth 0.5 0.5 0.5
Total 4.0 5.0 7.0
Beam Description: 6 in. x 6 in. x 0.19 in. steel tube.
Post Description: S3 x 5.7 steel posts, 5ft-3 in. long at 6 foot spacing.
Compatibility: A turned-down terminal is available. Although transitions are difficult, some transitions are available.
* Estimated values.
Notes: Variations in mounting height, caused by either poor construction or surrounding terrain, can result in a system failure. The system can be constructed with weathering steel.
Potential Benefits: Minimum snow drifting and view obstruction. Less visually obstructive than w-beam.
Potential Problems: Problems include accommodation of the deflection distances, large repairs usually required when system is hit, unique spare parts, and maintenance crew training.
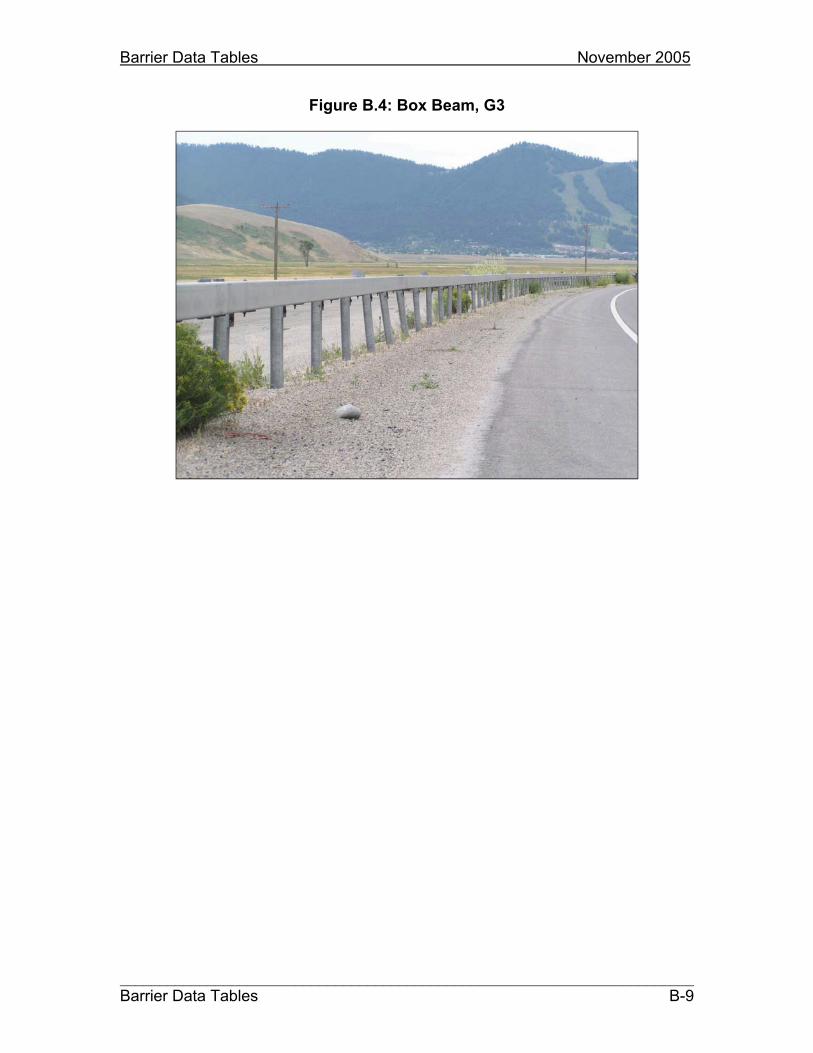
Barrier Data Tables November 2005
________________________________________________________________________Barrier Data Tables B-9
Figure B.4: Box Beam, G3

Barrier Data Tables November 2005
________________________________________________________________________B-10 Barrier Data Tables
Table B.6: Strong Post W-Beam, G4
Test Level: 3
Standards Reference: RDG, M617-10 and M617-11
Description: The strong post w-beam is the most commonly used roadside barrier. It has proven effective in a wide range of conditions. The strong posts serve to limit deflection. Block-outs are necessary to prevent wheel snags on the non-breakaway posts.
Metric Units
Cost Range ($ / m) Minimum Barrier – Hazard Offset (m) Low High Speed: 30 –50 km/h 55 – 70 km/h 80 (+) km/h
$52.00 $82.00 Deflection 0.2* 0.6 * 1.0
System Depth 0.2 0.2 0.2
Total 0.4 0.8 1.2
Beam Description: 2.67 galvanized steel w-beam.
Post Description: Wood posts can be either 200 mm square, 200 mm deep by 150 mm wide or 180 mm in diameter, with a minimum length of 1620 mm. W150 x 13.5 steel posts with a minimum length of 1780 mm can also be used. In either case, block-outs are required. Block-outs may be either wood or recycled plastic. If steel block-outs are used, the system becomes TL-2. Standard post spacing is 1905 mm.
Compatibility: Several terminals and transitions are available
* Estimated values.
U.S. Customary Units
Cost Range ($ / ft) Minimum Barrier – Hazard Offset Low High Speed: 20 – 30 mph 35 – 45 mph 50 (+) mph
$16.00 $25.00 Deflection (ft): 1.0 * 2.0 * 3.0
1 1.0 1.0 1.0
2.0 3.0 4.0
Beam Description: 12 gauge galvanized steel w-beam.
Post Description: Wood posts can be either 8 inches square, 8 inches deep by 6 inches wide or 7 inches in diameter, with a minimum length of 5 ft-5 in. 6 x 9 steel posts with a minimum length of 5 ft-11 in. can also be used. In either case, block-outs are required. Block-outs may be either wood or recycled plastic. If steel block-outs are used the system becomes TL-2. Standard post spacing is 6 ft-3 in.
Compatibility: Several terminals and transitions are available
* Estimated values
Notes: There are several options available to reduce the deflection characteristics including reducing the post spacing by fifty percent, nesting w-beams, using a rub rail mounted on the posts below the block-outs, and increasing the embedment of the posts by up to 0.3 meters (1 ft). The system can be constructed with weathering steel.
Potential Benefits: This system is commonly used. Damage as a result of crashes is usually limited. Although severe hits can destroy the system, it is not uncommon for the system to remain serviceable after several crashes.

Barrier Data Tables November 2005
________________________________________________________________________Barrier Data Tables B-11
Potential Problems: Aesthetics of the system may be a problem, although the wood posts with weathering steel do provide an attractive alternative. May obstruct views somewhat and drift snow.
Figure B.5: Strong Post W-Beam, G4

Barrier Data Tables November 2005
________________________________________________________________________B-12 Barrier Data Tables
Table B.7: Thrie-Beam, G9
Test Level: 3
Standards Reference: AASHTO Roadside Design Guide
Description: This system is very similar to the strong post w-beam, with the extra depth of the thrie-beam.
Metric Units
Cost Range ($ / m) Minimum Barrier – Hazard Offset (m) Low High Speed: 30 –50 km/h 55 – 70 km/h 80 (+) km/h
$72.00 $100.00 Deflection 0.2 * 0.2 * 0.7
System Depth 0.3 0.3 0.3
Total 0.5 0.5 1.0
Beam Description: 2.67 galvanized steel thrie-beam.
Post Description: Two types of posts are available. Wood posts are 200 mm deep by 150 mm wide and 1980 mm long. W150 x 13.5 steel posts, 1980 mm long can also be used. In either case, block-outs are required. Block-outs may be either wood or recycled plastic. Standard post spacing is 1905 mm.
Compatibility: A manufactured transition to standard w-beam must be used, then a w-beam terminal. A transition to a rigid system is available.
* Estimated values.
U.S. Customary Units
Cost Range ($ / ft) Minimum Barrier – Hazard Offset (ft) Low High Speed: 20 – 30 mph 35 – 45 mph 50 (+) mph
$22.00 $30.00 Deflection 1 * 1 * 2
System Depth 1 1 1
Total 2 2 3
Beam Description: 12 gage steel thrie-beam
Post Description: W6 x 9 steel, 6 ft-6 in. long or 6 in. x 8 in. wood, 6 ft-6 in. long. In either case, block-outs are required. Block-outs may be either wood or recycled plastic. Standard post spacing is 6 ft-3 in.
Compatibility: A manufactured transition to standard w-beam must be used, then a w-beam terminal. A transition to a rigid system is available.
* Estimated values.
Notes: If steel posts and steel block-outs are used, the system is TL-2. The system can be constructed with weathering steel.
Potential Benefits: Minimum sensitivity to variations in height, small deflections provide design flexibility.
Potential Problems: Obstruction of views, drifting of snow, cost and unique spare parts.
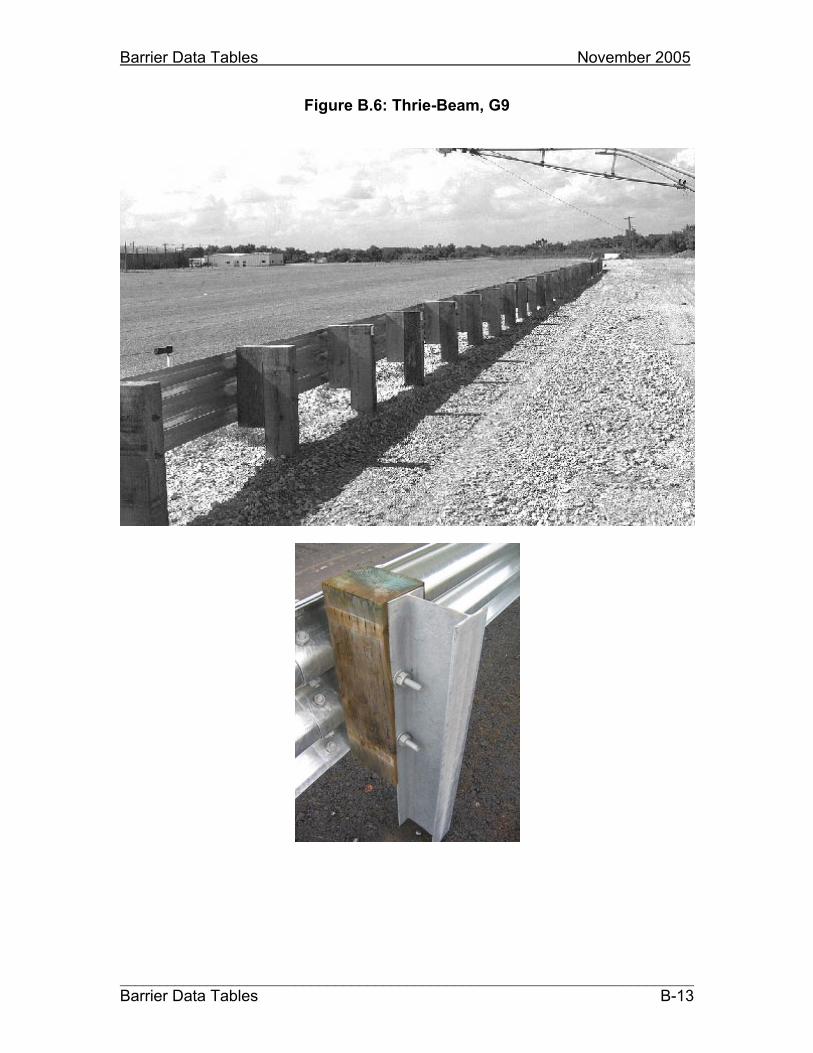
Barrier Data Tables November 2005
________________________________________________________________________Barrier Data Tables B-13
Figure B.6: Thrie-Beam, G9
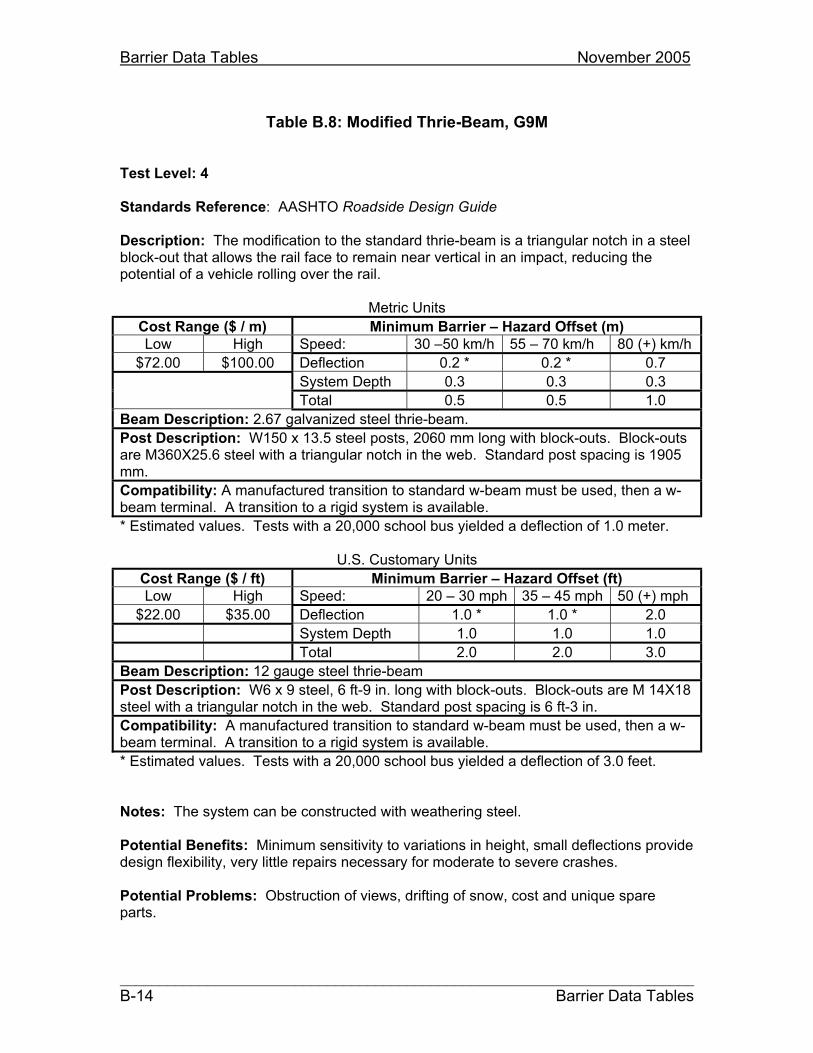
Barrier Data Tables November 2005
________________________________________________________________________B-14 Barrier Data Tables
Table B.8: Modified Thrie-Beam, G9M
Test Level: 4
Standards Reference: AASHTO Roadside Design Guide
Description: The modification to the standard thrie-beam is a triangular notch in a steel block-out that allows the rail face to remain near vertical in an impact, reducing the potential of a vehicle rolling over the rail.
Metric Units
Cost Range ($ / m) Minimum Barrier – Hazard Offset (m) Low High Speed: 30 –50 km/h 55 – 70 km/h 80 (+) km/h
$72.00 $100.00 Deflection 0.2 * 0.2 * 0.7
System Depth 0.3 0.3 0.3
Total 0.5 0.5 1.0
Beam Description: 2.67 galvanized steel thrie-beam.
Post Description: W150 x 13.5 steel posts, 2060 mm long with block-outs. Block-outs are M360X25.6 steel with a triangular notch in the web. Standard post spacing is 1905 mm.
Compatibility: A manufactured transition to standard w-beam must be used, then a w-beam terminal. A transition to a rigid system is available.
* Estimated values. Tests with a 20,000 school bus yielded a deflection of 1.0 meter.
U.S. Customary Units
Cost Range ($ / ft) Minimum Barrier – Hazard Offset (ft) Low High Speed: 20 – 30 mph 35 – 45 mph 50 (+) mph
$22.00 $35.00 Deflection 1.0 * 1.0 * 2.0
System Depth 1.0 1.0 1.0
Total 2.0 2.0 3.0
Beam Description: 12 gauge steel thrie-beam
Post Description: W6 x 9 steel, 6 ft-9 in. long with block-outs. Block-outs are M 14X18 steel with a triangular notch in the web. Standard post spacing is 6 ft-3 in.
Compatibility: A manufactured transition to standard w-beam must be used, then a w-beam terminal. A transition to a rigid system is available.
* Estimated values. Tests with a 20,000 school bus yielded a deflection of 3.0 feet.
Notes: The system can be constructed with weathering steel.
Potential Benefits: Minimum sensitivity to variations in height, small deflections provide design flexibility, very little repairs necessary for moderate to severe crashes.
Potential Problems: Obstruction of views, drifting of snow, cost and unique spare parts.

Barrier Data Tables November 2005
________________________________________________________________________Barrier Data Tables B-15
This page left blank intentionally

Barrier Data Tables November 2005
________________________________________________________________________B-16 Barrier Data Tables
Table B.9: Concrete Safety Shape, CSS
Test Level: 4
Standards Reference: AASHTO Roadside Design Guide
Description: Rigid concrete barrier. Impacting vehicles tend to ride up on the lower slope, dissipating some of the energy of the crash and thus reducing the rebound that might occur. This system is normally used as a median barrier but can be used in a single-face configuration on the roadside.
Metric Units
Cost Range ($ / m) Minimum Barrier – Hazard Offset (m) Low High Speed: 30 –50 km/h 55 – 70 km/h 80 (+) km/h
$260.00 $360.00 Deflection 0.0 0.0 0.0
System Depth 0.6 0.6 0.6
Total 0.6 0.6 0.6
Beam Description: The New Jersey shape has a lower slope of 550, breaking to 840
255 mm above the vertical reveal. The “F” shape is similar, breaking at 180 mm.
Post Description: N/A
Compatibility: Crash cushions or transitions to a strong post W-beam with a crashworthy end treatment are commonly used as terminals. Transitions to other systems are available.
U.S. Customary Units
Cost Range ($ / ft) Minimum Barrier – Hazard Offset (ft) Low High Speed: 20 – 30 mph 35 – 45 mph 50 (+) mph
$80.00 $110.00 Deflection 0.0 0.0 0.0
System Depth 2.0 2.0 2.0
Total 2.0 2.0 2.0
Beam Description: The New Jersey shape has a lower slope of 550, breaking to 840 10inches above the vertical reveal. The “F” shape is similar, breaking at 7 inches.
Post Description: N/A
Compatibility: Crash cushions or transitions to a strong post W-beam with a crashworthy end treatment are commonly used as terminals. Transitions to other systems are available.
Notes: The “F” shape is preferred because vehicle lift and roll is less pronounced than with the New Jersey shape. The CSS should not be used with a curb, since placing this system on a curb prevents an impacting vehicle from riding up the lower slope as designed. Textured designs are available to improve the aesthetics of the system.
Potential Benefits: Many situations require that the barrier have no deflection and/or a higher test level. No repair is necessary on most impacts.
Potential Problems: Initial cost, obstruction of views, drifting and storage of snow and pavement drainage.

Barrier Data Tables November 2005
________________________________________________________________________Barrier Data Tables B-17
Figure B.7: Concrete Safety Shape, CSS
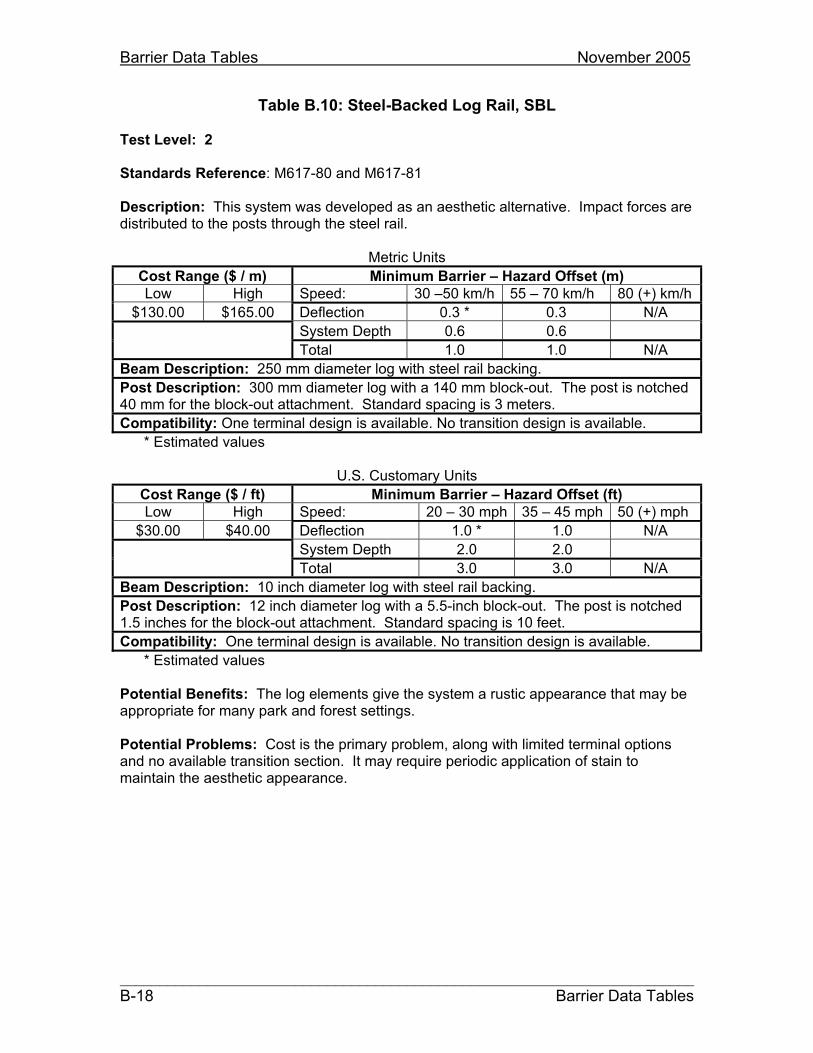
Barrier Data Tables November 2005
________________________________________________________________________B-18 Barrier Data Tables
Table B.10: Steel-Backed Log Rail, SBL
Test Level: 2
Standards Reference: M617-80 and M617-81
Description: This system was developed as an aesthetic alternative. Impact forces are distributed to the posts through the steel rail.
Metric Units
Cost Range ($ / m) Minimum Barrier – Hazard Offset (m) Low High Speed: 30 –50 km/h 55 – 70 km/h 80 (+) km/h
$130.00 $165.00 Deflection 0.3 * 0.3 N/A
System Depth 0.6 0.6
Total 1.0 1.0 N/A
Beam Description: 250 mm diameter log with steel rail backing.
Post Description: 300 mm diameter log with a 140 mm block-out. The post is notched 40 mm for the block-out attachment. Standard spacing is 3 meters.
Compatibility: One terminal design is available. No transition design is available.
* Estimated values
U.S. Customary Units
Cost Range ($ / ft) Minimum Barrier – Hazard Offset (ft) Low High Speed: 20 – 30 mph 35 – 45 mph 50 (+) mph
$30.00 $40.00 Deflection 1.0 * 1.0 N/A
System Depth 2.0 2.0
Total 3.0 3.0 N/A
Beam Description: 10 inch diameter log with steel rail backing.
Post Description: 12 inch diameter log with a 5.5-inch block-out. The post is notched 1.5 inches for the block-out attachment. Standard spacing is 10 feet.
Compatibility: One terminal design is available. No transition design is available.
* Estimated values
Potential Benefits: The log elements give the system a rustic appearance that may be appropriate for many park and forest settings.
Potential Problems: Cost is the primary problem, along with limited terminal options and no available transition section. It may require periodic application of stain to maintain the aesthetic appearance.
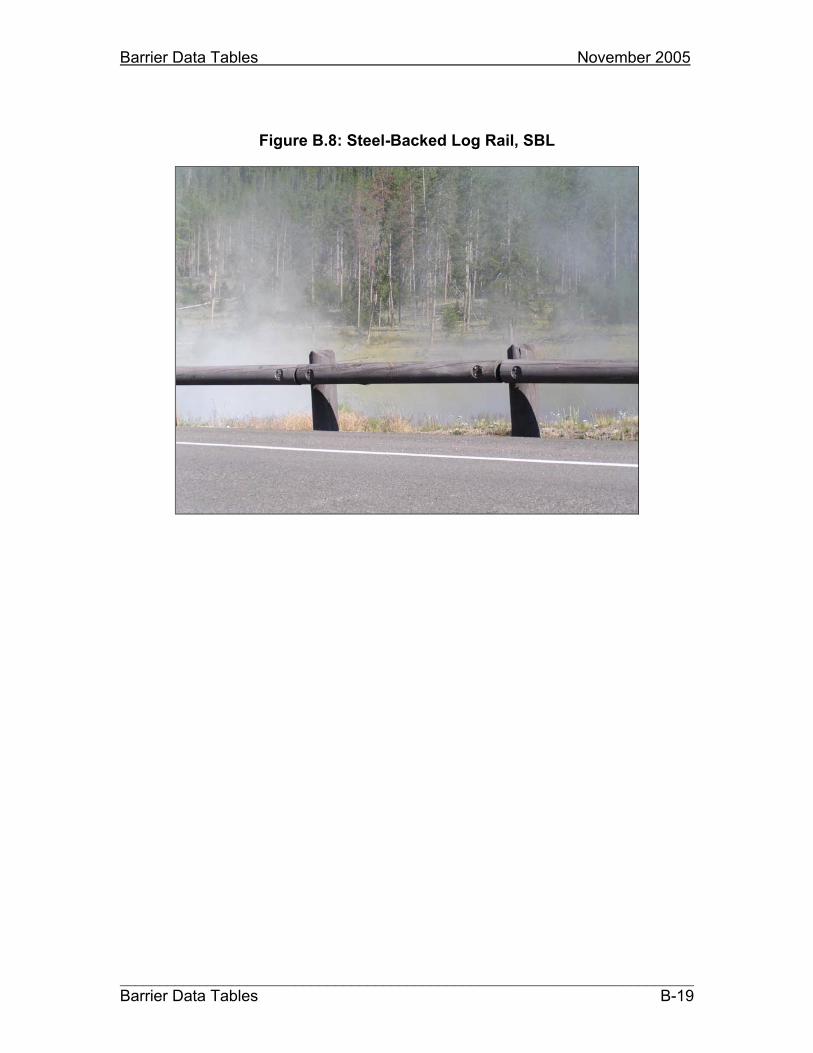
Barrier Data Tables November 2005
________________________________________________________________________Barrier Data Tables B-19
Figure B.8: Steel-Backed Log Rail, SBL

Barrier Data Tables November 2005
________________________________________________________________________B-20 Barrier Data Tables
Table B.11: Steel-Backed Timber Rail, SBT
Test Level: 3
Standards Reference: M617-60
Description: This system was developed as an aesthetic alternative. Impact forces are distributed to the posts through the weathering steel plate.
Metric Units
Cost Range ($ / m) Minimum Barrier – Hazard Offset (m) Low High Speed: 30 –50 km/h 55 – 70 km/h 80 (+) km/h
$165.00 $230.00 Deflection 0.2 * 0.2 * 0.6
System Depth 0.6 0.6 0.6
Total 0.8 0.8 1.2
Beam Description: 150 x 250 mm timber with steel plate backing.
Post Description: 250 x 300 x 2.1 m rough sawn timber with a 100mm block-out. Standard spacing is 3 m.
Compatibility: Two terminal designs are available and transitions designs are available.
U.S. Customary Units
Cost Range ($ / ft) Minimum Barrier – Hazard Offset (ft) Low High Speed: 20 – 30 mph 35 – 45 mph 50 (+) mph
$50.00 $70.00 Deflection 1.0 * 1.0 2.0
System Depth 2.0 2.0 2.0
Total 3.0 3.0 4.0
Beam Description: 6 in. X 10 in. timber with steel plate backing.
Post Description: 10 in. X 12 in. X 7 ft rough sawn timber with a 4-inch block-out. Standard spacing is 10 feet.
Compatibility: Two terminal designs are available and transition designs are available.
* Estimated values
Notes: Type A includes the block-out described above. If the 100 mm (4 in) block-out is not provided (Type B), the system is rated as Test Level 2.
Potential Benefits: The timber and weathering steel elements give the system a rustic appearance that may be appropriate for many park and forest settings.
Potential Problems: Cost is the primary problem, along with limited terminal options. It may require periodic application of stain to maintain the aesthetic appearance.

Barrier Data Tables November 2005
________________________________________________________________________Barrier Data Tables B-21
Figure B.9: Steel-Backed Timber Rail, SBT
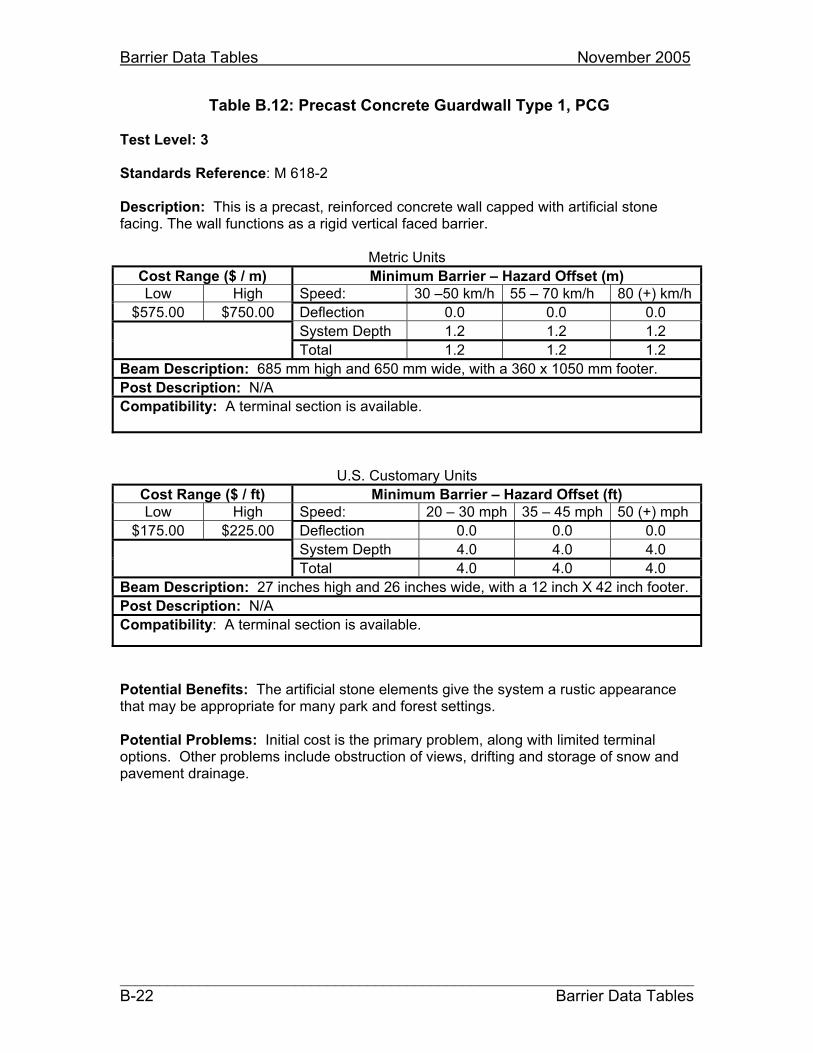
Barrier Data Tables November 2005
________________________________________________________________________B-22 Barrier Data Tables
Table B.12: Precast Concrete Guardwall Type 1, PCG
Test Level: 3
Standards Reference: M 618-2
Description: This is a precast, reinforced concrete wall capped with artificial stone facing. The wall functions as a rigid vertical faced barrier.
Metric Units
Cost Range ($ / m) Minimum Barrier – Hazard Offset (m) Low High Speed: 30 –50 km/h 55 – 70 km/h 80 (+) km/h
$575.00 $750.00 Deflection 0.0 0.0 0.0
System Depth 1.2 1.2 1.2
Total 1.2 1.2 1.2
Beam Description: 685 mm high and 650 mm wide, with a 360 x 1050 mm footer.
Post Description: N/A
Compatibility: A terminal section is available.
U.S. Customary Units
Cost Range ($ / ft) Minimum Barrier – Hazard Offset (ft) Low High Speed: 20 – 30 mph 35 – 45 mph 50 (+) mph
$175.00 $225.00 Deflection 0.0 0.0 0.0
System Depth 4.0 4.0 4.0
Total 4.0 4.0 4.0
Beam Description: 27 inches high and 26 inches wide, with a 12 inch X 42 inch footer.
Post Description: N/A
Compatibility: A terminal section is available.
Potential Benefits: The artificial stone elements give the system a rustic appearance that may be appropriate for many park and forest settings.
Potential Problems: Initial cost is the primary problem, along with limited terminal options. Other problems include obstruction of views, drifting and storage of snow and pavement drainage.
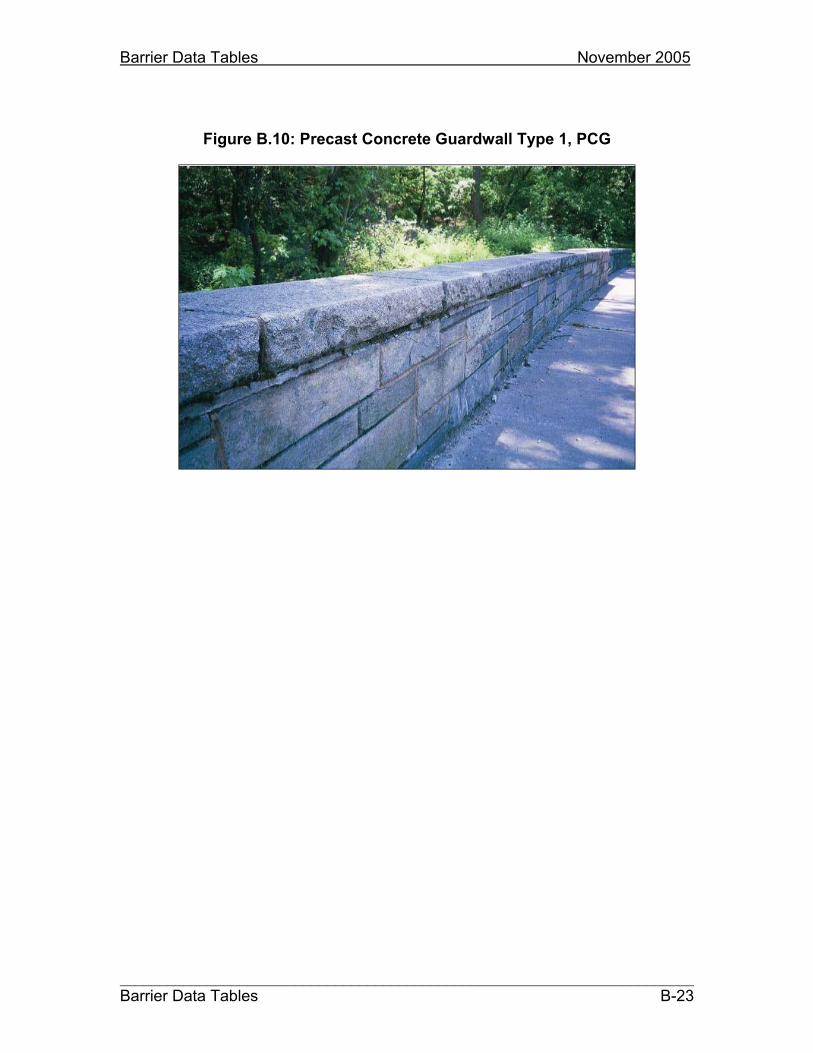
Barrier Data Tables November 2005
________________________________________________________________________Barrier Data Tables B-23
Figure B.10: Precast Concrete Guardwall Type 1, PCG
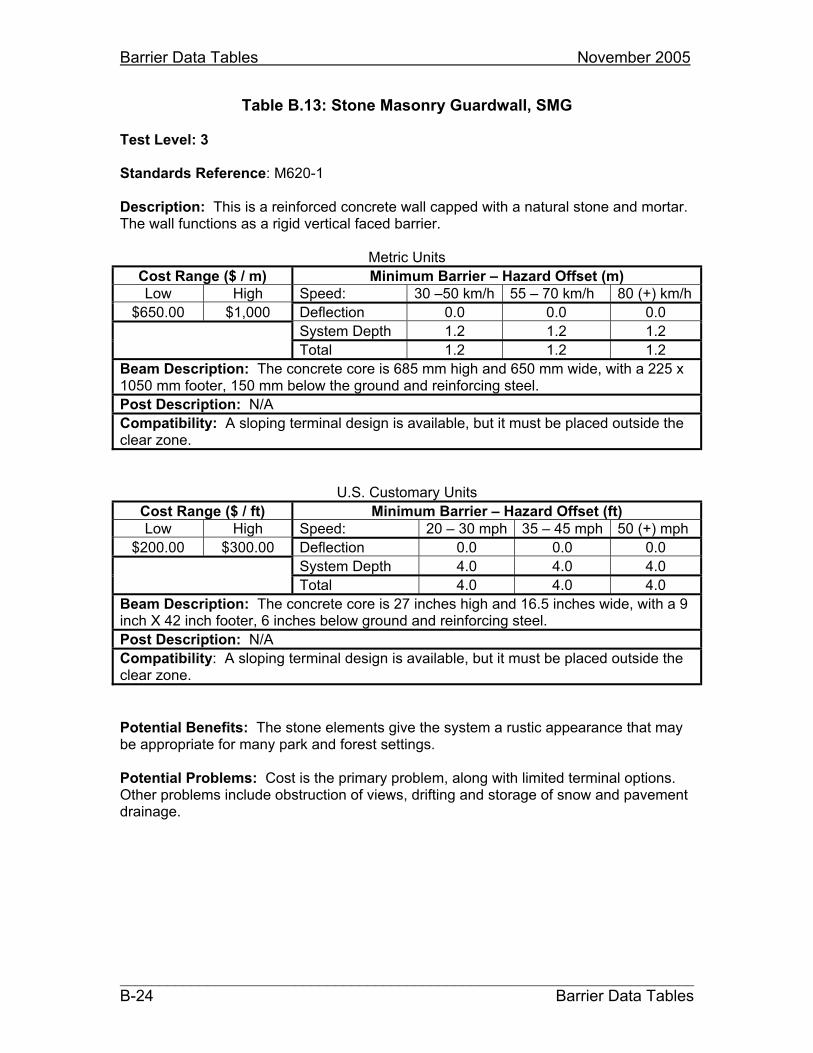
Barrier Data Tables November 2005
________________________________________________________________________B-24 Barrier Data Tables
Table B.13: Stone Masonry Guardwall, SMG
Test Level: 3
Standards Reference: M620-1
Description: This is a reinforced concrete wall capped with a natural stone and mortar. The wall functions as a rigid vertical faced barrier.
Metric Units
Cost Range ($ / m) Minimum Barrier – Hazard Offset (m) Low High Speed: 30 –50 km/h 55 – 70 km/h 80 (+) km/h
$650.00 $1,000 Deflection 0.0 0.0 0.0
System Depth 1.2 1.2 1.2
Total 1.2 1.2 1.2
Beam Description: The concrete core is 685 mm high and 650 mm wide, with a 225 x 1050 mm footer, 150 mm below the ground and reinforcing steel.
Post Description: N/A
Compatibility: A sloping terminal design is available, but it must be placed outside the clear zone.
U.S. Customary Units
Cost Range ($ / ft) Minimum Barrier – Hazard Offset (ft) Low High Speed: 20 – 30 mph 35 – 45 mph 50 (+) mph
$200.00 $300.00 Deflection 0.0 0.0 0.0
System Depth 4.0 4.0 4.0
Total 4.0 4.0 4.0
Beam Description: The concrete core is 27 inches high and 16.5 inches wide, with a 9 inch X 42 inch footer, 6 inches below ground and reinforcing steel.
Post Description: N/A
Compatibility: A sloping terminal design is available, but it must be placed outside the clear zone.
Potential Benefits: The stone elements give the system a rustic appearance that may be appropriate for many park and forest settings.
Potential Problems: Cost is the primary problem, along with limited terminal options. Other problems include obstruction of views, drifting and storage of snow and pavement drainage.
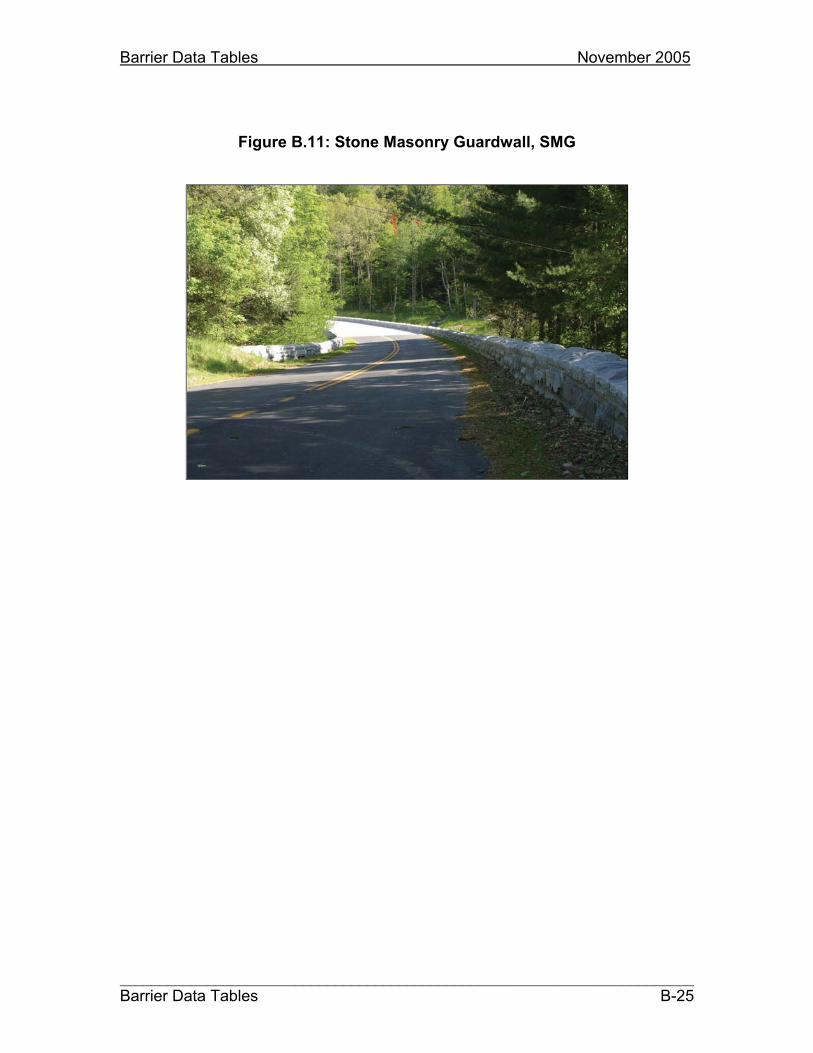
Barrier Data Tables November 2005
________________________________________________________________________Barrier Data Tables B-25
Figure B.11: Stone Masonry Guardwall, SMG

Barrier Data Tables November 2005
________________________________________________________________________B-26 Barrier Data Tables
Table B.14: Random Rubble Cavity Wall, RCW
Test Level: 1
Standards Reference: Park Service Drawings
Description: This is a reinforced concrete wall capped with a natural stone and mortar. The wall functions as a rigid vertical faced barrier.
Metric Units
Cost Range ($ / m) Minimum Barrier – Hazard Offset (m) Low High Speed: 30 –50 km/h 55 – 70 km/h 80 (+) km/h
$500 $750 Deflection 0.0
System Depth 0.6
Total 0.6
Beam Description: 685 mm high with a core wall height of 510 mm above grade and a width of 600 mm. The steel reinforced concrete footing is 225 mm by 1050 mm, 150 mm below ground level.
Post Description: N/A
Compatibility: A terminal can be constructed by flaring the barrier to beyond the clear zone.
U.S. Customary Units
Cost Range ($ / m) Minimum Barrier – Hazard Offset (ft) Low High Speed: 20 – 30 mph 35 – 45 mph 50 (+) mph
$150 $225 Deflection 0
System Depth 2
Total 2
Beam Description: 27 in high with a core wall height of 20 in above grade and a width of 24 in. The steel reinforced concrete footing is 9 in by42 in, 6 in below ground level.
Post Description: N/A
Compatibility: A terminal can be constructed by flaring the barrier to beyond the clear zone.
Potential Benefits: The stone elements give the system a rustic appearance that may be appropriate for many park and forest settings. The smaller design of a TL-1 system is less expensive to construct than the SMG.
Potential Problems: Cost is the primary problem, along with limited terminal options. Other problems include obstruction of views, drifting and storage of snow and pavement drainage.

Barrier Data Tables November 2005
________________________________________________________________________Barrier Data Tables B-27
Figure B.12: Random Rubble Cavity Wall, RCW


