32
Barriers to Adoption of Renewable Energy Technology Jeremiah Doner Illinois State University Institute for Regulatory Policy Studies May 2007

Barriers to Adoption of Renewable Energy Technology
Jeremiah Doner
Illinois State University
Institute for Regulatory Policy Studies
May 2007
- 1 -
Barriers to Adoption of Renewable Energy Technology
Table of Contents
Abstract 2
I. Introduction 3
II. Overview of Non-Hydro Renewable Energy Technology 5
1. Wind Turbines 6
2. Solar/Photovoltaic 8
3. Biomass 9
4. Geothermal 9
III. U.S. Renewable Energy Policy Designs 10
1. Production Tax Credit – Federal Government 10
2. Renewable Portfolio Standards – State 12
IV. Global Trends in Renewable Energy 14
1. Denmark 14
2. Germany 16
3. Netherlands 17
4. Japan 18
V. Barriers to New Technology Development and Implementation 19
1. Evolution of Technological Systems 21
2. Market transformation/Learning Curve 23
3. Diffusion Rate with Carbon Tax 24
VI. Conclusions 25
1. Recommended Policy Design by Regulatory Bodies 25
Appendix 27
References 30

- 2 -
Barriers to Adoption of Renewable Energy Technology1
Abstract: Increased use of renewable energy is one of several promising strategies for reducing
emissions of pollutants and for hedging against the volatility of fossil fuel prices. Among the
available options for encouraging the development of renewable energy technology are the
Production Tax Credit, Renewable Portfolio Standard, and Research and Development subsidies.
This paper examines the international and United States experience with renewables and what
policy structures were implemented. Also included is a discussion of how the diffusion rate of
new technologies such as renewables can be increased with certain policy mechanisms. The
main objective of this paper is to identify and describe the correct policy design measures that
might be used by regulatory bodies to guide the continued growth of renewable energy
technologies.
1 I wish to thank the Institute for their generous support of this project. I also wish to thank Rajeev Goel and David
Loomis for their numerous comments during this project.
- 3 -
Barriers to Adoption of Renewable Energy Technology
I. Introduction
The supply of energy is a crucial element in the economic growth of societies, where the
way this energy is produced, supplied, and consumed is a critical issue to assure that the current
generation does not prevent future generations from prospering. It is widely recognized that we
need to curb the increasing amounts of environmental pollution and greenhouse gases produced
through the generation of electricity using fossil fuels, and this goal can be accomplished in two
ways: 1) improving energy efficiency standards and 2) increasing the usage of renewable energy
technologies. This paper will focus on how government bodies can design policies that will
reduce the amount of electricity that is generated using fossil fuels and increase the usage of
renewable energy technologies.2
Renewable energy first gained the interest of policymakers in the 1970s and early
1980s, but interest faded due to falling fuel prices and abundant supply. Currently the market for
renewable energy technologies is experiencing rapid growth, which is due to such factors as high
fuel prices, improvements in renewable energy technologies, and increased political support due
to concerns about climate change and energy security.
The reduction in costs of renewable technology has been aided by the dramatic increase
in private investment, which increased from $50 billion in 2005 to $70 billion in 2006.
However, it is a fact that most renewable technologies, excluding wind energy, are still in the
developmental stage, and to guarantee the further growth of this industry the government will
have to design policies that provide incentives to investors to put their money into renewable
energy technology. Current policies the government is using in regards to renewables is to
2 For further reading on renewable energy technologies see Boyle, “Renewable Energy: Power for a Sustainable
Future” (2004).

- 4 -
provide subsidies to defer part of the costs to generate electricity using renewables, such as the
Production Tax Credit (PTC) for wind energy and subsidizing the initial capital investment in
solar energy. State governments are also mandating that a certain percentage of the electricity
purchased in their state come from renewable sources, and these programs are called Renewable
Portfolio Standards (RPS). Currently 23 states have enacted RPS initiatives, and Figure 1
indicates those states.
Figure 1. Renewable Portfolio Standards by State3
At the present time the majority of electricity generated in the United States depends on
fossil fuels, such as coal, where non-hydro renewable technologies only make-up 2.3% of total
electricity generated (See Figure 2). The cost of renewables is currently more expensive than
electricity generated from fossil fuels, but as the cost of renewables continues to decrease, and
with the removal of certain barriers in the market, renewables could become competitive with
electricity generated from fossil fuels. For example, the price of renewables becomes more
competitive with coal generation if the environmental costs are included; however, currently
environmental costs are not included in the price of electricity generated by coal.
3 Source: Energy Information Administration

- 5 -
Figure 2. U.S. Electric Power Generation by Fuel Type - 20054
The focus of this paper is to analyze what types of government policies will further the
growth of renewable energy technology without creating inefficiencies in the market causing
customers to pay unreasonable electric rates. The outline of the paper is as follows: Section II
provides an overview of the types of renewable energy technologies, Section III examines the
U.S.’s current renewable energy policies, Section IV examines global trends and policy
structures in the use of renewable energy technology, Section V examines the theoretical aspects
of new technology adoption, and the final section will examine the future of renewables.
Section II. Overview of Non-Hydro Renewable Energy Technologies
The focus of this paper is on non-hydro renewables, which include wind, solar
photovoltaic, biomass, and geothermal. Renewable energy technologies generate electricity
using natural regenerating resources such as sunlight, wind, and geothermal energy. The
following figure shows the global distribution of electricity generated using renewables, and in
4 Source: Energy Information Administration

- 6 -
the U.S. the renewable energy production totals in 2005 are: biomass - 1.5%, wind - 0.44%,
geothermal - 0.36%, and solar power - 0.01%.
Figure 3. Global Power Generation by Fuel Source - 20045
The U.S. as of 2006 had 11,600 MW of installed wind capacity, which is enough to
supply the power needs of approximately 4 million homes.6 Wind energy is captured using
multi-blade turbines placed on towers either located on land or in costal waters. The amount of
energy that can be captured from the wind is proportional to the cube of the wind speed, meaning
that a slight increase in the wind speed results in a large increase in electricity generation. For
example, if site A has an average wind speed of 14 mph and site B has average winds of 16 mph,
which means that site B will generate 50% more electricity than site A, all other things being
equal. Second, the taller the tower and the larger the area swept by the blades, the more
electricity that turbine will be able to potentially produce. The sweep area of a turbine rotor is a
function of the square of the blade length. For example, an increase in rotor diameter from 10
meters to 70 meters will result in yearly electricity output increasing by 120 times, due to the
longer blades and higher tower height.
The size of wind turbines and their electricity output have increased dramatically over the
last 20 years. In 1980 the typical turbine had a rated capacity of 25 kw with a rotor diameter of
5 Source: Energy Information Administration
6 EIA
- 7 -
10 meters and a cost of $2,600 per kw; however, by 2000 the turbine had a rated capacity of 1.65
MW with a rotor diameter of 70 meters and a cost of $790 per kw. The improvement in wind
energy technology has reduced the per kilowatt hour generating costs from 80 cents in 1980 to 6
to 9 cents currently without including subsidies, which is getting closer to the costs of generating
electricity using coal at a cost of 3 to 5 cents per kilowatt hour in the U.S.
The per kilowatt hour production costs of electricity generated using turbines can be
further reduced by recognizing that large wind farms experience gains in efficiency due to
economies of scale. For example, a 3 MW wind project can deliver electricity at six cents per
kWh and a 50 MW wind project can deliver electricity at four cents per kWh, which results in a
reduction in deliver costs of 40%. The reduction in costs is a result of dividing transaction,
operating and maintenance costs over more turbines. The costs of generating electricity using
wind turbines can be further minimized by placing the turbines in optimal locations based on
wind resource potential maps, which are produced by the U.S. Department of Energy – National
Renewable Energy Laboratory.
Currently one of the biggest issues facing the wind industry is the shortage of wind
turbine components. The shortage of turbine components has increased installation costs per
kilowatt from approximately $1,100 in the past few years to a current price of $1,500. The
shortages are expected to continue until 2008 when new wind turbine production capacity comes
on line.
Wind power is currently the world’s fastest-growing major energy source, where capacity
is increasing 30 to 35 percent per year. If installed capacity expands 20% per year from 2002-
2020 there would be an estimated 1,200 gigawatts of wind power capacity in the world, which

- 8 -
would represent 18% of the world’s total electricity supply assuming a growth rate in electricity
demand of 1% per year.7
Solar energy, which utilizes the free rays of the sun to produce electricity using
semiconductor chips, currently only produces one-thirteenth of 1% of the power in the United
States. The traditional usage of solar energy has been to install solar panels on the roof of ones’
house; however, the homeowner still needs to have power during the night and currently power
storage devices are extremely cost prohibitive. Also, solar panel technology is still highly
inefficient at converting the sun’s energy into useable electricity. The current per kWh cost of
generating electricity with solar panels is 26 to 35 cents without including subsidies, which is
considerably higher than the three to five cents per kWh costs for electricity generated using
coal. A study by the New Jersey Board of Public Utilities found that it cost $77,500 to install a
10 kw capacity system in a home, and at current electricity prices would take 50 years to pay off
the initial investment.
A new technology is currently being developed that will allow solar energy to be
produced at a much larger scale and at rates competitive with coal generated power. The
technology uses a technique called concentrated solar power (CSP), which uses mirrors to track
the movement of the sun to heat a liquid that produces steam to drive the turbines that create the
electricity. The costs per kwh to generate electricity using CSP is 9 to 12 cents without subsidies,
which is approximately three times as high as coal generation. Currently only 6% of the
electricity generated by solar energy is generated using this technology. The government will
need to provide subsidies to develop this new technology until costs of production are
comparable to current prices using traditional generating methods. Also, since this is a new
7 Geller. Energy Revolution. (2003, pp. 225)

- 9 -
technology, investment by the private sector will be viewed as too risky; therefore, the
government will need to subsidize both research and development costs and installation costs.
Because of rising costs in the raw material silicon, producers of solar panels are facing
similar production cost increases as in the wind industry. Solar panel manufactures now demand
more silicon than the computer chip industry. This has produced a shortage of silicon driving the
price up from $35 per kilogram to the current market price of $100 per kilogram.
The largest producer of renewable electricity in the U.S. is biomass, which produces
more electricity than wind, solar, and geothermal combined. Electricity is generated using
biomass by burning plant or waste material, or collecting and burning landfill gas. The largest
biomass producers in the U.S. are not utilities but private-companies that utilize forest materials
to produce lumber or paper products.
Biomass plants are usually much smaller than fossil-fuel power plants, where a typical
biomass plant may have a 50 MW capacity compared to the 500 MW capacity of a fossil-fuel
power plant. The small scale of these plants make the initial investment in equipment higher in
relation to the amount of power produced. The current per kWh costs for biomass is
approximately 10 cents. This cost is expected to decrease as more firms attempt to utilize their
waste materials to produce electricity instead of sending that material to landfills. The California
Biomass Collaborative estimated that 30 million tons of waste material could be used to produce
2,500 MW of electricity, which is the equivalent of five average sized fossil-fuel plants.
The renewable energy source that has the most unrealized production capacity is
geothermal energy, which uses the heat trapped in the Earth to generate electricity. The
traditional method used is to drill into the ground and capture the steam and heated water that has
been trapped underground to spin the turbines to generate electricity. The biggest challenge is
- 10 -
the need to properly balance the amount of water taken out with the amount that is put back in.
There is high variability in geothermal sites depending on such factors as the size of the
geothermal field, water pressure, temperature, and how quickly the field can reheat and release
water.
In the U.S. as of 2006 installed geothermal energy capacity is about 3,000 MW, with the
largest geothermal production field located in California, with an installed capacity of 725 MW.
The production costs of geothermal energy currently range from 6 to 10 cents a kWh. A study
by MIT estimated that 10% of the electricity in the U.S. could be produced using geothermal
technology by 2050. However, for geothermal technology to become competitive with fossil-
fuel based technology the government will need to create supportive policy initiatives, such as
government loan guarantees, production tax credits, accelerated depreciation, and depletion
allowances.
III. U.S. Renewable Energy Policy Designs
The U.S. has used numerous policy designs over the last thirty years to promote
renewable energy, which have included financial incentives, regulatory measures, and research
and development programs. The energy policies in the U.S. are a product of both individual
state and Federal policies. This section of the paper will examine the different policies utilized
in the U.S. and the success of those programs on increasing the usage of renewables.
One of the most important Federal policies enacted to promote the usage of renewables
has been the Production Tax Credit (PTC), which allows investors to use the tax credit to write
off their investment in qualifying renewable technology against other investments they have
made. The PTC was first enacted with the EPACT of 1992, which established a 10-year 1.5

- 11 -
cents per kWh inflation adjusted PTC for private and investor-owned wind projects and closed-
loop biomass plants brought online between 1994 and 1999. The current PTC has been
expanded to include solar and geothermal technologies. However, from 2000 to 2004 the PTC
was allowed to expire on three separate occasions. The effects of the three separate PTC
expirations on installation of new wind capacity are easily evident in Figure 4. The “on-
again/off-again” status that has been experienced with the PTC has created a boom-bust cycle in
the wind industry. The wind industry experiences strong growth in installed capacity during the
period before the PTC expires, and when the PTC expires there is a sizeable decrease in the
number of wind projects.
Figure 4. U.S. Wind Power Capacity Additions, 1999-20068
The PTC was set to expire again at the end of 2007, but Congress recently passed
legislation to extend the credit through the end of 2008. The extension will allow the wind
industry to continue with its record of strong growth; however, the extension does not allow for
sustainable long-term growth in renewable technologies. A wind farm project can take more
8 Source: Energy Information Administration

- 12 -
than two years to complete, and an investor who depends on the PTC to make a project more
cost effective is less likely to take the risk if they are unsure that the PTC will still be available
when the project is completed. Also, the wind and solar industries are currently experiencing
shortages in available wind turbines and solar panels, which mean that there is a demand for
increased manufacturing capacity. However, investors are less likely to make the huge capital
investments necessary to increase capacity without a guarantee that there will be consistent long-
term demand for their products. The policymakers need to enact a long-term PTC extension to
maximize the long-term growth of renewable technologies.
At the state level the key policy used to increase the usage of renewable energy
technologies has been Renewable Portfolio Standards (RPS). RPS require that a certain
percentage of a utility’s overall or new generation capacity or energy sales must be attained from
renewable resources. RPS requirements generally increase over time and utilities must
demonstrate compliance to the regulatory body on an annual basis, where utilities that fail to
meet their renewable purchases could be fined by the government. Since RPS set fixed numeric
targets for renewable energy but allows suppliers flexibility in how to meet those targets, it is
expected that properly designed RPS will create strong cost reduction incentives.
One key element in the RPS is the use of Renewable Energy Credits (REC), which is
tradable certificate that is proof that one kWh of electricity has been generated by a renewable
resource. The RPS requires that electricity generators show they have meet their renewable
energy obligation by purchasing a certain number of REC. For example, if the RPS is set at 5%,
and a generator sells 100,000 kWh in a year, the generator would need to purchase 5,000 REC.
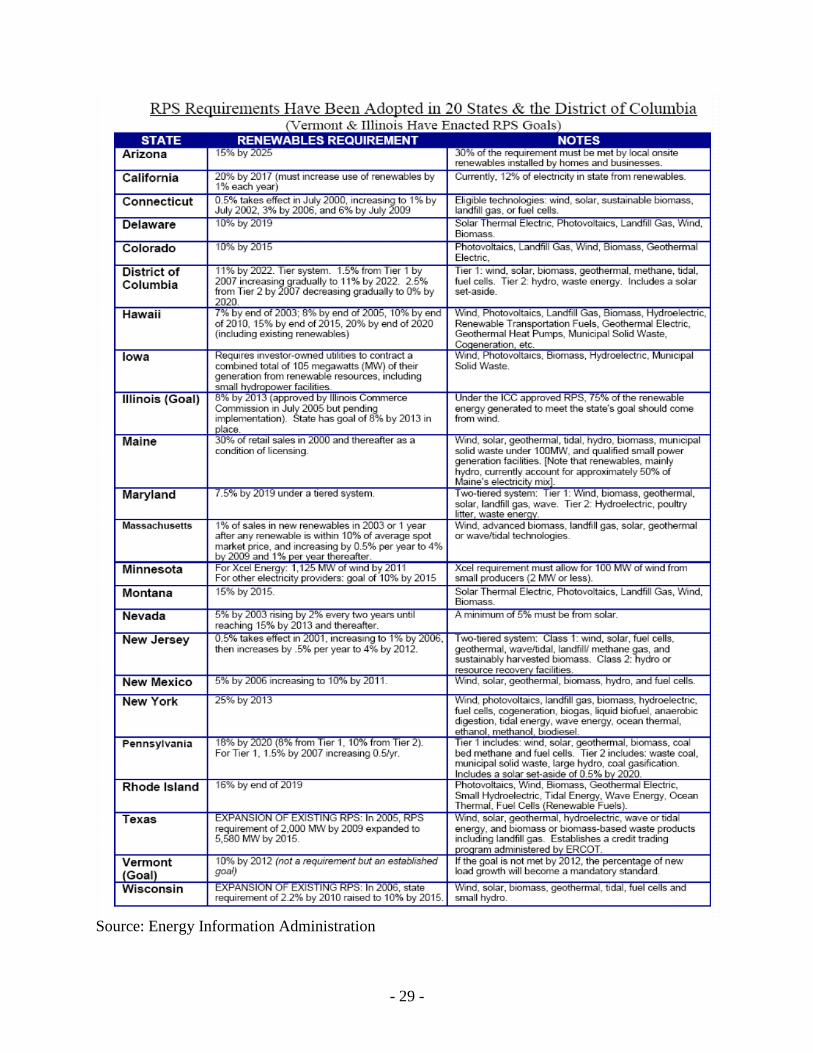
Currently 22 states and the District of Columbia have enacted RPS; a summary of all
programs is available in the appendix. For example the RPS in Illinois voluntarily encourages
- 13 -
that in 2007 2% of electric energy sales are met with renewable energy and increases to 8% by
2012. The state of California has enacted the most ambitious RPS, which calls for the state’s
investor-owned utilities, energy service providers, and community choice aggregators to meet
20% of their electricity load with renewable energy resources by 2010. This represents an
increase of 8,000 MW of new renewable capacity. California currently receives about 12% of
their electricity from renewable resources.
The advantage of RPS over the direct subsidy approach is that it avoids the process of
government bodies having to decide how to distribute funds, which can be highly inefficient and
bureaucratic. The only government involvement necessary once the RPS is set is to certify REC,
monitor compliance, and impose penalties when necessary. The optimal level of the penalty
needs to be several times the cost of purchasing REC to assure that generators comply with the
RPS.
A properly designed RPS will create certainty and stability in the renewables market by
allowing the renewable power industry to enter into long-term contracts and lessen the cost of
financing, which will also lead to the reduction in renewable energy costs. The flexibility of the
RPS allows generators to comply at the least cost. A generator can compare the cost of owning a
renewables facility to the cost of purchasing REC to determine how they meet the RPS.
Therefore, those who can efficiently generate renewable power will and those who cannot
efficiently produce it will purchase REC on the competitive market.
Another efficiency advantage of the RPS approach is that generation companies will be
looking to improve their competitiveness in the market, which means that they will have an
interest in reducing the costs of renewables so that the costs of complying with the RPS will also
be reduced. To accomplish cost reduction a company might provide financing to a renewable

- 14 -
project, seek out the least-cost renewable resources, or enter into long-term purchasing
agreements. All of these cost reduction methods will create a competitive environment for
renewable technologies that cannot be achieved by direct subsidies.
Section IV. Global Trends in Renewable Energy Technology
Since the energy crisis of the 1970s, many countries have become interested in
developing renewable energy technology for generation of electricity; the main motivation
behind increasing their usage of renewables was to reduce their dependence on imports of fossil
fuels. However, in the 1980s and 1990s countries renewed their interest in developing
renewables as a way to deal with environmental issues. This section of the paper examines the
state of renewables and the type of policies initiated in Denmark, Germany, the Netherlands, and
Japan.
The three European countries and Japan were chosen because each country has had
significant success in implementing renewable energy technology and an examination of their
policies is important to determine what type of policy structure creates growth in the renewable
energy sector. One item that needs to be mentioned when comparing the size of the renewable
energy sector in each of these countries with the United States is that the average electricity
prices in each of these countries is higher than in the U.S., which would reduce the price
premium on renewables and increase the likelihood of their implementation.
The country with the largest percentage of their electricity generated by non-hydro
renewables is Denmark, where in 2003 21% of their electricity was generated by wind power.
From 1996 to 2001 Denmark experienced 30% annual growth in installed wind capacity. The
Danish government with their Energy 21 program has set a goal of increasing wind capacity to

- 15 -
5,500 MW by 2030, which would represent 50% of total electricity demand in 2030. The
policies enacted by the Danish government over the last thirty years have succeeded in
increasing both the capacity and market share of renewable energy. (See Appendix Fig. 7)
In 1979 the government began offering an investment subsidy of up to 30% of the cost of
wind turbines and solar panels. This investment subsidy went directly to reimbursing a fixed
percentage of the costs of the investment, where in the U.S. the investment subsidy is actually an
investment tax credit. A direct investment subsidy instead of an investment tax credit means that
investors develop renewable energy projects to promote renewable energy instead of attempting
to reduce their tax burden.
The key to the consistent yearly growth of the wind industry in Denmark has been that
the production subsidy has remained the same. This has provided investors with the necessary
incentives to invest in the manufacturing of wind turbine and turbine components, which has led
to all wind capacity installed in Demark to be manufactured by domestic companies. Danish
companies also provide a significant percentage of the global supply of wind turbines, and in
2003 they supplied 32% of all installed capacity globally. The U.S. on the other hand has relied
on a Production Tax Credit (PTC), which has to be periodically renewed by Congress. This has
caused the installation of wind capacity in the U.S. to have large fluctuations depending on the
PTC. During periods when there is a PTC the installed wind capacity in the U.S. increases
greatly; however, when the PTC expires there is essentially zero wind capacity installed. The
inconsistency of the PTC has not given investors the guarantees needed to make investments in
the manufacturing of wind energy components.
The development of wind energy projects in Denmark has also not faced the same level
of local opposition that projects in the U.S. has, and in particular Illinois. The main reason is that
- 16 -
the wind industry in Demark has developed with a system of cooperative ownership of turbines,
where farmers and landowners are given an ownership interest in projects. Individuals or local
cooperatives own about two-thirds of the wind turbines in Denmark, which has reduced local
opposition and given voters a vested interest in the wind industry.
Germany, which is the largest economy in Europe, has the most installed wind capacity
of any country in the world, which increased from 12 GW in 2002 to 14.5 GW in 2003. In parts
of Germany wind energy represents 20% of the power supplied; however, the overall supply of
renewables in Germany is about 5%. The German government has also been active in promoting
the use of solar energy, and in 1999 passed the 100,000 Solar Roofs Program. The program
provides low-interest loans for photovoltaic systems, and this program has increased installed
capacity of PV systems from 50 MW in 1997 to 400 MW by 2003.
There have been two main policies enacted in Germany that have led to the sizable
increase in renewables: the Electricity Feed-In Law (1991) and the Renewable Energy Law
(2000). (See Appendix Fig. 5) The Electricity Feed-In Law changed the market structure for
renewable electricity producers by requiring utilities to purchase renewable electricity and
stating the price that this electricity would be purchased at from producers. The utilities were
required to pay renewable producers 90% of the retail rate for electricity. The passing of this law
did two important things for producers of renewable electricity: created a market for renewable
electricity, and provided a high enough price to guarantee being able to recover their initial
capital investment.
The Electricity Feed-In Law (EFIL) is similar to the Public Utilities Regulatory Policies
Act (PURPA) passed by the U.S. in 1978. PURPA required utilities to purchase electricity from
producers using renewable energy sources at a price not higher than their “avoided costs” of not

- 17 -
having to produce that power themselves, where the level of avoided costs was set at the state
level. The main difference between PURPA and the German law is that in the U.S. the
calculations of “avoided cost” were lower and closer to market wholesale rates than the higher
retail rate used in Germany, which allowed new renewable technologies to become competitive
faster. Another difference between the two laws has to do with their initial goals, where PURPA
was designed to promote energy efficiency the German law was developed to increase the usage
of renewable resources. Another reason PURPA might not have had the same effect as EFIL is
due to when the policies were enacted. The wind industry was more developed in terms of
technology and costs in 1992 when the EFIL was passed than in 1978 when PURPA was passed.
The U.S. did not experience the level of growth in wind energy that Germany did until additional
incentives were enacted, such as the PTC in 1992.
The Renewable Energy Law (REL) enacted by Germany in 2000 has also contributed to a
significant growth in the usage of renewable sources of electricity. The REL set fixed prices that
renewable power producers received for each type of renewable energy source. The structure of
this law allowed purchase prices to be tailored to each type of renewable resource providing the
necessary support for further growth, since each technology faces different costs of generation.
The Netherlands as of 2004 generated about 8% of their electricity from non-hydro
renewables. The Netherlands get a greater percentage of its renewable electricity from biomass
and waste incineration than any other country in Europe. Biomass and waste incineration
account for 67% of renewable electricity, while wind makes-up 24% and solar less than 1%. The
Netherlands has relied on a more voluntary approach to increasing the usage of renewables,
which is different than the route taken by Denmark and Germany. (See Appendix Fig. 9)

- 18 -
The Netherlands in 2000 enacted the Demand-Pull Ecotax System that is unlike any
policy currently used in the United States. This law uses a demand-pull approach by
encouraging consumers to purchase renewable electricity, which is in contrast to the supply-push
policies in the U.S., such as support for R&D (Federal) and Renewable Portfolio Standards
(State). The Ecotax has two components: producers receive a production subsidy, and
households are exempt from the Ecotax for all electricity purchased from renewable electricity
producers. The combination of these two incentives has allowed power from renewable
resources to be cheaper than power from fossil fuel sources for households in certain parts of the
Netherlands. The demand by households for electricity from renewable resources has increased
from a few thousand households in 1998 to more than a million in 2002. The demand for
electricity from renewable resources has been so great that it has outstripped supply, which has
caused the Netherlands to have to import renewable power since 2000.
Japan currently only generates 2% of their electricity from non-hydro renewables, but it
is one of the only countries that have had success in developing a market for photovoltaic (PV)
technology. (See Appendix Fig. 11) In 1992 Japan had PV installed capacity of only 19 MW but
by 2004 installed capacity increased to 2,000 MW.
The growth in PV capacity can be attributed to four policies enacted by the Japanese
government from 1992 to 1994. First, the government provided net metering guidelines, which
set the buy-back price on excess electricity generated equal to the retail price selling price of
electricity. Second, the government set a goal of increasing PV capacity to 4,600 MW by 2010.
Third, the government implemented a subsidy program to defer the initial installation costs of
PV systems. These subsidies have been decreased over the life of the program as the economics
of PV systems improved. Finally, the government enacted the 70,000 roofs program to

- 19 -
encourage residential use of PV and to provide households with information about the benefits of
PV technology.
The key to the strong growth in renewables that has been experienced by the countries
mentioned previously has been a coordinated and consistent national policy, where the U.S., on
the other hand, has enacted a multiple of different policies at the state level that have not always
been in agreement with Federal polices and goals. Also, the policies in these countries have been
enacted for long durations, which is necessary to assure that the market for renewables develops
properly.
V. Barriers to New Technology Development and Implementation
This section of the paper analyzes how the market for developmental and emerging
renewable technologies can be transformed into a competitive industry that is able to compete
directly with traditional energy technologies.9 The three main barriers to the market deployment
of renewables that will be discussed in this section are technical, economic, and institutional.
Fossils fuels are by far the dominant source of electricity in the world contributing over
63% of the electricity generated in 2005. The use of renewables on a large-scale to replace fossil
fuel electricity generation offers two principal advantages: a method to significantly reduce
greenhouse gas emissions, and to diversify a country’s energy supply. In the last decade the
number of wind turbines globally has increased at an average rate of 27% annually, and over the
same period the number of solar panels has increased at an average rate of 22% annually.
However, currently non-hydro renewables represent less than 3% of electricity generated
globally, where wind and solar energy only make-up 0.2% of the 3%. The issue is no longer
9 For further reading on new technology development see Schmalensee and Willig, Handbook of Industrial
Organization Vol. I, 1989.

- 20 -
about the technical potential of renewable energy technology, but how this potential can be
realized and become a sizeable part of how electricity is generated.
Wind and solar PV are emerging technologies that are proven to work, and through
further market expansion and experience with the aid of subsidies will be able to reduce their
costs to become competitive with traditional generation methods. Technologies such as
concentrating solar power and numerous other technologies are still in the developmental phase,
but with substantial R&D support from the government will be able to lower their production
costs and compete with traditional generation techniques and begin entry into the market.
The total amount of electricity produced is huge, and even with continued high growth
rates of renewables over the next two decades it may not begin to produce a majority of the
electricity until well after 2020, which means that policy design must be implemented with a
very long-term timeframe.
First, each policy has to be designed for each type of renewable energy technology, since
each technology is at a different level of development and faces different cost and pricing
structures. Second, renewable technologies currently are at a cost disadvantage when compared
with incumbent technologies, such as coal fired generation. Also, the use of renewable
technology may not offer the buyer or investor any direct benefits, but may offer society an
indirect benefit by reducing the costs of CO2 emissions. Incumbent technology also benefits
from indirect subsidies due to the negative externalities associated with its use. The European
Commission estimates that the price of coal generated electricity would be double if the price of
the negative externalities were included.10
Finally, the proponents of the established technology
often will attempt to block the diffusion of renewables by influencing the institutional framework
so that it continues to be to their advantage.
10
Jacobsson and Bergek. (2004). pp. 210.
- 21 -
The increase in market share of a new technology can be illustrated by the classic S-
shaped diffusion curve. The S-shaped diffusion curve was first developed by Griliches (1957)
with a study of diffusion rates for hybrid corn.11
The shape of the diffusion curve shows that
new technologies initially grow at a slow rate, which is caused by uncertainty about future
demand and higher learning costs, and then as demand increases and costs are reduced the
growth rate increases, and finally as market saturation is reached growth flattens out.
The size of the firm is also an important determinant of how new technologies are
adopted. Joskow and Rose (1990) find strong evidence that large firms tend to lead the
electricity industry in adoption of new technologies. There are two potential reasons for this
trend to occur: (1) large firms are better able to absorb the risk associated with new technologies
and (2) large firms have more capital to devote to R&D and the development of new
technologies.
Figure 5 shows the different policies that should be used over time as the market share of
a technology increases. Policies such as research and development, financial incentives, and
procurement initiatives are appropriate for stimulating commercialization and initial markets for
new technologies, which can create a “technology push.” Once a technology is established in the
marketplace further growth can be stimulated by financial incentives, procurement obligations,
and education and training. To complete the transformation of a new technology regulation and
market obligations can be used, such as electricity pricing reforms, capacity building, and
planning techniques.
11
Griliches, Z “Hybrid Corn: An Exploration in the Economics of Technological Change.”

- 22 -
Figure 5. Market Transformation12
The mix of policies appropriate to increase the market share of a new technology depends
on the technological properties of each new technology, the type of market barriers that currently
exist, and the present market conditions. The most critical element in the diffusion of any new
technology is investment in the research, development, and demonstration stage (RD&D). At the
initial stages of development the RD&D will have to be funded by the government, since the
private sector will under invest relative to what is considered desirable by society. Private sector
investment will be too low because it will not be able to capture all of the benefits that society
deems important, such as greater fuel diversity, reduced pollution emissions, and greater national
security. Also, firms tend to under invest in RD&D because they are more focused on short-term
profits, and fear that they will not be able to fully recover the costs incurred to develop new
technologies.
Providing low interest loans to investors in renewable technologies can help speed up the
diffusion rate by lowering the risk level associated with those investments. The government
12
Geller. (2003). pp. 48.
Time
Market
Share (%)
Codes & Standards
R&D
Testing & Rating Incentives
Bulk Procurement
Utility Rebates Education
Financing
- 23 -
could provide or back-up these loans, which would allow the loans to be offered at a lower
interest rate. A type of financial incentive, such as a Production Tax Credit, could also help to
increase the rate of diffusion.
The policies designed by regulators can move new technologies from the RD&D stage to
being competitive market options. The regulators can require utilities to purchase a certain
percentage of their power from renewable energy suppliers, such as a Renewable Portfolio
Standard. A carbon tax could be implemented to capture the negative externalities of coal
generated electricity, which would decrease the price differential between coal and renewable
technologies. Finally, regulators could start a net metering program, which allows customers
who produce more electricity than they use to sell their excess power to the utility at the retail
rate.
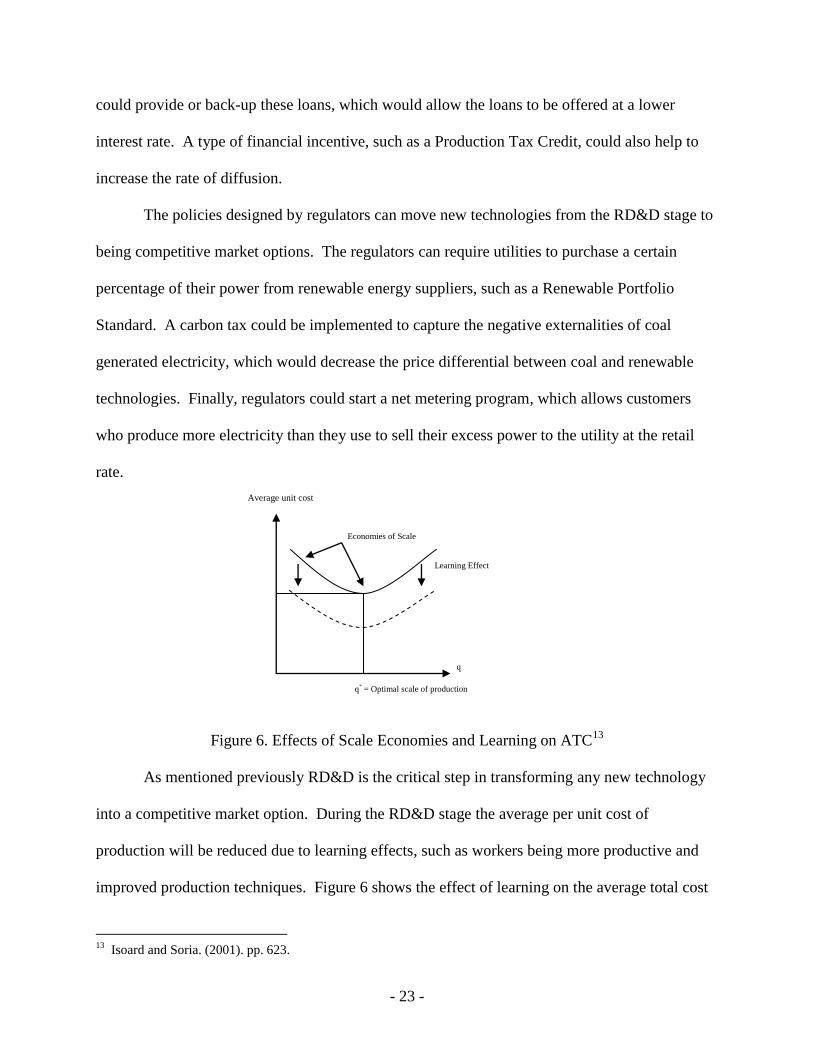
Figure 6. Effects of Scale Economies and Learning on ATC13
As mentioned previously RD&D is the critical step in transforming any new technology
into a competitive market option. During the RD&D stage the average per unit cost of
production will be reduced due to learning effects, such as workers being more productive and
improved production techniques. Figure 6 shows the effect of learning on the average total cost
13
Isoard and Soria. (2001). pp. 623.
q* = Optimal scale of production
q
Economies of Scale
Learning Effect
Average unit cost
- 24 -
(ATC) curve, which causes the ATC curve to shift down representing a lower per unit average
cost for every level of production. This graph also illustrates that as the level of production is
increased per unit costs decrease, which is an example of scale economies. The main point of
this figure is that as the production level of renewable technologies increases the average per unit
costs will decrease and become more competitive with current generation technologies, where
the reduction in ATC is realized from the combined effects of learning and scale economies.
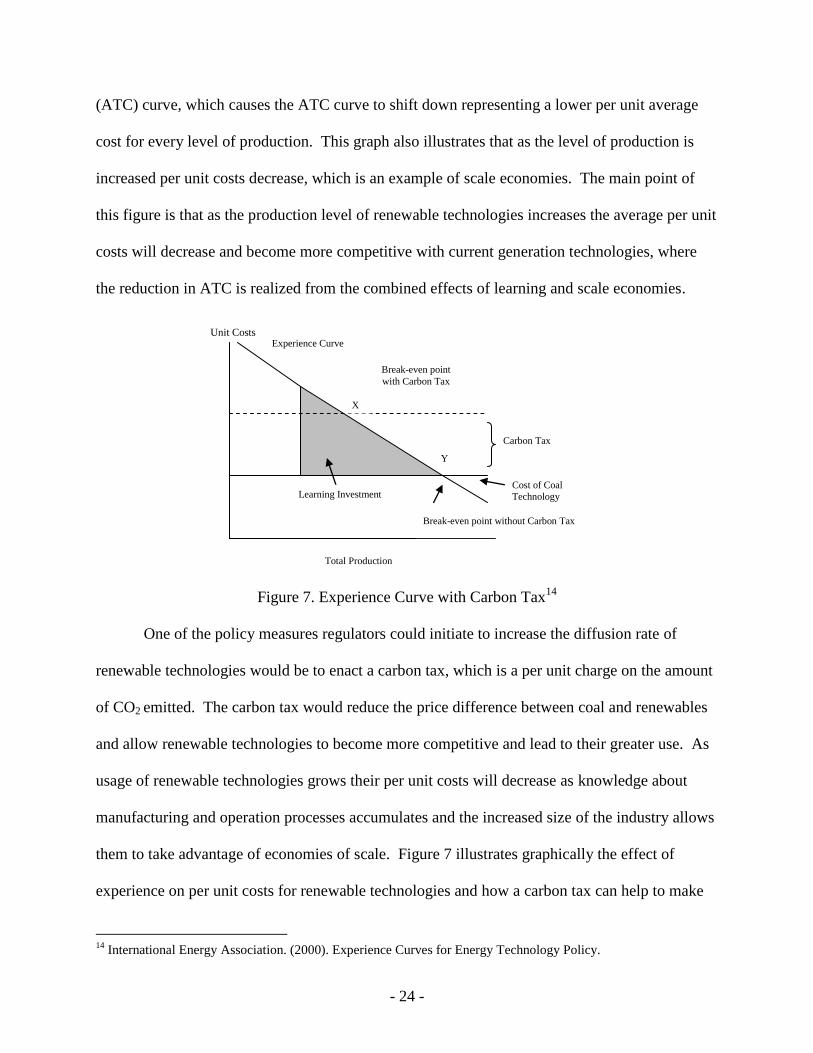
Figure 7. Experience Curve with Carbon Tax14
One of the policy measures regulators could initiate to increase the diffusion rate of
renewable technologies would be to enact a carbon tax, which is a per unit charge on the amount
of CO2 emitted. The carbon tax would reduce the price difference between coal and renewables
and allow renewable technologies to become more competitive and lead to their greater use. As
usage of renewable technologies grows their per unit costs will decrease as knowledge about
manufacturing and operation processes accumulates and the increased size of the industry allows
them to take advantage of economies of scale. Figure 7 illustrates graphically the effect of
experience on per unit costs for renewable technologies and how a carbon tax can help to make
14
International Energy Association. (2000). Experience Curves for Energy Technology Policy.
Total Production
Carbon Tax
X
Y
Experience Curve
Break-even point
with Carbon Tax
Break-even point without Carbon Tax
Learning Investment Cost of Coal
Technology
Unit Costs

- 25 -
renewables more competitive. At point X the per unit costs of the renewable technology is equal
to the per unit costs of the fossil fuel technology when the carbon tax is included. Point Y shows
that as the industry gains more experience and scale, eventually the carbon tax could be phased
out, because the per unit costs of the renewable technology has been reduced to such a level that
it is competitive with the fossil-fuel technology without the aide of the carbon tax.
The market transformation of renewables will allow the barriers to growth to be removed,
which will result in a permanent shift in the distribution of how electricity is generated. There is
a need for policy intervention in the early stages of market transformation to remove market
barriers, which will increase sales of new technologies and in turn through learning and scale
economies will reduce per-unit production costs. This results in a positive feedback loop that
can lead to rapid market growth.
VI. Conclusions
The future of renewable energy technology looks promising with continued strong
growth; however, it will take some time before most renewable technologies will become
competitive with fossil-fuel technologies. Policymakers will play a critical role in whether
renewables continue to increase their market share and eventually become competitive with
fossil-fuel technologies. This section offers ideas that could assure that renewables become a
substantial contributor in how electricity is generated in the future.
The most important policy structure for government bodies to adopt is to make policies
predictable and stable to reduce the risk and uncertainty that investors and consumers face. The
policies enacted should be kept in place for a decade or more to ensure proper development of
renewable energy industries and markets. Also, long-term price guarantees will reduce the risk
- 26 -
associated with the investment in renewables, which will make attaining loans from banks easier
since there is a long-term revenue guarantee. For example, the U.S. has in the past allowed the
PTC to expire numerous times and then when it is renewed it is only renewed for short periods,
which has created a boom-bust cycle in the wind and solar industry. If the U.S. is serious about
developing renewable technologies then the PTC should be extended for a period of at least 10
years to reduce the investment risk for expansion of manufacturing capacity.
The government should increase funding of research, development, and demonstration of
renewable technologies; however, the structure of these policies needs to be customized for each
type of renewable technology. The need for technology specific policy design is necessary
because renewables are at different stages of development and face different cost structures in
the market.
The competitive position of renewables would improve if policies were designed to
include the environmental and social costs of fossil-fuel technologies, which currently are priced
below their true cost to society. A carbon tax on coal generators would make renewables more
competitive and the revenue from this tax could be used to further RD&D in renewable
technologies. Also, any subsidies for fossil-fuel technologies should be moved to instead
provide subsidies for renewables until the industry is fully developed.
Finally, more states or even the Federal government should enact renewable portfolio
standards. A properly designed RPS should have the following properties: socially beneficial,
cost-effective and flexible, predictable, enforceable, consistency with market structure, and
compatibility with other policies. RPS will provide the necessary incentives for increased
investment in renewable technologies. The 20th
century was known as the coal century, and with
the proper policy designs the 21st century could be known as the renewable century.

- 27 -
Appendix
Source: Energy Information Administration

- 28 -
Source: Energy Information Administration
- 29 -
Source: Energy Information Administration
- 30 -
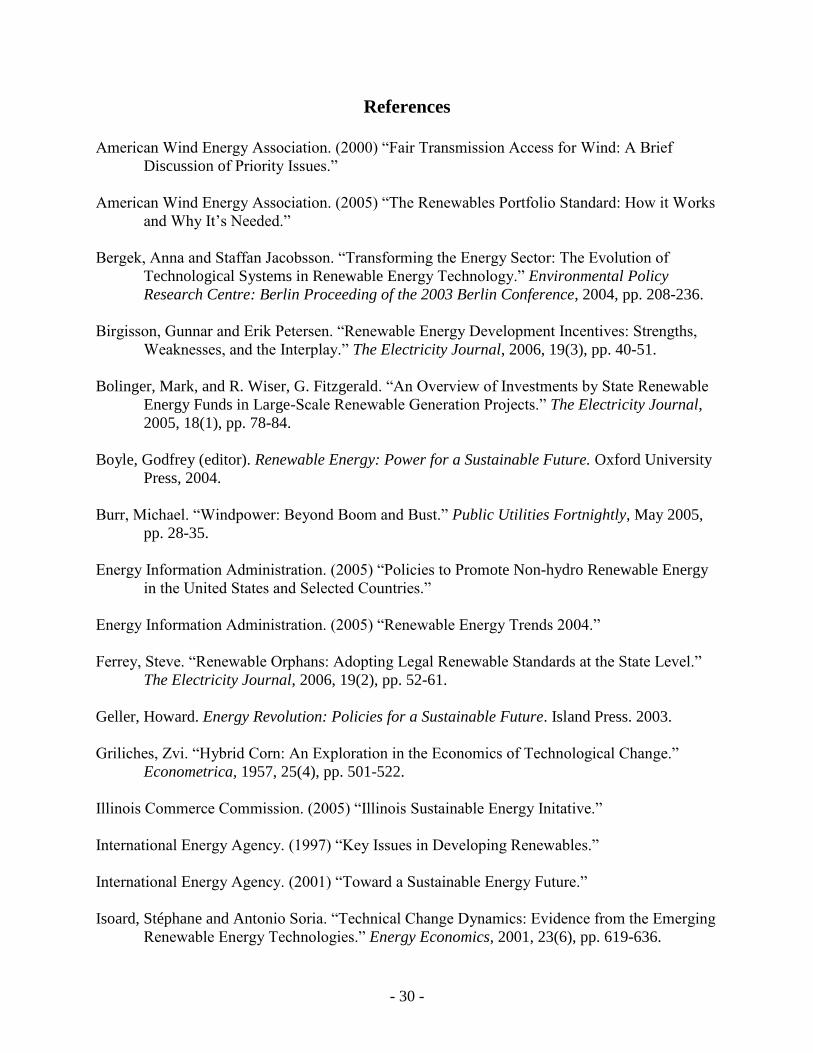
References
American Wind Energy Association. (2000) “Fair Transmission Access for Wind: A Brief
Discussion of Priority Issues.”
American Wind Energy Association. (2005) “The Renewables Portfolio Standard: How it Works
and Why It’s Needed.”
Bergek, Anna and Staffan Jacobsson. “Transforming the Energy Sector: The Evolution of
Technological Systems in Renewable Energy Technology.” Environmental Policy
Research Centre: Berlin Proceeding of the 2003 Berlin Conference, 2004, pp. 208-236.
Birgisson, Gunnar and Erik Petersen. “Renewable Energy Development Incentives: Strengths,
Weaknesses, and the Interplay.” The Electricity Journal, 2006, 19(3), pp. 40-51.
Bolinger, Mark, and R. Wiser, G. Fitzgerald. “An Overview of Investments by State Renewable
Energy Funds in Large-Scale Renewable Generation Projects.” The Electricity Journal,
2005, 18(1), pp. 78-84.
Boyle, Godfrey (editor). Renewable Energy: Power for a Sustainable Future. Oxford University
Press, 2004.
Burr, Michael. “Windpower: Beyond Boom and Bust.” Public Utilities Fortnightly, May 2005,
pp. 28-35.
Energy Information Administration. (2005) “Policies to Promote Non-hydro Renewable Energy
in the United States and Selected Countries.”
Energy Information Administration. (2005) “Renewable Energy Trends 2004.”
Ferrey, Steve. “Renewable Orphans: Adopting Legal Renewable Standards at the State Level.”
The Electricity Journal, 2006, 19(2), pp. 52-61.
Geller, Howard. Energy Revolution: Policies for a Sustainable Future. Island Press. 2003.
Griliches, Zvi. “Hybrid Corn: An Exploration in the Economics of Technological Change.”
Econometrica, 1957, 25(4), pp. 501-522.
Illinois Commerce Commission. (2005) “Illinois Sustainable Energy Initative.”
International Energy Agency. (1997) “Key Issues in Developing Renewables.”
International Energy Agency. (2001) “Toward a Sustainable Energy Future.”
Isoard, Stéphane and Antonio Soria. “Technical Change Dynamics: Evidence from the Emerging
Renewable Energy Technologies.” Energy Economics, 2001, 23(6), pp. 619-636.

- 31 -
Joskow, Paul L. and Nancy L. Rose. “The Diffusion of New Technologies: Evidence from the
Electric Utility Industry.” The RAND Journal of Economics, 1990, 21(3), pp. 354-373.
Neuhoff, Karsten. “Large Scale Deployment of Renewables for Electricity Generation.” Oxford
Review of Economic Policy, 2005, 21(1), pp. 88-110.
Price, Jeff. “The Production Tax Credit: Getting More Credit than its Due?” Public Utility
Fortnightly, May 2002, pp. 38-41.
Wiser, Ryan, and K. Porter, M. Bolinger, H. Raitt. “Does It Have to be This Hard? Implementing
the Nation’s Most Complex Renewables Portfolio Standard.” The Electricity Journal,
2005, 18(8), pp. 55-67.
Wiser, Ryan, and K. Porter, R. Grace. “Evaluating Experience with Renewables Portfolio
Standards in the United States.” Conference Proceedings of Global Windpower 2004
Chicago, March 28-31, 2004.
Wiser, Ryan and Steven Pickle. “Financing Investments in Renewable Energy: The Role of
Policy Design and Restructuring.” Environmental Energy Technologies Division-Ernest
Orlando Lawerence Berkeley National Laboratory, March 1997, pp. 1-69.


