115
1 BASELINE KPI REPORT Submitted to - Prepared by – Sub consultants
1
BASELINE KPI REPORT
Submitted to - Prepared by –
Sub consultants
Verification of baseline KPIs for Rourkela Smart City
2
Contents
List of tables .................................................................................................................................... 4
List of figures ................................................................................................................................... 5
Verification certificate ...................................................................................................................... 6
Executive Summary ........................................................................................................................ 7
Background of the study.................................................................................................................. 8
Need of Smart Grid leading to Smart City ................................................................................... 8
Objectives of the Smart Grid Project ........................................................................................... 9
Rourkela Smart Grid Leading to Smart City ................................................................................ 9
Concept of AT&C losses ............................................................................................................... 12
Methodology of verification ....................................................................................................... 13
Field interviews ......................................................................................................................... 13
Methodology of sampling .......................................................................................................... 14
Ring fencing & input points ....................................................................................................... 14
Determination of ring fencing .................................................................................................... 15
Key maps of Rourkela Smart city .............................................................................................. 15
AT&C Loss verification (FY 2017-18) ............................................................................................ 22
33 kV Input point feeder-wise losses ........................................................................................ 23
11 kV Input point feeder-wise losses ........................................................................................ 31
Total Input energy into the smart city area ................................................................................ 38
Billed energy booked under the smart city area ........................................................................ 38
Billed units for HT consumers ................................................................................................... 39
Collection booked under the smart city area ............................................................................. 40
AT&C Loss verification (FY 2018-19) ............................................................................................ 43
33 kV Input point feeder-wise losses ........................................................................................ 44
11 kV Input point feeder-wise losses ........................................................................................ 53
Total Input energy into the smart city area ................................................................................ 61
Billed energy booked under the smart city area: ....................................................................... 62
Billed units for HT consumers ................................................................................................... 63
Collection booked under the smart city area ............................................................................. 64
Technical loss verification ............................................................................................................. 67
Calculation of technical losses .................................................................................................. 67
11 kV feeders ........................................................................................................................... 73
T&D loss for sample Distribution transformers .......................................................................... 87

Verification of baseline KPIs for Rourkela Smart City
3
System Reliability Indices .............................................................................................................. 88
SAIFI (System Average Interruption Frequency Index) ............................................................. 88
SAIDI (System Average Interruption Duration Index) ................................................................ 89
Power Quality ................................................................................................................................ 90
Voltage profile ........................................................................................................................... 90
Power Factor profile .................................................................................................................. 92
Harmonics profile .......................................................................................................................... 94
Voltage harmonics profile ......................................................................................................... 94
Transformer failure rate ............................................................................................................... 112
Rourkela Electrical Division (RED) transformer failure ............................................................ 112
Rourkela Sadar Electrical Division (RSED) transformer failure ............................................... 113
Rourkela Sadar Electrical Division (RSED) transformer failure ............................................... 114
Total transformer failure for FY 2017-18 ................................................................................. 115
Verification of baseline KPIs for Rourkela Smart City
4
List of tables
Table 1 - Salient features of the distribution network of the smart city area ........................................ 11
Table 2 - Category-wise consumer details under smart city area ....................................................... 11
Table 3 - List of officials visited .......................................................................................................... 13
Table 4 - Methodology used for sampling .......................................................................................... 14
Table 5 - Standard resistance by conductor / cable type .................................................................... 68
Table 6 - Node-wise technical loss for DAV feeder ............................................................................ 74
Table 7 - Node-wise technical loss for 11 kV BC feeder .................................................................... 75
Table 8 - Node-wise technical loss for 11 kV Jhirpani feeder ............................................................. 77
Table 9 - Node-wise technical loss for 11 kV Nayabazar feeder ........................................................ 79
Table 10 - Node-wise technical loss for 11 kV Plant site feeder ......................................................... 81
Table 11 - Node-wise technical loss for 11 kV ADE feeder ................................................................ 83
Table 12 - Node-wise technical loss for 11 kV Shaktinagar feeder..................................................... 85
Table 13 - Node-wise technical loss for 11 kV PH road feeder .......................................................... 86
Table 14 - Summary of technical loss for sample 11 kV feeders ........................................................ 87
Table 15 - T&D loss for sample Distribution transformers .................................................................. 87
Table 16 - Intteruption of supply -data from feeder metering system .................................................. 88
Table 17 - Voltage profile of 33 kV feeders ........................................................................................ 90
Table 18 - Voltage profile of 11 kV feeders ........................................................................................ 91
Table 19 - Power factor profile of 33 kV feeders ................................................................................ 92
Table 20 - Power factor profile of 11 kV feeders ................................................................................ 93
Table 21 - Voltage harmonics profile ................................................................................................. 94
Table 22 - Current harmonics profile .................................................................................................. 95
Verification of baseline KPIs for Rourkela Smart City
5
List of figures
Figure 1 - List of Baseline KPIs covered under the project ................................................................. 10
Figure 2 - Methodology for verification ............................................................................................... 13
Figure 3 - 33 kV network configuration for FY 18-19 .......................................................................... 15
Figure 4 - Key map of smart city area ................................................................................................ 16
Figure 5 - Kay map of part 1 .............................................................................................................. 17
Figure 6 - Key map of Part 2 .............................................................................................................. 18
Figure 7 - Key map of Part 3 .............................................................................................................. 19
Figure 8 - Key map of Part 4 .............................................................................................................. 20
Figure 9 - Key map of Part 4A ........................................................................................................... 21
Figure 10 - SLD of 33 kV Basanti feeder............................................................................................ 68
Figure 11 - SLD of 33 kV Chhend - Koelnagar feeder ........................................................................ 69
Figure 12 - SLD of 33 kV Old IDC Civil township feeder .................................................................... 70
Figure 13 - SLD of 33 kV Powerhouse road (Town II) feeder ............................................................. 71
Figure 14 - SLD of 33 kV Industrial Estate feeder .............................................................................. 71
Figure 15 - SLD of 33 kV Pilot project feeder ..................................................................................... 72
Figure 16 - Summary of Technical losses at 33 kV level .................................................................... 73
Figure 17 - SLD of 11 kV DAV feeder ................................................................................................ 73
Figure 18 - SLD of 11 kV BC Block feeder ......................................................................................... 75
Figure 19 - SLD of 11 kV Jhirpani feeder ........................................................................................... 76
Figure 20 - SLD of 11 kV Nayabazar feeder ...................................................................................... 78
Figure 21 - SLD of 11 kV Plant site road feeder ................................................................................. 80
Figure 22 - SLD of 11 kV ADE feeder ................................................................................................ 82
Figure 23 - SLD of 11 kV Shaktinagar (Jagda) feeder ........................................................................ 84
Figure 24 - SLD of 11 kV PH road feeder .......................................................................................... 85

Verification of baseline KPIs for Rourkela Smart City
6
Verification certificate
CERTIFICATE ISSUED BY CERTIFIED ENERGY AUDITOR
This is to certify that M/s Feedback Infra Private Limited has completed the third-party independent
verification of AT&C losses at Rourkela smart city project area for the period FY 17-18 and FY 18-19
(till December). Results of the verification are as follows:-
Parameter UoM FY 2017-18 FY 2018-19
Input Energy LU 3,199.09 2,964.18
Billed Energy LU 2,320.12 2,396.70
Billed Amount INR Lacs 12,109.35 13,304.66
Collected Amount INR Lacs 11,610.67 12,439.40
Billing Efficiency % 72.52% 80.86 %
Collection Efficiency % 95.88 % 93.50 %
AT&C loss % 30.46% 24.40 %
The methodology and results have been verified by undersigned certified energy auditor.
Certified by –
Shailesh Jagannath Kalrao
(Vice President)
Feedback Energy Distribution Company (FEDCO)
Certified Energy Auditor

Verification of baseline KPIs for Rourkela Smart City
7
Executive Summary
Rourkela circle consists of three main divisions from which 11 kV feeders are currently catering to the
smart city area under Rourkela Municipal Corporation (RMC). These divisions are – Rourkela Electrical
Division (RED), Rourkela Sadar Electrical Division (RSED) and Rajgangpur Electrical Division (RJP).
RJP provides only 2 nos. 11 kV feeders catering to Rourkela Smart city area.
This report outlines the process and verification results for baseline parameters such as AT&C loss,
technical loss, transformer failure, system reliability and power quality. Data for the study has been
collected for the period FY 2017-18 and FY 2018-19 from MRT division and commercial sections of all
three divisions of Rourkela circle. Summary of findings regarding AT&C loss study are as follows:
Parameter UoM FY 2017-18 FY 2018-19
Input Energy LU 3,199.09 2,964.18
Billed Energy LU 2,320.12 2,396.70
Billed Amount INR Lacs 12,109.35 13,304.66
Collected Amount INR Lacs 11,610.67 12,439.40
Billing Efficiency % 72.52% 80.86 %
Collection Efficiency % 95.88 % 93.50 %
AT&C loss % 30.46% 24.40 %
Technical loss at 33 kV system is 2.45% and technical loss at 11 kV system (sample feeders) is 7.49%.
Voltage at 33 kV and 11 kV level is within permissible limits whereas power factor and harmonics are
also within permissible limits. Transformer failure stands at 2.06% only (excluding HDVS transformers)

Verification of baseline KPIs for Rourkela Smart City
8
Background of the study
Need of Smart Grid leading to Smart City
1. Energy needs of the country are growing at a very rapid pace. In order to meet increasing energy demand, amidst growing environmental concerns as well as energy security issues, we need to increase efficiency in all value chain viz. generation, transmission & distribution. More importantly, efficiency needs to be increased to a point where we shall actually be using less energy to power more establishment/ businesses.
2. Further, to be sustainable, we must be able to produce the amount of energy we need, without much impact on environment through renewable and other non- conventional resources. Consumer aspiration on quality supply, as well as operation in open electricity market regime, integration of renewable energy sources which are intermittent and variable in nature, are also posing new challenges which needs to be addressed. Smart Grid offers a solution towards above challenges. Smart Grid is a confluence of Information, Communication, Electrical/ Digital technologies, integrating all users to efficiently balance demand and supply over an increasing complex network.
3. Cities occupy 4% or less of the world’s terrestrial surface, yet they are home to almost half the
global population, consume close to three-quarters of the world’s natural resources, and generate three-quarters of its pollution and wastes. The United Nations estimates that virtually all net global population and economic growth over the next 30 years will occur in cities, leading to a doubling of current populations. India is also not untouched with above phenomenon. Our cities are becoming more populated continuously as people are migrating from rural areas towards urban areas for more facilities, better life, education and employment.
4. India is urbanizing at an unprecedented rate so much that estimates suggest nearly 600 million
Indians will be living in cities by 2030, up from 290 million as reported in the 2001 census. Increasing urban population and unprecedented load on aged and insufficient infrastructure in our cities has forced many challenges for fulfilling basic facilities like home, energy, employment, health, mobility etc. In addition, infrastructure to supply commodities like electricity, water, gas is becoming insufficient to cater such an inflow of population. Improved living standard of people is resulting in higher consumer aspirations and affordability.
5. Therefore, there is a need for development of Smart Grid leading to smart cities, to provide
quality life for its citizens for inclusive growth, generate employment as well as reduce pressure of infrastructure requirement on other large cities. Strengths of Smart Grid technologies can transform cities to smart cities which shall facilitate in increasing human productivity, realization of inherent urban potential and lesser use of natural resources per person, information access & processing to improve citizen services etc.

Verification of baseline KPIs for Rourkela Smart City
9
Smart Grid Implementation will bring the following advantages:
a) Accurate and well-timed Meter Reading; b) Commercial Loss Reduction; c) Remote connection disconnection of consumer load; d) Accurate tamper alert; e) Notification of sanctioned load violation at consumer level as well as DT overloading; f) Effective Outage Management System linked with Sub Station SCADA and Ring Fencing to
minimize losses during outage; g) Time-based pricing (Time-of-Use Tariff); and h) Peak Load Management to maximize available energy
Objectives of the Smart Grid Project
Following objectives have been outlined for development of Smart Grid in Rourkela Smart City
1. Reduction of AT&C Loss. 2. Automate Grid Operations and perform an accurate DT wise Energy Audit. 3. Increase in billed energy. 4. Empowerment of consumers to participate in the energy management. 5. Improvement in reliability by reduction in outage rate and duration. 6. Improved administration decision making through GIS tools. 7. Increase in customer satisfaction and consumer awareness. 8. Proposed Smart Grid technologies, would facilitate efficient, accurate & effective online
recording & monitoring of the energy exchanges in distribution system to reduce AT&C losses and operational errors viz. reading error, bias error, typographical errors etc. caused by involvement of human element.
9. Implementing technologies that would enhance quality of power at doorstep of consumers and would help in proper monitoring of assets for extended life.
10. Efficient system operation by better load management. 11. Enable high level of customer satisfaction and increased awareness. 12. Demand Side Management to ensure maximization of available power
Rourkela Smart Grid Leading to Smart City
Rourkela is one of Odisha’s five major cities and is one of the largest urban centers located in Chota
Nagpur Plateau is an important industrialized city of the region. The region has a rich and long history
of indigenous settlement (Tribes like Oraons, Mundas, Kharias, Bhuiyans and Bhumijs). It is also one
of the two proposed smart cities from the State of Odisha; selected by the GoI and is the Steel City of
Odisha. It has an area of 53.29 km² and its demography provides a Railway gateway for access to
Eastern Part of India to Southern Part of India and Western Part of India. The population of Rourkela is
over 3.09 lakhs and power consumers are over 81,000 nos. Consumers in Rourkela get electricity from
Western Electricity Supply Company of Odisha (WESCO), one of the distribution utilities catering
to Western part of Odisha with headquarters at Burla.
WESCO is the power distribution utility distributing electricity to the consumers of western part of Odisha
covering 9 revenue districts namely Sambalpur, Bargarh, Jharsuda, Deogarh, Sundargarh, Subarnapur,
Bolangir, Kalahandi and Nuapada etc. For smooth functioning of utility, activities is divided into 5 circles
comprising different revenue districts.
a) Sundargarh District- Rourkela Circle

Verification of baseline KPIs for Rourkela Smart City
10
b) Jharsuguda & Sambalpur District- Sambalpur Circle c) Bargarh District- Bargarh Circle d) Subarnapur & Bolangir District- Bolangir Circle e) Kalahandi & Nuapada District- Kalahandi Circle
Rourkela is divided into mainly 2 urban centers – Rourkela Municipal Corporation (RMC) with an area
of 53.3 Sq Kms and the Rourkela Steel Township (RST) with an area of approximately 54 Sq Kms. As
per census of 2011, the population of RMC and RST is around 3.09 Lacs and 2.1 Lacs respectively.
The current proposal is for development of Smart Grid in RMC area. Known as the Steel City, with the
presence of SAIL’s first Integrated Steel Plant; Rourkela Industrial Area further has 43 Sponge Iron
Plants, 3 cement industries and around 350 MSMEs’. However for implementation of Smart Grid, the
following have been excluded:
a) Area of Rourkela Steel Plant and its residential areas b) Area of Railway and its residential colony c) Area of National Institute of Technology (NIT) and, its residential colony
Odisha Power Transmission Corporation Ltd (OPTCL) and WESCO have appointed PFC Consulting
Ltd (PFCCL) for undertaking various activities for development and implementation of smart grid in
Rourkela city.
PFCCL has engaged Feedback Infra Pvt. Ltd. for study and evaluation of baseline KPIs for
implementation of Smart Grid in Rourkela. The baseline KPIs covered under the project are as follows
–
Figure 1 - List of Baseline KPIs covered under the project
Salient features of the distribution network of the smart city area are as follows –
•Input Energy (as per ring fencing)
•Technical Losses based on asset (DT, feeder, etc) and Voltage level
•Commercial Losses based on units measured, billed, collected, defective meters
AT&C Loss
•SAIFI (System Average Interruption Frequency Index)
•SAIDI (System Average Interruption Duration Index)
•CAIDI (Customer Average Interruption Duration Index)
System reliability indices
•Voltage profile
•PF profile
•Harmonics profile at selected substations
Power quality parameters
•Distribution transformers failure per year in project area
DT failure rate

Verification of baseline KPIs for Rourkela Smart City
11
Sl. No Particulars UoM Value
1 Area covered under smart city Sq. km. 53.29
2 No. of division offices Nos. 3
3 No. of sub-division offices Nos. 7
4 Population covered (as per 2011 census) Nos. 3.09 Lakhs
5 Total consumers (approx.) Nos. 86,768
6 No. of 33 kV feeders (Full & Partially feeding) Nos. 10
7 No. of 11 kV feeders Nos. 42
8 Length of 33 kV lines Ckt km. 79.01
9 Length of 11 kV lines Ckt km. 236.23
10 Length of LT lines Ckt km. 377.81
11 No. of 33 / 11 kV substations Nos. 18
12 No. of 33 / 11 kV power transformers Nos. 38
13 Capacity of 33 / 11 kV power transformers MVA 250.85
14 No. of 33 / 0.4 kV distribution transformers Nos. 13
15 Capacity of 33 / 0.4 kV distribution transformers MVA 1.7
16 No. of 11 / 0.4 kV distribution transformers Nos. 1194
17 Capacity of 11 / 0.4 kV distribution transformers MVA 167.36
Table 1 - Salient features of the distribution network of the smart city area
Category-wise consumer details under smart city area are as follows –
Sl. No. Category of consumers
RED RSED RJP Total
1 Domestic 43,676 27,179 3,411 74,266
2 Commercial 7,892 3,200 811 11,903
3 PHD 19 19 3 41
4 Street Light 8 1 6 15
5 Small Industry 147 93 83 323
6 Medium Industry 19 75 65 159
7 HT Industry 23 29 9 61
Total 51,784 30,596 4,388 86,768
Table 2 - Category-wise consumer details under smart city area

Verification of baseline KPIs for Rourkela Smart City
12
Concept of AT&C losses
AT&C losses provide a realistic picture of energy & revenue loss situation. These losses comprise of
two elements-
1. Technical loss - The technical losses primarily take place due to the following factors:-
a) Transformation Losses (at various transformation levels)
High I2R losses on distribution lines due to inherent resistance and poor power factor in the electrical
network. The level of technical losses varies with type of conductors used, transformation capacity of
transformers and reactive loads among other factors. There are number of software available in market
through which losses can be computed. The essential requirements for calculating technical loss on
power distribution network of any project areas are –
a) 33 kV and below HT network Line Diagrams b) Line Diagrams for each of distribution transformers and LT circuits up to poles/feeder pillars c) Voltage levels, Power factor and Current loading on HT/LT network & network equipment d) Line lengths, cross section & nature of material, network equipment’s load curve etc.
2. Commercial loss - Any illegal consumption of electrical energy, which is not correctly metered, billed and revenue collected, causes commercial losses to the utilities. The commercial losses are primarily attributable to discrepancies in –
a. Meter reading - Commercial losses occur due to discrepancy in meter reading. Meter
reading problems are manifested in form of zero consumption in meter reading books which may be due to premises found locked, untraceable consumers, stopped/defective meters, temporarily disconnected consumers continuing in billing solution etc.
Further, coffee shop reading, collusion with consumers is also source of commercial losses to utilities which are primarily due to suppressed meter reading.
b. Metering - Most of utilities across India are using either electro-mechanical or electronic
meters for consumer metering. Commercial losses through metering can be in form of meter tampering in various forms, bypassing of meters, usage of magnets to slow down the meters, tampering of PT circuits, CT/PT ratios (in case of HT meters) etc.
c. Theft by direct hooking - This is most common and visible form of commercial losses
in which people tend to tap LT lines to indulge in theft through direct hooking.
d. Collection efficiency - Typically in a billing cycle, a distribution utility issues bills against metered energy and assessed (generally in case of agricultural loads and temporary connections) energy. However, in most of instances utility is not able to collect the complete amount billed by it. The ratio of amount collected to total amount billed is termed as collection efficiency. Needless to say that low collection efficiency implies higher commercial losses.
The revenue collected shall exclude the arrears .However in case figures of arrears not available
separately; there is possibility to getting collection efficiency figures of more than 100%. In such cases

Verification of baseline KPIs for Rourkela Smart City
13
efficiency shall be restricted to 100% and shall be used for computation of AT&C losses. The amount
attributing collection efficiency higher than 100% shall be treated as collection against arrears.
Methodology of verification
PFC has issued a guideline in September 2009 with regard to methodology for establishing baseline
AT&C losses. This methodology underlines the procedure for establishing baseline losses for a project
area. Although PFC prescribes the verification of AT&C loss by taking data for 3 billing cycles. The
same was reiterated in given scope of work. However, upon consultation, it was suggested that data
for FY 2017-18 and FY 2018-19 (Q1 to Q3) shall be collated and analyzed in order to account for
seasonal variations.
Figure 2 - Methodology for verification
Field interviews
Information regarding network – such as Single Line Diagrams (SLDs), input energy sheets, billing
database etc. has been collected from the office of Superintending Engineer and all three division offices
which are covered under the area of Smart city project. Interviews conducted during field visit are as
follows:
Sl. No.
Officer Name Designation Circle /
Division Data / Information
1 Mr. A. N. Meher SE (Rourkela) Rourkela Overview of operations, network etc.
2 Mr. J. C. Patra EE (RED) RED Network details of feeders in RED division
3 Mr. B.K. Singh EE (RSED) RSED Network details of feeders in RSED
4 Mr. P.K. Sahoo EE (RJP) RJP Network details of feeders in RJP division
5 Mr. P. K. Sahu DFM RED LT Billing database of RED division
6 Mr. Biswajit Dash DFM RSED LT Billing database of RSED division
7 Mr. J. P. Lenka DFM RJP LT Billing database of RJP division
8 Mr. Arvind Sahu EE MRT TTB / Metering of 11 kV feeders
9 Mrs. Anamika AE MRT Input energy, HT billing data
Table 3 - List of officials visited
Field interviews
SamplingData
collectionAnalysis

Verification of baseline KPIs for Rourkela Smart City
14
Methodology of sampling
Wherever possible, 100 % samples have been taken. However, due to lack of appropriate data and
paucity of time, certain samples have been taken for the dipstick study as mutually agreed with WESCO
/ OPTCL. Methodology used for sampling is given as follows –
KPI / Parameter Sample methodology
AT&C loss 100 % feeders covering 33 kV and 11 kV level
Technical loss of 33 kV lines 100% 33 kV feeders
Technical loss of 11 kV lines 8 Nos. of 11 kV feeders as mutually agreed
T&D loss of LT network 10 Nos. of DTs as mutually agreed
SAIFI, SAIDI, CAIDI 100% 11 kV feeders with available data
Voltage & PF Profile 100% 11 kV feeders with available data
Total Harmonic Distortion 100% 11 kV feeders with testing facility
Transformer Failure 100% transformer failure covering all non-HVDS transformers
Consumer meter reading and billing 500 consumers covering all categories and feeders
Table 4 - Methodology used for sampling
Ring fencing & input points
According to PFC methodology for calculation of AT&C losses, “… utility can do ring fencing of towns
through installation of import/export meters at project area boundaries. There can be 11 kV feeders
feeding within and outside project area. The utility may install import/export meters at town boundaries
and account for total energy supplied beyond town boundaries through them. While computing energy
consumption of town, this energy may be subtracted from total energy consumption arrived from meter
reading.” Therefore, the electrical network of Rourkela has been studied in order to determine import
and export points for Smart City area.
The entire city can be divided into three main zones namely –
a. Rourkela Municipal Corporation area (RMC area) b. Rourkela Steel Plant Area (RSP area) c. NIT Area

Verification of baseline KPIs for Rourkela Smart City
15
Out of these three areas, RMC area shall only be covered under the Smart city project. Therefore,
feeders at 33 kV and 11 kV level providing power within RMC area have been evaluated for the purpose
of Baseline study. Methodology of determining the ring fencing is discussed in the following section.
Determination of ring fencing
There are 2 nos. of 132 / 33 kV Grid Sub-Stations (GSS) feeding electricity to Rourkela Smart City
project area (RMC area as specified above). There are 10 nos. of 33 kV feeders emanating from these
132 / 33 kV GSS which partially or fully provide power within the Smart city area. Out of these, 6 nos.
of 33kV feeders are fully catering to smart city area, whereas 4 nos. partially cater to smart city area.
It may be noted that 33 kV and 11 kV network has undergone changes from FY 17-18 to FY 18-19.
Current network configuration of FY 18-19 is given as follows –
Figure 3 - 33 kV network configuration for FY 18-19
Key maps of Rourkela Smart city
Key map of the electrical network of Rourkela Smart city area has been provided by WESCO. This map
shows the location of 132 / 33 kV GSS, 33 / 11 kV substations as well as interconnecting 33 kV lines.
The key map may be broken down into 5 parts for easy reference. The maps are enclosed for reference
–

16
Figure 4 - Key map of smart city area

Verification of baseline KPIs for Rourkela Smart City
17
Figure 5 - Kay map of part 1

18
Figure 6 - Key map of Part 2

19
Figure 7 - Key map of Part 3

20
Figure 8 - Key map of Part 4

21
Figure 9 - Key map of Part 4A

22
AT&C Loss verification (FY 2017-18)
AT&C loss has been verified for all input points (33 kV and 11 kV) by the following methodology:
Step 1: Individual input of 33 kV and 11 kV feeders have been derived from feeder meter reading by
the following formula:
Input Energy (Feeder A) = (Meter reading on 1st April 2018 – Meter reading on 1st April 2017) x
Multiplying factor
Step 2: For each division, LT billing data is available as a database file for each month. This billing data
consists of billed units, billed amount and collection for each consumer every month. As consumers are
tagged with 11 kV feeders, we can derive 11 kV feeder-wise billed units, billed amount and collection
from the database. Summation of billed units for connected 11 kV feeders will give the LT units billed
for the 33 kV feeder. HT billing data is available as a database file for all HT consumers. A consumer
list pertaining to smart city area has been shared by MRT division. This has been followed in deriving
billing and collection for HT consumers. With these data, the billing efficiency of the 33 kV feeder can
be derived as per the following formula:
Billing Efficiency (Feeder A) = (Billed energy of 33 kV consumers + Billed energy of 11 kV consumers
+ Billed energy of LT consumers of 11 kV feeders from connected substations) x 100 / Input Energy
(Feeder A)
Step 3: Collection Efficiency can be determined as follows:
Collection Efficiency (Feeder A) = (Amount Collected from 33 kV consumers + Amount Collected from
11 kV consumers + Amount Collected from LT consumers of 11 kV feeders from connected substations)
x 100 / (33 kV consumers billed amount + 11 kV consumers billed amount + LT consumer billed amount)
Step 4: AT & C for 33 kV feeder –
AT&C loss = 1 – (Billing efficiency x Collection efficiency) %

Verification of baseline KPIs for Rourkela Smart City
23
33 kV Input point feeder-wise losses
33 kV Industrial estate & 33 kV pilot project feeders
The input energy recorded for 33 kV Industrial Estate & 33 kV Pilot Project feeders can be summed up
and compared with 11 kV feeders emanating from 33/11 kV Industrial Estate & Pilot Project substations
in order to determine loss on 33 kV line and power transformer loss.
It is to be noted that AT&C calculation is done for the two feeders as a whole due to regular switchovers
for load sharing.
Feeder Name Reading on 1stApril 2017
Reading on 1stApril 2018
Multiplying Factor (MF)
Input Energy
(LU)
33 kV Industrial Estate 71,04,601 75,20,804 60 249.73
33 kV Pilot Project feeder 14,29,325 15,51,167 60 45.55
Total input energy for 33 kV Industrial Estate & 33 kV Pilot Project feeder 295.28
Billed units of all 11 kV feeders can be summed up as per the list of feeder codes1. Billed units for 11
kV feeders are added from database files and the results are collated below –
1 List of 11 kV feeders with feeder codes provided by WESCO – Annexure 1

Verification of baseline KPIs for Rourkela Smart City
24
Feeder Name LT billed energy
(LU) 11 kV HT billed
energy (LU) Total billed energy (LU)
11 kV Pilot Project (Town) 2.87 1.34 4.23
11 kV Industrial Estate feeder 105.09 5.71 110.8
11 kV Town feeder 54.34 13.64 67.98
Total energy billed for connected consumers of 11 kV feeders 182.99
Billed energy for 33 kV consumer M/s Utkal Flour Mills 19.03
Total billed energy 33 kV consumer + 11 kV feeders 202.02
Total input energy for 33 kV Industrial Estate & 33 kV Pilot Project feeder 295.28
Billing efficiency (%) 68.42%
Feeder / Consumer Name LT billed
amount (INR Lacs)
HT billed amount (INR
Lacs)
LT collected amount (INR
Lacs)
HT collected amount (INR
Lacs)
11 kV Pilot Project (Town) 21.11 6.59 20.82 6.59
11 kV Industrial Estate feeder 521.49 42.63 477.17 42.63
11 kV Town feeder 330.13 93.37 419.26 93.37
33 kV Utkal Flour Mill - 116.93 - 116.93
Total 1132.25 1176.77
Collection efficiency (%) 103.92 %
Therefore AT&C loss for 33 kV Industrial Estate & 33 kV Pilot Project feeders can be calculated as
follows:
Parameter Value
Billing efficiency (%) 68.42
Collection efficiency (%) (Capped at 100 %) 100.00
AT&C Loss 31.58 %
33 kV old IDC feeder
The input energy recorded for 33 kV Old IDC feeder can be summed up and compared with 11 kV
feeders emanating from 33/11 kV Panposh substation in order to determine loss on 33 kV line and
power transformer loss.
The Input energy for 33kV IDC feeder is calculated by adding up consumptions as per the load survey
data available with WESCO M.R.T division Rourkela

Verification of baseline KPIs for Rourkela Smart City
25
Feeder Name Consumption
for the month of April 2017
Cumulative consumption
up to the month of April
2018
Multiplying Factor (MF)
Input Energy
(LU)
33 kV Old IDC feeder 45.97 404.74 120 450.72
Total input energy for 33 kV Old IDC feeder 450.72
Billed units of all 11 kV feeders can be summed up as per the list of feeder codes2. Billed units for 11
kV feeders are added from database files and the results are collated below –
Feeder Name LT billed energy
(LU) 11 kV HT billed
energy (LU) Total billed energy (LU)
11 kV PHD feeder 0.24 13.52 13.76
11 kV Raw Water feeder 23.87 35.72 59.59
11 kV College feeder 90.35 27.85 118.20
11 kV Town feeder 150.61 - 150.61
11 kV RGH feeder - - -
Total energy billed for connected consumers of 11 kV feeders 342.16
Billed energy for 33 kV consumer Project Manager PMU 30.36
Billed energy for 33/0.4 kV Balughat (AGLX) 9.31
Total billed energy 33 kV consumer + 11 kV feeders 381.83
Total input energy for 33 kV Old IDC feeder 450.72
Billing efficiency (%) 84.72 %
2 List of 11 kV feeders with feeder codes provided by WESCO – Annexure 1

Verification of baseline KPIs for Rourkela Smart City
26
Feeder / Consumer Name LT billed
amount (INR Lacs)
HT billed amount (INR
Lacs)
LT collected amount (INR
Lacs)
HT collected amount (INR
Lacs)
11 kV PHD feeder 1.33 70.65 1.84 70.65
11 kV Raw Water feeder 135.06 219.96 118.69 219.96
11 kV College feeder 565.87 185.33 538.94 185.33
11 kV Town feeder 901.28 - 852.31 -
11 kV RGH feeder - - - -
33 kV Project Manager PMU - 180.591 - 180.591
33/0.4 kV Balughat (AGLX) 52.57 - 39.99 -
Total 2312.64 2208.30
Collection efficiency (%) 95.49%
Therefore AT&C loss for 33 kV Old IDC feeder can be calculated as follows:
Parameter Value
Billing efficiency (%) 84.73
Collection efficiency (%) 95.49
AT&C Loss 19.11 %
33 kV Power House (Town – 2) feeder
The input energy recorded for 33 kV Town - 2 feeder can be summed up and compared with 11 kV
feeders emanating from 33/11 kV Power house road substation in order to determine loss on 33 kV line
and power transformer loss.
Feeder Name Reading as on 1st April 2017
Reading as on 1st April 2018
Multiplying Factor (MF)
Input Energy
(LU)
33 kV Town-2 Feeder 90,30,284 95,94,298 120 676.81
Total input energy for 33 kV Town - 2 feeder 676.81

Verification of baseline KPIs for Rourkela Smart City
27
Billed units of all 11 kV feeders can be summed up as per the list of feeder codes3. Billed units for 11
kV feeders are added from database files and the results are collated below –
Feeder Name LT billed energy
(LU) 11 kV HT billed
energy (LU) Total billed energy (LU)
11 kV Udit Nagar feeder 133.49 22.69 156.18
11 kV Main Road feeder 121.73 75.01 196.74
11 kV Power house road 58.85 0 58.85
11 kV Plant Site feeder 106.59 2.62 109.21
Total energy billed for connected consumers of 11 kV feeders 520.98
Total input energy for 33 kV Town - 2 feeder 676.81
Billing efficiency (%) 76.98%
Feeder / Consumer Name LT billed
amount (INR Lacs)
HT billed amount (INR
Lacs)
LT collected amount (INR
Lacs)
HT collected amount (INR
Lacs)
11 kV Udit Nagar feeder 718.36 137.02 734.93 137.02
11 kV Main Road feeder 641.13 486.05 688.66 486.05
11 kV Power house road 274.13 0 283.71 0
11 kV Plant Site feeder 516.54 24.1 466.78 24.1
Total 2797.33 2821.25
Collection efficiency (%) 100.86%
Therefore AT&C loss for 33 kV Town - 2 feeder can be calculated as follows:
3 List of 11 kV feeders with feeder codes provided by WESCO – Annexure 1

Verification of baseline KPIs for Rourkela Smart City
28
Parameter Value
Billing efficiency (%) 76.98
Collection efficiency (%) (Capped at 100 %) 100.00
AT&C Loss 23.02%
It may be noted that according to PFC guidelines Collection efficiency shall be considered not more
than 100% while computing AT&C losses.
33 kV Basanti feeder
The input energy recorded for 33 kV Basanti feeder can be summed up and compared with 11 kV
feeders emanating from 33/11 kV Basanti substation in order to determine loss on 33 kV line and power
transformer loss.
Feeder Name Reading on 1st
April 2017 Reading on 1st
April 2018 Multiplying Factor (MF)
Input Energy
(LU)
33 kV Basanti feeder 7,17,909 15,01,286 60 470.03
Total input energy for 33 kV Basanti feeder 470.03
Billed units of all 11 kV feeders can be summed up as per the list of feeder codes. Billed units for 11 kV
feeders are added from database files and the results are collated below –

Verification of baseline KPIs for Rourkela Smart City
29
Feeder Name LT billed energy
(LU) 11 kV HT billed
energy (LU) Total billed energy (LU)
11 kV DAV feeder 117 0 117
11 kV PHD feeder 48.28 1.75 50.03
11 kV MS Palli feeder 117.62 2.05 119.67
Total energy billed for connected consumers of 11 kV feeders 286.70
Total input energy for 33 kV Basanti & Town 1 feeder 470.03
Billing efficiency (%) 61.00%
Feeder / Consumer Name LT billed
amount (INR Lacs)
HT billed amount (INR
Lacs)
LT collected amount (INR
Lacs)
HT collected amount (INR
Lacs)
11 kV DAV feeder 492.67 - 477.42 -
11 kV PHD feeder 231.16 12.19 235.53 12.19
11 kV MS Palli feeder 507.89 14.89 254.25 14.89
Total 1258.80 994.28
Collection efficiency (%) 78.98%
Therefore AT&C loss for 33 kV Basanti & Town – 1 feeder can be calculated as follows:
Parameter Value
Billing efficiency (%) 61.00
Collection efficiency (%) 78.98
AT&C Loss 51.82%
33 kV Chhend-Koelnagar feeder
The input energy recorded for 33 kV Chhend-Koelnagar feeder can be summed up and compared with
11 kV feeders emanating from 33/11 kV Chhend and 33/11 kV Koelnagar substations in order to
determine loss on 33 kV line and power transformer loss. The Chhend Loelnagar feeder is also
connected to 33/11 kV Kalingavihar Substation. So the effective input for the smart city area
Feeder Name Reading on 1st
April 2017 Reading on 1st
April 2018 Multiplying Factor (MF)
Input Energy
(LU)
33 kV Chhend-Koelnagar 180,90,580 187,21,100 120 756.62
Total input energy for 33 kV Chhend-Koelnagar feeder 756.62

Verification of baseline KPIs for Rourkela Smart City
30
Billed units of all 11 kV feeders can be summed up as per the list of feeder codes. Billed units for 11 kV
feeders are added from database files and the results are collated below –
Feeder Name LT billed energy
(LU) 11 kV HT billed
energy (LU) Total billed energy (LU)
11 kV Jhirpani feeder 48.10 5.77 53.87
11 kV BC Block feeder 51.15 - 51.15
11 kV ADE Block feeder 80.37 - 80.37
11 kV Hamirpur feeder 36.65 - 36.65
11 kV Self Finance feeder 54.84 1.49 56.33
11 kV Panposh feeder 52.33 3.02 55.35
11 kV RDA feeder 35.39 2.50 37.89
11 kV Chhend 1st Phase 73.08 73.08
11 kV Kalinga Vihar 61.05 61.05
11 kV Luhakera 23.21 5.64 28.84
Total energy billed for connected consumers of 11 kV feeders 534.59
Total input energy for 33 kV Chhend-Koelnagar feeder 756.62
Billing efficiency (%) 70.65 %
Feeder / Consumer Name LT billed
amount (INR Lacs)
HT billed amount (INR
Lacs)
LT collected amount (INR
Lacs)
HT collected amount (INR
Lacs)
11 kV Jhirpani feeder 215.01 37.58 190.95 37.58
11 kV BC Block feeder 228.81 - 248.89 -
11 kV ADE Block feeder 383.12 - 415.99 -

Verification of baseline KPIs for Rourkela Smart City
31
Feeder / Consumer Name LT billed
amount (INR Lacs)
HT billed amount (INR
Lacs)
LT collected amount (INR
Lacs)
HT collected amount (INR
Lacs)
11 kV Hamirpur feeder 155.25 - 153.65 -
11 kV Self Finance feeder 280.24 13.35 262.45 13.35
11 kV Panposh feeder 271.62 23.24 218.99 23.24
11 kV RDA feeder 170.14 13.35 154.94 13.35
11 kV Chhend 1st Phase 368.13 - 336.46 -
11 kV Kalinga Vihar 305.08 - 278.53 -
11 kV Luhakera 119.66 24.50 60.90 24.50
Total 2609.08 2433.77
Collection efficiency (%) 93.28 %
Therefore AT&C loss for 33 kV Chhend-Koelnagar feeder can be calculated as follows:
Parameter Value
Billing efficiency (%) 70.65
Collection efficiency (%) 93.28
AT&C Loss 34.09 %
11 kV Input point feeder-wise losses
11 kV Modern India - 1 feeder
11 kV Modern India – 1 feeder emanates from 33/11 kV Lathikata substation which in turn is supplied
power through 33 kV Lathikata feeder from 132/33 kV Rourkela GSS. While other feeders from 33/11
kV Lathikata substation cater to areas outside smart city, 11 kV Modern India – 1 (partially) caters to
Rourkela Smart city area. Input energy of the feeder is calculated as follows:
The total transformation capacity installed on the feeder is 8000kVA, out of that around 800kVA of
transformation capacity falls under the smart city area. Therefore the input billing and collection is
proportioned to be 10% of the total figures of the feeder as whole.
Feeder Name Input Energy (LU)
11 kV Modern India - I feeder 11.47

Verification of baseline KPIs for Rourkela Smart City
32
Billed units for the feeder can be derived by adding up LT billed energy from LT billing database provided
by DFMs and HT billed energy from HT billing database provided by MRT division.
Feeder Name LT billed energy
(LU) 11 kV HT billed
energy (LU) Total billed energy (LU)
11 kV Modern India - I (AIAA) 9.08 - 9.08
Total input energy for 11 kV Modern India - 1 feeder 11.47
Billing efficiency (%) 79.00 %
Feeder / Consumer Name LT billed
amount (INR Lacs)
HT billed amount (INR
Lacs)
LT collected amount (INR
Lacs)
HT collected amount (INR
Lacs)
11 kV Modern India - I (AIAA) 39.50 - 41.17 -
Total 39.50 41.17
Collection efficiency (%) 104.22 %
Therefore AT&C loss for 11 kV Modern India – 1 feeder can be calculated as follows:
Parameter Value
Billing efficiency (%) 79.00 %
Collection efficiency (%)(Capped at 100%) 100.00 %
AT&C Loss 21.00 %
11 kV Ved Vyas feeder
11 kV Vedvyas feeder emanates from 33/11 kV Vedvyas substation which in turn is supplied power
through 33 kV Vedvyas feeder from 132/33 kV Chhend GSS. While other feeders from 33/11 kV
Vedvyas substation cater to areas outside smart city, 11 kV Vedvyas and 11 kV Gopapalli feeders
caters to Rourkela Smart city area. Input energy of the feeder is calculated as follows:

Verification of baseline KPIs for Rourkela Smart City
33
Feeder Name Reading on 1st
April 2017 Reading on 1st
April 2018 Multiplying Factor (MF)
Input Energy
(LU)
11 kV Vedvyas feeder 5258.61 5,867.71 20000 121.82
Total input energy for 11 kV Vedvyas feeder 121.82
Billed units for the feeder can be derived by adding up LT billed energy from LT billing database provided
by DFMs and HT billed energy from HT billing database provided by MRT division.
Feeder Name LT billed energy
(LU) 11 kV HT billed
energy (LU) Total billed energy (LU)
11 kV Vedvyas (BDCC) 78.21 25.87 104.08
Total input energy for 11 kV Vedvyas feeder 121.82
Billing efficiency (%) 85.44 %
Feeder / Consumer Name LT billed
amount (INR Lacs)
HT billed amount (INR
Lacs)
LT collected amount (INR
Lacs)
HT collected amount (INR
Lacs)
11 kV Vedvyas (BDCC) 457.65 177.21 454.36 177.21
Total 634.86 631.57
Collection efficiency (%) 99.48 %
Therefore AT&C loss for 11 kV Vedvyas feeder can be calculated as follows:
Parameter Value
Billing efficiency (%) 85.44
Collection efficiency (%) 99.48
AT&C Loss 15.00 %
11 kV Gopapalli feeder
11 kV Gopapalli feeder emanates from 33/11 kV Vedvyas substation which in turn is supplied power
through 33 kV Vedvyas feeder from 132/33 kV Chhend GSS. While other feeders from 33/11 kV
Vedvyas substation cater to areas outside smart city, 11 kV Vedvyas and 11 kV Gopapalli feeders
caters to Rourkela Smart city area. Input energy of the feeder is calculated as follows:

Verification of baseline KPIs for Rourkela Smart City
34
Feeder Name Reading on 1st
April 2017 Reading on 1st
April 2018 Multiplying Factor (MF)
Input Energy
(LU)
11 kV Gopapalli feeder 11,029.88 11,340.44 20000 62.11
Total input energy for 11 kV Gopapalli feeder 62.11
Billed units for the feeder can be derived by adding up LT billed energy from LT billing database provided
by DFMs and HT billed energy from HT billing database provided by MRT division.
Feeder Name LT billed energy
(LU) 11 kV HT billed
energy (LU) Total billed energy (LU)
11 kV Gopapalli (BDCB) 25.77 10.51 36.28
Total input energy for 11 kV Gopapalli feeder 62.11
Billing efficiency (%) 58.41 %
Feeder / Consumer Name LT billed
amount (INR Lacs)
HT billed amount (INR
Lacs)
LT collected amount (INR
Lacs)
HT collected amount (INR
Lacs)
11 kV Gopapalli (BDCB) 148.46 69.79 142.57 69.79
Total 218.25 212.36
Collection efficiency (%) 97.30 %
Therefore AT&C loss for 11 kV Gopapalli feeder can be calculated as follows:
Parameter Value
Billing efficiency (%) 58.41
Collection efficiency (%) 97.30
AT&C Loss 43.16 %
11 kV Nayabazar feeder
11 kV Nayabazar feeder emanates from 33/11 kV REC substation which in turn is supplied power
through 33 kV NIT feeder from 132/33 kV Chhend GSS. All three feeders from 33/11 kV REC substation
cater to areas within smart city. Input energy of 11 kV Nayabazar feeder is calculated as follows:

Verification of baseline KPIs for Rourkela Smart City
35
Feeder Name Reading on 1st
April 2017 Reading on 1st
April 2018 Multiplying Factor (MF)
Input Energy
(LU)
11 kV Nayabazar feeder 59,487.23 63,169.79 4000 147.30
Total input energy for 11 kV Nayabazar feeder 147.30
Billed units for the feeder can be derived by adding up LT billed energy from LT billing database provided
by DFMs and HT billed energy from HT billing database provided by MRT division.
Feeder Name LT billed energy
(LU) 11 kV HT billed
energy (LU) Total billed energy (LU)
11 kV Nayabazar (AAAA) 91.91 5.3 97.21
Total input energy for 11 kV Nayabazar feeder 147.30
Billing efficiency (%) 65.99 %
Feeder / Consumer Name LT billed
amount (INR Lacs)
HT billed amount (INR
Lacs)
LT collected amount (INR
Lacs)
HT collected amount (INR
Lacs)
11 kV Nayabazar (AAAA) 381.92 27.01 355.02 27.01
Total 408.93 382.03
Collection efficiency (%) 93.42 %
Therefore AT&C loss for 11 kV Nayabazar feeder can be calculated as follows:
Parameter Value
Billing efficiency (%) 65.99
Collection efficiency (%) 93.42
AT&C Loss 38.35 %
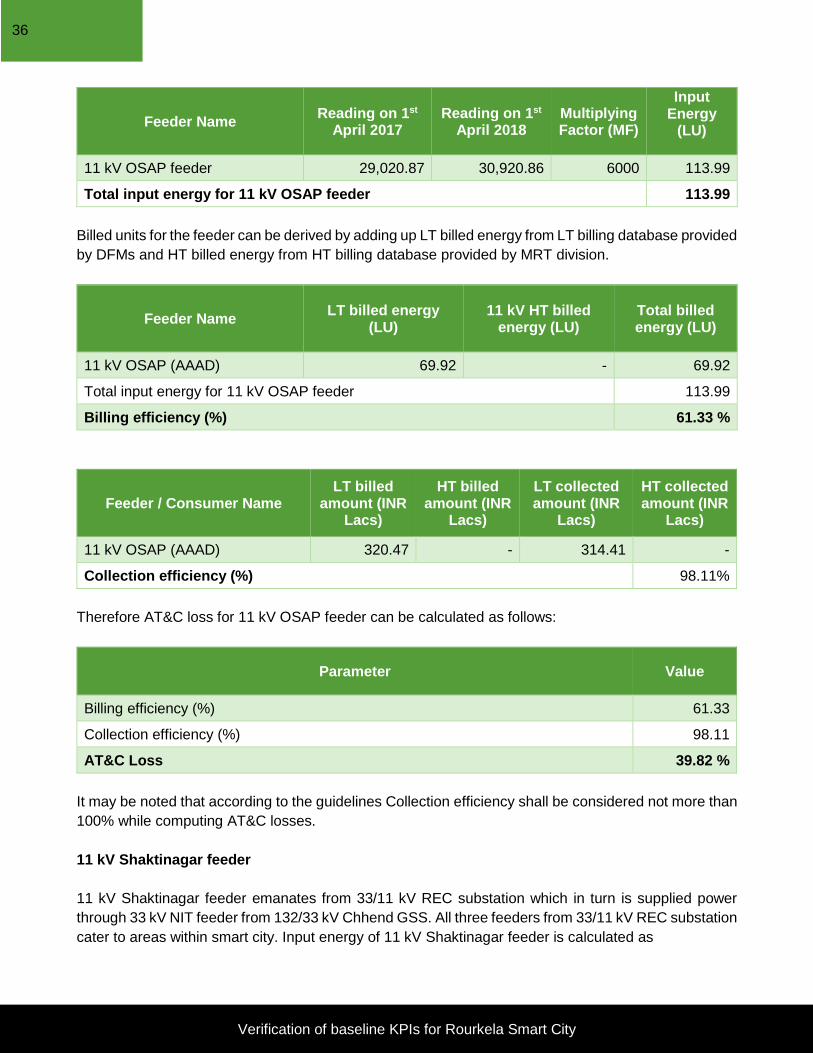
11 kV OSAP feeder
11 kV OSAP feeder emanates from 33/11 kV REC substation which in turn is supplied power through
33 kV NIT feeder from 132/33 kV Chhend GSS. All three feeders from 33/11 kV REC substation cater
to areas within smart city. Input energy of 11 kV OSAP feeder is calculated as follows:
Verification of baseline KPIs for Rourkela Smart City
36
Feeder Name Reading on 1st
April 2017 Reading on 1st
April 2018 Multiplying Factor (MF)
Input Energy
(LU)
11 kV OSAP feeder 29,020.87 30,920.86 6000 113.99
Total input energy for 11 kV OSAP feeder 113.99
Billed units for the feeder can be derived by adding up LT billed energy from LT billing database provided
by DFMs and HT billed energy from HT billing database provided by MRT division.
Feeder Name LT billed energy
(LU) 11 kV HT billed
energy (LU) Total billed energy (LU)
11 kV OSAP (AAAD) 69.92 - 69.92
Total input energy for 11 kV OSAP feeder 113.99
Billing efficiency (%) 61.33 %
Feeder / Consumer Name LT billed
amount (INR Lacs)
HT billed amount (INR
Lacs)
LT collected amount (INR
Lacs)
HT collected amount (INR
Lacs)
11 kV OSAP (AAAD) 320.47 - 314.41 -
Collection efficiency (%) 98.11%
Therefore AT&C loss for 11 kV OSAP feeder can be calculated as follows:
Parameter Value
Billing efficiency (%) 61.33
Collection efficiency (%) 98.11
AT&C Loss 39.82 %
It may be noted that according to the guidelines Collection efficiency shall be considered not more than
100% while computing AT&C losses.
11 kV Shaktinagar feeder
11 kV Shaktinagar feeder emanates from 33/11 kV REC substation which in turn is supplied power
through 33 kV NIT feeder from 132/33 kV Chhend GSS. All three feeders from 33/11 kV REC substation
cater to areas within smart city. Input energy of 11 kV Shaktinagar feeder is calculated as

Verification of baseline KPIs for Rourkela Smart City
37
Feeder Name Reading on 1st
April 2017 Reading on 1st
April 2018 Multiplying Factor (MF)
Input Energy
(LU)
11 kV Shaktinagar Feeder 9759.82 15956.4 1500 92.95
Total input energy for 11 kV Shaktinagar feeder 92.95
Billed units for the feeder can be derived by adding up LT billed energy from LT billing database provided
by DFMs and HT billed energy from HT billing database provided by MRT division.
Feeder Name LT billed energy
(LU) 11 kV HT billed
energy (LU) Total billed energy (LU)
11 kV Shaktinagar (AAAB) 74.35 3.08 77.43
Total input energy for 11 kV Shaktinagar feeder 92.95
Billing efficiency (%) 83.30%
Feeder / Consumer Name LT billed
amount (INR Lacs)
HT billed amount (INR
Lacs)
LT collected amount (INR
Lacs)
HT collected amount (INR
Lacs)
11 kV Shaktinagr (AAAB) 354.57 22.67 372.09 22.67
Collection efficiency (%) 104.60%
Therefore AT&C loss for 11 kV Shaktinagar feeder can be calculated as follows:
Parameter Value
Billing efficiency (%) 83.30
Collection efficiency (%) (Capped at 100%) 100.00
AT&C Loss 16.70%
It may be noted that according to the guidelines Collection efficiency shall be considered not more than
100% while computing AT&C losses.

Verification of baseline KPIs for Rourkela Smart City
38
Total Input energy into the smart city area
Sl. No. Feeder Name Input Energy (LU)
1 33 kV Industrial Estate feeder 249.72
2 33 kV Pilot Project feeder 45.55
3 33 kV Old IDC feeder 450.72
4 33 kV Town - 2 feeder 676.81
5 33 kV Basanti feeder 470.03
6 33 kV Town–1 feeder
7 33 kV Chhend-Koelnagar feeder 756.62
8 11 kV Modern India - I feeder 11.47
9 11 kV Vedvyas feeder 121.82
10 11 kV Gopapalli feeder 62.11
11 11 kV Nayabazar feeder 147.3
12 11 kV OSAP feeder 113.99
13 11 kV Shaktinagar feeder 92.95
Total input energy for Rourkela smart city (FY 2017-18) 3,199.09
Billed energy booked under the smart city area
Feeder Name
LT billed
energy (LU)
11 kV HT billed
energy (LU)
Total billed energy (LU)
11 kV Pilot Project (Town) 2.87 1.34 4.21
11 kV Industrial Estate feeder 105.09 5.71 110.8
11 kV Town feeder 54.34 13.64 67.98
11 kV PHD feeder 0.24 13.52 13.76
11 kV Raw Water feeder 23.87 35.72 59.59
11 kV College feeder 90.35 27.85 118.2
11 kV Town feeder 150.61 0 150.61
11 kV RGH feeder 0 0 0
11 kV Udit Nagar feeder 133.49 22.69 156.18
11 kV Main Road feeder 121.73 75.01 196.74
11 kV Power house road 58.85 0 58.85

Verification of baseline KPIs for Rourkela Smart City
39
11 kV Plant Site feeder 106.59 2.62 109.21
11 kV DAV feeder 117 0 117
11 kV PHD feeder 48.28 1.75 50.03
11 kV MS Palli feeder 117.62 2.05 119.67
11 kV Jhirpani feeder 48.1 5.77 53.87
11 kV BC Block feeder 51.15 0 51.15
11 kV ADE Block feeder 80.37 0 80.37
11 kV Hamirpur feeder 36.65 0 36.65
11 kV Self Finance feeder 54.84 1.49 56.33
11 kV Panposh feeder 52.33 3.02 55.35
11 kV RDA feeder 35.39 2.5 37.89
11 kV Chhend 1st Phase 73.08
73.08
11 kV Kalinga Vihar 61.05
61.05
11 kV Luhakera 23.21 5.64 28.85
11 kV Modern India - I (AIAA) 9.08 0 9.08
11 kV Vedvyas (BDCC) 78.21 25.87 104.08
11 kV Gopapalli (BDCB) 25.77 10.51 36.28
11 kV Nayabazar (AAAA) 91.91 5.3 97.21
11 kV OSAP (AAAD) 69.92 0 69.92
11 kV Shaktinagar (AAAB) 74.35 3.08 77.43
Total LT & 11 kV HT 1996.34 265.08 2261.42
Total energy billed for connected consumers of 11 kV feeders 2261.42
Billed energy for 33 kV consumers and DT 58.7
Total billed energy 33 kV consumer + 11 kV feeders 2,320.12
Total input energy 3,199.09
Billing efficiency (%) 72.52%
Billed units for HT consumers
Sl. No. Consumer Name Billed Energy (LU)
1 Utkal Flour Mills 19.03
2 Project Manager (PMU) 30.36

Verification of baseline KPIs for Rourkela Smart City
40
Sl. No. Consumer Name Billed Energy (LU)
3 33/0.4 kV Balughat transformer 9.31
Collection booked under the smart city area
Feeder / Consumer Name LT billed amount (INR
Lacs)
HT billed amount (INR
Lacs)
LT collected amount (INR
Lacs)
HT collected amount (INR
Lacs)
33 kV Utkal Flour Mill 0 116.93 0 116.93
33 kV Project Manager PMU 0 180.591 0 180.591
33/0.4 kV Balughat (AGLX) 52.57 0 39.99 0
11 kV Pilot Project (Town) 21.11 6.59 20.82 6.59
11 kV Industrial Estate feeder 521.49 42.63 477.17 42.63
11 kV Town feeder 330.13 93.37 419.26 93.37
11 kV PHD feeder 1.33 70.65 1.84 70.65
11 kV Raw Water feeder 135.06 219.96 118.69 219.96
11 kV College feeder 565.87 185.33 538.94 185.33
11 kV Town feeder 901.28 - 852.31 -
11 kV RGH feeder
11 kV DAV feeder 492.67 0 477.42 0
11 kV PHD feeder 231.16 12.19 235.53 12.19
11 kV MS Palli feeder 507.89 14.89 254.25 14.89
11 kV Jhirpani feeder 215.01 37.58 190.95 37.58
11 kV BC Block feeder 228.81 0 248.89 0
11 kV ADE Block feeder 383.12 0 415.99 0
11 kV Hamirpur feeder 155.25 0 153.65 0
11 kV Self Finance feeder 280.24 13.35 262.45 13.35
11 kV Panposh feeder 271.62 23.24 218.99 23.24
11 kV RDA feeder 170.14 13.35 154.94 13.35
11 kV Chhend 1st Phase 368.13 0 336.46 0
11 kV Kalinga Vihar 305.08 0 278.53 0
11 kV Luhakera 119.66 24.5 60.9 24.5
11 kV Udit Nagar feeder 718.36 137.02 734.93 137.02
11 kV Main Road feeder 641.13 486.05 688.66 486.05
Verification of baseline KPIs for Rourkela Smart City
41
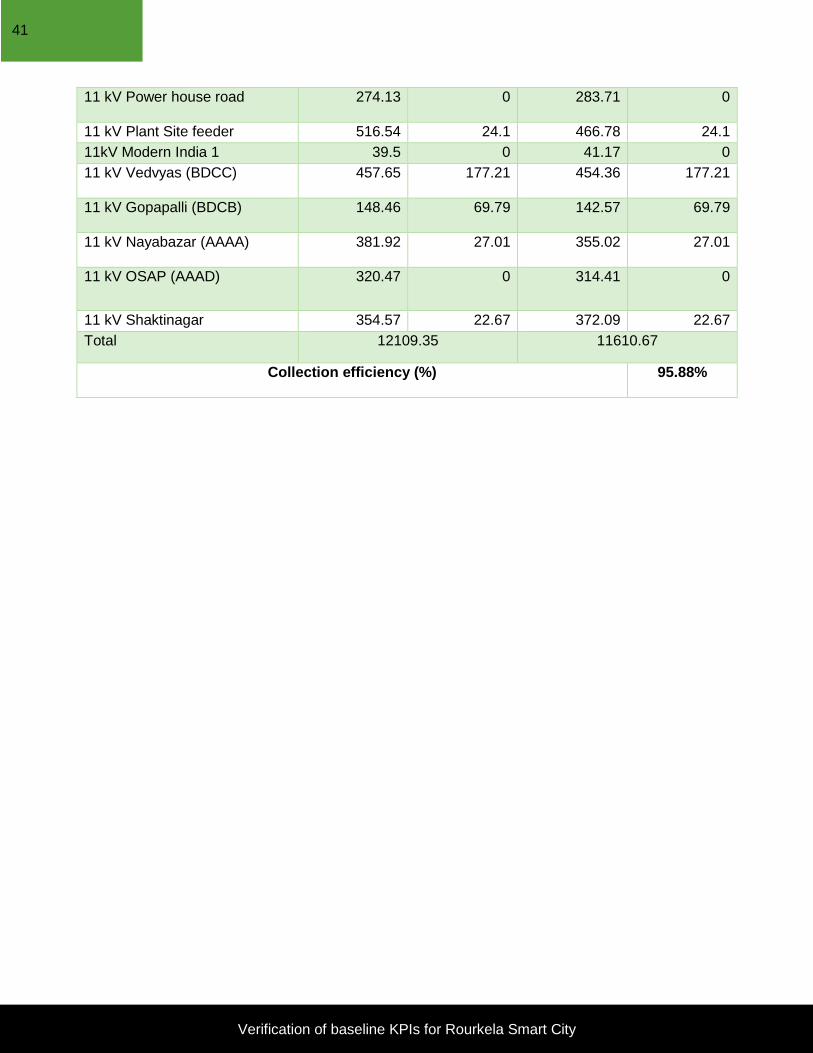
11 kV Power house road 274.13 0 283.71 0
11 kV Plant Site feeder 516.54 24.1 466.78 24.1
11kV Modern India 1 39.5 0 41.17 0
11 kV Vedvyas (BDCC) 457.65 177.21 454.36 177.21
11 kV Gopapalli (BDCB) 148.46 69.79 142.57 69.79
11 kV Nayabazar (AAAA) 381.92 27.01 355.02 27.01
11 kV OSAP (AAAD) 320.47 0 314.41 0
11 kV Shaktinagar 354.57 22.67 372.09 22.67
Total 12109.35 11610.67
Collection efficiency (%)
95.88%

42
The total AT&C losses, input feeder wise in Rourkela Smart City area as a whole under WESCO Rourkela circle for FY 2017-18 is tabulated below:
Sl. No.
Feeder Name Input Energy
(LU)
Billed Energy
(LU)
Billed Amount(Lacs)
Collected amount(Lacs)
Billing Efficiency
Collection Efficiency
AT&C
a b c d e=b/a f=d/c g=1-e*f
1 33 kV Industrial Estate feeder
249.72 202.02 1132.25 1176.77 68% 104% 32%
2 33 kV Pilot Project feeder 45.55
3 33 kV Old IDC feeder 450.72 381.83 2312.64 2208.30 85% 95% 19%
4 33 kV Town - 2 feeder 676.81 520.98 2797.33 2821.25 77% 101% 23%
5 33 kV Basanti feeder 470.03 286.70 1258.80 994.28 61% 79% 52%
6 33 kV Town–1 feeder
7 33 kV Chhend-Koelnagar feeder
756.62 534.59 2609.08 2433.77 71% 93% 34%
8 11 kV Modern India - I feeder
11.47 9.08 39.50 41.17 79% 104% 21%
9 11 kV Vedvyas feeder 121.82 104.08 634.86 631.57 85% 99% 15%
10 11 kV Gopapalli feeder 62.11 36.28 218.25 212.36 58% 97% 43%
11 11 kV Nayabazar feeder 147.3 97.21 408.93 382.03 66% 93% 38%
12 11 kV OSAP feeder 113.99 69.92 320.47 314.41 61% 98% 40%
13 11 kV Shaktinagar feeder 92.95 77.43 377.24 394.76 83% 105% 17%
Total for Rourkela smart city area (FY 2017-18)
3,199.09 2,320.12 12,109.35 11,610.67 73% 96% 30%

43
AT&C Loss verification (FY 2018-19)
AT&C loss has been verified for all input points (33 kV and 11 kV) by the following methodology:
Step 1: Individual input of 33 kV and 11 kV feeders have been derived from feeder meter reading by
the following formula:
Input Energy (Feeder A) = (Meter reading on 1st April 2019 – Meter reading on 1st April 2018) x
Multiplying factor
Step 2: For each division, LT billing data is available as a database file for each month. This billing data
consists of billed units, billed amount and collection for each consumer every month. As consumers are
tagged with 11 kV feeders, we can derive 11 kV feeder-wise billed units, billed amount and collection
from the database. Summation of billed units for connected 11 kV feeders will give the LT units billed
for the 33 kV feeder. HT billing data is available as a database file for all HT consumers. A consumer
list pertaining to smart city area has been shared by MRT division. This has been followed in deriving
billing and collection for HT consumers. With these data, the billing efficiency of the 33 kV feeder can
be derived as per the following formula:
Billing Efficiency (Feeder A) = (Billed energy of 33 kV consumers + Billed energy of 11 kV consumers
+ Billed energy of LT consumers of 11 kV feeders from connected substations) x 100 / Input Energy
(Feeder A)
Step 3: Collection Efficiency can be determined as follows:
Collection Efficiency (Feeder A) = (Amount Collected from 33 kV consumers + Amount Collected from
11 kV consumers + Amount Collected from LT consumers of 11 kV feeders from connected substations)
x 100 / (33 kV consumers billed amount + 11 kV consumers billed amount + LT consumer billed amount)
Step 4: AT & C for 33 kV feeder –
AT&C loss = 1 – (Billing efficiency x Collection efficiency) %

Verification of baseline KPIs for Rourkela Smart City
44
33 kV Input point feeder-wise losses
33 kV Industrial estate & 33 kV pilot project feeders
The input energy recorded for 33 kV Industrial Estate & 33 kV Pilot Project feeders can be summed up
and compared with 11 kV feeders emanating from 33/11 kV Industrial Estate & Pilot Project substations
in order to determine loss on 33 kV line and power transformer loss.
It is to be noted that AT&C calculation is done for the two feeders as a whole due to regular switchovers
for load sharing throughout FY 18-19.
Feeder Name Reading on 1st
April 2018 Reading on 1st
April 2019 Multiplying Factor (MF)
Input Energy
(LU)
33 kV Industrial Estate 75,20,804 79,00,714 60 227.95
33 kV Pilot Project feeder 15,05,249 15,67,666 60 37.45
Input energy for 33 kV Industrial Estate & 33 kV Pilot Project feeder 265.40
Billed units of all 11 kV feeders can be summed up as per the list of feeder codes4. Billed units for 11
kV feeders are added from database files and the results are collated below –
Feeder Name LT billed energy
(LU) 11 kV HT billed
energy (LU) Total billed energy (LU)
11 kV Pilot Project (Town) 3.33 1.09 4.42
11 kV Industrial Estate feeder 123.56 6.40 129.96
11 kV Town feeder 38.06 15.41 53.47
4 List of 11 kV feeders with feeder codes provided by WESCO – Annexure 1

Verification of baseline KPIs for Rourkela Smart City
45
Feeder Name LT billed energy
(LU) 11 kV HT billed
energy (LU) Total billed energy (LU)
Total energy billed for connected consumers of 11 kV feeders 187.86
Billed energy for 33 kV consumer M/s Utkal Flour Mills 18.80
Total billed energy 33 kV consumer + 11 kV feeders 206.66
Total input energy for 33 kV Industrial Estate & 33 kV Pilot Project feeder 265.40
Billing efficiency (%) 77.87 %
Feeder / Consumer Name LT billed
amount (INR Lacs)
HT billed amount (INR
Lacs)
LT collected amount (INR
Lacs)
HT collected amount (INR
Lacs)
11 kV Pilot Project (Town) 24.60 6.59 27.09 6.59
11 kV Industrial Estate feeder 710.36 44.22 687.54 44.22
11 kV Town feeder 235.90 106.64 209.02 106.64
33 kV Utkal Flour Mill - 118.92 - 118.92
Total 1247.23 1200.02
Collection efficiency (%) 96.21 %
Therefore AT&C loss for 33 kV Industrial Estate & 33 kV Pilot Project feeders can be calculated as
follows:
Parameter Value
Billing efficiency (%) 77.87 %
Collection efficiency (%) 96.21 %
AT&C Loss 25.08 %
33 kV old IDC feeder
The input energy recorded for 33 kV Old IDC feeder can be summed up and compared with 11 kV
feeders emanating from 33/11 kV Panposh substation in order to determine loss on 33 kV line and
power transformer loss.
The Input energy for 33kV IDC feeder is calculated by adding up consumptions as per the load survey
data available with WESCO M.R.T division Rourkela

Verification of baseline KPIs for Rourkela Smart City
46
Feeder Name Reading on 1st
April 2018 Reading on 1st
April 2019 Multiplying Factor (MF)
Input Energy
(LU)
33 kV Old IDC feeder 43,05,320 46,70,309.00 120 437.99
Total input energy for 33 kV Old IDC feeder 437.99
Billed units of all 11 kV feeders can be summed up as per the list of feeder codes5. Billed units for 11
kV feeders are added from database files and the results are collated below –
Feeder Name LT billed energy
(LU) 11 kV HT billed
energy (LU) Total billed energy (LU)
11 kV PHD feeder 0.42 15.37 15.79
11 kV Raw Water feeder 24.29 32.88 57.17
11 kV College feeder 92.82 29.38 122.20
11 kV Town feeder 161.56 - 161.56
11 kV RGH feeder - - -
Total energy billed for connected consumers of 11 kV feeders 356.73
Billed energy for 33 kV consumer Project Manager PMU 33.47
Billed energy for 33/0.4 kV Balughat (AGLX) 8.73
Total billed energy 33 kV consumer + 11 kV feeders 398.92
Total input energy for 33 kV Old IDC feeder 437.99
Billing efficiency (%) 91.08%
5 List of 11 kV feeders with feeder codes provided by WESCO – Annexure 1

Verification of baseline KPIs for Rourkela Smart City
47
Feeder / Consumer Name LT billed
amount (INR Lacs)
HT billed amount (INR
Lacs)
LT collected amount (INR
Lacs)
HT collected amount (INR
Lacs)
11 kV PHD feeder 1.99 87.19 2.24 87.19
11 kV Raw Water feeder 134.35 196.62 128.88 196.62
11 kV College feeder 572.95 199.18 581.54 199.18
11 kV Town feeder 959.25 - 974.35 -
11 kV RGH feeder - - - -
33 kV Project Manager PMU - 189.10 - 189.10
33/0.4 kV Balughat (AGLX) 48.98 - 56.63 -
Total 2389.61 2415.73
Collection efficiency (%) 101.09 %
Therefore AT&C loss for 33 kV Old IDC feeder can be calculated as follows:
Parameter Value
Billing efficiency (%) 91.08 %
Collection efficiency (%) (Capped at 100%) 100.00 %
AT&C Loss 8.92 %
33 kV Power House (Town – 2) feeder
The input energy recorded for 33 kV Town - 2 feeder can be summed up and compared with 11 kV
feeders emanating from 33/11 kV Power house road substation in order to determine loss on 33 kV line
and power transformer loss.
The meter for the said feeder was replaced on December 2018, new readings were available from
January 2019. The consumption of December (4167360 units) was calculated based on the readings
that MRT department has obtained from Substation log-book.
Feeder Name Reading as on 1st April 2018
Reading as on 1st December
2019
Multiplying Factor (MF)
Input Energy
(LU)
33 kV Town-2 Feeder
95,94,298 99,87,757 120 472.15
Reading as on 1st January 2018
Reading as on 1st April 2019
Multiplying Factor (MF)
Input Energy (LU)
22,104 1,30,057 120 129.54
Total input energy for 33 kV Town - 2 feeder = (129.54 + 472.15 + 41.67) 643.37

Verification of baseline KPIs for Rourkela Smart City
48
Billed units of all 11 kV feeders can be summed up as per the list of feeder codes6. Billed units for 11
kV feeders are added from database files and the results are collated below –
Feeder Name LT billed energy
(LU) 11 kV HT billed
energy (LU) Total billed energy (LU)
11 kV Udit Nagar feeder 136.53 20.27 156.80
11 kV Main Road feeder 127.63 67.20 194.83
11 kV Power house road 64.14 - 64.14
11 kV Plant Site feeder 118.56 2.22 120.78
Total energy billed for connected consumers of 11 kV feeders 536.56
Total input energy for 33 kV Town - 2 feeder 643.37
Billing efficiency (%) 83.40 %
Feeder / Consumer Name LT billed
amount (INR Lacs)
HT billed amount (INR
Lacs)
LT collected amount (INR
Lacs)
HT collected amount (INR
Lacs)
11 kV Udit Nagar feeder 832.36 125.80 791.79 125.80
11 kV Main Road feeder 785.06 428.58 745.71 428.58
11 kV Power house road 369.39 - 391.97 -
11 kV Plant Site feeder 668.76 17.89 588.25 17.89
Total 3227.84 3089.99
Collection efficiency (%) 95.73 %
6 List of 11 kV feeders with feeder codes provided by WESCO – Annexure 1

Verification of baseline KPIs for Rourkela Smart City
49
Therefore AT&C loss for 33 kV Town - 2 feeder can be calculated as follows:
Parameter Value
Billing efficiency (%) 83.40%
Collection efficiency (%) 95.73%
AT&C Loss 20.16 %
It may be noted that according to PFC guidelines Collection efficiency shall be considered not more
than 100% while computing AT&C losses.
33 kV Basanti feeder
The input energy recorded for 33 kV Basanti feeder can be summed up and compared with 11 kV
feeders emanating from 33/11 kV Basanti substation in order to determine loss on 33 kV line and power
transformer loss.
From May 2018 onwards Basanti feeder started drawing power from 33kV Town 1 feeder as it was
commissioned and charged on the same month. The total energy input to 33kV Town 1 feeder is a sum
of power drawn by 11kV Nayabazar and 33kV Basanti feeder.
The quantum of energy drawn by 11kV Nayabazar feeder from 33kV town 1 is equal to that of 11kV
Bondamunda feeder emanating from 33/11kV Bondamunda Substation ( 11kV Nayabazar and
Bondamunda were connected from May 2018).
Therefore the calculation stands as:
𝐼𝑛𝑝𝑢𝑡 𝑡𝑜 33𝑘𝑉 𝐵𝑎𝑠𝑎𝑛𝑡𝑖 𝑓𝑒𝑒𝑑𝑒𝑟 = (𝐶𝑜𝑛𝑠𝑢𝑚𝑝𝑡𝑖𝑜𝑛 𝑜𝑓 33𝑘𝑉 𝐵𝑎𝑠𝑎𝑛𝑡𝑖 𝑓𝑒𝑒𝑑𝑒𝑟 +
𝐶𝑜𝑛𝑠𝑢𝑚𝑡𝑖𝑜𝑛 𝑜𝑓 33𝑘𝑉 𝑇𝑜𝑤𝑛 1) − 𝐶𝑜𝑛𝑠𝑢𝑚𝑝𝑡𝑖𝑜𝑛 𝑜𝑓 11𝑘𝑉 𝐵𝑜𝑛𝑑𝑎𝑚𝑢𝑛𝑑𝑎 𝑓𝑒𝑒𝑑𝑒𝑟
The input energy for Basanti 33kV is thus taken as a sum of the individual meter readings.
Feeder Name Reading on 1st
April 2018 Reading on 1st
April 2019 Multiplying Factor (MF)
Input Energy
(LU)
33 kV Basanti feeder 7,17,909 15,01,286 60 293.46
Feeder Name Reading on 1st
May 2018 Reading on 1st
April 2019 Multiplying Factor (MF)
Input Energy
(LU)
Town-1(old REC) 89,12,658 90,63,322 120 180.80
Feeder Name Consumption on 1st May 2018 (Units)
Cumulative consumption till 1st April 2019 (Units)
Input Energy
(LU)
11kV Bondamunda feeder 613800 9241200 98.55
Total input energy for 33 kV Basanti feeder (293.46 + 180.80 - 98.55) 392.01

Verification of baseline KPIs for Rourkela Smart City
50
It must be noted that the meter readings at 11kV Bonamunda feeder were unavailable. The consumption
is calculated from load survey by MRT Rourkela
Billed units of all 11 kV feeders can be summed up as per the list of feeder codes. Billed units for 11 kV
feeders are added from database files and the results are collated below –
Feeder Name LT billed energy
(LU) 11 kV HT billed
energy (LU) Total billed energy (LU)
11 kV DAV feeder 127.00 - 127.00
11 kV PHD feeder 0.40 15.37 15.76
11 kV MS Palli feeder 133.45 1.48 134.92
Total energy billed for connected consumers of 11 kV feeders 277.69
Total input energy for 33 kV Basanti & Town 1 feeder 392.01
Billing efficiency (%) 70.84%
Feeder / Consumer Name LT billed
amount (INR Lacs)
HT billed amount (INR
Lacs)
LT collected amount (INR
Lacs)
HT collected amount (INR
Lacs)
11 kV DAV feeder 606.12 - 553.30 -
11 kV PHD feeder 1.87 87.19 1.51 87.19
11 kV MS Palli feeder 622.47 8.80 342.16 8.80
Total 1326.46 992.96

Verification of baseline KPIs for Rourkela Smart City
51
Feeder / Consumer Name LT billed
amount (INR Lacs)
HT billed amount (INR
Lacs)
LT collected amount (INR
Lacs)
HT collected amount (INR
Lacs)
Collection efficiency (%) 74.86%
Therefore AT&C loss for 33 kV Basanti & Town – 1 feeder can be calculated as follows:
Parameter Value
Billing efficiency (%) 70.84%
Collection efficiency (%) 74.86%
AT&C Loss 46.97%
33 kV Chhend-Koelnagar feeder
The input energy recorded for 33 kV Chhend-Koelnagar feeder can be summed up and compared with
11 kV feeders emanating from 33/11 kV Chhend and 33/11 kV Koelnagar substations in order to
determine loss on 33 kV line and power transformer loss.
Feeder Name Reading on 1st
April 2018 Reading on 1st
April 2019 Multiplying Factor (MF)
Input Energy
(LU)
33 kV Chhend-Koelnagar 187,21,100 1,92,90,500 120 683.28
Total input energy for 33 kV Chhend-Koelnagar feeder 683.28
Billed units of all 11 kV feeders can be summed up as per the list of feeder codes. Billed units for 11 kV
feeders are added from database files and the results are collated below –

Verification of baseline KPIs for Rourkela Smart City
52
Feeder Name LT billed energy
(LU) 11 kV HT billed
energy (LU) Total billed energy (LU)
11 kV Jhirpani feeder 46.95 5.58 52.53
11 kV BC Block feeder 52.17 0.00 52.17
11 kV ADE Block feeder 79.45 0.00 79.45
11 kV Hamirpur feeder 35.43 0.00 35.43
11 kV Self Finance feeder 60.93 1.43 62.36
11 kV Panposh feeder 55.34 3.21 58.54
11 kV RDA feeder 41.63 2.64 44.27
11 kV Chhend 1st Phase 80.41 0.00 80.41
11 kV Kalinga Vihar 67.88 0.00 67.88
11 kV Luhakera 23.06 5.67 28.73
Total energy billed for connected consumers of 11 kV feeders 561.76
Total input energy for 33 kV Chhend-Koelnagar feeder 683.28
Billing efficiency (%) 82.22 %
Feeder / Consumer Name LT billed
amount (INR Lacs)
HT billed amount (INR
Lacs)
LT collected amount (INR
Lacs)
HT collected amount (INR
Lacs)
11 kV Jhirpani feeder 234.25 35.86 189.49 35.86
11 kV BC Block feeder 260.53 - 240.40 -
11 kV ADE Block feeder 415.40 - 387.78 -
11 kV Hamirpur feeder 163.53 - 145.52 -
11 kV Self Finance feeder 307.60 12.73 322.43 12.73
11 kV Panposh feeder 284.98 23.35 262.75 23.35
11 kV RDA feeder 197.18 19.43 206.21 19.43
11 kV Chhend 1st Phase 396.40 - 403.74 -
11 kV Kalinga Vihar 328.35 - 332.86 -
11 kV Luhakera 118.59 24.89 87.28 24.89
Total 2823.05 2694.70
Collection efficiency (%) 95.45 %
Therefore AT&C loss for 33 kV Chhend-Koelnagar feeder can be calculated as follows:
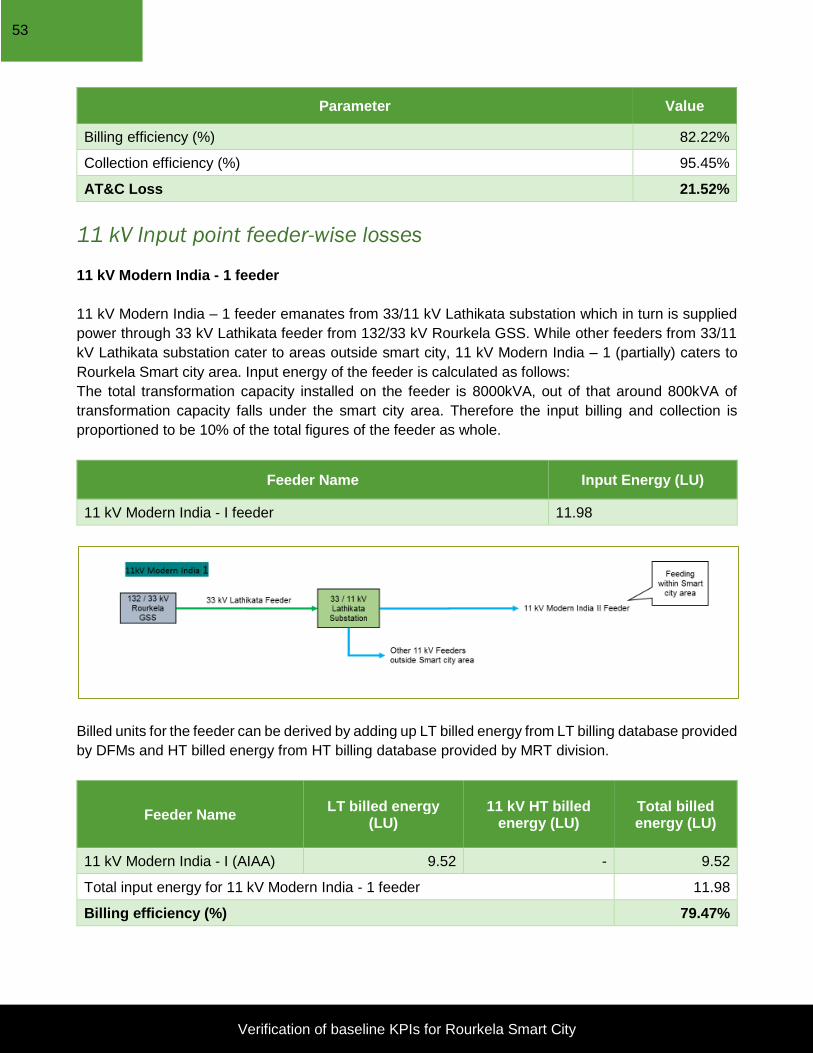
Verification of baseline KPIs for Rourkela Smart City
53
Parameter Value
Billing efficiency (%) 82.22%
Collection efficiency (%) 95.45%
AT&C Loss 21.52%
11 kV Input point feeder-wise losses
11 kV Modern India - 1 feeder
11 kV Modern India – 1 feeder emanates from 33/11 kV Lathikata substation which in turn is supplied
power through 33 kV Lathikata feeder from 132/33 kV Rourkela GSS. While other feeders from 33/11
kV Lathikata substation cater to areas outside smart city, 11 kV Modern India – 1 (partially) caters to
Rourkela Smart city area. Input energy of the feeder is calculated as follows:
The total transformation capacity installed on the feeder is 8000kVA, out of that around 800kVA of
transformation capacity falls under the smart city area. Therefore the input billing and collection is
proportioned to be 10% of the total figures of the feeder as whole.
Feeder Name Input Energy (LU)
11 kV Modern India - I feeder 11.98
Billed units for the feeder can be derived by adding up LT billed energy from LT billing database provided
by DFMs and HT billed energy from HT billing database provided by MRT division.
Feeder Name LT billed energy
(LU) 11 kV HT billed
energy (LU) Total billed energy (LU)
11 kV Modern India - I (AIAA) 9.52 - 9.52
Total input energy for 11 kV Modern India - 1 feeder 11.98
Billing efficiency (%) 79.47%
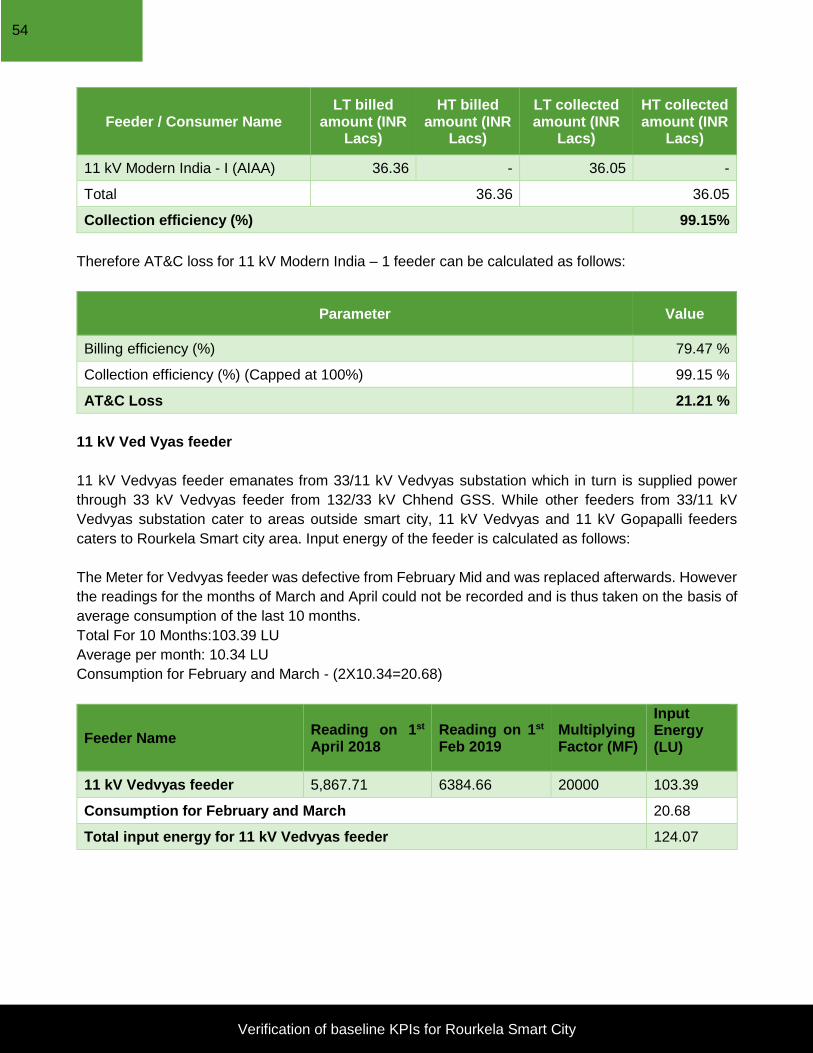
Verification of baseline KPIs for Rourkela Smart City
54
Feeder / Consumer Name LT billed
amount (INR Lacs)
HT billed amount (INR
Lacs)
LT collected amount (INR
Lacs)
HT collected amount (INR
Lacs)
11 kV Modern India - I (AIAA) 36.36 - 36.05 -
Total 36.36 36.05
Collection efficiency (%) 99.15%
Therefore AT&C loss for 11 kV Modern India – 1 feeder can be calculated as follows:
Parameter Value
Billing efficiency (%) 79.47 %
Collection efficiency (%) (Capped at 100%) 99.15 %
AT&C Loss 21.21 %
11 kV Ved Vyas feeder
11 kV Vedvyas feeder emanates from 33/11 kV Vedvyas substation which in turn is supplied power
through 33 kV Vedvyas feeder from 132/33 kV Chhend GSS. While other feeders from 33/11 kV
Vedvyas substation cater to areas outside smart city, 11 kV Vedvyas and 11 kV Gopapalli feeders
caters to Rourkela Smart city area. Input energy of the feeder is calculated as follows:
The Meter for Vedvyas feeder was defective from February Mid and was replaced afterwards. However
the readings for the months of March and April could not be recorded and is thus taken on the basis of
average consumption of the last 10 months.
Total For 10 Months:103.39 LU
Average per month: 10.34 LU
Consumption for February and March - (2X10.34=20.68)
Feeder Name Reading on 1st April 2018
Reading on 1st Feb 2019
Multiplying Factor (MF)
Input Energy (LU)
11 kV Vedvyas feeder 5,867.71 6384.66 20000 103.39
Consumption for February and March 20.68
Total input energy for 11 kV Vedvyas feeder 124.07

Verification of baseline KPIs for Rourkela Smart City
55
Billed units for the feeder can be derived by adding up LT billed energy from LT billing database provided
by DFMs and HT billed energy from HT billing database provided by MRT division.
Feeder Name LT billed energy
(LU) 11 kV HT billed
energy (LU) Total billed energy (LU)
11 kV Vedvyas (BDCC) 70.00 26.44 96.44
Total input energy for 11 kV Vedvyas feeder 124.07
Billing efficiency (%) 77.73 %
Feeder / Consumer Name LT billed
amount (INR Lacs)
HT billed amount (INR
Lacs)
LT collected amount (INR
Lacs)
HT collected amount (INR
Lacs)
11 kV Vedvyas (BDCC) 508.80 178.93 482.09 178.93
Total 687.73 661.02
Collection efficiency (%) 96.12 %
Therefore AT&C loss for 11 kV Vedvyas feeder can be calculated as follows:
Parameter Value
Billing efficiency (%) 77.73 %
Collection efficiency (%) 96.12 %
AT&C Loss 25.29 %

Verification of baseline KPIs for Rourkela Smart City
56
11 kV Gopapalli feeder
11 kV Gopapalli feeder emanates from 33/11 kV Vedvyas substation which in turn is supplied power
through 33 kV Vedvyas feeder from 132/33 kV Chhend GSS. While other feeders from 33/11 kV
Vedvyas substation cater to areas outside smart city, 11 kV Vedvyas and 11 kV Gopapalli feeders
caters to Rourkela Smart city area. Input energy of the feeder is calculated as follows:
The Meter for Gopapalli feeder was defective from February Mid and was replaced afterwards. However
the readings for the months of March and April could not be recorded and is thus taken on the basis of
average consumption of the last 10 months.
Total for 10 months: 103.39 LU
Average per month: 10.34 LU
Consumption for February and March - (2X10.34=20.68)
Feeder Name Reading on 1st
April 2018 Reading on 1st
April 2019 Multiplying Factor (MF)
Input Energy
(LU)
11 kV Gopapalli feeder 11,340.44 11,608.01 20000 53.51
Consumption for February and March 10.70
Total input energy for 11 kV Gopapalli feeder 64.22
Billed units for the feeder can be derived by adding up LT billed energy from LT billing database provided
by DFMs and HT billed energy from HT billing database provided by MRT division.
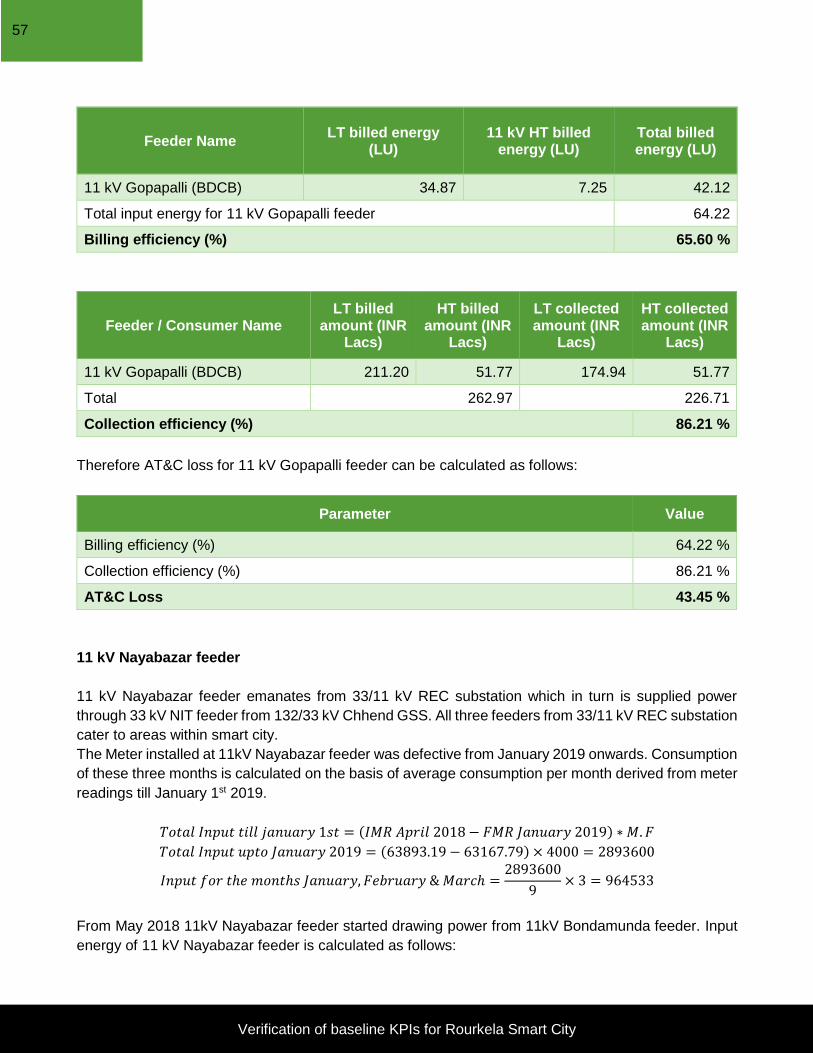
Verification of baseline KPIs for Rourkela Smart City
57
Feeder Name LT billed energy
(LU) 11 kV HT billed
energy (LU) Total billed energy (LU)
11 kV Gopapalli (BDCB) 34.87 7.25 42.12
Total input energy for 11 kV Gopapalli feeder 64.22
Billing efficiency (%) 65.60 %
Feeder / Consumer Name LT billed
amount (INR Lacs)
HT billed amount (INR
Lacs)
LT collected amount (INR
Lacs)
HT collected amount (INR
Lacs)
11 kV Gopapalli (BDCB) 211.20 51.77 174.94 51.77
Total 262.97 226.71
Collection efficiency (%) 86.21 %
Therefore AT&C loss for 11 kV Gopapalli feeder can be calculated as follows:
Parameter Value
Billing efficiency (%) 64.22 %
Collection efficiency (%) 86.21 %
AT&C Loss 43.45 %
11 kV Nayabazar feeder
11 kV Nayabazar feeder emanates from 33/11 kV REC substation which in turn is supplied power
through 33 kV NIT feeder from 132/33 kV Chhend GSS. All three feeders from 33/11 kV REC substation
cater to areas within smart city.
The Meter installed at 11kV Nayabazar feeder was defective from January 2019 onwards. Consumption
of these three months is calculated on the basis of average consumption per month derived from meter
readings till January 1st 2019.
𝑇𝑜𝑡𝑎𝑙 𝐼𝑛𝑝𝑢𝑡 𝑡𝑖𝑙𝑙 𝑗𝑎𝑛𝑢𝑎𝑟𝑦 1𝑠𝑡 = (𝐼𝑀𝑅 𝐴𝑝𝑟𝑖𝑙 2018 − 𝐹𝑀𝑅 𝐽𝑎𝑛𝑢𝑎𝑟𝑦 2019) ∗ 𝑀. 𝐹
𝑇𝑜𝑡𝑎𝑙 𝐼𝑛𝑝𝑢𝑡 𝑢𝑝𝑡𝑜 𝐽𝑎𝑛𝑢𝑎𝑟𝑦 2019 = (63893.19 − 63167.79) × 4000 = 2893600
𝐼𝑛𝑝𝑢𝑡 𝑓𝑜𝑟 𝑡ℎ𝑒 𝑚𝑜𝑛𝑡ℎ𝑠 𝐽𝑎𝑛𝑢𝑎𝑟𝑦, 𝐹𝑒𝑏𝑟𝑢𝑎𝑟𝑦 & 𝑀𝑎𝑟𝑐ℎ =2893600
9× 3 = 964533
From May 2018 11kV Nayabazar feeder started drawing power from 11kV Bondamunda feeder. Input
energy of 11 kV Nayabazar feeder is calculated as follows:

Verification of baseline KPIs for Rourkela Smart City
58
𝐼𝑛𝑝𝑢𝑡 𝑒𝑛𝑒𝑟𝑔𝑦 𝑡𝑜 11𝑘𝑉 𝑁𝑎𝑦𝑎𝑏𝑎𝑧𝑎𝑟 𝑓𝑒𝑒𝑑𝑒𝑟 = 𝐶𝑜𝑛𝑠𝑢𝑚𝑝𝑡𝑖𝑜𝑛 𝑜𝑓 11𝑘𝑉 𝑁𝑎𝑦𝑎𝑏𝑎𝑧𝑎𝑟 𝐹𝑒𝑒𝑑𝑒𝑟 +
𝐶𝑜𝑛𝑠𝑢𝑚𝑝𝑡𝑖𝑜𝑛 𝑜𝑓 11𝑘𝑉 𝐵𝑜𝑛𝑑𝑎𝑚𝑢𝑛𝑑𝑎 𝐹𝑒𝑒𝑑𝑒𝑟
Feeder Name Reading on 1st
April 2018 Reading on 1st January 2019
Multiplying Factor (MF)
Input Energy
(LU)
11 kV Nayabazar feeder 63,169.79 63,893.19 4000 28.94
Consumption for the months January February and March 9.65
Consumption of 11kV Bondamunda feeder 98.55
Total input energy for 11 kV Nayabazar feeder 137.14
Billed units for the feeder can be derived by adding up LT billed energy from LT billing database provided
by DFMs and HT billed energy from HT billing database provided by MRT division.
Feeder Name LT billed energy
(LU) 11 kV HT billed
energy (LU) Total billed energy (LU)
11 kV Nayabazar (AAAA) 113.95 4.96 118.91
Total input energy for 11 kV Nayabazar feeder 137.14
Billing efficiency (%) 86.71 %
Feeder / Consumer Name LT billed
amount (INR Lacs)
HT billed amount (INR
Lacs)
LT collected amount (INR
Lacs)
HT collected amount (INR
Lacs)
11 kV Nayabazar (AAAA) 523.42 25.55 432.75 25.55
Total 548.98 458.31
Collection efficiency (%) 83.48 %

Verification of baseline KPIs for Rourkela Smart City
59
Therefore AT&C loss for 11 kV Nayabazar feeder can be calculated as follows:
Parameter Value
Billing efficiency (%) 86.71 %
Collection efficiency (%) 83.48 %
AT&C Loss 27.61 %
11 kV OSAP feeder
11 kV OSAP feeder emanates from 33/11 kV REC substation which in turn is supplied power through
33 kV NIT feeder from 132/33 kV Chhend GSS. All three feeders from 33/11 kV REC substation cater
to areas within smart city. Input energy of 11 kV OSAP feeder is calculated as follows:
Feeder Name Reading on 1st
April 2018 Reading on 1st
April 2019 Multiplying Factor (MF)
Input Energy
(LU)
11 kV OSAP feeder 30,920.86 32743.51 6000 109.36
Total input energy for 11 kV OSAP feeder 109.36
Billed units for the feeder can be derived by adding up LT billed energy from LT billing database provided
by DFMs and HT billed energy from HT billing database provided by MRT division.
Feeder Name LT billed energy
(LU) 11 kV HT billed
energy (LU) Total billed energy (LU)
11 kV OSAP (AAAD) 67.78 - 67.78
Total input energy for 11 kV OSAP feeder 109.36
Billing efficiency (%) 61.98%

Verification of baseline KPIs for Rourkela Smart City
60
Feeder / Consumer Name LT billed
amount (INR Lacs)
HT billed amount (INR
Lacs)
LT collected amount (INR
Lacs)
HT collected amount (INR
Lacs)
11 kV OSAP (AAAD) 329.40 - 252.71 -
Collection efficiency (%) 76.72 %
Therefore AT&C loss for 11 kV OSAP feeder can be calculated as follows:
Parameter Value
Billing efficiency (%) 61.98 %
Collection efficiency (%) 76.72 %
AT&C Loss 52.45 %
11 kV Shaktinagar feeder
11 kV Shaktinagar feeder emanates from 33/11 kV REC substation which in turn is supplied power
through 33 kV NIT feeder from 132/33 kV Chhend GSS. All three feeders from 33/11 kV REC substation
cater to areas within smart city. Input energy of 11 kV Shaktinagar feeder is calculated as 95.38 LU. It
must be noted that the meter at Shaktinagar feeder was defective from December 2017. The input is
provided by MRT WESCO Rourkela based on the previous year consumption and load growth:
Feeder Name Input Energy (LU)
11 kV Shaktinagar 95.38
Billed units for the feeder can be derived by adding up LT billed energy from LT billing database provided
by DFMs and HT billed energy from HT billing database provided by MRT division.
Feeder Name LT billed energy
(LU) 11 kV HT billed
energy (LU) Total billed energy (LU)
11 kV Shaktinagar (AAAB) 77.87 2.47 80.34

Verification of baseline KPIs for Rourkela Smart City
61
Feeder Name LT billed energy
(LU) 11 kV HT billed
energy (LU) Total billed energy (LU)
Total input energy for 11 kV Shaktinagar feeder 95.38
Billing efficiency (%) 84.23 %
Feeder / Consumer Name LT billed
amount (INR Lacs)
HT billed amount (INR
Lacs)
LT collected amount (INR
Lacs)
HT collected amount (INR
Lacs)
11 kV Shaktinagr (AAAB) 408.83 16.23 394.99 16.23
Collection efficiency (%) 96.74 %
Therefore AT&C loss for 11 kV Shaktinagar feeder can be calculated as follows:
Parameter Value
Billing efficiency (%) 84.23 %
Collection efficiency (%) 96.74 %
AT&C Loss 18.51 %
It may be noted that according to the guidelines Collection efficiency shall be considered not more than
100% while computing AT&C losses.
Total Input energy into the smart city area
Sl. No. Feeder Name Input Energy (LU)
1 33 kV Industrial Estate feeder 227.95
2 33 kV Pilot Project feeder 37.45
3 33 kV Old IDC feeder 437.98
4 33 kV Town - 2 feeder 643.37
5 33 kV Basanti feeder 293.46
6 33 kV Town–1 feeder 98.55
7 33 kV Chhend-Koelnagar feeder 683.28

Verification of baseline KPIs for Rourkela Smart City
62
Sl. No. Feeder Name Input Energy (LU)
8 11 kV Modern India - I feeder 11.98
9 11 kV Vedvyas feeder 124.07
10 11 kV Gopapalli feeder 64.22
11 11 kV Nayabazar feeder 137.14
12 11 kV OSAP feeder 109.36
13 11 kV Shaktinagar feeder 95.38
Total input energy for Rourkela smart city area (FY 2018-19 till Feb’19)
2,964.18
Billed energy booked under the smart city area:
Feeder Name LT billed
energy (LU)
11 kV HT
billed energy
(LU)
Total billed
energy (LU)
11 kV Pilot Project (Town) 3.33 1.09 4.42
11 kV Industrial Estate feeder 123.56 6.40 129.96
11 kV Town feeder 38.06 15.41 53.47
11 kV PHD feeder 0.42 15.37 15.79
11 kV Raw Water feeder 24.29 32.88 57.17
11 kV College feeder 92.82 29.38 122.20
11 kV Town feeder 161.56 0.00 161.56
11 kV RGH feeder 0.00 0.00 0.00
11 kV Udit Nagar feeder 136.53 20.27 156.80
11 kV Main Road feeder 127.63 67.20 194.83
11 kV Power house road 64.14 0.00 64.14
11 kV Plant Site feeder 118.56 2.22 120.78
11 kV DAV feeder 127.00 0.00 127.00
11 kV PHD feeder 0.40 15.37 15.76
11 kV MS Palli feeder 133.45 1.48 134.92
11 kV Jhirpani feeder 46.95 5.58 52.53
11 kV BC Block feeder 52.17 - 52.17
11 kV ADE Block feeder 79.45 - 79.45

Verification of baseline KPIs for Rourkela Smart City
63
Feeder Name LT billed
energy (LU)
11 kV HT
billed energy
(LU)
Total billed
energy (LU)
11 kV Hamirpur feeder 35.43 - 35.43
11 kV Self Finance feeder 60.93 1.43 62.36
11 kV Panposh feeder 55.34 3.21 58.54
11 kV RDA feeder 41.63 2.64 44.27
11 kV Chhend 1st Phase 80.41 - 80.41
11 kV Kalinga Vihar 67.88 - 67.88
11 kV Luhakera 23.06 5.67 28.73
11 kV Modern India - I (AIAA) 9.52 - 9.52
11 kV Vedvyas (BDCC) 70.00 26.44 96.44
11 kV Gopapalli (BDCB) 34.87 7.25 42.12
11 kV Nayabazar (AAAA) 113.95 4.96 118.91
11 kV OSAP (AAAD) 67.78 - 67.78
11 kV Shaktinagar (AAAB) 77.87 2.47 80.34
Total LT & 11 kV HT 2068.99 266.72 2335.70
Total energy billed for connected consumers of 11 kV feeders 2335.70
Billed energy for 33 kV consumers and DT 60.99
Total billed energy 33 kV consumer + 11 kV feeders 2,396.70
Total input energy 2,964.18
Billing efficiency (%) 80.86%
Billed units for HT consumers
Sl. No. Consumer Name Billed Energy (LU)
1 Utkal Flour Mills 18.80
2 Project Manager (PMU) 33.47
3 33/0.4 kV Balughat transformer 8.73

Verification of baseline KPIs for Rourkela Smart City
64
Collection booked under the smart city area
Feeder / Consumer Name LT billed
amount (INR Lacs)
HT billed amount (INR
Lacs)
LT collected amount (INR
Lacs)
HT collected amount (INR
Lacs)
33 kV Utkal Flour Mill - 118.92 - 118.92
33 kV Project Manager PMU - 189.10 - 189.10
33/0.4 kV Balughat (AGLX) 48.98 0.00 56.63 0.00
11 kV Pilot Project (Town) 24.60 6.59 27.09 6.59
11 kV Industrial Estate feeder 710.36 44.22 687.54 44.22
11 kV Town feeder 235.90 106.64 209.02 106.64
11 kV PHD feeder 1.99 87.19 2.24 87.19
11 kV Raw Water feeder 134.35 196.62 128.88 196.62
11 kV College feeder 572.95 199.18 581.54 199.18
11 kV Town feeder 959.25 0.00 974.35 0.00
11 kV RGH feeder - - - -
11 kV DAV feeder 606.12 - 553.30 -
11 kV PHD feeder 1.87 87.19 1.51 87.19
11 kV MS Palli feeder 622.47 8.80 342.16 8.80
11 kV Jhirpani feeder 234.25 35.86 189.49 35.86
11 kV BC Block feeder 260.53 - 240.40 -
11 kV ADE Block feeder 415.40 - 387.78 -
11 kV Hamirpur feeder 163.53 - 145.52 -
11 kV Self Finance feeder 307.60 12.73 322.43 12.73
11 kV Panposh feeder 284.98 23.35 262.75 23.35
11 kV RDA feeder 197.18 19.43 206.21 19.43
11 kV Chhend 1st Phase 396.40 - 403.74 -
11 kV Kalinga Vihar 328.35 - 332.86 -
11 kV Luhakera 118.59 24.89 87.28 24.89
11 kV Udit Nagar feeder 832.36 125.80 791.79 125.80
11 kV Main Road feeder 785.06 428.58 745.71 428.58
11 kV Power house road 369.39 391.97
11 kV Plant Site feeder 668.76 17.89 588.25 17.89
11kV Modern India 1 36.36 36.05
11 kV Vedvyas (BDCC) 508.80 178.93 482.09 178.93
11 kV Gopapalli (BDCB) 211.20 51.77 174.94 51.77

Verification of baseline KPIs for Rourkela Smart City
65
Feeder / Consumer Name LT billed
amount (INR Lacs)
HT billed amount (INR
Lacs)
LT collected amount (INR
Lacs)
HT collected amount (INR
Lacs)
11 kV Nayabazar (AAAA) 523.42 25.55 432.75 25.55
11 kV OSAP (AAAD) 329.40 - 252.71 -
11 kV Shaktinagar 408.83 16.23 394.99 16.23
Total 11299.22 2005.44 10433.96 2005.44
Collection efficiency (%) 93.50%
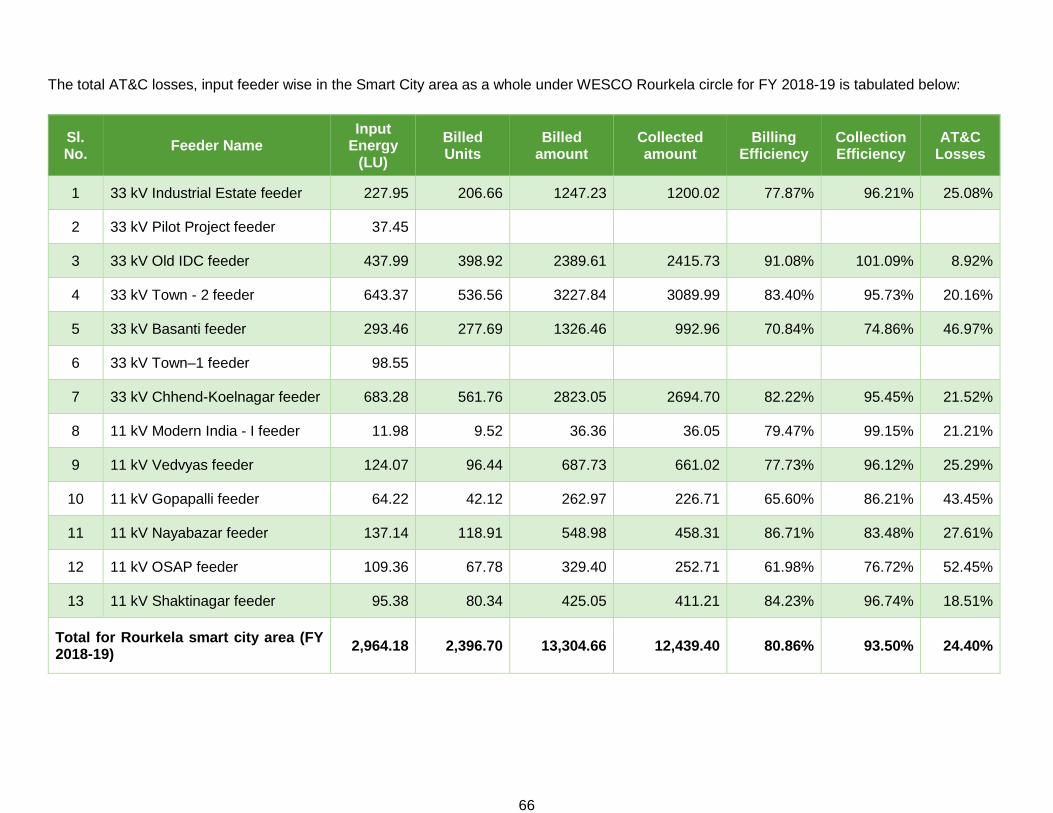
66
The total AT&C losses, input feeder wise in the Smart City area as a whole under WESCO Rourkela circle for FY 2018-19 is tabulated below:
Sl. No.
Feeder Name Input
Energy (LU)
Billed Units
Billed amount
Collected amount
Billing Efficiency
Collection Efficiency
AT&C Losses
1 33 kV Industrial Estate feeder 227.95 206.66 1247.23 1200.02 77.87% 96.21% 25.08%
2 33 kV Pilot Project feeder 37.45
3 33 kV Old IDC feeder 437.99 398.92 2389.61 2415.73 91.08% 101.09% 8.92%
4 33 kV Town - 2 feeder 643.37 536.56 3227.84 3089.99 83.40% 95.73% 20.16%
5 33 kV Basanti feeder 293.46 277.69 1326.46 992.96 70.84% 74.86% 46.97%
6 33 kV Town–1 feeder 98.55
7 33 kV Chhend-Koelnagar feeder 683.28 561.76 2823.05 2694.70 82.22% 95.45% 21.52%
8 11 kV Modern India - I feeder 11.98 9.52 36.36 36.05 79.47% 99.15% 21.21%
9 11 kV Vedvyas feeder 124.07 96.44 687.73 661.02 77.73% 96.12% 25.29%
10 11 kV Gopapalli feeder 64.22 42.12 262.97 226.71 65.60% 86.21% 43.45%
11 11 kV Nayabazar feeder 137.14 118.91 548.98 458.31 86.71% 83.48% 27.61%
12 11 kV OSAP feeder 109.36 67.78 329.40 252.71 61.98% 76.72% 52.45%
13 11 kV Shaktinagar feeder 95.38 80.34 425.05 411.21 84.23% 96.74% 18.51%
Total for Rourkela smart city area (FY 2018-19)
2,964.18 2,396.70 13,304.66 12,439.40 80.86% 93.50% 24.40%
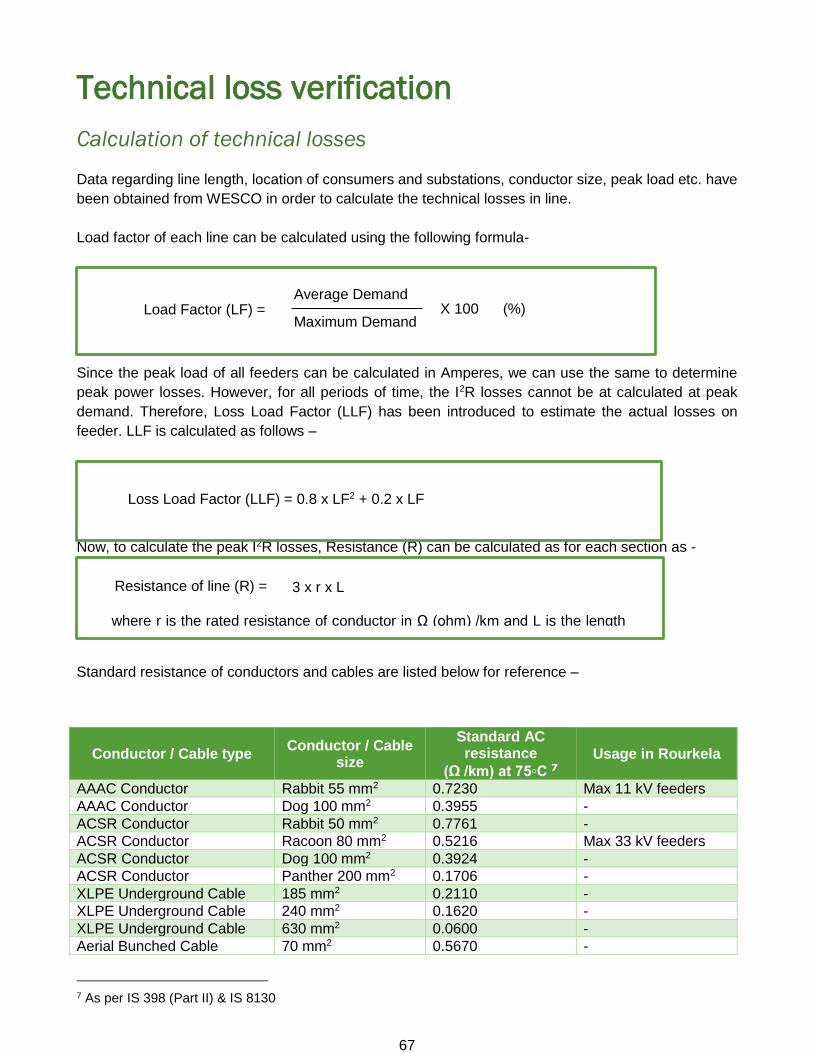
67
Technical loss verification
Calculation of technical losses
Data regarding line length, location of consumers and substations, conductor size, peak load etc. have
been obtained from WESCO in order to calculate the technical losses in line.
Load factor of each line can be calculated using the following formula-
Since the peak load of all feeders can be calculated in Amperes, we can use the same to determine
peak power losses. However, for all periods of time, the I2R losses cannot be at calculated at peak
demand. Therefore, Loss Load Factor (LLF) has been introduced to estimate the actual losses on
feeder. LLF is calculated as follows –
Now, to calculate the peak I2R losses, Resistance (R) can be calculated as for each section as -
Standard resistance of conductors and cables are listed below for reference –
Conductor / Cable type Conductor / Cable
size
Standard AC resistance
(Ω /km) at 75C 7
Usage in Rourkela
AAAC Conductor Rabbit 55 mm2 0.7230 Max 11 kV feeders
AAAC Conductor Dog 100 mm2 0.3955 -
ACSR Conductor Rabbit 50 mm2 0.7761 -
ACSR Conductor Racoon 80 mm2 0.5216 Max 33 kV feeders
ACSR Conductor Dog 100 mm2 0.3924 -
ACSR Conductor Panther 200 mm2 0.1706 -
XLPE Underground Cable 185 mm2 0.2110 -
XLPE Underground Cable 240 mm2 0.1620 -
XLPE Underground Cable 630 mm2 0.0600 -
Aerial Bunched Cable 70 mm2 0.5670 -
7 As per IS 398 (Part II) & IS 8130
Loss Load Factor (LLF) = 0.8 x LF2 + 0.2 x LF
available in Amperes, we can use the same to
determine peak power losses. However, for all periods
of time, the I2R losses cannot be at calculated at peak
demand. Therefore, Loss Load Factor (LLF) has been
introduced to estimate the actual losses on feeder.
LLF is calculated as follows -
Load Factor (LF) = Average Demand
Maximum Demand X 100 (%)
Resistance of line (R) = 3 x r x L
where r is the rated resistance of conductor in Ω (ohm) /km and L is the length
of feeder in km

Verification of baseline KPIs for Rourkela Smart City
68
Conductor / Cable type Conductor / Cable
size
Standard AC resistance
(Ω /km) at 75C 7
Usage in Rourkela
Aerial Bunched Cable 90 mm2 0.4100 -
Table 5 - Standard resistance by conductor / cable type
Further, the peak power losses can be calculated for each section as follows –
Now, the total technical losses of the feeder can be evaluated as summation of section-wise losses
follows –
Based on the above methodology, voltage level-wise technical losses have been calculated
33 kV feeders
a) 33 kV Basanti feeder
Figure 10 - SLD of 33 kV Basanti feeder
33 / 11 kV Basanti substation has 2 x 8 MVA power transformers with 3 nos. 11 kV feeders catering to
Rourkela smart city area. Peak load of the feeder is about 11,920 kVA as per data shared by MRT
division. Average power factor is 0.99 as determined from meter data during pf profiling.
Peak load in Amps = 11,920 / (1.732 x 33 x 0.99) = 211 Amp.
I2R loss = 2212 x 0.5216 x 3 x 4 km = 278 kW
Energy at peak demand for one year = 11,920 x 365 x 24 x 0.99 = 1033.75 LU
Energy input on feeder during FY 2017-18 = 470.03 LU
Therefore, load factor = 0.45
LLF = 0.8 x 0.452 + 0.2 x 0.45 = 0.26
Thus technical loss = 0.26 x 278 x 365 x 24 = 6.24 LU
LLF x P x 24 hours x 365
days
Technical loss (T) =
kWh
1000
Peak power losses (P) = I2R (Watts)
where I is the peak load of feeder in Amperes (A)
∑

Verification of baseline KPIs for Rourkela Smart City
69
% technical loss = 1.33 %
a. 33 kV Chhend-Koelnagar Feeder
Figure 11 - SLD of 33 kV Chhend - Koelnagar feeder
33 kV Chhend Koelnagar feeder provides supply to 33 / 11 kV Chhend and Koelnagar substations which
have 18 MVA and 15 MVA power transformer capacities. There are total 10 nos. 11 kV feeders catering
to Rourkela smart city area from these 2 substations. Peak load of the feeder is about 21,480 kVA as
per data shared by MRT division. Average power factor is 0.95 as determined from meter data during
pf profiling.
Peak load in Amps = 21,480 / (1.732 x 33 x 0.95) = 396 Amp.
I2R loss = 3962 x 0.5216 x 3 x 8 km = 1,959 kW
Energy at peak demand for one year = 21,480 x 365 x 24 x 0.95 = 1787.57 LU
Energy input on feeder during FY 2017-18 = 756.62 LU
Therefore, load factor = 0.42
LLF = 0.8 x 0.422 + 0.2 x 0.42 = 0.23
Thus technical loss = 0.23 x 1959 x 365 x 24 = 39.12 LU
% technical loss = 5.17 %

Verification of baseline KPIs for Rourkela Smart City
70
b. 33 kV Old IDC (Civil Township feeder)
Figure 12 - SLD of 33 kV Old IDC Civil township feeder
33 kV Old IDC (Civil township) feeder provides supply to 33 / 11 kV Pamposh substation which has 2 x
8 = 16 MVA power transformer capacity. There are total 5 nos. 11 kV feeders (out of which 4 are
operational at present) catering to Rourkela smart city area. Peak load of the feeder is about 9,200 kVA
as per data gathered from substation in-charge (it was not available with MRT department). Average
power factor is 0.94 as determined from meter data during pf profiling.
Peak load in Amps = 9,200 / (1.732 x 33 x 0.94) = 171 Amp.
I2R loss = 1712 x 0.5216 x 3 x 7 km = 321 kW
Energy at peak demand for one year = 9,200 x 365 x 24 x 0.94 = 757.76 LU
Energy input on feeder during FY 2017-18 = 359.03 LU
Therefore, load factor = 0.47
LLF = 0.8 x 0.472 + 0.2 x 0.47 = 0.27
Thus technical loss = 0.27 x 321 x 365 x 24 = 7.72 LU
% technical loss = 2.15 %
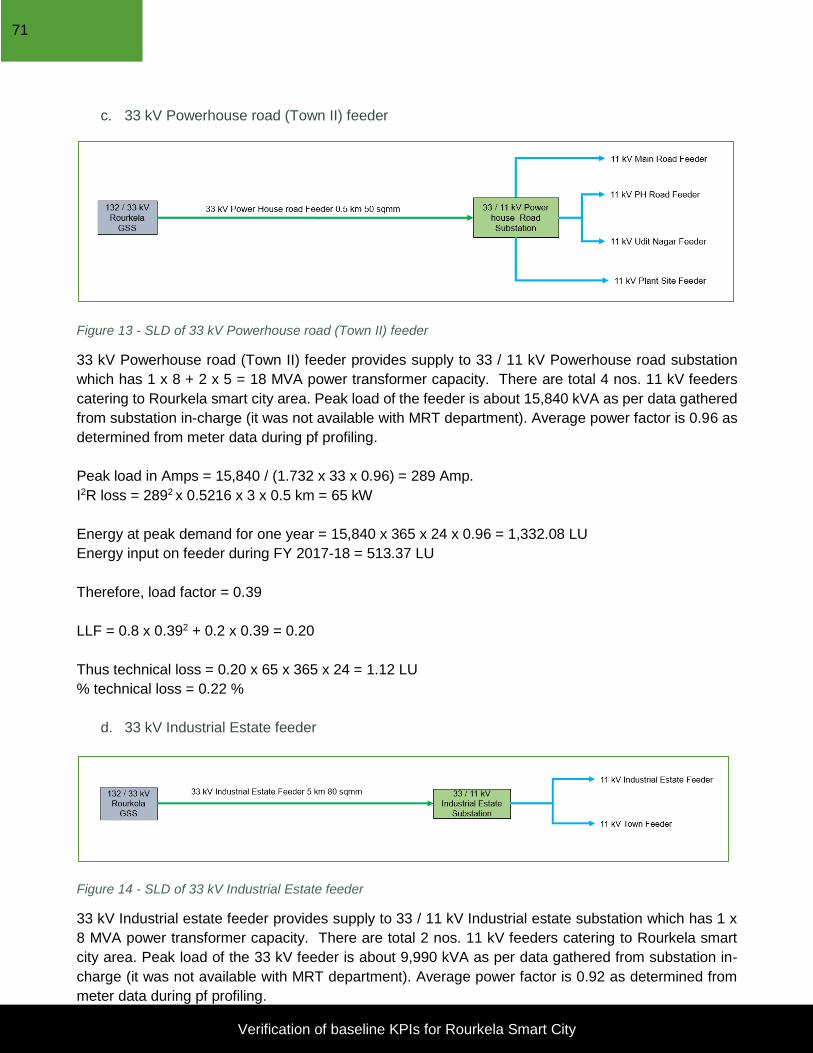
Verification of baseline KPIs for Rourkela Smart City
71
c. 33 kV Powerhouse road (Town II) feeder
Figure 13 - SLD of 33 kV Powerhouse road (Town II) feeder
33 kV Powerhouse road (Town II) feeder provides supply to 33 / 11 kV Powerhouse road substation
which has 1 x 8 + 2 x 5 = 18 MVA power transformer capacity. There are total 4 nos. 11 kV feeders
catering to Rourkela smart city area. Peak load of the feeder is about 15,840 kVA as per data gathered
from substation in-charge (it was not available with MRT department). Average power factor is 0.96 as
determined from meter data during pf profiling.
Peak load in Amps = 15,840 / (1.732 x 33 x 0.96) = 289 Amp.
I2R loss = 2892 x 0.5216 x 3 x 0.5 km = 65 kW
Energy at peak demand for one year = 15,840 x 365 x 24 x 0.96 = 1,332.08 LU
Energy input on feeder during FY 2017-18 = 513.37 LU
Therefore, load factor = 0.39
LLF = 0.8 x 0.392 + 0.2 x 0.39 = 0.20
Thus technical loss = 0.20 x 65 x 365 x 24 = 1.12 LU
% technical loss = 0.22 %
d. 33 kV Industrial Estate feeder
Figure 14 - SLD of 33 kV Industrial Estate feeder
33 kV Industrial estate feeder provides supply to 33 / 11 kV Industrial estate substation which has 1 x
8 MVA power transformer capacity. There are total 2 nos. 11 kV feeders catering to Rourkela smart
city area. Peak load of the 33 kV feeder is about 9,990 kVA as per data gathered from substation in-
charge (it was not available with MRT department). Average power factor is 0.92 as determined from
meter data during pf profiling.

Verification of baseline KPIs for Rourkela Smart City
72
Peak load in Amps = 9,990 / (1.732 x 33 x 0.92) = 190 Amp.
I2R loss = 1902 x 0.5216 x 3 x 5 km = 282 kW
Energy at peak demand for one year = 9,990 x 365 x 24 x 0.92 = 805.11 LU
Energy input on feeder during FY 2017-18 = 193.63 LU
Therefore, load factor = 0.24
LLF = 0.8 x 0.242 + 0.2 x 0.24 = 0.09
Thus technical loss = 0.09 x 282 x 365 x 24 = 2.33 LU
% technical loss = 1.20 %
e. 33 kV Pilot project feeder
Figure 15 - SLD of 33 kV Pilot project feeder
33 kV Pilot project feeder provides supply to 33 / 11 kV Pilot project substation which has 1.6 MVA
power transformer capacity. There is only 1 nos. 11 kV feeder catering to Rourkela smart city area as
well as 33 kV consumer “Utkal Floor mill”. Peak load of the 33 kV feeder is about 10,800 kVA as per
data gathered from substation in-charge (it was not available with MRT department). Average power
factor is 0.88 as determined from meter data during pf profiling.
Peak load in Amps = 10,800 / (1.732 x 33 x 0.88) = 215 Amp.
I2R loss = 2152 x 0.5216 x 3 x 7 km = 505 kW
Energy at peak demand for one year = 10,800 x 365 x 24 x 0.88 = 832.55 LU
Energy input on feeder during FY 2017-18 = 21.80 LU
Therefore, load factor = 0.03
LLF = 0.8 x 0.032 + 0.2 x 0.03 = 0.01
Thus technical loss = 0.01 x 505 x 365 x 24 = 0.26 LU
% technical loss = 1.17 %

Verification of baseline KPIs for Rourkela Smart City
73
Sl. No.
Feeder Name
Input Energy in FY 17-18
(LU)
Technical Loss in
LU
% Technical
loss
a. 33 kV Basanti feeder 470.03 6.24 1.33%
b. 33 kV Chhend Koelnagar feeder 756.62 39.12 5.17%
c. 33 kV Old IDC (Civil township) feeder 359.03 7.72 2.15%
d. 33 kV Powerhouse road (Town II) feeder 513.37 1.12 0.22%
e. 33 kV Industrial Estate feeder 193.63 2.33 1.20%
f. 33 kV Pilot project feeder 21.80 0.26 1.19%
Overall technical loss at 33 kV 2,314.48 56.79 2.45%
Figure 16 - Summary of Technical losses at 33 kV level
11 kV feeders
Technical loss for 8 nos. sample 11 kV feeders have been evaluated using the same methodology as
shared above.
a. 11 kV DAV feeder
Figure 17 - SLD of 11 kV DAV feeder
For each node in the 11 kV network, the technical loss per node is derived as follows:

Verification of baseline KPIs for Rourkela Smart City
74
Start End Length
(Ckt km)
DT Capacity
(kVA)
Cummulative DT Capacity
(kVA)
Peak current (A) @ 0.96 pf
Resistance (Ohms)
I2R (kW)
J K 0.10 200 200 10.93 0.22 0.03
I J 0.20 625 825 45.11 0.43 0.88
I1 I2 0.20 100 300 16.40 0.43 0.12
I I1 0.50 880 1180 64.51 1.08 4.51
H I 0.20 0 825 45.11 0.43 0.88
G H 0.50 600 1425 77.91 1.08 6.58
F G 0.30 500 1925 105.25 0.65 7.21
E F 0.20 100 2025 110.71 0.43 5.32
E E1 0.70 600 2625 143.52 1.52 31.27
D E 0.10 0 2025 110.71 0.22 2.66
C D 0.30 275 2300 125.75 0.65 10.29
B C 0.20 315 2615 142.97 0.43 8.87
A B 0.40 600 3215 175.77 0.87 26.81
O A 0.20 200 3415 186.71 0.43 15.12
Total technical loss (kW) 120.55
Table 6 - Node-wise technical loss for DAV feeder
Energy at peak demand for one year = 3,415 x 365 x 24 x 0.96 = 287.19 LU
Energy input on feeder during FY 2017-18 = 140.04 LU
Therefore, load factor = 0.49
LLF = 0.8 x 0.492 + 0.2 x 0.49 = 0.29
Thus technical loss = 0.29 x 120.55 x 365 x 24 = 3.04 LU
% technical loss = 2.17 %

Verification of baseline KPIs for Rourkela Smart City
75
b. 11 kV BC feeder
Figure 18 - SLD of 11 kV BC Block feeder
For each node in the 11 kV network, the technical loss per node is derived as follows:
Start End Length
(Ckt Km)
DT Capacity
(kVA)
Cumulative DT Capacity
(kVA)
Peak current (A) @ 0.95 pf
Resistance (Ohms)
I2R (W)
G H
0.40 815 815
45.03
0.93
1.89
F G
0.64 625 1,440
79.56
1.49
9.43
E F
0.40 478 1,918
105.97
0.93
10.46
D E
0.70 250 2,168
119.78
1.63
23.38
C D
0.01 25 2,193
121.16
0.02
0.34
B C
0.01 63 2,256
124.64
0.02
0.36
A B
0.02 100 2,356
130.17
0.05
0.79
O A
0.20 413 2,769
152.98
0.47
10.90
Total technical loss (kW) 57.55
Table 7 - Node-wise technical loss for 11 kV BC feeder
Energy at peak demand for one year = 2,769 x 365 x 24 x 0.95 = 230.44 LU
Energy input on feeder during FY 2017-18 = 74.87 LU

Verification of baseline KPIs for Rourkela Smart City
76
Therefore, load factor = 0.32
LLF = 0.8 x 0.322 + 0.2 x 0.32 = 0.15
Thus technical loss = 0.15 x 57.55 x 365 x 24 = 0.75 LU
% technical loss = 1.00 %
c. 11 kV Jhirpani feeder
Figure 19 - SLD of 11 kV Jhirpani feeder
For each node in the 11 kV network, the technical loss per node is derived as follows:
Start End Length
(Ckt km)
DT Capacity
(kVA)
Cumulative DT
Capacity (kVA)
Peak current (A) @ 0.97 pf
Resistance (Ohms)
I2R (W)
P Q
0.35 25 200 10.82 0.81
0.10
O P
0.10 100 300 16.23 0.23
0.06
L O
0.65 350 650 35.17 1.51
1.87
K L
0.45 0 650 35.17 1.05
1.30
L M
0.50 750 1400 75.75 1.16
6.68
M N
0.02 25 1425 77.11 0.05
0.28
F K
0.45 500 1925 104.16 1.05
11.37

Verification of baseline KPIs for Rourkela Smart City
77
F G
0.35 350 2275 123.10 0.81
12.35
G H
0.07 0 2275 123.10 0.16
2.47
H I
0.07 63 2338 126.51 0.16
2.61
H J
0.40 100 2438 131.92 0.93
16.21
C F
0.80 0 2438 131.92 1.86
32.42
D E
0.10 100 2538 137.33 0.23
4.39
C D
0.40 225 2763 149.51 0.93
20.82
B C 0 0 2763 149.51 - -
A B 0.4 550 3313 179.27 0.93
29.93
O A 1.2 25 3338 180.62 2.79
91.15
Total technical loss (kW) 233.98
Table 8 - Node-wise technical loss for 11 kV Jhirpani feeder
Energy at peak demand for one year = 3,338 x 365 x 24 x 0.97 = 283.64 LU
Energy input on feeder during FY 2017-18 = 91.13 LU
Therefore, load factor = 0.32
LLF = 0.8 x 0.322 + 0.2 x 0.32 = 0.15
Thus technical loss = 0.15 x 233.98 x 365 x 24 = 3.01 LU
% technical loss = 3.30 %
d. 11 kV Nayabazar

Verification of baseline KPIs for Rourkela Smart City
78
Figure 20 - SLD of 11 kV Nayabazar feeder
For each node in the 11 kV network, the technical loss per node is derived as follows:
Start End Length
(Ckt km)
DT Capacity
(kVA)
Cummulative DT Capacity
(kVA)
Peak current (A) @ 0.83 pf
Resistance (Ohms)
I2R (W)
A13 A14
0.70 100 200 12.65 1.63
0.26
A12 A13
0.20 63 263 16.63 0.47
0.13
A11 A12
0.40 363 626 39.59 0.93
1.46
A10 A11
0.70 16 642 40.60 1.63
2.69
A9 A10
0.10 100 742 46.92 0.23
0.51
A8 A9
0.40 263 1005 63.55 0.93
3.76
A7 A8
0.30 125 1130 71.46 0.70
3.57
A7 A71
0.15 50 1462 92.45 0.35
2.99
A6 A7
0.50 282 1412 89.29 1.16
9.28
A5 A6
0.20 489 1951 123.37 0.47
7.09
A4 A5
0.30 850 2801 177.13 0.70 21.91
A3 A4
0.10 63 2864 181.11 0.23
7.64

Verification of baseline KPIs for Rourkela Smart City
79
Start End Length
(Ckt km)
DT Capacity
(kVA)
Cummulative DT Capacity
(kVA)
Peak current (A) @ 0.83 pf
Resistance (Ohms)
I2R (W)
A2 A3
0.10 413 3277 207.23 0.23 10.00
A1 A2
0.30 100 3377 213.55 0.70 31.85
X A1 0.2 25 3402 215.13 0.47 21.55
T X 0.3 250 3652 230.94 0.70 37.25
S T 0.3 100 3752 237.26 0.70 39.32
R S 0.3 25 3777 238.84 0.70 39.85
Q R 0.3 25 3802 240.43 0.70 40.38
P Q 0.3 250 4052 256.23 0.70 45.86
O P 0.4 200 4252 268.88 0.93 67.33
N O 0.5 250 4502 284.69 1.16 94.35
M N 0.3 307 4809 304.10 0.70 64.60
L M 0 250 5059 319.91 - -
K1 L 0.5 200 5259 332.56 1.16 128.75
K K1 0.4 200 5459 345.21 0.93 110.98
J K 0.5 250 5709 361.02 1.16 151.73
I J 1 100 5809 367.34 2.33 314.18
H I 0.6 100 5909 373.67 1.40 195.05
G H 2 100 6009 379.99 4.66 672.37
F G 1.5 63 6072 383.97 3.49 514.91
E F 0.1 16 6088 384.98 0.23 34.51
D E 0.7 315 6403 404.90 1.63 267.20
C D 0.5 250 6653 420.71 1.16 206.05
B1 C 0.3 1024 7677 485.47 0.70 164.62
B1 B1 0.05 63 7740 489.45 0.12 27.89
A B 1 128 7868 497.55 2.33 576.37
O A 0.5 128 7996 505.64 1.16 297.64
Total technical loss (kW) 4,215.89
Table 9 - Node-wise technical loss for 11 kV Nayabazar feeder
Energy at peak demand for one year = 7,996 x 365 x 24 x 0.83 = 581.37 LU
Energy input on feeder during FY 2017-18 = 147.30 LU
Therefore, load factor = 0.25
LLF = 0.8 x 0.252 + 0.2 x 0.25 = 0.10
Thus technical loss = 0.10 x 4215.89 x 365 x 24 = 37.38 LU
% technical loss = 25.38 %

Verification of baseline KPIs for Rourkela Smart City
80
e. 11 kV Plant Site feeder
Figure 21 - SLD of 11 kV Plant site road feeder
For each node in the 11 kV network, the technical loss per node is derived as follows:
Start End Length
(Ckt km)
DT Capacity
(kVA)
Cummulative DT Capacity
(kVA)
Peak current (A) @ 0.98 pf
Resistance (Ohms)
I2R (W)
G H 0.20
0 0 - 0.47 -
F G 0.20
750 750 40.17 0.47
0.75
E F 0.30
500 1250 66.95 0.70
3.13
D E 0.50
630 1880 100.69 1.16 11.80
C D 0.20
730 2610 139.79 0.47
9.10
B C 0.10
1000 3610 193.34 0.23
8.70
B6 B7 0.30
1000 4610 246.90 0.70 42.58
B5 B6 0.10
100 4710 252.26 0.23 14.82
B4 B5 0.20
16 4726 253.11 0.47 29.83
B3 B4 0.20
16 4742 253.97 0.47 30.04

Verification of baseline KPIs for Rourkela Smart City
81
Start End Length
(Ckt km)
DT Capacity
(kVA)
Cummulative DT Capacity
(kVA)
Peak current (A) @ 0.98 pf
Resistance (Ohms)
I2R (W)
B2 B3
0.20 16 4758 254.83 0.47 30.24
B1 B2
0.20 16 4774 255.68 0.47 30.44
B B1
- 0 4774 255.68 - -
A B
0.60 516 5290 283.32 1.40 112.14
A2 0.1 0.1 500 5790 310.10 0.23 22.39
A1 A2 0.1 750 6540 350.27 0.23 28.57
A A1 0.3 100 6640 355.62 0.70 88.34
A1 A 1 450 7090 379.72 2.33 335.72
O A 0.6 0 7090 379.72 1.40 201.43
Total technical loss (kW) 1,000.00
Table 10 - Node-wise technical loss for 11 kV Plant site feeder
Energy at peak demand for one year = 7,090 x 365 x 24 x 0.98 = 608.66 LU
Energy input on feeder during FY 2017-18 = 237.57 LU
Therefore, load factor = 0.39
LLF = 0.8 x 0.392 + 0.2 x 0.39 = 0.20
Thus technical loss = 0.20 x 1000.00 x 365 x 24 = 17.52 LU
% technical loss = 7.37 %
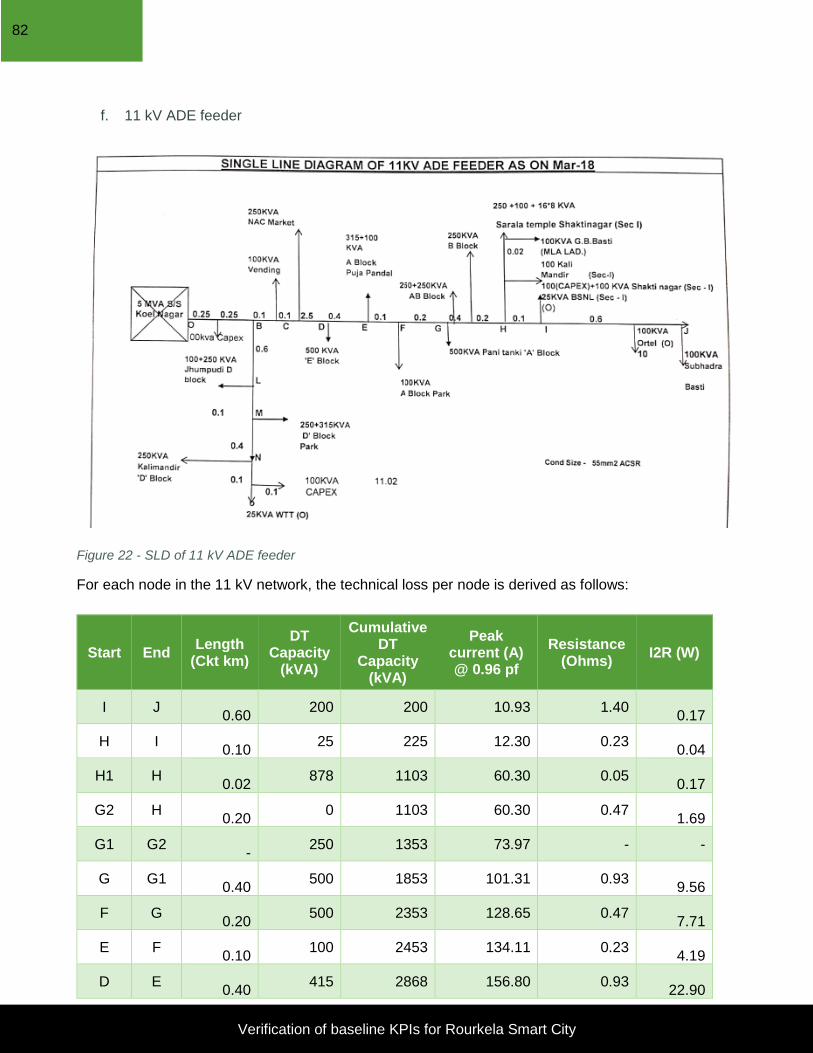
Verification of baseline KPIs for Rourkela Smart City
82
f. 11 kV ADE feeder
Figure 22 - SLD of 11 kV ADE feeder
For each node in the 11 kV network, the technical loss per node is derived as follows:
Start End Length
(Ckt km)
DT Capacity
(kVA)
Cumulative DT
Capacity (kVA)
Peak current (A) @ 0.96 pf
Resistance (Ohms)
I2R (W)
I J
0.60 200 200 10.93 1.40
0.17
H I
0.10 25 225 12.30 0.23
0.04
H1 H
0.02 878 1103 60.30 0.05
0.17
G2 H
0.20 0 1103 60.30 0.47
1.69
G1 G2
- 250 1353 73.97 - -
G G1
0.40 500 1853 101.31 0.93
9.56
F G
0.20 500 2353 128.65 0.47
7.71
E F
0.10 100 2453 134.11 0.23
4.19
D E
0.40 415 2868 156.80 0.93
22.90

Verification of baseline KPIs for Rourkela Smart City
83
Start End Length
(Ckt km)
DT Capacity
(kVA)
Cumulative DT
Capacity (kVA)
Peak current (A) @ 0.96 pf
Resistance (Ohms)
I2R (W)
C1 D
2.50 500 3368 184.14 5.82
197.37
C C1
0.10 250 3618 197.81 0.23
9.11
B B1
0.10 100 3718 203.28 0.23
9.62
N1 N2
0.10 100 3818 208.74 0.23
10.15
N N1
0.10 25 3843 210.11 0.23
10.28
M N 0.40 250 4093 223.78 0.93
46.64
L M 0.10 565 4658 254.67 0.23
15.10
B L 0.60 350 5008 273.80 1.40
104.73
A B 0.25 0 5008 273.80 0.58
43.64
O A 0.25 100 5108 279.27 0.58
45.40
Total technical loss (kW) 538.44
Table 11 - Node-wise technical loss for 11 kV ADE feeder
Energy at peak demand for one year = 5,108 x 365 x 24 x 0.96 = 429.56 LU
Energy input on feeder during FY 2017-18 = 97.69 LU
Therefore, load factor = 0.23
LLF = 0.8 x 0.232 + 0.2 x 0.23 = 0.09
Thus technical loss = 0.09 x 538.44 x 365 x 24 = 4.10 LU
% technical loss = 4.20 %

Verification of baseline KPIs for Rourkela Smart City
84
g. 11 kV Shaktinagar (Jagda) feeder
Figure 23 - SLD of 11 kV Shaktinagar (Jagda) feeder
For each node in the 11 kV network, the technical loss per node is derived as follows:
Start End Length
(Ckt km)
DT Capacity
(kVA)
Cummulative DT Capacity
(kVA)
Peak current (A) @ 0.98 pf
Resistance (Ohms)
I2R (kW)
I J
0.30 125 - 0.70
-
H I
0.10 100 100 5.36 0.23
0.01
G H
0.40 100 200 10.71 0.93
0.11
G G1
0.10 100 200 10.71 0.23
0.03
F G
0.30 0 200 10.71 0.70
0.08
E F
0.70 100 300 16.07 1.63
0.42
D E
0.20 500 800 42.85 0.47
0.85
C C1
0.20 750 1550 83.01 0.47
3.21

Verification of baseline KPIs for Rourkela Smart City
85
Start End Length
(Ckt km)
DT Capacity
(kVA)
Cummulative DT Capacity
(kVA)
Peak current (A) @ 0.98 pf
Resistance (Ohms)
I2R (kW)
C D
0.30 600 1400 74.98 0.70
3.93
B C
0.20 0 1400 74.98 0.47
2.62
A B
1.50 1225 2625 140.59 3.49
69.03
O A
0.10 112 2737 146.59 0.23
5.00
Total technical loss (kW) 85.28
Table 12 - Node-wise technical loss for 11 kV Shaktinagar feeder
Energy at peak demand for one year = 2,737 x 365 x 24 x 0.98 = 234.97 LU
Energy input on feeder during FY 2017-18 = 40.38 LU
Therefore, load factor = 0.17
LLF = 0.8 x 0.172 + 0.2 x 0.17 = 0.06
Thus technical loss = 0.06 x 85.28 x 365 x 24 = 0.43 LU
% technical loss = 1.06 %
h. 11 kV Power house road feeder
Figure 24 - SLD of 11 kV PH road feeder
For each node in the 11 kV network, the technical loss per node is derived as follows:
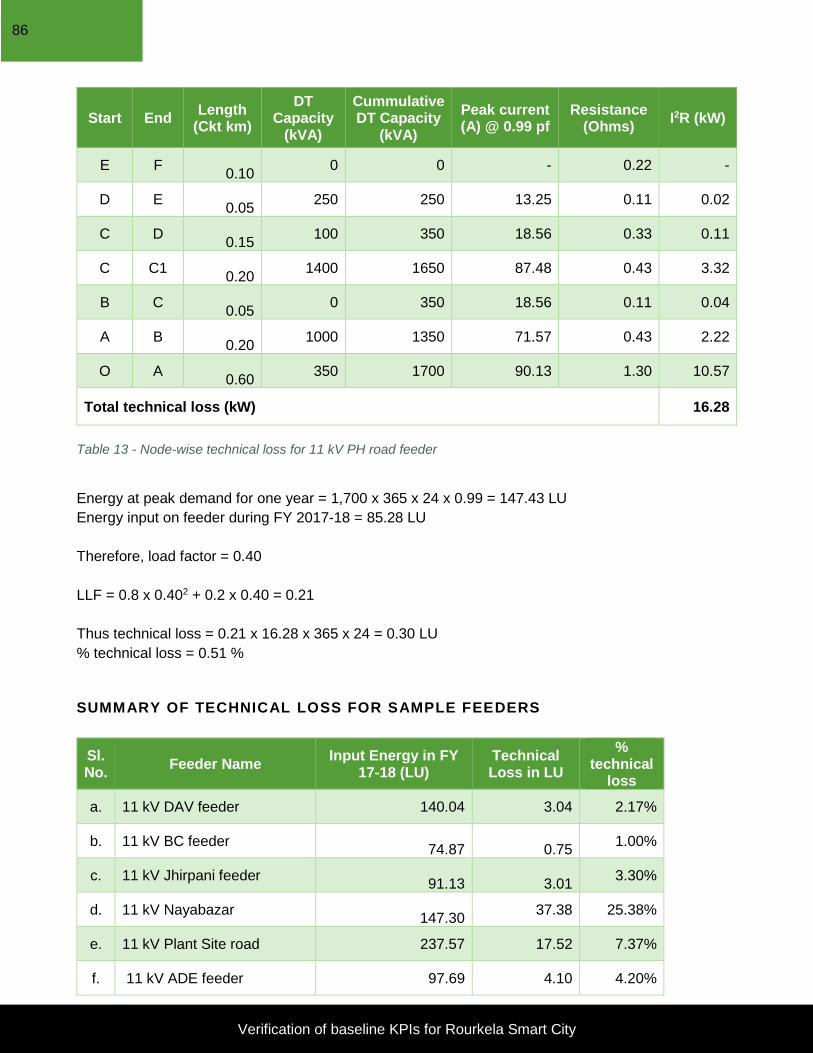
Verification of baseline KPIs for Rourkela Smart City
86
Start End Length
(Ckt km)
DT Capacity
(kVA)
Cummulative DT Capacity
(kVA)
Peak current (A) @ 0.99 pf
Resistance (Ohms)
I2R (kW)
E F
0.10 0 0 - 0.22 -
D E
0.05 250 250 13.25 0.11 0.02
C D
0.15 100 350 18.56 0.33 0.11
C C1
0.20 1400 1650 87.48 0.43 3.32
B C
0.05 0 350 18.56 0.11 0.04
A B
0.20 1000 1350 71.57 0.43 2.22
O A
0.60 350 1700 90.13 1.30 10.57
Total technical loss (kW) 16.28
Table 13 - Node-wise technical loss for 11 kV PH road feeder
Energy at peak demand for one year = 1,700 x 365 x 24 x 0.99 = 147.43 LU
Energy input on feeder during FY 2017-18 = 85.28 LU
Therefore, load factor = 0.40
LLF = 0.8 x 0.402 + 0.2 x 0.40 = 0.21
Thus technical loss = 0.21 x 16.28 x 365 x 24 = 0.30 LU
% technical loss = 0.51 %
SUMMARY OF TECHNICAL LOSS FOR SAMPLE FEEDERS
Sl. No.
Feeder Name Input Energy in FY
17-18 (LU) Technical Loss in LU
% technical
loss
a. 11 kV DAV feeder 140.04 3.04 2.17%
b. 11 kV BC feeder
74.87
0.75 1.00%
c. 11 kV Jhirpani feeder
91.13
3.01 3.30%
d. 11 kV Nayabazar
147.30 37.38 25.38%
e. 11 kV Plant Site road 237.57 17.52 7.37%
f. 11 kV ADE feeder 97.69 4.10 4.20%

Verification of baseline KPIs for Rourkela Smart City
87
Sl. No.
Feeder Name Input Energy in FY
17-18 (LU) Technical Loss in LU
% technical
loss
g. 11 kV Shaktinagar feeder 40.38 0.43 1.06%
h. 11 kV Power house feeder 59.36 0.30 0.51%
Total tech. loss at 11 kV level 888.35 6.53 7.49%
Table 14 - Summary of technical loss for sample 11 kV feeders
T&D loss for sample Distribution transformers
Sl. No.
DT Name Input Energy
(kWh) Sold Energy
(kWh) % Loss
a. DTR-1 DAV Polytech 8,699 8,285 4.76
b. DTR-2 DAV Polytech 28,000 23,847 14.83
c. DTR-3 DAV Chowk 81,223 51,514 36.57
d. DTR-5 L-Block DAV 42,878 35,762 16.60
e. DTR-7 Astaprahi Padia 25,838 22,803 11.75
f. DTR-10 FL-Block DAV 6,012 5,123 14.79
g. DTR-12 Atithibhavan 19.874 16,954 14.69
Table 15 - T&D loss for sample Distribution transformers

Verification of baseline KPIs for Rourkela Smart City
88
System Reliability Indices
Interruption data collected from 11 kV feeder meters is as follows:
Sub-Station Name
Feeder Name 11 kV
Feeders Meter No.
Duration of interruption (in
mins)
Frequency of interruption
(Nos.)
No. of Consumers
REC OSAP WSC07704 2920 49 3774
Nayabazar WSC07685 1251 21 6584
INDUSTRIAL ESTATE
Industrial Estate
ORBS4890 13646 227 3353
PANPOSH Raw Water UPB54732 4856 81 1357
College UPB54737 5513 92 2868
Town ORBS4751 6848 114 3529
Modern India-II WSC07576 11635 194 7643
POWER HOUSE
Main Road WSC32919 13404 223 3255
Ph. House Road
WES48743 10320 172 1626
Udit Nagar WES48745 12000 200 3069
CHEND Self Finance WSC39167 2627 44 2203
Panposh ORBS4894 8513 142 2572
RDA ORBS4763 8517 142 1925
Chend PH-I ORBS4777 13877 231 4023
Kalingavihar WSC39176 4406 73 2931
BASANTI Madhusudanpali
ORBS4756 5594 93 5042
PHD (Basanti-2)
WSC32995 5983 100 2267
Basanti-I WES50444 6000 100 5006
KOELNAGAR
Jhirpani WES48823 6000 100 2259
ADE Block WSC07569 OSE00370
6008 100 3186
Hamirpur WSC39113 OSE00958
3753.75 63 1928
VEDVYAS Gopapali WSC02440 11523 192 128
vedvyas WSC13195 6196 103 555
Table 16 - Intteruption of supply -data from feeder metering system
SAIFI (System Average Interruption Frequency Index)
The System Average Interruption Frequency Index (SAIFI) is commonly used as a reliability indicator
by electric power utilities. SAIFI is the average number of interruptions that a customer would
experience over a period of time. It is calculated as-

Verification of baseline KPIs for Rourkela Smart City
89
SAIFI is measured in units of interruptions per consumer. It is usually measured over the course of a
year, and according to IEEE Standard 1366-1998 the median value for North American utilities is
approximately 1.10 interruptions per consumer.
Sum-product for no. of interruptions and no. of consumers has been taken and overall SAIFI has been
calculated as 123.61.
SAIDI (System Average Interruption Duration Index)
The System Average Interruption Duration Index (SAIDI) is commonly used as a reliability indicator by
electric power utilities. SAIDI is the average outage duration for each consumer served over a fixed
period of time. It is calculated as-
SAIDI is measured in units of time, often minutes or hours. It is usually measured over the course of a
year, and according to IEEE Standard 1366-1998 the median value for North American utilities is
approximately 1.50 mins.
Sum-product for duration of interruptions and no. of consumers has been taken and overall SAIDI has
been calculated as 7416 mins.
SAIFI = Total number of consumer interruptions
Number of consumers served
(in Numbers)
SAIDI =
Sum of all consumer interruption
durations Number of customers served
(in Hours)

Verification of baseline KPIs for Rourkela Smart City
90
Power Quality
Voltage profile
33 KV FEEDERS
Name of 132/33KV GSS
Name of Feeder Voltage Level
AVG Voltage
V1 V2 V3
Rourkela GSS 33 kV Industrial Estate
33 kV 33,560 33,519 NA 33,600
Rourkela GSS 33 kV Pilot Project 33 kV 33,660 33,468 NA 33,852
Rourkela GSS 33 kV Powerhouse feeder
33 kV 33,963 33,783 NA 34,143
Chhend GSS 33 kV Basanti feeder 33 kV 33,546 33,627 NA 33,465
Chhend GSS 33 kV Chhend –Koelnagar
33 kV 33,567 33,624 NA 33,510
Table 17 - Voltage profile of 33 kV feeders
11 KV FEEDERS
Name of 33/11KV S/S
Nme of 11KV Feeder
Voltage AVG
Voltage V1 V2 V3
PH Road Udit Nagar 11KV 10,777
10,749
10,771
10,811
PH Road Main Road 11KV 11,067
11,080
11,042
11,080
PH Road Power House Road 11KV
11,039
11,093
10,950
11,074
PH Road Plant Site Road 11KV 11,151
11,259
11,213
10,982
Basanti DAV 11KV
11,086 11,081
11,131
11,046
Basanti PHD 11KV 10,902
10,991 10,842
10,872
Basanti MS Palli 11KV
11,101
11,085
11,090
11,128
REC Jagda/Shaktinagar 11KV
10,923
10,920
10,919
10,931
REC Nayabazar Bondamunda
11KV
10,846
10,849 NA
10,842
REC OSAP 11KV 10,791
10,788 NA
10,794
Koel Nagar Jhirpani 11KV
10,794
10,762
10,866
10,753
Koel Nagar BC 11KV
10,889
10,882 NA
10,896

Verification of baseline KPIs for Rourkela Smart City
91
Name of 33/11KV S/S
Nme of 11KV Feeder
Voltage AVG
Voltage V1 V2 V3
Koel Nagar ADE 11KV
10,956
10,958 NA
10,954
Koel Nagar Hamirpur 11KV
10,935
10,955
10,945
10,904
Chhend Self Finance 11KV
10,959
10,904
10,968
11,005
Chhend Panposh 11KV
10,896
10,889 10,879
10,920
Chhend RDA 11KV
10,937
10,941
10,919
10,951
Chhend Chend1st Phase 11KV
10,383
10,394 10,369
10,387
Chhend Kalingavihar 11KV
10,959
10,904
10,968
11,005
Panposh PHD 11KV
11,138
11,144
11,132
11,140
Panposh Balughat/RAW WATER
11KV
11,017
11,073 11,014
10,965
Panposh College 11KV
11,328
11,255
11,336 11,395
Panposh Town 11KV
11,316
11,310 11,296
11,341
Panposh RGH 11KV
11,303
11,338 11,283
11,289
Pilot Project Pilot Project 11KV
11,424
11,450
11,436 11,386
Industrial Estate
Industrial Estate 11KV
10,453
10,456
10,446 10,456
Industrial Estate
Town 11KV
11,086
11,058 NA
11,113
Lathikata Morden India-II 11KV
10,876 10,875 NA 10,876
Vedvyas Vedvyas 11KV
10,997
11,065 NA
10,929
Vedvyas Gopapali 11KV
10,864
10,864 NA 10,864
Table 18 - Voltage profile of 11 kV feeders

Verification of baseline KPIs for Rourkela Smart City
92
Power Factor profile
33 KV FEEDERS
Name of 132/33KV GSS
Name of Feeder Voltage Level AVG PF
Rourkela GSS 33 kV Industrial Estate feeder 33KV
0.92
Rourkela GSS 33 kV Pilot project feeder 33KV
0.88
Rourkela GSS 33 kV Old IDC feeder 33KV
0.94
Rourkela GSS 33 kV Powerhouse 33KV
0.96
Chhend GSS 33 kV Basanti feeder 33KV
0.99
Chhend GSS 33 kV Chhend Koelnagar 33KV
0.95
Table 19 - Power factor profile of 33 kV feeders
11 KV FEEDERS
Name of 33/11KV S/S Nme of 11KV Feeder Voltage AVG PF
Power House Road 11 kV Udit Nagar feeder 11KV
0.89
Power House Road 11 kV Main Road feeder 11KV
0.92
Power House Road 11 kV Power House Road feeder 11KV
0.99
Power House Road 11 kV Plant Site Road feeder 11KV
0.98
Basanti 11 kV DAV feeder 11KV
0.96
Basanti 11 kV PHD feeder 11KV
0.99
Basanti 11 kV MS Palli feeder 11KV
0.84
REC 11 kV Jagda/Shaktinagar 11KV
0.98
REC 11 kV Nayabazar Bondamunda 11KV
0.83
REC 11 kV OSAP feeder 11KV
0.94
Koel Nagar 11 kV Jhirpani feeder 11KV
0.97
Koel Nagar 11 kV BC feeder 11KV
0.95
Koel Nagar 11 kV ADE feeder 11KV
0.96

Verification of baseline KPIs for Rourkela Smart City
93
Name of 33/11KV S/S Nme of 11KV Feeder Voltage AVG PF
Koel Nagar 11 kV Hamirpur feeder 11KV
0.99
Chhend 11 kV Self Finance feeder 11KV
0.94
Chhend 11 kV Panposh feeder 11KV
0.91
Chhend 11 kV RDA feeder 11KV
0.89
Chhend 11 kV Chend1st Phase feeder 11KV
0.83
Chhend 11 kV Kalingavihar feeder 11KV
0.87
Chhend 11 kV Luhakera feeder 11KV
0.97
Panposh 11 kV PHD feeder 11KV
0.90
Panposh 11 kV Raw water feeder 11KV
0.63
Panposh 11 kV College feeder 11KV
0.98
Panposh 11 kV Town feeder 11KV
0.93
Panposh 11 kV RGH feeder 11KV
1.00
Pilot Project 11 kV Pilot Project feeder 11KV
0.90
Industrial Estate 11 kV Industrial Estate feeder 11KV
0.80
Industrial Estate 11 kV Town feeder 11KV
0.82
Lathikata 11 kV Modern India-II feeder 11KV
0.88
Vedvyas 11 kV Vedvyas feeder 11KV
0.95
Vedvyas 11 kV Gopapali feeder 11KV
0.96
Table 20 - Power factor profile of 11 kV feeders

Verification of baseline KPIs for Rourkela Smart City
94
Harmonics profile Voltage harmonics profile
Name of 33/11KV S/S
Nme of 11KV Feeder THD V1 THD V2 THD V3
Basanti 11 kV DAV feeder 2.45 % 2.58 % 3.70 %
Basanti 11 kV PHD feeder 4.30 % 4.48 % 4.21 %
Koel Nagar 11 kV Jhirpani feeder 2.53 % 1.86 % 1.66 %
Koel Nagar 11 kV BC feeder 2.41 % 2.05 % 1.73 %
Koel Nagar 11 kV ADE feeder 1.62 % 2.04 % 2.28 %
Koel Nagar 11 kV Hamirpur feeder 1.84 % 1.75 % 2.18 %
Chhend 11 kV Panposh feeder 2.31 % 2.00 % 1.85 %
Chhend 11 kV RDA feeder 2.48 % 2.29 % 1.92 %
Chhend 11 kV Chend1st Phase feeder
1.70 % 1.66 % 1.58 %
Chhend 11 kV Luhakera feeder 1.79 % 2.16 % 3.40 %
Panposh 11 kV Raw water feeder 1.23 % 1.73 % 1.15 %
Panposh 11 kV College feeder 1.53 % 1.94 % 1.52 %
Panposh 11 kV RGH feeder 1.52 % 1.70 % 1.81 %
Pilot Project 11 kV Pilot Project feeder 1.77 % 1.35 % 1.72 %
Industrial Estate 11 kV Industrial Estate feeder 1.11 % 0.89 % 0.73 %
Vedvyas 11 kV Vedvyas feeder 5.85 % 5.97 % 6.55 %
Vedvyas 11 kV Gopapali feeder 4.23 % 4.69 % 4.80 %
Table 21 - Voltage harmonics profile
CURRENT HARMONICS PROFILE
Name of 33/11KV S/S Nme of 11KV Feeder THD I1 THD I2 THD I3
Basanti 11 kV DAV feeder 4.25 % 4.60 % 4.21 %
Basanti 11 kV PHD feeder 4.48 % 4.10 % 4.27 %
Koel Nagar 11 kV Jhirpani feeder 2.24 % 1.49 % 1.93 %
Koel Nagar 11 kV BC feeder 4.58 % - 3.84 %
Koel Nagar 11 kV ADE feeder 3.77 % - 3.84 %
Koel Nagar 11 kV Hamirpur feeder 4.14 % 3.63 % 5.94 %
Chhend 11 kV Panposh feeder 3.43 % 3.13 % 3.31 %
Chhend 11 kV RDA feeder 3.83 % 4.86 % 4.40 %
Chhend 11 kV Chend1st Phase feeder 3.73 % 4.08 % 4.76 %
Chhend 11 kV Luhakera feeder 4.94 % 5.12 % 3.91 %
Panposh 11 kV Raw water feeder 1.97 % 1.84 % 1.92 %
Panposh 11 kV College feeder 2.67 % 2.93 % 3.90 %
Panposh 11 kV RGH feeder 3.01 % 4.02 % 3.70 %
Pilot Project 11 kV Pilot Project feeder 3.66 % 4.41 % 4.29 %

Verification of baseline KPIs for Rourkela Smart City
95
Name of 33/11KV S/S Nme of 11KV Feeder THD I1 THD I2 THD I3
Industrial Estate 11 kV Industrial Estate feeder 3.45 % 4.12 % 3.92 %
Vedvyas 11 kV Vedvyas feeder 9.01 % 9.25 % 9.49 %
Vedvyas 11 kV Gopapali feeder 3.81 % 5.88 % 6.09 %
Table 22 - Current harmonics profile
Individual results of harmonics test by Zera MT300 equipment are as follows:
a. 11 kV DAV Feeder
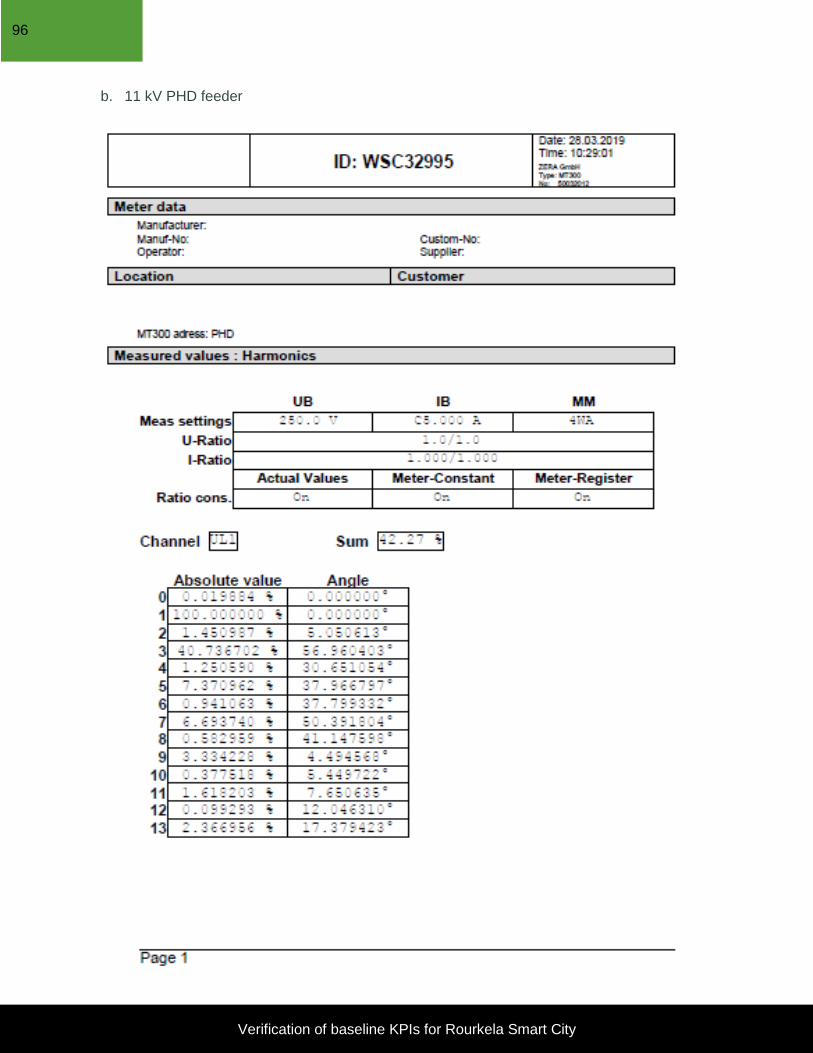
Verification of baseline KPIs for Rourkela Smart City
96
b. 11 kV PHD feeder

Verification of baseline KPIs for Rourkela Smart City
97
c. 11 kV Jhirpani feeder

Verification of baseline KPIs for Rourkela Smart City
98
d. 11 kV BC feeder

Verification of baseline KPIs for Rourkela Smart City
99
e. 11 kV ADE feeder

Verification of baseline KPIs for Rourkela Smart City
100
f. 11 kV Hamirpur feeder
g. 11 kV Panposh feeder

Verification of baseline KPIs for Rourkela Smart City
101
h. 11 kV RDA feeder

Verification of baseline KPIs for Rourkela Smart City
102
i. 11 kV Chhend 1phase feeder

Verification of baseline KPIs for Rourkela Smart City
103
j. 11 kV Luhakera feeder

Verification of baseline KPIs for Rourkela Smart City
104
k. 11 kV Raw water feeder

Verification of baseline KPIs for Rourkela Smart City
105
l. 11 kV College feeder

Verification of baseline KPIs for Rourkela Smart City
106
m. 11 kV RGH feeder

Verification of baseline KPIs for Rourkela Smart City
107
n. 11 kV Pilot project feeder
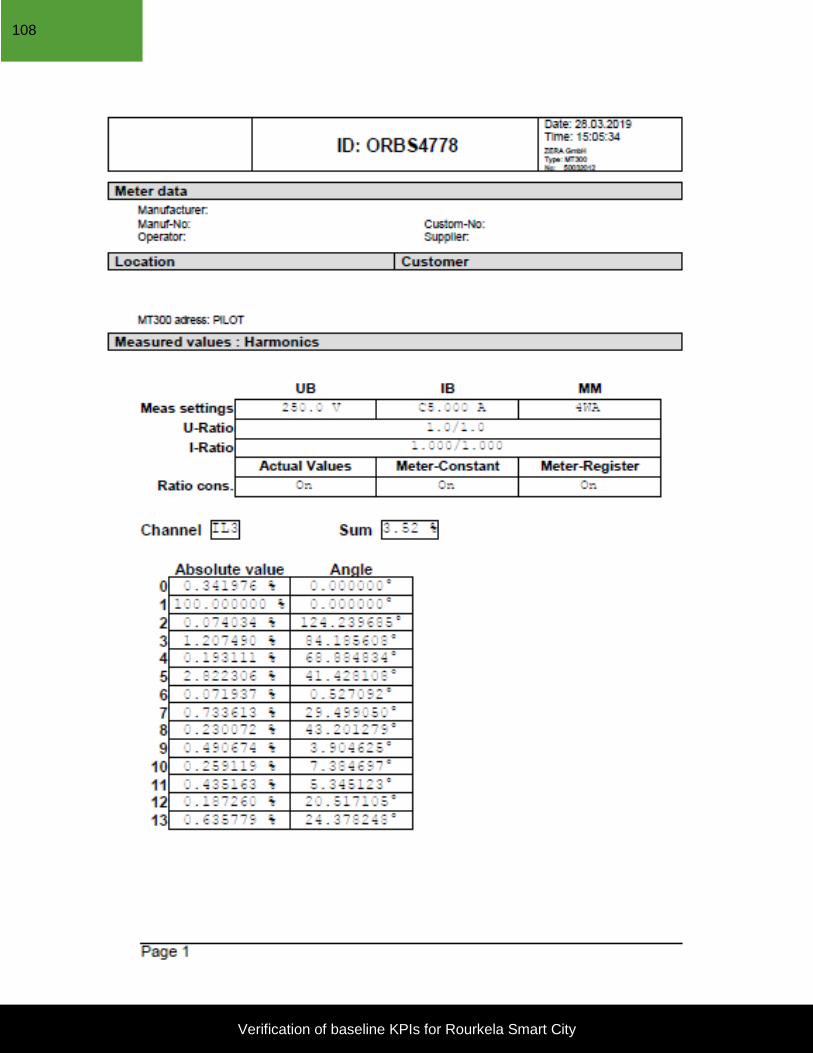
Verification of baseline KPIs for Rourkela Smart City
108

Verification of baseline KPIs for Rourkela Smart City
109
o. 11 kV Industrial estate feeder
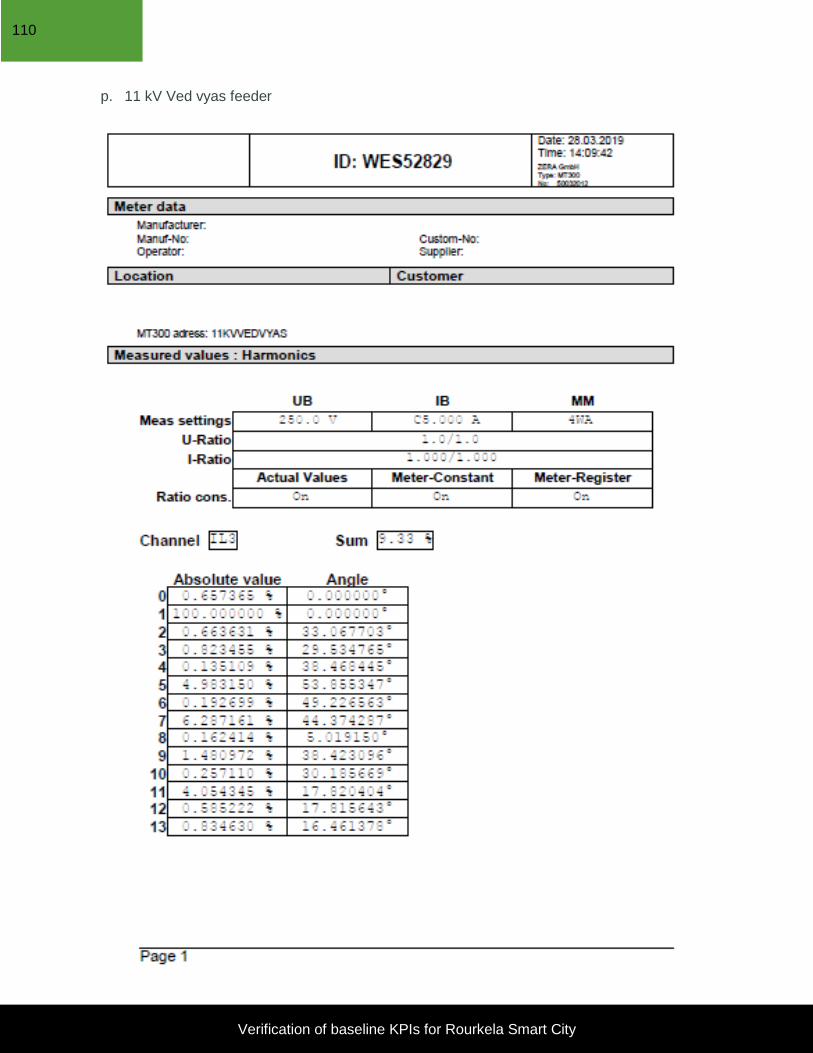
Verification of baseline KPIs for Rourkela Smart City
110
p. 11 kV Ved vyas feeder

Verification of baseline KPIs for Rourkela Smart City
111
q. 11 kV Gopapalli feeder

112
Transformer failure rate
Rourkela Electrical Division (RED) transformer failure
Installed Failed DTs in FY 2017-18
Capacity Nos. Apr May Jun Jul Aug Sep Oct Nov Dec Jan Feb Mar Total
10 kVA 0 0
16 kVA 210 1 2 1 4 4 2 1 1 16
25 kVA 59 3 1 5 1 8 1 3 22
63 kVA 36 2 1 2 1 1 7
100 kVA 142 4 4 3 3 2 2 1 1 20
150 kVA 6 0
160 kVA 1 0
200 kVA 12 1 1
250 kVA 78 1 1 1 3
300 kVA 0 0
315 kVA 19 0
400 kVA 4 0
500 kVA 50 1 1 1 3
630 kVA 6 1 1
750 kVA 1 0
1000 kVA 1 0
Total 625 4 8 4 9 9 8 14 5 2 5 4 1 73
Total transformers in RED division = 625
No. of failed transformers in 2017-18 = 73 - % failure rate = 73 / 625 = 11.68%
However, since 10, 16 and 25 kVA transformers are HVDS single consumer DTs with high failure rate, it might be excluded.
Therefore, % failure rate of RED division = 35 / 625 = 5.60%

Verification of baseline KPIs for Rourkela Smart City
113
Rourkela Sadar Electrical Division (RSED) transformer failure
Installed Failed DTs in FY 2017-18
Capacity Nos. Apr May Jun Jul Aug Sep Oct Nov Dec Jan Feb Mar Total
10 kVA 70 0
16 kVA 875 1 1 1 2 12 6 2 1 1 1 28
25 kVA 898 2 6 1 2 1 12
63 kVA 236 1 1 1 1 4
100 kVA 266 4 1 6 1 2 1 15
150 kVA 4 0
160 kVA 0 0
200 kVA 6 0
250 kVA 74 1 1 2
300 kVA 1 0
315 kVA 17 2 2
400 kVA 2 0
500 kVA 30 3 1 1 1 6
630 kVA 1 0
750 kVA 0 0
1000 kVA 0 0
Total 2480 8 2 3 11 22 8 7 1 2 2 1 2 69
Total transformers in RSED division = 2480
No. of failed transformers in 2017-18 = 69 - % failure rate = 89 / 2480 = 2.78%
However, since 10, 16 and 25 kVA transformers are HVDS single consumer DTs with high failure rate, it might be excluded.
Therefore, % failure rate of RSED division = 29 / 2480 = 1.17%

Verification of baseline KPIs for Rourkela Smart City
114
Rourkela Sadar Electrical Division (RSED) transformer failure
Installed Failed DTs in FY 2017-18
Capacity Nos. Apr May Jun Jul Aug Sep Oct Nov Dec Jan Feb Mar Total
10 kVA 70 0
16 kVA 875 1 1 1 2 12 6 2 1 1 1 28
25 kVA 898 2 6 1 2 1 12
63 kVA 236 1 1 1 1 4
100 kVA 266 4 1 6 1 2 1 15
150 kVA 4 0
160 kVA 0 0
200 kVA 6 0
250 kVA 74 1 1 2
300 kVA 1 0
315 kVA 17 2 2
400 kVA 2 0
500 kVA 30 3 1 1 1 6
630 kVA 1 0
750 kVA 0 0
1000 kVA 0 0
Total 2480 8 2 3 11 22 8 7 1 2 2 1 2 69
Total transformers in RSED division = 2480
No. of failed transformers in 2017-18 = 69 - % failure rate = 89 / 2480 = 2.78%
However, since 10, 16 and 25 kVA transformers are HVDS single consumer DTs with high failure rate, it might be excluded.
Therefore, % failure rate of RSED division = 29 / 2480 = 1.17%

Verification of baseline KPIs for Rourkela Smart City
115
Total transformer failure for FY 2017-18
Installed Failed DTs in FY 2017-18
Capacity Nos. Apr May Jun Jul Aug Sep Oct Nov Dec Jan Feb Mar Total
10 kVA 70 0 0 0 0 0 0 0 0 0 0 0 0 0
16 kVA 1085 1 2 1 4 13 10 6 3 1 1 1 1 44
25 kVA 957 0 0 3 3 11 2 10 1 0 4 0 0 34
63 kVA 272 0 2 0 1 1 0 1 2 1 1 1 1 11
100 kVA 408 8 5 0 9 1 3 4 0 2 1 1 1 35
150 kVA 10 0 0 0 0 0 0 0 0 0 0 0 0 0
160 kVA 1 0 0 0 0 0 0 0 0 0 0 0 0 0
200 kVA 18 0 0 0 1 0 0 0 0 0 0 0 0 1
250 kVA 152 0 0 2 1 2 0 0 0 0 0 0 0 5
300 kVA 1 0 0 0 0 0 0 0 0 0 0 0 0 0
315 kVA 36 0 0 0 0 2 0 0 0 0 0 0 0 2
400 kVA 6 0 0 0 0 0 0 0 0 0 0 0 0 0
500 kVA 80 3 1 1 1 0 1 0 0 0 0 2 0 9
630 kVA 7 0 0 0 0 1 0 0 0 0 0 0 0 1
750 kVA 1 0 0 0 0 0 0 0 0 0 0 0 0 0
1000 kVA 1 0 0 0 0 0 0 0 0 0 0 0 0 0
Total 3105 12 10 7 20 31 16 21 6 4 7 5 3 142
Total transformers in Smart city area = 3105
No. of failed transformers in 2017-18 = 142 - % failure rate = 142 / 3105 = 4.57%
However, since 10, 16 and 25 kVA transformers are HVDS single consumer DTs with high failure rate, it might be excluded.
Therefore, % failure rate = 64 / 3105 = 2.06%


