MusselsAlive Report JANUARY, 2013 MEAT QUALITY OF ROPE GROWN SCOTTISH MUSSELS The report describes the work developed at IPMA in order to characterize the meat quality of rope grown mussels from Scotland. ANA MAULVAULT ANTÓNIO MARQUES SÓNIA PEDRO MARIA LEONOR NUNES Acknowledgments: MusselsAlive is a research for SME Associations project and has received funding from the EU Seventh Framework Programme FP7 under grant agreement no 243452.
Transcript
MusselsAlive Report
JANUARY, 2013 MEAT QUALITY OF ROPE GROWN SCOTTISH
MUSSELS
The report describes the work developed at IPMA in order to
characterize the meat quality of rope grown mussels from
Scotland.
ANA MAULVAULT ANTÓNIO MARQUES SÓNIA PEDRO MARIA LEONOR NUNES
Acknowledgments: MusselsAlive is a research for SME Associations project and has received funding from the EU Seventh Framework Programme FP7 under grant agreement no 243452.
MusselsAlive Report - SCOTLAND
1
INDEX
1. TRANSPORT CONDITIONS .................................................................................................................... 3
MusselsAlive Report Meat quality of rope grown mussels in Scotland – Winter, Spring and Autumn 2011 – Winter, Spring and Summer 2012
The work developed at IPMA aimed to characterize the meat quality of rope grown mussels from Scotland in
order to evaluate the current status of mussel’s quality provided to European consumers throughout the year.
Mussels were sent by The Scottish Shellfish Marketing Group and received at IPMA (Lisbon) in four
seasons: Winter I (sent on the 1st of March and received on the 2nd of March, 2011), Spring I (sent on the
13th of June and received on the 14th of June, 2011), Autumn (sent on the 14th and received on the 15th of
November of 2011), Winter II (sent on the 25th of January and received on the 26th of January, 2012),
Spring II (sent on the 1st of May and received on the 2nd of May, 2012), and Summer (on the 11th of July
and received on the 12th of July, 2012). Once in Portugal, the mussels were immediately examined and
several parameters were checked namely:
1. Transport box and net bags
2. Biometry
3. Mortality
4. Sensorial analyses of raw and cooked mussels performed by a professional panel
5. Edible meat content
6. Meat chemical assessment
This report is divided in three main sections. The first section is the Transport Conditions and
comprehends the parameters one to three of the above list. The second part describes the results of the
sensorial analyses and the edible content and is entitled Perceived Freshness. Finally, the main results of
the chemical analyses, including proteins, fat, glycogen, ash, moisture, fatty acids, amino acids and inorganic
elements are shown in the third section - Chemical Composition.
MusselsAlive Report - SCOTLAND
3
1. TRANSPORT CONDITIONS
1.1 Transport box
Mussels were packed in 10 net bags in Spring (I and II) and Winter (I and II) seasons. The samples
received in Autumn consisted only in a large net bag containing all mussels. In Summer, 15 net bags with
Scottish mussels were sent. Nevertheless, once at the laboratory (in Lisbon, Portugal), the mussels were
divided and distributed into 9 different recipients. In all seasons, samples were transported in Styrofoam
boxes, containing packed ice to keep low temperature, i.e. around 10 ºC upon arrival to Lisbon, in all cases
(Figure 1). Additionally, paper journal was used to maintain moisture in Winter I and Spring I samples.
1.2 Biometric data
As shown in Table 1, each net bag of Winter I mussels had 989.3 ± 15.2 g, corresponding to 75 mussels
each, whereas in Winter II the net bags weighted in average 1028.0 ± 38.8 g and contained 98 mussels. In
Spring I, net bags weighted 960 ± 25.2 g, each having 77 specimens, but in Spring II a higher number of
mussels were found per net bags (100 mussels), each weighting 1096.3 ± 29.5 g. The samples received in
Autumn consisted only in a large net bag containing all mussels sent from Scotland. Nevertheless, once at
the laboratory (in Lisbon, Portugal), the mussels were divided and distributed into 9 different recipients. Each
A B C
D E
Figure 1 - The different layers wrapping the net bags containing mussels: A - Winter I (2011); B – Spring I (2011); C – Autumn (2011); D - Winter II (2012); E – Spring II (2012); F – Summer (2012). 1 - Packed Ice; 2- Insulating plastic layer; 3 – Paper Journal: 4 – Net bag with
live mussels.
1
2 3
4 1
2
3 4
1
2
4
1
2 4 1
2 4
1 2
4
F
4
A
MusselsAlive Report - SCOTLAND
4
recipient contained, in average, 67 mussels and weighted 1002.8 ± 2.6 g. Summer sample consisted of 15
net bags, each weighing 894.8 ± 14.9 g which corresponded to an average of 86 mussels per net bag.
Table 1 – Winter (I and II), Spring (I and II), Autumn and Summer mussels’ biometric parameters.
Biometrics Winter I Spring I Autumn Winter II Spring II Summer
In general, mussels harvested in Winter II, Spring II and Summer presented lower lengths and weights,
whereas larger specimens were collected in Winter I, Autumn and Spring I.
1.3 Mortalities and broken shells
Each net bag was visually inspected. As shown in Figure 2, mortality percentages during transportation were
very high on Winter I and Spring I (18% and 35%, respectively, not including broken shells), since these
samples only arrived at Lisbon 4 days after being collected. The mortalities observed in Autumn, Winter II,
Spring II and Summer were much lower, never exceeding 10%. When including mussels with broken shells
the mortalities were slightly higher, indicating that mussels should be handled and transported carefully along
the trade chain to avoid such losses. Despite the results obtained, it is important to note that mussels’ net
bags should not be kept inside a closed plastic bags (as observed in Spring II sampling) since this does not
allow animals to breath, causing the decrease of condition index and higher mortality rates during transport.
Figure 2 - Mussel’s mortality rate and mortality including broken mussels (%) in each net bag after transport from Scotland in a Styrofoam box.
MusselsAlive Report - SCOTLAND
5
In general, mortality (excluding broken shells) in each season was variable among bags,
with an average of 6 % in Autumn, 2 % in Winter II, 4 % in Spring II and 10% in Summer.
MusselsAlive Report - SCOTLAND
6
2. PERCEIVED FRESHNESS
2.1 Sensorial analysis of live and cooked mussels
Ten experienced panellists analysed the live mussels’ shell appearance and smell in Winter I, Spring I,
Autumn, Winter II, Spring II and Summer. The panel also scored odour, flavour and texture of steam-
cooked mussels. At the end, a global rate for each treatment (live and cooked) was attributed to the mussels.
In each season, six mussels were analysed per panellist (3 raw and 3 cooked), totalizing thirty live mussels
and thirty steam-cooked mussels.
2.1.2. LIVE MUSSELS SENSORIAL ANALYSES
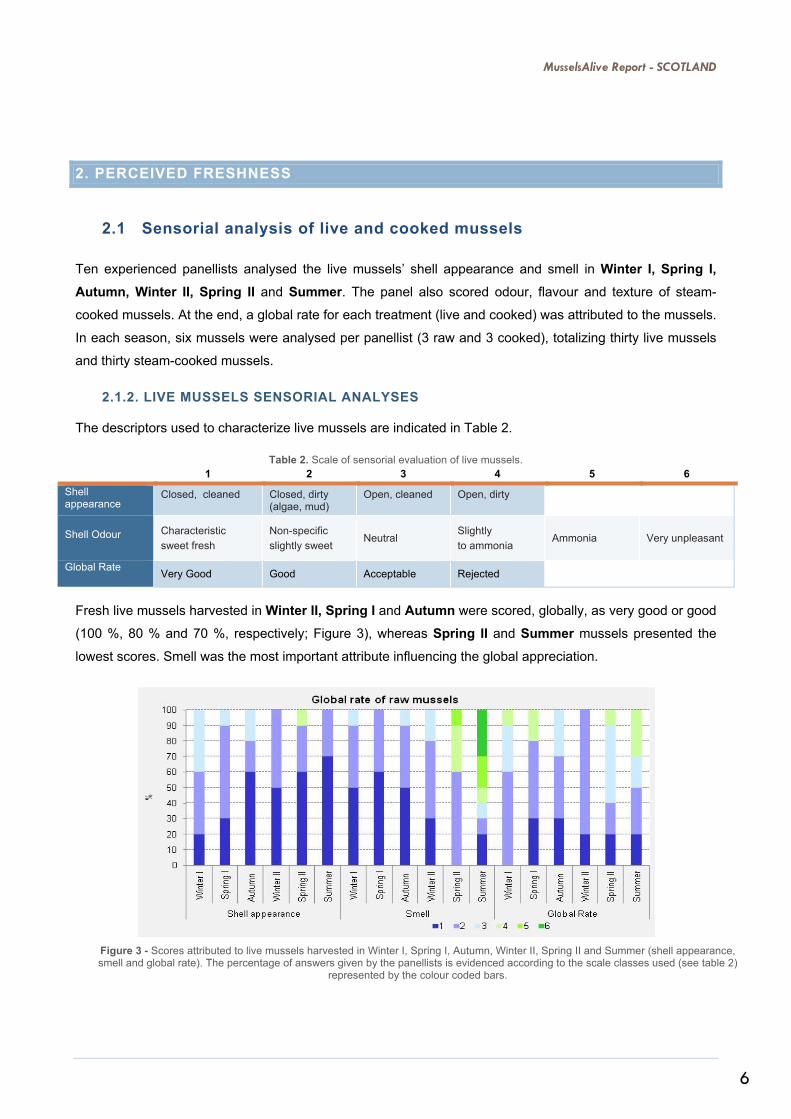
The descriptors used to characterize live mussels are indicated in Table 2.
Table 2. Scale of sensorial evaluation of live mussels. 1 2 3 4 5 6
Shell appearance
Closed, cleaned Closed, dirty (algae, mud)
Open, cleaned Open, dirty
Shell Odour Characteristic
sweet fresh
Non-specific
slightly sweet Neutral
Slightly
to ammonia Ammonia Very unpleasant
Global Rate Very Good Good Acceptable Rejected
Fresh live mussels harvested in Winter II, Spring I and Autumn were scored, globally, as very good or good
(100 %, 80 % and 70 %, respectively; Figure 3), whereas Spring II and Summer mussels presented the
lowest scores. Smell was the most important attribute influencing the global appreciation.
Figure 3 - Scores attributed to live mussels harvested in Winter I, Spring I, Autumn, Winter II, Spring II and Summer (shell appearance, smell and global rate). The percentage of answers given by the panellists is evidenced according to the scale classes used (see table 2)
represented by the colour coded bars.
MusselsAlive Report - SCOTLAND
7
2.1.2. STEAMED COOKED-MUSSELSSENSORIAL ANALYSES
Mussels were also steam-cooked at 100 ºC during 3 minutes and served to experienced panellists at room
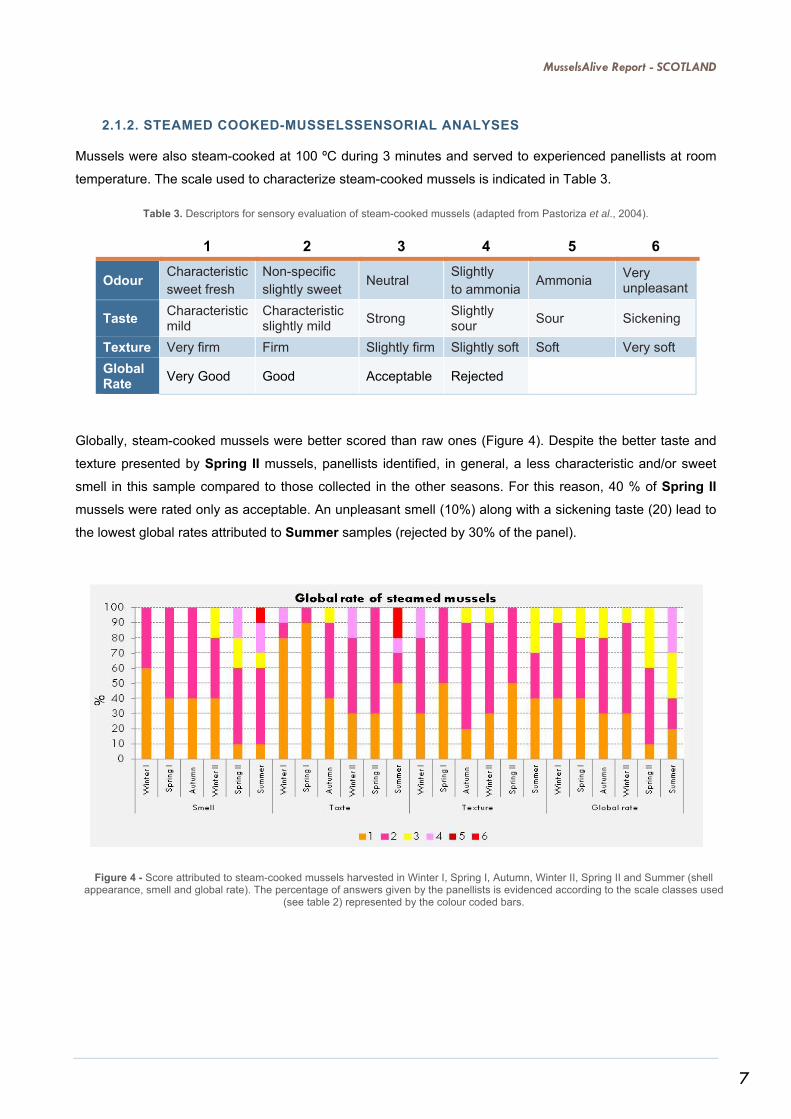
temperature. The scale used to characterize steam-cooked mussels is indicated in Table 3.
Table 3. Descriptors for sensory evaluation of steam-cooked mussels (adapted from Pastoriza et al., 2004).
1 2 3 4 5 6
Odour Characteristic sweet fresh
Non-specific slightly sweet
Neutral Slightly to ammonia
Ammonia Very unpleasant
Taste Characteristic mild
Characteristic slightly mild
Strong Slightly sour
Sour Sickening
Texture Very firm Firm Slightly firm Slightly soft Soft Very soft
Global Rate
Very Good Good Acceptable Rejected
Globally, steam-cooked mussels were better scored than raw ones (Figure 4). Despite the better taste and
texture presented by Spring II mussels, panellists identified, in general, a less characteristic and/or sweet
smell in this sample compared to those collected in the other seasons. For this reason, 40 % of Spring II
mussels were rated only as acceptable. An unpleasant smell (10%) along with a sickening taste (20) lead to
the lowest global rates attributed to Summer samples (rejected by 30% of the panel).
Figure 4 - Score attributed to steam-cooked mussels harvested in Winter I, Spring I, Autumn, Winter II, Spring II and Summer (shell appearance, smell and global rate). The percentage of answers given by the panellists is evidenced according to the scale classes used
(see table 2) represented by the colour coded bars.
MusselsAlive Report - SCOTLAND
8
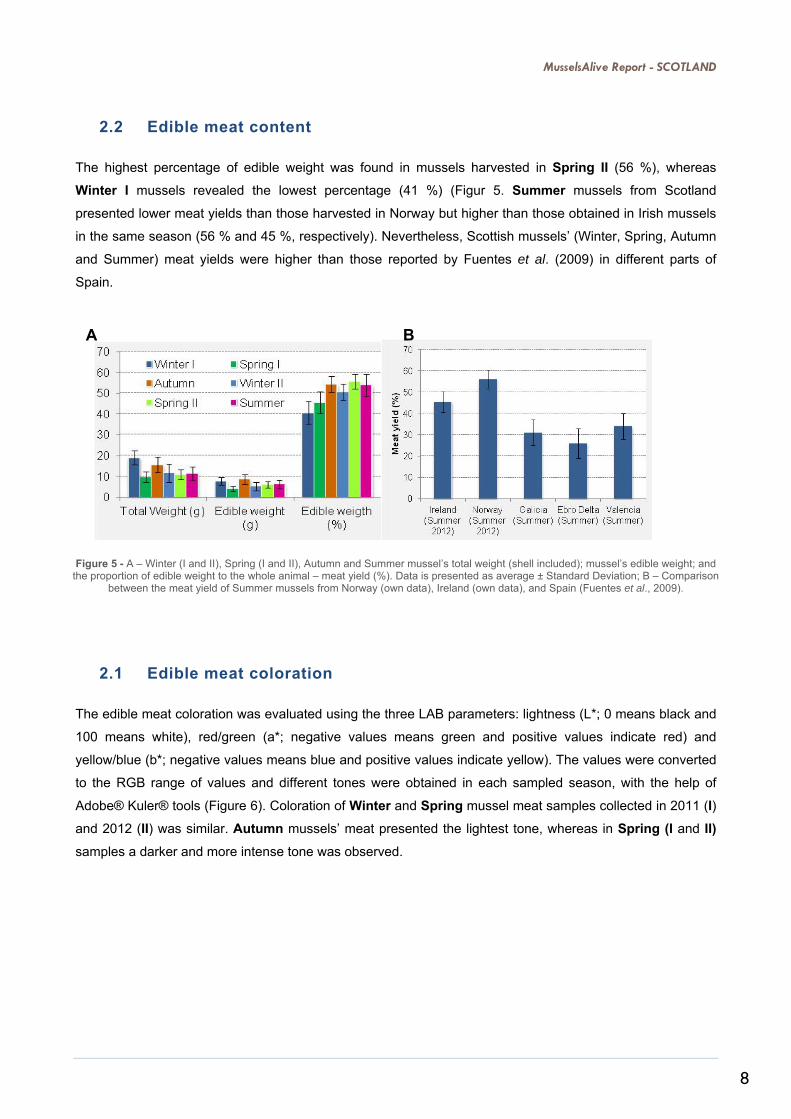
2.2 Edible meat content
The highest percentage of edible weight was found in mussels harvested in Spring II (56 %), whereas
Winter I mussels revealed the lowest percentage (41 %) (Figur 5. Summer mussels from Scotland
presented lower meat yields than those harvested in Norway but higher than those obtained in Irish mussels
in the same season (56 % and 45 %, respectively). Nevertheless, Scottish mussels’ (Winter, Spring, Autumn
and Summer) meat yields were higher than those reported by Fuentes et al. (2009) in different parts of
Spain.
2.1 Edible meat coloration
The edible meat coloration was evaluated using the three LAB parameters: lightness (L*; 0 means black and
100 means white), red/green (a*; negative values means green and positive values indicate red) and
yellow/blue (b*; negative values means blue and positive values indicate yellow). The values were converted
to the RGB range of values and different tones were obtained in each sampled season, with the help of
Adobe® Kuler® tools (Figure 6). Coloration of Winter and Spring mussel meat samples collected in 2011 (I)
and 2012 (II) was similar. Autumn mussels’ meat presented the lightest tone, whereas in Spring (I and II)
samples a darker and more intense tone was observed.
B
A
Figure 5 - A – Winter (I and II), Spring (I and II), Autumn and Summer mussel’s total weight (shell included); mussel’s edible weight; and the proportion of edible weight to the whole animal – meat yield (%). Data is presented as average ± Standard Deviation; B – Comparison
between the meat yield of Summer mussels from Norway (own data), Ireland (own data), and Spain (Fuentes et al., 2009).
MusselsAlive Report - SCOTLAND
9
In general, live and steam-cooked mussels harvested in Summer revealed lower
acceptance than those harvested in Winter, Autumn and Spring, mostly due to the
unpleasant smell and taste detected. Spring mussels revealed higher meat yield
percentages (55.5%) a darker and more intense coloration of meat.
WINTER
I and II
SPRING
I and II
AUTUMN
Figure 6 - Scottish mussels’ average edible meat coloration converting LAB values to RGB values (http://kuler.adobe.com).
SUMMER
MusselsAlive Report - SCOTLAND
10
3. CHEMICAL COMPOSITION
3.1 Proximate chemical composition
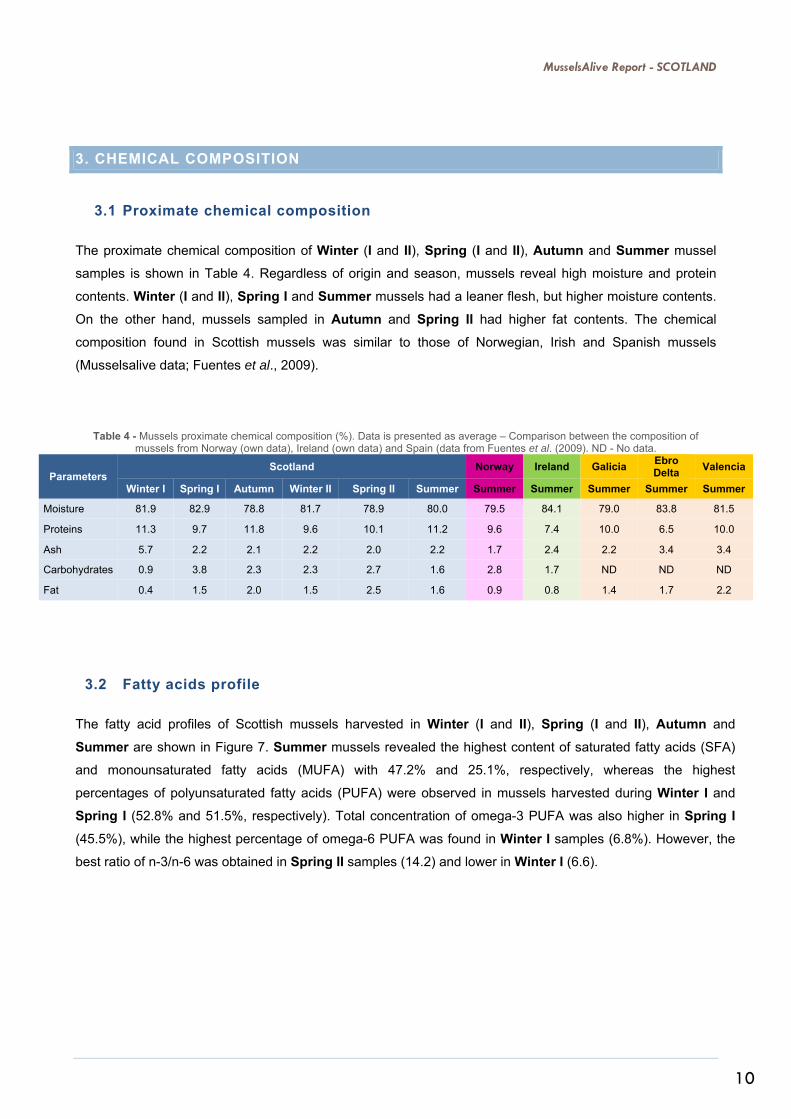
The proximate chemical composition of Winter (I and II), Spring (I and II), Autumn and Summer mussel
samples is shown in Table 4. Regardless of origin and season, mussels reveal high moisture and protein
contents. Winter (I and II), Spring I and Summer mussels had a leaner flesh, but higher moisture contents.
On the other hand, mussels sampled in Autumn and Spring II had higher fat contents. The chemical
composition found in Scottish mussels was similar to those of Norwegian, Irish and Spanish mussels
(Musselsalive data; Fuentes et al., 2009).
Table 4 - Mussels proximate chemical composition (%). Data is presented as average – Comparison between the composition of mussels from Norway (own data), Ireland (own data) and Spain (data from Fuentes et al. (2009). ND - No data.
Parameters Scotland Norway Ireland Galicia
Ebro Delta
Valencia
Winter I Spring I Autumn Winter II Spring II Summer Summer Summer Summer Summer Summer
Component of multiple enzymes and proteins, involved in the regulation of gene expression
8 (♀)
11 (♂)
40 Reduced Cu levels
Selenium
Se
Protection against oxidative stress, regulation of thyroid hormone action, reduction and oxidation of vitamin C and other molecules
0.055 0.4 Hair and nails brittleness and loss
Magnesium
Mg†
Cofactor of enzyme systems 320 (♀)
420 (♂)
ND No evidence of adverse effects from consumption of naturally occurring Mg in foods;
Mg containing supplements may cause osmotic diarrhea
Manganese
Mn
Involved in the formation of bone, as well as in enzymes from amino acid, cholesterol and carbohydrate metabolism
1.8* (♀)
2.3* (♂)
11 Elevated blood concentration and neurotoxicity
Abbreviation: (RDA) recommended dietary allowance; (AI) adequate intake; (UL) tolerable upper intake levels. RDA values are in bold type while AI are in ordinary type followed by an asterisk (*). All reference intakes shown are for adult males (♂) and females (♀) aged 19 to 50 years. (ND) not determinable due to lack of data of adverse effects in this age group and concern with regard to lack of ability to handle excess amounts. Source of intake should be from food only to prevent high levels of intake (IOM, 1997; 2001; 2004); (†) female and male adults aged between 31 and 50 years.
MusselsAlive Report - SCOTLAND
15
RDA is set to meet the daily dietary needs of almost all (97 to 98 %) healthy individuals in a particular life
stage (e.g. infants, children, pregnancy and lactation) and gender group. The AI is believed to cover the
needs of all individuals in a life stage group, but lack of data prevent being able to specify with confidence
the percentage of individuals covered by this intake. The UL is the highest level of daily nutrient intake that is
likely to pose no risk of adverse health effects to almost all individuals in the general population.
Considering that an adult may eat the equivalent to 100 g of mussels’ edible meat per meal
(approximately, 13 mussels), this product is an excellent source of Se and a good source of Zn, Cu
and Fe.
3.4.1. CONTAMINANTS
In addition to essential elements, toxic elements, such as Hg, Cd, Pb and As, can also be found in some
marine species. Such elements are available in water from natural sources, such as rocks, as a result of
human activities like emissions from industrial processes. These elements are taken up by marine organisms
through the diet and gills, and tend to accumulate in species occupying higher trophic levels, like fish and
shellfish (EFSA, 2004, 2005). Regular consumption of contaminated seafood can cause poisoning and
promote diseases. In the European Union, the European Commission has set maximum levels for Cd, Pb
and Hg but not yet for As (EC No. 1881/2006; Table 6). To ensure an efficient protection of public health,
products containing contaminants exceeding the maximum levels should not be placed on the market either
as such, after mixture with other foodstuffs or used as an ingredient in other foods (EC No. 1881/2006).
Table 6 - Maximum level (ML, ppm) for Hg, Cd and Pb in bivalves according to the EC regulation No 1881/2006 of 19 December 2006, setting maximum levels for certain contaminants in foodstuffs.
Element ML
(ppm) Adverse Effects Observations
Arsenic
As ND
No data on the possible adverse effects of organic arsenic compounds in food were found. Inorganic arsenic is a known toxic substance.
There is no established maximum level for Arsenic.
Cadmium
Cd 1.0
Nephrotoxicity, osteoporosis, carcinogenicity and genotoxicity, teratogenicity, and endocrine and reproductive effects.
Long biological half-life in mammals. In humans, steady-state concentrations in the renal cortex are reached after about 40 years.
Lead
Pb 1.5
Neurotoxicity, anaemia, renal toxicity and subsequent carcinogenicity and cardiovascular effects; impairment of the reproductive system.
Pb in seafood is inorganic, and is bound to proteins. Bioaccumulation in marine animals is low compared to mercury. Main sites of Pb accumulation in seafood: internal organs, skin and bone, but not in muscle.
Mercury
Hg 0.5
Neurotoxicity. High exposure in uterus has resulted in cerebral palsy or severe mental retardation in the neonate.
Organic Hg is considered to be more toxic than other forms of Hg following ingestion. Methyl-Hg is the predominant form of Hg in fish (> 90 %).
MusselsAlive Report - SCOTLAND
16
Despite the, relatively, higher concentrations of Cd and Pb found in Spring I samples (Figure 12), the values
are still well below the levels set by the EU (Table 5), thus indicating that mussels harvested in Scotland are
safe for consumption all year round. Presently, the EU has not established a maximum level for As, but the
concentrations obtained in Scottish mussels have shown to be very low compared to other seafood products
(Muñoz et al., 2009), thus not representing any risk to consumers.
Overall, Scottish mussels are a lean and safe seafood product, as very low contamination
levels were found in Scottish mussels.
Figure 12 – Contaminants concentration in Scottish mussels harvested in Winter (I and II), Spring (I and II), Autumn and Summer.
MusselsAlive Report - SCOTLAND
17
4. REFERENCES
Alkanani, T., Parrish, C. C., Thompson, R. J., & Mckenzie, C. H. (2007). Role of fatty acids in cultured
mussels, Mytilus edulis, grown in Notre Dame Bay, Newfoundland. Journal of Experimental Marine Biology
and Ecology, 348, 33–45.
Barrento, S. (2010). Nutritional quality and physiological responses to transport and storage of live
crustaceans traded in Portugal. Instituto de Ciências Biomédicas Abel Salazar da Universidade do Porto
(PhD thesis in English). 261p.
EFSA (2004). Opinion of the scientific panel on contaminants in the food chain on a request from the
Commission related to cadmium as undesirable substance in animal feed (Question N° EFSA-Q-2003-033).
The EFSA Journal, 72, 1-24.
EFSA (2005). Opinion of the scientific panel on contaminants in the food chain on a request from the
European Parliament related to the safety assessment of wild and farmed fish. Question N° EFSA-Q-2004-
22. The EFSA Journal, 236, 1-118.
Fuentes, A., Fernández-Segovia, I., Escriche, I. & Serra, J. A. (2009). Comparison of physico-chemical
parameters and composition of mussels (Mytilus galloprovincialis Lmk.) from different Spanish origins. Food
Chemistry, 112(2), 295-302.
Muñoz, O., Devesa, V., Suñer, M.A., Vélez, D., Montoro, R., Urieta, I., Macho, M.L., Jalón, M., 2000. Arsenic
in cooked seafood products: study on the effect of cooking on total and inorganic arsenic contents. Journal of
Agricultural and Food Chemistry, 49: 4132-4140.
Pastoriza, L., Bernárdez, M., Sampedro, G., Cabo, M. L. & Herrera, J. J. R. (2004). Elevated concentrations
of oxygen on the stability of live mussel stored refrigerated. European Food Research Technology, 218,