By adopting an array of tools, practices, and strategies we can mitigate the costs and challenges of displacement and relocation while building a greater downtown and city that welcomes all who are here, intend to stay, or hope to take part in Detroit’s resurgence. Baseline Study to Address Displacement and Relocation Tied to Multifamily Redevelopment in Greater Downtown Detroit Capital Impact Partners | Detroit Program
Transcript
By adopting an array of tools, practices, and
strategies we can mitigate the costs and
challenges of displacement and relocation while
building a greater downtown and city that
welcomes all who are here, intend to stay, or
hope to take part in Detroit’s resurgence.
Baseline Study to Address Displacement and Relocation Tied to Multifamily Redevelopment in Greater Downtown Detroit
Capital Impact Partners | Detroit Program
Baseline Study to Address Displacement and Relocation Tied to Multifamily Redevelopment
in Greater Downtown Detroit
Detroit Program
Bradford Frost Elizabeth Luther Pamela Schaeffer
March 2016 Capital Impact Partners 2990 West Grand Blvd, Suite M-15, Detroit, MI 48202 capitalimpact.org
Capital Impact Partners | May 2016 | pi
CONTENTS CONTENTS ......................................................................................................................................................................... I FIGURES ........................................................................................................................................................................... II INTRODUCTION................................................................................................................................................................. 1
Genesis of the Study................................................................................................................................................. 1 Study Questions ....................................................................................................................................................... 3 Study Area ................................................................................................................................................................ 3 Study Methods ......................................................................................................................................................... 3
RECENT TRENDS: DISPLACEMENT, RELOCATION & AFFORDABILITY IN DETROIT ........................................................................... 5 Displacement & Relocation ...................................................................................................................................... 5 Multifamily Housing ................................................................................................................................................. 7 Housing Conditions .................................................................................................................................................. 8 Housing Affordability & Income Distribution ......................................................................................................... 10 Housing Affordability: Trends ................................................................................................................................ 14 Publically Subsidized Housing ................................................................................................................................ 18 Case Studies ........................................................................................................................................................... 23
PROPOSED GUIDELINES AND POLICY RECOMMENDATIONS ..................................................................................................... 29 Summary of Risk ..................................................................................................................................................... 29 Regulatory Framework: Baseline Policies & Existing Legal Protections ................................................................. 30 Project-level Policy Recommendations .................................................................................................................. 33 Community Development & Public Policy Recommendations .............................................................................. 37
CONCLUSION ................................................................................................................................................................. 44 ACKNOWLEDGEMENTS ..................................................................................................................................................... 45 REFERENCES................................................................................................................................................................... 46 APPENDIX A: DATA NOTES ................................................................................................................................................. A
Multifamily Property Inventory................................................................................................................................ A Housing Cost Burden Data ....................................................................................................................................... B Rent Comp Data ....................................................................................................................................................... B Publically Subsidized Properties ............................................................................................................................... C
APPENDIX B: DATA REQUIREMENTS AND SURVEY TOPICS ........................................................................................................ D Data Requirements .................................................................................................................................................. D
FIGURES 711 W. Alexandrine | September 2015 ........................................................................................................................ 1 Figure 1. Map – Study area........................................................................................................................................... 2 Figure 2. Map – Multifamily structures and addresses, Q2 2015 ................................................................................ 7 Figure 3. Table – Multifamily structures and addresses, Q2 2015 ............................................................................... 8 Figure 4. Map – Multifamily structures by Condition, MCM 2014............................................................................... 9 Figure 5. Table – Building condition, MCM 2014 ....................................................................................................... 10 Figure 6. Table – Measures of median household income by geography, 2009-2013, 2015 .................................... 11 Figure 7. Table – HUD income limit definitions and 2015 limits for a two-person family ......................................... 11 Figure 8. Table – Income brackets for employment in Detroit .................................................................................. 12 Figure 9. Table – Housing cost burden, CHAS based on ACS 2008-2012 Five-year estimates ................................... 13 Figure 10. Map – LiveMidtown rental properties, 2011-2014 ................................................................................... 15 Figure 11. Table – LiveMidtown all properties rental prices, 2011-2014 .................................................................. 16 Figure 12. Table – LiveMidtown market-rate rental prices, 2011-2014.................................................................... 16 Figure 13. Table – LiveMidtown recent rehab/redevelopment rental prices, 2011-2014 ......................................... 17 Figure 14. Table – Case study rents, pre- and post-development ............................................................................. 18 Figure 15. Table – LiveMidtown property occupancy rate, 2011-2014 ..................................................................... 18 Figure 16. Table – Publically funded housing properties and units, active Jan 2016 ................................................. 19 Figure 17. Map – Publically funded housing properties in greater downtown ......................................................... 21 Figure 18. Table – LIHTC properties and units, active Jan 2016 ................................................................................. 22 Figure 19. Table – 711 W. Alexandrine: Post-redevelopment rents .......................................................................... 25 Figure 20. Table – 663 Prentis: Pre- & post-renovation rents, 2014-2015 ................................................................ 26 Figure 21. Table – 1214 Griswold: Post-redevelopment rents, 2015 ......................................................................... 28 Figure 22. Table – Risk of displacement ..................................................................................................................... 29 Figure 23. Table – Rental gap assistance assumptions and calculations ................................................................... 41
Capital Impact Partners | May 2016 | pii
Capital Impact Partners | May 2016 | p1
INTRODUCTION The half-century decline in Detroit’s population has been accompanied by disinvestment in the city’s housing stock. While the plight of single-family homes captures the attention of the media, there has been parallel disinvestment in the city’s multifamily housing. However, this latter trend is reversing. Community-based organizations, the nonprofit financial sector and the City of Detroit are shepherding the revitalization of Detroit’s greater downtown area. They are doing this through economic development and urban planning tactics that include the rehabilitation and redevelopment of existing structures using government and nonprofit subsidy in partnership with private investors.
For Capital Impact Partners (CIP), this investment is part of an Inclusive Growth Strategy that supports increasing density and diversifying the income mix in mixed-use neighborhoods and districts across Detroit.1 Along with other community development financial institutions (CDFIs) and philanthropic foundations, CIP’s efforts in Detroit are mostly focused on financing new and redeveloped multifamily properties near Detroit’s main corridor—Woodward Avenue—in the Midtown and downtown districts.
While the majority redevelopment efforts are focused on vacant and blighted buildings, the market is improving, and poorly maintained but occupied structures are becoming targets for redevelopment. As this occurs, it results in the need for residents to seek new housing. Recent examples have played out differently with developers, tenants’ rights groups, social service organizations, the City of Detroit and community-based organizations assisting residents in a variety of ways. Types of assistance have included a combination of housing referrals, payment for moving expenses and financial support from property developers. Developers of federally funded projects
1 See CIP’s paper Toward inclusive growth in Detroit: Density and income mix strategies for Detroit’s mixed-use corridors, accessed at http://detroitcorridorinitative.org.
must follow a prescribed response to this type of displacement; yet in practice, public and private relocation responses have been ad hoc.
As the CDFI and community-based organization network increases investment beyond Detroit’s immediate core, redevelopment efforts have become the focus of debate around relocation, displacement and gentrification. Defining and engaging these issues needs to be a part of any strategy that seeks to stabilize the real estate market with the participation of existing residents. This requires all actors involved in stabilization and revitalization activities across the city to consider how investors and residents perceive increasing density and diversifying income mix as well as what tools are required so that new and existing residents benefit from development.
This study looks closely at the relocation that results from building rehabilitation, specifically
• examples in Detroit in recent years,• the roles different actors have played in the
multifamily market, and• policies that may be helpful in following a path
of development without displacement.
GENESIS OF THE STUDY For Capital Impact Partners (CIP), the challenges of relocation came into focus with the rehabilitation of 711 W. Alexandrine (The Rainer).
711 W. ALEXANDRINE | SEPTEMBER 2015
The Rainer was an occupied multifamily property targeted for rehabilitation due to its substandard
Capital Impact Partners | May 2016 | p2
condition and strategic location. Using the Detroit Neighborhood Fund, a $30 million CIP loan product supported by JP Morgan Chase, CIP and Invest Detroit financed $6 million for the renovation of The Rainer transforming the building from a 40-percent occupied, 56-unit structure into a fully leased, 36-unit renovated building. During the rehabilitation, 22 households were required to vacate the property and offered financial support and assistance for relocation. The project raised important questions about rehabilitating occupied buildings in Detroit, including
issues of social justice, neighborhood continuity, building safety and balancing the rights and needs of tenants and property owners. Given its role, CIP saw The Rainer as an opportunity to evaluate the process in order to better account for the implications of relocation when considering future rehabilitation of occupied properties.
FIGURE 1. MAP – STUDY AREA
Capital Impact Partners | May 2016 | p3
STUDY QUESTIONS Through practice and policy, CDFIs active in Detroit have been addressing quality-of-life issues for decades by investing in neighborhoods and housing in partnership with community-based organizations. And as neighborhoods change, evaluation and measurement are necessary to improve strategy and programming. In researching and framing this study, CIP sought to address four main questions with a focus on greater downtown Detroit:
1. How common is displacement resulting frommultifamily redevelopment in Detroit’s greaterdowntown area?
2. What is the inventory of multifamilyproperties—subsidized and market rate—ingreater downtown, and within that inventory,what is the risk for displacement or relocationresulting from redevelopment?
3. What roles have developers, CDFIs, nonprofitsand the public sector played in recent examplesof relocation caused by multifamilyredevelopment in Detroit?
4. How could we structure a systemic response todisplacement resulting from multifamilyredevelopment in Detroit? What are the rolesfor developers, the public sector, nonprofitcommunity-based organizations, CDFIs,advocacy groups and social service providers?
STUDY AREA The study area (Figure 1) is limited to Detroit’s greater downtown, an area that roughly corresponds to the “7.2 square miles” that the Hudson-Webber Foundation tracks annually.2 The area includes downtown, Midtown, Cass Corridor, Brush Park, New Center, Rivertown and parts of other neighborhoods that fall inside the boundary of I-96, Grand Blvd., I-75 and the Detroit River.
The focus is on this area because it is where most multifamily development in Detroit has taken place in
2 7.2 SQ MI: A Report on Greater Downtown Detroit, p.10
recent years. With development concentrated here, the area serves as a testing ground for gathering data and refining questions for future research, programs and policies.
STUDY METHODS This snapshot of redevelopment in greater downtown uses both quantitative and qualitative sources. Capital Impact Partners’ (CIP) initial goal was to build a current picture of multifamily housing in order to best assess current displacement and relocation risks and policies due to redevelopment. This means that we use recent data and local experiences.
DATA SOURCES The foundation of the multifamily property survey is derived from the 2014 Motor City Mapping (MCM) database, which contains information about structure type, building condition and occupancy. The report supplements MCM with active address data from Valassis for more accurate and current vacancy and occupancy estimates within the inventory of multifamily properties in the greater downtown area. Federal data sources were used to compile demographic and household characteristics, housing cost burden levels and an inventory of subsidized multifamily properties.
Gathering a complete longitudinal picture of residency, housing costs and investment trends proved more challenging. The most complete information available is for the Midtown area due to Midtown Detroit, Inc.’s (MDI) collection of development pipeline and rent price data.
MDI and Local Initiatives Support Corporation’s (LISC) Detroit office shared data that they gathered on the state of subsidized properties. Official City of Detroit sources, while available, were not consistent enough for use in this study; however, current City efforts to improve data collection and sharing should make building permit tracking and landlord registries better data sources moving forward.
Capital Impact Partners | May 2016 | p4
INTERVIEWS AND CONVERSATIONS This study also draws from first-hand interviews with representatives from community and economic development organizations, property development teams, community advocacy groups, local and federal housing organizations and the City of Detroit municipal government. Residents who experienced relocation were not included in this study due to time constraints and access issues. However, as the results of the study lead to new programs and policies locally, we believe it will be necessary to include resident voices and input.
Stakeholder interview questions focused on the following areas:
• mission and role of the representative’sorganization in the community,
• role and participation in multifamilydevelopment,
• definition of displacement; assessment ofdisplacement in Detroit,
• specific examples of multifamily displacementand relocation,
• how the organization handles relocation, and• tools, networks, actors and policies to address
displacement.
Organizations represented in interviews include: • Capital Impact Partners,• Cass Corridor Neighborhood Development
Corporation,• Central Detroit Christian Community
Development Corporation,• City of Detroit Building, Safety Engineering and
Environmental Department,• Community Development Advocates of
Detroit,• DDAWN, a cohort of Ford Foundation Civic
Engagement grantees including the Building Movement Project and Detroit People's Platform
• Detroit Development Fund,• Detroit Housing Commission,• Great Lakes Capital Fund,
• IFF,
• Invest Detroit,
• Local Initiatives Support Corporation, Detroit office,
• Midtown Detroit, Inc., and• U.S. Department of Housing and Urban
Development.
Capital Impact Partners | May 2016 | p5
RECENT TRENDS: DISPLACEMENT, RELOCATION & AFFORDABILITY IN DETROIT As the housing market has recovered from the 2008 housing crash, multifamily development in Detroit’s greater downtown has accelerated with the assistance of deep philanthropic investment, government subsidy and private interest. CDFIs’ efforts to support market stabilization have largely focused on vacant property redevelopment and limited new construction with few instances of project-level relocation. Yet, as the real estate market strengthens, property owners have the opportunity to gain more income from multifamily properties through increased rents, which can affect housing affordability and lead to broader market displacement trends. Related to both relocation and displacement, the supply of naturally affordable housing–as opposed to price-controlled or subsidized housing–is likely to decrease as the market strengthens. This section defines and explains the terms in bold and summarizes related recent trends in Detroit’s greater downtown.
DISPLACEMENT & RELOCATION In order to assess trends and develop mitigation policies, the terms displacement and relocation need to be clearly framed. Study interviewees noted that “displacement” triggers wide-ranging conversations about gentrification, theories of economic development focused on rebuilding Detroit’s tax base, disinvestment patterns that harm minorities and investment patterns that favor attracting new residents over the needs of existing residents. While these are valid points of debate, the goals of this study are to establish a baseline for understanding displacement trends and to create actionable policies for redevelopment requiring the relocation of existing residents. To keep this study grounded, we have adopted the following working definitions for displacement and relocation.
DISPLACEMENT Displacement challenges are a significant and longstanding feature of development debates; in 1978, Grier and Grier developed this frequently used definition:
This definition broadly includes displacement due to natural disasters, war and market forces. In a Housing Studies journal issue dedicated to neighborhood restructuring, Kleinhans and Kearns point out that this definition does not include an active party forcing residents to leave their homes,4 a distinction important for this study of Detroit’s greater downtown.
Displacement is often a component of discussions on neighborhood change and gentrification. Traditional evidence of gentrification involves rapid increases in neighborhood resident income and housing costs.5 With these increases come higher property values, better services and a more stable tax base. For some households these increases are beneficial—they are able to stay and take advantage of new infrastructure, service and commercial investments or realize
3 Hutchison, p.224. 4 Kleinhans and Kearns, p.168. 5 A current definition of gentrification is “the transformation of a working-class or vacant areas of the central city into middle-class residential or commercial use” (Zuk, p.11). This definition includes all changes, positive and negative, for neighborhoods. It does not call out cultural changes that can accompany neighborhood gentrification, an area of study that has been added as a factor in displacement. For a full review of gentrification definitions and its historical and current relationship to displacement and racial inequality see the Federal Reserve Bank of San Francisco’s working paper “Gentrification, Displacement and the Role of Public Investment: A Literature Review” (Zuk, M., et al).
Displacement occurs when a household is compelled to leave its residence because of conditions that are beyond the household’s control, occur despite the household’s adherence to previously imposed conditions of occupancy, and cause continued occupancy to be impossible, hazardous, or unaffordable.3
financial gains from higher property values. For others, rising property taxes or rents are not affordable and they are unable to remain in a gentrifying neighborhood in order to take advantage of new investments and opportunities. In many neighborhoods in Detroit, including some of those in the greater downtown, there is a tension between market stabilization efforts and the needs of the existing community. Efforts to increase investment, create quality employment opportunities and attract residents with the goal of diversifying income mix and increasing neighborhood opportunity foster changes that are symptomatic of gentrifying neighborhoods.
Displacement often affects vulnerable populations disproportionately. In natural disasters, like Hurricanes Katrina and Sandy, for example, low-income households with the fewest resources struggle most to recover and rebuild their livelihoods. Market-force displacement has the same effects; low-income households with the fewest resources struggle to adapt to or meet higher rent requirements, a situation of concern in Detroit. The average Detroit resident simply does not have the financial resources to adapt to forces of market displacement. The challenge for those encouraging economic investment and real estate market stabilization in Detroit is to invest in a way that also helps existing households and businesses adapt and adjust during times of rapid change.
RELOCATION Relocation stands separate from displacement for a number of reasons; for this study it is defined as follows:
Separate from displacement, relocation forced by redevelopment has a defined number of people being affected—existing residents—and an identifiable set of actors—the development team. Relocation can be
Capital Impact Partners | May 2016 | p6
either voluntary or involuntary. Some public housing restructuring has included cases where households volunteer to move. In contrast, involuntary relocation occurs when households are not given the choice during redevelopment. Federal requirements governed by the Uniform Relocation Act were the relocation policies most commonly known to interviewees, and the largest relocation efforts have most recently involved federally funded properties (see the “Regulatory Framework” section for a summary of this policy). This study aims to define a series of relocation policies for CDFIs in situations not covered by other legal requirements.
When developers act without a compensation plan for existing residents by exercising their right to terminate leases and then redevelop the property, such cases would qualify as displacement, and the benefits of redevelopment may not be shared by existing residents. In defining a relocation guideline, CDFIs are aiming to ensure that redevelopments have positive outcomes for developers and existing residents.
Moving forward, it is important to assess households that are relocated in order to recognize whether or not project redevelopment is disproportionately affecting vulnerable populations and if the available resources are sufficient. In this way, a proactive relocation plan can improve living situations, and provide resources that allow households to face other displacement forces more effectively.
LINKING RELOCATION AND DISPLACEMENT As households are relocated, it is necessary that affordable housing is available, especially within neighborhoods where residents have existing connections and social networks. During interviews, many housing providers and developers expressed concern that relocated residents would soon run out of safe and affordable housing options in the greater
Relocation is a household’s move from one residence to another supported by compensation and services as outlined in legal policies or other agreements.
Capital Impact Partners | May 2016 | p7
downtown. Successful policies will require CDFIs to take steps to slow and lessen any displacement forces that decrease affordability and availability in the greater downtown. Therefore, we also recommend investments that strengthen existing properties, support for community networks that integrate new investment into the fabric of a community and development of a housing preservation strategy. These steps can help communities adjust to change while maintaining housing options for households at risk of displacement.
MULTIFAMILY HOUSING Capital Impact Partners in Detroit has primarily focused on financial and technical assistance for mixed-use and multifamily projects with more than 10 units because of the impact multifamily projects have on neighborhood density and income mix.
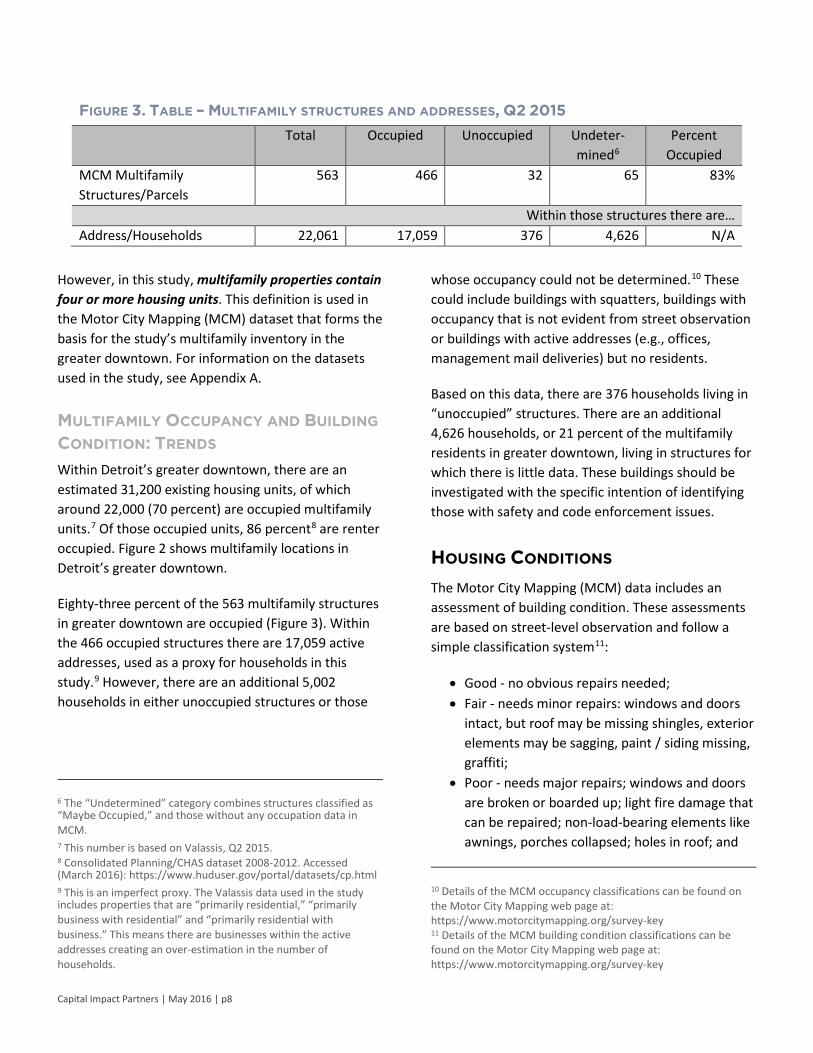
FIGURE 2. MAP – MULTIFAMILY STRUCTURES AND ADDRESSES, Q2 2015
However, in this study, multifamily properties contain four or more housing units. This definition is used in the Motor City Mapping (MCM) dataset that forms the basis for the study’s multifamily inventory in the greater downtown. For information on the datasets used in the study, see Appendix A.
MULTIFAMILY OCCUPANCY AND BUILDING CONDITION: TRENDS Within Detroit’s greater downtown, there are an estimated 31,200 existing housing units, of which around 22,000 (70 percent) are occupied multifamily units.7 Of those occupied units, 86 percent8 are renter occupied. Figure 2 shows multifamily locations in Detroit’s greater downtown.
Eighty-three percent of the 563 multifamily structures in greater downtown are occupied (Figure 3). Within the 466 occupied structures there are 17,059 active addresses, used as a proxy for households in this study.9 However, there are an additional 5,002 households in either unoccupied structures or those
6 The “Undetermined” category combines structures classified as “Maybe Occupied,” and those without any occupation data in MCM. 7 This number is based on Valassis, Q2 2015. 8 Consolidated Planning/CHAS dataset 2008-2012. Accessed (March 2016): https://www.huduser.gov/portal/datasets/cp.html 9 This is an imperfect proxy. The Valassis data used in the study includes properties that are “primarily residential,” “primarily business with residential” and “primarily residential with business.” This means there are businesses within the active addresses creating an over-estimation in the number of households.
Capital Impact Partners | May 2016 | p8
whose occupancy could not be determined.10 These could include buildings with squatters, buildings with occupancy that is not evident from street observation or buildings with active addresses (e.g., offices, management mail deliveries) but no residents.
Based on this data, there are 376 households living in “unoccupied” structures. There are an additional 4,626 households, or 21 percent of the multifamily residents in greater downtown, living in structures for which there is little data. These buildings should be investigated with the specific intention of identifying those with safety and code enforcement issues.
HOUSING CONDITIONS The Motor City Mapping (MCM) data includes an assessment of building condition. These assessments are based on street-level observation and follow a simple classification system11:
• Good - no obvious repairs needed;• Fair - needs minor repairs: windows and doors
intact, but roof may be missing shingles, exteriorelements may be sagging, paint / siding missing,graffiti;
• Poor - needs major repairs; windows and doorsare broken or boarded up; light fire damage thatcan be repaired; non-load-bearing elements likeawnings, porches collapsed; holes in roof; and
10 Details of the MCM occupancy classifications can be found on the Motor City Mapping web page at: https://www.motorcitymapping.org/survey-key 11 Details of the MCM building condition classifications can be found on the Motor City Mapping web page at: https://www.motorcitymapping.org/survey-key
FIGURE 3. TABLE – MULTIFAMILY STRUCTURES AND ADDRESSES, Q2 2015 Total Occupied Unoccupied Undeter-
mined6 Percent
Occupied MCM Multifamily Structures/Parcels
563 466 32 65 83%
Within those structures there are… Address/Households 22,061 17,059 376 4,626 N/A
Capital Impact Partners | May 2016 | p9
• Suggested Demolition - no longer shaped like abuilding; damaged beyond practical repair orrenovation, structural damage including collapseof roof, walls, foundation; uninhabitable.
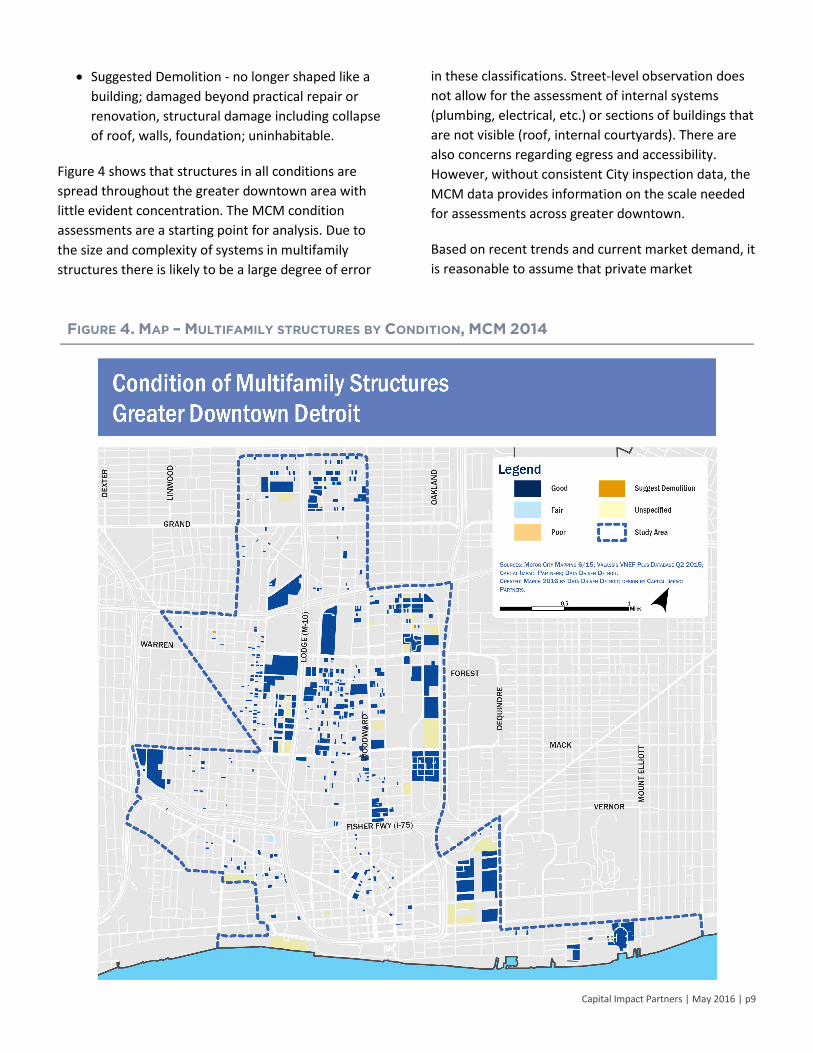
Figure 4 shows that structures in all conditions are spread throughout the greater downtown area with little evident concentration. The MCM condition assessments are a starting point for analysis. Due to the size and complexity of systems in multifamily structures there is likely to be a large degree of error
in these classifications. Street-level observation does not allow for the assessment of internal systems (plumbing, electrical, etc.) or sections of buildings that are not visible (roof, internal courtyards). There are also concerns regarding egress and accessibility. However, without consistent City inspection data, the MCM data provides information on the scale needed for assessments across greater downtown.
Based on recent trends and current market demand, it is reasonable to assume that private market
FIGURE 4. MAP – MULTIFAMILY STRUCTURES BY CONDITION, MCM 2014
properties classified as “good” will likely raise rents as conditions allow. However, buildings within the “fair” and “poor” categories will tend to require investment beyond the capacity of the private market. These structures are likely to house people unsafely or in substandard conditions. However, redevelopment of these buildings is necessary to continue to stabilize neighborhoods, address any unsafe living conditions for residents and to improve the built environment. In cases where these buildings are occupied, proactive relocation policies can create positive outcomes for residents, developers and neighbors.
Based on MCM condition surveys (Figure 5) there are 22 properties containing 294 households that would face relocation due to redevelopment in the greater downtown.
In addition to the 294 households living in “fair” and “poor” condition buildings there are nine households living in structures that are beyond redevelopment and possible candidates for demolition. While CDFIs are most likely to rehab and finance “fair” and “poor” multifamily structures, we believe the City and community partners should also look for ways to ensure that residents are not living in unsafe buildings requiring demolition. These buildings require inspection and, if found unsafe, residents should receive relocation assistance.
In total, there are 303 households in greater downtown that are possibly experiencing substandard housing conditions. While this represents only one percent of the households in the greater downtown, we believe the redevelopment of these properties is important to the quality-of-life needs for these
households. The residents should be aided in finding safe homes permanently or for the time required to rehabilitate their housing.
A key next step in assessing the displacement and relocation risks of these households is to resurvey the 24 buildings in the “fair,” “poor” and “suggest demo” categories. Additionally, the 54 structures that had unspecified occupation also have no condition data. This is 9.5 percent of the structures in the multifamily survey and 20 percent of the active addresses. With so many active addresses, it is necessary to identify these structures, verify whether they are residential structures and further assess their respective conditions.
HOUSING AFFORDABILITY & INCOME
DISTRIBUTION Income and housing costs are linked through the concept of housing affordability. The federal government’s definition of housing affordability states that housing costs for any household should not exceed 30 percent of household income; those paying more than the 30 percent threshold are operating under a housing burden.12 Thus a household with an income of $4,000 per month ($48,000 annually) is able to afford $1,200 a month for housing costs (0.3*$4,000 = $1,200). Using this measure, an estimated 45 percent of greater downtown renters experience a housing cost burden with black renters 1.4 times more likely to experience a burden than white renters (Figure 9).
Related but distinct, the federal government’s Department of Housing and Urban Development (HUD) bases many of its housing policies and aid determinations on regional factors. Housing aid eligibility is determined by recipient income as compared to a median income value (called “area median income” or “AMI”) that is calculated using household incomes from across a metropolitan area.
12 Affordable housing definition retrieved from HUD’s web page: http://portal.hud.gov/hudportal/HUD?src=/program_offices/comm_planning/affordablehousing
Additionally, HUD determines a “fair market value” for rental properties using regional income and property values. However, metropolitan-area-based AMI can be very different from local measures, as is the case in Detroit (Figure 6). The vast majority of residents in the greater downtown have lower incomes than regional residents. Therefore, the average greater downtown household becomes burdened by housing costs at significantly lower rental rates than the fair market value for rental properties.
The challenges of a regionally based AMI and disproportionately low-income households in the greater downtown suggest that using a different and more context-driven measure of household income could be a good way to customize affordable housing policies in Detroit.
Using the AMI and household size, the U.S. Department of Housing and Urban Development’s subsidy and loan programs have defined income limits for eligibility.15 Income levels are divided into three main categories (Figure 7): “low-income,” “very low-
13 HUD 2015 Fair Market Rate figures accessed from: http://www.communityhousingnetwork.org/activek/contentasp?catid=67&contentid=343&returnto=catid=67 14 The U.S. Department of Housing and Urban Development (HUD) estimates the median family income of an area each year and adjusts that amount for family size. This allows family incomes to be expressed as a percentage of the AMI. Information on this process can be accessed at: www.nccommerce.com/Portals/2/Documents/CommunityDevelopment/ARC/ARCHousing/Area%20Median%20Income.pdf 15 Annual HUD AMI figures can be accessed on HUD’s website: https://www.huduser.gov/portal/datasets/il.html
income” and “extremely low-income.” There is also a bracket for households earning at the median level; housing for this group is referred to as “workforce housing."
16 HUD Income Limit definitions can be accessed on HUD’s website at: http://portal.hud.gov/hudportal/HUD?src=/topics/rental_assistance/phprog
FIGURE 6. TABLE – MEASURES OF MEDIAN HOUSEHOLD INCOME BY GEOGRAPHY, 2009-2013,2015
Income Corresponding Housing Burden Limits
Greater downtown Detroit (ACS 2009-2013), Median household income, all households
$21,513/y $538/m
Detroit (ACS 2009-2013), Median household income, all households $26,325/y $658/m MSA- Wayne, Macomb, Oakland Counties (ACS 2009-2013) Median household income, all households
$51,844/y $1,296/m
HUD- Wayne, Macomb, Oakland, Lapeer, St. Clair Counties (2015 Fair Market Rate),13 Area Median Income (AMI),14 family of two
$54,188/y $1,355/m
FIGURE 7. TABLE – HUD INCOME LIMIT
DEFINITIONS16 AND 2015 LIMITS FOR A TWO-PERSON FAMILY
Income Bracket Definition (of AMI)
Income Range
Workforce 120%-81% $65,250-$43,351
Low-income 80%-51% $43,350-$27,101
Very low-income
50%-31% $27,100-$16,251
Extremely low-income
30% and less $16,250-$0
Figure 8 provides context for these income bands based on 2014 and 2015 compensation data. Workforce occupations often include public safety (police officers, firefighters), teaching and service industry managerial roles. The other low-income categories span various entry-level and training positions, part-time service industry positions and people on fixed incomes, including seniors living on social security or the disabled.
17 Unless otherwise noted incomes in this table reflect the U.S. Department of Labor’s May 2014 Detroit-Livonia-Dearborn Metropolitan Area Occupational Employment and Wage Estimates. Accessed on the Bureau of Labor and Statistics website: http://www.bls.gov/oes/current/oes_19804.htm 18 Detroit Police recruitment posting. Accessed (March 2016): http://www.detroitmi.gov/Portals/0/docs/Police/Jobs/DPDRecruit%20Pay%20Flier%20Rev10302014.pdf?ver=2015-02-12-152445-970 19 Detroit Public School employment listing. Accessed (March 2016): http://detroit.k12.mi.us/employment/ 20 Final day to apply for job as Detroit firefighter. (25 Oct 2013). CBS Detroit. Accessed (March 2016): http://detroit.cbslocal.com/2013/10/25/last-day-to-apply-for-job-as-detroit-firefighter/ 21 Social Security benefit payment information can be found on the Social Security Administration web page at: https://www.ssa.gov/news/press/factsheets/colafacts2015.html 22 Calculated based on a 40-hour week, and 50-week working year. Changes in Michigan minimum wage can be found on the Michigan Department of Licensing and Regulatory Affairs web page at: http://www.michigan.gov/lara/0,4601,7-154-11407_59886-370158--,00.html
Capital Impact Partners | May 2016 | p12
HOUSING BURDEN In order to assess the need for housing assistance, HUD has created the Comprehensive Housing Affordability Strategy (CHAS) dataset.23 Using data from the 2008-2012 ACS Five-year Survey (the most recent in CHAS) HUD calculates housing burden. Compiling the data to compare greater downtown to Detroit shows that households in greater downtown are less likely to experience a housing cost burden than households citywide. In addition to cost-burden calculations, the CHAS data inventories housing problems concerning kitchen and plumbing facilities and overcrowding. The data shows that households in the greater downtown are also less likely to experience these housing problems than households citywide.
Details concerning income levels, severity of housing burden and race in relation to housing burden are also available (Figure 9). These numbers reflect all owners and renters; they do not reflect the multifamily market exclusively as they include single-family homes, duplexes and other structures with less than four units. However, it does provide a broad picture of affordability options throughout the housing market.
23 The CHAS dataset can be accessed through HUD at: https://www.huduser.gov/portal/datasets/cp/CHAS/data_download_chas.html
FIGURE 8. TABLE – INCOME BRACKETS FOR EMPLOYMENT IN DETROIT17 Profession Income Range or
Mean Wage Affordable Monthly
Rent Income Bracket
Detroit Police Officer18 $32,000-$52,000 $800-$1,300 Workforce DPS Teacher (Elementary)19 $36,000-$43,000 $900-$1,075 Workforce Detroit Firefighter20 $32,000-$54,3000 $815-$1,360 Workforce Medical Technicians $38,940 $974 Low-income Restaurant Cook $22,580 $564 Very low-income Gaming Dealers $23,730 $593 Very low-income Retail Salesperson $25,160 $629 Very low-income Social Security (2015 Average Benefit)21 $21,360 $534 Very low-income MI Minimum wage position ($8.50/h)22 $17,000 $425 Very low-income
Capital Impact Partners | May 2016 | p13
These details show that households are more likely to rent in greater downtown than citywide and that of the greater downtown renters, 45 percent experienced a housing cost burden. Further, households are slightly more likely to experience a severe cost burden (26 percent have housing costs more than 50 percent of their monthly income versus 20 percent who pay between 30 percent and 50 percent of their monthly income). The number of households experiencing at least one housing problem is above 50 percent in both the city (62 percent) and greater downtown (51 percent). Black renters are more likely to suffer that burden than white renters within those that experience any housing cost burden in the greater downtown area. However, black and white renter households had a similar likelihood of experiencing a severe housing cost burden.
This data implies that, even with the available naturally affordable and subsidized units in greater downtown, there is need to preserve and increase the number of affordable units. Furthermore, even small increases in average rents will affect black renter households more severely given that they already experience much higher levels of housing cost burdens.
NATURAL AFFORDABILITY In areas with weaker housing markets, many units are “naturally affordable”—meaning priced at a level that falls beneath the 30 percent affordability threshold for any given household without any price controls or subsidies. These are market-rate units that happen to command a rent that falls within affordability thresholds. In greater downtown, naturally affordable housing costs less than $538/m for the average household (see Figures 6 and 8 for additional context around this threshold).24 There are two dangers within the naturally affordable market. First, as increased demand leads to higher rental rates, there are no legal limits on increases and the stock of naturally affordable housing will decrease. Second, some properties are naturally affordable at least partially because they are poorly managed, in poor condition and / or are not kept up to code. In these properties, owners provide poor-quality affordable housing options while simultaneously extracting rent from tenants and the surrounding neighborhood. A development strategy that seeks to
24 Based on the greater downtown median household income (all households) as shown in Figure 6. The average greater downtown household has 1.7 members.
FIGURE 9. TABLE – HOUSING COST BURDEN, CHAS BASED ON ACS 2008-2012 FIVE-YEAR
ESTIMATES
Greater Downtown Detroit Occupied housing units 19,305 258,875
Aggregate renter occupied with at least one housing problem count (%) 8,415 (51%) 75,619 (62%)
Capital Impact Partners | May 2016 | p14
increase density and diversify income mix should seek to preserve a well maintained, if perhaps older, naturally affordable housing stock while sorting out unsafe and poorly maintained properties for rehabilitation.
SUBSIDIZED AND PRICE-CONTROLLED AFFORDABILITY In contrast to naturally affordable housing, subsidized or price-controlled housing limits rent based on income levels (these levels are defined in Figure 7). For most subsidized housing in the Detroit area rental rates are determined based on federal programs administered by the State of Michigan statewide or City of Detroit. These programs include Low-Income Housing Tax Credit developments, Housing Choice Voucher participants, Section 8 Project-Based Rental Assistance (PBRA) properties, HOME Funds properties and Section 202 properties among other programs. Programs may implement different affordability thresholds and target specific populations (e.g., Section 202 funds are meant for senior housing while Section 811 funds target persons with disabilities).
Within the greater downtown, Wayne State University (WSU) on-campus student housing is also price controlled. WSU students are a sizeable population in the Midtown area; however, for the 3,139 students living in campus housing, costs are determined by the university in a process tied to the needs of students and university finances.25 In this way, these are price-controlled units, even though their controls may not be tied to area median income.
AFFORDABILITY BY TENURE Multifamily housing can refer to rental or homeownership models. When discussing displacement stemming from rental to condominium conversion, we are generally talking about a change in tenure. As rental housing can be market rate or price controlled, there are also a variety of ownership models including condominium and cooperative ownership. For simplicity, we categorize tenure by
25 May 2014 WSU Campus Transportation Survey.
rental or individually owned units. There are grey areas within these definitions when they are applied to multifamily properties. For example, the Park Shelton is a condominium property with individual unit ownership. However, it contains a number of units that are offered for rent by either the property management company or unit owners.
A mixed-income, mixed-use community will generally have a variety of rental and ownership models allowing for choice and flexibility in meeting needs of diverse households. However, in greater downtown Detroit, data for matching housing condition and tenure (rented or owned) is not available because City departments do not use tenure as a determining factor for permitting and code enforcement. Within City code there are special regulations for rental properties, including registration (these regulations are outlined in the “Regulatory Framework” section), but this information is not consistently collected. The best data available is from the US Census–represented in this study by its CHAS data set. It shows that from 2008-2012 residents in the greater downtown were more likely to be renters (86 percent renters) than citywide (47 percent renters), suggesting a potential need to diversify housing tenure in the greater downtown.
HOUSING AFFORDABILITY: TRENDS The available housing cost burden data (Figure 9) gives an average idea of the cost of housing in relation to resident income levels in greater downtown. To best understand the effects of investment on risk of displacement, it would be necessary to have longitudinal data reflecting changes in housing costs over time. Additionally, given the area’s inconsistent building conditions—from substandard to luxury housing—rental rate data often becomes an indicator of building condition.
Capital Impact Partners | May 2016 | p15
The only available rental data for the study was Midtown Detroit, Inc.’s (MDI’s) Rental Surveys from 2011, 2012, 2013 and 2014, which include occupancy and price for properties participating in the LiveMidtown program.26 Projects included in MDI’s development pipeline 2010 were identified in order to compare their rent levels to the existing multifamily
26 Information on the LiveMidtown program can be found on the program’s web page: http://www.livemidtown.org/
stock. These rental calculations are a starting point for assessing housing cost trends, but the use of the data is limited—the properties are not representative of greater downtown nor are they a random selection of addresses within Midtown (Figure 10 shows the location of the LiveMidtown properties). Also, because there is no count of units offered at each price, the
averages provided reflect rental asking prices rather than average rental rates.27
Using the data collected, it is possible to track rental asking prices in the Midtown area within properties that are categorized as “good condition” in the
27 Rental asking prices vs. rental rates. Without a unit count it is impossible to calculate the average rent for units within the market. As seen in the table there can be large differences between an average of asking price and an average of the rental rates for all units on the market. However, trends in asking prices will reflect trends in rental rates—as asking prices increase or decrease rental rates should also increase or decrease.
1 BR Rent
2BR Rent
1BR Units 2BR Units
A Property
$500 $800 25 units @ $500
($12,500)
2 units @ $800
($1,600) B Property
$750 $1,100 5 units @ $750
($3,750)
20 units @ $1,100
($22,000) Average $625 $950 $542
($16,250/30 total units)
$1,073 ($23,600/22
total units) Asking Price Rental rates based on number of
units in market
multifamily inventory (note: all the properties in the MDI rental comps are categorized as “good condition” properties in MCM). Figure 11 provides the average and median rental prices for studio, one-bedroom and two-bedroom units in multifamily properties. These properties include both market-rate and price-controlled units.
In all cases, the median asking price is lower than the mean asking price, suggesting that there are a small number of higher priced units on the market but that the majority of units fall below the average price. In 2013, the last year for the ACS income data, the median studio apartment was below the affordability threshold for the average greater downtown resident, and the median one-bedroom unit exceeded it by 15 percent. This indicates that, due to the rising rental price trends, Midtown has some affordable options but could soon have very few unsubsidized options for existing households.
If we limit the data to only market-rate projects (no federal subsidies or WSU price control) and those with four years of data in the MDI rental surveys, there are 57 properties. This group shows higher rental prices
than the entire LiveMidtown sample, but it still has some affordable housing options (Figure 12). Interestingly, two-bedroom, market-rate units are more likely to have lower rent prices than those in subsidized properties. This is expected, since there are a large number of two-bedroom units in subsidized properties, which lowers demand for two-bedroom units across the area and keeps those prices closer to affordability thresholds.
The most critical set of rental prices that help evaluate potential displacement risks limits the sample to the 24 properties that have been rehabilitated since 2010 (Figure 13). This data shows that new or redeveloped units brought on the market since 2011 in Midtown are more expensive than existing units of the same size. In most cases these new units are in the top quartile of prices, meaning that more than 75 percent of the existing market has lower prices. None of these units is priced in a range that is affordable for the average greater downtown household. For example, in 2013 an individual renting a one-bedroom apartment in this group needed an income of $35,560 (while this is 65 percent of the regional AMI, it is 65 percent higher than the median household income in the greater downtown) in order not to be burdened by housing costs.
However, these rehab rents need to be placed in context in order for us to understand the implications for displacement. First, these rents are considered affordable by federal programs that use MSA-based median incomes (Figure 2) and those targeting workforce housing rather than low- and very low-income housing (Figure 4). Second, these units have intentionally been developed to attract workers who have traditionally lived in neighborhoods outside of the city and commuted into greater downtown employment centers. By broadening the type and availability of housing options these properties are encouraging both mixed-income and higher density development.
It is also necessary to consider whether or not new developments are increasing the number of total units available on the market or if they are replacing naturally affordable units. This question is difficult to
quantify based on the data available. In the cases of 711 W. Alexandrine and 663 Prentis (redevelopment cases are profiled in the following section), the rehabilitated units displaced low-cost units. However, 680 Delaware will be replacing four occupied naturally affordable units with 12 price-controlled units and an additional 24 market-rate units. These determinations are further complicated when you consider building condition. For example, 711 W. Alexandrine did remove 22 naturally affordable units from the market and replace them with 36 higher priced units, but, based on the condition of the building, the 22 occupied units were not safe for residents.
Lastly, the MDI reports provide a vacancy calculation for the set of properties in the study. The numbers show that there is a very low level of vacancy in the Midtown market.28 This is not surprising. There has been little-to-no growth in the Detroit housing market until recently, and this high-occupancy rate suggests that the current nationwide and local demand for urban living has outstripped the supply of quality multifamily units in the greater downtown. At current levels, these vacancy rates show that rehabilitation of any building, whether it is in the naturally affordable range or at higher market rents, will pose displacement risks and challenges for current residents. These conditions have created a hyper-localized vacancy rate, which, when accounting for only a selective sample in Midtown, rivals occupancy rates in San Francisco and Boston. With these conditions, any additional units in the market help alleviate upward pressures on rent from unmet demand.
The MDI rental price and vacancy data shows a market that has naturally affordable options but is in the early stages of rent increases that could price current residents out of their homes. The trend in new buildings priced in the top quartile and the very tight
28 The Midtown market as tracked through the LiveMidtown data.
vacancy rates are indicators that market-based displacement could become a much larger problem. Although the study sample of properties is too small to make broader assumptions about the greater downtown area, this analysis points to the need for more comprehensive assessments of all of the greater downtown’s multifamily properties and their respective building conditions in order to create a more complete picture.
PUBLICALLY SUBSIDIZED HOUSING The last segment of the greater downtown multifamily housing stock is subsidized—either through property-based subsidies or through voucher programs attached to renters. Preservation of affordable housing has become a priority nationally and in Detroit. Every year, several properties with long-term U.S. Department of Housing and Urban Development (HUD) contracts under various federal housing programs reach the end of those contracts without guarantees that they will continue to operate serving low-income and very low-income residents.29 While most of these properties do renew their HUD contracts, occasionally they do not, as in the recent case of The Albert building at 1214 Griswold in downtown Detroit.
At the national level, as housing advocates and research organizations work with the federal government on how best to implement the new National Housing Trust Fund, debate has focused on preservation and recapitalization, prompting
29 Jordan and Poethig, Urban Wire blog.
FIGURE 14. TABLE – CASE STUDY RENTS, PRE- AND POST-DEVELOPMENT Year Studio (Income Req.) One Bedroom
organizations like LISC to take on affordable housing preservation as a national priority. In Detroit, The Albert garnered attention because it terminated Project-Based Rental Assistance (PBRA) contracts, which in turn forced the relocation of more than 100 seniors. Also, Low-Income Housing Tax Credit (LIHTC) properties in Detroit face unique issues due to low rental rates and instability in the city’s housing market. These Detroit cases run contrary to national trends, amplifying the importance for the Detroit community to craft an affordable housing preservation strategy that takes into account local conditions.
RENT AID AND VOUCHERS The primary rent voucher program funded by the federal government is the Housing Choice Voucher (HCV) program, formerly known as Section 8 vouchers. These vouchers provide rental gap assistance for households, filling the gap between 30 percent of a household’s income and the rent paid at a property. These vouchers are administered locally; in Detroit the
30 Active projects are those operating under a current contract or program timeframe. There is at least one property in Detroit that is currently operating on an extension agreement with HUD while a renewed contract is being processed. The database does not include this type of information and it is up to local outreach to track these developments.
Detroit Housing Commission (DHC) is responsible. Nationally, the demand for vouchers far outstrips the supply, and advocacy organizations are working to increase their availability.31 In Detroit, the demand is very high, and DHC distributes any available vouchers through a lottery process that selects applicants from a waitlist. 32 DHC cautions that “long wait times are common,”33 and that it is likely to take “a few years”34 to serve all those on the current waitlist. The difficulty of entering into the HCV program makes it unreliable as an option for resident relocation during redevelopment. However, CDFIs should work with landlords and property managers in rehabilitated properties to accept and accommodate households with Housing Choice Vouchers.
HCV households find their own housing with landlords that accept vouchers. These landlords need to pass inspection with DHC and are entered into the program. Currently it is difficult to track the properties that are being rented with HCV assistance; DHC inspects these properties but does not have a publically accessible database.
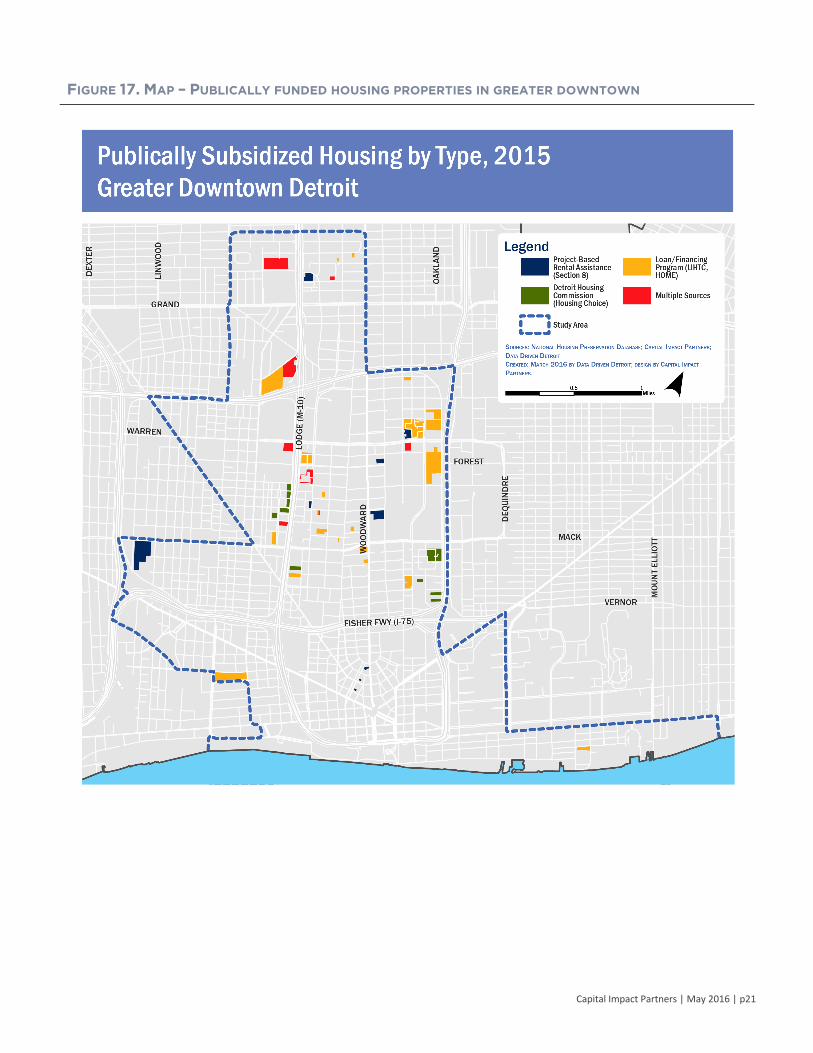
SUBSIDIZED HOUSING STOCK The National Housing Preservation Database provides data on housing properties funded through federal programs. The database allows categorization by federal program and downloads of property summary information. Through a web portal, it is also possible to view detailed information on properties, including past inspection scores. Figure 16 is a summary of all the active publically funded housing properties in
31 For national advocacy goals see the National Low Income Housing Coalition at: http://nlihc.org/issues/vouchers; and the National Council of State Housing Authorities at: https://www.ncsha.org/advocacy-issues/housing-choice-vouchers 32 According to DHC 2015 Housing Choice Voucher FAQ there were 40,000 applicants for 7,000 waitlist spots. It is from the waitlist that applicants receive Housing Choice Vouchers, although being on the waitlist does not guarantee aid. For information on the DHC Housing Choice Voucher process see: thttp://www.dhcmi.org/uploads/page/Voucher_Waiting_List_FAQ.pdf 33 DHC Housing Choice Voucher FAQ. accessed at: http://www.dhcmi.org/PageInd.aspx?page_id=2 34 DHC Housing Choice Voucher FAQ. accessed at: http://www.dhcmi.org/PageInd.aspx?page_id=2
FIGURE 16. TABLE – PUBLICALLY FUNDED
HOUSING PROPERTIES AND UNITS, ACTIVE JAN
201630 Greater
Downtown Detroit % in
Greater Downtown
Properties 62 366 17% Units 7,179 24,018 30%
Number with contract or program termination 2016-2020
Prop. Expiring % of total
21 34%
133 36%
16%
Units Expiring % of total
2,640 37%
8,434 35%
31%
Detroit and greater downtown, and Figure 17 shows their distribution and size in the area. These properties do not include local or state tax abatements or federal historic or brownfield tax credit programs.
Greater downtown Detroit contains 17 percent of subsidized properties—but 30 percent of the units—in the city. This relationship between the number of properties and units indicates that there is a concentration of low- and very low-income households in the greater downtown—a situation that can increase the concentrations of poverty but also provide low-income households with access to Detroit’s largest employment corridor. Figure 17 illustrates their location within the greater downtown.
Taking the total number of multifamily active addresses in greater downtown as a proxy for households (Figure 7) at 22,061, and assuming that affordable housing properties have very low vacancy in greater downtown, the 7,179 units of subsidized housing make up 33 percent of the occupied multifamily units in the area. This number does not include any Housing Choice Voucher users or those accessing housing subsidies through their employers. With this amount of support in the housing market in greater downtown it is understandable why there is a slightly lower housing cost burden in the area compared to the rest of the city.
The data shows that 37 percent of publically subsidized properties in the greater downtown (35 percent citywide) have contracts or program agreements expiring within the next five years. This number seems alarming, and numbers like it have attracted the attention of housing preservation efforts. However, historical trends and the overlapping of subsidy programs moderate this percentage, and Department of Housing and Urban Development (HUD) studies show that most properties (92 to 93 percent) renew contracts.35 These same studies show that housing conditions and the
35 Evidence Matters: Transforming Knowledge Into Housing and Community Development Policy, p.10.
Capital Impact Partners | May 2016 | p20
need for capital investment are larger threats to preserving subsidized properties than owners converting properties to market-rate rentals or condominiums. In Michigan, four properties terminated contracts in 2014: three small properties that lacked the funds for capital improvements and 1214 Griswold, which opted out due to improved market conditions. These four properties constitute less than one percent of the subsidized properties contracted by HUD across all of Michigan, which aligns with national trends.
The infrequent termination of contracts does not negate the effect of lost subsidies on a local community or the challenges for residents affected. However, it does indicate that local outreach and assessment is one of the best tools for preservation. Advocacy organizations and nonprofits can build relationships with property owners to best prepare for the rare occasions when maintenance or market forces make contract termination an option.
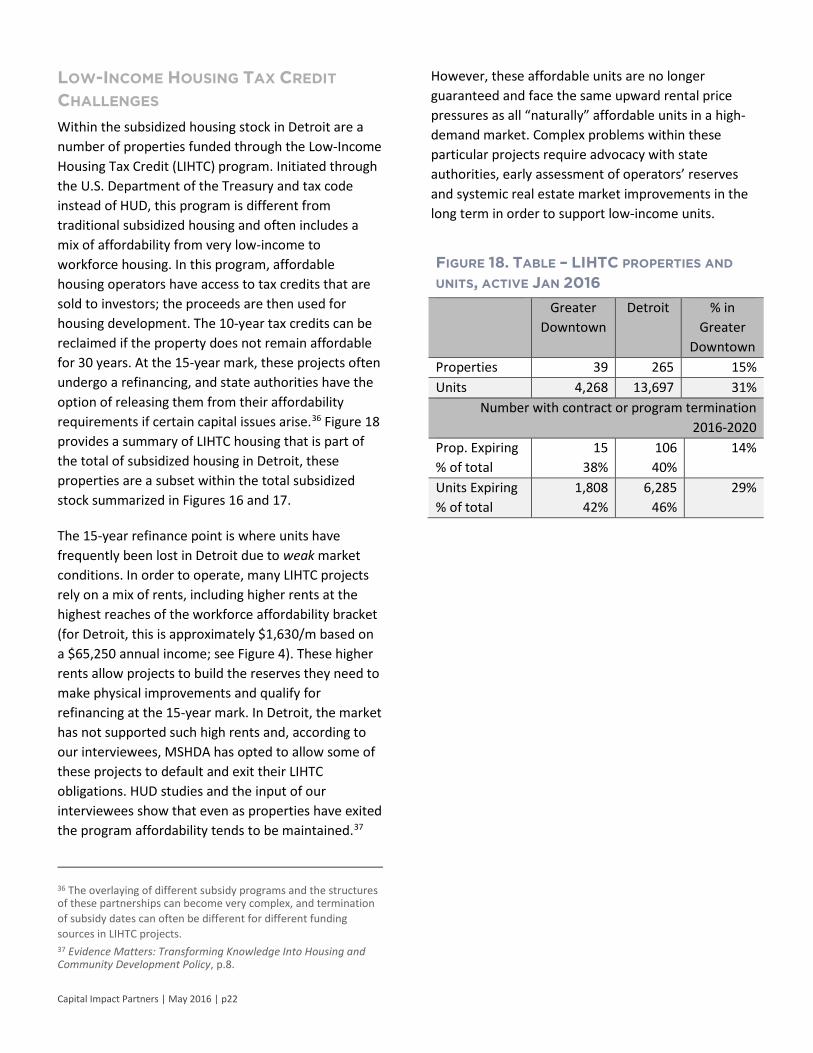
LOW-INCOME HOUSING TAX CREDIT CHALLENGES Within the subsidized housing stock in Detroit are a number of properties funded through the Low-Income Housing Tax Credit (LIHTC) program. Initiated through the U.S. Department of the Treasury and tax code instead of HUD, this program is different from traditional subsidized housing and often includes a mix of affordability from very low-income to workforce housing. In this program, affordable housing operators have access to tax credits that are sold to investors; the proceeds are then used for housing development. The 10-year tax credits can be reclaimed if the property does not remain affordable for 30 years. At the 15-year mark, these projects often undergo a refinancing, and state authorities have the option of releasing them from their affordability requirements if certain capital issues arise.36 Figure 18 provides a summary of LIHTC housing that is part of the total of subsidized housing in Detroit, these properties are a subset within the total subsidized stock summarized in Figures 16 and 17.
The 15-year refinance point is where units have frequently been lost in Detroit due to weak market conditions. In order to operate, many LIHTC projects rely on a mix of rents, including higher rents at the highest reaches of the workforce affordability bracket (for Detroit, this is approximately $1,630/m based on a $65,250 annual income; see Figure 4). These higher rents allow projects to build the reserves they need to make physical improvements and qualify for refinancing at the 15-year mark. In Detroit, the market has not supported such high rents and, according to our interviewees, MSHDA has opted to allow some of these projects to default and exit their LIHTC obligations. HUD studies and the input of our interviewees show that even as properties have exited the program affordability tends to be maintained.37
36 The overlaying of different subsidy programs and the structures of these partnerships can become very complex, and termination of subsidy dates can often be different for different funding sources in LIHTC projects. 37 Evidence Matters: Transforming Knowledge Into Housing and Community Development Policy, p.8.
Capital Impact Partners | May 2016 | p22
However, these affordable units are no longer guaranteed and face the same upward rental price pressures as all “naturally” affordable units in a high-demand market. Complex problems within these particular projects require advocacy with state authorities, early assessment of operators’ reserves and systemic real estate market improvements in the long term in order to support low-income units.
FIGURE 18. TABLE – LIHTC PROPERTIES AND
UNITS, ACTIVE JAN 2016 Greater
Downtown Detroit % in
Greater Downtown
Properties 39 265 15% Units 4,268 13,697 31%
Number with contract or program termination 2016-2020
Prop. Expiring % of total
15 38%
106 40%
14%
Units Expiring % of total
1,808 42%
6,285 46%
29%
Capital Impact Partners | May 2016 | p23
CASE STUDIES The following case studies provide examples of multifamily redevelopment in greater downtown Detroit in recent years. The 2014-2016 redevelopment of 711 W. Alexandrine, The Rainer, contains the most detail. All other projects are described in brief and illustrate specific examples of resident relocation due to redevelopment of multifamily properties.38
711 W. ALEXANDRINE PK Development, a Michigan-based affordable housing and management company, sought to redevelop 711 W. Alexandrine in 2013. Prior to 2013, PK Development was not involved in Detroit’s real estate market. However, with new, locally experienced personnel and improved conditions for development, the company decided to expand into the Detroit market. PK Development approached Midtown Detroit, Inc. (MDI) in 2013 to explore local investments, looking for both development and property management opportunities. MDI suggested 711 W. Alexandrine for redevelopment for a number of reasons: the building was deteriorating—a number of interviewees described it as “a few years from vacancy and blight,” “commonly known to be in bad shape” and “known to be a problem building by the City and neighborhood.” Furthermore, MDI had been focusing on redevelopment alongside Alexandrine to encourage investment west of Woodward Avenue. MDI recommended that 711 W. Alexandrine be developed as a market-rate rental in order to encourage economic diversity in the neighborhood and demonstrate that market stabilization had reached beyond the immediate Woodward Avenue area. MDI also brought Capital Impact Partners (CIP) and Invest Detroit to the project to access CIP’s Detroit Neighborhood funds.
38 Note: we did not interview anyone who relocated or locate any data sources that provided tracking information on previous residents of any of these buildings. We do have some commentary from property managers and community members who had contact with residents, but no direct reviews. For future studies, and any relocation processes, maintaining contact with residents for some time after a move will help better evaluate those processes.
For both PK Development and CIP, this project marked a different type of investment. For PK Development, the building was not only their first Detroit investment but also a rare entry into market-rate rentals. For CIP, it marked the first time they financed and invested in a building that was partially occupied. The building’s condition convinced both actors that redevelopment was worthwhile. All parties agreed that relocation of existing residents as part of redevelopment could help these households find safer housing and that the building itself was worth preserving.
The building was erected in 1921 as The Rainer at the intersection of W. Alexandrine Street and 3rd Avenue. When constructed, it had 56 units ranging from 250-500 square feet (sf), and, based on early photos, there were retail / commercial spaces at street level along 3rd Avenue. By 2013, the building was 40 percent occupied. There were 22 households with unwritten month-to-month leases and rents ranging between $400 and $500 and, according to interviewees, at least two households that had ceased paying any rent. During the 2014 MCM building survey the building rated in “good” condition; however, there were extensive issues that would not have been evident during a curbside street survey. At that time there were units with egress and accessibility issues, water service in some units was problematic, and there was deferred maintenance throughout the building, including roof damage.39 When PK Development sought insurance for the building, their insurance company found a completely outdated electrical system and required that the building’s entire electrical system be updated and brought into code compliance. Further, once construction began and walls and ceilings were opened, the water damage from the roof proved more extensive and structural than previously thought. Also, there was other non-roof-related structural damage on other floors.
Prior to understanding the full extent of the building’s condition, MDI, PK Development and CIP anticipated resident relocation due to the extent of construction
39 These issues were evident in City inspection reports. However, upon purchase it became evident that there were multiple issues making redevelopment necessary.
and the projected market-rate rents. As an affordable housing developer and manager, PK Development—as part of standard operating—considered the needs of the residents, and CIP was prepared to include financing for relocation in the development package. During interviews, both of these partners discussed relocation aid as part of the responsible development of the property and not as an added cost. PK Development’s original plan had been to provide residents with six-months’ notice and relocation support before requiring them to vacate the building. However, when the extent of damage and insurance requirements were known the notice period was adjusted to 90 days with a waiver of rent for all tenants during that time. CIP included $2,500 relocation aid per household in the financing package.
The relocation of residents fell primarily to PK Development and its site manager; MDI supported the effort by providing the names and contact information for the neighborhood’s affordable and low-income housing properties. All parties we spoke with credited the success of relocation to PK Development’s site manager. This person had worked in this position under the previous owner, had developed relationships with the residents of the building and had a good working knowledge of the neighborhood. PK Development retained the site manager in this position partly because these relationships would be crucial to the successful relocation of residents. This person was able to have honest conversations with residents about the relocation timeline, their needs and circumstances in finding new homes and to broker negotiations with new landlords. Over the course of the 90-days’ notice period, 13 households sought additional support in finding new homes from the site manager and were provided with aid for moving costs and security deposits on new apartments. On average PK Development estimates that they spent $1,100-$1,300 on each of the 13 households, not including the time spent by the site manager and development team. All 13 households found housing, although the development team did lose contact with one resident before he moved.
For this study, we were not able to make contact with any of the 22 residents of 711 W. Alexandrine, and PK
Capital Impact Partners | May 2016 | p24
Development did not follow up with the 13 aid-seeking households after they relocated. Yet, interviewees addressed this relocation process in other ways. Representatives from the Cass Corridor Neighborhood Development Corporation (CCNDC) felt that residents were being treated fairly, although there were concerns for at least one resident of the building. At the same time the property management side of CCNDC was concerned that their waitlist meant that they were unable to offer housing to some of the residents within the 90-days’ time frame. They were also concerned that credit and background requirements made it difficult for some 711 W. Alexandrine residents to qualify for CCNDC housing.
PK Development expressed the following concerns with the relocations process, including
• Time frame for finding housing in theneighborhood: PK Development believes thatonly two or three 711 W. Alexandrinehouseholds left the greater downtown area—yetbased on their experience assisting all 13households, there is concern that the availablehousing is disappearing.
• Credit and background requirements oflandlords make it difficult to place residentsfrom a building like 711 W. Alexandrine.Residents at 711 were not required to payutilities; in turn, some lacked the credit record tofind a new home. Additionally, leases wereunwritten leaving residents without documentedrental payment histories.
• Quality of buildings to which residentsrelocated: As PK Development investigatedproperties for their own investment and forrelocation purposes, they were concerned aboutthe lack of quality housing choices available.
• Lack of follow up with residents: While PKDevelopment did not consider it part of theirrelocation aid responsibilities, they did voiceconcern about the long-term housing situationsof the relocated residents.
Capital Impact Partners | May 2016 | p25
The redevelopment of 711 W. Alexandrine also factors into the larger displacement and housing preservation debate beyond establishing appropriate and responsible relocation policies. After redevelopment, the building will contain 36 one- and two-bedroom units. Based on the rental rates for the redeveloped building (Figure 19), the investment at 711 could be seen as a loss of naturally affordable housing units. However, it is not so clear-cut. Is this a loss of 22 affordable units (the number occupied), or a loss of 56 units (the total in the building)? Given the poor quality living standards and conditions of the building, is it prudent to include the entire building as part of the area’s housing stock? In this case, the loss of the affordable units occurred at some point when the deterioration of the building made it noncompliant with code—a point that a more rigorous municipal inspection regime would likely identify.
680 DELAWARE A private owner donated the property at 680 Delaware to Central Detroit Christian Community Development Corporation (CDCCDC) after it suffered a fire but contained four households in its 30 units. Because of its mission, the general quality of the undamaged units and the historic character of the building, CDCCDC sought financing for redevelopment. While working through pre-development, CDCCDC decided that operating the partially occupied building over the 2014-2015 winter season was not efficient and they relocated residents in the summer of 2014. Two households moved into nearby buildings operated by CDCCDC, while two others found different living situations.
CDCCDC and its funders finalized a redevelopment package in the summer of 2015, and after rehabilitation the building will be mixed income: 30 percent subsidized and 70 percent market rate units. At capacity, this will provide approximately 12 subsidized units and 24 unsubsidized units. Like the 711 W. Alexandrine case, this redevelopment exemplifies one of the complications with assessing existing housing stock in the area: with fire damage should any of the 30 units (occupied or unoccupied) count as existing affordable housing stock? After redevelopment, the completed building will provide 26 new habitable units for the neighborhood, including eight new affordable units. At least one of the relocated households living in CDCCDC housing has expressed an interest in returning to 680 Delaware.
15 E. KIRBY The conversion of units in the Park Shelton, or 15 E. Kirby, from rental units to condominiums is an example of market change from a decade ago, but it is the only rental-to-condominium conversion example our interviewees provided. Erected in 1926 as The Wardell, the building was placed on the National Register of Historic Places in 2007. The building began as a high-end residential hotel in the city’s cultural center, transitioning to a standard hotel and eventually converting to mid- to high-end apartments in the 1970s. In 2004, the building was sold, restored and converted into 230 condominiums. However, with the 2008 housing market crash, which affected the condo market in particular, a number of units were retained as rental properties by the investors, and the building operated with a mix of individual owners and renters. In the past year, vacated rental units have been offered for sale as condominiums. As of 2016, 12 years after the initial conversion, the last of these rental units is still being converted for sale. In the meantime, some individual owners continue to offer their condominiums for rent.
FIGURE 19. TABLE – 711 W. ALEXANDRINE:POST-REDEVELOPMENT RENTS
Unit Size Minimum Rent (Affordable
Income)
Maximum Rent (Affordable
Income) One bedroom $800
($32,000) $1,150
($46,000) Two bedroom $1,250
($50,000) $1,350
($52,000)
Throughout its life as The Wardell and then the Park Shelton, 15 E. Kirby commanded above-average rents and prices in the Detroit market and served as an anchor in Midtown. Its conversion to condominiums, and the displacement of renters this caused is a source of debate about whether or not those who can afford above-market rents require the same considerations as those living at lower income levels. There are different answers depending on one’s criteria for evaluation. The legal protections for renters in properties being converted to condominiums are much higher than those for renters in buildings that are being rehabilitated but maintain rental status (see discussion of legal protections in the next section “Regulatory Framework”). These protections provide seniors and households with financial means options for remaining in place. For community members anxious about maintaining housing choice within greater downtown, a conversion like that at the Park Shelton causes minimal concern. Rental residents were already of an income level that provided them an array of choices, even if they had little choice in leaving the Park Shelton, and condominiums provide greater choice within the market as a whole. However, from the standpoint of maintaining neighborhood income diversity and density, there may be cause to provide incentives for these residents to remain in the area.
663 PRENTIS The renovation of 663 Prentis, or Villa Lante, is an example of market-based displacement beginning to take place in the greater downtown. In the fall of 2015, a number of residents of 663 Prentis came to Cass Corridor Neighborhood Development Corporation (CCNDC) looking for housing after receiving a 30-days’ notice of lease termination. Unfortunately, the waitlist for housing with CCNDC was longer than 30 days. While 663 Prentis residents were added to that list, it is not clear when or where they found housing. At the time of this study, the redevelopment was still proceeding at 663 Prentis.
663 Prentis has been part of the Midtown Detroit, Inc. rental comp survey since 2011; it is in good condition and consistently shows full occupancy. The building
Capital Impact Partners | May 2016 | p26
contains 28 studio and one-bedroom units. In October 2014, a private investor purchased the property with financing through a regional bank. The owners applied for one permit with the City’s Building Safety, Environmental and Engineering Department (BSEED): a plumbing permit in October 2015. In current listings, the property is described as the “Newly Renovated Luxury Villa Lante Apartments.”40 The projected asking rents show a substantial increase from previous prices and exceed the housing cost burden threshold for the greater downtown’s median household income. However, the new prices still fall within workforce affordability criteria for the metropolitan area (Figure 20).
The purchase, renovation and relisting of the Villa Lante exemplifies Midtown’s stabilizing real estate market alongside the shifting supply of naturally affordable housing—particularly as defined by affordability levels based on greater downtown Detroit’s median household income.
40 The LiveMidtown listing for 664 Prentis can be accessed at: http://www.livemidtown.org/places/location/midtown-north-cass/villa-lante
1214 GRISWOLD The Griswold Building, now The Albert, is perhaps the best-known recent example of displacement in the Detroit market. The notoriety of the case stems from a mixture of compassion for the seniors being displaced, the relatively large number of people involved, the stark contrast between the senior residents and the targeted future residents and their respective incomes as well as the tragic passing of one senior soon after the moving date. All interviewees named The Albert as an example of displacement and relocation from multifamily housing due to redevelopment. However, few parties know the full details of the relocation process and are unable to judge its success. This outline is based on a series of Detroit Free Press articles41 and conversations with federal Housing and Urban Development (HUD) and Detroit Housing Commission (DHC) employees. The Senior Housing Preservation-Detroit Coalition (SHP-Detroit) is currently undertaking an in-depth case study of the relocation.
The Griswold Building was a Section 8 Project-Based Rental Assistance (PBRA) property, housing more than 100 seniors in downtown Detroit. The building was erected in 1929 as an office building, eventually converted into apartments, placed on the National Register of Historic Buildings in 1980 and managed under contract with HUD through the end of March 2014. Per federal law, in March 2013, all residents were given notice that in one year their property-based housing vouchers would expire, and they would be required to move if they could not afford the new unsubsidized lease terms.
During the course of the year, Broder & Sachse Real Estate Services, the developer, contracted the United Community Housing Coalition (UCHC) and the Neighborhood Services Organization (NSO) to oversee and facilitate the move for senior residents. At that time, Broder & Sachse was in negotiations with HUD and MSHDA in an effort to provide vouchers for 10-20 units in the newly renovated building, and they communicated to residents that it was possible some
41 Muller, D. (2014).
could stay. Eventually, it became clear that HUD’s fair-market rent thresholds limited the use of new vouchers, and all residents faced relocation. According to UCHC, the seniors were placed in more than 40 properties throughout Detroit. They were provided with assistance in finding a home, packing and moving costs, security deposits, identification and background checks and were aided in clearing utility bills.
Relocation of the seniors at The Griswold marked a shift from using housing contracts to preserve buildings to cancelling contracts to take advantage of improved real estate conditions. For actors in the Detroit affordable and senior housing community and the real estate development community the event seems to have become a learning process. The regional Housing and Urban Development (HUD) office, Broder & Sachse and UCHC generally agree that the relocation process was successful in that all residents found homes—but there were a number of issues along the way. The inability to retain some residents through vouchers created communication problems and confusion among residents, and beginning construction before the final March 2014 move-out date led to emotional, health and safety complications for some residents.42 Overall, UCHC and other concerned parties were motivated to create the SHP-Detroit Coalition to understand the effects of relocating seniors to formulate a better relocation process and to plan for the preservation of other subsidized senior housing communities.
In the past, Detroit’s weak real estate market made affordability subsidies necessary for preserving historic buildings like 1214 Griswold, but the market has shifted and demands new approaches. For a building the size of 1214 Griswold, its historic status substantially increases the cost of renovations. When asked, the Detroit Housing Commission was not able to acquire and manage the property (step in) due to the short time frame for planning and unknown capital costs. In comparison to Midtown rental prices the rents in the rehabilitated building are high (Figure
42 Pery, et.al. p. 5
21).43 The fact that such relatively high rents are possible in Detroit indicates stabilization of the real estate market, and continued growth should allow for policies that leverage market investment to fund affordable housing preservation through possible public trust funds, targeted development fees or other financial tools.
43 The Albert’s rents would place it in the top quartile of rental prices in Midtown. Current data is needed to compare rental prices between the neighborhoods that make up greater downtown.
SUMMARY OF RISK Based on comments from our interviewees and the data available it is possible to estimate the risk of displacement and the need for relocation in Detroit’s multifamily market. A risk summary is laid out in Figure 17. With so few examples of project-level displacement in the greater downtown area this assessment is general. Within our case studies, 711 W. Alexandrine and 663 Prentis transitioned from naturally affordable to market average or above, 680 Delaware is planned to go from naturally affordable to subsidized affordable, 1214 Griswold went from subsidized affordable rental to market-rate rental, and
15 E. Kirby went from rental to condominium. The column headed “Happening in Detroit?” was determined based on the examples provided by our interviewees since it has been difficult to trace changes in property affordability and tenure type across greater downtown through data sources. CDFIs and other community investment partners have different roles to play within each risk area.
44 There are many properties that have renewed their housing contracts or are in the process of renewing. We did not profile any
As seen in the cases in the prior section, the transition of any property, naturally affordable or priced controlled, to market average or above can result in resident displacement. The risk of displacement when affordable housing is maintained after redevelopment is low; however, if there are substantial renovation or changes in ownership, there may be a need for temporary relocation policies. Also, the transition of naturally affordable to subsidized affordable has moderate displacement risk because of the increased screening and application processes required for subsidized housing. Cases of rentals converting to condominiums are currently rare, but may increase as the real estate market stabilizes and mortgages are readily available.
CDFIS’ ROLE IN MANAGING RISK OF DISPLACEMENT Within each of these transitions, CDFIs and the investment community have different roles to play—roles that can foster increased investment, retain neighborhood residents and preserve affordability.
of these projects since they do not involve displacement or relocation.
FIGURE 22. TABLE – RISK OF DISPLACEMENT Risk of
Displacement Happening in
Detroit? Relevant Case Naturally affordable rental to… …subsidized affordable Moderate Occasionally 680 Delaware …market average or above High Somewhat
Frequently 711 W. Alexandrine 680 Delaware 663 Prentis
…condominium High Rarely 15 E. Kirby Subsidized affordable rental to… …refinanced/renewed contract w/subsidies Low Frequently N/A44 …market-rate rental High Occasionally 1214 Griswold …condominium High Rarely N/A
CDFIs are likely to be most active in projects that transition naturally affordable properties to subsidized affordable or market-rate rentals. In these cases, CDFIs should prioritize residents’ choice. This prioritization could include the chance to return to affordable units in the same building or find alternative housing. The policies outlined in the next section “Project-level Recommendations” address these dislocations and cover temporary relocations with residents returning to subsidized affordable units or permanent relocations with aid for residents to find, move and adjust to new affordable units.
Based on their respective missions, it is less likely that CDFIs will be involved in a project that terminates subsidies; more likely their focus would include efforts to preserve subsidized properties. Preservation requires an assessment of the state of subsidy contracts and ownership plans. Senior Housing Preservation-Detroit and Midtown Development, Inc. have already begun this process in order to understand the potential risk of housing transitioning to market rate.
Less direct roles include the creation of a pre-emptive program that provides financial management advice, maintenance and capital investment financing, refinancing support when needed or larger community partner networks that provide greater support to existing housing. In cases where subsidized properties are transitioning away from affordability, CDFIs and other funding partners will need to support service organizations that manage relocations and transitions with a focus on residents’ choice.
REGULATORY FRAMEWORK: BASELINE
POLICIES & EXISTING LEGAL
PROTECTIONS This section provides an overview of regulations affecting resident relocation based on statutes and guides provided by the State of Michigan and City of Detroit. State law overrides City law when there are contradictions; however, if State law is silent on an issue City code applies.
Capital Impact Partners | May 2016 | p30
Disclaimer: This is a high level summary of certain areas of the law. The summary is not comprehensive, and the areas highlighted are both complex and subject to change. This study does not constitute legal advice of any kind; you must consult with an attorney in the event that any of the areas highlighted are of interest to you.
MICHIGAN TENANTS’ RIGHTS The State of Michigan provides a guide for tenants and landlords summarizing the rights and responsibilities of each party when entering into a lease agreement. The guide addresses topics like security deposits, utility payments, lease terminations, rental increases, evictions and the steps tenants can take if a landlord is not meeting maintenance or safety requirements. The following is a basic outline of termination and notice requirements from that guide.45
FIXED-TERM LEASES
These are usually annual leases, but they include any lease term that is three or more months. The lease should spell out start and end dates and clarify the periods between rental payments. Termination requirements depend on the following provisions:
• If the lease requires tenants to vacate at end oflease term, no notice is required as the leaseclearly states that a tenant must be out of theunit on a given date.
• If the lease states that it will roll over to amonth-to-month lease, notice requirements ofthe month-to-month lease apply (see PeriodicTenancy below).
• If the lease does not specify requirements attermination of the lease and the landlordaccepts rental payments and allows the tenantto stay after the fixed term expires, it is assumedthat the landlord has renewed the fixed-termlease with a one-year term and under the sameconditions as the original lease.
45 MSU Law Housing Law Clinic (2013). Tenants and landlords: Resource guide.
Capital Impact Partners | May 2016 | p31
PERIODIC TENANCY LEASES These are usually month-to-month leases, but they include any three-month or less lease term. These leases are renewed from one month (or term) to the next if no notice is given. Notice of lease termination is generally required at the beginning of the last period of tenancy. For a month-to-month lease, this translates to 30-days’ notice; a 90-day lease will require 90-days’ notice.
EARLY TERMINATION Early termination of a lease is allowed under two conditions:
• Eviction for cause. There are a number of legalcauses for terminating a lease early; however, achange in ownership of a property is not legalcause for eviction.
• An early termination is essentially a change inthe lease terms, and these can only be enactedwith agreement from both the landlord andtenant. A tenant is not obligated to agree to anearly termination and is free to negotiate theterms of a termination agreement if vacating aproperty is an acceptable option. Further, alandlord is required to operate and maintain thebuilding; they cannot neglect maintenance in aneffort to pressure a tenant to leave.
Unlike provisions within the Condominium Act (see below), there are no special rights for seniors or persons with disabilities when it comes to a landlord’s termination of a lease. However, these groups are afforded special rights if they need to terminate a fixed-term lease before the term expires.
CONDOMINIUM CONVERSION PROTECTIONS The basis of rights and process in any conversion from rental property to condominium ownership is regulated by the Michigan Condominium Act of 197846
and its amendments and is augmented by Detroit Municipal Code, Chapter 26, Article VI “Condominium Conversions.”47 As the primary law, State law will be the binding statute. Common to both is a required 120-days’ notice period to existing tenants, andprotection of those tenants from eviction during thatnotice period. State law includes a special one-yearnotice consideration for qualifying seniors andpersons with disabilities;48 Detroit code provides forthe possibility of creating a lifetime lease for qualifyingsenior tenants.49 Detroit code also incorporates a“right of first refusal” for existing tenants, whichprovides tenant organizations the right to make amatching purchase offer on the whole property orallows individual residents the right to make the firstoffer on purchasing their homes.
FEDERAL RELOCATION POLICIES Federal policy varies based on programs involved and whether property is being acquired and redeveloped using federal funds or if it is an existing federally subsidized property being transitioned to market rate (e.g., 1214 Griswold).
FEDERAL ACQUISITION OF PROPERTY FOR
REDEVELOPMENT
The Uniform Relocation Act (URA) of 1970 governs when federal funds are used to acquire property for development of affordable housing and the treatment of existing tenants.50 The following is a general
.aspx?page=getobject&objectname=mcl-Act-59-of-1978&query=on&highlight=Condominium%20AND%20Act 47 Detroit City Code, Chapter 26 - Housing, Article VI - Condominium Conversion. Accessed (March 2016): https://www.municode.com/library/mi/detroit/codes/code_of_ordinances?nodeId=PTIIICICO_CH26HO_ARTVICOCO 48 MCL Act 59 of 1978, Section 104.b provides definitions of qualified seniors and persons with disabilities. Accessed (March 2016): http://www.legislature.mi.gov/(S(ggbcix0zhgtflcpqdzzllbgd))/mileg.aspx?page=getobject&objectname=mcl-559-204b&query=on&highlight=senior 49 Detroit City Code Chapter 26, Article 6, Section 1 provides a definition of qualified senior. Accessed (March 2016): https://www.municode.com/library/mi/detroit/codes/code_of_ordinances?nodeId=PTIIICICO_CH26HO_ARTVICOCO_S26-6-1DE 50 HUD provides an informational handbook on the Uniform Relocation Act that can be accessed at:
summary of requirements. However, HUD may adjust these requirements depending on funds, property type and other factors. The primary goal of the URA is to “take all reasonable steps to minimize displacement as the result of a project.”51
• Notice: There are three forms of notice required:a General Information Notice, a Notice ofRelocation Eligibility and a 90-Days’ Notice. Thefirst is informational and should be provided assoon as is reasonable after a property isacquired. The second notifies tenants of theireligibility for relocation aid, and the third servesas the official notice of termination, providingthe date when a tenant is required to be out oftheir home. The 90-Days’ Notice cannot be givenbefore either of the other two notices.
• Relocation Aid: Both relocation services andfinancial aid are required under the URA.Services include counseling and housing searchservices. Financial aid includes moving expensesand up to 42 months (up to $5,250) of rental gapassistance for replacement housing.
TERMINATION OF A FEDERAL SUBSIDY OR
CONTRACT
Subsidy and contract terminations are regulated as part of the individual subsidy programs. For example, the termination of the contract at 1214 Griswold fell under federal law Title 42: The Public Health and Welfare, Chapter 8 – Low-income Housing (42 USC Sec 1437f(c)(8)-).52 This requires that any owner terminating a Section 8 contract must provide both HUD and the tenants a one-year notice and that HUD provide tenants with rental assistance for new housing of their choice. Further, it allows for additional requirements as defined by HUD, and these requirements may include relocation assistance and service support.
http://portal.hud.gov/hudportal/HUD?src=/program_offices/admi nistration/hudclips/handbooks/cpd/13780 51 Uniform Relocation Act, 42 CFR 24.205(a). 52 Federal law Title 42 can be accessed at: http://uscode.house.gov/view.xhtml?req=(title:42%20section:143 7f%20edition:prelim)%20OR%20(granuleid:USC-prelim-title42-section1437f)&f=treesort&edition=prelim&num=0&jumpTo=true
Capital Impact Partners | May 2016 | p32
NEIGHBORHOOD RESTRUCTURING AND
RELOCATION PROJECTS
Federal neighborhood restructuring and relocation programs beyond the single-property relocations governed by the URA also provide insight. The HOPE VI program from 1993-2004 was a major restructuring of public housing aimed at demolishing and rehabilitating distressed public housing and requiring large-scale relocation. The success of HOPE VI projects varied across the nation, and outcomes tended to be mixed.53 In Detroit, the process resulted in the rehabilitation of the largest and worst-off public housing developments, but it took an extended period of time to carry out and was one of the reasons for federal oversight of the Detroit Housing Commission.54 Another, smaller-scale demonstration project is the federal Moving to Opportunity program. This relocation project was designed to study long-term quality of life improvement among public housing residents who voluntarily relocate using housing vouchers—some receive open choice vouchers while others are given select higher opportunity places to use the voucher.
Although these programs are different from the cases covered by potential CDFI relocations, there are lessons to be learned. First, relocation is at times seen as an opportunity to provide residents with the resources they need to move to better living conditions.55 Second, landlord outreach and post-move support help ensure that moves are successful over the long term.56 Pre-move search and housing counseling help prepare residents for new homes and to find better living conditions. Post-move follow up eases communication and adjustment periods, increasing the chances of successful relocation.
PROPERTY MANAGEMENT REGULATIONS In Detroit there are a number of City code requirements that govern rental property operations and management. These are primarily found in two
53 Schwartz, A.F., p.117-125. 54 Fournier, H. (31 March 2015). 55 Kearns and Mason, p.181 56 Varady and Kleinhans, p. 333
sections of the Municipal Code: “Chapter 9: Buildings and Building Regulations” and “Chapter 26: Housing.” Full text of the ordinances can be found online.57
REGISTRATION Detroit code requires the registration and annual renewal of any residential property that is offered for rent. The information required for registration includes location and use of property, identification of owner, property manager and party responsible for maintenance, emergency and inspection access. As part of the annual registration process, the City is required to inspect properties as part of a Certificate of Occupancy (COO). Rental properties without an inspection and current COO are technically illegal in Detroit. These City and owner responsibilities are outlined in Detroit’s Code of Ordinances, Chapter 9, Article I, Division 3.
BUILDING CONDITION INSPECTION In addition to the annual inspection required for rental certification, the City is enabled to inspect buildings that have been reported as substandard. These inspections are in addition to the annual inspections and can be performed on any building regardless of their registration status.58
Within Chapter 8 and Chapter 26, the City specifies management and maintenance requirements for rental properties. This is an extensive list and includes exterior maintenance, landscaping, waste disposal, mechanical and electrical code, accessibility, etc. Inspections are intended to ensure code compliance, including the remediation of any violations.
PROJECT-LEVEL POLICY
RECOMMENDATIONS The following recommendations are intended to address issues at the project level and provide steps that individual CDFIs can take. Upon completion of the
57 Detroit City Code can be accessed online at: https://www.municode.com/library/mi/detroit/codes/code_of_ordinances?nodeId=10649 58 Detroit City Code: Chapter 26, Article II
internal guideline, Capital Impact Partners plans to share it with the Detroit CDFI Coalition to encourage widespread adoption of this approach for multifamily rehabs in Detroit.
INVESTMENT PRIORITIES CDFIs should continue to prioritize the creation of new multifamily residential units in greater downtown with a focus on new construction and rehabilitation of unoccupied or vacant structures. However, there is also neighborhood and community value in rehabilitating unsafe buildings that are occupied, and, as they do with any project, CDFIs can evaluate these cases closely and bring a broader set of tools to the table.
The goal of creating a dense urban environment requires the physical infill of vacant and open land in the greater downtown. Converting parking lots and rehabilitating vacant structures fills the space between occupied structures, creating densities that support key services like public transportation, schools and fresh food access.
If an occupied building is targeted for redevelopment, a relocation plan should be outlined in the loan document, with actors identified for the initiator, manager, service provider and verification roles outlined below and financial and relocation service provisions spelled out.
The list of service provision options is an umbrella that borrows from federal regulations, City code and general practice. It has been developed under the assumption that many occupants of these substandard buildings will be low-income renters with limited housing options, and extra time and services may be necessary to ensure that they find safe and affordable housing. This list should be regarded as a menu with a selection of options that best fits the needs of the existing tenants and the financial realities of the project. CDFIs and community development partners should revisit relocation policies on a regular basis, as new projects will provide new insights. Each of the following recommendations are covered in detail below:
• extended notice,• housing services, including pre-move search
services and post-move evaluation,• financial assistance for relocation,• prioritized rental/right-of-return,• rental waivers, and• utility and credit aid and counseling.
RELOCATION PROJECT ROLES Based on our case studies, four roles seem key in the process of assisting residents with relocation in the case of a multifamily development. They are Initiator, Manager, Service Provider and Verifier.
Individuals or organizations filling these roles will, ideally, create and carry out a relocation plan for residents. The plan should provide support for finding new housing, aid in the actual move and provide continued support after the move. Depending on the number of residents relocating and the needs of those households, these roles can be filled by development team members or a team of social service providers and contracted professionals.
INITIATOR This actor raises the need for a relocation plan and ensures that it is included in the project budget and schedule.
711 W. Alexandrine- The CIP loan officer and the PK Development project manager shared this role. CIP ensured that relocation funds were included in the financing for the project. PK Development, a property management company with experience in affordable housing, was aware of the needs of existing residents and was prepared to work with them.
680 Delaware- Central Detroit Christian Community Development Corporation (CDCCDC) took on this role. As a developer, property manager, community organizer, service provider and mission-driven neighborhood organization, this was part of CDCCDC’s normal operations.
1214 Griswold- Compliance with federal regulations determined content and timetable of the relocation plan.
Proposed actor: CDFIs and financial partners with potential City oversight and relocation aid requirements
CDFIs will have limited, if any, involvement in projects like 1214 Griswold, which terminated subsidized affordable housing. In such cases, federal requirements would trump these recommendations.
In cases of CDFI-led transactions, relocation plans must be built into the finance structure and planned in partnership with service providers with the capacity to manage the cases of relocated residents. All CDFI representatives interviewed expressed willingness to take on the initiator role by including relocation aid and plans as criteria for releasing funds. Moving forward it is possible that the City, acting like HUD in properties with federal funding, could enact regulations requiring relocation considerations as conditions for use of City funds. In any case, governmental actors or CDFI financiers will need to develop the capacity to monitor and evaluate project level compliance.
MANAGER This actor oversees implementation of a relocation plan, ensuring that the tools are in place to fulfill the requirements of the plan. The manager should carefully track the expenses associated with the relocation plan, including both the aid dispensed and any internal personnel costs that are not included in contracts.
711 W. Alexandrine- PK Development filled this role. The project manager from PK Development and the on-site property manager at 711 W. Alexandrine were the primary actors in assisting residents with relocation needs.
680 Delaware- CDCCDC filed this role. They developed a relationship with the four
Capital Impact Partners | May 2016 | p35
households in the building and worked with them throughout relocation.
1214 Griswold- Broder & Sachse, the real estate development partner, filled this role. Broder & Sachse contracted all service providers and coordinated relocation within the redevelopment budget and schedule.
Proposed actor: Real estate developer
In the cases we explored, the manager was the only role filled by the same actor. All facets of development projects tend to be managed by the developer; placing the relocation plan within their scope allows for it to be fully integrated with the project’s budget and timeline. Further, if lenders use loan covenants to ensure compliance, the developer will have the largest interest in ensuring that the plan is workable and followed. Tracking the actual costs of relocation is especially important so that future projects can fully account for the needs of residents and resources of developers.
SERVICE PROVIDER This actor oversees the relocation of residents, providing case management centered on each households needs.
711 W. Alexandrine- PK Development’s on-site property manager filled this role. The property manager was retained after purchase because of his relationships with the tenants. These relationships allowed him to work with tenants in evaluating their housing options, and his knowledge of the area helped those who requested aid in finding appropriate housing.
680 Delaware- This role was filled by CDCCDC. Since there were only four existing households in the building, CDCCDC was able to work with them through the relocation without requiring additional help.
1214 Griswold- This role was contracted out to
the United Community Housing Coalition (UCHC) and the Neighborhood Services Organization (NSO). UCHC was the primary actor working with residents to understand their needs and help them find housing in Detroit. UCHC also served as a liaison between tenants and Broder & Sachse to represent tenants’ interests.
Proposed actor: Clearly defined point person or organization
Based on the number of residents and their needs, this role can be filled within the existing development team or contracted out to a housing support service provider. It is important that this entity prioritizes the needs of residents and that this person is the clear point of contact for both residents and the developer. When appointing this actor, the number of residents needing aid, the capacity of the on-site or development team, the relationship of the development team with residents and knowledge of the housing options available to affected households will need to be taken into account.
Interviewees consistently raised questions about the existence and capacity of appropriate service providers in Detroit. The demands of relocation will depend upon the number of households requiring aid and the characteristics of those households. The large number of seniors living at 1214 Griswold required a larger response than the four households at 680 Delaware. Based on recent evidence, the redevelopments that CDFIs are most likely to finance will be vacant buildings or those with few occupants, meaning that service capacity will rarely need to accommodate a large number of relocations. However, that does not exclude the need for special consideration in providing services. CDFIs and community-based organizations will need to work with existing service providers to develop a resident needs evaluation tool to ensure that the right type of aid is being provided. The Senior Housing Preservation-Detroit Coalition has begun this work, and their requirements can be used as a starting point in creating service organization capacity and a relocation process.
VERIFIER This actor ensures that the terms of the relocation plan are followed. The verifier should also be aware of any regulatory frameworks that apply to the redevelopment.
711 W. Alexandrine- This role was unfilled. Allowances were made within the loan for relocation needs but there were no loan covenants requiring verification. Project partners generally knew that assistance was provided to all who sought it, but there was confusion on the exact roles played by various actors. PK Development’s mission as an affordable housing property manager ensured residents were housed appropriately as defined by internal standards.
680 Delaware- This role was unfilled. With four households and a developer who is also an active organizer and service provider in the neighborhood, the relocation process occurred as part of CDCCDC’s normal operating procedures. There was no need for an external verification process.
1214 Griswold- This role was filled by HUD working with Broder & Sachse to ensure that all federal requirements were met. The service providers, UCHC and NSO, were also aware of the requirements and verified compliance in the course of providing services.
Proposed actor: Third party or financial partner
One of the largest concerns of the CDFIs in using loan covenants to enforce a relocation plan is verification. At this point, most CDFIs do not have the capacity to verify compliance nor do many other community organizations. It will be necessary to build this capacity in order to track individuals' experiences in the relocation process. Other programs that require verification can serve as a model for this process; examples include the enforcement of Low-Income Housing Tax Credit (LIHTC) affordability or regular
Capital Impact Partners | May 2016 | p36
insurance inspections of properties as part of term renewals. In both cases loan syndicators and insurers either build internal verification departments or contract out the role. The type of relocation plan that this study addresses spans a shorter timeline than LIHTC compliance—lasting approximately two years for relocation and construction timelines and resident follow up in the above cases. With so few documented examples of redevelopments requiring relocation, the creation of a full-time position within a CDFI might not be efficient. Other options include project-by-project contracts with an independent evaluator or bundling this role within a new multifamily / community position.
FINANCIAL AND RELOCATION SERVICE PROVISIONS
EXTENDED NOTICE Provide 120-days’ notice to vacate building. This requirement does not override fulfillment of any fixed-term leases. It applies to month-to-month tenants and residents with established building residency to whom it will provide fair warning that they will not be able to renew a fixed-term lease. The vacancy rates in greater downtown are currently very low (Figure 15). This means that finding a new home will require completion of rental applications and time on waiting lists, which generally takes longer than the minimum legally required 30-days’ lease termination notice. Also, a greater time allowance will help residents with special needs locate appropriate housing and services and should lessen the stress associated with a sudden and perhaps unexpected move.
HOUSING SEARCH SERVICES Provide one-on-one housing search aid for those who seek it, ensuring residents locate safe housing options. An individual or organization knowledgeable about the options within the area will help residents relocate within their neighborhood even if they are required to change buildings. Whether or not this service is provided by a member of the development team or an outside provider will most likely depend on the number of people requiring assistance and the types
Capital Impact Partners | May 2016 | p37
of housing needed. These services should span both pre- and post-move time periods. In the pre-move search timeframe, it is important that those providing aid understand the needs of the residents and have good relationships with prospective new landlords. In the post-move phase, these services should focus on ensuring that residents and new landlords have developed clear means of communication and common expectations. Post-move follow up should last for at least one lease cycle (or one year) to evaluate the success of the relocation. The follow up will also help future development projects modify relocation plans for greater success.
FINANCIAL ASSISTANCE FOR RELOCATION Financial aid to cover the raw cost of moving falls into two categories: moving assistance and upfront rental costs (security deposits, first / last payments). Moving assistance includes any of the following as requested: packing aid, the cost of physically moving possessions out of one housing unit and into another and logistics like supplying a moving service. Upfront rental costs vary by case and may depend on resident income levels or use of existing security deposits in paying new landlords.
CIP proposes a policy through which project financing incorporates support for residents’ transitions in cases where redevelopment requires relocation. Loan officers can build transition assistance into the development package with line items for three months’ rental assistance per affected household and moving assistance. CIP’s internal guideline will recommend using $3,000 as a baseline assumption for the financing package, recognizing that actual costs may vary from $1,000-$5,000 per affected unit.
PRIORITIZED RENTAL, RIGHT-OF-RETURN Provide residents with the option to return to a rehabilitated building if possible. For buildings with affordable housing subsidies as part of their financing, the property manager and developer can offer existing low-income residents priority when leasing affordable units and offer assistance in navigating/waiving new leasing documentation requirements. If rents are raised, the property manager prioritizes existing
households that are able and willing to pay the higher rents when leasing the building.
RENT WAIVERS Developers can waive rent for the notice period (pre-move and pre-construction) when financially feasible. Rent waivers allow residents flexibility to settle utility bills and save for new housing costs. In cases where occupancy rates are low, the rental income collected over 120 days will be nominal to the redevelopment-financing model, but it may make a large difference for residents.
UTILITY AND CREDIT AID OR COUNSELING Developers can provide financial aid to clear any delinquent utility payments related to the property under development. One of the largest obstacles for residents that interviewees identified is that many low-income renters lack the financial history for standard rental applications. A 120-days’ notice period is not enough time to develop a complete credit history, but it is enough time for service providers to help residents establish clear utility records, gather documentation of financial history and provide financial counseling.
COMMUNITY DEVELOPMENT & PUBLIC
POLICY RECOMMENDATIONS Addressing issues of displacement within the community and the problems that arise beyond individual projects requires coordinated efforts across the community. The following recommendations will require CDFIs, the development community and social service providers to work together as allies pooling resources for efficiency and a wider, more influential reach.
GREATER DOWNTOWN MULTIFAMILY FOCUS A few interviewees recommended the possibility of an effort focused solely on retaining the greater downtown’s existing multifamily housing stock and residents. As we explored a variety tools to address this suggestion, it became clear that existing
community development and advocacy organizations are already handling some of these initiatives or are poised to take them up given capacity to do so. Other initiatives may be more appropriately handled by one or more partnerships that seek to build a deeper understanding of the area’s multifamily trends and develop responsive policies.
The following is a list of some possible initiatives and funds that a central effort could focus on:
• data collection and area survey,• third-party verification / coordinate relocation
needs,• support for community partners,• flexible capital,• tenant association and neighborhood
organization support,• property management,• housing preservation strategy,• rental gap aid for relocated persons,• resident retention programs, and• resident displacement and relocation
evaluations.
DATA COLLECTION AND AREA SURVEY All CDFI interviewees requested better and more complete data about citywide housing trends and displacement risks. This data creates a basis for assessing market activity, risk and opportunity. As we gathered data for this study, it became clear that some sources require extensive refinement and analysis, while other sources are missing entirely (see Appendix A for more detail).
One way to generate data is conducting a survey of multifamily properties. This survey would, at a minimum, need to include a detailed inventory of multifamily properties, including number of units, vacancy, occupancy, property condition and ownership/property management status. Additionally, the survey should gather household information including household size, income, tenure in unit and neighborhood, employment location and any demographic information residents are willing to share. This effort could build on the groundwork of
Capital Impact Partners | May 2016 | p38
MDI’s rental comp survey by adding in the details as outlined in Appendix B.
There are many national examples of multifamily and household tracking efforts. The most comprehensive is undertaken by New York City every three years. The NYC Housing and Vacancy Survey is administered by the U.S. Census Bureau and gathers extensive information, including vacancy, household characteristics, tenure, crowding, building condition, neighborhood characteristics, utility costs and accessibility.59 Other surveys, often aimed at specific neighborhoods or household types, provide examples of limited data collection—East Lansing conducted a survey of senior housing needs in 2013 / 2014.60 Beaverton, Oregon’s 2014 online housing survey is a traditional short-form questionnaire used for comprehensive planning that captures many of the household data points outlined above.61 A survey for greater downtown could sit somewhere between the comprehensive NYC example and these other focused questionnaires. Ideally, it would be updated annually to build the trend data needed to understand the patterns of neighborhood development and displacement over time.
THIRD-PARTY VERIFICATION, COORDINATION OF
RELOCATION NEEDS
One of the obstacles to making relocation and displacement plans part of the loan covenants is the organizational capacity to verify that loan terms are fulfilled. Based on the relatively few cases of relocation caused by redevelopment to date in Detroit it is unlikely that any single CDFI would need a full-time staff person to fill this role. However, adding or contracting out this responsibility to a third-party organization like the United Community Housing Coalition, the Neighborhood Service Organization or independent evaluators are possible solutions.
59 For more information on the New York City Housing and Vacancy Survey see: http://www.census.gov/housing/nychvs/ 60 For more information on East Lansing’s “Welcome Home: A housing assessment for senior residents” see: https://www.cityofeastlansing.com/842/Housing-Survey 61 For more information on Beaverton’s housing survey and household questions see: http://www.beavertonoregon.gov/housingsurvey
Capital Impact Partners | May 2016 | p39
SUPPORT FOR COMMUNITY PARTNERS The experience of our interviewees and literature surrounding “development without displacement”62 all point to the need for strong community development partners, neighborhood organizations and local business associations wherever market-based or physical development is taking place. Where housing markets are strengthening, existing community development corporations (CDCs) play irreplaceable roles in preserving existing affordable housing and ensuring that resources remain in the community. CDFIs and funders should continue to support existing organizations through development partnerships and funding where appropriate. Additionally, there is a need to facilitate connections between service providers and community development organizations. Partnering organizations that are focused on employment, health and social services with neighborhood development groups will build a network that supports neighborhoods and their residents.
FLEXIBLE CAPITAL Without a citywide operational support system for community-based organizations, CDCs in Detroit consistently need small grants or very favorable loans without the strings usually attached to city, state or federal subsidies—particularly for acquisition, repair and operation costs associated with small-scale housing used by low-income residents who do not qualify for publically subsidized housing. Preserving this type of well-managed housing will be central to a neighborhood’s ability to inclusively retain residents.
62 Local plans and studies concerning “Development without Displacement” parallel the development of gentrification as a framework for understanding urban development. Two recent studies and plans have come from San Francisco and Philadelphia. The San Francisco document created by Cause Justa/Just Cause can be accessed at: http://cjjc.org/images/development-without-displacement.pdf The Philadelphia plan, created by the Philadelphia Coalition for Affordable Communities, can be accessed at: http://phillyaffordablecommunities.org/index.php/our-report/
TENANT ASSOCIATION AND NEIGHBORHOOD
ORGANIZATION SUPPORT
Tenant associations and neighborhood organizations, like strong community partners, are useful in identifying and mitigating displacement pressures. Their core activities often include activating residents, providing useful communication platforms within diverse communities and integrating new residents into existing communities. Within the Detroit community, the most active force in tenant organization is the United Community Housing Coalition (UCHC), which focuses on tenant groups’ legal needs. A “Greater Downtown Multifamily Partnership” could support new tenant associations in new projects and provide a forum for bringing associations from multiple buildings together on a regular basis with the goal of proactive and effective interaction with development forces.
PROPERTY MANAGEMENT While outside of the scope of this report, effective and professional property management can make or break a thriving multifamily residential community and has beneficial effects on surrounding neighborhoods. Building development and construction comprise a relatively short period of time in the lifecycle of a development, whereas good management can keep a building safe and valuable for decades.
Current State of Property Management Regulation
The City of Detroit’s Building, Safety Engineering and Environmental Department (BSEED) enforces Detroit’s property management regulations, maintaining the rental registry and conducting inspections. Like many departments within the City government, BSEED has struggled to fulfill all requirements within a tight budget: the rental registry is not up to date, and inspections take place in response to complaints instead of annually. The limited resources of the department are often focused on current City priorities to document blight in residential neighborhoods, leaving few resources to annual operations.
Additionally, there are issues with the rental inspections that are on file with BSEED. Due to the case-by-case style of the current inspections there is little consistency across reports. This inconsistency ranges from how properties are classified to what is inspected and includes differences between inspectors’ reports. As CDFIs make investments, it is possible to review past inspection data on a property-by-property basis. However, this information will only be available if the building has had problems and those problems have been brought to the attention of BSEED.63
As the regulatory framework and capacity of City agencies are rebuilt, BSEED data will still be in flux. However, a streamlined inspection and data management program could improve rental conditions throughout the city, create a transparent check on inspections and provide residents and investors with a tool to understand neighborhood conditions and evaluate risk. It is in the interest of the investment community to encourage consistent code enforcement as a tool in improving property and neighborhood conditions and to access data on those conditions. Code enforcement is one of the best tools to sort property owners and managers who are invested in the community and those extracting income from buildings while allowing them to deteriorate. However, if these tools succeed they can create changes in property ownership and management that lead to displacement as owners may sell properties without consideration for tenants or neighborhood development plans. Detroit Future City discusses the implications of code enforcement on vacant homes,64 and many of the strategies identified can ensure intentional improvement of the multifamily market as well. These recommendations include enforcement and incentives. The central need is for a consistent, transparent and public inspection regime. This regime can be both an enforcement tool and an incentive, as “good” and “bad” landlords can
63 There is no guarantee that residents or neighbors will bring issues to BSEED. This requires residents to be aware of their rights in calling in City inspection, from who bears the cost of inspections to their protections under Michigan’s Tenant Rights. 64 Detroit Future City, p.312-313.
Capital Impact Partners | May 2016 | p40
be equally highlighted and publically acknowledged. Additionally, enforcement steps include calibrating fines and follow-up inspection to encourage resolution of problems. Incentives could include outreach to landlords to inform them of their responsibilities, training and technical assistance for those seeking to improve properties and access to financial and management tools to aid owners making improvements.
For those landlords unwilling to make improvements in the face of increased code enforcement community development and neighborhood organizations should reach out in order to encourage or facilitate property sales that take into account the needs of current building and neighborhood residents.
Some options for advocating for good property management citywide include:
• Support the City in improving enforcement ofrental property registration and annualinspections, including sharing the housing surveydata with the city to support a more transparentinspection regime.
• Investigate existing and new programs fortraining property managers; educate managersand tenants about best practices.
• Identify property management and capitalinvestment strategies that help preserveaffordability, including improving energyefficiency and water usage.65
65 Enterprise Community Partners has a program that works with affordable housing owners and residents to evaluate energy use and finance energy efficiency improvements. The program monitors pre- and post-upgrade energy use to understand and pass along savings from upgrades to owners and renters. Information on Enterprise’s Green Communities program can be found at: http://www.enterprisecommunity.com/solutions-and-innovation/enterprise-green-communities In Chicago a coalition of community partners has created the Preservation Compact, working to preserve affordable housing. In addition to property management training, one of their main programs is to support small property owners in making investments to improve energy efficiency in their properties. Information on the Chicago program can be found at: http://www.preservationcompact.org
Capital Impact Partners | May 2016 | p41
HOUSING PRESERVATION STRATEGY Tracking changes in publically subsidized housing needs to be taken on at a local scale. As noted, HUD’s point of view is that the loss of Project-Based Rental Assistance (PBRA) partners is minimal, but any loss can have a large effect on a local community. The resources needed to either transfer ownership or redevelop this housing while maintaining affordability are often substantial. Mission-driven public owners like the Detroit Housing Commission or private ones like PK Development require time and support to be able to take on new properties. In Detroit, the SHP-D Coalition, LISC and MDI have all started to assemble the information needed to track and understand the nuances of publically funded housing. These efforts should be supported and bolstered to include regular tracking and outreach to current properties, outreach to possible funders and investors if they are needed, increased attention paid to the quality of the housing being provided and development of a preservation
strategy integrating City and community organization priorities and capabilities.66
RENTAL GAP ASSISTANCE FOR RELOCATED
HOUSEHOLDS
Philanthropic grants and small development fees modeled on the Uniform Relocation Act (URA) could provide assistance to residents directly displaced by projects funded with CDFI resources. The first step in creating this fund is re-surveying the properties involved to update Motor City Mapping data and address the 54 structures for which there was no data.
Figure 23 outlines a possible scenario requiring the creation of a $1.5 million fund to be dispersed over four years.
66 A coalition of affordable housing developers and activists in Washington, DC, with support from the Urban Institute and LISC, have created the District of Columbia Preservation Catalogue, a periodic updating of local subsidized properties, their contract or affordability limits, condition and other characteristics of interest. The information can be accessed through the Neighborhood Info DC website at: http://www.neighborhoodinfodc.org/dcpreservationcatalog/
FIGURE 23. TABLE – RENTAL GAP ASSISTANCE ASSUMPTIONS AND CALCULATIONS Assumptions
Number of households: 294 Based on the 22 properties in “fair” and “poor” condition as identified in Trend: Housing Conditions. Additional survey of 24 “fair,” “poor” and “suggest demo” plus 54 unspecified structures
Pace of development: six projects per year Based on goals of CIP investment team
Rental gap: $375 / month for a 1br Based on the difference between the minimum ($325 /m) and average ($700 / m) rent as identified in the MDI rental comp survey for 2014
Terms of Assistance Maximum amount of aid: $5,250
Based on maximum aid in Federal Uniform Relocation Act Period of aid: 14 months
Based on number of months covered by $5,250 dispersed at $375 /m Household stabilization: proof of steps taken to stabilize housing situation without subsidy
Could include application for other housing aid, assisted search for affordable housing, financial and credit counseling
Calculation
294 households x $5,250 = $1.54 million
Any comprehensive program should carefully target and support residents directly affected by project-based displacement. We propose specifically addressing actions that CDFIs can take on projects they are involved in—not all potential market-based displacement e.g., the displacement created by projects like 663 Prentis. Efforts to extend this aid beyond the CDFI community will require careful design and monitoring or a very limited geography, as widespread rental support could quickly outpace the capacity of a fund.
RESIDENT RETENTION PROGRAMS CIP and MDI have designed a pilot resident retention program modeled after the LiveMidtown housing subsidy to target households earning 50-80 percent AMI in MDI’s most active development center—the Upper Cass Corridor—from Woodward Avenue to the Lodge Freeway and Warren Avenue to MLK Boulevard. This program will provide up to $4,500 in rental assistance over three years to provide residents affected by market rental rate increases of more than 10 percent with an option to stay or move into the greater downtown.
Through this program CIP and MDI will learn how to best serve this vulnerable population and create longer-term policies and solutions for neighborhood access and affordable housing while housing supply lags behind current demand. As more than 2,000 units of housing are expected to come online in the next 24 months, we believe more naturally affordable housing for this group will be available.
DISPLACEMENT AND RELOCATION EVALUATIONS Evaluation of these policies and programs is key to ensuring that development in Detroit is meeting the challenge of encouraging growth and diversifying the greater downtown’s income mix while ensuring that households most at risk of displacement or relocation are included and supported throughout the process.
POLITICAL ADVOCACY Beyond the direct action of loan covenants and the collective actions of community-based organizations or a “Greater Downtown Multifamily Partnership,”
Capital Impact Partners | May 2016 | p42
additional public policy changes would help to slow and mitigate displacement in the long term. It’s important to note that some of these approaches may not be appropriate in the short term, given that Detroit’s real estate market, while improving, is still quite weak and often leaves development projects in the greater downtown with substantial financing gaps.
The following are some examples from other cities and suggestions from our interviewees. In applying any of these examples to the greater downtown, it is important to consider
• how current market strength limits whichregulations the current market can bear withoutlimiting quality investment;
• if there are future market benchmarks (e.g. rentsper square foot reach a certain level) that maytrigger the need for stronger regulations as themarket strengthens; and
• whether there is financial and regulatorycapacity for enforcing any proposed cityordinances or state legislation.
INCREASED LEGAL PROTECTION FOR RENTERS Advocating for a change in lease termination and rent increase notification would allow residents the time needed to find alternative housing solutions. Current conditions (high-occupancy rates in greater downtown) and the requirements of rental applications make a 30-days housing search difficult for renters at any income level.
INCLUSIONARY ZONING Many cities are implementing inclusive zoning requirements, building a requirement for affordable housing into zoning ordinances. Different cities have implemented these programs in a variety of ways and there is a rich body of literature analyzing programs.67
67 For background on Inclusionary Zoning the Chicago Metropolitan Agency for Planning has a review with case studies at: http://www.cmap.illinois.gov/about/2040/supporting-materials/process-archive/strategy-;papers/inclusionary-zoning/background-and-examples In 2013 the Department of Housing and Urban Development did two in-depth case studies of the IZ programs in Montgomery
Capital Impact Partners | May 2016 | p43
In Detroit, the Housing and Revitalization Department currently encourages 20 percent of the units in new and rehabilitation projects to serve low-income households with up to 80 percent AMI when development includes City-owned property or uses City-approved tax abatements. The development community at large should advocate for the City to establish this policy explicitly in order to make the development process as predictable, stable and financeable as possible.68
At present, the Housing and Revitalization Department has issued an Inclusionary Housing Feasibility Study RFP in response to a proposed ordinance that would solidify affordability thresholds and a housing trust fund—as opposed to making them at the City’s discretion. The results of the feasibility study and housing ordinance process are expected by the end of 2016. Capital Impact Partners is taking a proactive role in this process.
RENT CONTROL In 1988, Detroit enacted rent stabilization ordinances69 that were quickly nullified by state law.70 However, it may be the time to find allies in other communities facing rent increase and displacement issues. As a group, these communities could work to change state law and allow for some rent stabilization. Communities like Ann Arbor, Traverse City and Grand Rapids are all facing increasing rents that are outpacing the ability of residents and affordable developments to adapt.
County, MD and Fairfax County, VA, two well-established IZ regimes. Access the studies at: https://www.huduser.gov/portal/pdredge/pdr_edge_research_012513.html 68 The Department of Housing and Urban Development report on IZ programs specifically found that clear and explicit requirements were necessary for the risk assessments needed by developers. 69 Detroit Municipal Code, Chapter 26, Article VII- Stabilization and regulation of rent increases. 70 MCL Chapter 123, Act 226 of 1988, Section 123.411 (2) “Leasing of Private Residential Property”: (excerpt) A local government unit shall not enact, maintain, or enforce an ordinance or resolution that would have the effect of controlling the amount charged for leasing private residential property.
DEVELOPMENT FEES/ PAYMENT IN LIEU OF
TAXES States, counties and cities have used fee and tax collection authority to fund affordable housing, housing preservation and neighborhood and economic development. The fee structures below are used to collect funds from developments and properties with the intent of reinvesting in the community. These revenue generators are most effective in stable real estate markets, and examples come from cities like San Francisco, Boston, Seattle, Philadelphia and northern New Jersey. As the Detroit market stabilizes, investors and regulators should be ready to put these revenue sources in place to address social service and equity issues. These fees could be triggered when real estate investment proceeds without subsidy, the average rental rate exceeds affordability limits or housing development reaches more sustainable urban density levels.71
Development Impact Fees
Development Impact Fees are collected on individual developments and the revenue is used in public investment tied to the development e.g., infrastructure investment, neighborhood school funding or public safety needs.
Targeted Housing Development Fees
In thriving housing markets, development fees, sometimes paired with Inclusionary Zoning, are used to fund neighborhood and economic development programs. For example, in San Francisco there is a proposed fee on housing developments that will fund transit improvements.72 In Seattle there is a proposed fee on commercial development that will create a housing trust fund to be used to preserve and build affordable housing.73 In a use of fees and incentives,
71 Frost and Luther, p.8. 72 Dineen, J.K., and Cabanatuan, M. (22 July 2015). City proposing new housing development fee to expand transit. SFGate.com. Accessed (March 2016): http://www.sfgate.com/bayarea/article/City-proposing-new-housing-development-fee-to-6398091.php 73 Klein, Stephanie (1 Sept 2015). Seattle mayor rolls out “gand” affordable housing plan. MyNorthwest.com. Accessed (March 2016): http://mynorthwest.com/11/2803967/Seattle-mayor-rolls-out-grand-affordable-housing-plan
Jersey City has proposed a new way of linking affordable housing requirements through zoning with property tax abatements and fees.74
COMMUNITY BENEFITS AGREEMENTS Advocates, developers and elected officials across Michigan are currently debating the role of Community Benefits Agreements (CBAs). Like Inclusionary Zoning, CBAs have been tested in a variety of places, nationally and internationally. Even in Detroit, where CBAs are not required practice, CDFIs, the City and other development partners often reach out to community members during development. At its heart, the CBA process ensures that the community has a seat at the table as development is planned, constructed and managed. The CBA is also a tool that can link real estate development to economic development. For example, CBAs often include requirements for local employment on projects, support of local businesses, and support of affordable housing near large-scale public transportation investments. If executed correctly, CBAs can epitomize a healthy relationship between the City, developers and residents. Within this framework, granting the community a seat at the development table will not dampen the investment that is proceeding in Detroit.
74 Misra, T. (3 Sept 2015). Jersey City’s innovative new affordable housing plan might actually work. Citylab.com. Access (March 2016): http://www.citylab.com/cityfixer/2015/09/jersey-citys-innovative-new-affordable-housing-plan-might-actually-work/402574/
Capital Impact Partners | May 2016 | p44
CONCLUSION As redevelopment and growth become more common in parts of Detroit, it will be an ongoing challenge to plan for and preempt resident displacement. Diverse stakeholders citywide will need to come together to establish a set of shared values, practices and standards for managing complex market dynamics in a way that prioritizes existing residents, promotes racial and economic diversity and ethically facilitates development processes to limit their negative effects on Detroit’s most vulnerable populations. We believe, by adopting the array of tools, practices and strategies outlined in this report, we can mitigate the costs and challenges of displacement and relocation while building a city and greater downtown that welcomes all who are here, intend to stay or hope to take part in Detroit’s resurgence.
One thing we have learned from this study is that a variety of stakeholders’ values intersect around residents’ need and right to the choice of clean, safe, affordable housing in their neighborhood. At minimum, it is within our collective capacity to facilitate development that fully considers displacement risks and responsibly addresses any instance of relocation. Though it won’t happen without intervention into market forces, Detroit can be a city that encourages growth while providing access and affordability for all—particularly in the city’s highest opportunity neighborhoods.
• Dennis Archambault, Ian Davis, Tam Perry and Vincent Tilford, Senior Housing Preservation‐Detroit,
• Kirby Burkholder, IFF,• Yulonda Byrd, Mark McDaniels and Dennis
Quinn, Great Lakes Capital Fund,• Candace Baldwin, Melinda Clemons and Ian
Weisner, Capital Impact Partners• Linda Campbell, Building Movement Project,
Detroit People's Platform, and DDAWN,• Patrick Dorn, Cass Corridor Neighborhood
Development Corporation,• Aaron Handelsman, Building Movement Project,
Detroit People's Platform, • Jacob Horner, PK Development,• Lisa Johanon, Central Detroit Christian
Community Development Corporation,• Mary King, Invest Detroit,• Sue Mosey, Midtown Detroit, Inc.,• Royce Nunley, Law Offices of Royce A. Nunley,• Seana Page, Detroit Housing Commission,• Michael Polsinelli and Susie Sapilewski,
Department of Housing and Urban Development,
• John Schoeniger, Detroit Development Fund,• Sarida Scott, Community Development
Advocates of Detroit and D‐DAWN,
Tonja Stapleton, City of Detroit Building, SafetyEngineering and Environmental Department,
Molly Sweeney, D‐DAWN, and Tahirih Zeigler, Local Initiatives Support
Corporation
Capital Impact Partners | May 2016 | p45
ACKNOWLEDGEMENTS The authors would like to acknowledge the contributions of the following individuals and organizations:
• Lauren Hood for her help in refining our studydirection and reaching out to communitymembers and organizations, and
• Noah Urban, Jeff Bross and the Data DrivenDetroit team for their aid with Motor CityMapping data, mapping and occupancy analysis.
We would also like to thank the following people for their time and input through interviews, meetings and draft reviews:
Capital Impact Partners | May 2016 | p46
REFERENCES 7.2 SQ MI: A Report on Greater Downtown Detroit,
Second Edition. (2015). The Hudson-Webber Foundation. Accessed (March 2016): http://detroitsevenpointtwo.com
Assessing the needs and contributions of older adults. (2015). Senior Housing Preservation-Detroit.
Detroit City Code. Accessed (March 2016): https://www.municode.com/library/mi/detroit/codes/code_of_ordinances?nodeId=10649 2016
Evidence Matters: Transforming Knowledge Into Housing and Community Development Policy. (Summer 2013). U.S. Department of Housing and Urban Development, Office of Policy, Development and Research. Washington, DC. Accessed (March 2016): https://www.huduser.gov/portal/evidence.html
Fournier, H. (31 March 2015). Feds end management of Detroit’s public housing. The Detroit News. Accessed (March 2016): http://www.detroitnews.com/story/news/local/detroit-city/2015/03/31/feds-end-management-detroits-public-housing/70712826/
Frost, B., and Luther, E. (2015). Toward inclusive growth in Detroit: Density & income mix strategies for Detroit’s mixed-use corridors. Capital Impact Partners. Accessed (March 2016): http://detroitcorridorinitiative.org/fwd-admin/projects-2/toward-inclusive-growth/
Hutchison, R. ed. (2010). Encyclopedia of Urban Studies. SAGE Publications, Inc.
Jordan, R., and Poethig, E.C. (20 Oct. 2015). How to keep affordable housing in high-opportunity neighborhoods. Urban Wire: Housing and Housing Finance. Urban Institute, Washington, DC. Accessed (March 2016): http://www.urban.org/urban-wire/how-keep-affordable-housing-high-opportunity-neighborhoods
Kearns, A., and Mason P. (2013). Defining and measuring displacement: Is relocation from restructuring neighborhoods always unwelcome and disruptive? Housing Studies, 28:2, 177-204.
Kleinhans, R., and Kearns, A. (2013). Neighborhood restructuring and residential relocation: Towards a balanced perspective on relocation processes and outcomes. Housing Studies, 28:2, 163-176.
MSU College of Law Housing Law Clinic. (2013) Tenants and Landlords: Resource guide. Accessed (March 2016): https://www.law.msu.edu/clinics/rhc/resources.html
Muller, D. (19 August 2014). Detroit’s Midtown, downtown redevelopment threatens senior housing. Detroit Free Press. Accessed (March 2016): http://www.mlive.com/business/detroit/index.ssf/2014/08/troubled_move_of_seniors_from.html
Muller, D. (20 August 2014). Downtown development offers lessons for displacing low-income residents for market-rate housing. Detroit Free Press. Accessed (March 2016): http://www.mlive.com/business/detroit/index.ssf/2014/08/expertise_gleaned_from_senior.html
National Low Income Housing Coalition. (2014). 2014 Advocates’ Guide to Housing and Community Development. Washington, DC.
Perry, T. E., Wintermute, T., Carnet, B. C., Sanford, C., and Leach D. E. (2015). Senior housing at a crossroads: A case study of a university/community partnership in Detroit, MI. Draft.
Schwartz, A. F. (2006). Housing Policy in the United States: An Introduction, First Edition. Routlage, New York, NY.
Zuk, M., etal. (August 2015). Gentrification, displacement and the role of public investment: A literature review. (Working paper). Federal reserve Bank of San Francisco. San Francisco, CA.
Capital Impact Partners | May 2016 | pA
APPENDIX A: DATA NOTES
MULTIFAMILY PROPERTY INVENTORY
DESCRIPTION List of all parcels from Motor City Mapping (MCM) 2014 indicated as residential with active addresses as of the second quarter of 2015. This data was limited to the greater downtown area. MCM provides a street survey inventory of building in Detroit; trained volunteers completed it in 2014. The following data points were used for our study:
• inventory of buildings,• four+ unit classification, and• building condition.
D3 has access to Valassis data—a bulk-mailing database that tracks active addresses. The data from Q2 2015 was paired with MCM building inventory data and filtered for building with more than four active addresses.
Combining these two databases provided the most easily accessible and geo-located inventory of multifamily buildings.
DATA ACCESS Motor City Mapping Data is accessed through their web portal at: https://www.motorcitymapping.org/#t=overview&s=detroit&f=all
For this study Data Driven Detroit accessed this information and limited the data set to multifamily buildings in the greater downtown. They were then able to match that data to Valassis occupancy data through a D3 contract.
DATA ISSUES The MCM and Valassis data present a number of challenges for quantifying the number of structures and households vulnerable to displacement.
• Number of structures. The current list includesonly buildings with active addresses. Thismeans that both 711 W. Alexandrine and 680Delaware are not included in the list. Theseaddresses were dropped off the current listsince both were unoccupied and at differentstages of redevelopment. For future studiesobtaining lists for multiple quarters over timewould address this issue and also allow thetracking of addresses as they are occupied,unoccupied, redeveloped and brought backonline.
• Residential addresses. The active addresses asprovided by the Valassis data include thoseclassified as “primary residential,” “primaryresidential with business” and “primarybusiness with residential.” These addresses donot distinguish between dwelling units,property management offices and any retail orcommercial spaces also housed at a givenaddress. For example, 663 Prentis has 28dwelling units but is listed as having 29 activeaddresses, and at the Park Shelton there are289 active addresses, of which approximately230 are residential addresses. The Valassis dataprovides no detail on categorizing addresseswithin a multifamily mixed-use structure.
• Total units / occupancy rates. The addresscount listed is for active addresses only and nota number of total units within the property.Without the total units it is impossible todetermine occupancy rates. This detail isimportant in determining whether or not abuilding is a candidate for rehabilitation and inunderstanding the scale of displacement ifunder-occupied buildings are targeted forrehab. Also, in lieu of consistent buildinginspections, occupancy can serve as oneindicator of building condition.
• Building condition. MCM building condition,size and occupancy data is based on street-level observation. It is likely that this type ofevaluation will have a higher degree of error inlarge multifamily buildings than would exist forsingle-family homes. Roof conditions (due toheight), the complexity of interior systems and
the provision of accessible internal routes are all characteristics that a street-level observation cannot capture. For example, 711 W. Alexandrine (in the online dataset) ischaracterized as a building in “good” condition,although as seen in the recent rehab it hadnumerous electrical, accessibility andmaintenance issues that might put it in a “fair”or “poor” condition based on a more completeinspection. Also, 680 Delaware is shown asunoccupied with fire damage although therewere four households living in the building’sundamaged sections at the time of the survey.
DATA RESOLUTIONS • Number of structures. Since there was some
discrepancy between MCM and Valassis dataon buildings containing more than four unitsthe count used in this study included anybuilding that MCM or Valassis indicated hasfour+ units.
• Total units / occupancy rates. D3 has access tooccupancy data and has been willing to sharebased on their agreements with Valassis.Future development of the database shouldallow for closer incorporation and better use ofthis occupancy data.
HOUSING COST BURDEN DATA
DESCRIPTION From the Consolidated Planning/CHAS web portal: The U.S. Department of Housing and Urban Development (HUD) periodically receives "custom tabulations" of data from the U.S. Census Bureau that are largely not available through standard Census products. This data, known as "CHAS" (Comprehensive Housing Affordability Strategy) data, demonstrates the extent of housing problems and housing needs, particularly for low-income households. The CHAS data is used by local governments to plan how to spend HUD funds, and may also be used by HUD to distribute grant funds.
Capital Impact Partners | May 2016 | pB
DATA ACCESS The Consolidated Planning/CHAS data sets are accessed through the HUD data portal at: https://www.huduser.gov/portal/datasets/cp/CHAS/data_download_chas.html
DATA ISSUES • Vouchers and rent support. Rental rates in
CHAS are self-reported and there are nodirections on how respondents should accountfor any rental aid whether it is in the form of aHousing Choice Voucher or privately fundedprograms (like employer subsidies).
RENT COMP DATA
DESCRIPTION The rent comp data is a compilation of Midtown Detroit, Inc.’s (MDI) Rental Survey from 2011, 2012, 2013 and 2014. The datasets are based on properties participating in the LiveMidtown program and measure occupancy and price within this subset of buildings. As part of this study, we matched properties from MDI’s Development Pipeline Tracker to properties included in the rental comp database. This allows us to compare the rents in new developments with those in existing projects.
DATA ACCESS Current rental comp data can be accessed through the Midtown Detroit, Inc. (MDI) website at: http://midtowndetroitinc.org/development/maps-midtown
Archived datasets and the development pipeline data were provided directly from MDI.
DATA ISSUES • Non-random sample. The data set is neither
random nor geographically diverse. Theproperties sampled are focused on theMidtown area and are selected based onLiveMidtown and other MDI relationships.
Capital Impact Partners | May 2016 | pC
• Rental asking prices. Unit counts are notbroken down by unit size and are not suited togetting a true average of unit rents. Withoutunit counts rent price ranges within a propertycan also be misleading.
• Property condition. There is no data on otherproperty characteristics.
DATA RESOLUTIONS • Rent price ranges. An average of the minimum
and maximum asking price per unit type perproperty was used in evaluating propertieswith multiple asking prices.
These issues present themselves only when this dataset is being used to make larger conclusions about multifamily properties in greater downtown. However, it is possible that, with a few additions to the groundwork laid by MDI in conducting this survey, a much more comprehensive analysis could be completed.
PUBLICALLY SUBSIDIZED PROPERTIES
DESCRIPTION Federal subsidized and affordable housing data was accessed through the National Housing Preservation Database. This data is compiled by the National Low Income Housing Coalition and the Public and Affordable Housing Research Corporation to track federally funded affordable housing properties using HUD Project-Based Rental Assistance, Section 202 Direct Loans, HUD Insurance programs, Low Income Housing Tax Credits, HOME Rental Assistance, public housing and other rural and state programs not applicable in Detroit.
DATA ACCESS The Data is accessed through the National Housing Preservation web portal at: http://www.preservationdatabase.org/index.php
DATA ISSUES • Property characteristics. Many properties
access a variety of funding streams yetproperty specific information can vary; forexample, identifiers (address, name, etc.), andunit counts were found to vary within a projectacross funding source data sets.
• Temporary affordability extensions. There areprograms not tracked in the database. Forfederal programs the most difficult gap to trackis temporary contract extension. These may becontract extensions that preserve affordabilityduring times of transition or when longercontract renewals are being negotiated.
DATA RESOLUTIONS • Property characteristics. Downloaded property
information by project type and manuallymatched properties through cross-referencingaddress, name, owner and mapping.
• Temporary affordability extensions. These canonly be solved by tracking extensions throughcontact with local HUD offices and propertyowners.
Capital Impact Partners | May 2016 | pD
APPENDIX B: DATA
REQUIREMENTS AND SURVEY TOPICS In order to assess the effects of investment, risk of displacement and housing needs for new and existing residents reliable data is required at two levels: building or project-level data and household-level data. One is an inventory of physical assets and the second provides the detail for the residents who live in the area. The data sources used for this study do not cover all of the requirements listed below, but they have provided a baseline on which a more comprehensive dataset can be created. For more detailed information on the datasets used see Appendix A.
DATA REQUIREMENTS
PROJECT-LEVEL DATA The most important data is a complete-as-possible list of the multifamily buildings, projects and properties in greater downtown. This inventory is the base on which all other data is mapped. Creating a complete list with unique identifiers for properties places the focus of the study on property investment and management and is the framework by which occupancy and displacement can be traced. Within this inventory a number of property characteristics need to be quantified. The most important characteristics include
• location (address and parcel),• number of dwelling units,• number of occupied units,• rental costs (for rental), purchase prices (for
individually owned),• building condition,• public / private ownership,
• market rate or price controlled,• change in ownership,• capital investment, and• existing tenant association.
HOUSEHOLD-LEVEL DATA Broadly, households face market-force displacement because of a mismatch between resident income and housing costs. To capture this side of displacement it is necessary to have access to household data including
• household size,• household income, and• how long a household has lived on a property
or in the neighborhood.
Other demographic data that residents are willing to share will help build a complete understanding of which households are at risk of displacement and how relocation processes are succeeding. Some of these data points include
• household ethnicity/race,• occupation and location of employment,• means of transportation,• relocation experiences,• housing search experience,• changes in employment,• local social service use, and• involvement with community organizations.
Within any displacement study, one of the hardest data pieces to acquire is tracking households over time. While this may not be necessary to capture the mismatch of housing supply to residents’ ability to pay at any given time, it is necessary in understanding how displacement can be mitigated over time.
Delivering Social Impact in Detroit & Communities Nationwide
www.capitalimpact.org
Capital Impact Partners builds strong, vibrant communities for underserved people. A nonprofit Community Development Financial Institution, we deliver strategic financing, incubate new social ventures, and support capacity building to help ensure that low-to-moderate-income individuals have access to quality health care and education, healthy foods, affordable housing, and the opportunity to age independently.
WE HAVE DEPLOYED OVER $2 BILLION TO SERVE NEARLY 5 MILLION PEOPLE AND CREATE MORE THAN 33,000 JOBS NATIONWIDE IN SECTORS CRITICAL TO VIBRANT COMMUNITIES.
TRANSFORMING UNDERSERVED COMMUNITIES INTO STRONG, VIBRANT PLACES OF OPPORTUNITY