53
Baseline Survey of Peri-Urban Sanitation and Hygiene in Cotonou, Abomey-Calavi, and Porto-Novo, Benin APRIL 2015
Baseline Survey of Peri-UrbanSanitation and Hygiene in CotonouAbomey-Calavi and Porto-Novo Benin
APRIL 2015
About WASHplus
The WASHplus project supports healthy households and communities by creating and delivering interventions that lead to improvements in water sanitation and hygiene (WASH) and household air pollution (HAP) This multi-year project (2010-2016) funded through USAIDrsquos Bureau for Global Health and led by FHI 360 in partnership with CARE and Winrock International uses at-scale programming approaches to reduce diarrheal diseases and acute respiratory infections the two top killers of children under age 5 globally
Recommended Citation
WASHplus 2015 Baseline Survey of Peri-Urban Sanitation and Hygiene in Cotonou Abomey-Calavi and Porto-Novo Benin Washington DC USAIDWASHplus Project
Acknowledgments
WASHplus would like to express our gratitude to Alain Zomadi of Colter Ingenierie WASHplus MampE Specialist Dr Orlando Hernandez and WASHplus Benin Coordinator Armand Aguidi for the labor involved in designing and carrying out this study Thanks also to Catherine Bocher of FHI 360 for translating the document from French to English and to WASHplus Program Officer Sarah Yagoda for contributing considerably to the production of the document in both languages Finally WASHplus would like to acknowledge and thank the tireless enumerators and patient residents that participated in the study
Contact Information
WASHplus
FHI 360 COLTER Ingeacutenierie-Conseils 1825 Connecticut Ave NW 01 BP 5835 CotonouBENIN Washington DC 20009 Tel +229 ndash 21 00 79 43 2028848000 Email benincolter-iccom wwwWASHplusorg contactwashplusorg
This study is made possible by the generous support of the American people through the United States Agency for International Development (USAID) Bureau for Global Health under terms of Cooperative Agreement No AID-OAA-A-10-00040 The contents are the responsibility of FHI 360 and do not necessarily reflect the views of USAID or the United States Government
Table of Contents
Introduction 1
Survey Objectives 2
Methodology 2
Main Results of the Studyhellip 11
Housing and Family Characteristics of Surveyed Households 11
Distribution of Households by Municipality 11
Housing 12
Level of Education 12
Property Ownership of Respondents 13
Occupational Status of Heads of Households and Respondents 13
Assets Owned by Households 14
Level of Economic Well-Being 15
Household Drinking Water Supply 16
Sources of Water Supply 16
Knowledge of Methods of Water Treatment at Home 18
Water Treatment at Home 19
Storage of Drinking Water in Homes 22
Household Hygiene 23
Sanitation in Households 28
Management of Feces 28
Availability of Toilets in Households 30
Principal Reasons to Build or Not to Build Toilets 31
Observation of Household Toilets 35
Condition of Toilets 35
Psycho-Social Determinants of Latrine Ownership 36
Summary Table of Survey Indicators 38
Exposure to Information Messages on Hygiene and Sanitation Practices 42
Conclusion 44
Endnotes 45
Annex 1 ndash Population from Sampled Districts 46
List of Tables Table 1 Distribution of EA sub-EA and households surveyed by municipality borough and district 3 Table 2 List of stakeholders contacted to inform them of the study 4 Table 3 Assets used for the construction of the socio-economic index 9 Table 4 Distribution of respondents by municipality 11 Table 5 Relationship between the respondent and the head of household 11 Table 6 Distribution of respondents according to their level of education and gender 12 Table 7 Socio-professional status of the head of household reported by the women surveyed 13 Table 8 Distribution of respondents according to their socio-professional profile 13 Table 9 Assets owned by households 14 Table 10 Distribution of households by district according to their level of socio-economic welfare 16 Table 11 Proportional distribution of drinking water sources by municipality 17 Table 12 Water treatment in households according to principal source of drinking water for the household 18 Table 13 Relationship between the source of drinking water and its treatment at home 20 Table 14 Relationship between knowledge of Aquatabs and treatment of water at home 22 Table 15 Circumstances of rinsing (simple wash) or washing hands (wash with soap) in households according to respondentsrsquo own statements 24 Table 16 Percentage distribution of hand washing stations in several locations in the house and supplies observed by location (N=856) 26 Table 17 Key moments of the day to wash hands 27 Table 18 Factors motivating hand washing in households 27 Table 19 Distribution of households according to the person responsible for installing latrines and the title of ownership of the house 30 Table 20 Household opinions on latrine ownership 37 Table 21 Key indicators by household socio-economic level 38 Table 22 Presentation of key indicators by municipality 39 Table 23 Presentation of indicators by municipality and household socio-economic levels 40
List of Figures Figure 1 Distribution of households by source of water supply 17 Figure 2 Distribution of respondents according to their knowledge of methods to treat drinking water 19 Figure 3 Distribution of households according to methods of household water treatment 20 Figure 4 Distribution of households according to storage containers used for drinking water 22 Figure 5 Distribution of households by most commonly used type of soap 23 Figure 6 Distribution of households by places of defecation by children under the age of 3 28 Figure 7 Distribution of households by place of defecation for family members 29 Figure 8 Distribution of households by location of toilets in the household 31 Figure 9 Distribution of households according to principal reasons for building the toilets 32 Figure 10 Distribution of households by principal reasons for not building latrines 32 Figure 11 Distribution of households by reasons for dissatisfaction in the use of a latrine 33 Figure 12 Distribution of households by reasons justifying the feelings of satisfaction of households that use the latrine 34 Figure 13 Results of the assessment of latrine maintenance components in observed latrines 36 Figure 14 Distribution of households having received information on hand washing by source of information 42 Figure 15 Distribution of households who received information on water treatment by source of information 43 Figure 16 Distribution of households having received information on sanitation by source of information 43
ACRONYMS
EA Enumeration Areas
GHI Global Health Initiative
INSAE National Institute of Statistics and Economic Analysis
JMP Joint Monitoring Programme
NGO Nongovernmental Organization
RGPH General Population and Habitat Census
SONEB Socieacuteteacute Nationale des Eaux du Beacutenin
WASH Water Sanitation and Hygiene
Introduction Worldwide diarrheal diseases cause over 15 million deaths per year mostly in children under 5 years of age (Boschi-Pinto 2008) Benin is no exception
Lack of safe drinking water and sanitation and inadequate hygiene are the principal global causes of diarrheal diseases estimated at 4 billion annually 25 million Beninese use unimproved or shared latrines and 52 million do not have any latrine and defecate outdoors (WSP 2012)
Joint Monitoring Programme (JMP) estimates in 2010 for the water sanitation and hygiene (WASH) sector in Benin indicate better access to water than to sanitation for the entire country Only 25 percent of households relied exclusively on unimproved or surface water sources However 56 percent of households defecate in the open This means that throughout the country lack of access to sanitation was twice as high as the lack of access to safe drinking water sources According to the same source urban areas were as we might expect generally better served than rural areas But the data reported to JMP still indicate that 28 percent of households in urban areas defecate in the open
Benin is a country with rapid urban growth whose urban population will soon reach 50 percent of the entire population By rural exodus and immigration people come in a continuous flow and settle in crowded andor flood-prone peri-urban areas in the coastal south They build unplanned urban settlements along the entire length of the coast up to and even beyond Porto-Novo Among the effects of this uncontrolled urbanization blocked drainage of rainwater to the lagoons and the sea flooding and lack of safe drinking water and access to sanitation Seasonal cholera is an annual reality and in 2010 became a humanitarian disaster
Diarrhea and malnutrition are closely related to the extent that one exacerbates the other In addition UNICEFBenin recently announced that the majority of unvaccinated children under the age of 5 live in urban areas
Almost no WASH data exist for the unplanned peri-urban areas and the poorest neighborhoods of Cotonou Abomey-Calavi and Porto-Novo Given the health impact on households without access to water sanitation and hygiene it is critical to obtain a better understanding of the magnitude of the problem in these areas This information will help develop a strategy to improve water supply and sanitation as well as hygiene practices which will lead to the improvement of the health status of poor households in urban areas
It is in this context that this household survey was implemented in three peri-urban areas of the cities of Cotonou Abomey-Calavi and Porto-Novo to generate the information needed to design such a strategy
USAIDBenin funded this study through the global USAIDWASHplus project As part of its health sector strategy and in accordance with the achievement of Millennium Development Goal 7 USAIDBenin launched a five-year program known as the Global Health Initiative (GHI) in October 2012 The target population of GHI will include urban and peri-
Benin Baseline Survey of Peri-Urban Sanitation and Hygiene 1
urban populations from Cotonou Abomey-Calavi and Porto-Novo as it has been shown that vulnerable groups in these areas have less access to basic health services than rural populations in Benin
Survey Objectives
The overall objective of this survey is to measure access to drinking water and sanitation facilities and to assess the basic hygiene practices of urban and peri-urban populations
Specifically it will determine
The proportion of households using an improved sanitation facility
The proportion of households in which there is a hand washing device near a toilet equipped with water and soap
The proportion of households in which there is a hand washing device near the kitchen equipped with water and soap
The proportion of households who treat drinking water correctly
The proportion of households who store treated drinking water correctly
Methodology
Overall Sampling Strategy The WASHplus program coordinator in Benin established a list of peri-urban districts in Cotonou Porto-Novo and Abomey-Calavimdashcoordinated with USAIDBeninrsquos intended GHI target neighborhoodsmdashusing a census of flood prone zones According to the study protocol eight districts were to be selected However the initial census identified a total of 10 districts some of which had only four or five enumeration areas (EA) It was therefore decided to include all areas in the study
From this list of districts and with the help of the National Institute of Statistics and Economic Analysis (INSAE) an exhaustive list of EAs from the General Population and Habitat Census of 2012 was established Thus a total of 37 EAs was obtained With this list the COLTER IC team contacted INSAE in accordance with the recommendations of the National Statistical Council1 to obtain the number of households in each EA The number of households per EA ranged between 96 and 785 To facilitate creating a grid pattern for data collection teams EArsquos whose size exceeded 200 households were divided in half or more This resulted in reasonably sized geographical areas for the identification and selection of households In the field EA maps were then divided according to this information However given the lack of clarity2 on the exact location of households WASHplus decided to select h ouseholds based on the systematic method
1 The protocol for this study has been validated by the Benin National Statistical Council (Conseil National de la Statistique du Benin) before its submission to the National Ethics Committee for Health Research of the Institute of Advanced Biomedical Sciences (Comiteacute National drsquoEthique de la Recherche en Santeacute de lrsquoInstitut des Sciences Biomeacutedicales Avanceacutees (ISBA)) 2 Given that the census was just completed the data are not yet entered However the totals have been calculated giving an exact idea of the number of households in the EA
Benin Baseline Survey of Peri-Urban Sanitation and Hygiene 2
Thus for each sub-EA the total number of households was divided by 10 to obtain the sampling interval or standard interval between participants A random number between one and the sampling interval was selected This number was used as the number of the first household selected The following households were selected by adding the sampling interval in succession Investigators were instructed to clean their sub-EA systematically to be able to crisscross the area well and to ensure that all households had a chance to be selected In the end 10 households by sub-EA were drawn Random selection makes it possible for the sample to represent the diversity of households that may exist in the population even if each sample drawn from a given population has a reality gap vis-agrave-vis the areas of interest Every sample is likely to confront this gap
The following table shows the distribution of districts and enumeration areas of the three cities in the study as well as the number of households drawn by EA It is important to bear in mind that the size of the sample does not have to represent a percentage given to each enumeration area The sample size is calculated on the a ssumption that the sample reflects the estimated percentage of households in a peri-urban population that would have a selected location for washing hands Given the available information it was estimated that this percentage would be around 65 percent so we wanted this percentage to be reflected in our sample This calculation was made using the 20 software CSurvey with a margin of error of 5 percent which means that the actual population value could vary between 60 percent and 70 percent Similarly for this calculation a cluster effect of 20 was estimated which required a doubling of the number of households to be surveyed Finally we chose a confiden ce interval of 95 percent This means we accept a 5 percent margin of error on the probability that the result is false
Table 1 Distribution of EA sub-EA and households s urveyed by municipality borough and district
Benin Baseline Survey of Peri-Urban Sanitation and Hygiene 3
Municipality Borough District EA Sub EA
Households surveyed
Total
Cotonou 1st Avotrou 10 19 190
349 2nd Minontchou 4 6 60
6th Ladji 4 10 100
Porto-Novo 1st Accron 2 9 88
1st Avassa 1 4 40
351 1st Houeacuteyogbeacute-
Gbeacutedji 2 9 91
3rd Foun Foun Tokpa
3 13 132
Abomey-Calavi Abomey-Calavi
Tokpa Zoungo
6 6 60 155
Godomey Togoudo (lakeside)
2 2 20
Akassato Akassato (lakeside)
3 8 75
TOTAL 37 85 857 855
The estimated population in the districts selected for the sample is presented in Annex 1
Practical Implementation of the Survey
Preparatory Activities
Test and proofreading of questionnaire
The field survey was carried out using a questionnaire divided into five sections Section 1 addresses issues related to housing and family characteristics section 2 addresses issues related to water section 3 deals with issues related to hygiene section 4 addresses issues related to sanitation and section 5 addresses issues related to householdsrsquo exposure to information about hand washing treatment of drinking water sanitation and the respective sources for this information The questions were reviewed and some were reformulated to ensure a better understanding Also the questionnaire was translated into two local languages Fon and Yoruba
Information about authorities and populations
Before the implementation of field activities a process of informing all concerned stakeholders was conducted Thus the research team formally approached local authorities (neighborhood or village chiefs) from the selected study EAs and requested their cooperation
Various measures of information and sensitization of communities covered by the survey were also implemented to promote the acceptance of the field work which greatly reduced the reluctance of populations during the investigatorsrsquo visits
The following table presents the list of key stakeholders who received information about the planned study
Table 2 List of stakeholders contacted to inform them of the study
Benin Baseline Survey of Peri-Urban Sanitation and Hygiene 4
Ministry of Health issued the authorization to conduct the study
INSAE studied the protocol and issued scientific approval
The Ethics Committee examined the protocol and issued ethical approval
District delegates informed of the study and appointed people to help investigators identify the boundaries of the areas
Recruitment of data collectors
Sixteen data collectors were selected for this study (men and women) with at least high school (BAC) + 2 years in one of the social sciences and speakingwriting ability in the languages currently spoken in the three cities covered by the study The 16 data collectors were selected from 20 candidates preselected on the basis of their curriculum vitae their field experiences their tested psychometric skills (teamwork attendance work quality good investigator skills openness and initiative availability etc) and their experiences regarding household surveys
Qualifications for team leaders included a minimum of a high school diploma (BAC) + 4 years that COLTER ICrsquos database of employees identified as having proven experience in similar studies The Mission Chief held an interview with each one to ensure their availability for the duration of the study
Training of data collectors and pretest of questionnaire
The training of data collectors took place in Cotonou and ran four days under the supervision of the principal investigator The training agenda included the context of the survey questionnaires sampling procedures for households at cluster level and collection methodology The first two days of training were devoted to methodological and ethical aspects the study of questionnaires the reading of EA cards individual and pair practice using questionnaires and translation of questions into local languages (Fon and Yoruba) At this stage the questionnaires were carefully studied to allow participants to familiarize themselves with the content
A pretest in the field of all the survey procedures was scheduled on the third day of training in three EAs3 of Cotonou All participants in this exercise were divided into three different teams according to their tasks in the field (data collectors or team leader)
During the pretest three EAs were identified and household members of selected clusters surveyed Each team practiced trying to find the selected households conducting interviews and applying the methodological procedures After the pretest the length of administration of the questionnaire was reassessed
The fourth and final day of training was devoted to a debrief of the pretest the integration of observations on the questionnaires for finalization final selection of 16 data collectors and practical arrangements for arrival in the field
During this process 20 preselected data collectors were given two assessments the first after the second day of training and the second following the pretest (fourth day) The top 16 were selected as members of three data collection teams and the others were placed on the waiting list in case of any potential dropouts
In addition to the information provided at this training other handouts such as the investigatorrsquos manual the team leaderrsquos manual EA cards and chlorine test kits facilitated the participantsrsquo understanding of various presentations made by the training consultants
3 These EAs were not selected for the survey
Benin Baseline Survey of Peri-Urban Sanitation and Hygiene 5
Establishment of field teams and roles of data collection staff
The teams from Cotonou and Abomey-Calavi were each composed of five data collectors and one team leader and the one in Porto-Novo had six data collectors and one team leader
The team leadersrsquo role was to
o Inform local authorities of the arrival of the team in the area
o Ensure that the data collectors have the necessary equipment in sufficient quantities (questionnaires and accessories) before arrival in the field
o Provide an interface between the data collectors and the home office
o Coordinate team travel logistics
o Develop a daily schedule in line with the travel schedule and difficulties encountered in the field
o Assign to each agent the area to survey
o Supervise data collection that is monitor how the collectors conduct interviews and overcome any difficulties encountered in the field
o Ensure that the data collectors stay within the boundaries of the survey
o Check the questionnaires and provide updates during the daily debriefing
o Keep a field journal and report progress and difficulties encountered to home office
o Make sure that the questionnaires are packed up by cluster and transmitted to COLTER IC staff
As for the data collectors it was their responsibility to
o Find the households of the EA to survey
o Administer questionnaires to cluster households
o Follow the team leaderrsquos instructions
o Participate in daily meetings
o Contact the team leader in case of problems
o Follow the methodology used for the study
o Ensure the completeness of the questionnaire
Data Collection
Identification and location of survey areas
At this stage the team leader conducted the complete identification of the EA including boundaries and important identifiers He made sure that all team members could orient themselves properly Once the limits of the EA were correctly identified and under the
Benin Baseline Survey of Peri-Urban Sanitation and Hygiene 6
supervision of the team leader the team conducted the enumeration of households To do this the EA was divided among the different team members and they went to each house or compound to identify the number of family members living there They collected the name of the head of household and the number of people in the household Once the team leader had an exhaustive list of households in the EA he then proceeded to select participating households Below are the steps taken to systematically select 10 households among all households of the EA
o The first step is to calculate the sampling interval (ratio of total number of households in the EA divided by 10)
o Proceed with random selection of the first household to survey (draw a number between 1 and the sampling interval)
o After each selection add the interval to determine the next household to survey
o Repeat until you have selected 10 households to survey
In the event that a household selected according to the sampling interval was not available it was replaced by the household that followed immediately in the enumeration list Similarly if this last one was not available it was replaced by the household that followed immediately on the list until completion of the interview The household to interview next was the one retained by the application of the sampling interval
It is only when the data collectors clearly identified the scope of the survey (cluster of 10 households) that they could proceed with the interviews applying the standards that they were taught to respect Team members divvied up the selected households in the EA and surveyed them one after the other Each data collector surveyed an average of five households per day
Travel procedures for data collectors
Members of a same field team traveled together Once the list of households had been finalized in a particular EA they proceeded to collect data in all selected households before tackling another enumeration area
Using the questionnaire
Household interviews used a structured questionnaire The questionnaire is available separately The data collector first obtained consent from the head of household or his representative She then proceeded to conduct the interview and fill in the questionnaire
To be eligible for this survey respondents needed to meet the following requirements
o Be the wife of the household head the household head or his representative
o Be at least 18 years old
o Live in one of the districts selected for the study
For the most reliable results in the field all efforts were made for the selected households to be interviewed with up to two follow-up visits if all household members were absent before replacing the selected household
Benin Baseline Survey of Peri-Urban Sanitation and Hygiene 7
Data Management and Quality Control
Each data collection staff member received a unique identifier Each team received all maps of clusters it had to visit These maps identified the precise boundaries of each cluster to visit Data were collected via the questionnaire At the end of each interview the data collector verified the completeness of information as well as the skips The households surveyed have a unique identifier to ensure confidentiality of data Each evening a debriefing of the data collection was done and filled out questionnaires were sent to team leaders to verify Questionnaires from each cluster were put together packaged and sent to staff from COLTER IC Staff verified 10 percent of questionnaires by city and made recommendations to team leaders who passed them to their collection teams for implementation
Ethical Considerations
The present study was conducted in accordance with fundamental ethical principles such as respect for the person honorable intentions4 and fairness The survey data are treated as anonymous and confidential Also the participation of all respondents was strictly voluntary People visited were free to accept or refuse to participate in the administration of the questionnaire During training of field staff emphasis was placed on the need to obtain informed consent of the respondents and to avoid any form of coercion Through the support and supervision of team leaders complete confidentiality of interviews was guaranteed The circular and the consent form were read in the respondentrsquos language and a copy was provided to the participating households
Difficulties
Apart from small difficulties inherent in any data collection exercise (eligible persons not at home unavailability of respondents reluctancehellip) rain presented the main difficulty Data collection took place in the small rainy season which had some minor impact on data collection However these disturbances have in no way undermined the quality of data collected
Entry and Data Cleaning
Ten agents were screened to perform data entry using the EpiData 31 software They received a day of training after which the top eight were selected The input operation itself (first and second input) lasted 10 days At the end of the second entry a comparison of the two bases was conducted to highlight differences in the records We then compared the two records to the physical data in the questionnaire and proceeded to correct the erroneous base The same process was applied each time that the same questionnaire was recorded differently in the two bases
At the end of the first data cleaning the data were exported to the SPSS software to control for consistency and completeness To this end a quality assurance program was designed to verify the internal consistency of responses according to the logic of the questionnaire The
4 Adhering to the best interests of the study while at the same time avoiding putting it in danger or at risk (moral
social financial etc)
Benin Baseline Survey of Peri-Urban Sanitation and Hygiene 8
quality assurance program was applied to the database and all data entries were checked cleaned and corrected This allowed for a more efficient cleaning as shown in this screenshot
Image 1 Sample of cleaning program
Source Data cleaning program from the Enquecircte de Base en Hygiegravene Peacuteri Urbaine et Sanitaire au Beacutenin COLTER IC 2013
Data Analysis
Data analysis followed several steps to comply with the clientrsquos needs First we examined the sociodemographic characteristics of heads of households who responded to the questionnaire This allowed us to know their profile as well as the characteristics of households Next based on the assets owned by the household we used principal component analysis to create a socio-economic index with three categories (lower middle and upper) The list of assets used to construct the index appears in the table below The weight of each asset is shown This weight varies between 0001 and 0999 Only assets with a weight higher than 030 were included in the index A score was assigned to each household based on its assets The distribution of these scores was used to create categories with an equivalent number of respondents by level Thus a third of respondents were in the low category another third in the middle category and the rest in the upper category
Table 3 Assets used for the construction of the socio-economic index
Assets Weight of goods in the construction of the index
Fan 0802
Gas stove 0754
Benin Baseline Survey of Peri-Urban Sanitation and Hygiene 9
DVDCD player 0745
Dishdecoder 0738
Electric iron 0700
TV set 0674
Computer 0594
Hi-Fi 0513
Cartruck 0498
Motorcycle 0452
Radio 0450
Improved stove 0281
Kerosene lamp 0073
Two types of data analysis were performed descriptive and inferential In the descriptive phase all variables were considered to give researchers an idea of the distribution of responses The analysis in this phase permitted the building of a profile of study participants from socio-demographic variables such as gender age socio-professional status ownership status characteristics of housing property ownership etc In this phase we also addressed variables such as access to water sanitation and facilities for hand washing with soap some knowledge of hygiene practices and access to sources of information on WASH One objective of this analysis was to establish the baseline for WASH indicators that the WASHplus project typically follows In the inferential phase some variables were crossed to better understand the WASH situation in peri-urban areas of Cotonou The reader will find the results of these analyses in sections that follow The results are presented in three sections household and family characteristics key program indicators and other variables of interest
Benin Baseline Survey of Peri-Urban Sanitation and Hygiene 10
Main Results of the Study
Housing and Family Characteristics of Surveyed Households
Distribution of Households by Municipality
Table 4 Distribution of respondents by municipality
Municipality Sex of respondent Number of households surveyed
Women Men
Cotonou 311 38 349
Porto-Novo 315 37 352
Abomey-Calavi 135 20 155
Total 761 95 856
The table above shows the distribution of households by municipality In Cotonou from the random selection made households visited were in the 1st 2nd and 6th boroughs in Porto-Novo they were in the 1st and 3rd boroughs and in Abomey-Calavi in the boroughs of Godomey Abomey-Calavi and Akassato
The surveyed population consists of 889 percent women and 111 percent men These men for the most part heads of households were surveyed because women were absent during data collection visits Most survey questions relate to objective data (eg water source ownership of property latrine etc) Some variables were collected via observation (eg presence of necessary supplies for washing hands) We felt that these data could be provided by either the husband or the wife Moreover our experience shows that women are generally better informed on matters related to WASH Approximately 19 percent of women surveyed called themselves ldquohead of householdrdquo The distribution of relationships between the women surveyed and the head of household appears on the following table
Table 5 Relationship between the respondent and the head of household
Relationship between the female respondent and the head of household
Proportion
(N=761)
Declared herself to be head of household 187
Wife of head of household 725
Daughter of head of household 60
Sister of head of household 11
Mother of head of household 05
Daughter-in-law of head of household 05
Benin Baseline Survey of Peri-Urban Sanitation and Hygiene 11
Other relationship 07
Total 1000
Housing Nearly three-quarters (744 percent) of households visited live in compounds (housing for large or extended families) just over one-fifth (213 percent) live in detached houses and only 35 percent of households live in apartments
Nearly nine out of 10 households (864 percent) have brick walls for the main room Only a tiny portion of households have walls made of mud brick (51 percent) of bamboo (36 percent) or of wood (21 percent) respectively
With regards to the roof of the housing the most common types of materials are sheet metal (911 percent) concrete slabs (61 percent) and tile (22 percent) respectively
Materials used most for the floor of the main room are cement (887 percent) tiles (65 percent) and sand (28 percent)
Level of Education Nearly three respondents out of five (586 percent) are educated Table 6 below shows the educational level of respondents according to the highest level attained
Table 6 Distribution of respondents according to their level of education and gender
Level of education
Sex of the respondent Total percentage
(N=856) Women Men
Uneducated 443 179 414
Primary 258 274 259
Secondary (lower) 148 179 152
Secondary (second cycle) 83 147 90
Higher 68 221 85
Total 1000 1000 1000
This table shows that 414 percent of respondents have no education 259 percent have primary level 242 percent have secondary level and 85 percent have a higher education Only 471 of the respondents know how to read and write It also shows that men have reached a higher level of education more frequently than women respondents (Chi2=418 p=00)
Benin Baseline Survey of Peri-Urban Sanitation and Hygiene 12
Property Ownership of Respondents The majority (546 percent) of surveyed households owned the houses in which they live a little over one-third (343 percent) rents and 111 percent are hosted5
Almost all renters (98 percent) pay their rent monthly Whether tenants or owners 272 percent of households made their decision to live in their home based on access to water and a latrine But 638 percent of households decided to live in their home for reasons other than access to water andor a latrine The homes of two out of five households surveyed (41 percent) are flooded during the rainy season but only 122 percent are able to move during the rainy season
Occupational Status of Heads of Households and Respondents Table 7 shows the distribution of professions practiced by the heads of households according to women respondents who do not consider themselves heads of households
Table 7 Socio-professional status of the head of household reported by the women surveyed
Profession Proportions ()
(N=714)
Laborer 412
Civil servant 174
DriverTaxi-Moto 116
Small business owner 84
Store employee 84
Retailer 80
Fisherman 25
Other 25
Total 1000
During the last 12 months preceding the survey 941 percent of respondents had a job that earned a salary This situation has improved and 984 percent of persons surveyed during the study had a job at that time Table 8 below shows the socio-professional profile of the respondents
Table 8 Distribution of respondents according to their socio-professional profile
Profession Proportions ()
(N=856)
Laborer 370
5 They live in someone elsersquos home for free
Benin Baseline Survey of Peri-Urban Sanitation and Hygiene 13
Civil servant 160
Retailer 158
DriverTaxi-Moto 99
Store ownersmall business 85
Employee in a store 26
Housekeeper 13
Employee in a restaurant 07
Housewife 05
Other 77
Total 1000
A little over a third of people surveyed for this study are laborers (37 percent) followed by civil servants (16 percent) retailers (158 percent) taxi-moto drivers (99 percent) and small business owners (85 percent) Other trades were recorded in relatively low proportions
In regards to which member of the couple contributes most to the familyrsquos income regardless of the source in 768 percent of households men have the highest income compared to only 223 percent of households for women
Assets Owned by Households Table 9 shows the assets owned by the households surveyed They are organized in three categories (leisure utility and transportation) In each category the goods are shown in descending order of frequency
Table 9 Assets owned by households
Types of Assets Assets owned Proportion of households ()
N = 856
Radio 821
DVDCD player 505
Leisure goods Television set 667
Satellite dishdecoder 208
Hi-Fi 10
Video recorder 75
Utilitarian goods Mobile phone 955
Improved stove 525
Benin Baseline Survey of Peri-Urban Sanitation and Hygiene 14
Types of Assets Assets owned Proportion of households ()
N = 856
Kerosene lamp 446
Fan 403
Gas stove 223
Electric iron 182
Refrigerator 98
Computer 96
Generator 35
Fixed telephone line 18
Washer 04
Motorcycle 640
Transportation goods Cartruck 100
Bicycle 48
Boatcanoe 19
The most frequently owned household asset is the mobile phone (955 percent) regardless of its use (private or professional) Radio and television are available in just over four out of five households (821 percent) and in two out of three households (667 percent) respectively Half (505 percent) of the households surveyed have a DVDCD player Regarding transportation 64 percent of households have a motorcycle 10 percent have a car or truck 48 percent a bicycle and 19 percent a boat or a canoe For cooking the improved stove is used by 525 percent of households against 223 percent using a gas stove
Although 446 percent of households have kerosene lamps it should be noted that 738 percent of households use electricity from SBEE (utility) as their main source of lighting Households also own other goods such as fans (403 percent) satellite dishes (208 percent) electric irons (182 percent) Hi-Fis (10 percent) computers (96 percent) refrigerators (98 percent) and video recorders (75 percent)
Level of Economic Well-Being The level of household economic well-being was calculated from asset data (radio television Hi-Fi satellitecable box VCR DVDCD player refrigerator gas stove computer) using principal components analysis A quality weight (or score) was assigned to each of these assets and housing characteristics and generated from a principal component analysis These scores have been standardized according to a standard normal distribution with mean 0 and standard deviation 1 The total score was calculated for each household and individuals were
Benin Baseline Survey of Peri-Urban Sanitation and Hygiene 15
ranked according to the total score of the household in which they reside The population sample was then divided into thirds each tertile corresponding to a level ranging from 1 (the poorest) to 3 (the richest) Table 5 presents the results of the distribution of households by districts according to their socio-economic level
Table 10 Distribution of households by district according to their level of socio-economic welfare
Municipalities Districts Socio-economic level
Lower Middle
Upper
Abomey-Calavi
Akassato (Houekegbo) 571 286 143
Akassato (Houekehonou) 456 426 118
Godomey-Togoudo (cocircteacute lac)
100 400 500
Tokpa-Zoungo 283 383 333
Total Abomey-Calavi 348 400 252
Cotonou Avotrou 69 307 624
Ladji 440 420 140
Minontchou 183 267 550
Total Cotonou 195 332 473
Porto-Novo Accron 489 341 170
Avassa 409 364 227
Founfoun Tokpa 424 242 333
Houeacuteyogbeacute-Gbegravedji 523 295 182
Total Porto-Novo 463 295 241
Household Drinking Water Supply
Sources of Water Supply
Access to drinking water is an important requirement for good hygiene in households The water used in households surveyed in the study came from several sources (Figure 1)
Benin Baseline Survey of Peri-Urban Sanitation and Hygiene 16
-
=
Figure 1 Distribution of households by source of water supply
Three sources of water are frequently used by households piped water that comes into a neighborrsquos house (484 percent) a public water tap or hydrant (224 percent) and water piped into the respondentrsquos house (21 percent) Other water sources including unprotected wells (47 percent) are also used by households in relatively small proportions
The following table shows the distribution of water sources by municipality This information is presented as information only because the sample size does not allow us to generalize by municipality
Table 11 Proportional distribution of drinking water sources by municipality
Water sources Abomey Calavi
N 155
Cotonou
N =349
Porto-Novo
N =352
Pipe at neighborrsquos house 155 341 770
Public pipe 568 292 06
Pipe at the house 32 367 134
Unprotected well 116 00 62
Artesian wellborehole equipped with a pump
103 00 00
Protected well 26 00 23
Water from protected source 116 00 62
Rainwater 00 00 03
Benin Baseline Survey of Peri-Urban Sanitation and Hygiene 17
Total 100 100 100
More than nine out of 10 households (937 percent) pay for drinking water Among them 949 percent pay for water based on volume compared to only 51 percent who pay a fixed monthly sum
According to households surveyed water is bought by basin (427 percent) by bucket (275 percent) by jerry can (134 percent) and by cubic meter (163 percent) when it is bought directly from the Socieacuteteacute Nationale des Eaux du Beacutenin (SONEB) In the three municipalities SONEB provides drinking water in nine households out of 10 (915 percent) It should be noted that households that obtain drinking water from neighbors also buy it from them In other instances the heads of household and the homeowners were also cited as distributors to a lesser extent (55 percent) when drinking water is from a well
In households other water sources are used for needs other than drinking (for example to wash hands cook and other household tasks) Of more than 10 sources cited by households water from protected surface wells (182 percent) and those of unprotected surface wells (57 percent) are the most utilized
To make water potable certain households (58 percent) use methods to treat water at home Household practices for treating drinking water are shown in the Table 12 below
Table 12 Water treatment in households according to principal source of drinking water for the household
Principal source of drinking water for the household of households that reported treating
their drinking water
A pipe that comes into the house 33
A pipe that comes into the house of a neighbor 31
Public water tap public water hydrant 83
Borehole equipped with a pumpartesian well 62
Protected well 333
Unprotected well 250
Water from unprotected source 00
Rainwater 00
Knowledge of Methods of Water Treatment at Home To measure the general knowledge of drinking water treatment methods at home we asked the households to cite the methods that they know
Figure 2 below shows responses from the respondents
Benin Baseline Survey of Peri-Urban Sanitation and Hygiene 18
Figure 2 Distribution of respondents according to their knowledge of methods to treat drinking water
In data from Figure 2 it is clear that the two most known methods of household water treatment were boiling (328 percent) and using Aquatabs and other effervescent products (54 percent) Methods such as the use of coagulantflocculants (153 percent) and cloth filters (72 percent) are known in relatively small proportions The category ldquootherrdquo takes into account products such as kaolin charcoal permanganate etc (96 percent)
Water Treatment at Home Only a minority of households (58 percent) treat water at home so that it is potable No statistical association has been found between household water treatment and socio-economic group (Chi2=086 p=065) Reasons given by these households for treating water are rooted in beliefs and not in true knowledge about water quality These include campaign messages promoting health (426 percent) household habit of treating drinking water (404 percent) having the treatment product at home (21 percent) and the fact that it is largely accepted that the sources of water are not safe for drinking without treatment (213 percent)
On the other hand those who donrsquot treat the water evoke reasons such as the lack of information on water treatment (58 percent) no tradition of having treated water at home (55 percent) unavailability of a treatment product (07 percent) the water source is considered to be clean and therefore it does not need to be treated before drinking (852 percent) and no reason (22 percent)
During the survey households were asked who treats the water and what treatment methods are used Figure 3 shows methods of treatment used by households
Benin Baseline Survey of Peri-Urban Sanitation and Hygiene 19
Figure 3 Distribution of households according to methods of household water treatment
There is a statistical relationship between the source of drinking water and treatment practices Households who use a pipe private or public tend not to treat water In addition those who use an artesian well or a borehole with pump an unprotected well or surface water tend to treat The relationship between these two variables source of water and treatment of water is shown in the following table The relationship is statistically significant or Chi2 value is 528 and the probability of 00 However 85 percent of households who have not treated their water report that they donrsquot do it because the source provides safe water to drink and therefore the need to treat the water does not exist Only 5 percent say they have never treated drinking water at home and 6 percent reported not being aware that they needed to treat it That is to say they tend to trust the source Furthermore no statistical relationship was detected between household water treatment and socio-economic level (Chi2=086 p=065)
Table 13 Relationship between the source of drinking water and its treatment at home
Source of drinking water Treatment of drinking water Total
(N=854) No (N=804)
Yes (N=50)
Pipe at home at the neighborrsquos or a hydrant
715 380 696
Artesian wells 219 320 225 Unprotected wells 19 20 19 Protected wells 10 80 14 Unprotected source 37 200 47 Total 1000 1000 1000
Benin Baseline Survey of Peri-Urban Sanitation and Hygiene 20
Three out of four households (74 percent) use effervescent chlorine tabletsAquatabs for water treatment Other methods are used by less than one household out of 10 The ldquoother category includes products such as kaolin (6 percent)
However it should be noted that all methods used are not effective to purify water Among the many methods reported being used by households only three are able to treat water (if used correctly) boiling liquid chlorine or effervescent chlorine tablets (including Aquatabs)
Boiling is a traditional method of treating water This method if used correctly can provide safe drinking water to a household that has no other option Boiling will kill pathogenic germs but it doesnrsquot have a lasting effect Therefore if the water is not properly handled it can be recontaminated Boiled water should therefore be safely stored and used within one to two days
As for chlorination it is a simple and effective way to disinfect water It consists of introducing chlorine products (chlorine tablets bleach) into water to kill any micro-organisms it may contain After a contact time of about 30 minutes water is considered safe It remains safe for a few hours or days (depending on storage conditions) with the residual chlorine
Thus of the small minority of respondent households 58 percent (50856) that treat water at home 82 percent (4150) use effective treatment methods6 However the results of residual chlorine tests made in households that treat water show that only 76 percent (3850) of these households used chlorination We found that the average concentration of chlorine in water is 349 mgl which seems very high given the fact that according to the World Health Organization (WHO) concentration of free chlorine in treated water should be 02 to 05 mgl It is likely that over-chlorination is occurring due to chlorination of tap water which in principle is already chlorinated Also note that the average number of days during which households continue to drink the treated water is 64 days Poor water treatment practices were observed in a minority of households (8 percent) (1650) that mix treated with untreated water whenever they replenish the water in the container Only 46 percent (39856) of households from the three municipalities treat drinking water properly
There is a statistical relationship between knowledge of Aquatabs and its use Those who know of Aquatabs are more likely to use them This relationship is significant so that Chi2=192 and p=000 This relationship is shown in the following table
6 Meaning when all required steps are respected
Benin Baseline Survey of Peri-Urban Sanitation and Hygiene 21
Table 14 Relationship between knowledge of Aquatabs and treatment of water at home
Report knowing about Aquatabs as a known method for home treatment of drinking water
Home treatment of drinking water Total
Yes
(N= 804)
No
(N =50)
Yes 840 521 460
No 160 479 540
Total 100 100 100
Storage of Drinking Water in Homes All efforts to make water safe to drink are useless if it is not stored or handled properly During the survey information was collected on the conditions of storage and handling of drinking water Several containers are used by households to store drinking water (Figure 4)
Figure 4 Distribution of households according to storage containers used for drinking water
Buckets (722 percent) containers below or above 25 L (165 percent) and clay jars (86 percent) are the most used by households for storing drinking water
From the results of observations made by data collectors in households it appears that in the overwhelming majority of cases the containers used are closedcovered (965 percent) with tight fitting lids (925 percent) clean on the outside (866 percent) and out of reach of animals (936 percent) Only 06 percent of vessels observed had a tap
Benin Baseline Survey of Peri-Urban Sanitation and Hygiene 22
Looking at households where the container used to store water is both closed with a tight fitting lid and clean on the outside and out of reach of animals we realize that 735 percent of households in the three municipalities store their drinking water properly
There is a statistical relationship between the use of a covered container to store water and socio-economic status as the use of a cover goes from 938 percent in the lower socio-economic group to 971 percent in the intermediate group and 989 percent in the higher group (Chi2=111 p=00) Also we found a statistical relationship between the use of a tight-fitting lid and socio-economic status The presence of a tight-fitting lid goes from 871 percent in the lower socio-economic group to 909 percent in the intermediate group and 989 percent in the upper group (Chi2=277 p=00)
Household Hygiene
The practice of hand hygiene is central to household hygiene in general The key behavior of hand hygiene is washing hands especially with soap Within households visited data have been collected on the availability and the various uses of soap Nearly 94 percent of households visited had soap available at the time of the interview The following chart provides information on the most commonly used types of soap in most households7
Figure 5 Distribution of households by most commonly used type of soap
In almost all households (985 percent) soaps used are purchased by the head of household or hisher spouse The soap purchased is used to wash clothes (986 percent) to bathe (952 percent) wash children (631 percent) wash the buttocks of children (91 percent) wash the hands of children (119 percent) wash hands after using the toilet (359 percent) wash hands before feeding children (118 percent) wash hands before cooking (131 percent) and wash hands before eating (263 percent)
Hand washing is a practice that surveyed households are very aware of but regrettably the act of washing hands with soap and water is not yet a regular habit for many people and children are not properly taught to use soap to wash their hands
7 We do not have information on the usage of each type of soap as this was not a question posed
Benin Baseline Survey of Peri-Urban Sanitation and Hygiene 23
-
We recognize that researching hand washing is a challenge as some respondents tend to report what is expected socially instead of reporting actual practice A way to address this challenge is to ask people how often hand washing is practiced in different circumstances Table 15 shows the distribution of respondentsrsquo answers when asked to use four types of frequency for each circumstance never sometimes often and always In addition we wanted to study the difference between the practice of rinsing hands without using soap and the practice of washing hands where soap is used The comparison between rinsing and washing is also presented in Table 15 This table shows us respondentsrsquo own statements about rinsing and washing at critical circumstances to avoid diarrhea For example 678 percent said they always wash their hands before eating compared to only 213 percent who reported doing so with soap In the same way 647 percent said they always wash their hands before feeding a child compared to 227 percent who reported doing so with soap A similar trend can be found when it comes to circumstances where there is the risk of coming in contact with feces So for example 743 percent claimed to rinse their hands after using the toilet but only 478 percent said they always do it with soap Washing hands with soap certainly merits strengthening
Table 15 Circumstances of rinsing (simple wash) or washing hands (wash with soap) inhouseholds according to respondentsrsquo own statements
Circumstances Never
()
Some times
()
Often
()
Always
()
When you wash your face at sunrise
Rinse 393
638
251
246
157
57
200
58With soap
When you wash or empty the potty of a child
Rinse 28
74
97
224
271
304
604
398With soap
After going to the toilet Rinse 06
51
57
180
194
291
743
478With soap
Before eating Rinse 04
174
56
382
263
231
678
213With soap
Before cooking Rinse 82
175
275
478
304
206
340
141With soap
Benin Baseline Survey of Peri-Urban Sanitation and Hygiene 24
-
Circumstances Never
()
Some times
()
Often
()
Always
()
Before feeding children Rinse 09
141
74
350
270
282
647
227With soap
After any task where I had to use my hands
Rinse 19
71
421
577
300
220
261
132With soap
After touching an animal Rinse 166
248
340
403
199
160
296
189With soap
After cleaning the bottom (feces) of my child
Rinse 19
74
71
180
215
304
695
443With soap
After cleaning the toilet Rinse 47
75
60
97
121
239
772
589With soap
After having taken care of a sick person
Rinse 129
183
325
356
182
181
364
279With soap
Other occasions Rinse 41
127
270
380
689
494With soap
Note proportions in bold are the answers to hand washing with soap
However in order to wash hands households must have the necessary supplies to do so These include the presence of a mobile or stationary hand washing device soap and water These devices should exist in one or more places in the home especially near places where food is handled or where people come in contact with feces
To complete information on the practice of hand washing we used an objective indicator to verify the presence of a hand washing station with or without required supplies water and a washing productmdasheither a soap bar liquid soap or even ashes These indicators are objective because they are based on actual existence of a hand washing station and nearby supplies The
Benin Baseline Survey of Peri-Urban Sanitation and Hygiene 25
indicator is different from previous indicators that are based solely on the intervieweesrsquo responses
UNICEFrsquos Multiple Indicator Cluster Survey and USAIDrsquos Demographic and Health Surveys use this indicator when carrying out their surveys in developing countries We tried to determine how many hand washing stations had necessary products for the practice of hand washing with soap and if these stations are located in a place accessible to all family members near the kitchen or the toilet The following table shows the results obtained concerning the presence of the supplies mentioned In this table the denominator used is the total number of households visited in order to compare the different hand washing stations for the entire sample In the following section we will find a discussion of accessibility to latrines However the results on the presence of a hand washing station near latrines are shown here to collect all information on this subject in the same section of the report We note the low number of households where these stations existed and the low percentage of households where the devices were equipped with water andor soap during our visit
Table 16 Percentage distribution of hand washing stations in several locations in the houseand supplies observed by location (N=856)
Station usually used by family members
Station near the area of food preparation
Station near the toilet
Households having a corner dedicated to hand washing
294 167 83
Water availability 271 158 79
Availability of soap 230 132 63
Availability of water and soap
221 129 62
To assess the key moments when household members actually wash their hands respondents were asked to name activities after which they wash their hands without making suggestions The responses obtained are summarized in Table 17 below These results reaffirm the need for people to know the moments when hand washing with soap is critical Note that only 254 percent of respondents feel that hand washing is key before preparing food Similarly only 340 percent felt that it was key before feeding a child Both are relatively low percentages
Benin Baseline Survey of Peri-Urban Sanitation and Hygiene 26
Table 17 Key moments of the day to wash hands
Moments Proportion of households ()
After going to the toilet 876
After doing poo 662
Before eating 938
After cleaning a child or washing out a diaper 138
After cleaning the toilet 421
After touching any utensil used for cleaning the house 82
After cleaning a chamber pot 151
Before preparing food 254
Before feeding a child 340
After touching or having cared for a patient 140
After eating 616
These data are consistent with the previous table confirming that although households are aware of the usefulness of this practice it takes time to become a habit
When asked what motivates household members to wash their hands with water and soap or detergent their spontaneous responses were
Table 18 Factors motivating hand washing in households
Motivational Factors Proportion of households ()
Prevent disease 868
Prevent diarrhea 325
Remove germs 361
Prevent dust from entering the mouth 127
Prevent dust from entering the food 33
It smells good 16
Benin Baseline Survey of Peri-Urban Sanitation and Hygiene 27
In four out of five households (868 percent) hand washing is done to prevent disease However health is not a sufficient factor to motivate hand washing with soap The presence of a functional device for hand washing has a lot to do with it
Among the 868 percent of households claiming to wash their hands because of disease only 246 percent have a hand washing station equipped with essential supplies (soap and water) near the kitchen
Other lesser reasons but related to the first are the prevention of diarrhea (325 percent) and the elimination of germs (361 percent)
Sanitation in Households
Household sanitation depends largely on the accessibility of hygiene infrastructure (latrine shower) in the household This is particularly important when the household has young children including children under five years old when they are most vulnerable 595 percent of households visited during this survey have a child younger than five years old and 453 percent have a child under three years old So the majority of children under the age of five are children less than three years old
Management of Feces During the survey respondents were asked ldquoThe last time your child under 3 years of age pooped where did he gordquo
Figure 6 summarizes the responses recorded from households
Figure 6 Distribution of households by places of defecation by children under the age of 3
Benin Baseline Survey of Peri-Urban Sanitation and Hygiene 28
A little more than three-quarters of households (776 percent) used a potty Cloth diapers (67 percent) and disposables (64 percent) were rarely used Other unsavory means were used and are found in the ldquoOtherrdquo category (13 percent) garbage piles in plastic bags and on the ground
Once the child has finished pooping parents dispose of the feces in different places toiletlatrines (668 percent) garbage dumps (204 percent) or garbage cans (34 percent) They are also thrown out with wastewater (31 percent) or disposed of in Other places (41 percent) such as the bush in the lagoon in the lake in gutters and in swampland
According to respondents in four out of five households (807 percent) childrenrsquos feces are disposed of by the head of household or hisher spouse and in just over one in 10 households (126 percent) by the sons or daughters of the head of household They are also disposed of by other relatives (67 percent) of the household members surveyed
The respondents were also asked ldquoWhere do family members go when they need to defecaterdquo Figure 7 summarizes the responses recorded on defecation areas used by household members surveyed In this figure the section ldquoVentilated Latrinesrdquo includes ventilated latrines and ventilated improved pit latrines
Figure 7 Distribution of households by place of defecation for family members
More than seven out of 10 households (743 percent) use sanitation facilities The remaining households use either fields the beach plastic bags (16 percent) or dumpsites (74 percent) The rest (46 percent) use swampy areas the lakeside public drains the lagoon or at times private for-fee or hanging latrines
For anal cleansing households use several means These are newsprint (40 percent) water (386 percent) toilet paper (196 percent) and leaves (14 percent)
Benin Baseline Survey of Peri-Urban Sanitation and Hygiene 29
Availability of Toilets in Households Information was collected during the survey about who put in the toilets used by households hence the question Did your household install the toilet that you are using Answers from the respondents are summarized in the Total column of the table below In addition the crossing of this question with the question of home ownership produces the following results Among homeowners a little more than one-third (345 percent) did not have a toilet compared to four households out of nine (454 percent) who installed a toilet in their house We note that one-fifth (201 percent) of these homeowners were not responsible for the installation of toilets in their homes This is the case with households that live in family homes in which they are considered to be the owners or co-owners For renters 762 percent did not install the toilets that are in the houses where they live only 07 percent are responsible for installing toilets in their home and a little more than one-fifth (231 percent) do not have a toilet In lodged households 537 percent did not install toilets in the house where they live only 63 percent are responsible for installing toilets in their home and four-tenths (400 percent) do not have a toilet in their house
Table 19 Distribution of households according to the person responsible for installing latrines and the title of ownership of the house
Installation of toilets by the household
Title of ownership of the house Total
Owner Renter Lodged
No they were already there
201 762 537 431
Yes 454 07 63 257
The household does not have a toilet
345 231 400 312
Total 100 100 100 100
At the household level when the decision was made to install latrines in nearly nine households out of 10 (877 percent) it was made by the head of household or spouse This decision was taken in 82 percent of households by the parents of the head of household or spouse and in 41 percent of households (renting) by the owners
Regarding the location of toilets the owners made the decision in a little less than half of households visited (47 percent) heads of households or spouses made it in one-third of households (341 percent) and in almost one-fifth of the households visited (188 percent) other actors such as parents of head of household or spouse and previous renters made the decision
Figure 8 provides information on the location of toilets in households
Benin Baseline Survey of Peri-Urban Sanitation and Hygiene 30
Figure 8 Distribution of households by location of toilets in the household
Half of households visited (501 percent) have their toilets inside or attached to their house a little less than half (479 percent) have theirs elsewhere in the compound usually in the courtyard and only 2 percent outside of the property
According to the responses obtained from respondents less than a quarter (224 percent) of toilet pits has been emptied recently Two-thirds of the emptied pits (666 percent) are emptied once a year Others are emptied with regular frequency such as once a month (08 percent) once every two months (08 percent) or once every three months (23 percent) Still others grouped in the section ldquoOthersrdquo (356 percent) are emptied twice a year once every two years and once every three years The average cost of one emptying is 44500 CFA Pit emptying is more common in households where the latrine is shared with other families (Chi2=63 p=000) among renters (Chi2=1238 p=000) in houses that flood (Chi2=263 p=000) and in families with a better socio-economic status (Chi3=91 p=001)
In regards to the place where the sewage sludge is dumped nine households out of 10 (902 percent) reported not knowing where it is emptied On the other hand one household out of 10 (98 percent) said that the toilets are flushed into rivers and the ocean All emptied toilets are still in use
Regarding shared toilets two households out of three (659 percent) share their toilets with other households The average number of households that share the same toilet is five
In the three municipalities of the study nearly seven households out of 10 (697 percent) use an improved sanitation infrastructure
Principal Reasons to Build or Not to Build Toilets We asked households with toilets for three main reasons why they built their toilets Figure 9 below shows the responses of households interviewed
Benin Baseline Survey of Peri-Urban Sanitation and Hygiene 31
Figure 9 Distribution of households according to principal reasons for building the toilets
Households mentioned the following three reasons most to justify building toilets privacy (699 percent) disease prevention (616 percent) and security (362 percent)
Households that do not have toilets mention the reasons below (Figure 10)
Figure 10 Distribution of households by principal reasons for not building latrines
The high cost of construction of latrines (677 percent) is by far the most common reason households justified not building the toilets While more households in the lower socio-economic status (715 percent) than in the higher socio-economic status (526 percent) give this reason the difference is not statistically significant Next the nature of the soil (373 percent) and the fact that the household does not have the necessary supplies to build latrines
Benin Baseline Survey of Peri-Urban Sanitation and Hygiene 32
(327 percent) are mentioned Other reasons are listed in smaller proportions as indicated in the graph The ldquoOtherrdquo category (216 percent) is comprised of those who do not have toilets (one-fifth of respondents) among other reasonsmdashthe delay in resettlement operations the effects of flooding during the rainy season the refusal of some tenants to contribute upon request of the owner to build toilets and zoning and resettlement issues
In households feelings of satisfaction or dissatisfaction regarding the use of the latrine were recorded depending on where the household defecates In fact 325 percent of households are very dissatisfied with the place where they defecate 129 percent are somewhat dissatisfied 27 percent have no opinion 227 percent are rather satisfied and 293 percent are very satisfied
Reasons for dissatisfaction are summarized in Figure 11
Figure 11 Distribution of households by reasons for dissatisfaction in the use of a latrine
The reason most cited by three out of five households interviewed (595 percent) is that the defecation site is not hygienic The section ldquoOtherrdquo (63 percent) takes into account reasons such as the latrine is full or almost full latrine has no door latrine has a defective door too many people use the latrine flooding latrine is dirty lacks a vent pipe and does not allow privacy It should be added that the response about privacy is very uncommon but is relevant especially in the case of shared latrines that are very close to living quarters where the person using the latrine is known by all
Reasons for satisfaction are summarized in Figure 12
Benin Baseline Survey of Peri-Urban Sanitation and Hygiene 33
Figure 12 Distribution of households by reasons justifying the feelings of satisfaction ofhouseholds that use the latrine
The proximity of the place (60 percent) maintenance (419 percent) safety (389 percent) and the fact that the site provides a sense of privacy (378) are the satisfaction factors households mention the most
Despite the fact that almost a third (312 percent) of households interviewed do not have a latrine and that nearly two-thirds (595 percent) have decried hygiene conditions only a quarter of households (257 percent) surveyed seem to want to do something to change their present situation regarding access to a latrine
To change the current situation households made the following suggestions building private latrines (291 percent) improving private latrines owned by the household (159 percent) asking the owner to build a latrine (155 percent) asking for community help to build latrines (05 percent) and requesting assistance of government or outside sources to improve the sanitation situation (241 percent) Actions that are covered under the section ldquoOtherrdquo (15 percent) include moving the household emptying the latrine andor covering the latrine
Only 76 percent of households interviewed intend to install or change their sanitation facility in the next six months
More than the majority (69 percent) of households thinks that sanitation is a problem in their district They mention reasons such as open defecation (525 percent) odor (558 percent) presence of feces everywhere (25 percent) unhealthy environment (44 percent) lack of health services (503 percent) lack of resources (335 percent) and ldquoOtherrdquo reasons (52 percent)mdash flooding of toilets in the rainy season high level of ground water full toilets not emptied defecation in bags the proliferation of flies and occupancy of swamp areas
Benin Baseline Survey of Peri-Urban Sanitation and Hygiene 34
Observation of Households Toilets
Condition of Toilets Data collectors asked householders who owned toilets if they could observe their facilities In response to the question ldquoMay I see your toiletsrdquo nine out of 10 households (901 percent) responded in the affirmative Only 53 percent of toilets observed were built during the 12 months that preceded the survey From observation of the distance between the toilets and the dwelling it appears that 854 percent of toilets are in the homes 26 percent in the yard 111 percent at a distance less than or equal to 20 meters from the house and 09 percent more than 20 meters from the house
Of the toilets observed 965 percent have walls 906 percent have a roof 886 percent allow privacy 69 percent keep their door closed and 64 percent are a series of toilets with more than one entrance to allow several persons to use them at the same time Two elements observed help make them more accessible to children squat toilets with a smaller hole (64 percent) maybe by chance and toilets with a lower seat (636 percent) Fewer than half (459 percent) of latrines visited had a covered hole
In the latrines the following conditions were observed (using a flashlight) fecal matter was observed in squat holes in 502 percent of cases anal cleansing products (236 percent) wet seats (438 percent) grey colored seats (129 percent) bad smells (365 percent) presence of flies (21 percent) and cockroaches (163 percent)
According to respondents only 36 percent of toilets are flooded during the rainy season Remember that flooded houses are more common in Cotonou When latrines are flooded household members go to defecate in a dry public place (30 percent) in the lake (30 percent) in a private dry place (15 percent) in a plastic bag (15 percent) on a dump site (5 percent) or in the flooded latrine (5 percent)
Also during the observation an assessment was made of latrine maintenance namely the floor the hole cover and the anal cleansing material (toilet paper for the most part) Figure 13 below shows the results of observed toilet maintenance The graph shows the cumulative percentages by component
Benin Baseline Survey of Peri-Urban Sanitation and Hygiene 35
Figure 13 Results of the assessment of latrine maintenance components in observed latrines
In general observations showed that only about a third of latrines had been adequately cleaned Thus each latrine component only receives an approximate cleaning 531 percent for the floor 186 percent for the hole cover and 533 percent for the anal cleansing material
In nearly one out of two households (486 percent) a broom was noted near the toilets Finally feces in the observed toilets go mainly into septic tanks (586 percent) and dry holes (394 percent)
Psycho-Social Determinants of Latrine Ownership
To measure psycho-social determinants of latrine ownership the respondents were read a series of statements to elicit their opinion Responses obtained are shown in Table 20 below
Benin Baseline Survey of Peri-Urban Sanitation and Hygiene 36
Table 20 Household opinions on latrine ownership
Statements Do not agree No opinion
Some-what agree
Strongly agree
It makes the owners appear modern 70 82 287 561
It makes the owners respectable members of the community
50 79 298 572
It makes the owners respected by people who visit them
20 43 306 631
It makes the owners more appreciated
35 65 309 591
It makes the members of the household proud
11 33 228 729
It allows women to have privacy at any time of the day
08 05 129 858
It helps keep the shared compound areas clean
22 50 214 713
It doesnrsquot reduce the number of flies in the house
449 103 192 256
It allows you to go relieve yourself easily when you are sick
09 40 254 697
It allows you to go relieve yourself easily when you are old
18 39 278 665
It reduces the possibility of disease in the household
21 30 256 692
It gives toilet users a little more privacy
01 08 185 805
Itrsquos annoying to go to the ldquojohnrdquo every time to do your business
719 140 39 102
It avoids the dangers of having to go do your business at night in the bush
05 01 118 876
Itrsquos really hard to maintain latrines so that they are always operational
594 125 177 104
It is difficult to maintain them so that they are always clean
607 108 178 108
Benin Baseline Survey of Peri-Urban Sanitation and Hygiene 37
-
Summary Table of Survey Indicators
A summary table of indicators has been generated according to socio-economic groups Socio-demographic factors were used to establish socio-economic levels and an analysis was made for each income level The socio-economic levels were established using the conventional method of creating a wealth index The data were subsequently processed by municipality to explore the differences among Cotonou Abomey-Calavi and Porto-Novo
Table 21 Key indicators by household socio-economic level
Indicators
Socio economic typology All subgroups combined
(N=856)
Pearson Chi-square 8
p
Lower
(N=245)
Intermediate
(N=263)
Upper
(N=278)
of households using an improved sanitation facility
453 691 945 697 164675 01
of households with a station for hand washing equipped with essential supplies (soap and water) near the toilets
11 11 142 55 63584 01
of households with a station for hand washing equipped with essential supplies (soap and water) near the kitchen
109 160 391 221 75597 01
of households treating drinking water correctly
32 60 45 46 2689 lt Not significant
of households storing drinking water correctly
600 702 900 735 68427 01
A p value of 01 means that the relationships are highly significant meaning improved infrastructure is more commonly found in the upper socio-economic group
Table 22 below provides a specific summary of each of the three municipalities of the study
8 The Chi-square seeks to establish the relationship between two categorical variables Sex is a categorical variables because it would group individuals into one of two categories men or women This would be a dichotomous categorical variable Socioeconomic quintiles would also be a categorical variable In this case it would not be dichotomous Chi-square can be used to explore the relationship between the two types
Benin Baseline Survey of Peri-Urban Sanitation and Hygiene 38
Table 22 Presentation of key indicators by municipality
Indicators
Municipality Together
(N=856)
Pearson Chi-square
p
Abomey-Calavi
(N=155)
Cotonou
(N=349)
Porto-Novo
(N=352)
of households using improved sanitation infrastructure
516 799 676 697 42106 gt 921
01
of households with a station for hand washing with essential supplies (soap and water) near the toilets
13 86 43 55 12780 01
of households with a station for hand washing with essential supplies (soap and water) near the kitchen
161 284 185 221 13880 01
of households who treat their drinking water properly
77 54 23 46 8471 02
of households who store their drinking water properly
645 785 724 735 11117 01
All associations reported are statistically significant The improved facilities and better practices are more commonly reported in Cotonou
Benin Baseline Survey of Peri-Urban Sanitation and Hygiene 39
-
Table 23 below combines the variables of the two tables above
Table 23 Presentation of indicators by municipality and by household socio-economic levels
Indicators
Municipalities
Abomey Calavi Cotonou Porto-Novo
poor average wealthy Pearson Chi-square
poor average wealthy Pearson Chi-square
poor average wealthy Pearson Chi-square
of households using improved sanitation infrastructure
204 581 846 39148 gt 921
485 716 988 8348 gt 921
521 731 906 Significant 01 level
of households with a station for hand washing with essential supplies (soap and water) near the toilets
00 00 51 6026 gt 5991
00 17 170 28092 gt 921
18 10 129 Significant 01 level
of households with a station for hand washing with essential supplies (soap and water) near the kitchen
19 45 97 19915 gt 921
74 147 467 52703 gt 921
141 202 247 Not significant
of households who properly treat their drinking water
74 81 77 0018 lt 4605
59 69 42 0964 lt 4605
06 38 35 Not significant
of households who store their drinking
574 581 846 9201 gt 529 733 927 48001 638 740 871 15323 Significant
Benin Baseline Survey of Peri-Urban Sanitation and Hygiene 40
-
Indicators
Municipalities
Abomey Calavi Cotonou Porto-Novo
poor average wealthy Pearson Chi-square
poor average wealthy Pearson Chi-square
poor average wealthy Pearson Chi-square
water properly 7824 gt 921 01 level
Benin Baseline Survey of Peri-Urban Sanitation and Hygiene 41
Exposure to Information Messages on Hygiene and Sanitation Practices
During this survey information was also collected on the exposure of households to information messages on hygiene and sanitation practices as well as on sources of this information Data show that only one in five households (196 percent) received information on washing hands during the 30 days preceding the survey Figure 14 below summarizes the main sources of information received by the households
Figure 14 Distribution of households having received information on hand washing by sourceof information
As illustrated in the figure the most common sources of information to households are the radio (518 percent) and television (482 percent) and to some extent health centers (243 percent)
Regarding the treatment of drinking water only a quarter of the households surveyed (247 percent) received information on water treatment during the 30 days preceding the survey Sources of this information are practically the same as those for hand washing (Figure 15)
Benin Baseline Survey of Peri-Urban Sanitation and Hygiene 42
Figure 15 Distribution of households who received information on water treatment by sourceof information
Regarding sanitation only one-fifth (204 percent) of respondents had seen or heard about sanitation during the 30 days preceding the survey Sources of information received by these households are shown in Figure 16
Figure 16 Distribution of households having received information on sanitation by source of information
Whether for hand washing water treatment or sanitation television and the radio remain the two most cited sources of information by the households
The households surveyed were rarely visited by health educators for sensitization on the practice of open defecation (21 percent) or the daily maintenance of toilets (4 percent)
As for information on hydro-fecal diseases a little less than a third (274 percent) of households reported having received information on diarrhea or cholera in the 30 days that preceded the survey The most cited sources of information were the radio (594 percent) television (449 percent) and the health center (406 percent)
Benin Baseline Survey of Peri-Urban Sanitation and Hygiene 43
Conclusion
Data from this study indicate that certain populations from the municipalities of Cotonou Porto-Novo and Abomey-Calavi lack basic hygiene and sanitation infrastructure even though they live in urban areas The overall acceptability of conditions varies from one municipality to another The results of the study reveal that nearly seven out of 10 households surveyed use an improved sanitation facility The problem is less acute in Cotonou (799 percent) and Porto-Novo (676 percent) than in Abomey-Calavi (516 percent) Although households recognize the importance of hand washing in preventing certain diseases the act of washing hands with water and soap at key moments is still far from being a habit in many households Hand washing stations exist in very few households depending on whether the hand washing station is located near the kitchen or toilet In Cotonou the availability of hand washing stations is 284 percent near the kitchen compared to 86 percent near the toilets in Porto-Novo 185 percent have hand washing stations near the kitchen compared to 43 percent near the toilets and in Abomey-Calavi 161 percent of households have facilities near the kitchen compared to 13 percent near the toilets
Regarding household supply of drinking water in nine out of 10 households surveyed the drinking water comes from the distribution network of SONEB Only a minority of households drinks water from other sources including wells Only 58 percent of households treat drinking water Results of chlorine tests made in households that used chlorination show the average concentration of chlorine in the water as 349 mgl which is very high considering the World Health Organization standard of free chlorine concentration of treated water is 02 to 05 mgl Also the average number of days that the households continue to drink treated water is 64 days A poor household practice of mixing treated water with untreated whenever the water is renewed in the container was also observed All these reasons explain the alarmingly low percentage of households that properly treat their drinking water This indicator is 54 percent in Cotonou compared to 77 percent in Abomey-Calavi and 23 percent in Porto-Novo
Regarding proper storage of drinking water nearly three out of four households (735 percent) store their drinking water properly This indicator is 785 percent in Cotonou 724 percent in Porto-Novo and 645 percent in Abomey-Calavi
All these indicators that characterize the current state of hygiene and sanitation in these peri-urban districts surveyed also change depending on the socio-economic level of households
To reduce the health vulnerability of households in the study population it is necessary that appropriate interventions be implemented in the peri-urban neighborhoods To this end radio television and to some extent health centers appear to be the most appropriate channels for disseminating information and awareness messages according to data from the study
Benin Baseline Survey of Peri-Urban Sanitation and Hygiene 44
Endnotes
Boschi-Pinto C L Velebit and K Shibuyac 2008 Estimating Child Mortality Due to Diarrhoea in Developing Countries Bulletin of the World Health 86710ndash717
Water and Sanitation Program 2012 Economic Impact of Poor Sanitation in Africa
Benin Baseline Survey of Peri-Urban Sanitation and Hygiene 45
Annex 1 ndash Population from Sampled Districts
Municipality Districts Population Cotonou AVOTROU 17318
MINONTCHOU 7145 LADJI 8409
Abomey- GODOMEY 60034 Calavi TOGOUDO
TOKPA ZOUNGO 11090 HOUEKEGBO 1718 HOUEKEHONOU 1770
Porto-Novo ACCRON 5350 AVASSA 1715 FOUN FOUN 3412 TOKPA HOUEYOGBE 1638 GBEDJI
TOTAL 119601
The Survey Questionnaire is available separately on request from contactwashplusorg
Benin Baseline Survey of Peri-Urban Sanitation and Hygiene 46
WASHplus FHI 360 1825 Connecticut Ave NW Washington DC 20009 2028848000 wwwWASHplusorg contactwashplusorg
Benin Baseline Survey of Peri-Urban Sanitation and Hygiene 47
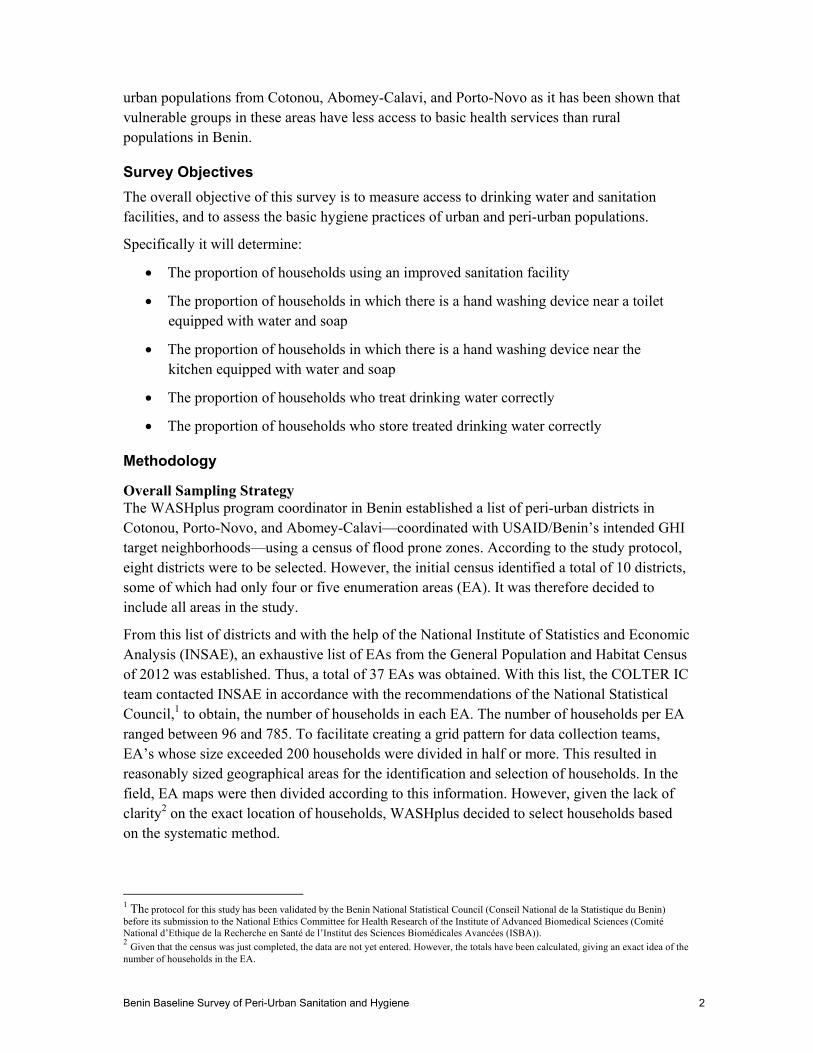
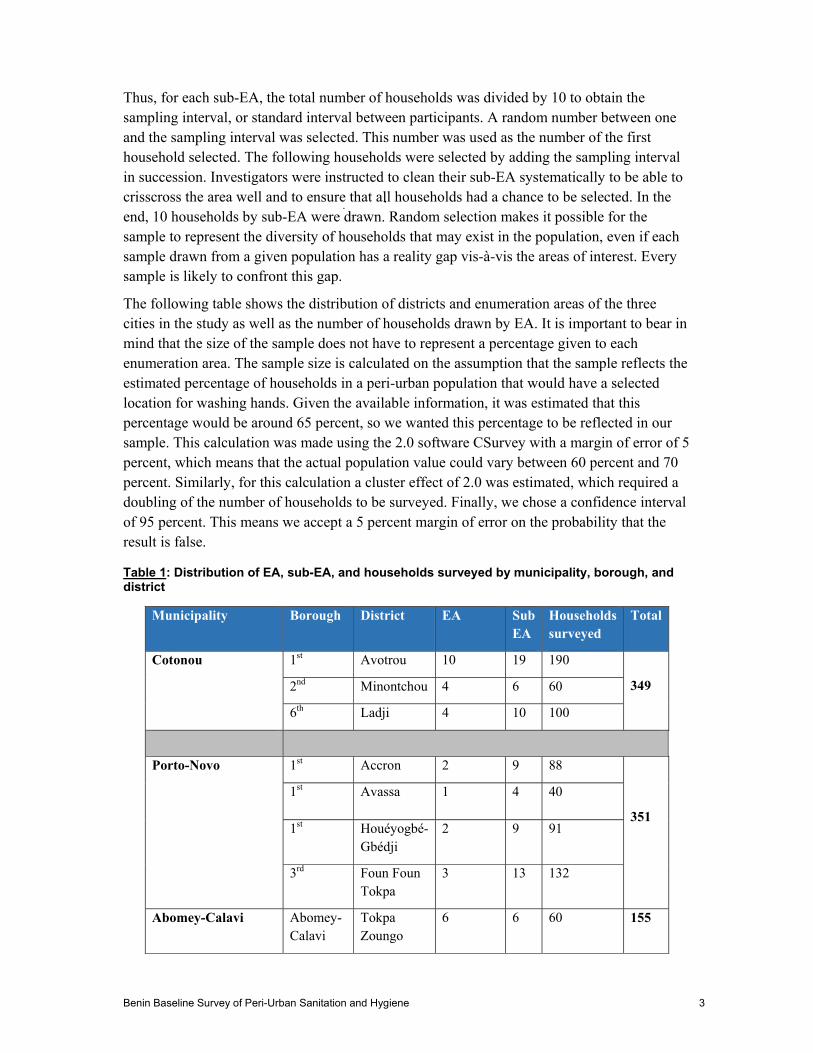
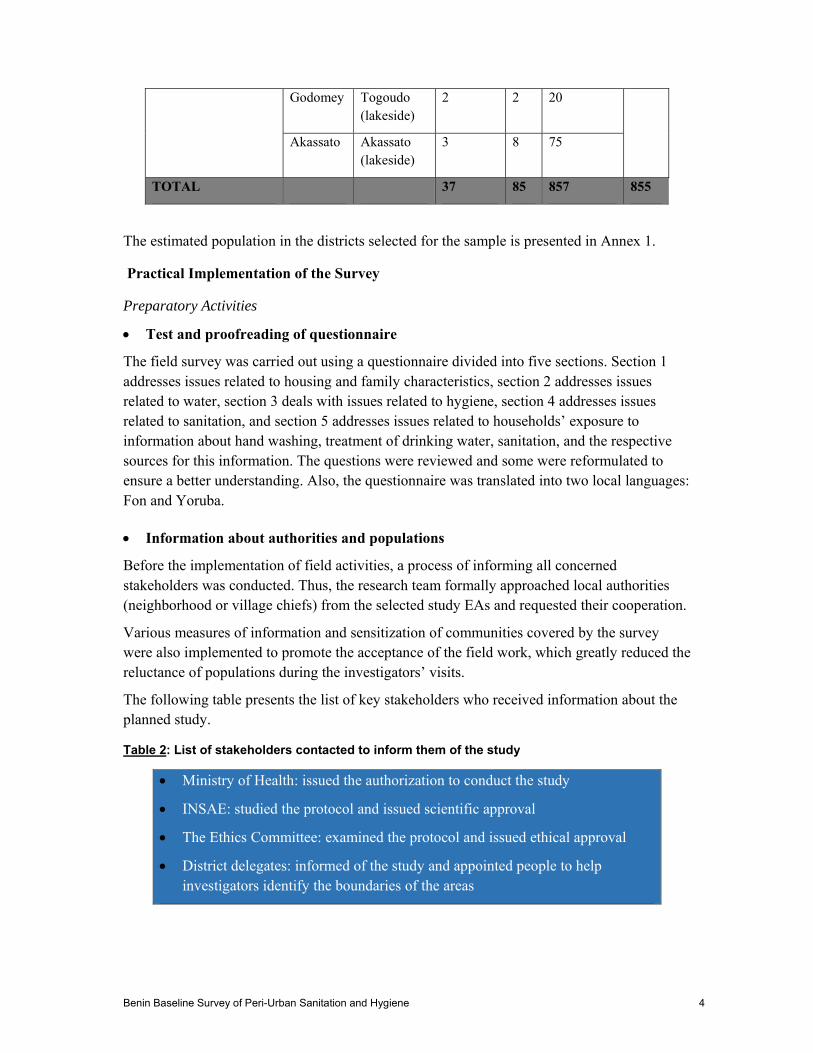
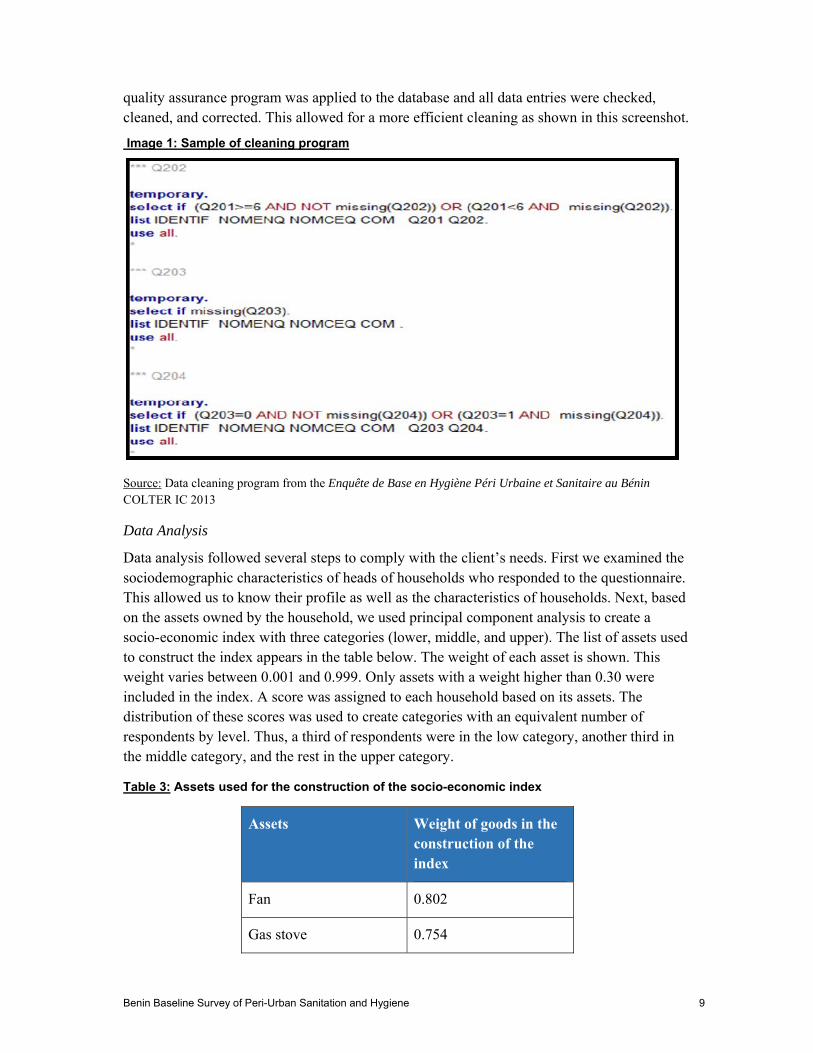
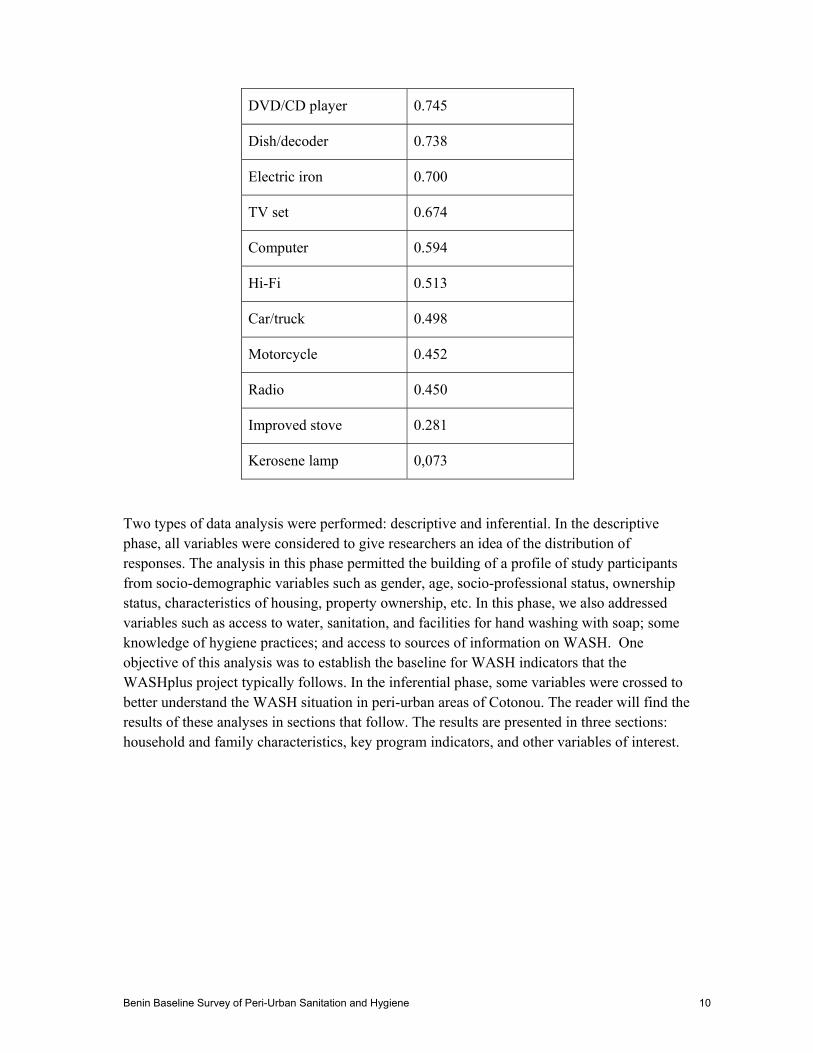
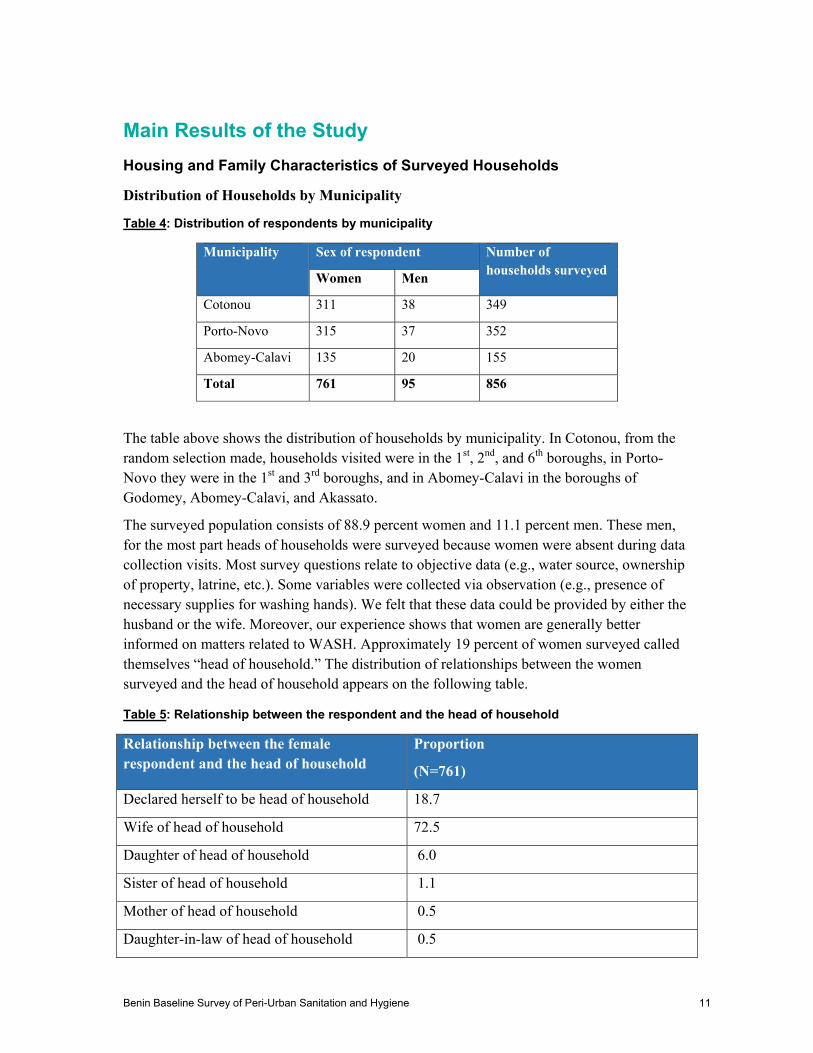
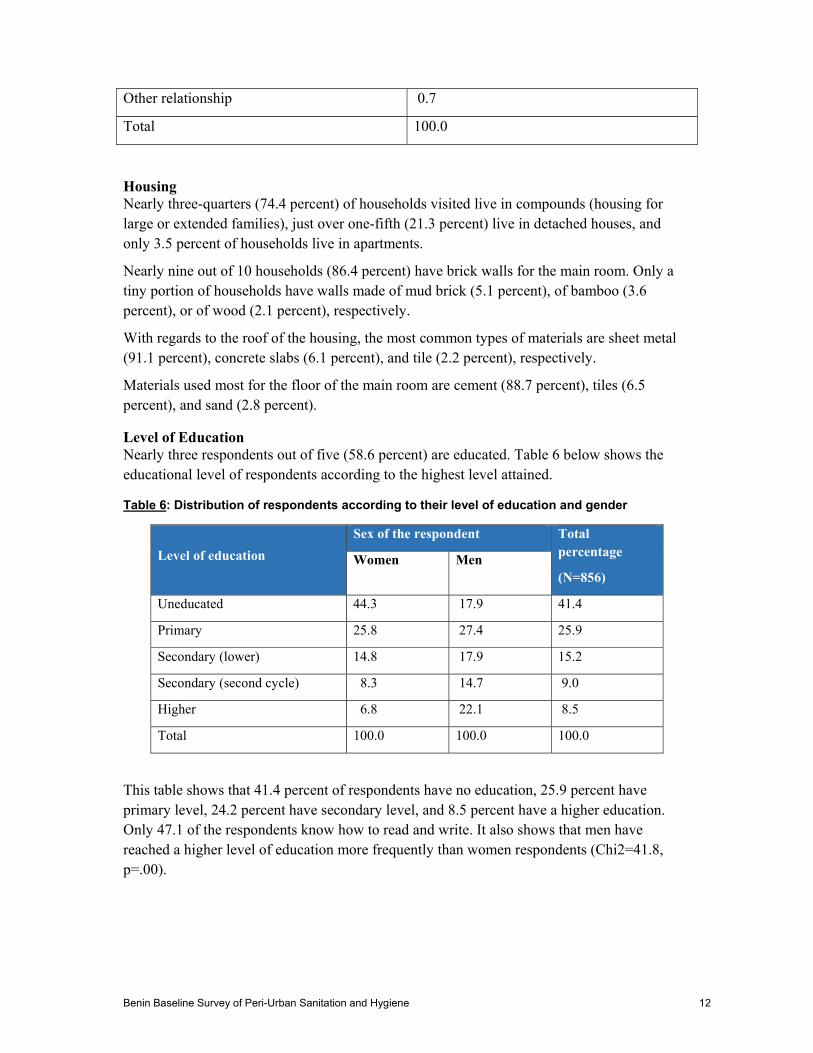
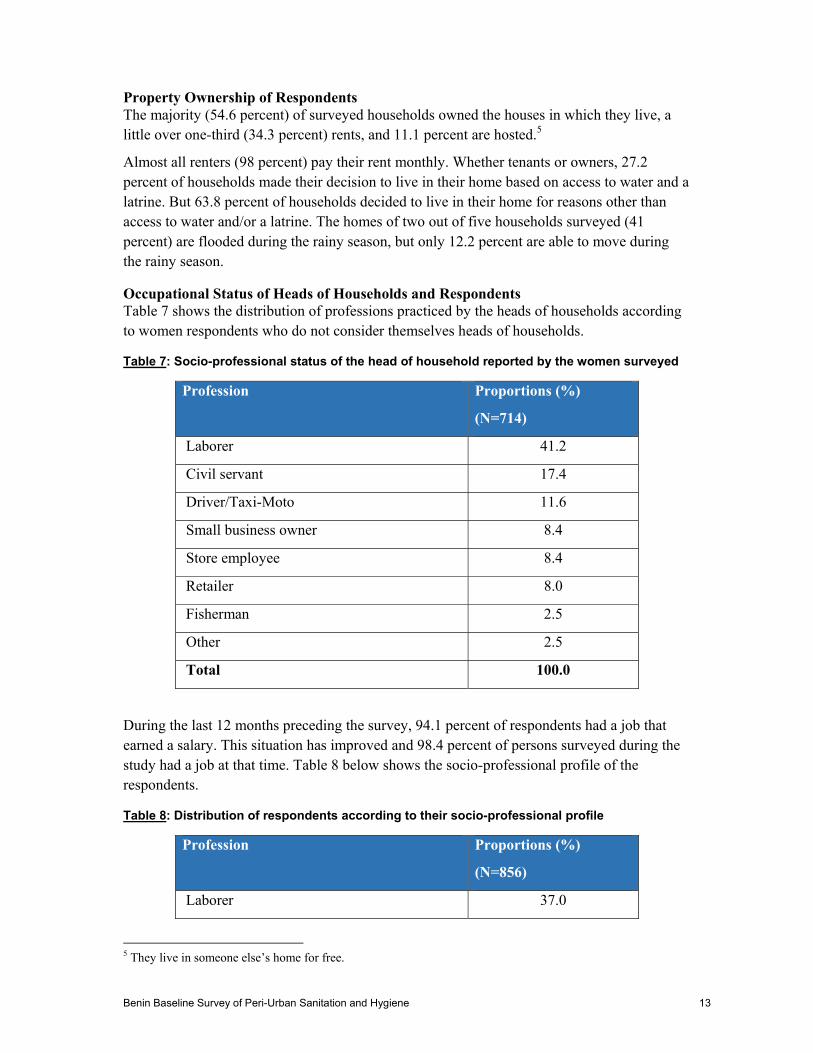
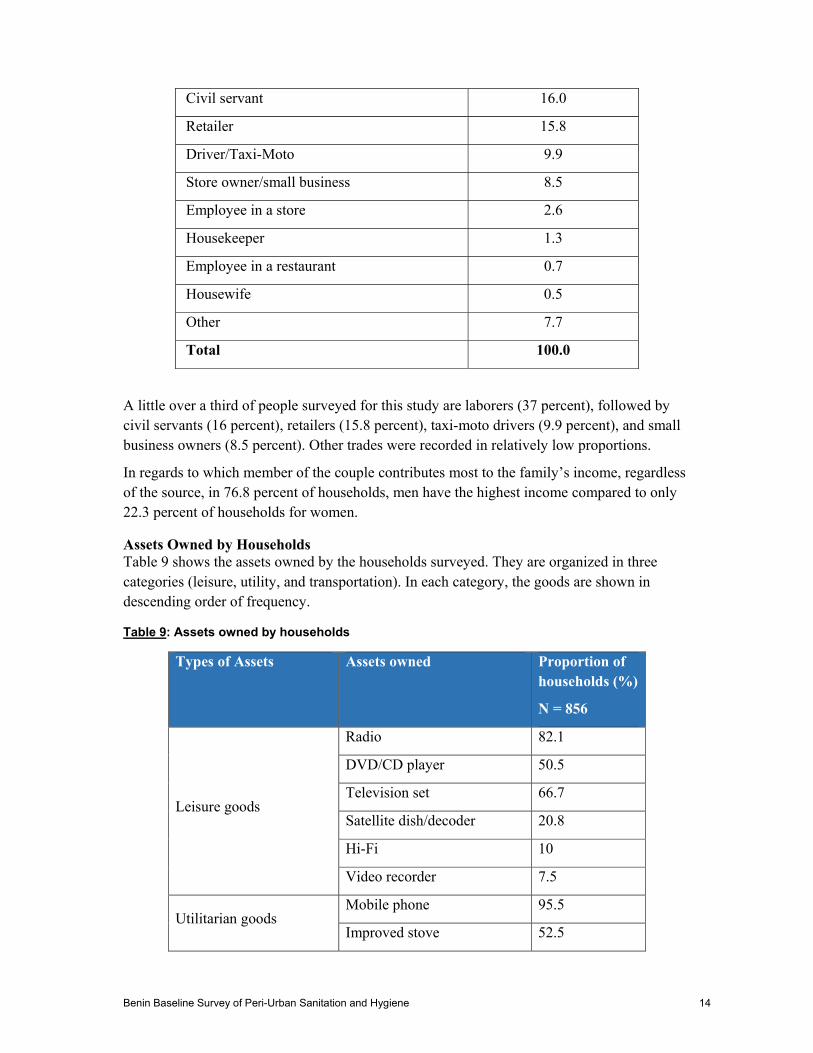
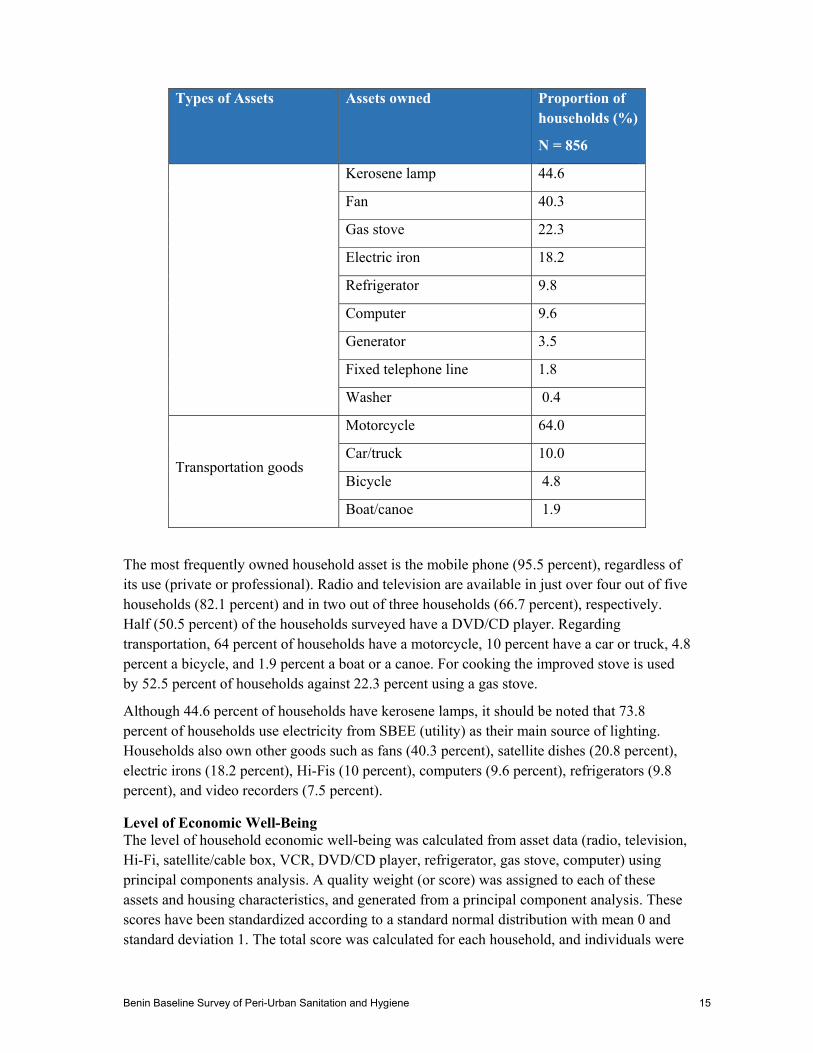
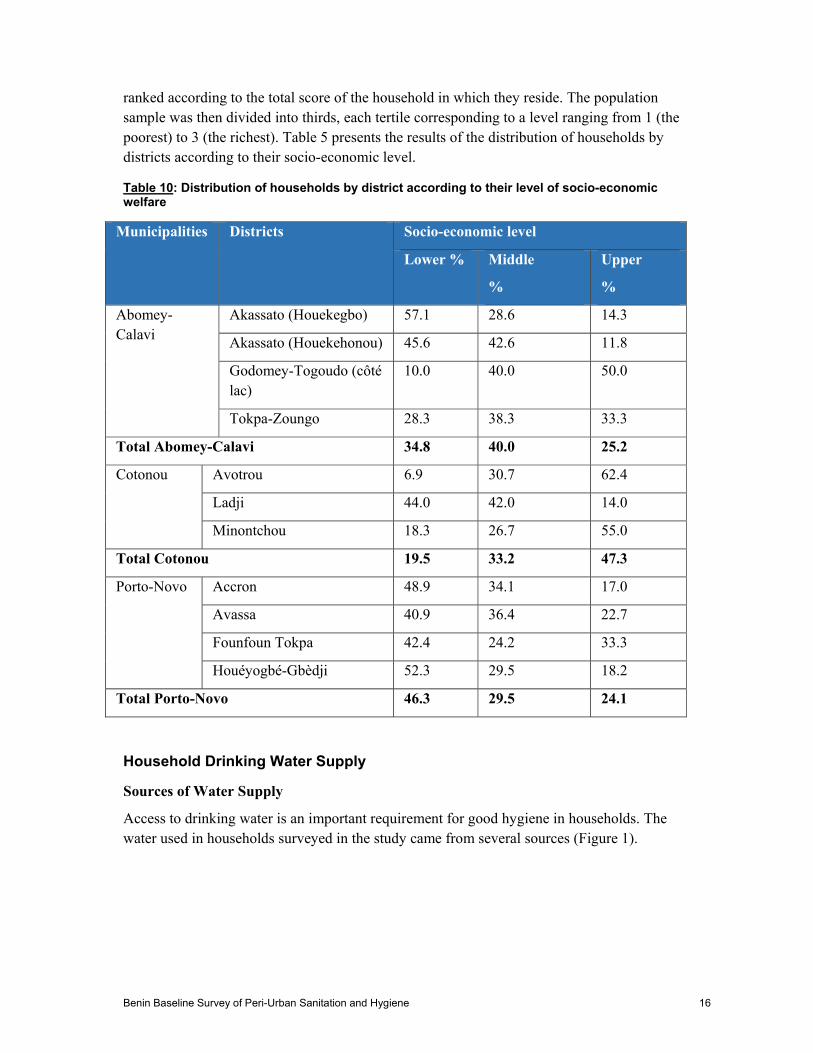
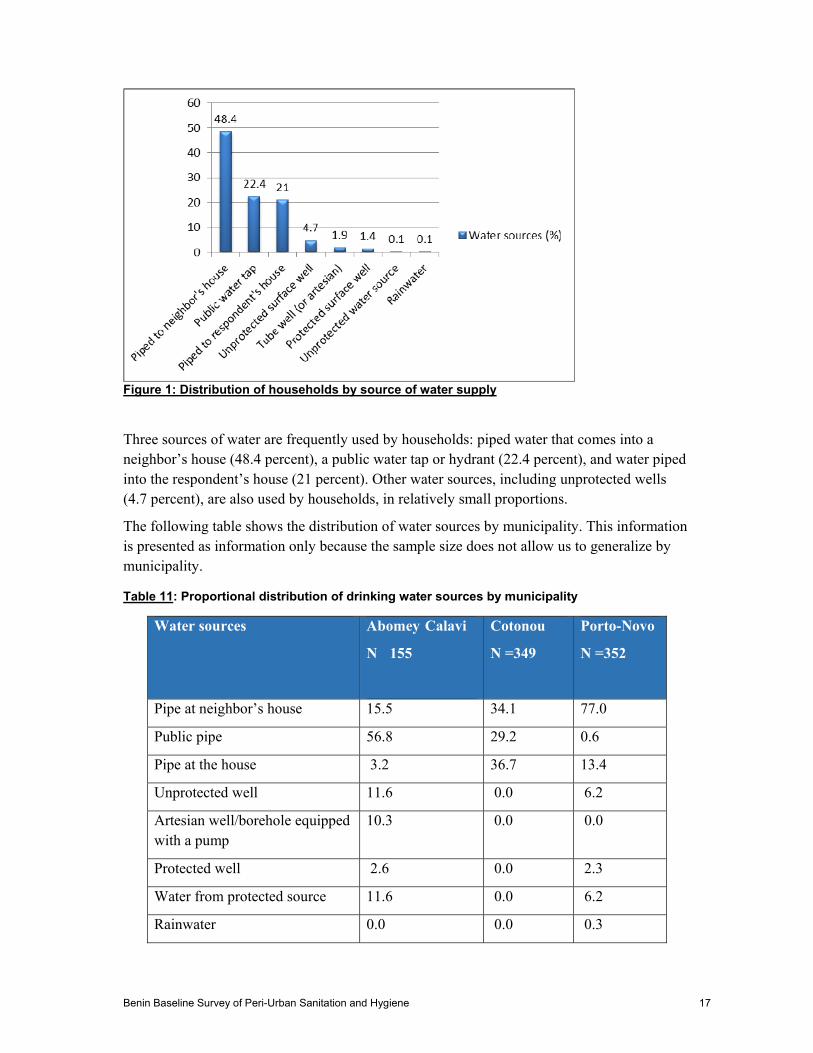
-
=
Figure 1 Distribution of households by source of water supply
Three sources of water are frequently used by households piped water that comes into a neighborrsquos house (484 percent) a public water tap or hydrant (224 percent) and water piped into the respondentrsquos house (21 percent) Other water sources including unprotected wells (47 percent) are also used by households in relatively small proportions
The following table shows the distribution of water sources by municipality This information is presented as information only because the sample size does not allow us to generalize by municipality
Table 11 Proportional distribution of drinking water sources by municipality
Water sources Abomey Calavi
N 155
Cotonou
N =349
Porto-Novo
N =352
Pipe at neighborrsquos house 155 341 770
Public pipe 568 292 06
Pipe at the house 32 367 134
Unprotected well 116 00 62
Artesian wellborehole equipped with a pump
103 00 00
Protected well 26 00 23
Water from protected source 116 00 62
Rainwater 00 00 03
Benin Baseline Survey of Peri-Urban Sanitation and Hygiene 17
Total 100 100 100
More than nine out of 10 households (937 percent) pay for drinking water Among them 949 percent pay for water based on volume compared to only 51 percent who pay a fixed monthly sum
According to households surveyed water is bought by basin (427 percent) by bucket (275 percent) by jerry can (134 percent) and by cubic meter (163 percent) when it is bought directly from the Socieacuteteacute Nationale des Eaux du Beacutenin (SONEB) In the three municipalities SONEB provides drinking water in nine households out of 10 (915 percent) It should be noted that households that obtain drinking water from neighbors also buy it from them In other instances the heads of household and the homeowners were also cited as distributors to a lesser extent (55 percent) when drinking water is from a well
In households other water sources are used for needs other than drinking (for example to wash hands cook and other household tasks) Of more than 10 sources cited by households water from protected surface wells (182 percent) and those of unprotected surface wells (57 percent) are the most utilized
To make water potable certain households (58 percent) use methods to treat water at home Household practices for treating drinking water are shown in the Table 12 below
Table 12 Water treatment in households according to principal source of drinking water for the household
Principal source of drinking water for the household of households that reported treating
their drinking water
A pipe that comes into the house 33
A pipe that comes into the house of a neighbor 31
Public water tap public water hydrant 83
Borehole equipped with a pumpartesian well 62
Protected well 333
Unprotected well 250
Water from unprotected source 00
Rainwater 00
Knowledge of Methods of Water Treatment at Home To measure the general knowledge of drinking water treatment methods at home we asked the households to cite the methods that they know
Figure 2 below shows responses from the respondents
Benin Baseline Survey of Peri-Urban Sanitation and Hygiene 18
Figure 2 Distribution of respondents according to their knowledge of methods to treat drinking water
In data from Figure 2 it is clear that the two most known methods of household water treatment were boiling (328 percent) and using Aquatabs and other effervescent products (54 percent) Methods such as the use of coagulantflocculants (153 percent) and cloth filters (72 percent) are known in relatively small proportions The category ldquootherrdquo takes into account products such as kaolin charcoal permanganate etc (96 percent)
Water Treatment at Home Only a minority of households (58 percent) treat water at home so that it is potable No statistical association has been found between household water treatment and socio-economic group (Chi2=086 p=065) Reasons given by these households for treating water are rooted in beliefs and not in true knowledge about water quality These include campaign messages promoting health (426 percent) household habit of treating drinking water (404 percent) having the treatment product at home (21 percent) and the fact that it is largely accepted that the sources of water are not safe for drinking without treatment (213 percent)
On the other hand those who donrsquot treat the water evoke reasons such as the lack of information on water treatment (58 percent) no tradition of having treated water at home (55 percent) unavailability of a treatment product (07 percent) the water source is considered to be clean and therefore it does not need to be treated before drinking (852 percent) and no reason (22 percent)
During the survey households were asked who treats the water and what treatment methods are used Figure 3 shows methods of treatment used by households
Benin Baseline Survey of Peri-Urban Sanitation and Hygiene 19
Figure 3 Distribution of households according to methods of household water treatment
There is a statistical relationship between the source of drinking water and treatment practices Households who use a pipe private or public tend not to treat water In addition those who use an artesian well or a borehole with pump an unprotected well or surface water tend to treat The relationship between these two variables source of water and treatment of water is shown in the following table The relationship is statistically significant or Chi2 value is 528 and the probability of 00 However 85 percent of households who have not treated their water report that they donrsquot do it because the source provides safe water to drink and therefore the need to treat the water does not exist Only 5 percent say they have never treated drinking water at home and 6 percent reported not being aware that they needed to treat it That is to say they tend to trust the source Furthermore no statistical relationship was detected between household water treatment and socio-economic level (Chi2=086 p=065)
Table 13 Relationship between the source of drinking water and its treatment at home
Source of drinking water Treatment of drinking water Total
(N=854) No (N=804)
Yes (N=50)
Pipe at home at the neighborrsquos or a hydrant
715 380 696
Artesian wells 219 320 225 Unprotected wells 19 20 19 Protected wells 10 80 14 Unprotected source 37 200 47 Total 1000 1000 1000
Benin Baseline Survey of Peri-Urban Sanitation and Hygiene 20
Three out of four households (74 percent) use effervescent chlorine tabletsAquatabs for water treatment Other methods are used by less than one household out of 10 The ldquoother category includes products such as kaolin (6 percent)
However it should be noted that all methods used are not effective to purify water Among the many methods reported being used by households only three are able to treat water (if used correctly) boiling liquid chlorine or effervescent chlorine tablets (including Aquatabs)
Boiling is a traditional method of treating water This method if used correctly can provide safe drinking water to a household that has no other option Boiling will kill pathogenic germs but it doesnrsquot have a lasting effect Therefore if the water is not properly handled it can be recontaminated Boiled water should therefore be safely stored and used within one to two days
As for chlorination it is a simple and effective way to disinfect water It consists of introducing chlorine products (chlorine tablets bleach) into water to kill any micro-organisms it may contain After a contact time of about 30 minutes water is considered safe It remains safe for a few hours or days (depending on storage conditions) with the residual chlorine
Thus of the small minority of respondent households 58 percent (50856) that treat water at home 82 percent (4150) use effective treatment methods6 However the results of residual chlorine tests made in households that treat water show that only 76 percent (3850) of these households used chlorination We found that the average concentration of chlorine in water is 349 mgl which seems very high given the fact that according to the World Health Organization (WHO) concentration of free chlorine in treated water should be 02 to 05 mgl It is likely that over-chlorination is occurring due to chlorination of tap water which in principle is already chlorinated Also note that the average number of days during which households continue to drink the treated water is 64 days Poor water treatment practices were observed in a minority of households (8 percent) (1650) that mix treated with untreated water whenever they replenish the water in the container Only 46 percent (39856) of households from the three municipalities treat drinking water properly
There is a statistical relationship between knowledge of Aquatabs and its use Those who know of Aquatabs are more likely to use them This relationship is significant so that Chi2=192 and p=000 This relationship is shown in the following table
6 Meaning when all required steps are respected
Benin Baseline Survey of Peri-Urban Sanitation and Hygiene 21
Table 14 Relationship between knowledge of Aquatabs and treatment of water at home
Report knowing about Aquatabs as a known method for home treatment of drinking water
Home treatment of drinking water Total
Yes
(N= 804)
No
(N =50)
Yes 840 521 460
No 160 479 540
Total 100 100 100
Storage of Drinking Water in Homes All efforts to make water safe to drink are useless if it is not stored or handled properly During the survey information was collected on the conditions of storage and handling of drinking water Several containers are used by households to store drinking water (Figure 4)
Figure 4 Distribution of households according to storage containers used for drinking water
Buckets (722 percent) containers below or above 25 L (165 percent) and clay jars (86 percent) are the most used by households for storing drinking water
From the results of observations made by data collectors in households it appears that in the overwhelming majority of cases the containers used are closedcovered (965 percent) with tight fitting lids (925 percent) clean on the outside (866 percent) and out of reach of animals (936 percent) Only 06 percent of vessels observed had a tap
Benin Baseline Survey of Peri-Urban Sanitation and Hygiene 22
Looking at households where the container used to store water is both closed with a tight fitting lid and clean on the outside and out of reach of animals we realize that 735 percent of households in the three municipalities store their drinking water properly
There is a statistical relationship between the use of a covered container to store water and socio-economic status as the use of a cover goes from 938 percent in the lower socio-economic group to 971 percent in the intermediate group and 989 percent in the higher group (Chi2=111 p=00) Also we found a statistical relationship between the use of a tight-fitting lid and socio-economic status The presence of a tight-fitting lid goes from 871 percent in the lower socio-economic group to 909 percent in the intermediate group and 989 percent in the upper group (Chi2=277 p=00)
Household Hygiene
The practice of hand hygiene is central to household hygiene in general The key behavior of hand hygiene is washing hands especially with soap Within households visited data have been collected on the availability and the various uses of soap Nearly 94 percent of households visited had soap available at the time of the interview The following chart provides information on the most commonly used types of soap in most households7
Figure 5 Distribution of households by most commonly used type of soap
In almost all households (985 percent) soaps used are purchased by the head of household or hisher spouse The soap purchased is used to wash clothes (986 percent) to bathe (952 percent) wash children (631 percent) wash the buttocks of children (91 percent) wash the hands of children (119 percent) wash hands after using the toilet (359 percent) wash hands before feeding children (118 percent) wash hands before cooking (131 percent) and wash hands before eating (263 percent)
Hand washing is a practice that surveyed households are very aware of but regrettably the act of washing hands with soap and water is not yet a regular habit for many people and children are not properly taught to use soap to wash their hands
7 We do not have information on the usage of each type of soap as this was not a question posed
Benin Baseline Survey of Peri-Urban Sanitation and Hygiene 23
-
We recognize that researching hand washing is a challenge as some respondents tend to report what is expected socially instead of reporting actual practice A way to address this challenge is to ask people how often hand washing is practiced in different circumstances Table 15 shows the distribution of respondentsrsquo answers when asked to use four types of frequency for each circumstance never sometimes often and always In addition we wanted to study the difference between the practice of rinsing hands without using soap and the practice of washing hands where soap is used The comparison between rinsing and washing is also presented in Table 15 This table shows us respondentsrsquo own statements about rinsing and washing at critical circumstances to avoid diarrhea For example 678 percent said they always wash their hands before eating compared to only 213 percent who reported doing so with soap In the same way 647 percent said they always wash their hands before feeding a child compared to 227 percent who reported doing so with soap A similar trend can be found when it comes to circumstances where there is the risk of coming in contact with feces So for example 743 percent claimed to rinse their hands after using the toilet but only 478 percent said they always do it with soap Washing hands with soap certainly merits strengthening
Table 15 Circumstances of rinsing (simple wash) or washing hands (wash with soap) inhouseholds according to respondentsrsquo own statements
Circumstances Never
()
Some times
()
Often
()
Always
()
When you wash your face at sunrise
Rinse 393
638
251
246
157
57
200
58With soap
When you wash or empty the potty of a child
Rinse 28
74
97
224
271
304
604
398With soap
After going to the toilet Rinse 06
51
57
180
194
291
743
478With soap
Before eating Rinse 04
174
56
382
263
231
678
213With soap
Before cooking Rinse 82
175
275
478
304
206
340
141With soap
Benin Baseline Survey of Peri-Urban Sanitation and Hygiene 24
-
Circumstances Never
()
Some times
()
Often
()
Always
()
Before feeding children Rinse 09
141
74
350
270
282
647
227With soap
After any task where I had to use my hands
Rinse 19
71
421
577
300
220
261
132With soap
After touching an animal Rinse 166
248
340
403
199
160
296
189With soap
After cleaning the bottom (feces) of my child
Rinse 19
74
71
180
215
304
695
443With soap
After cleaning the toilet Rinse 47
75
60
97
121
239
772
589With soap
After having taken care of a sick person
Rinse 129
183
325
356
182
181
364
279With soap
Other occasions Rinse 41
127
270
380
689
494With soap
Note proportions in bold are the answers to hand washing with soap
However in order to wash hands households must have the necessary supplies to do so These include the presence of a mobile or stationary hand washing device soap and water These devices should exist in one or more places in the home especially near places where food is handled or where people come in contact with feces
To complete information on the practice of hand washing we used an objective indicator to verify the presence of a hand washing station with or without required supplies water and a washing productmdasheither a soap bar liquid soap or even ashes These indicators are objective because they are based on actual existence of a hand washing station and nearby supplies The
Benin Baseline Survey of Peri-Urban Sanitation and Hygiene 25
indicator is different from previous indicators that are based solely on the intervieweesrsquo responses
UNICEFrsquos Multiple Indicator Cluster Survey and USAIDrsquos Demographic and Health Surveys use this indicator when carrying out their surveys in developing countries We tried to determine how many hand washing stations had necessary products for the practice of hand washing with soap and if these stations are located in a place accessible to all family members near the kitchen or the toilet The following table shows the results obtained concerning the presence of the supplies mentioned In this table the denominator used is the total number of households visited in order to compare the different hand washing stations for the entire sample In the following section we will find a discussion of accessibility to latrines However the results on the presence of a hand washing station near latrines are shown here to collect all information on this subject in the same section of the report We note the low number of households where these stations existed and the low percentage of households where the devices were equipped with water andor soap during our visit
Table 16 Percentage distribution of hand washing stations in several locations in the houseand supplies observed by location (N=856)
Station usually used by family members
Station near the area of food preparation
Station near the toilet
Households having a corner dedicated to hand washing
294 167 83
Water availability 271 158 79
Availability of soap 230 132 63
Availability of water and soap
221 129 62
To assess the key moments when household members actually wash their hands respondents were asked to name activities after which they wash their hands without making suggestions The responses obtained are summarized in Table 17 below These results reaffirm the need for people to know the moments when hand washing with soap is critical Note that only 254 percent of respondents feel that hand washing is key before preparing food Similarly only 340 percent felt that it was key before feeding a child Both are relatively low percentages
Benin Baseline Survey of Peri-Urban Sanitation and Hygiene 26
Table 17 Key moments of the day to wash hands
Moments Proportion of households ()
After going to the toilet 876
After doing poo 662
Before eating 938
After cleaning a child or washing out a diaper 138
After cleaning the toilet 421
After touching any utensil used for cleaning the house 82
After cleaning a chamber pot 151
Before preparing food 254
Before feeding a child 340
After touching or having cared for a patient 140
After eating 616
These data are consistent with the previous table confirming that although households are aware of the usefulness of this practice it takes time to become a habit
When asked what motivates household members to wash their hands with water and soap or detergent their spontaneous responses were
Table 18 Factors motivating hand washing in households
Motivational Factors Proportion of households ()
Prevent disease 868
Prevent diarrhea 325
Remove germs 361
Prevent dust from entering the mouth 127
Prevent dust from entering the food 33
It smells good 16
Benin Baseline Survey of Peri-Urban Sanitation and Hygiene 27
In four out of five households (868 percent) hand washing is done to prevent disease However health is not a sufficient factor to motivate hand washing with soap The presence of a functional device for hand washing has a lot to do with it
Among the 868 percent of households claiming to wash their hands because of disease only 246 percent have a hand washing station equipped with essential supplies (soap and water) near the kitchen
Other lesser reasons but related to the first are the prevention of diarrhea (325 percent) and the elimination of germs (361 percent)
Sanitation in Households
Household sanitation depends largely on the accessibility of hygiene infrastructure (latrine shower) in the household This is particularly important when the household has young children including children under five years old when they are most vulnerable 595 percent of households visited during this survey have a child younger than five years old and 453 percent have a child under three years old So the majority of children under the age of five are children less than three years old
Management of Feces During the survey respondents were asked ldquoThe last time your child under 3 years of age pooped where did he gordquo
Figure 6 summarizes the responses recorded from households
Figure 6 Distribution of households by places of defecation by children under the age of 3
Benin Baseline Survey of Peri-Urban Sanitation and Hygiene 28
A little more than three-quarters of households (776 percent) used a potty Cloth diapers (67 percent) and disposables (64 percent) were rarely used Other unsavory means were used and are found in the ldquoOtherrdquo category (13 percent) garbage piles in plastic bags and on the ground
Once the child has finished pooping parents dispose of the feces in different places toiletlatrines (668 percent) garbage dumps (204 percent) or garbage cans (34 percent) They are also thrown out with wastewater (31 percent) or disposed of in Other places (41 percent) such as the bush in the lagoon in the lake in gutters and in swampland
According to respondents in four out of five households (807 percent) childrenrsquos feces are disposed of by the head of household or hisher spouse and in just over one in 10 households (126 percent) by the sons or daughters of the head of household They are also disposed of by other relatives (67 percent) of the household members surveyed
The respondents were also asked ldquoWhere do family members go when they need to defecaterdquo Figure 7 summarizes the responses recorded on defecation areas used by household members surveyed In this figure the section ldquoVentilated Latrinesrdquo includes ventilated latrines and ventilated improved pit latrines
Figure 7 Distribution of households by place of defecation for family members
More than seven out of 10 households (743 percent) use sanitation facilities The remaining households use either fields the beach plastic bags (16 percent) or dumpsites (74 percent) The rest (46 percent) use swampy areas the lakeside public drains the lagoon or at times private for-fee or hanging latrines
For anal cleansing households use several means These are newsprint (40 percent) water (386 percent) toilet paper (196 percent) and leaves (14 percent)
Benin Baseline Survey of Peri-Urban Sanitation and Hygiene 29
Availability of Toilets in Households Information was collected during the survey about who put in the toilets used by households hence the question Did your household install the toilet that you are using Answers from the respondents are summarized in the Total column of the table below In addition the crossing of this question with the question of home ownership produces the following results Among homeowners a little more than one-third (345 percent) did not have a toilet compared to four households out of nine (454 percent) who installed a toilet in their house We note that one-fifth (201 percent) of these homeowners were not responsible for the installation of toilets in their homes This is the case with households that live in family homes in which they are considered to be the owners or co-owners For renters 762 percent did not install the toilets that are in the houses where they live only 07 percent are responsible for installing toilets in their home and a little more than one-fifth (231 percent) do not have a toilet In lodged households 537 percent did not install toilets in the house where they live only 63 percent are responsible for installing toilets in their home and four-tenths (400 percent) do not have a toilet in their house
Table 19 Distribution of households according to the person responsible for installing latrines and the title of ownership of the house
Installation of toilets by the household
Title of ownership of the house Total
Owner Renter Lodged
No they were already there
201 762 537 431
Yes 454 07 63 257
The household does not have a toilet
345 231 400 312
Total 100 100 100 100
At the household level when the decision was made to install latrines in nearly nine households out of 10 (877 percent) it was made by the head of household or spouse This decision was taken in 82 percent of households by the parents of the head of household or spouse and in 41 percent of households (renting) by the owners
Regarding the location of toilets the owners made the decision in a little less than half of households visited (47 percent) heads of households or spouses made it in one-third of households (341 percent) and in almost one-fifth of the households visited (188 percent) other actors such as parents of head of household or spouse and previous renters made the decision
Figure 8 provides information on the location of toilets in households
Benin Baseline Survey of Peri-Urban Sanitation and Hygiene 30
Figure 8 Distribution of households by location of toilets in the household
Half of households visited (501 percent) have their toilets inside or attached to their house a little less than half (479 percent) have theirs elsewhere in the compound usually in the courtyard and only 2 percent outside of the property
According to the responses obtained from respondents less than a quarter (224 percent) of toilet pits has been emptied recently Two-thirds of the emptied pits (666 percent) are emptied once a year Others are emptied with regular frequency such as once a month (08 percent) once every two months (08 percent) or once every three months (23 percent) Still others grouped in the section ldquoOthersrdquo (356 percent) are emptied twice a year once every two years and once every three years The average cost of one emptying is 44500 CFA Pit emptying is more common in households where the latrine is shared with other families (Chi2=63 p=000) among renters (Chi2=1238 p=000) in houses that flood (Chi2=263 p=000) and in families with a better socio-economic status (Chi3=91 p=001)
In regards to the place where the sewage sludge is dumped nine households out of 10 (902 percent) reported not knowing where it is emptied On the other hand one household out of 10 (98 percent) said that the toilets are flushed into rivers and the ocean All emptied toilets are still in use
Regarding shared toilets two households out of three (659 percent) share their toilets with other households The average number of households that share the same toilet is five
In the three municipalities of the study nearly seven households out of 10 (697 percent) use an improved sanitation infrastructure
Principal Reasons to Build or Not to Build Toilets We asked households with toilets for three main reasons why they built their toilets Figure 9 below shows the responses of households interviewed
Benin Baseline Survey of Peri-Urban Sanitation and Hygiene 31
Figure 9 Distribution of households according to principal reasons for building the toilets
Households mentioned the following three reasons most to justify building toilets privacy (699 percent) disease prevention (616 percent) and security (362 percent)
Households that do not have toilets mention the reasons below (Figure 10)
Figure 10 Distribution of households by principal reasons for not building latrines
The high cost of construction of latrines (677 percent) is by far the most common reason households justified not building the toilets While more households in the lower socio-economic status (715 percent) than in the higher socio-economic status (526 percent) give this reason the difference is not statistically significant Next the nature of the soil (373 percent) and the fact that the household does not have the necessary supplies to build latrines
Benin Baseline Survey of Peri-Urban Sanitation and Hygiene 32
(327 percent) are mentioned Other reasons are listed in smaller proportions as indicated in the graph The ldquoOtherrdquo category (216 percent) is comprised of those who do not have toilets (one-fifth of respondents) among other reasonsmdashthe delay in resettlement operations the effects of flooding during the rainy season the refusal of some tenants to contribute upon request of the owner to build toilets and zoning and resettlement issues
In households feelings of satisfaction or dissatisfaction regarding the use of the latrine were recorded depending on where the household defecates In fact 325 percent of households are very dissatisfied with the place where they defecate 129 percent are somewhat dissatisfied 27 percent have no opinion 227 percent are rather satisfied and 293 percent are very satisfied
Reasons for dissatisfaction are summarized in Figure 11
Figure 11 Distribution of households by reasons for dissatisfaction in the use of a latrine
The reason most cited by three out of five households interviewed (595 percent) is that the defecation site is not hygienic The section ldquoOtherrdquo (63 percent) takes into account reasons such as the latrine is full or almost full latrine has no door latrine has a defective door too many people use the latrine flooding latrine is dirty lacks a vent pipe and does not allow privacy It should be added that the response about privacy is very uncommon but is relevant especially in the case of shared latrines that are very close to living quarters where the person using the latrine is known by all
Reasons for satisfaction are summarized in Figure 12
Benin Baseline Survey of Peri-Urban Sanitation and Hygiene 33
Figure 12 Distribution of households by reasons justifying the feelings of satisfaction ofhouseholds that use the latrine
The proximity of the place (60 percent) maintenance (419 percent) safety (389 percent) and the fact that the site provides a sense of privacy (378) are the satisfaction factors households mention the most
Despite the fact that almost a third (312 percent) of households interviewed do not have a latrine and that nearly two-thirds (595 percent) have decried hygiene conditions only a quarter of households (257 percent) surveyed seem to want to do something to change their present situation regarding access to a latrine
To change the current situation households made the following suggestions building private latrines (291 percent) improving private latrines owned by the household (159 percent) asking the owner to build a latrine (155 percent) asking for community help to build latrines (05 percent) and requesting assistance of government or outside sources to improve the sanitation situation (241 percent) Actions that are covered under the section ldquoOtherrdquo (15 percent) include moving the household emptying the latrine andor covering the latrine
Only 76 percent of households interviewed intend to install or change their sanitation facility in the next six months
More than the majority (69 percent) of households thinks that sanitation is a problem in their district They mention reasons such as open defecation (525 percent) odor (558 percent) presence of feces everywhere (25 percent) unhealthy environment (44 percent) lack of health services (503 percent) lack of resources (335 percent) and ldquoOtherrdquo reasons (52 percent)mdash flooding of toilets in the rainy season high level of ground water full toilets not emptied defecation in bags the proliferation of flies and occupancy of swamp areas
Benin Baseline Survey of Peri-Urban Sanitation and Hygiene 34
Observation of Households Toilets
Condition of Toilets Data collectors asked householders who owned toilets if they could observe their facilities In response to the question ldquoMay I see your toiletsrdquo nine out of 10 households (901 percent) responded in the affirmative Only 53 percent of toilets observed were built during the 12 months that preceded the survey From observation of the distance between the toilets and the dwelling it appears that 854 percent of toilets are in the homes 26 percent in the yard 111 percent at a distance less than or equal to 20 meters from the house and 09 percent more than 20 meters from the house
Of the toilets observed 965 percent have walls 906 percent have a roof 886 percent allow privacy 69 percent keep their door closed and 64 percent are a series of toilets with more than one entrance to allow several persons to use them at the same time Two elements observed help make them more accessible to children squat toilets with a smaller hole (64 percent) maybe by chance and toilets with a lower seat (636 percent) Fewer than half (459 percent) of latrines visited had a covered hole
In the latrines the following conditions were observed (using a flashlight) fecal matter was observed in squat holes in 502 percent of cases anal cleansing products (236 percent) wet seats (438 percent) grey colored seats (129 percent) bad smells (365 percent) presence of flies (21 percent) and cockroaches (163 percent)
According to respondents only 36 percent of toilets are flooded during the rainy season Remember that flooded houses are more common in Cotonou When latrines are flooded household members go to defecate in a dry public place (30 percent) in the lake (30 percent) in a private dry place (15 percent) in a plastic bag (15 percent) on a dump site (5 percent) or in the flooded latrine (5 percent)
Also during the observation an assessment was made of latrine maintenance namely the floor the hole cover and the anal cleansing material (toilet paper for the most part) Figure 13 below shows the results of observed toilet maintenance The graph shows the cumulative percentages by component
Benin Baseline Survey of Peri-Urban Sanitation and Hygiene 35
Figure 13 Results of the assessment of latrine maintenance components in observed latrines
In general observations showed that only about a third of latrines had been adequately cleaned Thus each latrine component only receives an approximate cleaning 531 percent for the floor 186 percent for the hole cover and 533 percent for the anal cleansing material
In nearly one out of two households (486 percent) a broom was noted near the toilets Finally feces in the observed toilets go mainly into septic tanks (586 percent) and dry holes (394 percent)
Psycho-Social Determinants of Latrine Ownership
To measure psycho-social determinants of latrine ownership the respondents were read a series of statements to elicit their opinion Responses obtained are shown in Table 20 below
Benin Baseline Survey of Peri-Urban Sanitation and Hygiene 36
Table 20 Household opinions on latrine ownership
Statements Do not agree No opinion
Some-what agree
Strongly agree
It makes the owners appear modern 70 82 287 561
It makes the owners respectable members of the community
50 79 298 572
It makes the owners respected by people who visit them
20 43 306 631
It makes the owners more appreciated
35 65 309 591
It makes the members of the household proud
11 33 228 729
It allows women to have privacy at any time of the day
08 05 129 858
It helps keep the shared compound areas clean
22 50 214 713
It doesnrsquot reduce the number of flies in the house
449 103 192 256
It allows you to go relieve yourself easily when you are sick
09 40 254 697
It allows you to go relieve yourself easily when you are old
18 39 278 665
It reduces the possibility of disease in the household
21 30 256 692
It gives toilet users a little more privacy
01 08 185 805
Itrsquos annoying to go to the ldquojohnrdquo every time to do your business
719 140 39 102
It avoids the dangers of having to go do your business at night in the bush
05 01 118 876
Itrsquos really hard to maintain latrines so that they are always operational
594 125 177 104
It is difficult to maintain them so that they are always clean
607 108 178 108
Benin Baseline Survey of Peri-Urban Sanitation and Hygiene 37
-
Summary Table of Survey Indicators
A summary table of indicators has been generated according to socio-economic groups Socio-demographic factors were used to establish socio-economic levels and an analysis was made for each income level The socio-economic levels were established using the conventional method of creating a wealth index The data were subsequently processed by municipality to explore the differences among Cotonou Abomey-Calavi and Porto-Novo
Table 21 Key indicators by household socio-economic level
Indicators
Socio economic typology All subgroups combined
(N=856)
Pearson Chi-square 8
p
Lower
(N=245)
Intermediate
(N=263)
Upper
(N=278)
of households using an improved sanitation facility
453 691 945 697 164675 01
of households with a station for hand washing equipped with essential supplies (soap and water) near the toilets
11 11 142 55 63584 01
of households with a station for hand washing equipped with essential supplies (soap and water) near the kitchen
109 160 391 221 75597 01
of households treating drinking water correctly
32 60 45 46 2689 lt Not significant
of households storing drinking water correctly
600 702 900 735 68427 01
A p value of 01 means that the relationships are highly significant meaning improved infrastructure is more commonly found in the upper socio-economic group
Table 22 below provides a specific summary of each of the three municipalities of the study
8 The Chi-square seeks to establish the relationship between two categorical variables Sex is a categorical variables because it would group individuals into one of two categories men or women This would be a dichotomous categorical variable Socioeconomic quintiles would also be a categorical variable In this case it would not be dichotomous Chi-square can be used to explore the relationship between the two types
Benin Baseline Survey of Peri-Urban Sanitation and Hygiene 38
Table 22 Presentation of key indicators by municipality
Indicators
Municipality Together
(N=856)
Pearson Chi-square
p
Abomey-Calavi
(N=155)
Cotonou
(N=349)
Porto-Novo
(N=352)
of households using improved sanitation infrastructure
516 799 676 697 42106 gt 921
01
of households with a station for hand washing with essential supplies (soap and water) near the toilets
13 86 43 55 12780 01
of households with a station for hand washing with essential supplies (soap and water) near the kitchen
161 284 185 221 13880 01
of households who treat their drinking water properly
77 54 23 46 8471 02
of households who store their drinking water properly
645 785 724 735 11117 01
All associations reported are statistically significant The improved facilities and better practices are more commonly reported in Cotonou
Benin Baseline Survey of Peri-Urban Sanitation and Hygiene 39
-
Table 23 below combines the variables of the two tables above
Table 23 Presentation of indicators by municipality and by household socio-economic levels
Indicators
Municipalities
Abomey Calavi Cotonou Porto-Novo
poor average wealthy Pearson Chi-square
poor average wealthy Pearson Chi-square
poor average wealthy Pearson Chi-square
of households using improved sanitation infrastructure
204 581 846 39148 gt 921
485 716 988 8348 gt 921
521 731 906 Significant 01 level
of households with a station for hand washing with essential supplies (soap and water) near the toilets
00 00 51 6026 gt 5991
00 17 170 28092 gt 921
18 10 129 Significant 01 level
of households with a station for hand washing with essential supplies (soap and water) near the kitchen
19 45 97 19915 gt 921
74 147 467 52703 gt 921
141 202 247 Not significant
of households who properly treat their drinking water
74 81 77 0018 lt 4605
59 69 42 0964 lt 4605
06 38 35 Not significant
of households who store their drinking
574 581 846 9201 gt 529 733 927 48001 638 740 871 15323 Significant
Benin Baseline Survey of Peri-Urban Sanitation and Hygiene 40
-
Indicators
Municipalities
Abomey Calavi Cotonou Porto-Novo
poor average wealthy Pearson Chi-square
poor average wealthy Pearson Chi-square
poor average wealthy Pearson Chi-square
water properly 7824 gt 921 01 level
Benin Baseline Survey of Peri-Urban Sanitation and Hygiene 41
Exposure to Information Messages on Hygiene and Sanitation Practices
During this survey information was also collected on the exposure of households to information messages on hygiene and sanitation practices as well as on sources of this information Data show that only one in five households (196 percent) received information on washing hands during the 30 days preceding the survey Figure 14 below summarizes the main sources of information received by the households
Figure 14 Distribution of households having received information on hand washing by sourceof information
As illustrated in the figure the most common sources of information to households are the radio (518 percent) and television (482 percent) and to some extent health centers (243 percent)
Regarding the treatment of drinking water only a quarter of the households surveyed (247 percent) received information on water treatment during the 30 days preceding the survey Sources of this information are practically the same as those for hand washing (Figure 15)
Benin Baseline Survey of Peri-Urban Sanitation and Hygiene 42
Figure 15 Distribution of households who received information on water treatment by sourceof information
Regarding sanitation only one-fifth (204 percent) of respondents had seen or heard about sanitation during the 30 days preceding the survey Sources of information received by these households are shown in Figure 16
Figure 16 Distribution of households having received information on sanitation by source of information
Whether for hand washing water treatment or sanitation television and the radio remain the two most cited sources of information by the households
The households surveyed were rarely visited by health educators for sensitization on the practice of open defecation (21 percent) or the daily maintenance of toilets (4 percent)
As for information on hydro-fecal diseases a little less than a third (274 percent) of households reported having received information on diarrhea or cholera in the 30 days that preceded the survey The most cited sources of information were the radio (594 percent) television (449 percent) and the health center (406 percent)
Benin Baseline Survey of Peri-Urban Sanitation and Hygiene 43
Conclusion
Data from this study indicate that certain populations from the municipalities of Cotonou Porto-Novo and Abomey-Calavi lack basic hygiene and sanitation infrastructure even though they live in urban areas The overall acceptability of conditions varies from one municipality to another The results of the study reveal that nearly seven out of 10 households surveyed use an improved sanitation facility The problem is less acute in Cotonou (799 percent) and Porto-Novo (676 percent) than in Abomey-Calavi (516 percent) Although households recognize the importance of hand washing in preventing certain diseases the act of washing hands with water and soap at key moments is still far from being a habit in many households Hand washing stations exist in very few households depending on whether the hand washing station is located near the kitchen or toilet In Cotonou the availability of hand washing stations is 284 percent near the kitchen compared to 86 percent near the toilets in Porto-Novo 185 percent have hand washing stations near the kitchen compared to 43 percent near the toilets and in Abomey-Calavi 161 percent of households have facilities near the kitchen compared to 13 percent near the toilets
Regarding household supply of drinking water in nine out of 10 households surveyed the drinking water comes from the distribution network of SONEB Only a minority of households drinks water from other sources including wells Only 58 percent of households treat drinking water Results of chlorine tests made in households that used chlorination show the average concentration of chlorine in the water as 349 mgl which is very high considering the World Health Organization standard of free chlorine concentration of treated water is 02 to 05 mgl Also the average number of days that the households continue to drink treated water is 64 days A poor household practice of mixing treated water with untreated whenever the water is renewed in the container was also observed All these reasons explain the alarmingly low percentage of households that properly treat their drinking water This indicator is 54 percent in Cotonou compared to 77 percent in Abomey-Calavi and 23 percent in Porto-Novo
Regarding proper storage of drinking water nearly three out of four households (735 percent) store their drinking water properly This indicator is 785 percent in Cotonou 724 percent in Porto-Novo and 645 percent in Abomey-Calavi
All these indicators that characterize the current state of hygiene and sanitation in these peri-urban districts surveyed also change depending on the socio-economic level of households
To reduce the health vulnerability of households in the study population it is necessary that appropriate interventions be implemented in the peri-urban neighborhoods To this end radio television and to some extent health centers appear to be the most appropriate channels for disseminating information and awareness messages according to data from the study
Benin Baseline Survey of Peri-Urban Sanitation and Hygiene 44
Endnotes
Boschi-Pinto C L Velebit and K Shibuyac 2008 Estimating Child Mortality Due to Diarrhoea in Developing Countries Bulletin of the World Health 86710ndash717
Water and Sanitation Program 2012 Economic Impact of Poor Sanitation in Africa
Benin Baseline Survey of Peri-Urban Sanitation and Hygiene 45
Annex 1 ndash Population from Sampled Districts
Municipality Districts Population Cotonou AVOTROU 17318
MINONTCHOU 7145 LADJI 8409
Abomey- GODOMEY 60034 Calavi TOGOUDO
TOKPA ZOUNGO 11090 HOUEKEGBO 1718 HOUEKEHONOU 1770
Porto-Novo ACCRON 5350 AVASSA 1715 FOUN FOUN 3412 TOKPA HOUEYOGBE 1638 GBEDJI
TOTAL 119601
The Survey Questionnaire is available separately on request from contactwashplusorg
Benin Baseline Survey of Peri-Urban Sanitation and Hygiene 46
WASHplus FHI 360 1825 Connecticut Ave NW Washington DC 20009 2028848000 wwwWASHplusorg contactwashplusorg
Benin Baseline Survey of Peri-Urban Sanitation and Hygiene 47
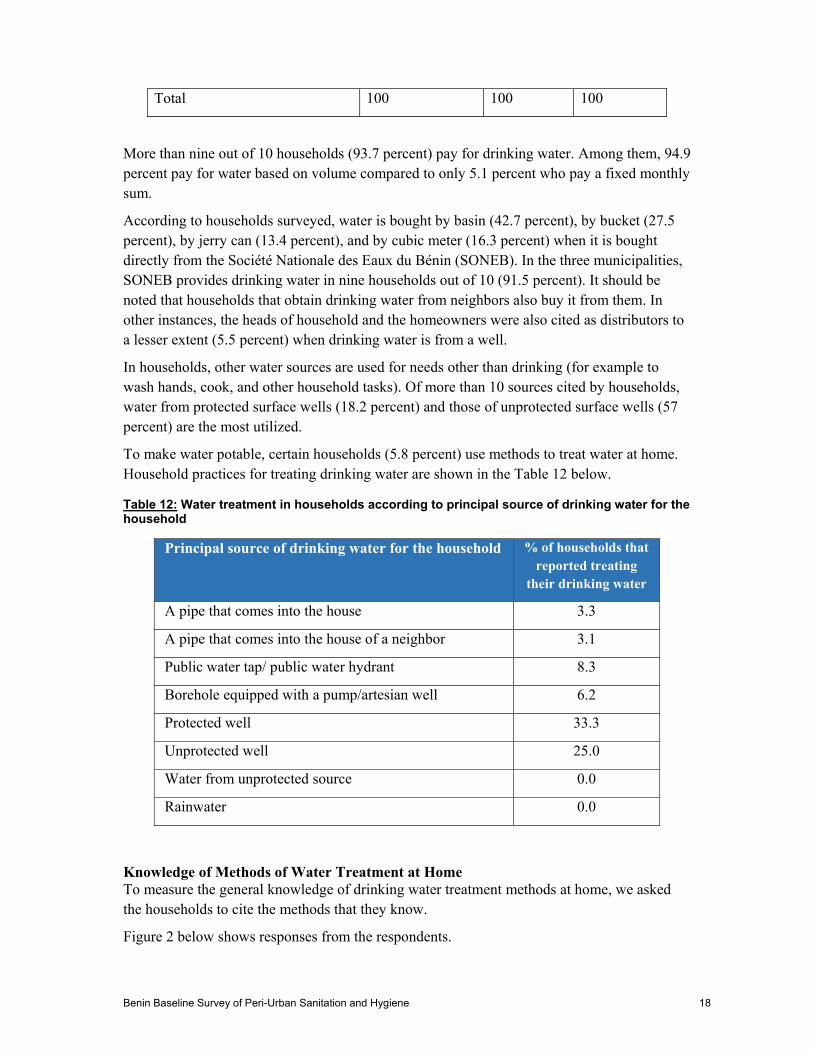
Total 100 100 100
More than nine out of 10 households (937 percent) pay for drinking water Among them 949 percent pay for water based on volume compared to only 51 percent who pay a fixed monthly sum
According to households surveyed water is bought by basin (427 percent) by bucket (275 percent) by jerry can (134 percent) and by cubic meter (163 percent) when it is bought directly from the Socieacuteteacute Nationale des Eaux du Beacutenin (SONEB) In the three municipalities SONEB provides drinking water in nine households out of 10 (915 percent) It should be noted that households that obtain drinking water from neighbors also buy it from them In other instances the heads of household and the homeowners were also cited as distributors to a lesser extent (55 percent) when drinking water is from a well
In households other water sources are used for needs other than drinking (for example to wash hands cook and other household tasks) Of more than 10 sources cited by households water from protected surface wells (182 percent) and those of unprotected surface wells (57 percent) are the most utilized
To make water potable certain households (58 percent) use methods to treat water at home Household practices for treating drinking water are shown in the Table 12 below
Table 12 Water treatment in households according to principal source of drinking water for the household
Principal source of drinking water for the household of households that reported treating
their drinking water
A pipe that comes into the house 33
A pipe that comes into the house of a neighbor 31
Public water tap public water hydrant 83
Borehole equipped with a pumpartesian well 62
Protected well 333
Unprotected well 250
Water from unprotected source 00
Rainwater 00
Knowledge of Methods of Water Treatment at Home To measure the general knowledge of drinking water treatment methods at home we asked the households to cite the methods that they know
Figure 2 below shows responses from the respondents
Benin Baseline Survey of Peri-Urban Sanitation and Hygiene 18
Figure 2 Distribution of respondents according to their knowledge of methods to treat drinking water
In data from Figure 2 it is clear that the two most known methods of household water treatment were boiling (328 percent) and using Aquatabs and other effervescent products (54 percent) Methods such as the use of coagulantflocculants (153 percent) and cloth filters (72 percent) are known in relatively small proportions The category ldquootherrdquo takes into account products such as kaolin charcoal permanganate etc (96 percent)
Water Treatment at Home Only a minority of households (58 percent) treat water at home so that it is potable No statistical association has been found between household water treatment and socio-economic group (Chi2=086 p=065) Reasons given by these households for treating water are rooted in beliefs and not in true knowledge about water quality These include campaign messages promoting health (426 percent) household habit of treating drinking water (404 percent) having the treatment product at home (21 percent) and the fact that it is largely accepted that the sources of water are not safe for drinking without treatment (213 percent)
On the other hand those who donrsquot treat the water evoke reasons such as the lack of information on water treatment (58 percent) no tradition of having treated water at home (55 percent) unavailability of a treatment product (07 percent) the water source is considered to be clean and therefore it does not need to be treated before drinking (852 percent) and no reason (22 percent)
During the survey households were asked who treats the water and what treatment methods are used Figure 3 shows methods of treatment used by households
Benin Baseline Survey of Peri-Urban Sanitation and Hygiene 19
Figure 3 Distribution of households according to methods of household water treatment
There is a statistical relationship between the source of drinking water and treatment practices Households who use a pipe private or public tend not to treat water In addition those who use an artesian well or a borehole with pump an unprotected well or surface water tend to treat The relationship between these two variables source of water and treatment of water is shown in the following table The relationship is statistically significant or Chi2 value is 528 and the probability of 00 However 85 percent of households who have not treated their water report that they donrsquot do it because the source provides safe water to drink and therefore the need to treat the water does not exist Only 5 percent say they have never treated drinking water at home and 6 percent reported not being aware that they needed to treat it That is to say they tend to trust the source Furthermore no statistical relationship was detected between household water treatment and socio-economic level (Chi2=086 p=065)
Table 13 Relationship between the source of drinking water and its treatment at home
Source of drinking water Treatment of drinking water Total
(N=854) No (N=804)
Yes (N=50)
Pipe at home at the neighborrsquos or a hydrant
715 380 696
Artesian wells 219 320 225 Unprotected wells 19 20 19 Protected wells 10 80 14 Unprotected source 37 200 47 Total 1000 1000 1000
Benin Baseline Survey of Peri-Urban Sanitation and Hygiene 20
Three out of four households (74 percent) use effervescent chlorine tabletsAquatabs for water treatment Other methods are used by less than one household out of 10 The ldquoother category includes products such as kaolin (6 percent)
However it should be noted that all methods used are not effective to purify water Among the many methods reported being used by households only three are able to treat water (if used correctly) boiling liquid chlorine or effervescent chlorine tablets (including Aquatabs)
Boiling is a traditional method of treating water This method if used correctly can provide safe drinking water to a household that has no other option Boiling will kill pathogenic germs but it doesnrsquot have a lasting effect Therefore if the water is not properly handled it can be recontaminated Boiled water should therefore be safely stored and used within one to two days
As for chlorination it is a simple and effective way to disinfect water It consists of introducing chlorine products (chlorine tablets bleach) into water to kill any micro-organisms it may contain After a contact time of about 30 minutes water is considered safe It remains safe for a few hours or days (depending on storage conditions) with the residual chlorine
Thus of the small minority of respondent households 58 percent (50856) that treat water at home 82 percent (4150) use effective treatment methods6 However the results of residual chlorine tests made in households that treat water show that only 76 percent (3850) of these households used chlorination We found that the average concentration of chlorine in water is 349 mgl which seems very high given the fact that according to the World Health Organization (WHO) concentration of free chlorine in treated water should be 02 to 05 mgl It is likely that over-chlorination is occurring due to chlorination of tap water which in principle is already chlorinated Also note that the average number of days during which households continue to drink the treated water is 64 days Poor water treatment practices were observed in a minority of households (8 percent) (1650) that mix treated with untreated water whenever they replenish the water in the container Only 46 percent (39856) of households from the three municipalities treat drinking water properly
There is a statistical relationship between knowledge of Aquatabs and its use Those who know of Aquatabs are more likely to use them This relationship is significant so that Chi2=192 and p=000 This relationship is shown in the following table
6 Meaning when all required steps are respected
Benin Baseline Survey of Peri-Urban Sanitation and Hygiene 21
Table 14 Relationship between knowledge of Aquatabs and treatment of water at home
Report knowing about Aquatabs as a known method for home treatment of drinking water
Home treatment of drinking water Total
Yes
(N= 804)
No
(N =50)
Yes 840 521 460
No 160 479 540
Total 100 100 100
Storage of Drinking Water in Homes All efforts to make water safe to drink are useless if it is not stored or handled properly During the survey information was collected on the conditions of storage and handling of drinking water Several containers are used by households to store drinking water (Figure 4)
Figure 4 Distribution of households according to storage containers used for drinking water
Buckets (722 percent) containers below or above 25 L (165 percent) and clay jars (86 percent) are the most used by households for storing drinking water
From the results of observations made by data collectors in households it appears that in the overwhelming majority of cases the containers used are closedcovered (965 percent) with tight fitting lids (925 percent) clean on the outside (866 percent) and out of reach of animals (936 percent) Only 06 percent of vessels observed had a tap
Benin Baseline Survey of Peri-Urban Sanitation and Hygiene 22
Looking at households where the container used to store water is both closed with a tight fitting lid and clean on the outside and out of reach of animals we realize that 735 percent of households in the three municipalities store their drinking water properly
There is a statistical relationship between the use of a covered container to store water and socio-economic status as the use of a cover goes from 938 percent in the lower socio-economic group to 971 percent in the intermediate group and 989 percent in the higher group (Chi2=111 p=00) Also we found a statistical relationship between the use of a tight-fitting lid and socio-economic status The presence of a tight-fitting lid goes from 871 percent in the lower socio-economic group to 909 percent in the intermediate group and 989 percent in the upper group (Chi2=277 p=00)
Household Hygiene
The practice of hand hygiene is central to household hygiene in general The key behavior of hand hygiene is washing hands especially with soap Within households visited data have been collected on the availability and the various uses of soap Nearly 94 percent of households visited had soap available at the time of the interview The following chart provides information on the most commonly used types of soap in most households7
Figure 5 Distribution of households by most commonly used type of soap
In almost all households (985 percent) soaps used are purchased by the head of household or hisher spouse The soap purchased is used to wash clothes (986 percent) to bathe (952 percent) wash children (631 percent) wash the buttocks of children (91 percent) wash the hands of children (119 percent) wash hands after using the toilet (359 percent) wash hands before feeding children (118 percent) wash hands before cooking (131 percent) and wash hands before eating (263 percent)
Hand washing is a practice that surveyed households are very aware of but regrettably the act of washing hands with soap and water is not yet a regular habit for many people and children are not properly taught to use soap to wash their hands
7 We do not have information on the usage of each type of soap as this was not a question posed
Benin Baseline Survey of Peri-Urban Sanitation and Hygiene 23
-
We recognize that researching hand washing is a challenge as some respondents tend to report what is expected socially instead of reporting actual practice A way to address this challenge is to ask people how often hand washing is practiced in different circumstances Table 15 shows the distribution of respondentsrsquo answers when asked to use four types of frequency for each circumstance never sometimes often and always In addition we wanted to study the difference between the practice of rinsing hands without using soap and the practice of washing hands where soap is used The comparison between rinsing and washing is also presented in Table 15 This table shows us respondentsrsquo own statements about rinsing and washing at critical circumstances to avoid diarrhea For example 678 percent said they always wash their hands before eating compared to only 213 percent who reported doing so with soap In the same way 647 percent said they always wash their hands before feeding a child compared to 227 percent who reported doing so with soap A similar trend can be found when it comes to circumstances where there is the risk of coming in contact with feces So for example 743 percent claimed to rinse their hands after using the toilet but only 478 percent said they always do it with soap Washing hands with soap certainly merits strengthening
Table 15 Circumstances of rinsing (simple wash) or washing hands (wash with soap) inhouseholds according to respondentsrsquo own statements
Circumstances Never
()
Some times
()
Often
()
Always
()
When you wash your face at sunrise
Rinse 393
638
251
246
157
57
200
58With soap
When you wash or empty the potty of a child
Rinse 28
74
97
224
271
304
604
398With soap
After going to the toilet Rinse 06
51
57
180
194
291
743
478With soap
Before eating Rinse 04
174
56
382
263
231
678
213With soap
Before cooking Rinse 82
175
275
478
304
206
340
141With soap
Benin Baseline Survey of Peri-Urban Sanitation and Hygiene 24
-
Circumstances Never
()
Some times
()
Often
()
Always
()
Before feeding children Rinse 09
141
74
350
270
282
647
227With soap
After any task where I had to use my hands
Rinse 19
71
421
577
300
220
261
132With soap
After touching an animal Rinse 166
248
340
403
199
160
296
189With soap
After cleaning the bottom (feces) of my child
Rinse 19
74
71
180
215
304
695
443With soap
After cleaning the toilet Rinse 47
75
60
97
121
239
772
589With soap
After having taken care of a sick person
Rinse 129
183
325
356
182
181
364
279With soap
Other occasions Rinse 41
127
270
380
689
494With soap
Note proportions in bold are the answers to hand washing with soap
However in order to wash hands households must have the necessary supplies to do so These include the presence of a mobile or stationary hand washing device soap and water These devices should exist in one or more places in the home especially near places where food is handled or where people come in contact with feces
To complete information on the practice of hand washing we used an objective indicator to verify the presence of a hand washing station with or without required supplies water and a washing productmdasheither a soap bar liquid soap or even ashes These indicators are objective because they are based on actual existence of a hand washing station and nearby supplies The
Benin Baseline Survey of Peri-Urban Sanitation and Hygiene 25
indicator is different from previous indicators that are based solely on the intervieweesrsquo responses
UNICEFrsquos Multiple Indicator Cluster Survey and USAIDrsquos Demographic and Health Surveys use this indicator when carrying out their surveys in developing countries We tried to determine how many hand washing stations had necessary products for the practice of hand washing with soap and if these stations are located in a place accessible to all family members near the kitchen or the toilet The following table shows the results obtained concerning the presence of the supplies mentioned In this table the denominator used is the total number of households visited in order to compare the different hand washing stations for the entire sample In the following section we will find a discussion of accessibility to latrines However the results on the presence of a hand washing station near latrines are shown here to collect all information on this subject in the same section of the report We note the low number of households where these stations existed and the low percentage of households where the devices were equipped with water andor soap during our visit
Table 16 Percentage distribution of hand washing stations in several locations in the houseand supplies observed by location (N=856)
Station usually used by family members
Station near the area of food preparation
Station near the toilet
Households having a corner dedicated to hand washing
294 167 83
Water availability 271 158 79
Availability of soap 230 132 63
Availability of water and soap
221 129 62
To assess the key moments when household members actually wash their hands respondents were asked to name activities after which they wash their hands without making suggestions The responses obtained are summarized in Table 17 below These results reaffirm the need for people to know the moments when hand washing with soap is critical Note that only 254 percent of respondents feel that hand washing is key before preparing food Similarly only 340 percent felt that it was key before feeding a child Both are relatively low percentages
Benin Baseline Survey of Peri-Urban Sanitation and Hygiene 26
Table 17 Key moments of the day to wash hands
Moments Proportion of households ()
After going to the toilet 876
After doing poo 662
Before eating 938
After cleaning a child or washing out a diaper 138
After cleaning the toilet 421
After touching any utensil used for cleaning the house 82
After cleaning a chamber pot 151
Before preparing food 254
Before feeding a child 340
After touching or having cared for a patient 140
After eating 616
These data are consistent with the previous table confirming that although households are aware of the usefulness of this practice it takes time to become a habit
When asked what motivates household members to wash their hands with water and soap or detergent their spontaneous responses were
Table 18 Factors motivating hand washing in households
Motivational Factors Proportion of households ()
Prevent disease 868
Prevent diarrhea 325
Remove germs 361
Prevent dust from entering the mouth 127
Prevent dust from entering the food 33
It smells good 16
Benin Baseline Survey of Peri-Urban Sanitation and Hygiene 27
In four out of five households (868 percent) hand washing is done to prevent disease However health is not a sufficient factor to motivate hand washing with soap The presence of a functional device for hand washing has a lot to do with it
Among the 868 percent of households claiming to wash their hands because of disease only 246 percent have a hand washing station equipped with essential supplies (soap and water) near the kitchen
Other lesser reasons but related to the first are the prevention of diarrhea (325 percent) and the elimination of germs (361 percent)
Sanitation in Households
Household sanitation depends largely on the accessibility of hygiene infrastructure (latrine shower) in the household This is particularly important when the household has young children including children under five years old when they are most vulnerable 595 percent of households visited during this survey have a child younger than five years old and 453 percent have a child under three years old So the majority of children under the age of five are children less than three years old
Management of Feces During the survey respondents were asked ldquoThe last time your child under 3 years of age pooped where did he gordquo
Figure 6 summarizes the responses recorded from households
Figure 6 Distribution of households by places of defecation by children under the age of 3
Benin Baseline Survey of Peri-Urban Sanitation and Hygiene 28
A little more than three-quarters of households (776 percent) used a potty Cloth diapers (67 percent) and disposables (64 percent) were rarely used Other unsavory means were used and are found in the ldquoOtherrdquo category (13 percent) garbage piles in plastic bags and on the ground
Once the child has finished pooping parents dispose of the feces in different places toiletlatrines (668 percent) garbage dumps (204 percent) or garbage cans (34 percent) They are also thrown out with wastewater (31 percent) or disposed of in Other places (41 percent) such as the bush in the lagoon in the lake in gutters and in swampland
According to respondents in four out of five households (807 percent) childrenrsquos feces are disposed of by the head of household or hisher spouse and in just over one in 10 households (126 percent) by the sons or daughters of the head of household They are also disposed of by other relatives (67 percent) of the household members surveyed
The respondents were also asked ldquoWhere do family members go when they need to defecaterdquo Figure 7 summarizes the responses recorded on defecation areas used by household members surveyed In this figure the section ldquoVentilated Latrinesrdquo includes ventilated latrines and ventilated improved pit latrines
Figure 7 Distribution of households by place of defecation for family members
More than seven out of 10 households (743 percent) use sanitation facilities The remaining households use either fields the beach plastic bags (16 percent) or dumpsites (74 percent) The rest (46 percent) use swampy areas the lakeside public drains the lagoon or at times private for-fee or hanging latrines
For anal cleansing households use several means These are newsprint (40 percent) water (386 percent) toilet paper (196 percent) and leaves (14 percent)
Benin Baseline Survey of Peri-Urban Sanitation and Hygiene 29
Availability of Toilets in Households Information was collected during the survey about who put in the toilets used by households hence the question Did your household install the toilet that you are using Answers from the respondents are summarized in the Total column of the table below In addition the crossing of this question with the question of home ownership produces the following results Among homeowners a little more than one-third (345 percent) did not have a toilet compared to four households out of nine (454 percent) who installed a toilet in their house We note that one-fifth (201 percent) of these homeowners were not responsible for the installation of toilets in their homes This is the case with households that live in family homes in which they are considered to be the owners or co-owners For renters 762 percent did not install the toilets that are in the houses where they live only 07 percent are responsible for installing toilets in their home and a little more than one-fifth (231 percent) do not have a toilet In lodged households 537 percent did not install toilets in the house where they live only 63 percent are responsible for installing toilets in their home and four-tenths (400 percent) do not have a toilet in their house
Table 19 Distribution of households according to the person responsible for installing latrines and the title of ownership of the house
Installation of toilets by the household
Title of ownership of the house Total
Owner Renter Lodged
No they were already there
201 762 537 431
Yes 454 07 63 257
The household does not have a toilet
345 231 400 312
Total 100 100 100 100
At the household level when the decision was made to install latrines in nearly nine households out of 10 (877 percent) it was made by the head of household or spouse This decision was taken in 82 percent of households by the parents of the head of household or spouse and in 41 percent of households (renting) by the owners
Regarding the location of toilets the owners made the decision in a little less than half of households visited (47 percent) heads of households or spouses made it in one-third of households (341 percent) and in almost one-fifth of the households visited (188 percent) other actors such as parents of head of household or spouse and previous renters made the decision
Figure 8 provides information on the location of toilets in households
Benin Baseline Survey of Peri-Urban Sanitation and Hygiene 30
Figure 8 Distribution of households by location of toilets in the household
Half of households visited (501 percent) have their toilets inside or attached to their house a little less than half (479 percent) have theirs elsewhere in the compound usually in the courtyard and only 2 percent outside of the property
According to the responses obtained from respondents less than a quarter (224 percent) of toilet pits has been emptied recently Two-thirds of the emptied pits (666 percent) are emptied once a year Others are emptied with regular frequency such as once a month (08 percent) once every two months (08 percent) or once every three months (23 percent) Still others grouped in the section ldquoOthersrdquo (356 percent) are emptied twice a year once every two years and once every three years The average cost of one emptying is 44500 CFA Pit emptying is more common in households where the latrine is shared with other families (Chi2=63 p=000) among renters (Chi2=1238 p=000) in houses that flood (Chi2=263 p=000) and in families with a better socio-economic status (Chi3=91 p=001)
In regards to the place where the sewage sludge is dumped nine households out of 10 (902 percent) reported not knowing where it is emptied On the other hand one household out of 10 (98 percent) said that the toilets are flushed into rivers and the ocean All emptied toilets are still in use
Regarding shared toilets two households out of three (659 percent) share their toilets with other households The average number of households that share the same toilet is five
In the three municipalities of the study nearly seven households out of 10 (697 percent) use an improved sanitation infrastructure
Principal Reasons to Build or Not to Build Toilets We asked households with toilets for three main reasons why they built their toilets Figure 9 below shows the responses of households interviewed
Benin Baseline Survey of Peri-Urban Sanitation and Hygiene 31
Figure 9 Distribution of households according to principal reasons for building the toilets
Households mentioned the following three reasons most to justify building toilets privacy (699 percent) disease prevention (616 percent) and security (362 percent)
Households that do not have toilets mention the reasons below (Figure 10)
Figure 10 Distribution of households by principal reasons for not building latrines
The high cost of construction of latrines (677 percent) is by far the most common reason households justified not building the toilets While more households in the lower socio-economic status (715 percent) than in the higher socio-economic status (526 percent) give this reason the difference is not statistically significant Next the nature of the soil (373 percent) and the fact that the household does not have the necessary supplies to build latrines
Benin Baseline Survey of Peri-Urban Sanitation and Hygiene 32
(327 percent) are mentioned Other reasons are listed in smaller proportions as indicated in the graph The ldquoOtherrdquo category (216 percent) is comprised of those who do not have toilets (one-fifth of respondents) among other reasonsmdashthe delay in resettlement operations the effects of flooding during the rainy season the refusal of some tenants to contribute upon request of the owner to build toilets and zoning and resettlement issues
In households feelings of satisfaction or dissatisfaction regarding the use of the latrine were recorded depending on where the household defecates In fact 325 percent of households are very dissatisfied with the place where they defecate 129 percent are somewhat dissatisfied 27 percent have no opinion 227 percent are rather satisfied and 293 percent are very satisfied
Reasons for dissatisfaction are summarized in Figure 11
Figure 11 Distribution of households by reasons for dissatisfaction in the use of a latrine
The reason most cited by three out of five households interviewed (595 percent) is that the defecation site is not hygienic The section ldquoOtherrdquo (63 percent) takes into account reasons such as the latrine is full or almost full latrine has no door latrine has a defective door too many people use the latrine flooding latrine is dirty lacks a vent pipe and does not allow privacy It should be added that the response about privacy is very uncommon but is relevant especially in the case of shared latrines that are very close to living quarters where the person using the latrine is known by all
Reasons for satisfaction are summarized in Figure 12
Benin Baseline Survey of Peri-Urban Sanitation and Hygiene 33
Figure 12 Distribution of households by reasons justifying the feelings of satisfaction ofhouseholds that use the latrine
The proximity of the place (60 percent) maintenance (419 percent) safety (389 percent) and the fact that the site provides a sense of privacy (378) are the satisfaction factors households mention the most
Despite the fact that almost a third (312 percent) of households interviewed do not have a latrine and that nearly two-thirds (595 percent) have decried hygiene conditions only a quarter of households (257 percent) surveyed seem to want to do something to change their present situation regarding access to a latrine
To change the current situation households made the following suggestions building private latrines (291 percent) improving private latrines owned by the household (159 percent) asking the owner to build a latrine (155 percent) asking for community help to build latrines (05 percent) and requesting assistance of government or outside sources to improve the sanitation situation (241 percent) Actions that are covered under the section ldquoOtherrdquo (15 percent) include moving the household emptying the latrine andor covering the latrine
Only 76 percent of households interviewed intend to install or change their sanitation facility in the next six months
More than the majority (69 percent) of households thinks that sanitation is a problem in their district They mention reasons such as open defecation (525 percent) odor (558 percent) presence of feces everywhere (25 percent) unhealthy environment (44 percent) lack of health services (503 percent) lack of resources (335 percent) and ldquoOtherrdquo reasons (52 percent)mdash flooding of toilets in the rainy season high level of ground water full toilets not emptied defecation in bags the proliferation of flies and occupancy of swamp areas
Benin Baseline Survey of Peri-Urban Sanitation and Hygiene 34
Observation of Households Toilets
Condition of Toilets Data collectors asked householders who owned toilets if they could observe their facilities In response to the question ldquoMay I see your toiletsrdquo nine out of 10 households (901 percent) responded in the affirmative Only 53 percent of toilets observed were built during the 12 months that preceded the survey From observation of the distance between the toilets and the dwelling it appears that 854 percent of toilets are in the homes 26 percent in the yard 111 percent at a distance less than or equal to 20 meters from the house and 09 percent more than 20 meters from the house
Of the toilets observed 965 percent have walls 906 percent have a roof 886 percent allow privacy 69 percent keep their door closed and 64 percent are a series of toilets with more than one entrance to allow several persons to use them at the same time Two elements observed help make them more accessible to children squat toilets with a smaller hole (64 percent) maybe by chance and toilets with a lower seat (636 percent) Fewer than half (459 percent) of latrines visited had a covered hole
In the latrines the following conditions were observed (using a flashlight) fecal matter was observed in squat holes in 502 percent of cases anal cleansing products (236 percent) wet seats (438 percent) grey colored seats (129 percent) bad smells (365 percent) presence of flies (21 percent) and cockroaches (163 percent)
According to respondents only 36 percent of toilets are flooded during the rainy season Remember that flooded houses are more common in Cotonou When latrines are flooded household members go to defecate in a dry public place (30 percent) in the lake (30 percent) in a private dry place (15 percent) in a plastic bag (15 percent) on a dump site (5 percent) or in the flooded latrine (5 percent)
Also during the observation an assessment was made of latrine maintenance namely the floor the hole cover and the anal cleansing material (toilet paper for the most part) Figure 13 below shows the results of observed toilet maintenance The graph shows the cumulative percentages by component
Benin Baseline Survey of Peri-Urban Sanitation and Hygiene 35
Figure 13 Results of the assessment of latrine maintenance components in observed latrines
In general observations showed that only about a third of latrines had been adequately cleaned Thus each latrine component only receives an approximate cleaning 531 percent for the floor 186 percent for the hole cover and 533 percent for the anal cleansing material
In nearly one out of two households (486 percent) a broom was noted near the toilets Finally feces in the observed toilets go mainly into septic tanks (586 percent) and dry holes (394 percent)
Psycho-Social Determinants of Latrine Ownership
To measure psycho-social determinants of latrine ownership the respondents were read a series of statements to elicit their opinion Responses obtained are shown in Table 20 below
Benin Baseline Survey of Peri-Urban Sanitation and Hygiene 36
Table 20 Household opinions on latrine ownership
Statements Do not agree No opinion
Some-what agree
Strongly agree
It makes the owners appear modern 70 82 287 561
It makes the owners respectable members of the community
50 79 298 572
It makes the owners respected by people who visit them
20 43 306 631
It makes the owners more appreciated
35 65 309 591
It makes the members of the household proud
11 33 228 729
It allows women to have privacy at any time of the day
08 05 129 858
It helps keep the shared compound areas clean
22 50 214 713
It doesnrsquot reduce the number of flies in the house
449 103 192 256
It allows you to go relieve yourself easily when you are sick
09 40 254 697
It allows you to go relieve yourself easily when you are old
18 39 278 665
It reduces the possibility of disease in the household
21 30 256 692
It gives toilet users a little more privacy
01 08 185 805
Itrsquos annoying to go to the ldquojohnrdquo every time to do your business
719 140 39 102
It avoids the dangers of having to go do your business at night in the bush
05 01 118 876
Itrsquos really hard to maintain latrines so that they are always operational
594 125 177 104
It is difficult to maintain them so that they are always clean
607 108 178 108
Benin Baseline Survey of Peri-Urban Sanitation and Hygiene 37
-
Summary Table of Survey Indicators
A summary table of indicators has been generated according to socio-economic groups Socio-demographic factors were used to establish socio-economic levels and an analysis was made for each income level The socio-economic levels were established using the conventional method of creating a wealth index The data were subsequently processed by municipality to explore the differences among Cotonou Abomey-Calavi and Porto-Novo
Table 21 Key indicators by household socio-economic level
Indicators
Socio economic typology All subgroups combined
(N=856)
Pearson Chi-square 8
p
Lower
(N=245)
Intermediate
(N=263)
Upper
(N=278)
of households using an improved sanitation facility
453 691 945 697 164675 01
of households with a station for hand washing equipped with essential supplies (soap and water) near the toilets
11 11 142 55 63584 01
of households with a station for hand washing equipped with essential supplies (soap and water) near the kitchen
109 160 391 221 75597 01
of households treating drinking water correctly
32 60 45 46 2689 lt Not significant
of households storing drinking water correctly
600 702 900 735 68427 01
A p value of 01 means that the relationships are highly significant meaning improved infrastructure is more commonly found in the upper socio-economic group
Table 22 below provides a specific summary of each of the three municipalities of the study
8 The Chi-square seeks to establish the relationship between two categorical variables Sex is a categorical variables because it would group individuals into one of two categories men or women This would be a dichotomous categorical variable Socioeconomic quintiles would also be a categorical variable In this case it would not be dichotomous Chi-square can be used to explore the relationship between the two types
Benin Baseline Survey of Peri-Urban Sanitation and Hygiene 38
Table 22 Presentation of key indicators by municipality
Indicators
Municipality Together
(N=856)
Pearson Chi-square
p
Abomey-Calavi
(N=155)
Cotonou
(N=349)
Porto-Novo
(N=352)
of households using improved sanitation infrastructure
516 799 676 697 42106 gt 921
01
of households with a station for hand washing with essential supplies (soap and water) near the toilets
13 86 43 55 12780 01
of households with a station for hand washing with essential supplies (soap and water) near the kitchen
161 284 185 221 13880 01
of households who treat their drinking water properly
77 54 23 46 8471 02
of households who store their drinking water properly
645 785 724 735 11117 01
All associations reported are statistically significant The improved facilities and better practices are more commonly reported in Cotonou
Benin Baseline Survey of Peri-Urban Sanitation and Hygiene 39
-
Table 23 below combines the variables of the two tables above
Table 23 Presentation of indicators by municipality and by household socio-economic levels
Indicators
Municipalities
Abomey Calavi Cotonou Porto-Novo
poor average wealthy Pearson Chi-square
poor average wealthy Pearson Chi-square
poor average wealthy Pearson Chi-square
of households using improved sanitation infrastructure
204 581 846 39148 gt 921
485 716 988 8348 gt 921
521 731 906 Significant 01 level
of households with a station for hand washing with essential supplies (soap and water) near the toilets
00 00 51 6026 gt 5991
00 17 170 28092 gt 921
18 10 129 Significant 01 level
of households with a station for hand washing with essential supplies (soap and water) near the kitchen
19 45 97 19915 gt 921
74 147 467 52703 gt 921
141 202 247 Not significant
of households who properly treat their drinking water
74 81 77 0018 lt 4605
59 69 42 0964 lt 4605
06 38 35 Not significant
of households who store their drinking
574 581 846 9201 gt 529 733 927 48001 638 740 871 15323 Significant
Benin Baseline Survey of Peri-Urban Sanitation and Hygiene 40
-
Indicators
Municipalities
Abomey Calavi Cotonou Porto-Novo
poor average wealthy Pearson Chi-square
poor average wealthy Pearson Chi-square
poor average wealthy Pearson Chi-square
water properly 7824 gt 921 01 level
Benin Baseline Survey of Peri-Urban Sanitation and Hygiene 41
Exposure to Information Messages on Hygiene and Sanitation Practices
During this survey information was also collected on the exposure of households to information messages on hygiene and sanitation practices as well as on sources of this information Data show that only one in five households (196 percent) received information on washing hands during the 30 days preceding the survey Figure 14 below summarizes the main sources of information received by the households
Figure 14 Distribution of households having received information on hand washing by sourceof information
As illustrated in the figure the most common sources of information to households are the radio (518 percent) and television (482 percent) and to some extent health centers (243 percent)
Regarding the treatment of drinking water only a quarter of the households surveyed (247 percent) received information on water treatment during the 30 days preceding the survey Sources of this information are practically the same as those for hand washing (Figure 15)
Benin Baseline Survey of Peri-Urban Sanitation and Hygiene 42
Figure 15 Distribution of households who received information on water treatment by sourceof information
Regarding sanitation only one-fifth (204 percent) of respondents had seen or heard about sanitation during the 30 days preceding the survey Sources of information received by these households are shown in Figure 16
Figure 16 Distribution of households having received information on sanitation by source of information
Whether for hand washing water treatment or sanitation television and the radio remain the two most cited sources of information by the households
The households surveyed were rarely visited by health educators for sensitization on the practice of open defecation (21 percent) or the daily maintenance of toilets (4 percent)
As for information on hydro-fecal diseases a little less than a third (274 percent) of households reported having received information on diarrhea or cholera in the 30 days that preceded the survey The most cited sources of information were the radio (594 percent) television (449 percent) and the health center (406 percent)
Benin Baseline Survey of Peri-Urban Sanitation and Hygiene 43
Conclusion
Data from this study indicate that certain populations from the municipalities of Cotonou Porto-Novo and Abomey-Calavi lack basic hygiene and sanitation infrastructure even though they live in urban areas The overall acceptability of conditions varies from one municipality to another The results of the study reveal that nearly seven out of 10 households surveyed use an improved sanitation facility The problem is less acute in Cotonou (799 percent) and Porto-Novo (676 percent) than in Abomey-Calavi (516 percent) Although households recognize the importance of hand washing in preventing certain diseases the act of washing hands with water and soap at key moments is still far from being a habit in many households Hand washing stations exist in very few households depending on whether the hand washing station is located near the kitchen or toilet In Cotonou the availability of hand washing stations is 284 percent near the kitchen compared to 86 percent near the toilets in Porto-Novo 185 percent have hand washing stations near the kitchen compared to 43 percent near the toilets and in Abomey-Calavi 161 percent of households have facilities near the kitchen compared to 13 percent near the toilets
Regarding household supply of drinking water in nine out of 10 households surveyed the drinking water comes from the distribution network of SONEB Only a minority of households drinks water from other sources including wells Only 58 percent of households treat drinking water Results of chlorine tests made in households that used chlorination show the average concentration of chlorine in the water as 349 mgl which is very high considering the World Health Organization standard of free chlorine concentration of treated water is 02 to 05 mgl Also the average number of days that the households continue to drink treated water is 64 days A poor household practice of mixing treated water with untreated whenever the water is renewed in the container was also observed All these reasons explain the alarmingly low percentage of households that properly treat their drinking water This indicator is 54 percent in Cotonou compared to 77 percent in Abomey-Calavi and 23 percent in Porto-Novo
Regarding proper storage of drinking water nearly three out of four households (735 percent) store their drinking water properly This indicator is 785 percent in Cotonou 724 percent in Porto-Novo and 645 percent in Abomey-Calavi
All these indicators that characterize the current state of hygiene and sanitation in these peri-urban districts surveyed also change depending on the socio-economic level of households
To reduce the health vulnerability of households in the study population it is necessary that appropriate interventions be implemented in the peri-urban neighborhoods To this end radio television and to some extent health centers appear to be the most appropriate channels for disseminating information and awareness messages according to data from the study
Benin Baseline Survey of Peri-Urban Sanitation and Hygiene 44
Endnotes
Boschi-Pinto C L Velebit and K Shibuyac 2008 Estimating Child Mortality Due to Diarrhoea in Developing Countries Bulletin of the World Health 86710ndash717
Water and Sanitation Program 2012 Economic Impact of Poor Sanitation in Africa
Benin Baseline Survey of Peri-Urban Sanitation and Hygiene 45
Annex 1 ndash Population from Sampled Districts
Municipality Districts Population Cotonou AVOTROU 17318
MINONTCHOU 7145 LADJI 8409
Abomey- GODOMEY 60034 Calavi TOGOUDO
TOKPA ZOUNGO 11090 HOUEKEGBO 1718 HOUEKEHONOU 1770
Porto-Novo ACCRON 5350 AVASSA 1715 FOUN FOUN 3412 TOKPA HOUEYOGBE 1638 GBEDJI
TOTAL 119601
The Survey Questionnaire is available separately on request from contactwashplusorg
Benin Baseline Survey of Peri-Urban Sanitation and Hygiene 46
WASHplus FHI 360 1825 Connecticut Ave NW Washington DC 20009 2028848000 wwwWASHplusorg contactwashplusorg
Benin Baseline Survey of Peri-Urban Sanitation and Hygiene 47
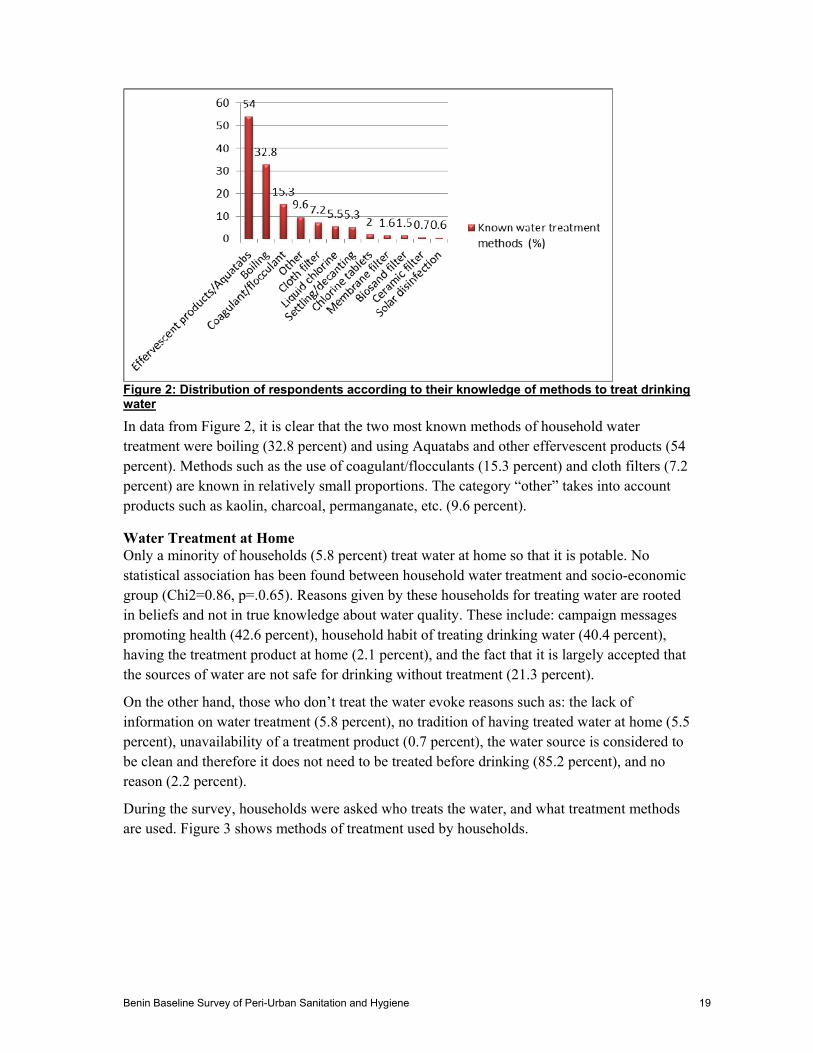
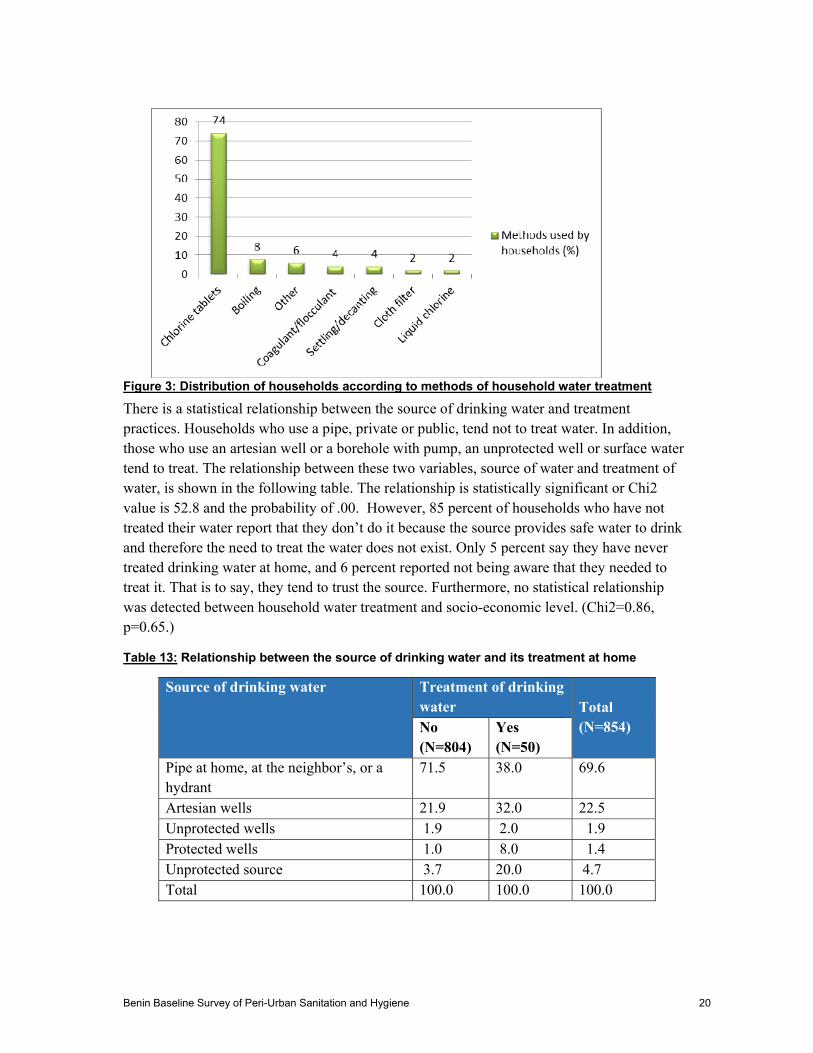
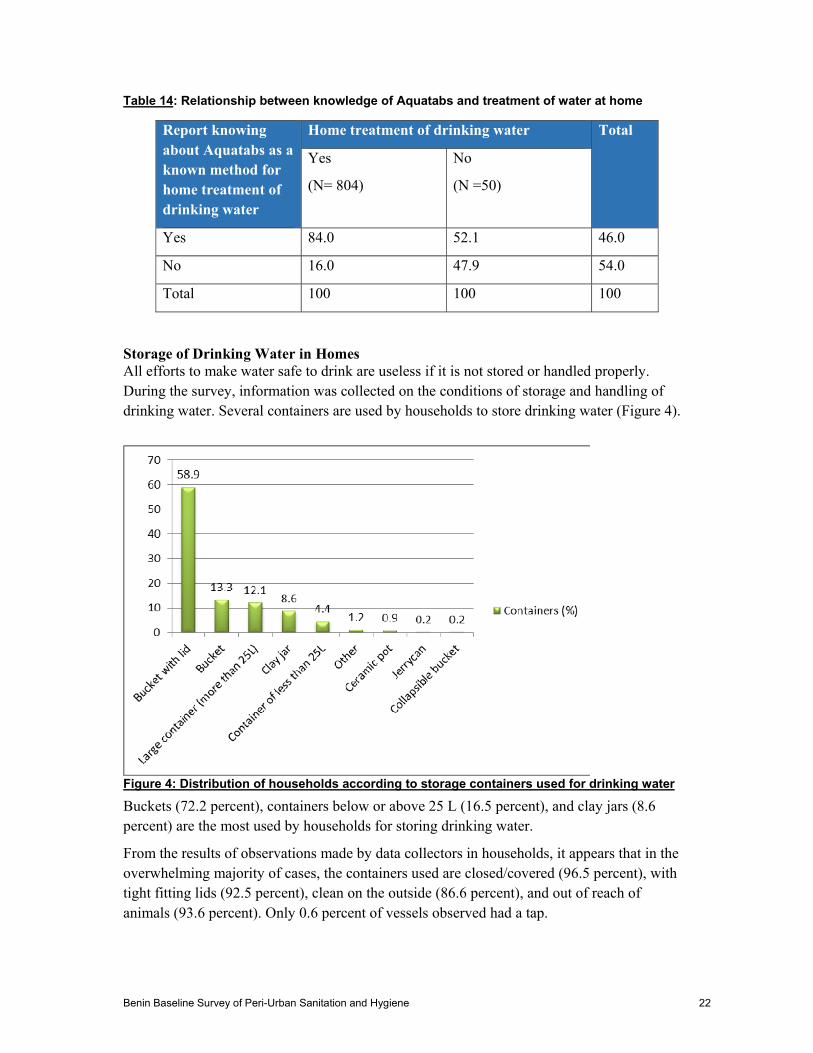
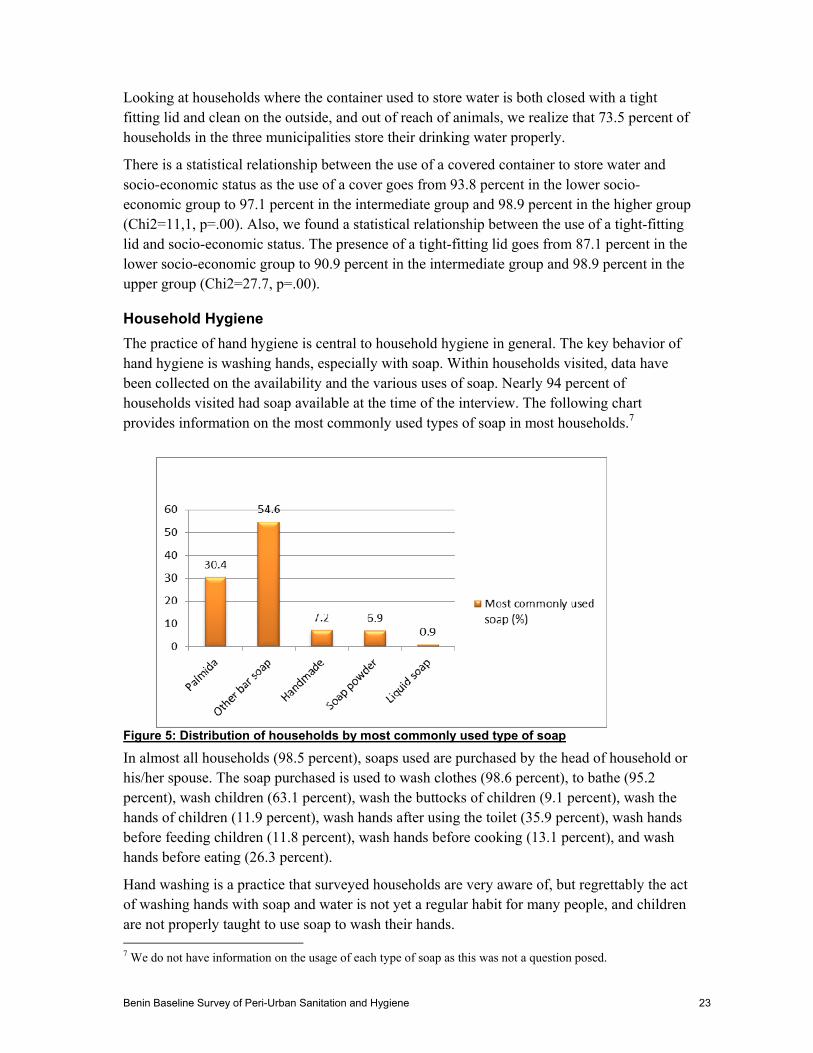
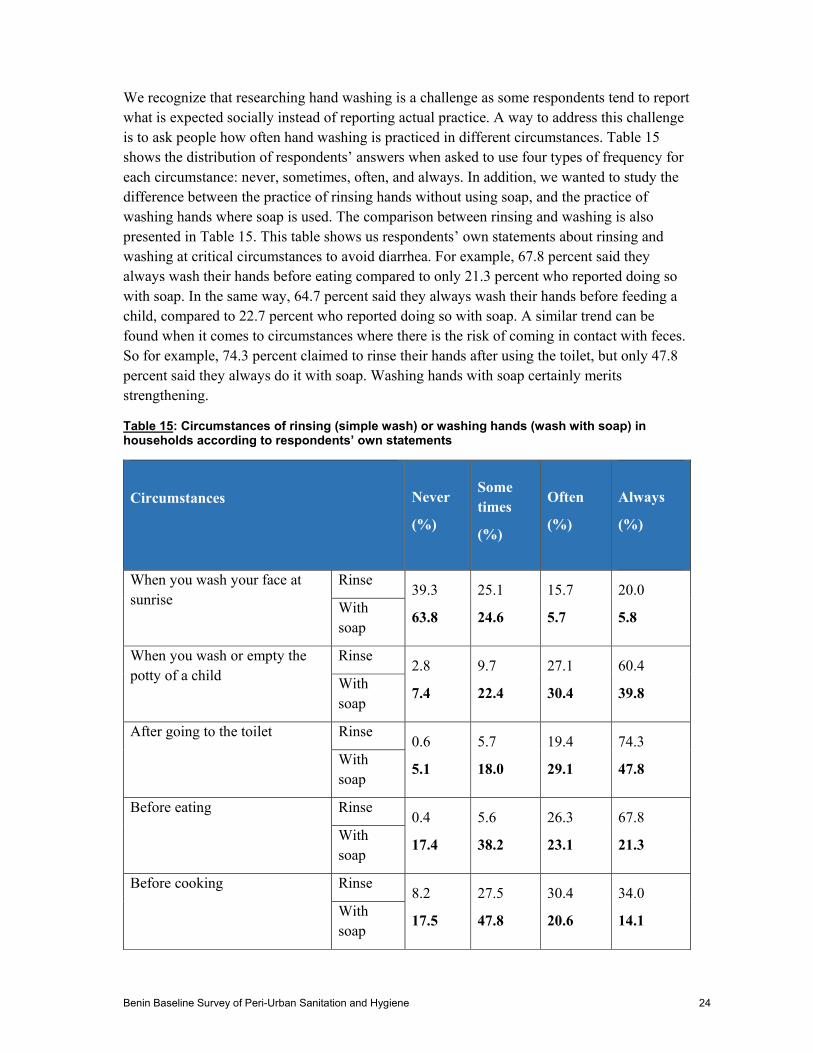
-
We recognize that researching hand washing is a challenge as some respondents tend to report what is expected socially instead of reporting actual practice A way to address this challenge is to ask people how often hand washing is practiced in different circumstances Table 15 shows the distribution of respondentsrsquo answers when asked to use four types of frequency for each circumstance never sometimes often and always In addition we wanted to study the difference between the practice of rinsing hands without using soap and the practice of washing hands where soap is used The comparison between rinsing and washing is also presented in Table 15 This table shows us respondentsrsquo own statements about rinsing and washing at critical circumstances to avoid diarrhea For example 678 percent said they always wash their hands before eating compared to only 213 percent who reported doing so with soap In the same way 647 percent said they always wash their hands before feeding a child compared to 227 percent who reported doing so with soap A similar trend can be found when it comes to circumstances where there is the risk of coming in contact with feces So for example 743 percent claimed to rinse their hands after using the toilet but only 478 percent said they always do it with soap Washing hands with soap certainly merits strengthening
Table 15 Circumstances of rinsing (simple wash) or washing hands (wash with soap) inhouseholds according to respondentsrsquo own statements
Circumstances Never
()
Some times
()
Often
()
Always
()
When you wash your face at sunrise
Rinse 393
638
251
246
157
57
200
58With soap
When you wash or empty the potty of a child
Rinse 28
74
97
224
271
304
604
398With soap
After going to the toilet Rinse 06
51
57
180
194
291
743
478With soap
Before eating Rinse 04
174
56
382
263
231
678
213With soap
Before cooking Rinse 82
175
275
478
304
206
340
141With soap
Benin Baseline Survey of Peri-Urban Sanitation and Hygiene 24
-
Circumstances Never
()
Some times
()
Often
()
Always
()
Before feeding children Rinse 09
141
74
350
270
282
647
227With soap
After any task where I had to use my hands
Rinse 19
71
421
577
300
220
261
132With soap
After touching an animal Rinse 166
248
340
403
199
160
296
189With soap
After cleaning the bottom (feces) of my child
Rinse 19
74
71
180
215
304
695
443With soap
After cleaning the toilet Rinse 47
75
60
97
121
239
772
589With soap
After having taken care of a sick person
Rinse 129
183
325
356
182
181
364
279With soap
Other occasions Rinse 41
127
270
380
689
494With soap
Note proportions in bold are the answers to hand washing with soap
However in order to wash hands households must have the necessary supplies to do so These include the presence of a mobile or stationary hand washing device soap and water These devices should exist in one or more places in the home especially near places where food is handled or where people come in contact with feces
To complete information on the practice of hand washing we used an objective indicator to verify the presence of a hand washing station with or without required supplies water and a washing productmdasheither a soap bar liquid soap or even ashes These indicators are objective because they are based on actual existence of a hand washing station and nearby supplies The
Benin Baseline Survey of Peri-Urban Sanitation and Hygiene 25
indicator is different from previous indicators that are based solely on the intervieweesrsquo responses
UNICEFrsquos Multiple Indicator Cluster Survey and USAIDrsquos Demographic and Health Surveys use this indicator when carrying out their surveys in developing countries We tried to determine how many hand washing stations had necessary products for the practice of hand washing with soap and if these stations are located in a place accessible to all family members near the kitchen or the toilet The following table shows the results obtained concerning the presence of the supplies mentioned In this table the denominator used is the total number of households visited in order to compare the different hand washing stations for the entire sample In the following section we will find a discussion of accessibility to latrines However the results on the presence of a hand washing station near latrines are shown here to collect all information on this subject in the same section of the report We note the low number of households where these stations existed and the low percentage of households where the devices were equipped with water andor soap during our visit
Table 16 Percentage distribution of hand washing stations in several locations in the houseand supplies observed by location (N=856)
Station usually used by family members
Station near the area of food preparation
Station near the toilet
Households having a corner dedicated to hand washing
294 167 83
Water availability 271 158 79
Availability of soap 230 132 63
Availability of water and soap
221 129 62
To assess the key moments when household members actually wash their hands respondents were asked to name activities after which they wash their hands without making suggestions The responses obtained are summarized in Table 17 below These results reaffirm the need for people to know the moments when hand washing with soap is critical Note that only 254 percent of respondents feel that hand washing is key before preparing food Similarly only 340 percent felt that it was key before feeding a child Both are relatively low percentages
Benin Baseline Survey of Peri-Urban Sanitation and Hygiene 26
Table 17 Key moments of the day to wash hands
Moments Proportion of households ()
After going to the toilet 876
After doing poo 662
Before eating 938
After cleaning a child or washing out a diaper 138
After cleaning the toilet 421
After touching any utensil used for cleaning the house 82
After cleaning a chamber pot 151
Before preparing food 254
Before feeding a child 340
After touching or having cared for a patient 140
After eating 616
These data are consistent with the previous table confirming that although households are aware of the usefulness of this practice it takes time to become a habit
When asked what motivates household members to wash their hands with water and soap or detergent their spontaneous responses were
Table 18 Factors motivating hand washing in households
Motivational Factors Proportion of households ()
Prevent disease 868
Prevent diarrhea 325
Remove germs 361
Prevent dust from entering the mouth 127
Prevent dust from entering the food 33
It smells good 16
Benin Baseline Survey of Peri-Urban Sanitation and Hygiene 27
In four out of five households (868 percent) hand washing is done to prevent disease However health is not a sufficient factor to motivate hand washing with soap The presence of a functional device for hand washing has a lot to do with it
Among the 868 percent of households claiming to wash their hands because of disease only 246 percent have a hand washing station equipped with essential supplies (soap and water) near the kitchen
Other lesser reasons but related to the first are the prevention of diarrhea (325 percent) and the elimination of germs (361 percent)
Sanitation in Households
Household sanitation depends largely on the accessibility of hygiene infrastructure (latrine shower) in the household This is particularly important when the household has young children including children under five years old when they are most vulnerable 595 percent of households visited during this survey have a child younger than five years old and 453 percent have a child under three years old So the majority of children under the age of five are children less than three years old
Management of Feces During the survey respondents were asked ldquoThe last time your child under 3 years of age pooped where did he gordquo
Figure 6 summarizes the responses recorded from households
Figure 6 Distribution of households by places of defecation by children under the age of 3
Benin Baseline Survey of Peri-Urban Sanitation and Hygiene 28
A little more than three-quarters of households (776 percent) used a potty Cloth diapers (67 percent) and disposables (64 percent) were rarely used Other unsavory means were used and are found in the ldquoOtherrdquo category (13 percent) garbage piles in plastic bags and on the ground
Once the child has finished pooping parents dispose of the feces in different places toiletlatrines (668 percent) garbage dumps (204 percent) or garbage cans (34 percent) They are also thrown out with wastewater (31 percent) or disposed of in Other places (41 percent) such as the bush in the lagoon in the lake in gutters and in swampland
According to respondents in four out of five households (807 percent) childrenrsquos feces are disposed of by the head of household or hisher spouse and in just over one in 10 households (126 percent) by the sons or daughters of the head of household They are also disposed of by other relatives (67 percent) of the household members surveyed
The respondents were also asked ldquoWhere do family members go when they need to defecaterdquo Figure 7 summarizes the responses recorded on defecation areas used by household members surveyed In this figure the section ldquoVentilated Latrinesrdquo includes ventilated latrines and ventilated improved pit latrines
Figure 7 Distribution of households by place of defecation for family members
More than seven out of 10 households (743 percent) use sanitation facilities The remaining households use either fields the beach plastic bags (16 percent) or dumpsites (74 percent) The rest (46 percent) use swampy areas the lakeside public drains the lagoon or at times private for-fee or hanging latrines
For anal cleansing households use several means These are newsprint (40 percent) water (386 percent) toilet paper (196 percent) and leaves (14 percent)
Benin Baseline Survey of Peri-Urban Sanitation and Hygiene 29
Availability of Toilets in Households Information was collected during the survey about who put in the toilets used by households hence the question Did your household install the toilet that you are using Answers from the respondents are summarized in the Total column of the table below In addition the crossing of this question with the question of home ownership produces the following results Among homeowners a little more than one-third (345 percent) did not have a toilet compared to four households out of nine (454 percent) who installed a toilet in their house We note that one-fifth (201 percent) of these homeowners were not responsible for the installation of toilets in their homes This is the case with households that live in family homes in which they are considered to be the owners or co-owners For renters 762 percent did not install the toilets that are in the houses where they live only 07 percent are responsible for installing toilets in their home and a little more than one-fifth (231 percent) do not have a toilet In lodged households 537 percent did not install toilets in the house where they live only 63 percent are responsible for installing toilets in their home and four-tenths (400 percent) do not have a toilet in their house
Table 19 Distribution of households according to the person responsible for installing latrines and the title of ownership of the house
Installation of toilets by the household
Title of ownership of the house Total
Owner Renter Lodged
No they were already there
201 762 537 431
Yes 454 07 63 257
The household does not have a toilet
345 231 400 312
Total 100 100 100 100
At the household level when the decision was made to install latrines in nearly nine households out of 10 (877 percent) it was made by the head of household or spouse This decision was taken in 82 percent of households by the parents of the head of household or spouse and in 41 percent of households (renting) by the owners
Regarding the location of toilets the owners made the decision in a little less than half of households visited (47 percent) heads of households or spouses made it in one-third of households (341 percent) and in almost one-fifth of the households visited (188 percent) other actors such as parents of head of household or spouse and previous renters made the decision
Figure 8 provides information on the location of toilets in households
Benin Baseline Survey of Peri-Urban Sanitation and Hygiene 30
Figure 8 Distribution of households by location of toilets in the household
Half of households visited (501 percent) have their toilets inside or attached to their house a little less than half (479 percent) have theirs elsewhere in the compound usually in the courtyard and only 2 percent outside of the property
According to the responses obtained from respondents less than a quarter (224 percent) of toilet pits has been emptied recently Two-thirds of the emptied pits (666 percent) are emptied once a year Others are emptied with regular frequency such as once a month (08 percent) once every two months (08 percent) or once every three months (23 percent) Still others grouped in the section ldquoOthersrdquo (356 percent) are emptied twice a year once every two years and once every three years The average cost of one emptying is 44500 CFA Pit emptying is more common in households where the latrine is shared with other families (Chi2=63 p=000) among renters (Chi2=1238 p=000) in houses that flood (Chi2=263 p=000) and in families with a better socio-economic status (Chi3=91 p=001)
In regards to the place where the sewage sludge is dumped nine households out of 10 (902 percent) reported not knowing where it is emptied On the other hand one household out of 10 (98 percent) said that the toilets are flushed into rivers and the ocean All emptied toilets are still in use
Regarding shared toilets two households out of three (659 percent) share their toilets with other households The average number of households that share the same toilet is five
In the three municipalities of the study nearly seven households out of 10 (697 percent) use an improved sanitation infrastructure
Principal Reasons to Build or Not to Build Toilets We asked households with toilets for three main reasons why they built their toilets Figure 9 below shows the responses of households interviewed
Benin Baseline Survey of Peri-Urban Sanitation and Hygiene 31
Figure 9 Distribution of households according to principal reasons for building the toilets
Households mentioned the following three reasons most to justify building toilets privacy (699 percent) disease prevention (616 percent) and security (362 percent)
Households that do not have toilets mention the reasons below (Figure 10)
Figure 10 Distribution of households by principal reasons for not building latrines
The high cost of construction of latrines (677 percent) is by far the most common reason households justified not building the toilets While more households in the lower socio-economic status (715 percent) than in the higher socio-economic status (526 percent) give this reason the difference is not statistically significant Next the nature of the soil (373 percent) and the fact that the household does not have the necessary supplies to build latrines
Benin Baseline Survey of Peri-Urban Sanitation and Hygiene 32
(327 percent) are mentioned Other reasons are listed in smaller proportions as indicated in the graph The ldquoOtherrdquo category (216 percent) is comprised of those who do not have toilets (one-fifth of respondents) among other reasonsmdashthe delay in resettlement operations the effects of flooding during the rainy season the refusal of some tenants to contribute upon request of the owner to build toilets and zoning and resettlement issues
In households feelings of satisfaction or dissatisfaction regarding the use of the latrine were recorded depending on where the household defecates In fact 325 percent of households are very dissatisfied with the place where they defecate 129 percent are somewhat dissatisfied 27 percent have no opinion 227 percent are rather satisfied and 293 percent are very satisfied
Reasons for dissatisfaction are summarized in Figure 11
Figure 11 Distribution of households by reasons for dissatisfaction in the use of a latrine
The reason most cited by three out of five households interviewed (595 percent) is that the defecation site is not hygienic The section ldquoOtherrdquo (63 percent) takes into account reasons such as the latrine is full or almost full latrine has no door latrine has a defective door too many people use the latrine flooding latrine is dirty lacks a vent pipe and does not allow privacy It should be added that the response about privacy is very uncommon but is relevant especially in the case of shared latrines that are very close to living quarters where the person using the latrine is known by all
Reasons for satisfaction are summarized in Figure 12
Benin Baseline Survey of Peri-Urban Sanitation and Hygiene 33
Figure 12 Distribution of households by reasons justifying the feelings of satisfaction ofhouseholds that use the latrine
The proximity of the place (60 percent) maintenance (419 percent) safety (389 percent) and the fact that the site provides a sense of privacy (378) are the satisfaction factors households mention the most
Despite the fact that almost a third (312 percent) of households interviewed do not have a latrine and that nearly two-thirds (595 percent) have decried hygiene conditions only a quarter of households (257 percent) surveyed seem to want to do something to change their present situation regarding access to a latrine
To change the current situation households made the following suggestions building private latrines (291 percent) improving private latrines owned by the household (159 percent) asking the owner to build a latrine (155 percent) asking for community help to build latrines (05 percent) and requesting assistance of government or outside sources to improve the sanitation situation (241 percent) Actions that are covered under the section ldquoOtherrdquo (15 percent) include moving the household emptying the latrine andor covering the latrine
Only 76 percent of households interviewed intend to install or change their sanitation facility in the next six months
More than the majority (69 percent) of households thinks that sanitation is a problem in their district They mention reasons such as open defecation (525 percent) odor (558 percent) presence of feces everywhere (25 percent) unhealthy environment (44 percent) lack of health services (503 percent) lack of resources (335 percent) and ldquoOtherrdquo reasons (52 percent)mdash flooding of toilets in the rainy season high level of ground water full toilets not emptied defecation in bags the proliferation of flies and occupancy of swamp areas
Benin Baseline Survey of Peri-Urban Sanitation and Hygiene 34
Observation of Households Toilets
Condition of Toilets Data collectors asked householders who owned toilets if they could observe their facilities In response to the question ldquoMay I see your toiletsrdquo nine out of 10 households (901 percent) responded in the affirmative Only 53 percent of toilets observed were built during the 12 months that preceded the survey From observation of the distance between the toilets and the dwelling it appears that 854 percent of toilets are in the homes 26 percent in the yard 111 percent at a distance less than or equal to 20 meters from the house and 09 percent more than 20 meters from the house
Of the toilets observed 965 percent have walls 906 percent have a roof 886 percent allow privacy 69 percent keep their door closed and 64 percent are a series of toilets with more than one entrance to allow several persons to use them at the same time Two elements observed help make them more accessible to children squat toilets with a smaller hole (64 percent) maybe by chance and toilets with a lower seat (636 percent) Fewer than half (459 percent) of latrines visited had a covered hole
In the latrines the following conditions were observed (using a flashlight) fecal matter was observed in squat holes in 502 percent of cases anal cleansing products (236 percent) wet seats (438 percent) grey colored seats (129 percent) bad smells (365 percent) presence of flies (21 percent) and cockroaches (163 percent)
According to respondents only 36 percent of toilets are flooded during the rainy season Remember that flooded houses are more common in Cotonou When latrines are flooded household members go to defecate in a dry public place (30 percent) in the lake (30 percent) in a private dry place (15 percent) in a plastic bag (15 percent) on a dump site (5 percent) or in the flooded latrine (5 percent)
Also during the observation an assessment was made of latrine maintenance namely the floor the hole cover and the anal cleansing material (toilet paper for the most part) Figure 13 below shows the results of observed toilet maintenance The graph shows the cumulative percentages by component
Benin Baseline Survey of Peri-Urban Sanitation and Hygiene 35
Figure 13 Results of the assessment of latrine maintenance components in observed latrines
In general observations showed that only about a third of latrines had been adequately cleaned Thus each latrine component only receives an approximate cleaning 531 percent for the floor 186 percent for the hole cover and 533 percent for the anal cleansing material
In nearly one out of two households (486 percent) a broom was noted near the toilets Finally feces in the observed toilets go mainly into septic tanks (586 percent) and dry holes (394 percent)
Psycho-Social Determinants of Latrine Ownership
To measure psycho-social determinants of latrine ownership the respondents were read a series of statements to elicit their opinion Responses obtained are shown in Table 20 below
Benin Baseline Survey of Peri-Urban Sanitation and Hygiene 36
Table 20 Household opinions on latrine ownership
Statements Do not agree No opinion
Some-what agree
Strongly agree
It makes the owners appear modern 70 82 287 561
It makes the owners respectable members of the community
50 79 298 572
It makes the owners respected by people who visit them
20 43 306 631
It makes the owners more appreciated
35 65 309 591
It makes the members of the household proud
11 33 228 729
It allows women to have privacy at any time of the day
08 05 129 858
It helps keep the shared compound areas clean
22 50 214 713
It doesnrsquot reduce the number of flies in the house
449 103 192 256
It allows you to go relieve yourself easily when you are sick
09 40 254 697
It allows you to go relieve yourself easily when you are old
18 39 278 665
It reduces the possibility of disease in the household
21 30 256 692
It gives toilet users a little more privacy
01 08 185 805
Itrsquos annoying to go to the ldquojohnrdquo every time to do your business
719 140 39 102
It avoids the dangers of having to go do your business at night in the bush
05 01 118 876
Itrsquos really hard to maintain latrines so that they are always operational
594 125 177 104
It is difficult to maintain them so that they are always clean
607 108 178 108
Benin Baseline Survey of Peri-Urban Sanitation and Hygiene 37
-
Summary Table of Survey Indicators
A summary table of indicators has been generated according to socio-economic groups Socio-demographic factors were used to establish socio-economic levels and an analysis was made for each income level The socio-economic levels were established using the conventional method of creating a wealth index The data were subsequently processed by municipality to explore the differences among Cotonou Abomey-Calavi and Porto-Novo
Table 21 Key indicators by household socio-economic level
Indicators
Socio economic typology All subgroups combined
(N=856)
Pearson Chi-square 8
p
Lower
(N=245)
Intermediate
(N=263)
Upper
(N=278)
of households using an improved sanitation facility
453 691 945 697 164675 01
of households with a station for hand washing equipped with essential supplies (soap and water) near the toilets
11 11 142 55 63584 01
of households with a station for hand washing equipped with essential supplies (soap and water) near the kitchen
109 160 391 221 75597 01
of households treating drinking water correctly
32 60 45 46 2689 lt Not significant
of households storing drinking water correctly
600 702 900 735 68427 01
A p value of 01 means that the relationships are highly significant meaning improved infrastructure is more commonly found in the upper socio-economic group
Table 22 below provides a specific summary of each of the three municipalities of the study
8 The Chi-square seeks to establish the relationship between two categorical variables Sex is a categorical variables because it would group individuals into one of two categories men or women This would be a dichotomous categorical variable Socioeconomic quintiles would also be a categorical variable In this case it would not be dichotomous Chi-square can be used to explore the relationship between the two types
Benin Baseline Survey of Peri-Urban Sanitation and Hygiene 38
Table 22 Presentation of key indicators by municipality
Indicators
Municipality Together
(N=856)
Pearson Chi-square
p
Abomey-Calavi
(N=155)
Cotonou
(N=349)
Porto-Novo
(N=352)
of households using improved sanitation infrastructure
516 799 676 697 42106 gt 921
01
of households with a station for hand washing with essential supplies (soap and water) near the toilets
13 86 43 55 12780 01
of households with a station for hand washing with essential supplies (soap and water) near the kitchen
161 284 185 221 13880 01
of households who treat their drinking water properly
77 54 23 46 8471 02
of households who store their drinking water properly
645 785 724 735 11117 01
All associations reported are statistically significant The improved facilities and better practices are more commonly reported in Cotonou
Benin Baseline Survey of Peri-Urban Sanitation and Hygiene 39
-
Table 23 below combines the variables of the two tables above
Table 23 Presentation of indicators by municipality and by household socio-economic levels
Indicators
Municipalities
Abomey Calavi Cotonou Porto-Novo
poor average wealthy Pearson Chi-square
poor average wealthy Pearson Chi-square
poor average wealthy Pearson Chi-square
of households using improved sanitation infrastructure
204 581 846 39148 gt 921
485 716 988 8348 gt 921
521 731 906 Significant 01 level
of households with a station for hand washing with essential supplies (soap and water) near the toilets
00 00 51 6026 gt 5991
00 17 170 28092 gt 921
18 10 129 Significant 01 level
of households with a station for hand washing with essential supplies (soap and water) near the kitchen
19 45 97 19915 gt 921
74 147 467 52703 gt 921
141 202 247 Not significant
of households who properly treat their drinking water
74 81 77 0018 lt 4605
59 69 42 0964 lt 4605
06 38 35 Not significant
of households who store their drinking
574 581 846 9201 gt 529 733 927 48001 638 740 871 15323 Significant
Benin Baseline Survey of Peri-Urban Sanitation and Hygiene 40
-
Indicators
Municipalities
Abomey Calavi Cotonou Porto-Novo
poor average wealthy Pearson Chi-square
poor average wealthy Pearson Chi-square
poor average wealthy Pearson Chi-square
water properly 7824 gt 921 01 level
Benin Baseline Survey of Peri-Urban Sanitation and Hygiene 41
Exposure to Information Messages on Hygiene and Sanitation Practices
During this survey information was also collected on the exposure of households to information messages on hygiene and sanitation practices as well as on sources of this information Data show that only one in five households (196 percent) received information on washing hands during the 30 days preceding the survey Figure 14 below summarizes the main sources of information received by the households
Figure 14 Distribution of households having received information on hand washing by sourceof information
As illustrated in the figure the most common sources of information to households are the radio (518 percent) and television (482 percent) and to some extent health centers (243 percent)
Regarding the treatment of drinking water only a quarter of the households surveyed (247 percent) received information on water treatment during the 30 days preceding the survey Sources of this information are practically the same as those for hand washing (Figure 15)
Benin Baseline Survey of Peri-Urban Sanitation and Hygiene 42
Figure 15 Distribution of households who received information on water treatment by sourceof information
Regarding sanitation only one-fifth (204 percent) of respondents had seen or heard about sanitation during the 30 days preceding the survey Sources of information received by these households are shown in Figure 16
Figure 16 Distribution of households having received information on sanitation by source of information
Whether for hand washing water treatment or sanitation television and the radio remain the two most cited sources of information by the households
The households surveyed were rarely visited by health educators for sensitization on the practice of open defecation (21 percent) or the daily maintenance of toilets (4 percent)
As for information on hydro-fecal diseases a little less than a third (274 percent) of households reported having received information on diarrhea or cholera in the 30 days that preceded the survey The most cited sources of information were the radio (594 percent) television (449 percent) and the health center (406 percent)
Benin Baseline Survey of Peri-Urban Sanitation and Hygiene 43
Conclusion
Data from this study indicate that certain populations from the municipalities of Cotonou Porto-Novo and Abomey-Calavi lack basic hygiene and sanitation infrastructure even though they live in urban areas The overall acceptability of conditions varies from one municipality to another The results of the study reveal that nearly seven out of 10 households surveyed use an improved sanitation facility The problem is less acute in Cotonou (799 percent) and Porto-Novo (676 percent) than in Abomey-Calavi (516 percent) Although households recognize the importance of hand washing in preventing certain diseases the act of washing hands with water and soap at key moments is still far from being a habit in many households Hand washing stations exist in very few households depending on whether the hand washing station is located near the kitchen or toilet In Cotonou the availability of hand washing stations is 284 percent near the kitchen compared to 86 percent near the toilets in Porto-Novo 185 percent have hand washing stations near the kitchen compared to 43 percent near the toilets and in Abomey-Calavi 161 percent of households have facilities near the kitchen compared to 13 percent near the toilets
Regarding household supply of drinking water in nine out of 10 households surveyed the drinking water comes from the distribution network of SONEB Only a minority of households drinks water from other sources including wells Only 58 percent of households treat drinking water Results of chlorine tests made in households that used chlorination show the average concentration of chlorine in the water as 349 mgl which is very high considering the World Health Organization standard of free chlorine concentration of treated water is 02 to 05 mgl Also the average number of days that the households continue to drink treated water is 64 days A poor household practice of mixing treated water with untreated whenever the water is renewed in the container was also observed All these reasons explain the alarmingly low percentage of households that properly treat their drinking water This indicator is 54 percent in Cotonou compared to 77 percent in Abomey-Calavi and 23 percent in Porto-Novo
Regarding proper storage of drinking water nearly three out of four households (735 percent) store their drinking water properly This indicator is 785 percent in Cotonou 724 percent in Porto-Novo and 645 percent in Abomey-Calavi
All these indicators that characterize the current state of hygiene and sanitation in these peri-urban districts surveyed also change depending on the socio-economic level of households
To reduce the health vulnerability of households in the study population it is necessary that appropriate interventions be implemented in the peri-urban neighborhoods To this end radio television and to some extent health centers appear to be the most appropriate channels for disseminating information and awareness messages according to data from the study
Benin Baseline Survey of Peri-Urban Sanitation and Hygiene 44
Endnotes
Boschi-Pinto C L Velebit and K Shibuyac 2008 Estimating Child Mortality Due to Diarrhoea in Developing Countries Bulletin of the World Health 86710ndash717
Water and Sanitation Program 2012 Economic Impact of Poor Sanitation in Africa
Benin Baseline Survey of Peri-Urban Sanitation and Hygiene 45
Annex 1 ndash Population from Sampled Districts
Municipality Districts Population Cotonou AVOTROU 17318
MINONTCHOU 7145 LADJI 8409
Abomey- GODOMEY 60034 Calavi TOGOUDO
TOKPA ZOUNGO 11090 HOUEKEGBO 1718 HOUEKEHONOU 1770
Porto-Novo ACCRON 5350 AVASSA 1715 FOUN FOUN 3412 TOKPA HOUEYOGBE 1638 GBEDJI
TOTAL 119601
The Survey Questionnaire is available separately on request from contactwashplusorg
Benin Baseline Survey of Peri-Urban Sanitation and Hygiene 46
WASHplus FHI 360 1825 Connecticut Ave NW Washington DC 20009 2028848000 wwwWASHplusorg contactwashplusorg
Benin Baseline Survey of Peri-Urban Sanitation and Hygiene 47
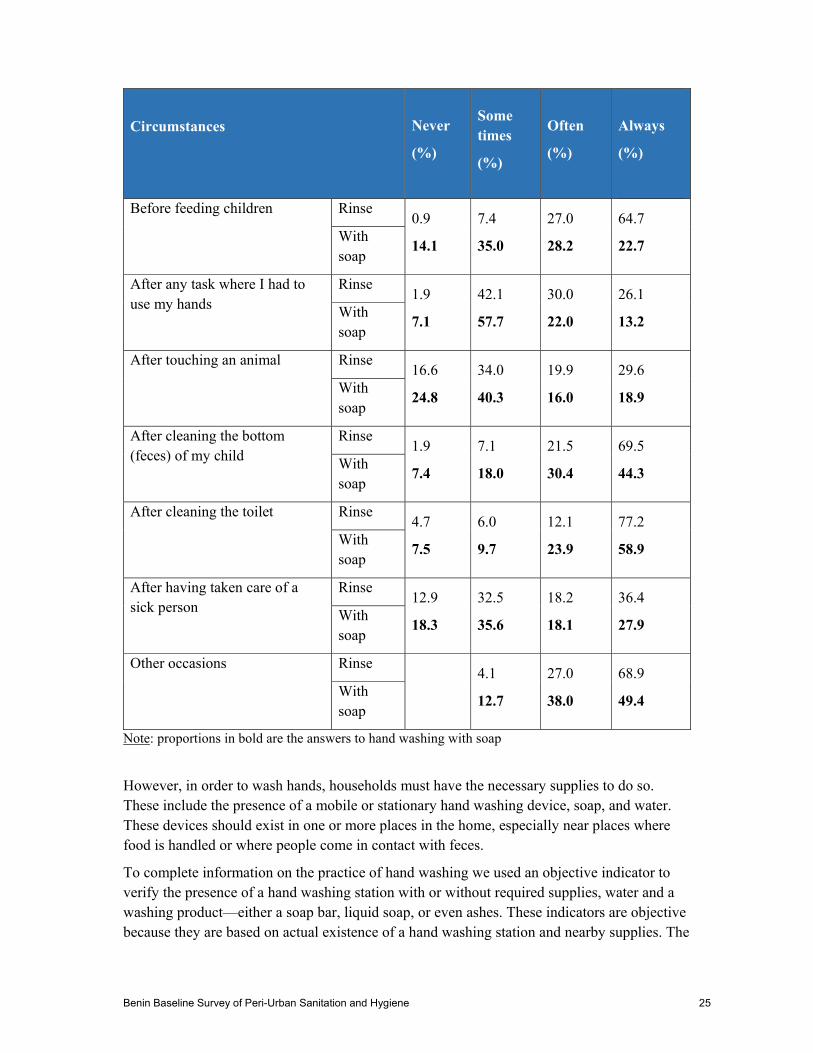
-
Circumstances Never
()
Some times
()
Often
()
Always
()
Before feeding children Rinse 09
141
74
350
270
282
647
227With soap
After any task where I had to use my hands
Rinse 19
71
421
577
300
220
261
132With soap
After touching an animal Rinse 166
248
340
403
199
160
296
189With soap
After cleaning the bottom (feces) of my child
Rinse 19
74
71
180
215
304
695
443With soap
After cleaning the toilet Rinse 47
75
60
97
121
239
772
589With soap
After having taken care of a sick person
Rinse 129
183
325
356
182
181
364
279With soap
Other occasions Rinse 41
127
270
380
689
494With soap
Note proportions in bold are the answers to hand washing with soap
However in order to wash hands households must have the necessary supplies to do so These include the presence of a mobile or stationary hand washing device soap and water These devices should exist in one or more places in the home especially near places where food is handled or where people come in contact with feces
To complete information on the practice of hand washing we used an objective indicator to verify the presence of a hand washing station with or without required supplies water and a washing productmdasheither a soap bar liquid soap or even ashes These indicators are objective because they are based on actual existence of a hand washing station and nearby supplies The
Benin Baseline Survey of Peri-Urban Sanitation and Hygiene 25
indicator is different from previous indicators that are based solely on the intervieweesrsquo responses
UNICEFrsquos Multiple Indicator Cluster Survey and USAIDrsquos Demographic and Health Surveys use this indicator when carrying out their surveys in developing countries We tried to determine how many hand washing stations had necessary products for the practice of hand washing with soap and if these stations are located in a place accessible to all family members near the kitchen or the toilet The following table shows the results obtained concerning the presence of the supplies mentioned In this table the denominator used is the total number of households visited in order to compare the different hand washing stations for the entire sample In the following section we will find a discussion of accessibility to latrines However the results on the presence of a hand washing station near latrines are shown here to collect all information on this subject in the same section of the report We note the low number of households where these stations existed and the low percentage of households where the devices were equipped with water andor soap during our visit
Table 16 Percentage distribution of hand washing stations in several locations in the houseand supplies observed by location (N=856)
Station usually used by family members
Station near the area of food preparation
Station near the toilet
Households having a corner dedicated to hand washing
294 167 83
Water availability 271 158 79
Availability of soap 230 132 63
Availability of water and soap
221 129 62
To assess the key moments when household members actually wash their hands respondents were asked to name activities after which they wash their hands without making suggestions The responses obtained are summarized in Table 17 below These results reaffirm the need for people to know the moments when hand washing with soap is critical Note that only 254 percent of respondents feel that hand washing is key before preparing food Similarly only 340 percent felt that it was key before feeding a child Both are relatively low percentages
Benin Baseline Survey of Peri-Urban Sanitation and Hygiene 26
Table 17 Key moments of the day to wash hands
Moments Proportion of households ()
After going to the toilet 876
After doing poo 662
Before eating 938
After cleaning a child or washing out a diaper 138
After cleaning the toilet 421
After touching any utensil used for cleaning the house 82
After cleaning a chamber pot 151
Before preparing food 254
Before feeding a child 340
After touching or having cared for a patient 140
After eating 616
These data are consistent with the previous table confirming that although households are aware of the usefulness of this practice it takes time to become a habit
When asked what motivates household members to wash their hands with water and soap or detergent their spontaneous responses were
Table 18 Factors motivating hand washing in households
Motivational Factors Proportion of households ()
Prevent disease 868
Prevent diarrhea 325
Remove germs 361
Prevent dust from entering the mouth 127
Prevent dust from entering the food 33
It smells good 16
Benin Baseline Survey of Peri-Urban Sanitation and Hygiene 27
In four out of five households (868 percent) hand washing is done to prevent disease However health is not a sufficient factor to motivate hand washing with soap The presence of a functional device for hand washing has a lot to do with it
Among the 868 percent of households claiming to wash their hands because of disease only 246 percent have a hand washing station equipped with essential supplies (soap and water) near the kitchen
Other lesser reasons but related to the first are the prevention of diarrhea (325 percent) and the elimination of germs (361 percent)
Sanitation in Households
Household sanitation depends largely on the accessibility of hygiene infrastructure (latrine shower) in the household This is particularly important when the household has young children including children under five years old when they are most vulnerable 595 percent of households visited during this survey have a child younger than five years old and 453 percent have a child under three years old So the majority of children under the age of five are children less than three years old
Management of Feces During the survey respondents were asked ldquoThe last time your child under 3 years of age pooped where did he gordquo
Figure 6 summarizes the responses recorded from households
Figure 6 Distribution of households by places of defecation by children under the age of 3
Benin Baseline Survey of Peri-Urban Sanitation and Hygiene 28
A little more than three-quarters of households (776 percent) used a potty Cloth diapers (67 percent) and disposables (64 percent) were rarely used Other unsavory means were used and are found in the ldquoOtherrdquo category (13 percent) garbage piles in plastic bags and on the ground
Once the child has finished pooping parents dispose of the feces in different places toiletlatrines (668 percent) garbage dumps (204 percent) or garbage cans (34 percent) They are also thrown out with wastewater (31 percent) or disposed of in Other places (41 percent) such as the bush in the lagoon in the lake in gutters and in swampland
According to respondents in four out of five households (807 percent) childrenrsquos feces are disposed of by the head of household or hisher spouse and in just over one in 10 households (126 percent) by the sons or daughters of the head of household They are also disposed of by other relatives (67 percent) of the household members surveyed
The respondents were also asked ldquoWhere do family members go when they need to defecaterdquo Figure 7 summarizes the responses recorded on defecation areas used by household members surveyed In this figure the section ldquoVentilated Latrinesrdquo includes ventilated latrines and ventilated improved pit latrines
Figure 7 Distribution of households by place of defecation for family members
More than seven out of 10 households (743 percent) use sanitation facilities The remaining households use either fields the beach plastic bags (16 percent) or dumpsites (74 percent) The rest (46 percent) use swampy areas the lakeside public drains the lagoon or at times private for-fee or hanging latrines
For anal cleansing households use several means These are newsprint (40 percent) water (386 percent) toilet paper (196 percent) and leaves (14 percent)
Benin Baseline Survey of Peri-Urban Sanitation and Hygiene 29
Availability of Toilets in Households Information was collected during the survey about who put in the toilets used by households hence the question Did your household install the toilet that you are using Answers from the respondents are summarized in the Total column of the table below In addition the crossing of this question with the question of home ownership produces the following results Among homeowners a little more than one-third (345 percent) did not have a toilet compared to four households out of nine (454 percent) who installed a toilet in their house We note that one-fifth (201 percent) of these homeowners were not responsible for the installation of toilets in their homes This is the case with households that live in family homes in which they are considered to be the owners or co-owners For renters 762 percent did not install the toilets that are in the houses where they live only 07 percent are responsible for installing toilets in their home and a little more than one-fifth (231 percent) do not have a toilet In lodged households 537 percent did not install toilets in the house where they live only 63 percent are responsible for installing toilets in their home and four-tenths (400 percent) do not have a toilet in their house
Table 19 Distribution of households according to the person responsible for installing latrines and the title of ownership of the house
Installation of toilets by the household
Title of ownership of the house Total
Owner Renter Lodged
No they were already there
201 762 537 431
Yes 454 07 63 257
The household does not have a toilet
345 231 400 312
Total 100 100 100 100
At the household level when the decision was made to install latrines in nearly nine households out of 10 (877 percent) it was made by the head of household or spouse This decision was taken in 82 percent of households by the parents of the head of household or spouse and in 41 percent of households (renting) by the owners
Regarding the location of toilets the owners made the decision in a little less than half of households visited (47 percent) heads of households or spouses made it in one-third of households (341 percent) and in almost one-fifth of the households visited (188 percent) other actors such as parents of head of household or spouse and previous renters made the decision
Figure 8 provides information on the location of toilets in households
Benin Baseline Survey of Peri-Urban Sanitation and Hygiene 30
Figure 8 Distribution of households by location of toilets in the household
Half of households visited (501 percent) have their toilets inside or attached to their house a little less than half (479 percent) have theirs elsewhere in the compound usually in the courtyard and only 2 percent outside of the property
According to the responses obtained from respondents less than a quarter (224 percent) of toilet pits has been emptied recently Two-thirds of the emptied pits (666 percent) are emptied once a year Others are emptied with regular frequency such as once a month (08 percent) once every two months (08 percent) or once every three months (23 percent) Still others grouped in the section ldquoOthersrdquo (356 percent) are emptied twice a year once every two years and once every three years The average cost of one emptying is 44500 CFA Pit emptying is more common in households where the latrine is shared with other families (Chi2=63 p=000) among renters (Chi2=1238 p=000) in houses that flood (Chi2=263 p=000) and in families with a better socio-economic status (Chi3=91 p=001)
In regards to the place where the sewage sludge is dumped nine households out of 10 (902 percent) reported not knowing where it is emptied On the other hand one household out of 10 (98 percent) said that the toilets are flushed into rivers and the ocean All emptied toilets are still in use
Regarding shared toilets two households out of three (659 percent) share their toilets with other households The average number of households that share the same toilet is five
In the three municipalities of the study nearly seven households out of 10 (697 percent) use an improved sanitation infrastructure
Principal Reasons to Build or Not to Build Toilets We asked households with toilets for three main reasons why they built their toilets Figure 9 below shows the responses of households interviewed
Benin Baseline Survey of Peri-Urban Sanitation and Hygiene 31
Figure 9 Distribution of households according to principal reasons for building the toilets
Households mentioned the following three reasons most to justify building toilets privacy (699 percent) disease prevention (616 percent) and security (362 percent)
Households that do not have toilets mention the reasons below (Figure 10)
Figure 10 Distribution of households by principal reasons for not building latrines
The high cost of construction of latrines (677 percent) is by far the most common reason households justified not building the toilets While more households in the lower socio-economic status (715 percent) than in the higher socio-economic status (526 percent) give this reason the difference is not statistically significant Next the nature of the soil (373 percent) and the fact that the household does not have the necessary supplies to build latrines
Benin Baseline Survey of Peri-Urban Sanitation and Hygiene 32
(327 percent) are mentioned Other reasons are listed in smaller proportions as indicated in the graph The ldquoOtherrdquo category (216 percent) is comprised of those who do not have toilets (one-fifth of respondents) among other reasonsmdashthe delay in resettlement operations the effects of flooding during the rainy season the refusal of some tenants to contribute upon request of the owner to build toilets and zoning and resettlement issues
In households feelings of satisfaction or dissatisfaction regarding the use of the latrine were recorded depending on where the household defecates In fact 325 percent of households are very dissatisfied with the place where they defecate 129 percent are somewhat dissatisfied 27 percent have no opinion 227 percent are rather satisfied and 293 percent are very satisfied
Reasons for dissatisfaction are summarized in Figure 11
Figure 11 Distribution of households by reasons for dissatisfaction in the use of a latrine
The reason most cited by three out of five households interviewed (595 percent) is that the defecation site is not hygienic The section ldquoOtherrdquo (63 percent) takes into account reasons such as the latrine is full or almost full latrine has no door latrine has a defective door too many people use the latrine flooding latrine is dirty lacks a vent pipe and does not allow privacy It should be added that the response about privacy is very uncommon but is relevant especially in the case of shared latrines that are very close to living quarters where the person using the latrine is known by all
Reasons for satisfaction are summarized in Figure 12
Benin Baseline Survey of Peri-Urban Sanitation and Hygiene 33
Figure 12 Distribution of households by reasons justifying the feelings of satisfaction ofhouseholds that use the latrine
The proximity of the place (60 percent) maintenance (419 percent) safety (389 percent) and the fact that the site provides a sense of privacy (378) are the satisfaction factors households mention the most
Despite the fact that almost a third (312 percent) of households interviewed do not have a latrine and that nearly two-thirds (595 percent) have decried hygiene conditions only a quarter of households (257 percent) surveyed seem to want to do something to change their present situation regarding access to a latrine
To change the current situation households made the following suggestions building private latrines (291 percent) improving private latrines owned by the household (159 percent) asking the owner to build a latrine (155 percent) asking for community help to build latrines (05 percent) and requesting assistance of government or outside sources to improve the sanitation situation (241 percent) Actions that are covered under the section ldquoOtherrdquo (15 percent) include moving the household emptying the latrine andor covering the latrine
Only 76 percent of households interviewed intend to install or change their sanitation facility in the next six months
More than the majority (69 percent) of households thinks that sanitation is a problem in their district They mention reasons such as open defecation (525 percent) odor (558 percent) presence of feces everywhere (25 percent) unhealthy environment (44 percent) lack of health services (503 percent) lack of resources (335 percent) and ldquoOtherrdquo reasons (52 percent)mdash flooding of toilets in the rainy season high level of ground water full toilets not emptied defecation in bags the proliferation of flies and occupancy of swamp areas
Benin Baseline Survey of Peri-Urban Sanitation and Hygiene 34
Observation of Households Toilets
Condition of Toilets Data collectors asked householders who owned toilets if they could observe their facilities In response to the question ldquoMay I see your toiletsrdquo nine out of 10 households (901 percent) responded in the affirmative Only 53 percent of toilets observed were built during the 12 months that preceded the survey From observation of the distance between the toilets and the dwelling it appears that 854 percent of toilets are in the homes 26 percent in the yard 111 percent at a distance less than or equal to 20 meters from the house and 09 percent more than 20 meters from the house
Of the toilets observed 965 percent have walls 906 percent have a roof 886 percent allow privacy 69 percent keep their door closed and 64 percent are a series of toilets with more than one entrance to allow several persons to use them at the same time Two elements observed help make them more accessible to children squat toilets with a smaller hole (64 percent) maybe by chance and toilets with a lower seat (636 percent) Fewer than half (459 percent) of latrines visited had a covered hole
In the latrines the following conditions were observed (using a flashlight) fecal matter was observed in squat holes in 502 percent of cases anal cleansing products (236 percent) wet seats (438 percent) grey colored seats (129 percent) bad smells (365 percent) presence of flies (21 percent) and cockroaches (163 percent)
According to respondents only 36 percent of toilets are flooded during the rainy season Remember that flooded houses are more common in Cotonou When latrines are flooded household members go to defecate in a dry public place (30 percent) in the lake (30 percent) in a private dry place (15 percent) in a plastic bag (15 percent) on a dump site (5 percent) or in the flooded latrine (5 percent)
Also during the observation an assessment was made of latrine maintenance namely the floor the hole cover and the anal cleansing material (toilet paper for the most part) Figure 13 below shows the results of observed toilet maintenance The graph shows the cumulative percentages by component
Benin Baseline Survey of Peri-Urban Sanitation and Hygiene 35
Figure 13 Results of the assessment of latrine maintenance components in observed latrines
In general observations showed that only about a third of latrines had been adequately cleaned Thus each latrine component only receives an approximate cleaning 531 percent for the floor 186 percent for the hole cover and 533 percent for the anal cleansing material
In nearly one out of two households (486 percent) a broom was noted near the toilets Finally feces in the observed toilets go mainly into septic tanks (586 percent) and dry holes (394 percent)
Psycho-Social Determinants of Latrine Ownership
To measure psycho-social determinants of latrine ownership the respondents were read a series of statements to elicit their opinion Responses obtained are shown in Table 20 below
Benin Baseline Survey of Peri-Urban Sanitation and Hygiene 36
Table 20 Household opinions on latrine ownership
Statements Do not agree No opinion
Some-what agree
Strongly agree
It makes the owners appear modern 70 82 287 561
It makes the owners respectable members of the community
50 79 298 572
It makes the owners respected by people who visit them
20 43 306 631
It makes the owners more appreciated
35 65 309 591
It makes the members of the household proud
11 33 228 729
It allows women to have privacy at any time of the day
08 05 129 858
It helps keep the shared compound areas clean
22 50 214 713
It doesnrsquot reduce the number of flies in the house
449 103 192 256
It allows you to go relieve yourself easily when you are sick
09 40 254 697
It allows you to go relieve yourself easily when you are old
18 39 278 665
It reduces the possibility of disease in the household
21 30 256 692
It gives toilet users a little more privacy
01 08 185 805
Itrsquos annoying to go to the ldquojohnrdquo every time to do your business
719 140 39 102
It avoids the dangers of having to go do your business at night in the bush
05 01 118 876
Itrsquos really hard to maintain latrines so that they are always operational
594 125 177 104
It is difficult to maintain them so that they are always clean
607 108 178 108
Benin Baseline Survey of Peri-Urban Sanitation and Hygiene 37
-
Summary Table of Survey Indicators
A summary table of indicators has been generated according to socio-economic groups Socio-demographic factors were used to establish socio-economic levels and an analysis was made for each income level The socio-economic levels were established using the conventional method of creating a wealth index The data were subsequently processed by municipality to explore the differences among Cotonou Abomey-Calavi and Porto-Novo
Table 21 Key indicators by household socio-economic level
Indicators
Socio economic typology All subgroups combined
(N=856)
Pearson Chi-square 8
p
Lower
(N=245)
Intermediate
(N=263)
Upper
(N=278)
of households using an improved sanitation facility
453 691 945 697 164675 01
of households with a station for hand washing equipped with essential supplies (soap and water) near the toilets
11 11 142 55 63584 01
of households with a station for hand washing equipped with essential supplies (soap and water) near the kitchen
109 160 391 221 75597 01
of households treating drinking water correctly
32 60 45 46 2689 lt Not significant
of households storing drinking water correctly
600 702 900 735 68427 01
A p value of 01 means that the relationships are highly significant meaning improved infrastructure is more commonly found in the upper socio-economic group
Table 22 below provides a specific summary of each of the three municipalities of the study
8 The Chi-square seeks to establish the relationship between two categorical variables Sex is a categorical variables because it would group individuals into one of two categories men or women This would be a dichotomous categorical variable Socioeconomic quintiles would also be a categorical variable In this case it would not be dichotomous Chi-square can be used to explore the relationship between the two types
Benin Baseline Survey of Peri-Urban Sanitation and Hygiene 38
Table 22 Presentation of key indicators by municipality
Indicators
Municipality Together
(N=856)
Pearson Chi-square
p
Abomey-Calavi
(N=155)
Cotonou
(N=349)
Porto-Novo
(N=352)
of households using improved sanitation infrastructure
516 799 676 697 42106 gt 921
01
of households with a station for hand washing with essential supplies (soap and water) near the toilets
13 86 43 55 12780 01
of households with a station for hand washing with essential supplies (soap and water) near the kitchen
161 284 185 221 13880 01
of households who treat their drinking water properly
77 54 23 46 8471 02
of households who store their drinking water properly
645 785 724 735 11117 01
All associations reported are statistically significant The improved facilities and better practices are more commonly reported in Cotonou
Benin Baseline Survey of Peri-Urban Sanitation and Hygiene 39
-
Table 23 below combines the variables of the two tables above
Table 23 Presentation of indicators by municipality and by household socio-economic levels
Indicators
Municipalities
Abomey Calavi Cotonou Porto-Novo
poor average wealthy Pearson Chi-square
poor average wealthy Pearson Chi-square
poor average wealthy Pearson Chi-square
of households using improved sanitation infrastructure
204 581 846 39148 gt 921
485 716 988 8348 gt 921
521 731 906 Significant 01 level
of households with a station for hand washing with essential supplies (soap and water) near the toilets
00 00 51 6026 gt 5991
00 17 170 28092 gt 921
18 10 129 Significant 01 level
of households with a station for hand washing with essential supplies (soap and water) near the kitchen
19 45 97 19915 gt 921
74 147 467 52703 gt 921
141 202 247 Not significant
of households who properly treat their drinking water
74 81 77 0018 lt 4605
59 69 42 0964 lt 4605
06 38 35 Not significant
of households who store their drinking
574 581 846 9201 gt 529 733 927 48001 638 740 871 15323 Significant
Benin Baseline Survey of Peri-Urban Sanitation and Hygiene 40
-
Indicators
Municipalities
Abomey Calavi Cotonou Porto-Novo
poor average wealthy Pearson Chi-square
poor average wealthy Pearson Chi-square
poor average wealthy Pearson Chi-square
water properly 7824 gt 921 01 level
Benin Baseline Survey of Peri-Urban Sanitation and Hygiene 41
Exposure to Information Messages on Hygiene and Sanitation Practices
During this survey information was also collected on the exposure of households to information messages on hygiene and sanitation practices as well as on sources of this information Data show that only one in five households (196 percent) received information on washing hands during the 30 days preceding the survey Figure 14 below summarizes the main sources of information received by the households
Figure 14 Distribution of households having received information on hand washing by sourceof information
As illustrated in the figure the most common sources of information to households are the radio (518 percent) and television (482 percent) and to some extent health centers (243 percent)
Regarding the treatment of drinking water only a quarter of the households surveyed (247 percent) received information on water treatment during the 30 days preceding the survey Sources of this information are practically the same as those for hand washing (Figure 15)
Benin Baseline Survey of Peri-Urban Sanitation and Hygiene 42
Figure 15 Distribution of households who received information on water treatment by sourceof information
Regarding sanitation only one-fifth (204 percent) of respondents had seen or heard about sanitation during the 30 days preceding the survey Sources of information received by these households are shown in Figure 16
Figure 16 Distribution of households having received information on sanitation by source of information
Whether for hand washing water treatment or sanitation television and the radio remain the two most cited sources of information by the households
The households surveyed were rarely visited by health educators for sensitization on the practice of open defecation (21 percent) or the daily maintenance of toilets (4 percent)
As for information on hydro-fecal diseases a little less than a third (274 percent) of households reported having received information on diarrhea or cholera in the 30 days that preceded the survey The most cited sources of information were the radio (594 percent) television (449 percent) and the health center (406 percent)
Benin Baseline Survey of Peri-Urban Sanitation and Hygiene 43
Conclusion
Data from this study indicate that certain populations from the municipalities of Cotonou Porto-Novo and Abomey-Calavi lack basic hygiene and sanitation infrastructure even though they live in urban areas The overall acceptability of conditions varies from one municipality to another The results of the study reveal that nearly seven out of 10 households surveyed use an improved sanitation facility The problem is less acute in Cotonou (799 percent) and Porto-Novo (676 percent) than in Abomey-Calavi (516 percent) Although households recognize the importance of hand washing in preventing certain diseases the act of washing hands with water and soap at key moments is still far from being a habit in many households Hand washing stations exist in very few households depending on whether the hand washing station is located near the kitchen or toilet In Cotonou the availability of hand washing stations is 284 percent near the kitchen compared to 86 percent near the toilets in Porto-Novo 185 percent have hand washing stations near the kitchen compared to 43 percent near the toilets and in Abomey-Calavi 161 percent of households have facilities near the kitchen compared to 13 percent near the toilets
Regarding household supply of drinking water in nine out of 10 households surveyed the drinking water comes from the distribution network of SONEB Only a minority of households drinks water from other sources including wells Only 58 percent of households treat drinking water Results of chlorine tests made in households that used chlorination show the average concentration of chlorine in the water as 349 mgl which is very high considering the World Health Organization standard of free chlorine concentration of treated water is 02 to 05 mgl Also the average number of days that the households continue to drink treated water is 64 days A poor household practice of mixing treated water with untreated whenever the water is renewed in the container was also observed All these reasons explain the alarmingly low percentage of households that properly treat their drinking water This indicator is 54 percent in Cotonou compared to 77 percent in Abomey-Calavi and 23 percent in Porto-Novo
Regarding proper storage of drinking water nearly three out of four households (735 percent) store their drinking water properly This indicator is 785 percent in Cotonou 724 percent in Porto-Novo and 645 percent in Abomey-Calavi
All these indicators that characterize the current state of hygiene and sanitation in these peri-urban districts surveyed also change depending on the socio-economic level of households
To reduce the health vulnerability of households in the study population it is necessary that appropriate interventions be implemented in the peri-urban neighborhoods To this end radio television and to some extent health centers appear to be the most appropriate channels for disseminating information and awareness messages according to data from the study
Benin Baseline Survey of Peri-Urban Sanitation and Hygiene 44
Endnotes
Boschi-Pinto C L Velebit and K Shibuyac 2008 Estimating Child Mortality Due to Diarrhoea in Developing Countries Bulletin of the World Health 86710ndash717
Water and Sanitation Program 2012 Economic Impact of Poor Sanitation in Africa
Benin Baseline Survey of Peri-Urban Sanitation and Hygiene 45
Annex 1 ndash Population from Sampled Districts
Municipality Districts Population Cotonou AVOTROU 17318
MINONTCHOU 7145 LADJI 8409
Abomey- GODOMEY 60034 Calavi TOGOUDO
TOKPA ZOUNGO 11090 HOUEKEGBO 1718 HOUEKEHONOU 1770
Porto-Novo ACCRON 5350 AVASSA 1715 FOUN FOUN 3412 TOKPA HOUEYOGBE 1638 GBEDJI
TOTAL 119601
The Survey Questionnaire is available separately on request from contactwashplusorg
Benin Baseline Survey of Peri-Urban Sanitation and Hygiene 46
WASHplus FHI 360 1825 Connecticut Ave NW Washington DC 20009 2028848000 wwwWASHplusorg contactwashplusorg
Benin Baseline Survey of Peri-Urban Sanitation and Hygiene 47
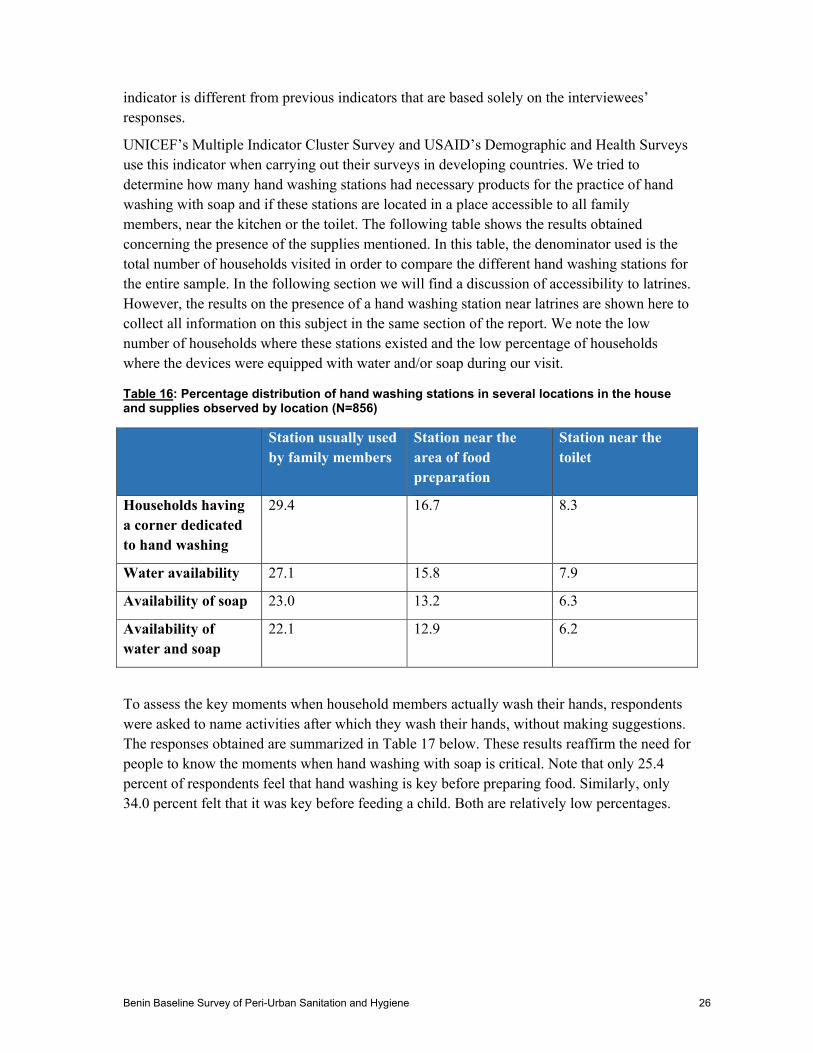
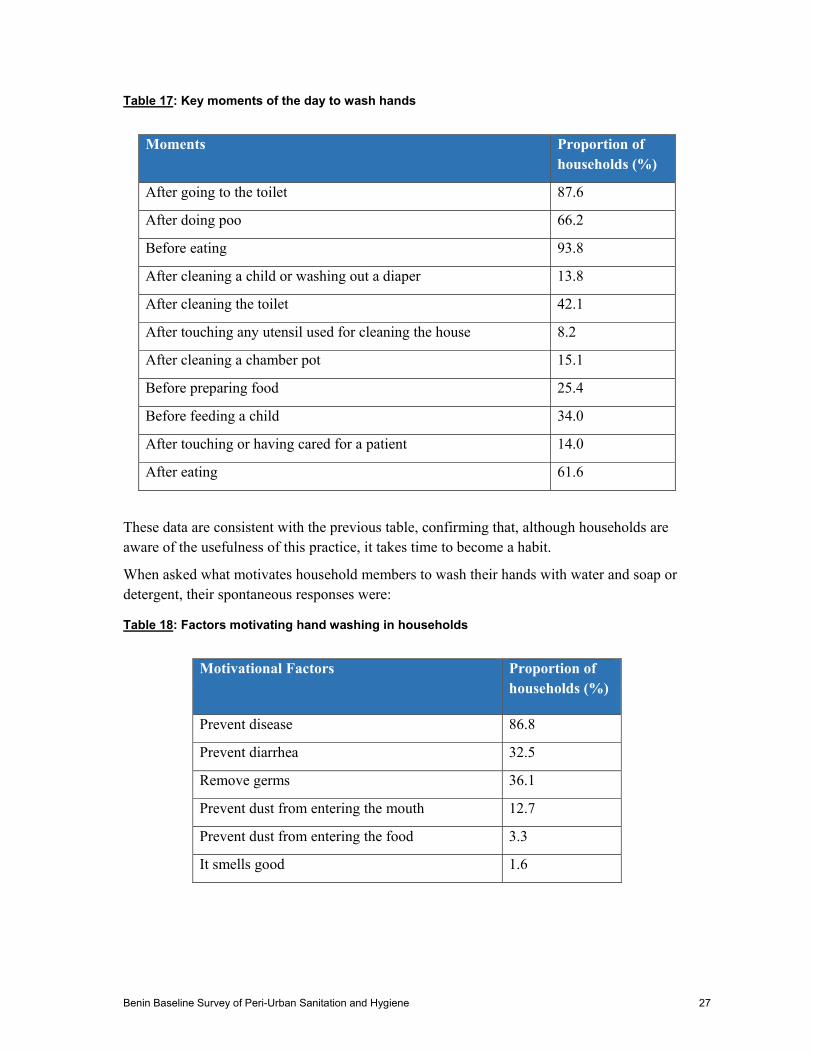
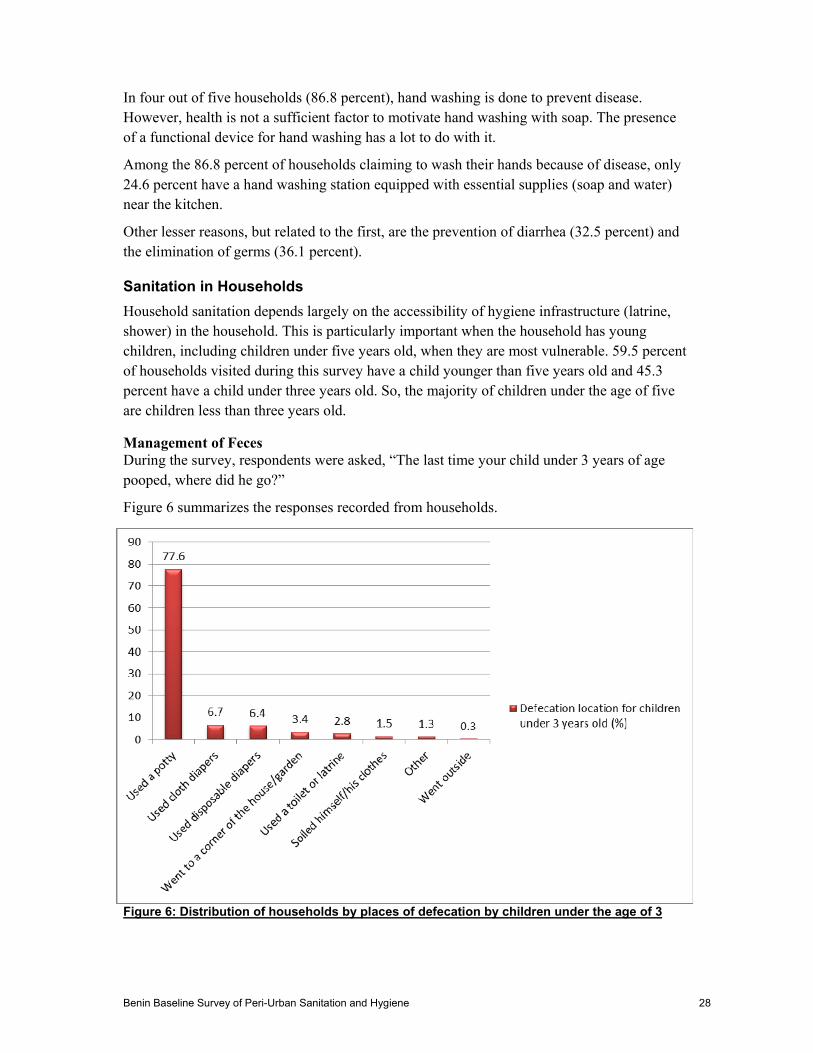
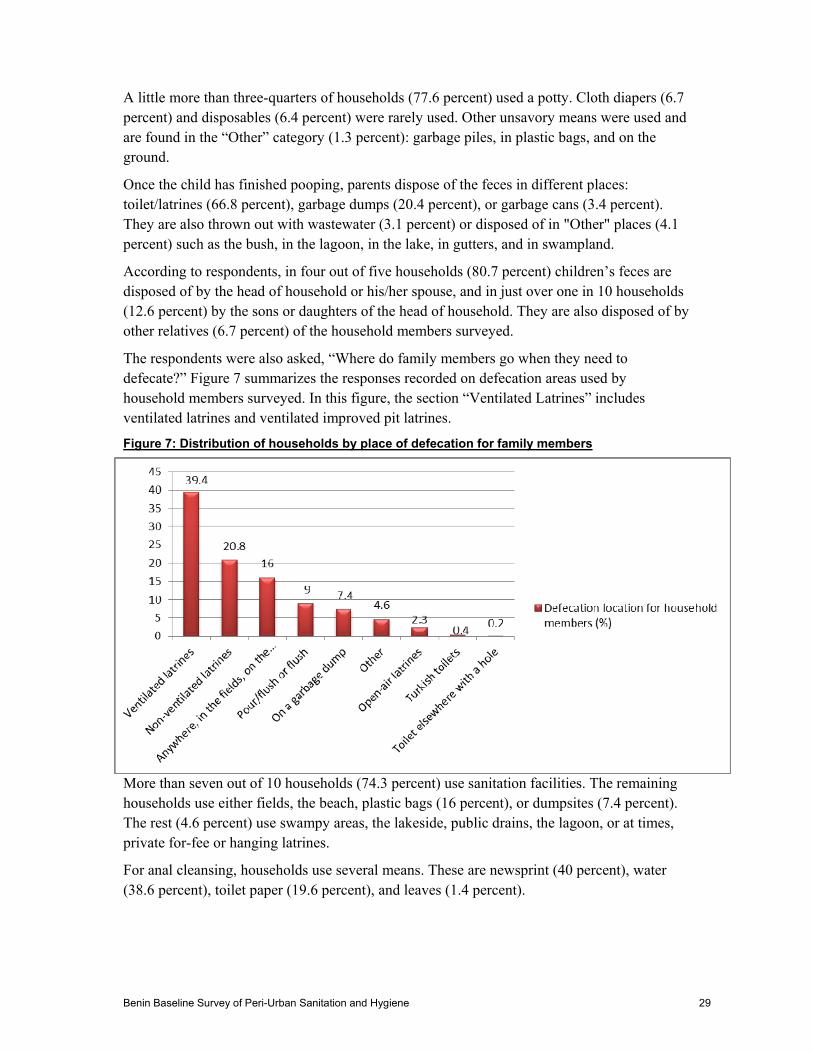
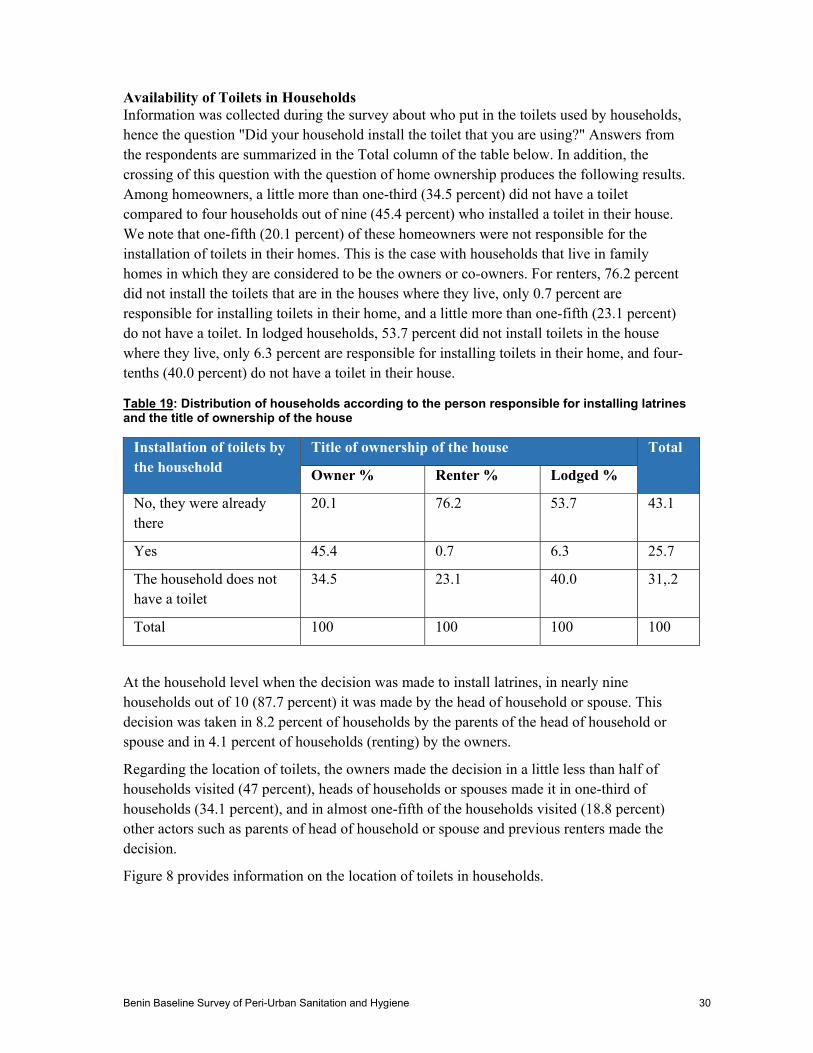
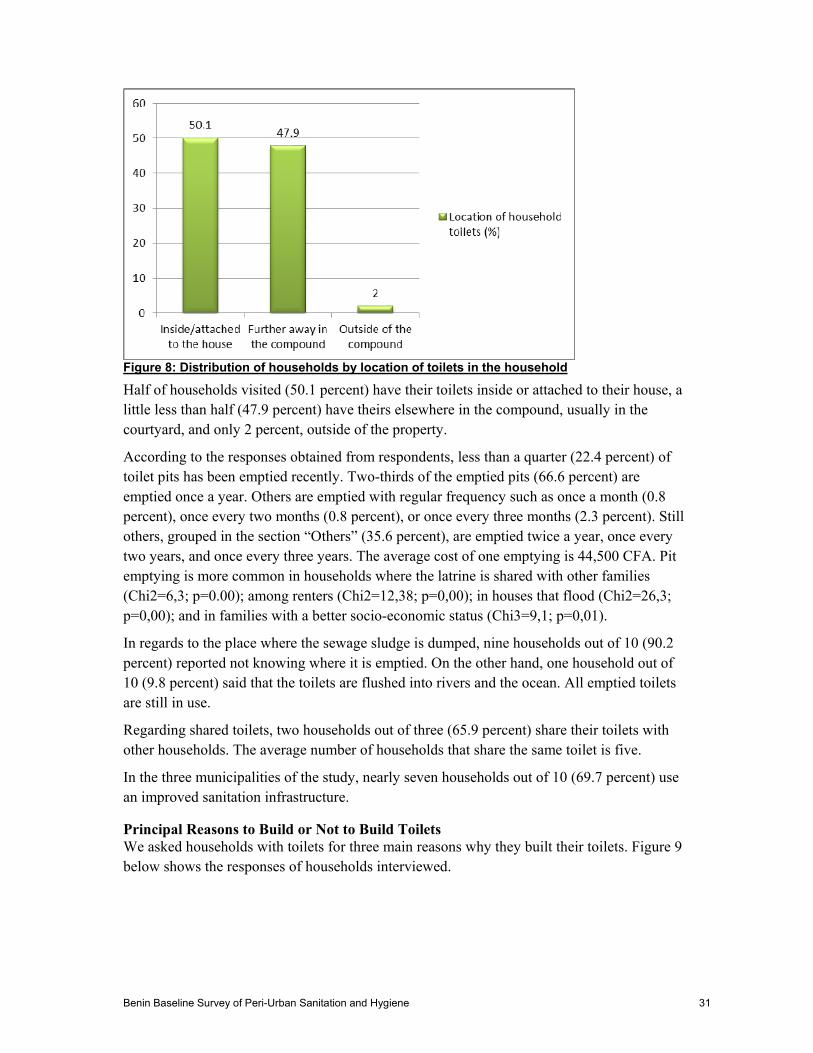
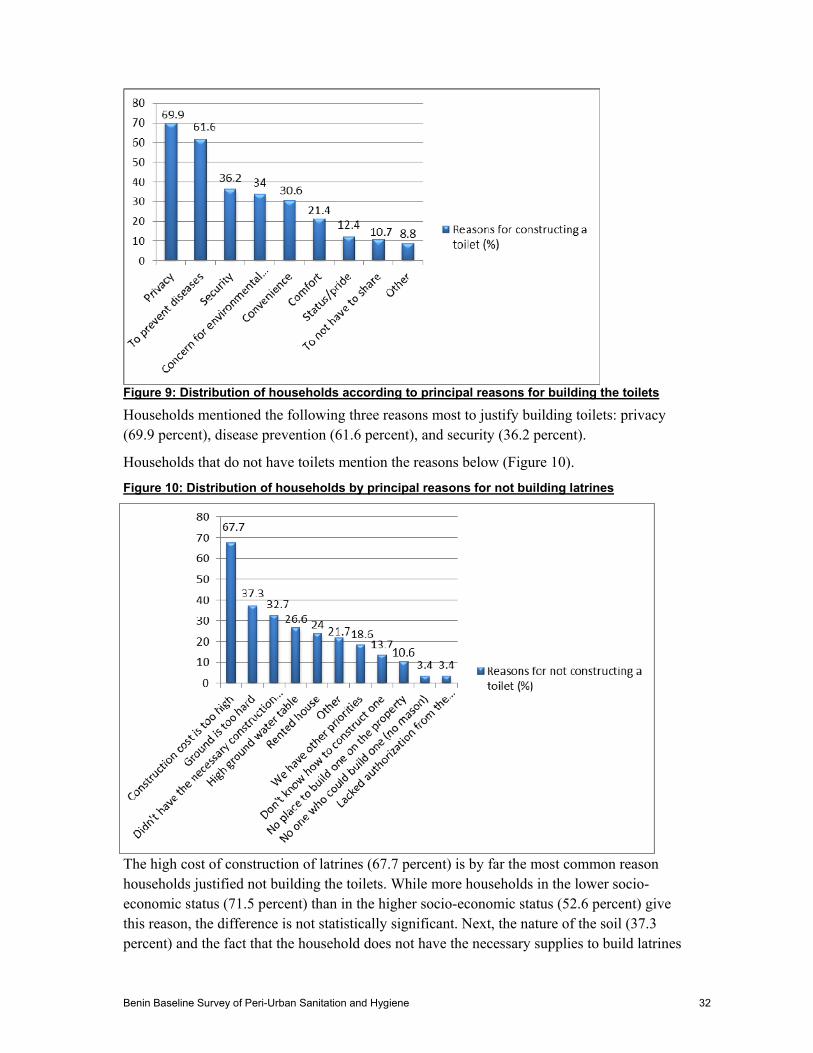
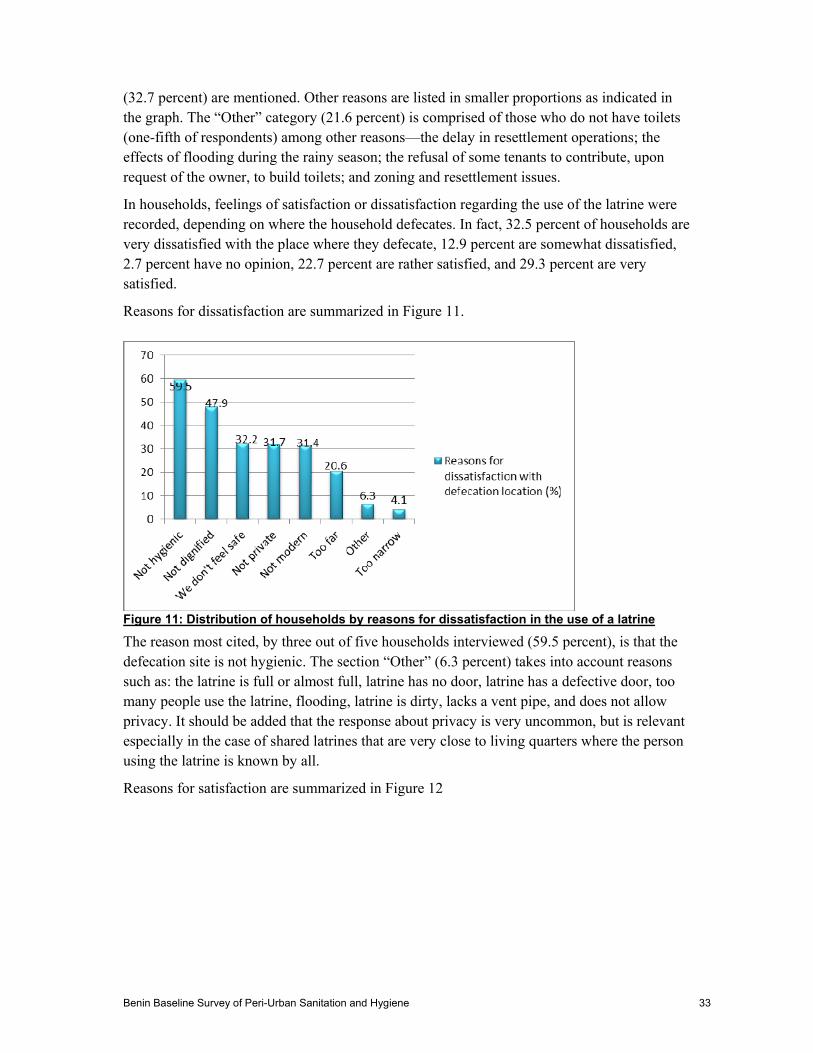
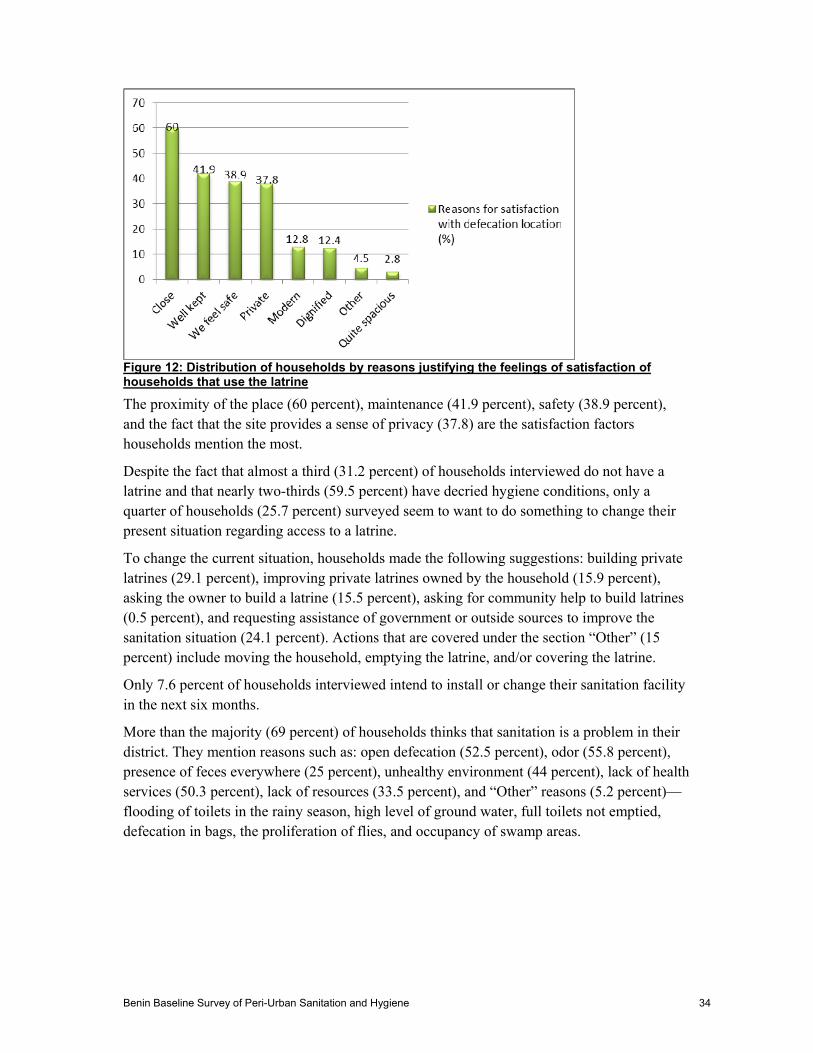
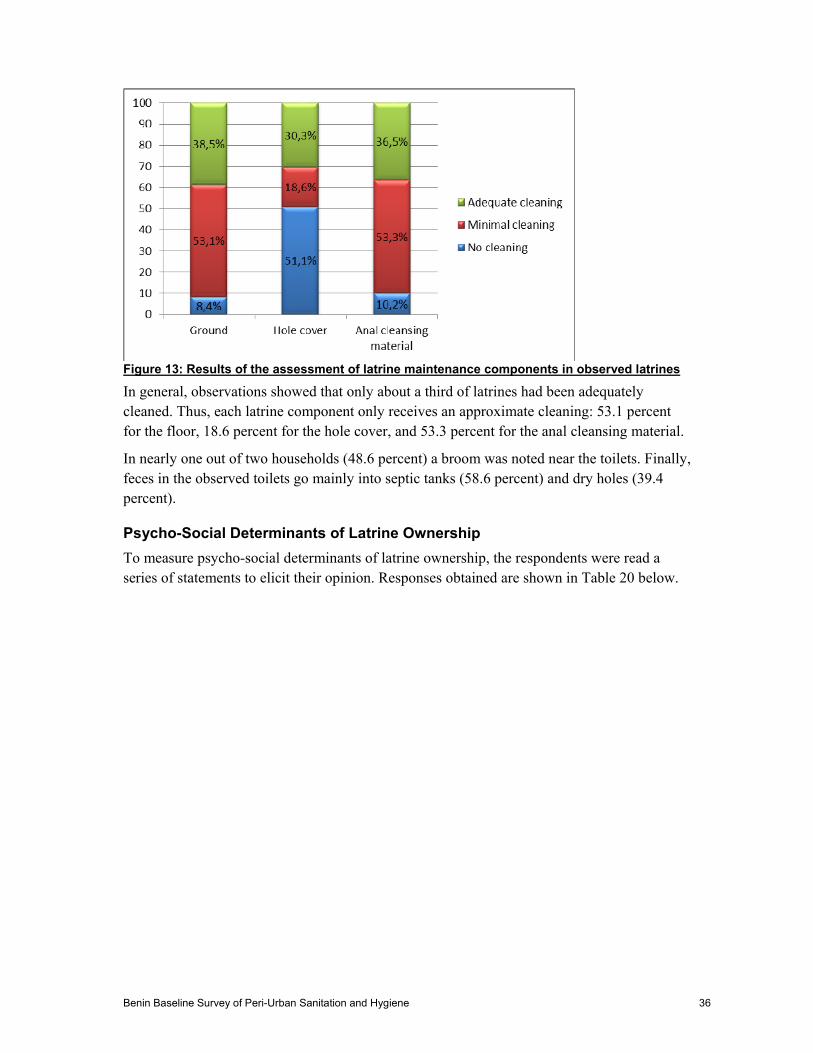
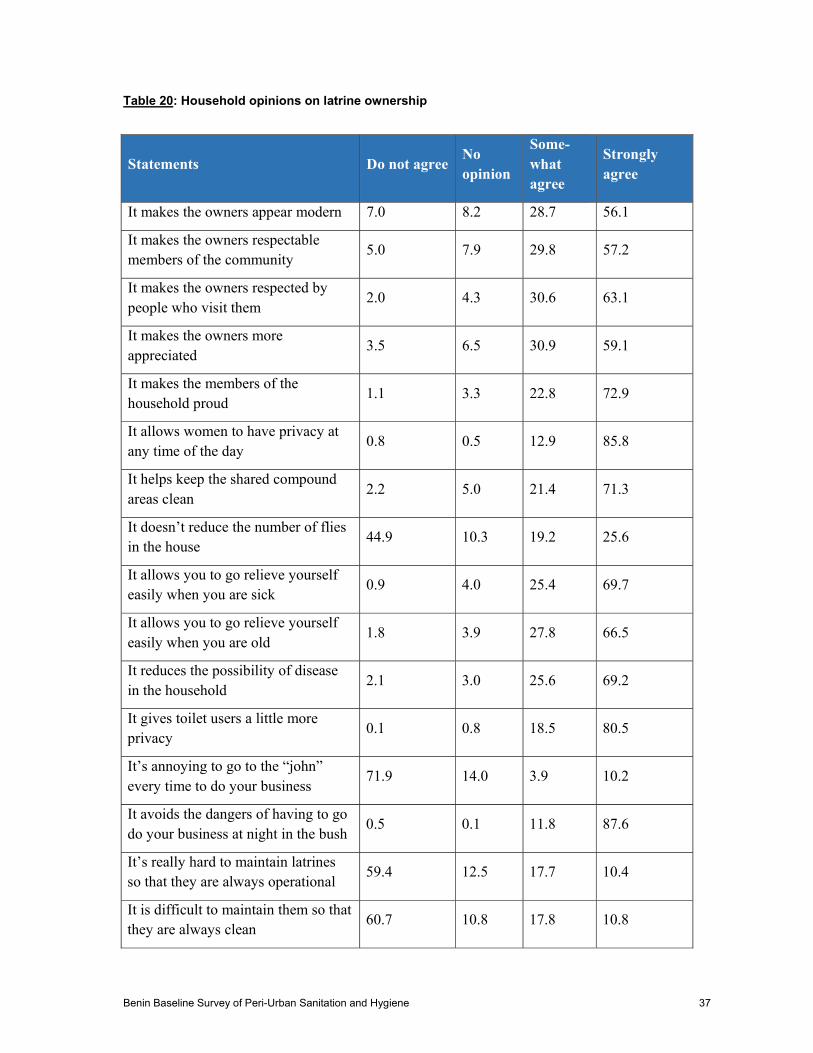
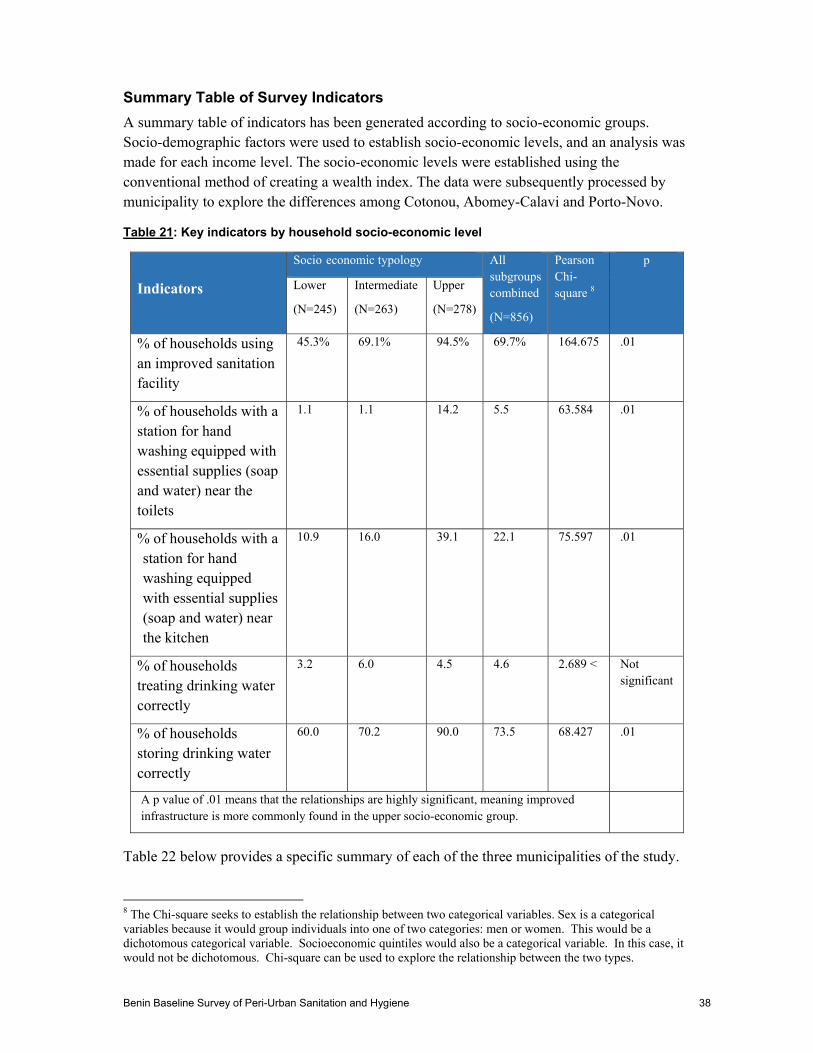
-
Summary Table of Survey Indicators
A summary table of indicators has been generated according to socio-economic groups Socio-demographic factors were used to establish socio-economic levels and an analysis was made for each income level The socio-economic levels were established using the conventional method of creating a wealth index The data were subsequently processed by municipality to explore the differences among Cotonou Abomey-Calavi and Porto-Novo
Table 21 Key indicators by household socio-economic level
Indicators
Socio economic typology All subgroups combined
(N=856)
Pearson Chi-square 8
p
Lower
(N=245)
Intermediate
(N=263)
Upper
(N=278)
of households using an improved sanitation facility
453 691 945 697 164675 01
of households with a station for hand washing equipped with essential supplies (soap and water) near the toilets
11 11 142 55 63584 01
of households with a station for hand washing equipped with essential supplies (soap and water) near the kitchen
109 160 391 221 75597 01
of households treating drinking water correctly
32 60 45 46 2689 lt Not significant
of households storing drinking water correctly
600 702 900 735 68427 01
A p value of 01 means that the relationships are highly significant meaning improved infrastructure is more commonly found in the upper socio-economic group
Table 22 below provides a specific summary of each of the three municipalities of the study
8 The Chi-square seeks to establish the relationship between two categorical variables Sex is a categorical variables because it would group individuals into one of two categories men or women This would be a dichotomous categorical variable Socioeconomic quintiles would also be a categorical variable In this case it would not be dichotomous Chi-square can be used to explore the relationship between the two types
Benin Baseline Survey of Peri-Urban Sanitation and Hygiene 38
Table 22 Presentation of key indicators by municipality
Indicators
Municipality Together
(N=856)
Pearson Chi-square
p
Abomey-Calavi
(N=155)
Cotonou
(N=349)
Porto-Novo
(N=352)
of households using improved sanitation infrastructure
516 799 676 697 42106 gt 921
01
of households with a station for hand washing with essential supplies (soap and water) near the toilets
13 86 43 55 12780 01
of households with a station for hand washing with essential supplies (soap and water) near the kitchen
161 284 185 221 13880 01
of households who treat their drinking water properly
77 54 23 46 8471 02
of households who store their drinking water properly
645 785 724 735 11117 01
All associations reported are statistically significant The improved facilities and better practices are more commonly reported in Cotonou
Benin Baseline Survey of Peri-Urban Sanitation and Hygiene 39
-
Table 23 below combines the variables of the two tables above
Table 23 Presentation of indicators by municipality and by household socio-economic levels
Indicators
Municipalities
Abomey Calavi Cotonou Porto-Novo
poor average wealthy Pearson Chi-square
poor average wealthy Pearson Chi-square
poor average wealthy Pearson Chi-square
of households using improved sanitation infrastructure
204 581 846 39148 gt 921
485 716 988 8348 gt 921
521 731 906 Significant 01 level
of households with a station for hand washing with essential supplies (soap and water) near the toilets
00 00 51 6026 gt 5991
00 17 170 28092 gt 921
18 10 129 Significant 01 level
of households with a station for hand washing with essential supplies (soap and water) near the kitchen
19 45 97 19915 gt 921
74 147 467 52703 gt 921
141 202 247 Not significant
of households who properly treat their drinking water
74 81 77 0018 lt 4605
59 69 42 0964 lt 4605
06 38 35 Not significant
of households who store their drinking
574 581 846 9201 gt 529 733 927 48001 638 740 871 15323 Significant
Benin Baseline Survey of Peri-Urban Sanitation and Hygiene 40
-
Indicators
Municipalities
Abomey Calavi Cotonou Porto-Novo
poor average wealthy Pearson Chi-square
poor average wealthy Pearson Chi-square
poor average wealthy Pearson Chi-square
water properly 7824 gt 921 01 level
Benin Baseline Survey of Peri-Urban Sanitation and Hygiene 41
Exposure to Information Messages on Hygiene and Sanitation Practices
During this survey information was also collected on the exposure of households to information messages on hygiene and sanitation practices as well as on sources of this information Data show that only one in five households (196 percent) received information on washing hands during the 30 days preceding the survey Figure 14 below summarizes the main sources of information received by the households
Figure 14 Distribution of households having received information on hand washing by sourceof information
As illustrated in the figure the most common sources of information to households are the radio (518 percent) and television (482 percent) and to some extent health centers (243 percent)
Regarding the treatment of drinking water only a quarter of the households surveyed (247 percent) received information on water treatment during the 30 days preceding the survey Sources of this information are practically the same as those for hand washing (Figure 15)
Benin Baseline Survey of Peri-Urban Sanitation and Hygiene 42
Figure 15 Distribution of households who received information on water treatment by sourceof information
Regarding sanitation only one-fifth (204 percent) of respondents had seen or heard about sanitation during the 30 days preceding the survey Sources of information received by these households are shown in Figure 16
Figure 16 Distribution of households having received information on sanitation by source of information
Whether for hand washing water treatment or sanitation television and the radio remain the two most cited sources of information by the households
The households surveyed were rarely visited by health educators for sensitization on the practice of open defecation (21 percent) or the daily maintenance of toilets (4 percent)
As for information on hydro-fecal diseases a little less than a third (274 percent) of households reported having received information on diarrhea or cholera in the 30 days that preceded the survey The most cited sources of information were the radio (594 percent) television (449 percent) and the health center (406 percent)
Benin Baseline Survey of Peri-Urban Sanitation and Hygiene 43
Conclusion
Data from this study indicate that certain populations from the municipalities of Cotonou Porto-Novo and Abomey-Calavi lack basic hygiene and sanitation infrastructure even though they live in urban areas The overall acceptability of conditions varies from one municipality to another The results of the study reveal that nearly seven out of 10 households surveyed use an improved sanitation facility The problem is less acute in Cotonou (799 percent) and Porto-Novo (676 percent) than in Abomey-Calavi (516 percent) Although households recognize the importance of hand washing in preventing certain diseases the act of washing hands with water and soap at key moments is still far from being a habit in many households Hand washing stations exist in very few households depending on whether the hand washing station is located near the kitchen or toilet In Cotonou the availability of hand washing stations is 284 percent near the kitchen compared to 86 percent near the toilets in Porto-Novo 185 percent have hand washing stations near the kitchen compared to 43 percent near the toilets and in Abomey-Calavi 161 percent of households have facilities near the kitchen compared to 13 percent near the toilets
Regarding household supply of drinking water in nine out of 10 households surveyed the drinking water comes from the distribution network of SONEB Only a minority of households drinks water from other sources including wells Only 58 percent of households treat drinking water Results of chlorine tests made in households that used chlorination show the average concentration of chlorine in the water as 349 mgl which is very high considering the World Health Organization standard of free chlorine concentration of treated water is 02 to 05 mgl Also the average number of days that the households continue to drink treated water is 64 days A poor household practice of mixing treated water with untreated whenever the water is renewed in the container was also observed All these reasons explain the alarmingly low percentage of households that properly treat their drinking water This indicator is 54 percent in Cotonou compared to 77 percent in Abomey-Calavi and 23 percent in Porto-Novo
Regarding proper storage of drinking water nearly three out of four households (735 percent) store their drinking water properly This indicator is 785 percent in Cotonou 724 percent in Porto-Novo and 645 percent in Abomey-Calavi
All these indicators that characterize the current state of hygiene and sanitation in these peri-urban districts surveyed also change depending on the socio-economic level of households
To reduce the health vulnerability of households in the study population it is necessary that appropriate interventions be implemented in the peri-urban neighborhoods To this end radio television and to some extent health centers appear to be the most appropriate channels for disseminating information and awareness messages according to data from the study
Benin Baseline Survey of Peri-Urban Sanitation and Hygiene 44
Endnotes
Boschi-Pinto C L Velebit and K Shibuyac 2008 Estimating Child Mortality Due to Diarrhoea in Developing Countries Bulletin of the World Health 86710ndash717
Water and Sanitation Program 2012 Economic Impact of Poor Sanitation in Africa
Benin Baseline Survey of Peri-Urban Sanitation and Hygiene 45
Annex 1 ndash Population from Sampled Districts
Municipality Districts Population Cotonou AVOTROU 17318
MINONTCHOU 7145 LADJI 8409
Abomey- GODOMEY 60034 Calavi TOGOUDO
TOKPA ZOUNGO 11090 HOUEKEGBO 1718 HOUEKEHONOU 1770
Porto-Novo ACCRON 5350 AVASSA 1715 FOUN FOUN 3412 TOKPA HOUEYOGBE 1638 GBEDJI
TOTAL 119601
The Survey Questionnaire is available separately on request from contactwashplusorg
Benin Baseline Survey of Peri-Urban Sanitation and Hygiene 46
WASHplus FHI 360 1825 Connecticut Ave NW Washington DC 20009 2028848000 wwwWASHplusorg contactwashplusorg
Benin Baseline Survey of Peri-Urban Sanitation and Hygiene 47
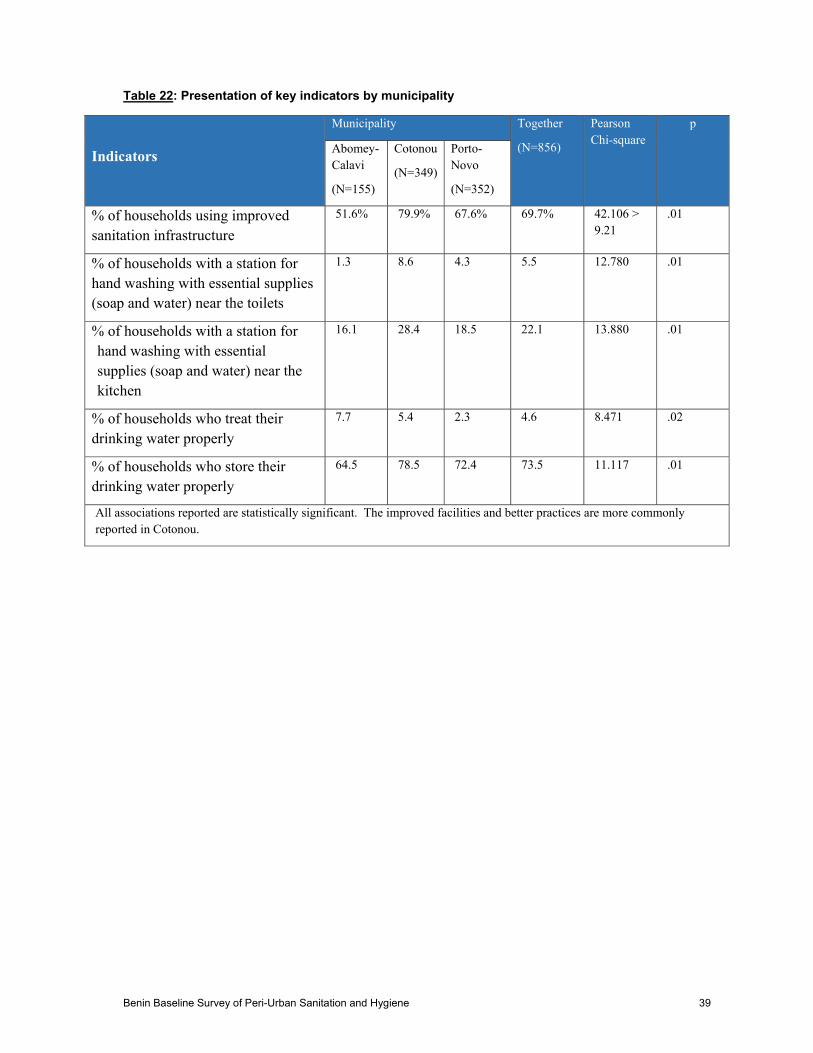
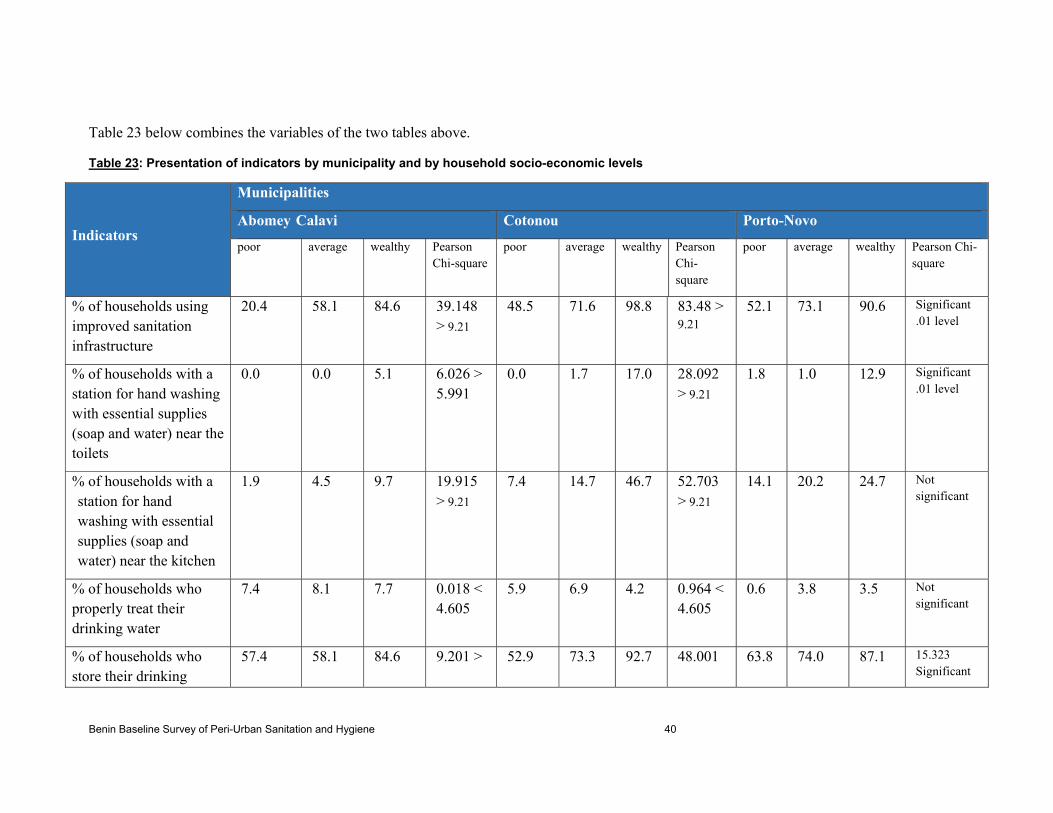
-
Table 23 below combines the variables of the two tables above
Table 23 Presentation of indicators by municipality and by household socio-economic levels
Indicators
Municipalities
Abomey Calavi Cotonou Porto-Novo
poor average wealthy Pearson Chi-square
poor average wealthy Pearson Chi-square
poor average wealthy Pearson Chi-square
of households using improved sanitation infrastructure
204 581 846 39148 gt 921
485 716 988 8348 gt 921
521 731 906 Significant 01 level
of households with a station for hand washing with essential supplies (soap and water) near the toilets
00 00 51 6026 gt 5991
00 17 170 28092 gt 921
18 10 129 Significant 01 level
of households with a station for hand washing with essential supplies (soap and water) near the kitchen
19 45 97 19915 gt 921
74 147 467 52703 gt 921
141 202 247 Not significant
of households who properly treat their drinking water
74 81 77 0018 lt 4605
59 69 42 0964 lt 4605
06 38 35 Not significant
of households who store their drinking
574 581 846 9201 gt 529 733 927 48001 638 740 871 15323 Significant
Benin Baseline Survey of Peri-Urban Sanitation and Hygiene 40
-
Indicators
Municipalities
Abomey Calavi Cotonou Porto-Novo
poor average wealthy Pearson Chi-square
poor average wealthy Pearson Chi-square
poor average wealthy Pearson Chi-square
water properly 7824 gt 921 01 level
Benin Baseline Survey of Peri-Urban Sanitation and Hygiene 41
Exposure to Information Messages on Hygiene and Sanitation Practices
During this survey information was also collected on the exposure of households to information messages on hygiene and sanitation practices as well as on sources of this information Data show that only one in five households (196 percent) received information on washing hands during the 30 days preceding the survey Figure 14 below summarizes the main sources of information received by the households
Figure 14 Distribution of households having received information on hand washing by sourceof information
As illustrated in the figure the most common sources of information to households are the radio (518 percent) and television (482 percent) and to some extent health centers (243 percent)
Regarding the treatment of drinking water only a quarter of the households surveyed (247 percent) received information on water treatment during the 30 days preceding the survey Sources of this information are practically the same as those for hand washing (Figure 15)
Benin Baseline Survey of Peri-Urban Sanitation and Hygiene 42
Figure 15 Distribution of households who received information on water treatment by sourceof information
Regarding sanitation only one-fifth (204 percent) of respondents had seen or heard about sanitation during the 30 days preceding the survey Sources of information received by these households are shown in Figure 16
Figure 16 Distribution of households having received information on sanitation by source of information
Whether for hand washing water treatment or sanitation television and the radio remain the two most cited sources of information by the households
The households surveyed were rarely visited by health educators for sensitization on the practice of open defecation (21 percent) or the daily maintenance of toilets (4 percent)
As for information on hydro-fecal diseases a little less than a third (274 percent) of households reported having received information on diarrhea or cholera in the 30 days that preceded the survey The most cited sources of information were the radio (594 percent) television (449 percent) and the health center (406 percent)
Benin Baseline Survey of Peri-Urban Sanitation and Hygiene 43
Conclusion
Data from this study indicate that certain populations from the municipalities of Cotonou Porto-Novo and Abomey-Calavi lack basic hygiene and sanitation infrastructure even though they live in urban areas The overall acceptability of conditions varies from one municipality to another The results of the study reveal that nearly seven out of 10 households surveyed use an improved sanitation facility The problem is less acute in Cotonou (799 percent) and Porto-Novo (676 percent) than in Abomey-Calavi (516 percent) Although households recognize the importance of hand washing in preventing certain diseases the act of washing hands with water and soap at key moments is still far from being a habit in many households Hand washing stations exist in very few households depending on whether the hand washing station is located near the kitchen or toilet In Cotonou the availability of hand washing stations is 284 percent near the kitchen compared to 86 percent near the toilets in Porto-Novo 185 percent have hand washing stations near the kitchen compared to 43 percent near the toilets and in Abomey-Calavi 161 percent of households have facilities near the kitchen compared to 13 percent near the toilets
Regarding household supply of drinking water in nine out of 10 households surveyed the drinking water comes from the distribution network of SONEB Only a minority of households drinks water from other sources including wells Only 58 percent of households treat drinking water Results of chlorine tests made in households that used chlorination show the average concentration of chlorine in the water as 349 mgl which is very high considering the World Health Organization standard of free chlorine concentration of treated water is 02 to 05 mgl Also the average number of days that the households continue to drink treated water is 64 days A poor household practice of mixing treated water with untreated whenever the water is renewed in the container was also observed All these reasons explain the alarmingly low percentage of households that properly treat their drinking water This indicator is 54 percent in Cotonou compared to 77 percent in Abomey-Calavi and 23 percent in Porto-Novo
Regarding proper storage of drinking water nearly three out of four households (735 percent) store their drinking water properly This indicator is 785 percent in Cotonou 724 percent in Porto-Novo and 645 percent in Abomey-Calavi
All these indicators that characterize the current state of hygiene and sanitation in these peri-urban districts surveyed also change depending on the socio-economic level of households
To reduce the health vulnerability of households in the study population it is necessary that appropriate interventions be implemented in the peri-urban neighborhoods To this end radio television and to some extent health centers appear to be the most appropriate channels for disseminating information and awareness messages according to data from the study
Benin Baseline Survey of Peri-Urban Sanitation and Hygiene 44
Endnotes
Boschi-Pinto C L Velebit and K Shibuyac 2008 Estimating Child Mortality Due to Diarrhoea in Developing Countries Bulletin of the World Health 86710ndash717
Water and Sanitation Program 2012 Economic Impact of Poor Sanitation in Africa
Benin Baseline Survey of Peri-Urban Sanitation and Hygiene 45
Annex 1 ndash Population from Sampled Districts
Municipality Districts Population Cotonou AVOTROU 17318
MINONTCHOU 7145 LADJI 8409
Abomey- GODOMEY 60034 Calavi TOGOUDO
TOKPA ZOUNGO 11090 HOUEKEGBO 1718 HOUEKEHONOU 1770
Porto-Novo ACCRON 5350 AVASSA 1715 FOUN FOUN 3412 TOKPA HOUEYOGBE 1638 GBEDJI
TOTAL 119601
The Survey Questionnaire is available separately on request from contactwashplusorg
Benin Baseline Survey of Peri-Urban Sanitation and Hygiene 46
WASHplus FHI 360 1825 Connecticut Ave NW Washington DC 20009 2028848000 wwwWASHplusorg contactwashplusorg
Benin Baseline Survey of Peri-Urban Sanitation and Hygiene 47
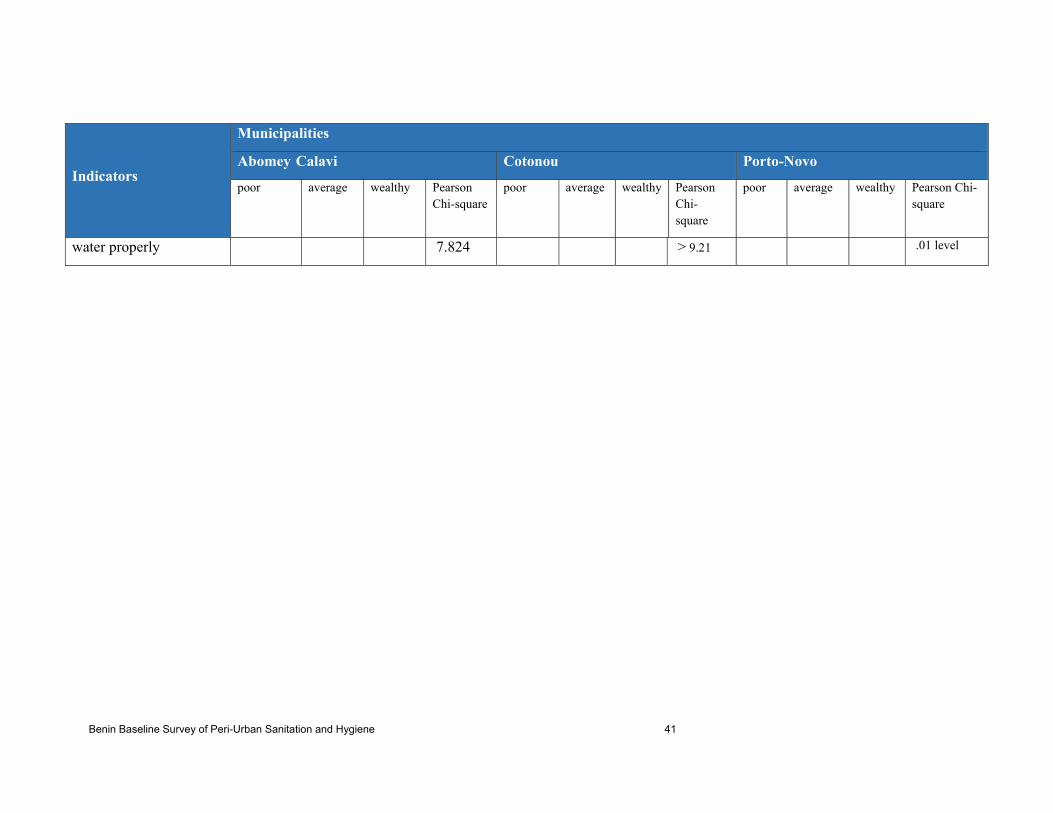
-
Indicators
Municipalities
Abomey Calavi Cotonou Porto-Novo
poor average wealthy Pearson Chi-square
poor average wealthy Pearson Chi-square
poor average wealthy Pearson Chi-square
water properly 7824 gt 921 01 level
Benin Baseline Survey of Peri-Urban Sanitation and Hygiene 41
Exposure to Information Messages on Hygiene and Sanitation Practices
During this survey information was also collected on the exposure of households to information messages on hygiene and sanitation practices as well as on sources of this information Data show that only one in five households (196 percent) received information on washing hands during the 30 days preceding the survey Figure 14 below summarizes the main sources of information received by the households
Figure 14 Distribution of households having received information on hand washing by sourceof information
As illustrated in the figure the most common sources of information to households are the radio (518 percent) and television (482 percent) and to some extent health centers (243 percent)
Regarding the treatment of drinking water only a quarter of the households surveyed (247 percent) received information on water treatment during the 30 days preceding the survey Sources of this information are practically the same as those for hand washing (Figure 15)
Benin Baseline Survey of Peri-Urban Sanitation and Hygiene 42
Figure 15 Distribution of households who received information on water treatment by sourceof information
Regarding sanitation only one-fifth (204 percent) of respondents had seen or heard about sanitation during the 30 days preceding the survey Sources of information received by these households are shown in Figure 16
Figure 16 Distribution of households having received information on sanitation by source of information
Whether for hand washing water treatment or sanitation television and the radio remain the two most cited sources of information by the households
The households surveyed were rarely visited by health educators for sensitization on the practice of open defecation (21 percent) or the daily maintenance of toilets (4 percent)
As for information on hydro-fecal diseases a little less than a third (274 percent) of households reported having received information on diarrhea or cholera in the 30 days that preceded the survey The most cited sources of information were the radio (594 percent) television (449 percent) and the health center (406 percent)
Benin Baseline Survey of Peri-Urban Sanitation and Hygiene 43
Conclusion
Data from this study indicate that certain populations from the municipalities of Cotonou Porto-Novo and Abomey-Calavi lack basic hygiene and sanitation infrastructure even though they live in urban areas The overall acceptability of conditions varies from one municipality to another The results of the study reveal that nearly seven out of 10 households surveyed use an improved sanitation facility The problem is less acute in Cotonou (799 percent) and Porto-Novo (676 percent) than in Abomey-Calavi (516 percent) Although households recognize the importance of hand washing in preventing certain diseases the act of washing hands with water and soap at key moments is still far from being a habit in many households Hand washing stations exist in very few households depending on whether the hand washing station is located near the kitchen or toilet In Cotonou the availability of hand washing stations is 284 percent near the kitchen compared to 86 percent near the toilets in Porto-Novo 185 percent have hand washing stations near the kitchen compared to 43 percent near the toilets and in Abomey-Calavi 161 percent of households have facilities near the kitchen compared to 13 percent near the toilets
Regarding household supply of drinking water in nine out of 10 households surveyed the drinking water comes from the distribution network of SONEB Only a minority of households drinks water from other sources including wells Only 58 percent of households treat drinking water Results of chlorine tests made in households that used chlorination show the average concentration of chlorine in the water as 349 mgl which is very high considering the World Health Organization standard of free chlorine concentration of treated water is 02 to 05 mgl Also the average number of days that the households continue to drink treated water is 64 days A poor household practice of mixing treated water with untreated whenever the water is renewed in the container was also observed All these reasons explain the alarmingly low percentage of households that properly treat their drinking water This indicator is 54 percent in Cotonou compared to 77 percent in Abomey-Calavi and 23 percent in Porto-Novo
Regarding proper storage of drinking water nearly three out of four households (735 percent) store their drinking water properly This indicator is 785 percent in Cotonou 724 percent in Porto-Novo and 645 percent in Abomey-Calavi
All these indicators that characterize the current state of hygiene and sanitation in these peri-urban districts surveyed also change depending on the socio-economic level of households
To reduce the health vulnerability of households in the study population it is necessary that appropriate interventions be implemented in the peri-urban neighborhoods To this end radio television and to some extent health centers appear to be the most appropriate channels for disseminating information and awareness messages according to data from the study
Benin Baseline Survey of Peri-Urban Sanitation and Hygiene 44
Endnotes
Boschi-Pinto C L Velebit and K Shibuyac 2008 Estimating Child Mortality Due to Diarrhoea in Developing Countries Bulletin of the World Health 86710ndash717
Water and Sanitation Program 2012 Economic Impact of Poor Sanitation in Africa
Benin Baseline Survey of Peri-Urban Sanitation and Hygiene 45
Annex 1 ndash Population from Sampled Districts
Municipality Districts Population Cotonou AVOTROU 17318
MINONTCHOU 7145 LADJI 8409
Abomey- GODOMEY 60034 Calavi TOGOUDO
TOKPA ZOUNGO 11090 HOUEKEGBO 1718 HOUEKEHONOU 1770
Porto-Novo ACCRON 5350 AVASSA 1715 FOUN FOUN 3412 TOKPA HOUEYOGBE 1638 GBEDJI
TOTAL 119601
The Survey Questionnaire is available separately on request from contactwashplusorg
Benin Baseline Survey of Peri-Urban Sanitation and Hygiene 46
WASHplus FHI 360 1825 Connecticut Ave NW Washington DC 20009 2028848000 wwwWASHplusorg contactwashplusorg
Benin Baseline Survey of Peri-Urban Sanitation and Hygiene 47
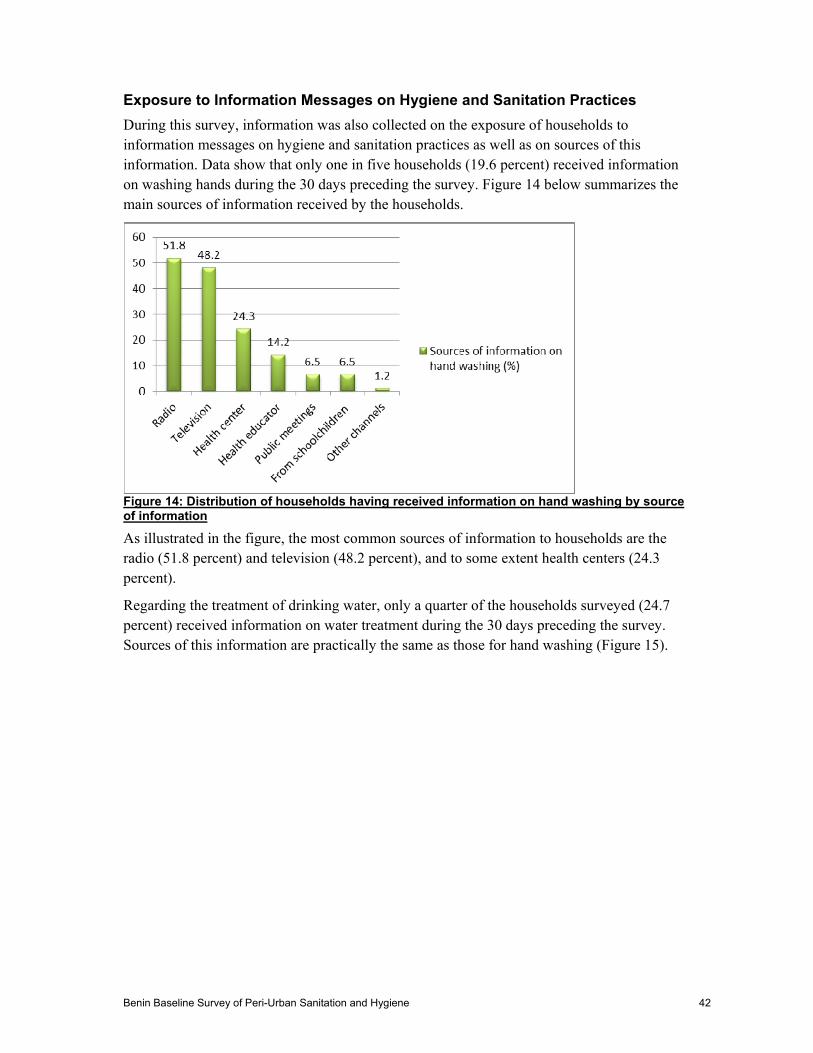
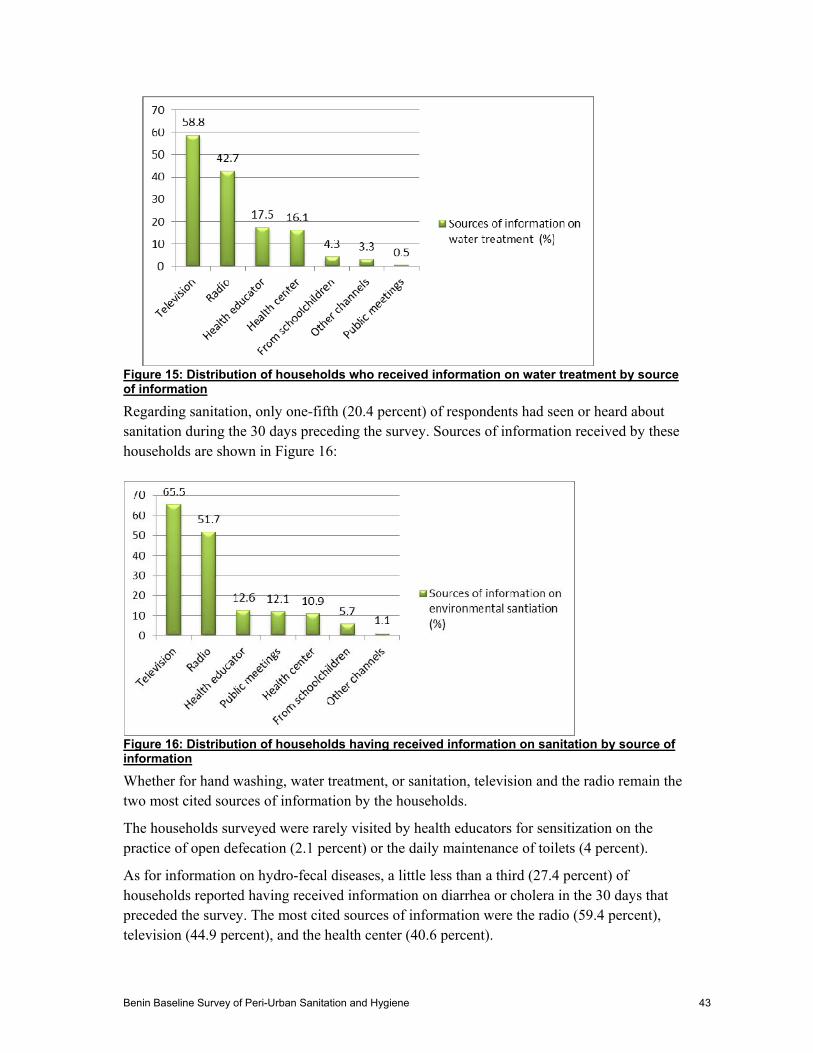
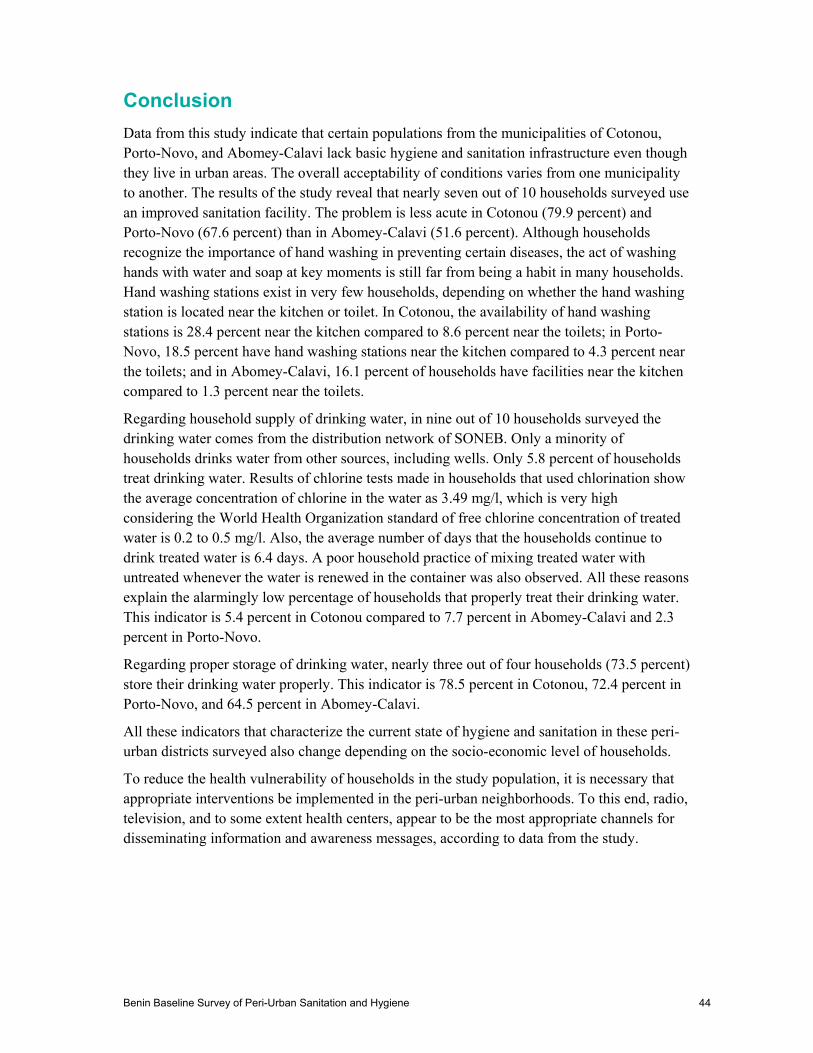
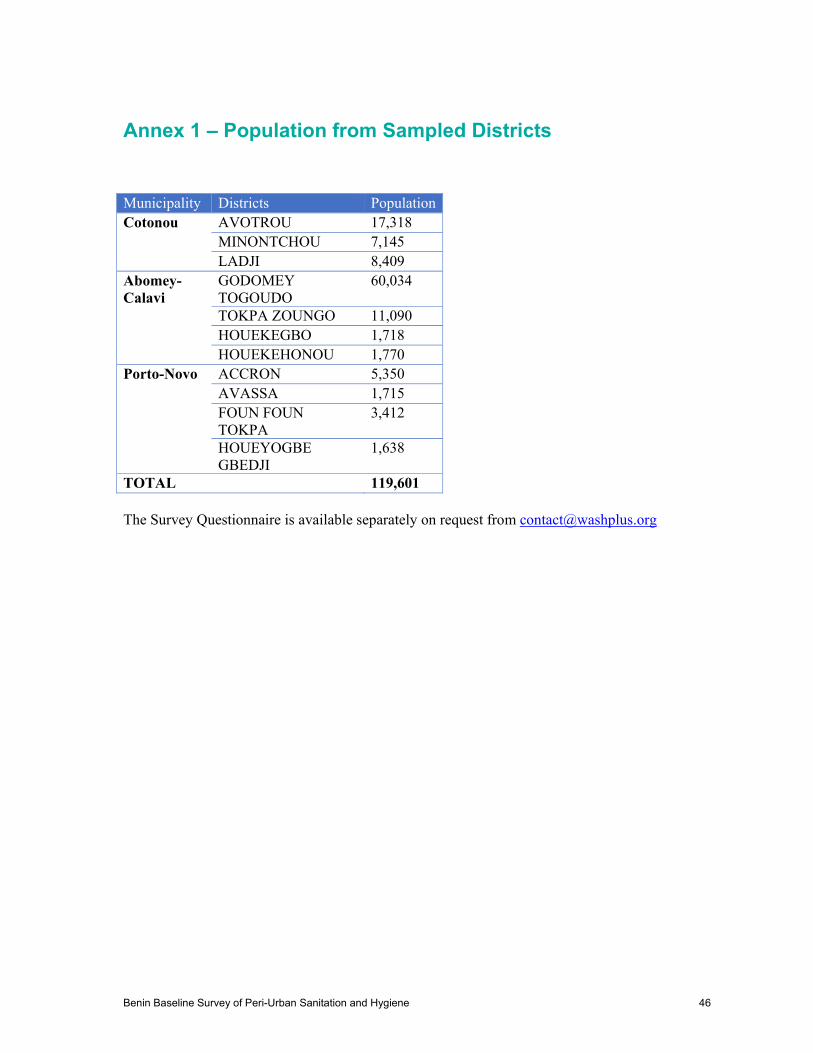
WASHplus FHI 360 1825 Connecticut Ave NW Washington DC 20009 2028848000 wwwWASHplusorg contactwashplusorg
Benin Baseline Survey of Peri-Urban Sanitation and Hygiene 47


