CONS/1011-8 NASA TM-73763 BASELINE TESTS OF THE EVA CHANGE-OF-PACE COUPE ELECTRIC PASSENGER VEHICLE John M. Bozek, Edward A. Maslowski, and Miles 0. Dustin National Aeronautics and Space Administration Lewis Research Center Cleveland, Ohio 44135 OTH21E EVA N78-17-38 r(NASA-Tn 73763)Y BASELINE TESTS CHANGE-OF-PACE COUPE ELECTBIC, PASSENGER VEHICLE (NASA) 63 p HC A04/ME A01 CSCL 13F Unclas G3/85 04463 November 1977 Prepared for DEPARTMENT OF ENERGY Division of Transportation Energy Conservation Under Interagency Agreement EC-77-A-31-1011
Transcript
CONS/1011-8 NASA TM-73763
BASELINE TESTS OF THE EVA CHANGE-OF-PACE COUPE ELECTRIC PASSENGER VEHICLE
John M. Bozek, Edward A. Maslowski, and Miles 0. Dustin National Aeronautics and Space Administration Lewis Research Center Cleveland, Ohio 44135
OTH21E EVA N78-17-38r(NASA-Tn73763)Y BASELINE TESTS CHANGE-OF-PACE COUPE ELECTBIC,PASSENGER VEHICLE (NASA) 63 p HC A04/ME A01 CSCL 13F
Unclas G3/85 04463
November 1977
Prepared for
DEPARTMENT OF ENERGY Division of Transportation Energy Conservation Under Interagency Agreement EC-77-A-31-1011
-This report was prepared to document work sponsored by
the United States Government. Neither the United States
nor its agent, the United States Energy Research and
Development Administration, nor any Federal employees,
nor any of their contractors, subcontractors or their
employees, makes any warranty, express or implied, oz
assumes any legal liability or responsibility for the
accuracy, completeness, or usefulnoss of any informa
tion, apparatus, product or process disclosed, or
represents that its use would not infringe privately
owned rights.
1 Report No 2 Government Accession No 3 Recipient's Catalog No
NASA TM-73763 4 Title and Subtitle 5 Report Date
BASELINE TESTS OF THE EVA CHANGE-OF-PACE COUPE November 1977 ELECTRIC PASSENGER VEHICLE 6 Performing Organization Code
7 Author(s) 8 Performing Organization Report No
John M Bozek, Edward A. Maslowski, and Miles 0. Dustin E -9469
10 Work Unit No 9 Performing Organization Name and Address
National Aeronautics and Space Administration 11 Contract or Grant No Lewis Research Center Cleveland, Ohio 44135 13 Type of Report and Period Covered
12 Sponsoring Agency Name and Address Technical Memorandum Department of Energy Division of Transportation Energy Conservation 14 Sponsoring Agency GOdeReport No. Washington, D.C. 20545 CONS/1011-8
15 Supplementary Notes
Prepared under Interagency Agreement EC-77-A-31-011.
16 Abstract
The EVA Change-of-Pace Coupe, commonly referred to as the EVA Pacer, is an electric
passenger vehicle manufactured by Electric Vehicle Associates, Inc., Valley View, Ohio. It
was tested at the Transportation Research Center Test Track near East Liberty, Ohio, between
June 9 and July 15, 1977 The tests are part of an Energy Research and Development Adminis
tration (ERDA) project to characterize the state-of-the-art of electric vehicles. The EVA
Change-of-Pace Coupe vehicle performance test results are presented in this report. The EVA
Change-of-Pace Coupe is a four-passenger American Motors Pacer that has been converted to
an electric vehicle It is powered by twenty 6-volt traction batteries through a silicon
controlled-rectifier chopper controller actuated by a foot throttle to change the voltage applied to the series-wound, direct-current motor. Braking is accomplished with a vacuum-assist
hydraulic braking system Regenerative braking is also provided.
17 Key Words (Suggested by Author(s)) 18 Distribution Statement
Electric vehicle, Car, Test and evaluation; Unclassified - unlimited
Battery STAR Category 85
DOE Category UC-96
19 Security Classif (of this report) 20 Securty nlassif (of this page) 21 No of Pages 22 Price
Unclassified Unclassified
For sale by the National Technical Information Service Springfield Virginia 221G1
The Electric and Hybrid Vehicle Program
was conducted under the guidance of the
then Energy Research and Development
Administration (ERDA), now part of the
Department of Energy.
BASELINE TESTS OF THE EVA CHANGE-OF-PACE COUPE
ELECTRIC PASSENGER VEHICLE
John M. Bozek, Edward A. Maslowski, and Miles 0. Dustin
Lewis Research Center
SUMMARY
The EVA Change-of-Pace Coupe, commonly referred to asthe EVA Pacer, is an electric passenger vehicle manufacturedby Electric Vehicle Associates, Inc., Valley View, Ohio. Itwas tested at the Transportation Research Center Test Tracknear East Liberty, Ohio, between June 9 and July 15, 1977.The tests are part of an Energy Research and DevelopmentAdministration (ERDA) project to characterize thestate-of-the-art of electric vehicles. The EVAChange-of-Pace coupe vehicle performance test results arepresented in this report.
The EVA Change-of-Pace Coupe is a four-passengerAmerican Motors Pacer that has been converted to an electricvehicle. It is powered by twenty 6-volt traction batteriesthrough a silicon-controlled-rectifier chopper controlleractuated by a foot throttle to change the voltage applied tothe series-wound, direct-current motor. Braking isaccomplished with a vacuum-assist hydraulic braking system.Regenerative braking is also provided.
All tests were run at the gross vehicle weight of 2086kilograms (4600 lbm). The results of the tests are asfollows:
Test speed or Type of testdriving schedule
Range Road Road energy Energy consumptionkm/h mph- power,
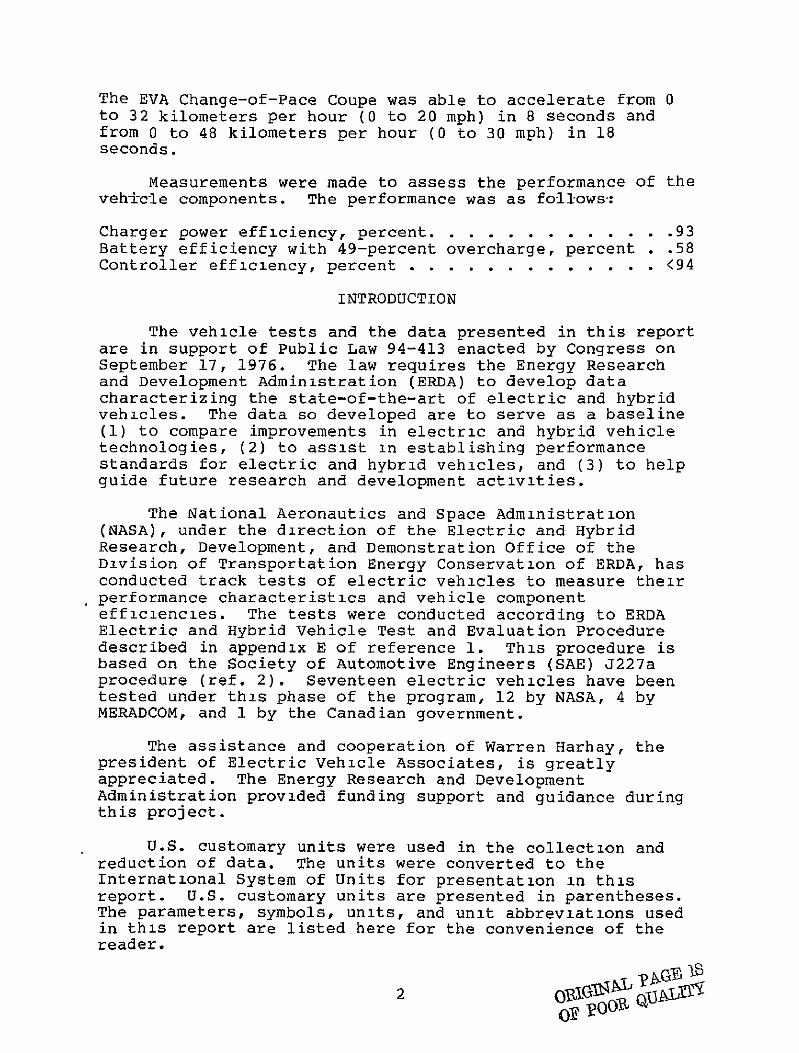
The EVA Change-of-Pace Coupe was able to accelerate from 0to 32 kilometers per hour (0 to 20 mph) in 8 seconds andfrom 0 to 48 kilometers per hour (0 to 30 mph) in 18seconds.
Measurements were made to assess the performance of theveh-icle components. The performance was as follows-:
Charger power efficiency, percent........... Battery efficiency with 49-percent overcharge, percent Controller efficiency, percent .............
.. 93
. .58 <94
INTRODUCTION
The vehicle tests and the data presented in this reportare in support of Public Law 94-413 enacted by Congress onSeptember 17, 1976. The law requires the Energy Researchand Development Administration (ERDA) to develop datacharacterizing the state-of-the-art of electric and hybridvehicles. The data so developed are to serve as a baseline(1) to compare improvements in electric and hybrid vehicletechnologies, (2) to assist in establishing performancestandards for electric and hybrid vehicles, and (3) to helpguide future research and development activities.
The National Aeronautics and Space Administration(NASA), under the direction of the Electric and HybridResearch, Development, and Demonstration Office of theDivision of Transportation Energy Conservation of ERDA, hasconducted track tests of electric vehicles to measure theirperformance characteristics and vehicle componentefficiencies. The tests were conducted according to ERDAElectric and Hybrid Vehicle Test and Evaluation Proceduredescribed in appendix E of reference 1. This procedure isbased on the Society of Automotive Engineers (SAE) J227aprocedure (ref. 2). Seventeen electric vehicles have beentested under this phase of the program, 12 by NASA, 4 by MERADCOM, and 1 by the Canadian government.
The assistance and cooperation of Warren Harhay, thepresident of Electric Vehicle Associates, is greatlyappreciated. The Energy Research and DevelopmentAdministration provided funding support and guidance duringthis project.
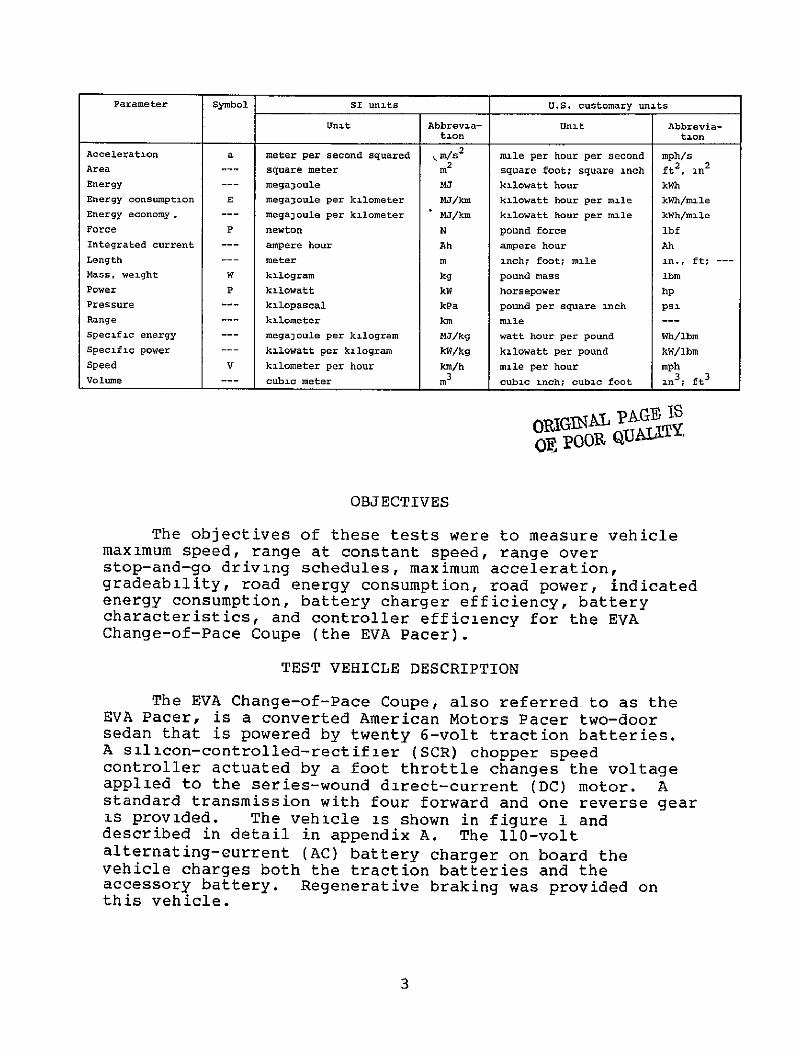
U.S. customary units were used in the collection andreduction of data. The units were converted to theInternational System of Units for presentation in thisreport. U.S. customary units are presented in parentheses.The parameters, symbols, units, and unit abbreviations usedin this report are listed here for the convenience of thereader.
PIIS 2 oS1IG JALI0Y?)T
Parameter Symbol SI units U.S. customary units
Unit Abbrevaa- Unit Abbreviation tion
Acceleration Area
a --
meter per second squared square meter
Km/s I2
2 mile per hour per second square foot: square inch
mph/s ft
2 , in
2
Energy -- mega3oule mJ kilowatt hour kwh
Energy consumption E mega3oule per kilometer NJ/kin kilowatt hour per mile kWh/mle Energy economy, -- megajoule per kilometer MJ/km kilowatt hour per mile kwh/mile
Force P newton N pound force lbf
Integrated current -- ampere hour Ah ampere hour Ah
Length -- meter m inch; foot; mile An., ft; ---
Mass, weight W kilogram kg pound mass Ibm
Power P kilowatt kW horsepower hp
Pressure -- kilopascal kPa pound per square inch psi
Range -- kilometer km mile ---
Specific energy -- megaoule per kilogram MJ/kg watt hour per pound Wh/lbm Specific power -- kilowatt per kilogram kW/kg kilowatt per pound kW/ibm
Speed
Volume
V
--
kilometer per hour
cubic meter
km/h
m 3
mile per hour
cubic inch; cubic foot
mph
in3; ft3
poop QUALITYrORIGINAL PAGE IS
OBJECTIVES
The objectives of these tests were to measure vehiclemaximum speed, range at constant speed, range overstop-and-go driving schedules, maximum acceleration,gradeability, road energy consumption, road power, indicatedenergy consumption, battery charger efficiency, batterycharacteristics, and controller efficiency for the EVAChange-of-Pace Coupe (the EVA Pacer).
TEST VEHICLE DESCRIPTION
The EVA Change-of-Pace Coupe, also referred to as theEVA Pacer, is a converted American Motors Pacer two-doorsedan that is powered by twenty 6-volt traction batteries.A sillcon-controlled-rectifier (SCR) chopper speedcontroller actuated by a foot throttle changes the voltageapplied to the series-wound direct-current (DC) motor. Astandard transmission with four forward and one reverse gearis provided. The vehicle is shown in figure 1 anddescribed in detail in appendix A. The 110-voltalternating-current (AC) battery charger on board thevehicle charges both the traction batteries and theaccessory battery. Regenerative braking was provided onthis vehicle.
3
INSTRUMENTATION
The EVA Change-of-Pace Coupe was instrumented tomeasure and record vehicle speed and distance traveled,battery current and voltage, motor current and voltage,energ-y into the charger, battery capacity removed during thetest, and battery capacity restored during charging. (Aschematic diagram of the electric propulsion system ith theinstrumentation sensors is shown in fig. 2.) A NucleusCorporation Model NC-7 precision speedometer (fifth wheel)was used to measure vehicle velocity and distance traveled.Auxiliary equipment used with the fifth wheel included aModel ERP-X1 electronic pulser for distance measurement, aModel NC-PTE pulse totalizer, a Model ESS/E expanded-scalespeedometer, a Model NC-RSD digital speedometer, and aprogrammable digital attenuator. Vehicle speed and distancewere recorded on an on-board Honeywell 195 Electroniktwo-channel, strip-chart recorder. The fifth wheel systemand the recording system were calibrated periodically. Anelectronic pulse generator was used to simulate the rotationof the fifth wheel. Comparing the simulated speed anddistance to that indicated by the expanded-scalespeedometer, digital speedometer, pulse totalizer, andstrip-chart recorder showed an error of less than +1.6kilometers per hour (+l mph) in speed and less than +1percent in distance.
The integrated battery current was measured for thebattery pack with a current shunt and an on-board current integrator. It was recorded manually after each test. Thecurrent integrator is a Curtis Model SHR-C3 currentintegrator and was calibrated periodically to within +1percent of reading.
Battery and motor current and voltage were recorded ontwo on-board Honeywell 195 Electronik two-channel,strip-chart recorders. The currents were measured with500-ampere shunts, and the voltages were measured withappropriate voltage-sensing leads (fig. 2). In addition,battery electrolyte temperatures and specific gravities weremeasured manually before and after the tests.
The battery current and voltage during charge and theenergy into the battery charger were measured. The batterycurrent and voltage were recorded on a Honeywell 195Electronik two-channel, strip-chart recorder (fig. 2). Theenergy delivered to the charger was measured with a GeneralElectric 1-50A single-phase residential kilowatt-hour meter(fig. 2).
4
In tests designed to measure the charger powerefficiency, a laboratory-type wattmeter with Hall-effectcurrent sensors was used. The wattmeter was manufactured byOhio Semitronics, Inc.
Power for the fifth-wheel system was provided from a12-volt starting, lighting, and ignition (SLI)instrumentation battery. A Tripp Lite 500-watt DC/ACinverter, also powered from the SLI battery, provided the ACpower to the current integrator and to all on-boardstrip-chart recorders.
All instruments were calibrated periodically. Theintegrators and strip-chart recorders were calibrated with a Hewlett-Packard Model 6920 B meter calibrator, which has anaccuracy of 0.2 percent of reading and a usable range ofbetween 0.01 and 1000 volts.
TEST PROCEDURES
The tests described in this report were performed atthe Transportation Research Center Test Track, a12-kilometer (7.5-mile) multilane test track located in EastLiberty, Ohio. A complete description of the track is givenin appendix B. When the vehicle was delivered to the testtrack, the pretest checks described in appendix C wereconducted. The first test was a formal shakedown tofamiliarize the driver with the operating characteristics ofthe vehicle, to check out all instrumentation systems, andto determine the vehicle's maximum speed (appendix C). Alltests were run in accordance with ERDA Electric and HybridVehicle Test And Evaluation Procedure ERDA-EHV-TEP(appendix E of ref. 1) at the gross weight of the vehicle,2086 kilograms (4600 ibm).
Range Tests at Constant Speed
The vehicle speed for the highest constant-speed rangetest was determined during checkout tests of the vehicle.It was specified as 95 percent of the minimum speed thevehicle could maintain on the test track when it wastraveling at full power. This speed was 82 kilometers perhour (51 mph) for the EVA Change-of-Pace Coupe.
Range tests were run at constant speeds of 40, 56, 72,and 82 kilometers per hour (25, 35, 45, and 51 mph). Thespeed was held constant within +1.6 kilometers per hour (1mph), and the test was terminatid when the vehicle could nolonger maintain 95 percent of the test speed.
5
Range Tests under Driving Schedules
Schedule B and C stop-and-go driving cycles, shown infigure 3, were run with and without the regenerative brakingsystem operative. A complete description of cycle tests isgiven in appendix E of reference 1. A special instrument,called a cycle timer, was developed at the Lewis ResearchCenter to assist in accurately running these tests. DetailSof the cycle timer are given in appendix C. The cycle testswere terminated when the cruise speed could not be attainedin the time required under maximum acceleration.
Acceleration and Coast-Down Tests
The maximum acceleration of the vehicle was measured ona level road with the battery fully charged and 40 and 80percent discharged. Four runs were made at each of thebattery states of charge, two on each side of the oval testtrack, in order to average out track abnormalities. Depthof discharge was determined from the number of ampere-hoursremoved from the batteries. Coast-down data were takenafter the acceleration test with the transmission in neutraland with fully charged batteries in order to start thecoast-down run from the maximum attainable vehicle speed.
Braking, Tractive Force, and Handling Tests
The braking and tractive force tests described inappendix E of reference 1 were not performed. The period oftime the vehicle was available for testing was limited, anda higher priority was placed on determining the range of thevehicle and the acceleration and coast-down characteristics.The handling tests were omitted at the request of ERDA.
Charger Efficiency Tests
Charger efficiency was measured with a 50-kilowattpower meter and a Hall-effect current probe. To minimizeerrors, the same meter and current probes were used for boththe input measurement and the output measurement. Theaverage power measured was about 4 percent of full scale.The batteries were removed from the vehicle and reconnectedin series with pressure clamps. The ratio of input andoutput charger power was determined at only one point in thecharging phase. As a result, only the power efficiency was determined.
TEST RESULTS ORIGMAt PaX
Range
The data -collected from all the range tests aresummarized in table I. Shown in the table are the test
6
date, the type of test, the environmental conditions, therange attained, the number of cycles completed, the capacityinto and out of the battery, the energy into the charger,and the calculated indicated energy consumption.
The maximum speed of the vehicle was measured during the checkout tests. Maximum speed is defined as the averagespeed that could be maintained on the track underfullpower. The measured maximum speed was 90 kilometers perhour (56 mph) for this vehicle. This differs from themaximum speed used in the range tests.
Nineteen range tests were performed with the EVAChange-of-Pace Coupe. Five of these tests were invalid oraborted due to various vehicle failures. These data are notreported. These five failures included three speedcontroller failures, a fractured clutch linkage, and shortedmotor leads. One range test was performed withhigh-pressure truck tires in place of the standard tires onthe vehicle. No significant difference was observed betweenthe results of this test and the results from similar testswith standard tires.
The results of the 14 useful range tests are shown intable I. The measured vehicle range varied from an averageof 84.6 kilometers (52.6 miles) at 40 kilometers per hour(25 mph) to 50.5 kilometers (31.4 miles) at 82.1 kilometersper hour (51 mph). Regenerative braking effects weredetermined for the schedule B and C tests. The averageranges measured under schedule C were 45.9 kilometers (28.5miles) without regenerative braking and 47.8 kilometers(29.7 miles) with regenerative braking, for a 5-percentimprovement in range. The range extension due toregenerative braking during the schedule B tests wassomewhat larger - 47.9 kilometers (29.8 miles) withoutregenerative braking and 52.8 kilometers (32.8 miles) withregenerative braking, for a 10-percent improvement. Onlyone schedule B test in each configuration was run, so the accuracy of the schedule B regenerative braking results issomewhat in doubt.
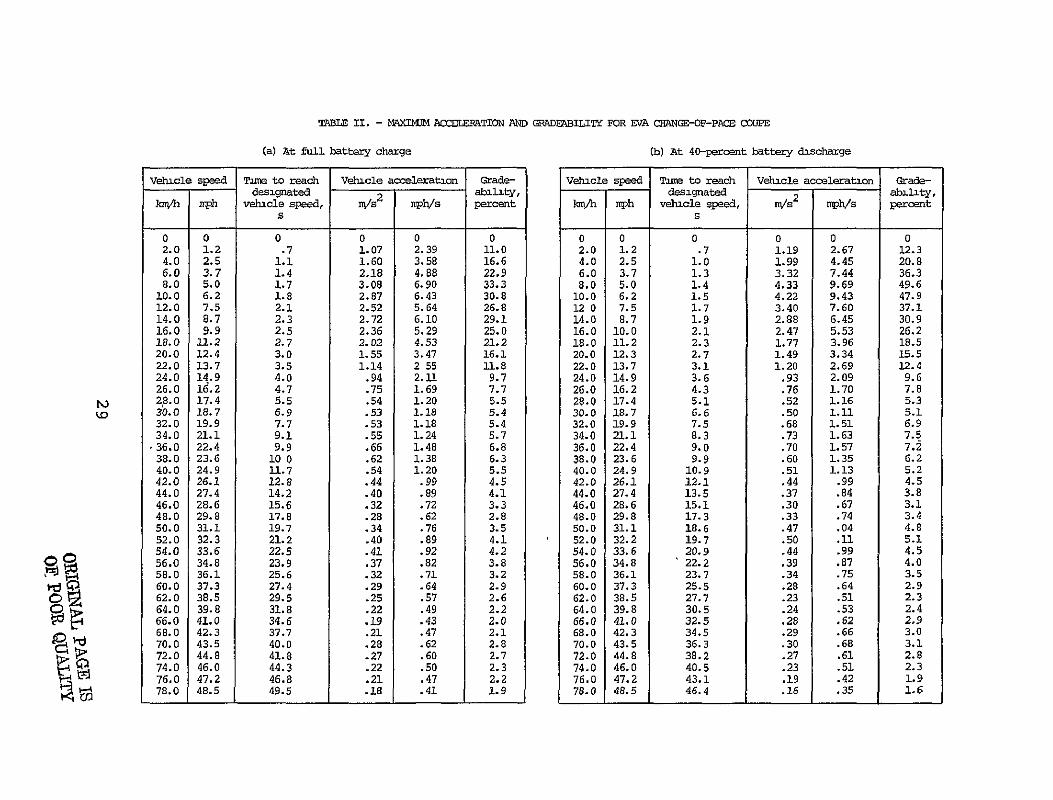
Maximum Acceleration
The maximum acceleration of the vehicle was determinedwith the batteries fully charged and 40 and 80 percentdischarged. The vehicle speed and acceleration at the threestates of battery charge are presented in figures 4 and 5and tabulated in table II. The average acceleration awas calculated for the time period tn- 1 to tn, whererthevehicle speed increased from Vn_1 to Vn, from theequation
7
-- n - Vn- 1Va-=n-in -=n t n t 1
and the average speed of the vehicle V from the equation
V + Vn-i 2
Gradeability
The maximum specific grade, in percent, that a vehicle can climb at an average vehicle speed V was determinedfrom maximum acceleration tests by using the equations
= 100 tan (sin 0.1026 a ) for V in km/h
in SI units
or ORIGINAL PAGE IS
= 100 tan (sin 0.0455 -an) for V in mph OF POOR QUALITY
in U.S. customary units
where an as average acceleration in meters per secondsquared (mph/sec). The maximum grades the EVA Change-of-Pace Coupe can negotiate as a function of speed and batterystate of charge are shown in figure 6 and table Il. At aspeed of 20 kilometers per hour (12.4 mph), the gradeabilityvaried from 16.1 percent for a fully charged battery to 12.6percent for an 80-percent-discharged battery. Thegradeability is less than 5 percent at speeds greater than42 kilometers per hour (26.1 mph) at all states of charge.
Road Energy Consumption
Road energy is a measure of the energy consumed perunit distance in overcoming the vehicle's aerodynamic androlling resistance plus the energy consumed in thedifferential drive shaft and the portion of the transmissionrotating when in neutral. It was obtained during coast-down
8
V
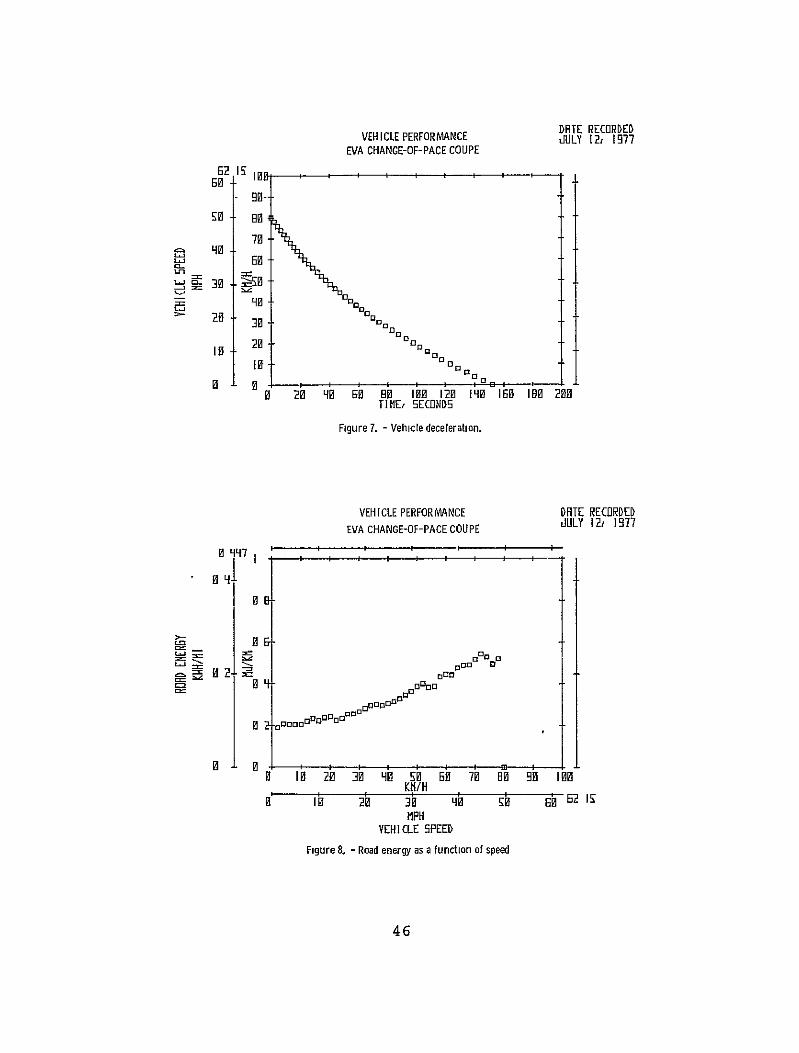
tests, when the differential was being driven by the wheels,and thus may be different than the energy consumed when thedifferential is being driven by the motor. Figure 7 andtable III show the vehicle speed as a function of timeduring the coast-down period. The vehicle coasted down froma speed of 80 kilometers per hour (49.7 mph) in 145.7seconds.
Road energy consumption En was calculated from thefollowing equations:
E =2.78x1O-4W V n-1 - n, MJ/kmn tn - tn_ 1
or
E 9.07xl0-5W V n-1 - n, kWh/milen tn n-1
where
W vehicle mass, kg (ibm)
vehicle speed, km/h (mph)
t time, s
The results of the road energy calculations are shown infigure 8 and table III. At 2.0 kilometers per hour (1.2mph) the road energy was 0.188 megajoule per kilometer(0.084 kWh/mile). At 78 kilometers per hour (48.5 mph) theroad energy was 0.519 megajoule per kilometer (0.232kWh/mile).
Road Power Requirements
The calculation of road poWer is analogous to that ofroad energy. Road power is a measure of the power necessaryto overcome vehicle aerodynamic and rolling resistance plusthe power losses in the differential, the drive shaft, and aportion of the transmission. The road power Pn requiredto propel a vehicle at various speeds is also determinedfrom the coast-down tests. The following equations wereused:
V2 _ 2
Pn= 3.86x10- 5W tn - tn ,kW
9
or
V2 _ 2P .0xl - w n-1 n' hp Pn 6.08x10-W tn t n,
The results of road power calculations are shown in figure 9 and table III. At 2.0 kilometers per hour (1.2 mph) the road power was 0.105 kilowatt (0.14 hp). At 78.0 kilometers per hour (48.5 mph) the road power was 11.26 kilowatts (15.095 hp).
Indicated Energy Consumption
The vehicle indicated energy consumption is defined asthe energy required to recharge the battery after a test,divided by the vehicle range achieved during the test, wherethe energy is the input to the battery charger.
During the testing of the EVA Change-of-Pace Coupe,three different chargers were used: a 110-volt AC full-waverectifier originally supplied with the vehicle; a 110-voltAC NASA-supplied charger used after the original chargerfailed; and a 208-volt AC, single-phase charger supplied bythe vehicle manufacturer for the last few range tests. Thetype of charger used after each test is shown in table I.
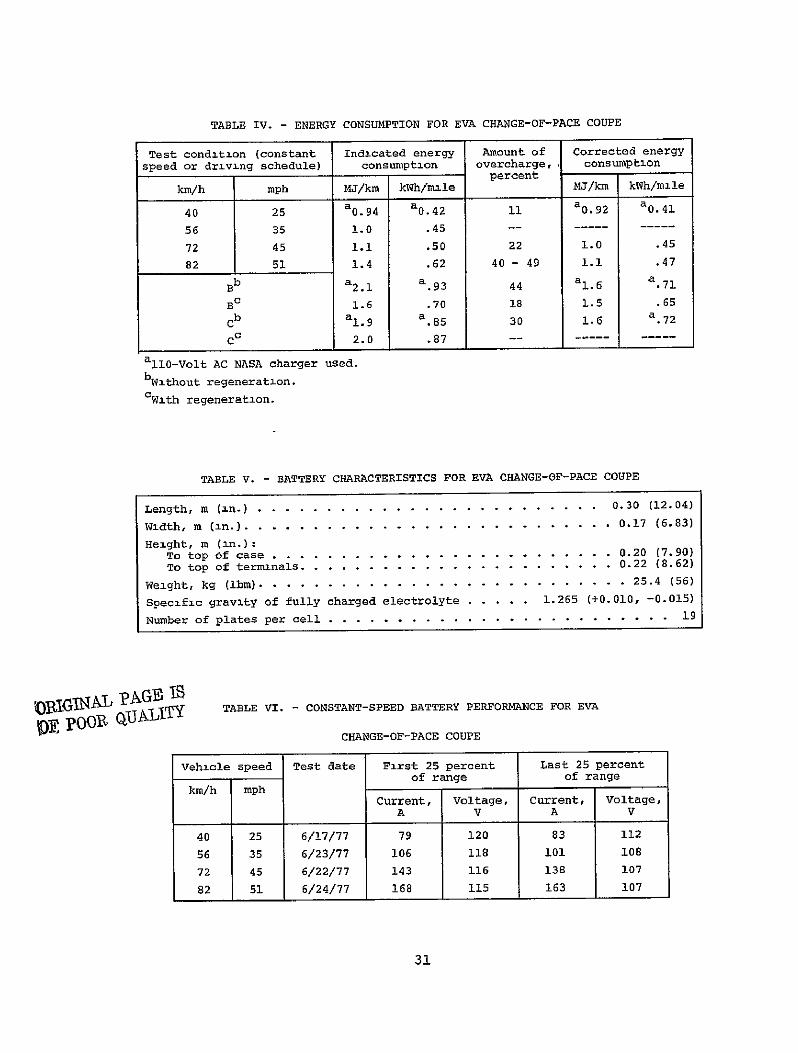
The indicated energy consumptions reported herein arefor the two ll0-volt AC chargers only. The energy input tothe 208-volt AC, single-phase charger was not measured. Theaverage indicated energy consumptions for the constant-speedand cycle tests are shown in table IV.
During the testing program the battery was overchargedto assure a fully charged and equalized battery. In manycases the overcharge exceeded 10 percent, which would bedesirable in actual field use conditions. Correcting thecharger input energy to a 10-percent overcharge reduces theenergy consumption. The actual total charge energy and thecorrected energy consumption for an overcharge of 10 percentare shown in table IV for the constant-speed and cycletests.
COMPONENT PERFORMANCE AND EFFICIENCY
Battery Charger
Three different traction battery chargers were used:the original 110-volt AC, full-wave rectifier; a 110-volt ACNASA charger; and a 208-volt AC single-phase charger.
10 ORIGINAL PAGE IS OF POOR QUALITY
The original 110-volt AC charger was unable to charge,the traction battery in the 18 hours between tests. Thecharger was to be replaced because of this deficiency butfailed before a replacement arrived. Since this charger wasa simple bridge rectifier, it was very sensitive to inputvoltage. An increase in input voltage would increase thecurrent delivered to the battery to a point where thecharger components were operating beyond design points. Adecrease in input voltage would reduce the current deliveredto the battery to a point where the charge could not becompleted overnight. This sensitivity necessitated constantattention to the filter chokes used in series with thecharger. When the battery current exceeded 20 amperes, itwas assumed that the input charger voltage exceeded thenominal value of 110-volt AC. The number of chokes inseries with the charger had to be increased to reduce thebattery current. When charging times were in excess of16 hours and/or battery current levels were less than 15amperes, the number of series chokes was decreased, therebyincreasing the battery current. These chokes wereadjustable from 0 to 2.4 millihenries in 0.6-millhenrysteps.
The original 110-volt AC charger failed and aNASA-supplied, 110-volt AC charger was used until a newcharger could be obtained from the vehicle manufacturer.The auxiliary NASA charger was a 110-volt AC, full-wavebridge using a variable resistor for control. The newcharger supplied by the vehicle manufacturer was an upgradedversion of the original charger but required a three-wire208-volt AC, single-phase input voltage. This charger wasmuch more stable and performed well during the latter phasesof testing. The new charger was designed to terminatecharge when the battery voltage reached 150 volts.
The efficiency of the 208-volt AC charger wasdetermined from data gathered during a charging sequencewith the battery removed from the vehicle. The 50-kilowattpower meter used on the AC and DC sides of the chargerindicated a power efficiency of 93 percent at 20 amperes DC.
Battery
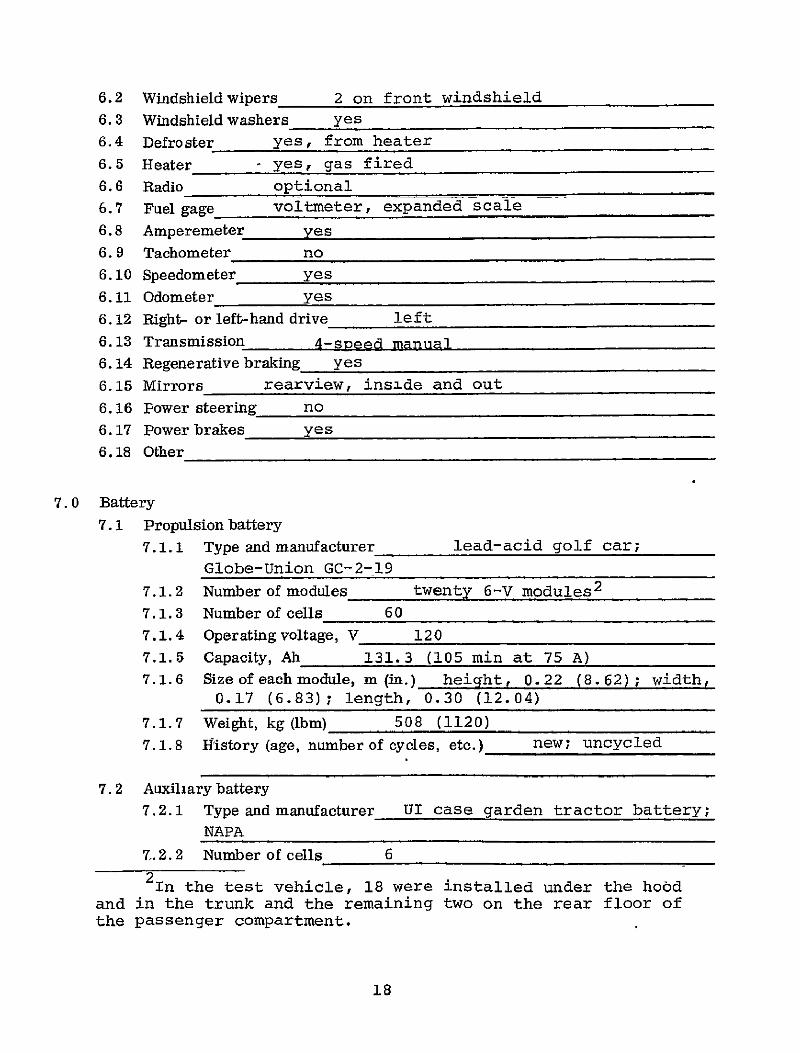
Manufacturer's data. - The battery supplied with theEVA Change-of-Pace Coupe consisted of 20 Globe-Union GC-2-19golf car battery modules. The manufacturer delivered thevehicle to NASA for testing with 18 of the batteries underthe hood and in the trunk. The remaining two batteries werelocated on the floor in front of the rear seat, reducing theseating capacity to three. The GC-2-19 is a 6-volt,three-cell module that provides an average of
11
131 ampere-hours when discharged in 105 minutes at a current of 75 amperes to a voltage cutoff of 1.75 volts per cell.Battery characteristics as supplied by the manufacturer areshown in table V, and battery discharge data are presentedin figures 10 and 11. Discharge current as a function ofdischarge time is shown in figure 10. The capacity of thebattery varies with discharge current. The battery iscapable of delivering 205 ampere-hours at 10 amperes, or 131ampere-hours at 75 amperes.
Battery specific power as a function of the specificenergy available for a three-cell module is shown in figure11. At a low specific power of 2 watts per kilogram (0.9W/lbm) the available energy is 0.15 megajoule per kilogram(41.7 Wh/kg). At a higher specific power of 20 watts perkilogram (9 W/lbm), the available energy decreases to 0.08megajoule per kilogram (22.2 Wh/kg). At the manufacturer'srated discharge rate of 75 amperes, which is equivalent to14.8 watts per kilogram the available specific energy is0.093 megajoule per kilogram (25.8 Wh/kg).
Battery acceptance. - Prior to track testing, thebattery supplied by the vehicle manufacturer was checked forcapacity and terminal integrity as specified in appendix Eof reference 1.
The 300-ampere terminal qualification test was run witha constant-current electronic load bank. The batteryvoltage decreased from 107 volts to 105 volts (1.75 VPC)when it was discharged at a rate of 300 amperes (fig. 12).After a 5-minute discharge at the 300-ampere rate, theterminal temperature as measured by thermocouples rangedfrom 520 to 820 C (1250 to 1800 F). As this was less than60 degrees Celsius above ambient, the battery system waswithin specifications.
The capacity check was performed using the same loadbank. The capacity check was run twice, once immediatelyafter the 300-ampere terminal test without a recharge andonce after a subsequent recharge. In both tests the batterywas discharged at 75 amperes until the battery voltagereached 105 volts (1.75 VPC). The results of both tests areshown in figure 12. In the first capacity test (whichincluded the 300-ampere test) the measured capacity was127 ampere-hours. In the second test the capacity was123 ampere-hours. The average capacity of 125 ampere-hoursis 95 percent of-the manufacturer's specification, which iswithin the 80-percent criterion for passing the test.
Battery performance at constant vehicle speed. - Duringthe track tests, battery current and voltage were recorded.
12 ORIGINAL PAG IoF 1,(RQuALIf,
The battery current and voltage for four constant-speedtests are shown in figures 13 and 14 and table VI. Averagedata are presented for the first 25 percent and the last 25percent of the range at their respective speeds.
Battery current and voltage tended to decrease towardthe end of the test, suggesting that the power required topropel the vehicle at a constant speed decreases as the testproceeds. This effect has also been reported inreference 1. It is probably due to a reduction in road loadas the mechanical components, lubricants, and tires heat up.
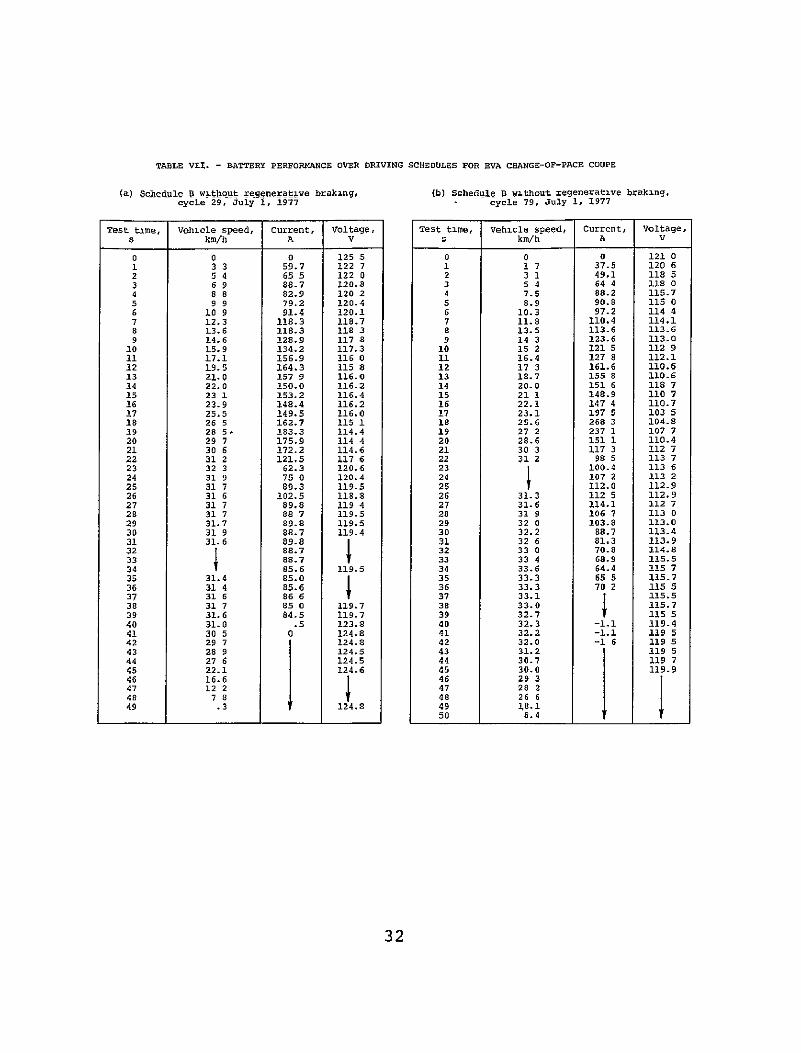
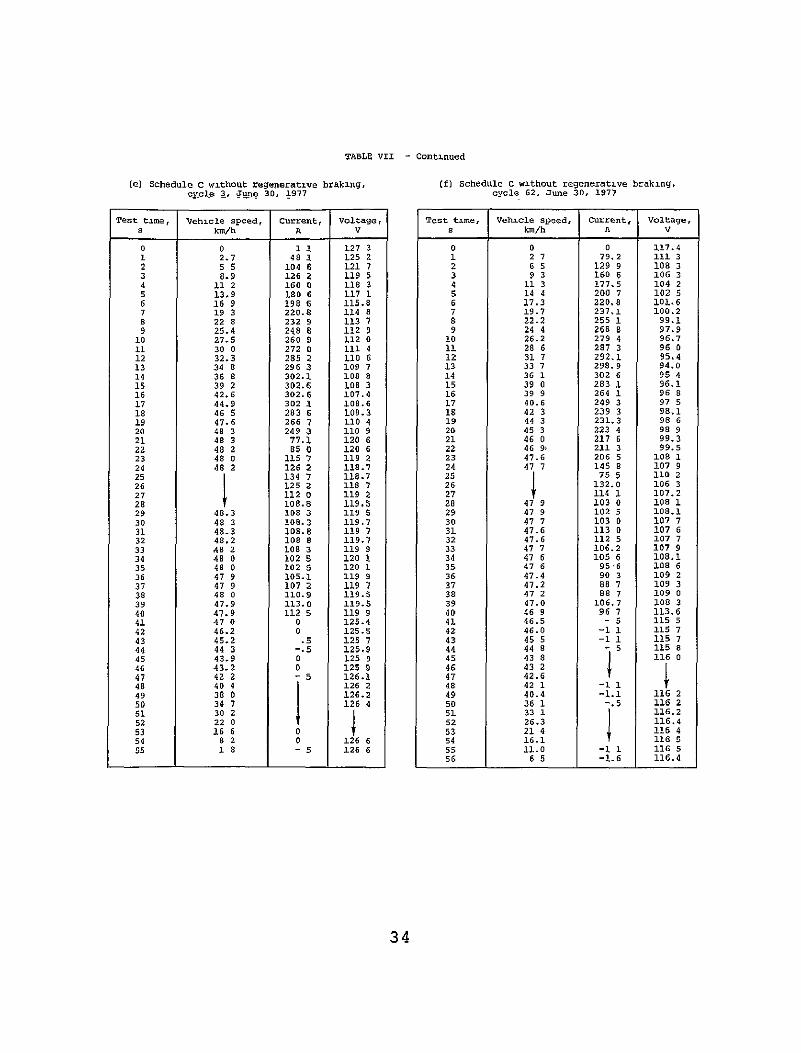
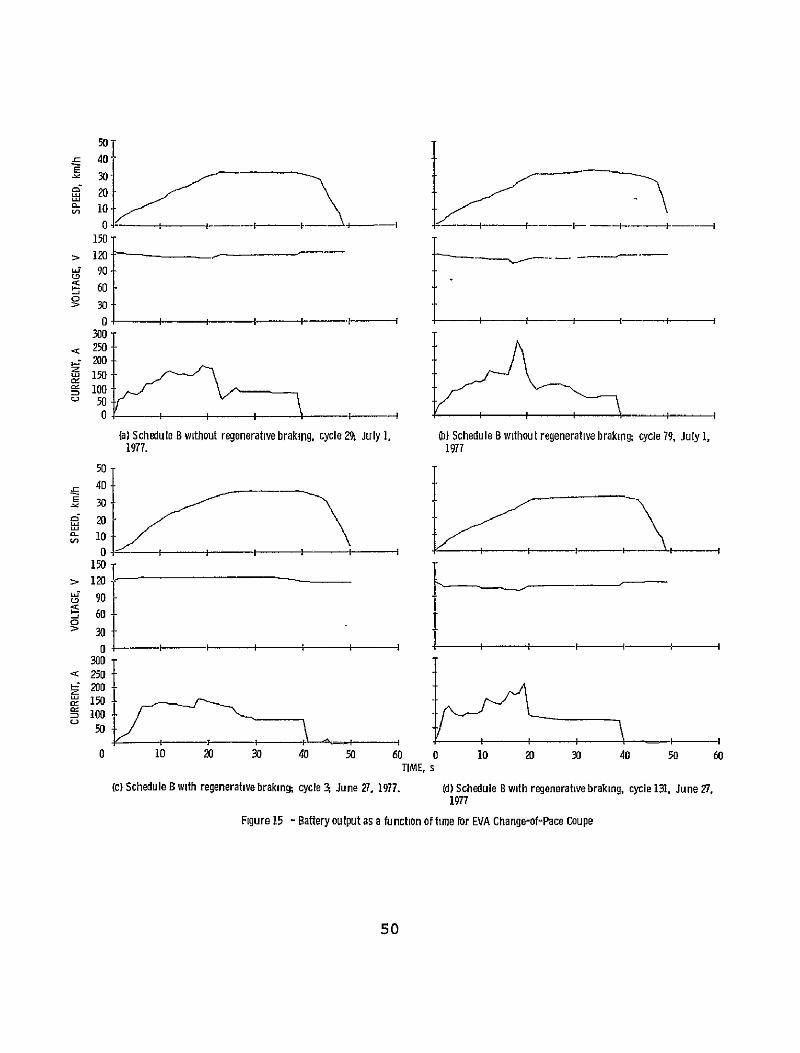
Battery performance over a driving schedule. - Duringthe two stop-and-go schedule tests (schedules B and C withand without regenerative braking), battery voltage andcurrent were recorded. These battery data are presented infigure 15 and table VII. Regenerative braking should returncurrent to the battery when the brakes are applied at about42 seconds from the start of driving schedules B and C, 46 seconds for schedule C (fig. 3). A negative current pulseresults when regenerative braking is operative. The currentreturned to the battery is small. only 0.03 ampere-hour wasreturned to the battery during a typical cycle (fig. 15(h));the battery was discharged 1.7 ampere-hours during the sametest. During the schedule B tests, even less capacity wasreturned to the battery.
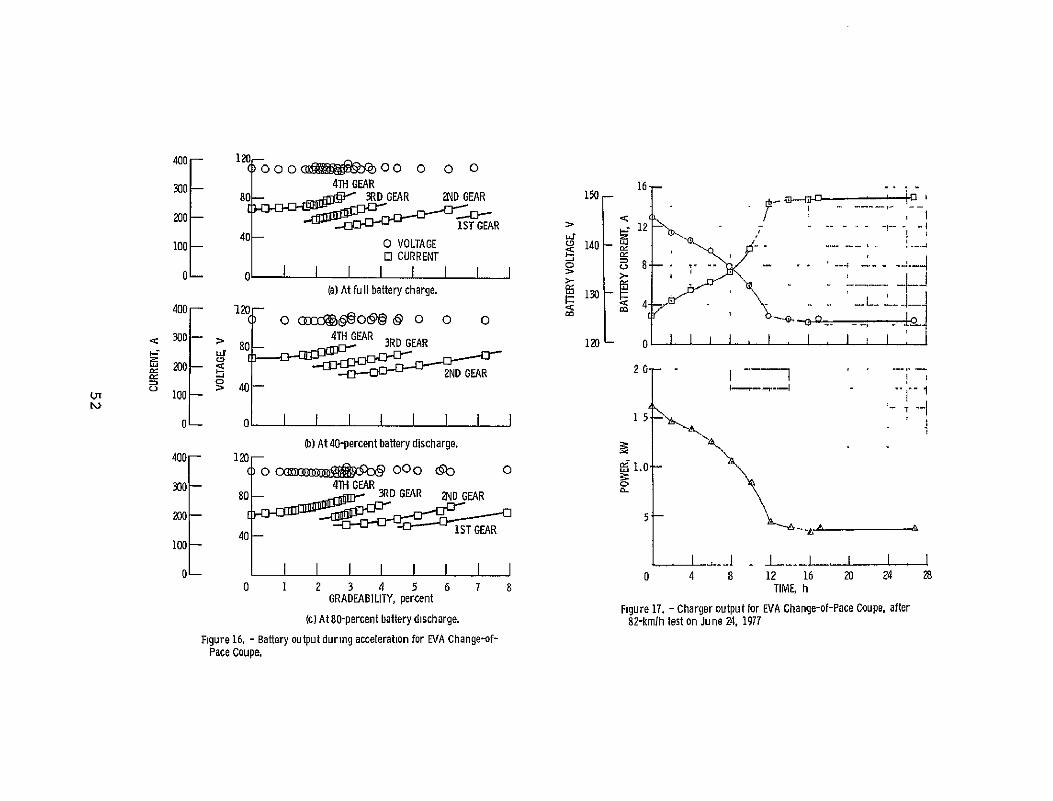
Battery performance during maximum acceleration tests.- Battery current and voltage as a function of gradeabilityand depth of discharge are shown in figure 16 and tableVIII. The calculation procedure used to obtain gradeabilityfrom maximum acceleration test data is discussed undergradeability. The transmission gear (first, second, third,or fourth) that the vehicle was being driven in when datawere recorded is also shown in figure 16. The peak currentdrains occurred while shifting into a higher gear andreached 277 amperes at a battery voltage of 108.7 volts witha fully charged battery.
General battery performance. - Battery data forrepresentative tests are shown in table IX. The batteryelectrolyte specific gravities ranged from 1.273 to 1.280for the fully charged battery and from 1.110 to 1.149 forthe fully discharged battery. The ampere-hour overchargevaried from 11 percent to 51 percent.
'The battery temperature increased more during thedriving schedule tests than during the constant-speed tests.During the constant-speed tests, battery temperaturesincreased an average of 3 degrees Celsius, during thedriving schedule tests they increased 17 degrees Celsius.
13
Charging and battery efficiency. - Battery energyefficiency is calculated from measurements of charger inputand battery output. Since the EVA Change-of-Pace Coupeemploys an SCR chopper speed controller and only averagebattery and current were recorded, simple multiplication ofbattery current and voltage to obtain power is inaccurate.This inaccuracy may be minimized if battery efficiency iscalculated for tests where the chopper control is full on ornearly full on throughout the test. This situation occurredduring the constant-high-speed test.
The charge sequence and the test results for the82-kilometer-per-hour (51-mph) test on 6/24/77 were analyzedto determine battery energy efficiency. The chargingbattery current, voltage, and power for this test are shownin figure 17. The total energy restored to the battery was72 megajoules (20 kWh). The energy removed from the batteryduring this speed test was 42 megajoules (11.6 kWh). Thus,the calculated battery energy efficiency is 58 percent. Thebattery overcharge during this test was 49 percent (tableIX). Correcting this excess overcharge to 10 percentincreases the battery energy efficiency to 79 percent.
Controller
The controller for the EVA Change-of-Pace Coupe is acommercially available SCR Cableform chopper. Anoff-the-shelf controller was modified by Cableform, enablingthe controller to initiate and maintain regenerativebraking. Figure 18 is a schematic of the electrical driveand the controller showing the operation in the normal andregenerative modes.
During normal operation the speed controller, actuatedby the foot pedal, varies the power to the motor. Alsoduring normal operation, contactors Cl, C2, and C5 areclosed and C3 and C4 are open. Current then flows from thebattery into the motor. During the regenerative mode, whichis actuated by the brake pedal, contactors Cl, C2, and C5are opened and C3 and C4 are closed. Current then flowsfrom the motor armature into the batteries.
The power efficiency of the controller can bedetermined from battery and motor data recorded during themaximum acceleration tests. During these tests, the speedcontroller is full on, so average current and voltage can bemultiplied to determine average power. This technique wasapplied to a random sample of battery and motor current andvoltage given in tables VIII and X. The resultant ratio of battery and motor power gives an average controller powereffiency of 94 percent. The power efficiency of the speed
14
controller will decrease when it is operating in other than
the full-on condition.
Motor
The motor used in the EVA Change-of-Pace Coupe is a DC series-wound motor specifically manufactured for EVA. Theavailable data for the motor are included in appendix A.Motor input current and voltage data for maximumacceleration tests are shown in figure 19 and table X. Thecurrent and voltage are presented as a function ofgradeability, similar to the battery data discussed earlier.The transmission gear the vehicle was driven in during thetest is also shown for reference in figure 19. At the shiftpoints the peak motor current was 272.4 amperes and motorvoltage was 95.3 volts during the 80 percent batterydischarge tests.
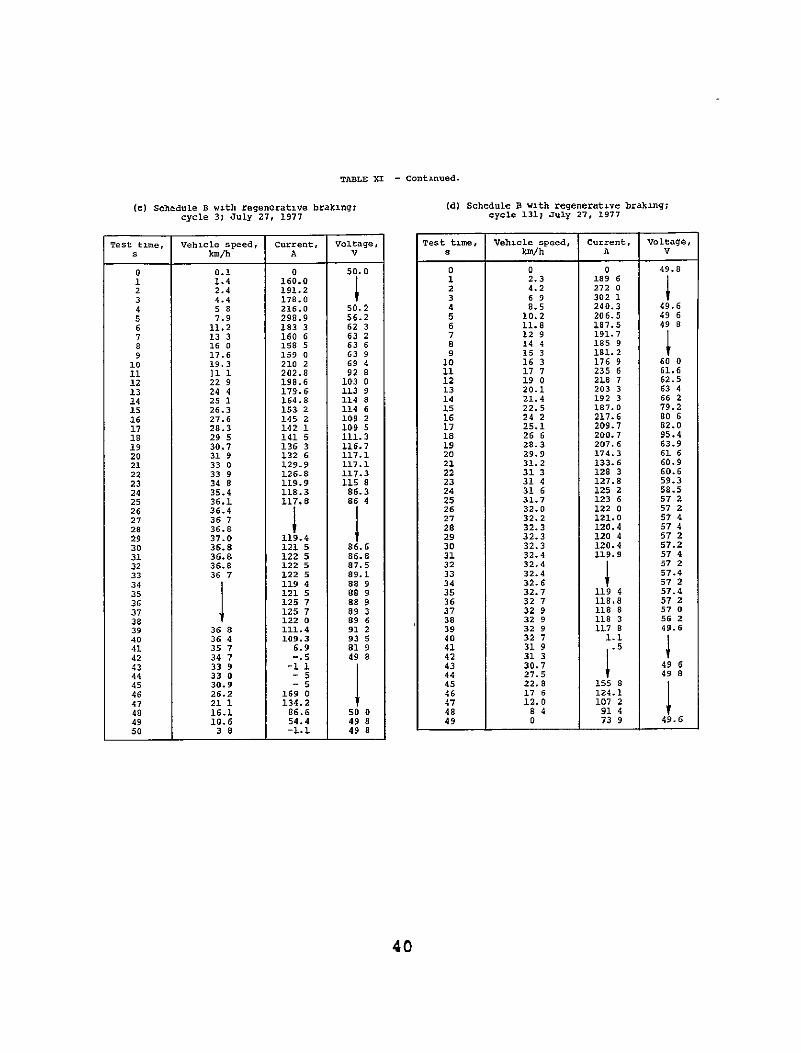
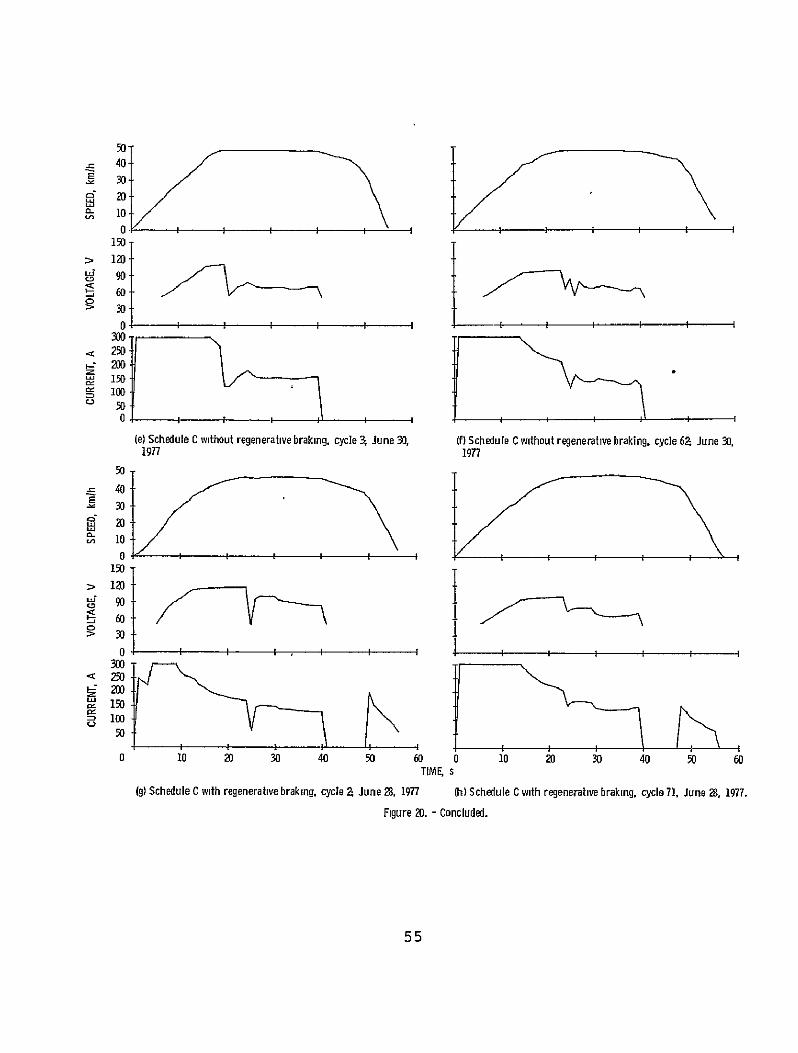
The input parameters to the motor during the various cycletests are shown in figure 20 and table XI. Regeneration occursduring the braking phase of the test and in some cases reaches250 to 300 amperes for a short period of time.
The efficiency of the motor could not be determined because
torque/speed characteristics were not available for the motor.
VEHICLE RELIABILITY
The initial tests demonstrated a need for a motor ad3ustment. Due to a misalignment of the motor brushes, acomponent in the SCR speed controller failed. After the motorbrushes were rotated to a more optimum position and the failedcomponent in the speed controller was replaced, it was found thatthe vehicle's maximum speed was reduced from 87 kilometers perhour (54 mph) to 82 kilometers per hour (51 mph). As a result,all range tests completed prior to this repair were notrepresentative of the vehicle performance and are not included inthis report.
Testing was resumed after the adjustments and repairsdescribed above had been made. Two subsystem failures resulted in an aborted test: another SCR speed controller failure on7/5/77, and a fractured clutch linkage on 7/14/77. During tworange tests conducted on 7/1/77 and 7/8/77, intermittent speedcontroller outages occurred. During one charging sequence on 6/27/77 the original 110-volt AC charger failed. An auxiliaryNASA 110-volt AC charger was used until a new charger wassupplied by the vehicle manufacturer on 7/8/77.
15
DRIVER REACTION AND VEHICLE SERVICEABILITY
The vehicle was comfortable and handled well. Thetransmission coupled with the SCR speed controller system allowedeffortless and smooth gear changes.
The operation Of the charger is sensitive to line inputvoltage. Longer charge times are required if line voltage islow. The batteries were all relatively easy to service (i.e., in
respect to adding water and servicing the terminals), except forthe two 6-volt modules located temporarily in the back seat.
16
APPENDIX A
VEHICLE SUMMARY DATA SHEET
1.0 Vehicle manufacturer Electric Vehicle Associates, Inc.Valley View, Ohio
2.0 Vehicle EVA Change-of-Pace Coupe
3.0 Price and availability $10 500; immediate
4.0 Vehicle weight and load4.1 Curb weight, kg (lbm) 1810 (3990)4.2 Gross vehicle weight, kg (ibm) 2086 (4600)4.3 Cargo weight, kg (Ibm) 141 (310) with two passengers4.4 Number of passengers 144.5 Payload, kg (lbm) 277 (610)
5.0 Vehicle size
5.1 Wheelbase, m (in.) 2.54 (100)5.2 Length, m (in.) 4.3 (170.2)5.3 Width, m(in.) 1.96 (77)
5.4 Height, m (in.)5.5 Headroom, m(i.) 0.98 (38.3)
5.6 Legroom, m (in.) 1.03 (40.7)5.7 Frontal area, m 2 (ft2 )5.8 Road clearance, m (in.)5.9 Number of seats 2 front; 1 rear
6.0 Auxiliaries and options6.1 Lights (number, type, and function) 2 head; 2 park and tail;
2 brake; 2 front parking
iLimited to three on test vehicle because two batteries wereinstalled on floor of rear passenger compartment.
O17
6.2 Windshield wipers 2 on front windshield
6.3 Windshield washers yes6.4 Defroster yes, from heater
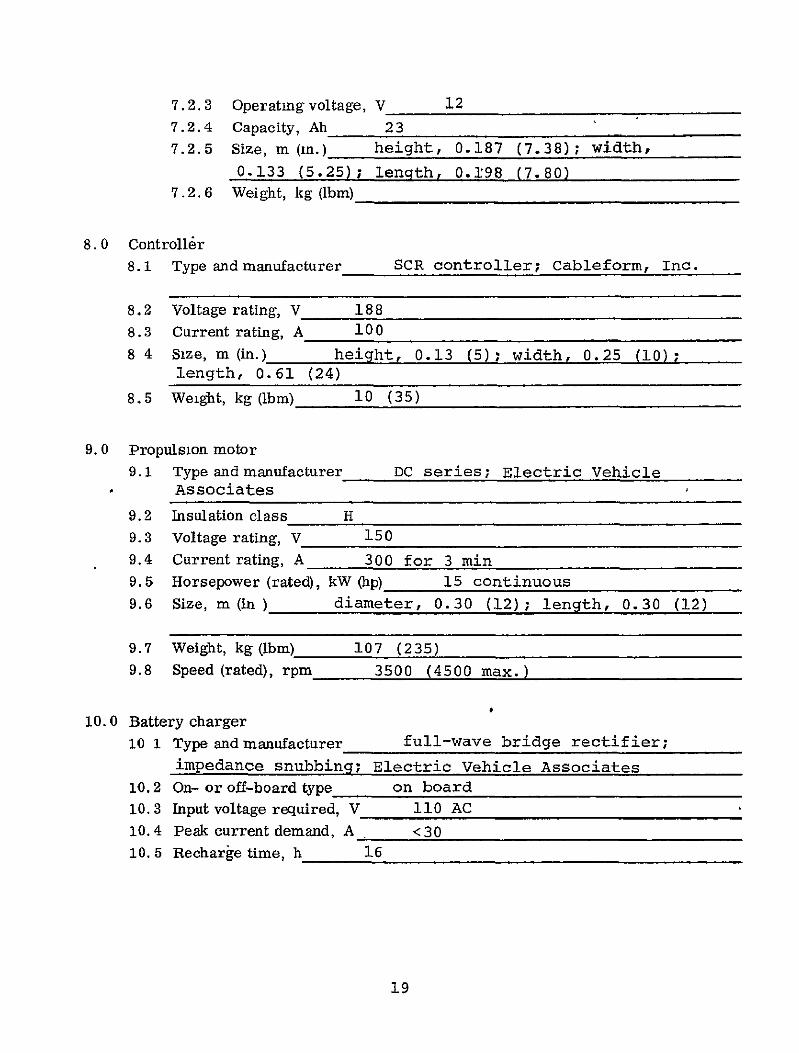
9.0 Propulsion motor 9,1 Type and manufacturer DC series; Electric Vehicle
Associates
9.2 Insulation class H
9.3 Voltage rating, V 150 9.4 Current rating, A 300 for 3 min 9.5 Horsepower (rated), kW (hp) 15 continuous 9.6 Size, m (in) diameter, 0.30 (12); length, 0.30 (12)
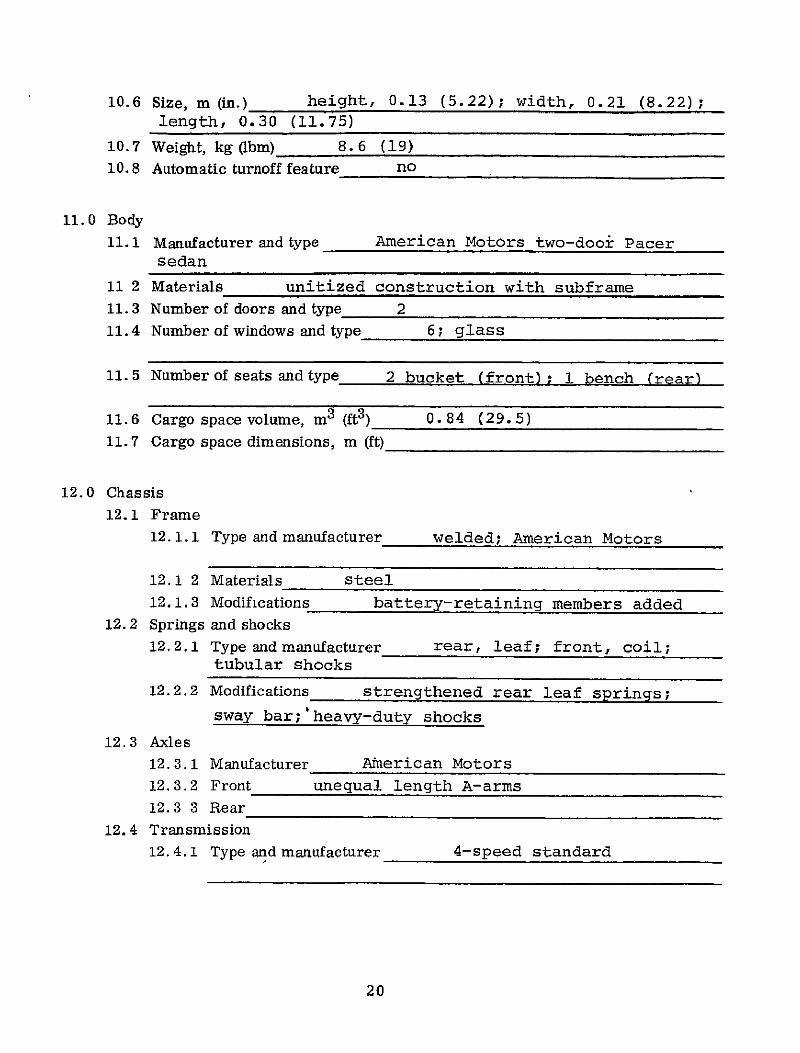
12.4 Transmission12.4.1 Type and manufacturer 4-speed standard
20
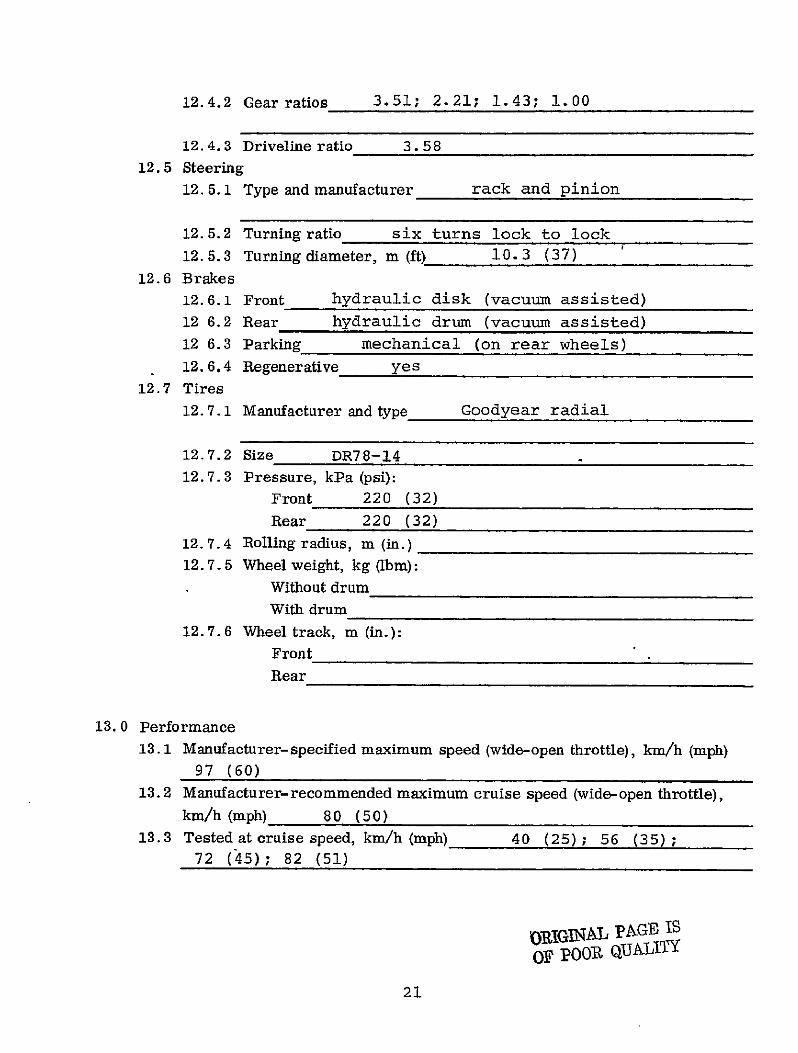
12.4.2 Gearratios 3.51; 2.21; 1.43; 1.00
12.4.3 Driveline ratio 3.58
12.5 Steering12.5.1 Type and manufacturer rack and pinion
12.5.2 Turning ratio six turns lock to lock
12.5.3 Turning diameter, m (ft) 10.3 (37)
12.6 Brakes12.6.1 Front hydraulic disk (vacuum assisted)
12 6.2 Rear hydraulic drum (vacuum assisted)
12 6.3 Parking mechanical (on rear wheels)
12.6.4 Regenerative yes
12.7 Tires
12.7.1 Manufacturer and type Goodyear radial
12.7.2 Size DR78-14
12.7.3 Pressure, kPa (psi):
Front 220 (32) Rear 220 (32)
12.7.4 Rolling radius, m (in.)
12.7.5 Wheel weight, kg (Ibm):Without drum
With drum
12.7.6 Wheel track, m (in.):Front
Rear
13. 0 Performance 13.1 Manufacturer-specified maximum speed (wide-open throttle), km/h (mph)
97 (60)13.2 Manufacturer-recommended maximum cruise speed (wide-open throttle),
km/h (mph) 80 (50)13.3 Tested at cruise speed, km/h (mph) 40 (25) ; 56 (35);
72 (45); 82 (51)
OIIGINAL pAGE IS
OF POOR QUALITY
21
APPENDIX B
DESCRIPTION OF VEHICLE TEST TRACK
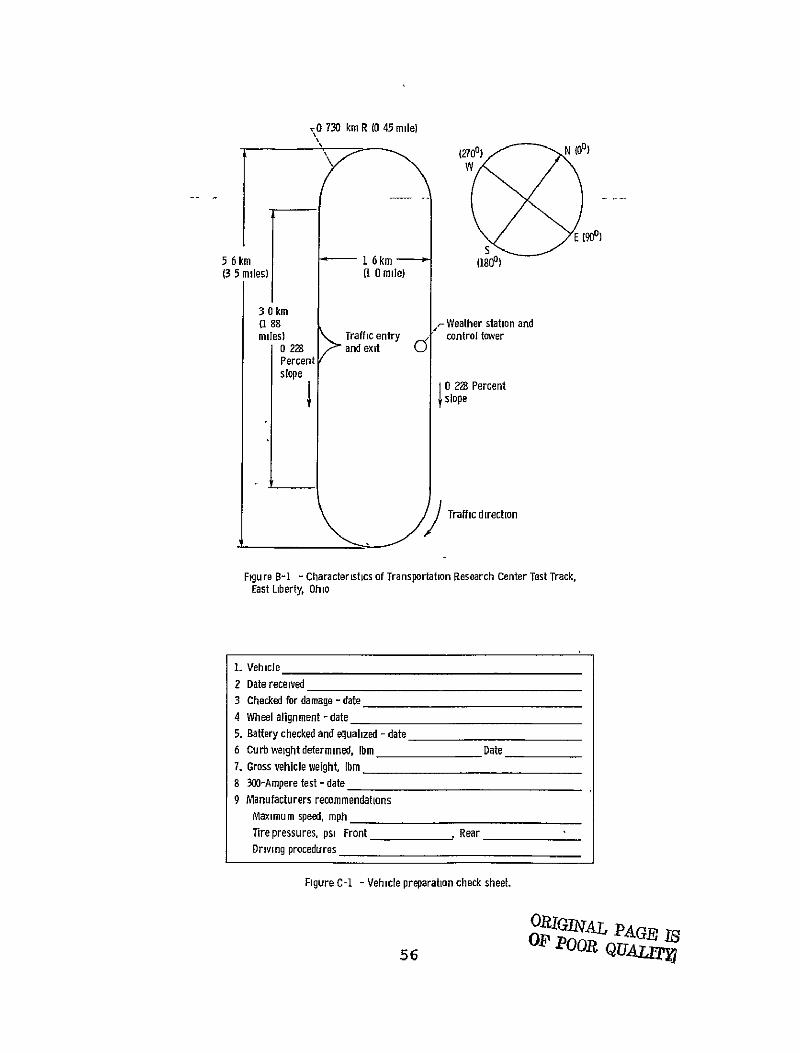
All the tests were conducted at the TransportationResearch Center (TRC) of Ohio (fig. B-1). This facility wasbuil-t by the State of Ohio and is now operated by acontractor and supported by the state. It is located 72kilometers (45 miles) northwest of Columbus along U.S. route33 near East Liberty, Ohio.
The test track is a 12-kilometer (7.5 mile) continuousloop 1.6 kilometers (1 mile) wide and 5.6 kilometers (3.5miles) long. Three concrete lanes 11 meters (36 ft) wide in the straightaways and 13 meters (42 ft) wide in the curvesmake up the high-speed test area. The lanes were designedfor speeds of 129, 177, and 225 kilometers per hour (80,110, and 140 mph) with zero lateral acceleration in thecurves. The 3-kilometer- (1.88-mile-) long straightawaysare connected to the constant 731-meter- (2400-ft-) radiuscurves by a short variable-radius transition section.Adjacent to the inside concrete lane is a 3.66-meter(12-ft-) wide asphalt berm. This berm is only bankedslightly to provide a drainage slope. An additional asphaltlane 3.66 meters (12 ft) wide is located adjacent to theoutside lane on the straightaways. The constant-speed andcycle tests were conducted on the inside asphalt lanebecause all tests were at relatively low speeds. Theacceleration and coast-down tests were conducted on thestraight outside asphalt lanes because these were more alikethan the two inside asphalt lanes and because it was theportion of the track least likely to encounter trafficinterference. The track has a constant 0.228 percentnorth-to-south downslope. The TRC complex also has a 20hectare (50-acre) vehicle dynamics area and a 2740-meter(9000-ft-) long skid pad for the conduct of braking andhandling tests.
22
APPENDIX, C
VEHICLE PREPARATION AND TEST PROCEDURE
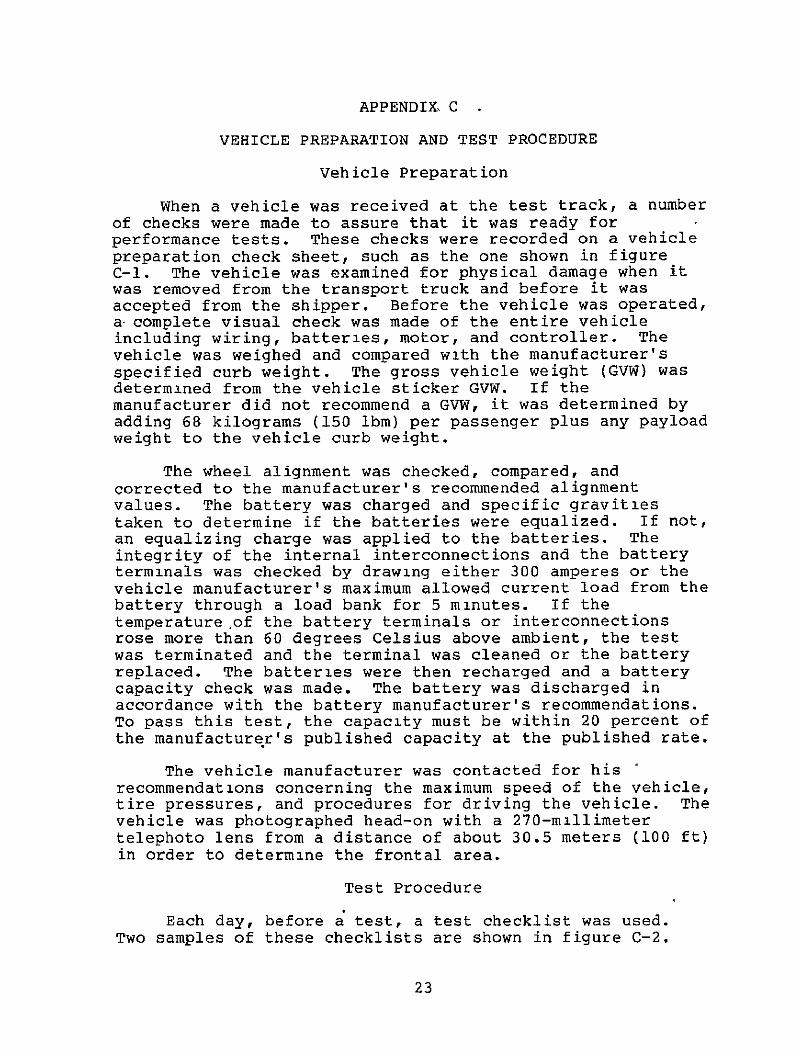
Vehicle Preparation
When a vehicle was received at the test track, a numberof checks were made to assure that it was ready forperformance tests. These checks were recorded on a vehicle preparation check sheet, such as the one shown in figureC-I. The vehicle was examined for physical damage when itwas removed from the transport truck and before it wasaccepted from the shipper. Before the vehicle was operated,a complete visual check was made of the entire vehicle including wiring, batteries, motor, and controller. Thevehicle was weighed and compared with the manufacturer'sspecified curb weight. The gross vehicle weight (GVW) wasdetermined from the vehicle sticker GVW. If themanufacturer did not recommend a GVW, it was determined byadding 68 kilograms (150 ibm) per passenger plus any payloadweight to the vehicle curb weight.
The wheel alignment was checked, compared, andcorrected to the manufacturer's recommended alignmentvalues. The battery was charged and specific gravities taken to determine if the batteries were equalized. If not,an equalizing charge was applied to the batteries. Theintegrity of the internal interconnections and the batteryterminals was checked by drawing either 300 amperes or thevehicle manufacturer's maximum allowed current load from thebattery through a load bank for 5 minutes. If thetemperature of the battery terminals or interconnectionsrose more than 60 degrees Celsius above ambient, the test was terminated and the terminal was cleaned or the batteryreplaced. The batteries were then recharged and a batterycapacity check was made. The battery was discharged inaccordance with the battery manufacturer's recommendations. To pass this test, the capacity must be within 20 percent ofthe manufacturer's published capacity at the published rate.
The vehicle manufacturer was contacted for hisrecommendations concerning the maximum speed of the vehicle,tire pressures, and procedures for driving the vehicle. Thevehicle was photographed head-on with a 270-millimetertelephoto lens from a distance of about 30.5 meters (100 ft)in order to determine the frontal area.
Test Procedure
Each day, before a test, a test checklist was used.Two samples of these checklists are shown in figure C-2.
23
The first item under driver instructions on the testchecklist is to complete the pretest checklist (fig. C-3).
Data taken before, during, and after each test wereentered on the vehicle data sheet (fig. C-4). These datainclude
(1) Average specific gravity of the battery
(2) Tire pressures
(3) Fifth-wheel tire pressure
(4) Test weight of the vehicle
(5) Weather information
(6) Battery temperatures
(7) Time the test was started
(8) Time the test was stopped ORIGINALP5oF poor QIAU 4
(9) Ampere-hours out of the battery
(10) Fifth-wheel distance count
(11) Odometer readings before and after the tests
The battery charge data taken during the charge cycle werealso recorded on this data sheet. These data include theaverage specific gravity of the battery after the test, thekilowatt-hours and ampere-hours put into the battery duringthe charge, and the total time of the charge.
To prepare for a test, the specific gravities werefirst measured for each cell and recorded. The tirepressures were measured and the vehicle was weighed. Theweight was brought up to the GVW by adding sandbags. Theinstrumentation was connected, and power from theinstrumentation battery was applied. All instruments wereturned on and warmed up. The vehicle was towed to thestarting point on the track. If the data were beingtelemetered, precalibrations were applied to both themagnetic tape and the oscillograph. The fifth-wheeldistance counter -and ampere-hour integrator counter werereset to zero, and thermocouple reference junctions wereturned on. The test was started and was carried out inaccordance with the test checklist. When the test wasterminated, the vehicle was brought to a stop and thepost-test checks were made in accordance with the post-test
24
checklist (fig. C-5). The driver recorded on the vehicledata sheet the time, the odometer reading, the ampere-hourintegrator reading, and the fifth-wheel distance reading.The post-calibration steps were then applied to the magqetictape and the oscillograph. At the end of the test, weatherdata were recorded on the vehicle data sheet. Allinstrumentation power was turned off, the instrumentationbattery was disconnected, and the fifth wheel was raised.The vehicle was then towed back to the garage, the post-testspecific gravities were measured for all cells, and thevehicle was placed on charge.
After the test, the engineer conducting the testcompleted a test summary sheet (fig. C-6). This data sheetprovides a brief summary of the pertinent informationreceived from the test. Another data sheet, the engineer'sdata sheet (fig. C-7), was also filled out. This data sheetsummarizes the engineer's evaluation of the test andprovides a record of problems, malfunctions, changes toinstrumentation, etc., that occurred during the test.
Weather data. - Wind velocity and direction and ambienttemperature were measured at the beginning and at the end ofeach test and every hour during the test. The windanemometer was located about 1.8 meters (6 ft) from theground near the southern straight section of the track. Theambient temperature readings were taken at theinstrumentation trailer near the west curve of the track.During most of the test period the winds were variable andgusty.
Determination of maximum speed. - The maximum speed ofthe vehicle was determined in the following manner. Thevehicle was fully charged and loaded to gross vehicleweight. After one warmup lap, the vehicle was driven atwide-open throttle for three laps around the track. Theminimum speed for each lap was recorded and the average wascalculated. This average was called the vehicle maximumspeed. This speed takes into account track variability andmaximum vehicle loading. This quantity was then reduced by5 percent and called the recommended maximum cruise testspeed.
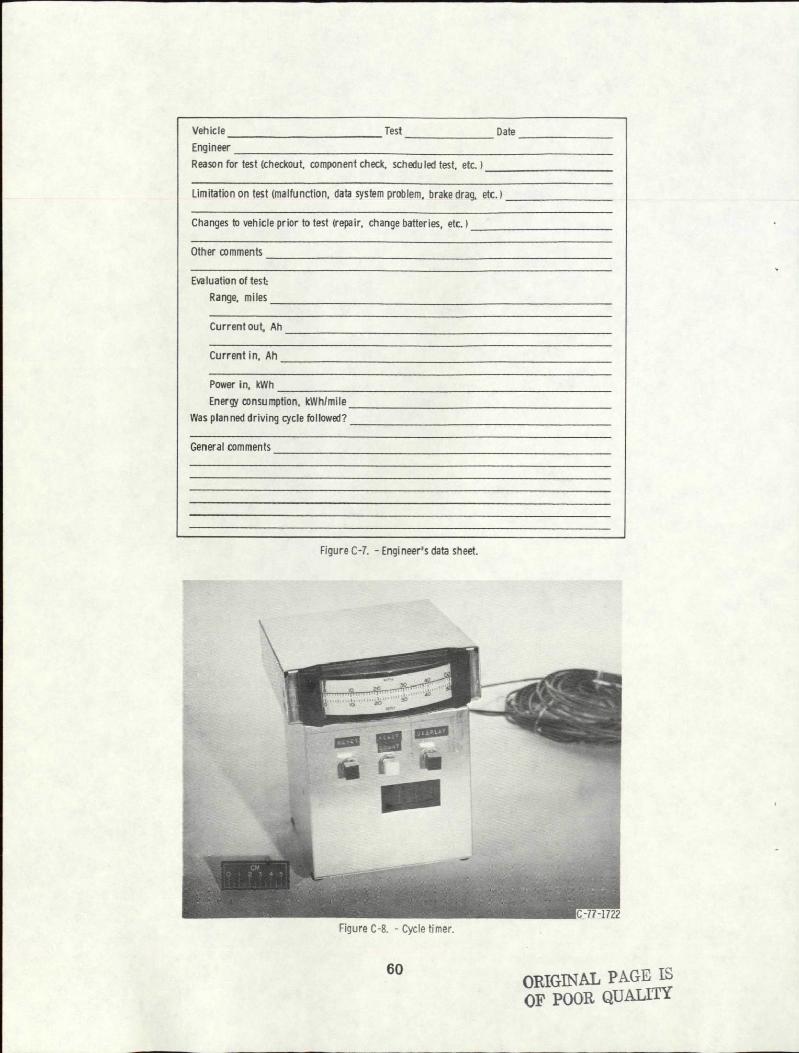
Cycle timer. - The cycle timer (fig. C-8) was designedto assist the vehicle driver in accurately driving SAEschedules B,-C, and D. The required test profile ispermanently stored on a programmable read-only memory(PROM), which is the heart of the instrument. This profileis continuously reproduced on one needle of a dual-movementanalog meter shown in the figure. The second needle isconnected to the output of the fifth wheel and the driver
25
"matches needles" to accurately drive the required schedule.
One second before each speed transition (e.g.,acceleration to cruise or cruise to coast), an audio signalsounds to forewarn the driver of a change. A longerduration audio signal sounds after the idle period toemphasize the start of a new cycle. The total number oftest cycles driven is stored in a counter and can bedisplayed at any time with a pushbutton (to conserve power).
26
REFERENCES
1. Sargent, Noel B., Maslowski, Edward A.; Soltis, RichardF.; and Schuh, Richard M.: Baseline Tests of the C. H. Waterman DAF Electric Passenger Vehicle. NASA TM-73757,1977.
2. Society of Automotive Engineers, Inc.: Electric VehicleTest Procedure - SAE J227a. Feb. 1976.
27
=8insI. - SU OF TEST PSI)SS MOR EVA C1( OF-pACE OWUPE
(a) S3 'nats
Test date Test condLtin (cistant spel,
.or &rxvag sC e )
W" vecty,
Vh
1wp' sire,
oc
Usage lz
cyle life,
aser of cycle
capacity cut ahterO.
Ah
Capacity wfanto
batterie s, Ah
ergy ante
chae, Ml
bd atod enery
oms=c , M/kl
TA of char
farrks
6/17/77 40 6 - 23 30 83.8 144 356 179 21 o0VAC
6/21/77
6/22/77
82
72
10
a 16
18
21
49 7
54 5
100
102
140
124
65 9
60 8
1 3
1 1
6/23/77 56 0 -1 21 67 6 95 143 68 4 1 0
6/24/77
6/27/77
6/28/77
6/30/77
82
B a
Ca
&
6
0 -1i
16 - 24
13 - 31
22
27
24
25
51 2
52 8
47 1
40 5
145
b 7 3 (75)
62
110
140
124
112
164
165
126
146
73 1
82 4
91 4
77 0
1 4
1 6
1 9
1 9
110 V AC
+ NSA w
110 VCcharger
filed Preaturetermnaton
of test
7/1/77
7/6/77
BO
40
6 - 3S
8 19
22
31
47 9
85 2
33 140
142
201
168
99 7
79 6
2 1
94
gNS
S Newcontxolier
7/8/77
7/1/77
56
C
6
6
22
23
73 2
48 4 82
125
126
170
173
-
-
-
-
208 V A
208 V C
Hzgh-prerssre tires gh transinsico
oil Light trn scn nfl
7/13/77
7/15/77
C
Cc
6 - 19
- -
30 48,1
47.8
83
82
127
126
179
-
- - 208VAC Light t musmofl
Light trenessco oli
(b) V S citesr nt
Test date Test cttuta (wastant speed, mph, or diving
a a)
Wnd velocity,
nmh
T erae. ature,
O. atules
cycle life,
'rneb of cycles
Capacity ct of atteri,
Ah
Capacity Enrgy ante into
batteries ,cre Ah )de
.
Indicated e
.onss , dvisule
iyp of mrks
6/17/77
6/21/77
6/22/77
25
31
45
4 14
6
5 - 10
86 63
70
52,1 300
33 9 -
144 100
102
356 140
124
49 7 18 3
16 9
0 93 59
50
110 Ac
6/23/77
6/24/77
35
31
0 - a
4
70
71
42.0
31 8
95
n0
143
164
19 0
20.3
.45
64
6/27/77
6/28/77
6/30/n
7/1/77
3 e
Ca
C
B0
0 10
10-15
a6 - 19
4 - 22
s0
0
77
71
32 a
29.3
25 2
29 8
145
b 7 3 (75)
62
133
140
124
112
140
165
126
146
201
22.4
254
21 4
27 7
70
87
85
93
novAC + }SA
OfS
99SA
0V ACo rer failed
PrT tenaatin of test
7/6/77
7/8/77
7/11/77
25
35
Ca
5 - n
4
4
88
72
73
53 0
45 5
30 1
-
82
142
125
128
158
170
173
22 1
-42
-
-V
t
208
228V
e Wtoller
iih-iessu.re ta
ught txausrssien oil
ightt rans ioossnoil
7/13/77
7/15/77
C
C0
4 - 12 56
-
30 5
29 7
83
82
127
126
179
- -
- 0-20 V AC Light tran .issonoil
Light tnnsnsson oil
'tre WIest to
erative brakg cycles may have not eat schedule
W xthitgeamra brakn
PAG1 Ig
28E OO
TABM II. - MfM ACCERATION AND GRADEABILITY FOR EVA CHANGE-OF-PACE COUPE
(a) At full battery charge (b) At 40-percent battery discharge
Vehicle speed TiMe to reach Vehicle acceleration Grade- Vehicle speed Time to reach Vehicle acceleration Gradedesignated 2 ability, designated 2 ability,
knih mph vehicle speed, D/s nph/s percent n/h mph vehicle speed, Ws mph/s percent s s
3.At signal from control center accelerate moderately to - mph. 2.While on track recheck.
4 Maintain -+ mph with minimal accelerator movement. Integrator - light on, in "operate" position, zeroed
5. When vehicle is no longer able to maintain _ mph, brake moderately to full stop Speedometer - set on _ mph center 6. Complete post-test checklist and other documentation Distance - on, reset, lighted
Attenuator - on, reset, selector on 100 Recording Cycle timer - verify scheduled timing with stop watch
1 Set oscillograph zeros at Channel Zero, in. 3 At signal from control center, perform cycle test using cycle timer as basis for deter3 40 mining length of each phase of performance cycle Use programmed stop watch as 4 45 50 backup device Cycle consists of6
Accelerate to_ mph in s10 75Lin 12 1.1 Cru ise at mph for _ s13 1 2 Coast for s2 014 120Brake to complete stop in s
Hoin stop in _Check Inputs at beginning of test to verify
2 Record all channels on magnetic tape. Hold in stop poslton for srecording
Repeat entire cycle until vehicle isunable to meet acceleration time Moderately brake 3.Run cals on all channels to a complete stop4 copete stot 4 Remove all channels from oscillograph except 3and 4
4 Complte post-test checklist and other documentaton. 5 Start recording 15 s before start of test at oscillograph speed of 01 Ins and tape speed
Recordingof r ins. 1 Record all channels on magnetic tape at - mis Check all channels to verily
into test connect channels 6, 10, 12, 13, and 14 to oscillograph and record6 After 15 mi input at beginning of testaburst at 100 in/s while vehicle isin chopper mode.
2 Record speed and distance on oscillograph at _ in/s.7.Remove channels 6, 10, 12, 13. and 14 from oscillograph and continue test at 01 in/s
3 Start recordingdata 15 sbefore beginning testwith channels 3and 4only. 8 Document all ambient conditions at beginning, once every hour, and at the end of the 4. Document ambient conditions at beginning, once every hour, and at the end of the test
Items recorded shall include temperature, wind speed and direction, significant windtest Items recorded shall include temperature, wind speed and direction, significant wind gusts, and corrected barometric pressure gusts, and corrected barometric pressure
0) Driving cycle test(a)Constant-speed test. Figure C-2. - Test checklists.
1.Record specifLc gravity readings after removing vehicle from charge, and disconnect charger instrumentation Fill in charge data portion of data sheet from previous test Add water to batteries as necessary, recording amount added Check and record 5th wheel tire pressure and vehicle tire pressure,Connect (Connect alligator clips to instrumentation battery last) (a)Inverter to istrument battery (c)Integrator input lead(c)Integrator power to inverter (d)Starred (0)5th wheel jumper cable (e) Check timesCycle timer power and speed signal input cables. (0 Spin up and calibrate 5th wheel
3. Record test weight - includes driver and ballast with 5th wheel raised
4 Turn on (a)lnverter, motor speed sensor, thermocouple reference junctions, integrator,
UL and digital voltmeter Set integrator on "Operate "Motor c0 () Fifth wheel readout and switching interface units (2) (Selectdistance for ex
panded scale range.) Tow vehicle onto track with 5th wheel raised
Precallbrat ions. Tape data systemOscillograph
Reset 5th wheel distance
0- Ampere-hour meter Thermocouple readout switches on "Record"
Turn on thermocouple reference jungionsChreinuvotgV_________________Lower 5th wheel. Set hub loading.
- Be sure data sheet isproperly filled out to tiiis point Check watch time with controltower
id 7 Proceed with test
Figure C-3 - Pretest checklist.
Vehicle Battery system Test Date
Track data Driver Navigator Average pretest specific gravity Open-circuit voltage, V lire pressure before test, psi
Right front _ Left front Right rear Left rear-Tire pressure after test, psi
Right front _ Left front_ Right rear LeffrearFifth-vtheel pressure psi (_____cahibrated] ___ _ psi)
Weather Initial During test FinalOFTemperature,Wind speed, mph ____ ____ _____Wind drecton
Pressure, in Hg Battery temperature, OF Before Ater
temperature, OF. Before - After Time Start _ Stop _
Odometer reading, miles Start __ StopCurrent out, Ah __ Current in (regenerative), Ah Ffth wheelBasis for termination of tests
Charge dataAverage post-test specific gravityOpen-circuit voltage, V Charger used
Battery temperature, OF Before charge _ After charge
Pwrh ttEnd -- TotalI-Time Start End Total charge time, -min
Current input, Ah Average specific gravity aftercharge-
Approval
Figure C-4 - Track and charge data
1. Record time immediately at completion of test, Turn off key switch,
2. Complete track data sheet: fa) Odometer stopt Ampere-hour integrator(c) 5th wheel distancefit Read temperature(e) Calibratedata system (f) Record weather data
3. Turn off inverter, thermocouple reference ju nctions. 4. Disconnect 12-olt instrument battery red lead.
5. Raise 5th wheel.
6. Tow vehicle off track.
7. Start charge procedure (specific gravities).
8. Check specific graviltyon instrument battery. If less than L 220, remove from vehicle and charge to full capacity.
9. Check water level in accessory batteries. Add water as necessary.
Figure C-5. - Post-test checklist.
Vehicle Test Date
Test conditions:
Temperature, OF Wind speed, mph at
Barometer reading, in.Hg - Other Test results:
Test time, h Range, milesCyclesCurrent out of battery. AhCurrent into battery, Ah
Charge time, h
Power into battery. kWh
Magnetic tape
NO. ; Speed, inls
Comments
Figure C-6. - Test summary sheet.
59
Vehicle Test Date
Engineer Reason for test (checkout component check, scheduled test. etc. )
Limitation on test (malfunction, data system problem, brake drag. etc.)
Changes to vehicle prior to test (repair, change batteries, etc. )
Other comments
Evaluation of test
Range, miles
Current out, Ah
Current in, Ah
Power in, kWh
Energy consumption. kWhlmile
Was planned driving cycle followed?
General comments
Figure C-7. - Engineer's data sheet.
Figure C-8. - Cycle timer.
60 ORIGINAL PAGE IS
OF POOR QUALITY
NATIONAL AERONAUTICS AND SPACE ADMINISTRATION WASHINGTON. D C 20S46 POSTAGE AND FEES PAID
NATIONAL AERONAUTICS AND OFFICIAL BUSINESS SPACE ADMINISTRATION
PENALTY FOR PRIVATE USE $300 SPECIAL FOURTH-CLASS RATE 451
BOOK
If Undeliverable (Sectio. 158POSTMASTER Postal lanual) Do Not Return