18
BASF – our experience in China Joerg Wuttke, BASF China April 2005
| Date post: | 21-Aug-2018 |
| Category: |
Documents |
| Upload: | truongngoc |
| View: | 213 times |
| Download: | 0 times |

BASF –our experience in China
Joerg Wuttke, BASF ChinaApril 2005

BASF in Greater China
BASF has been trading in China since 1885
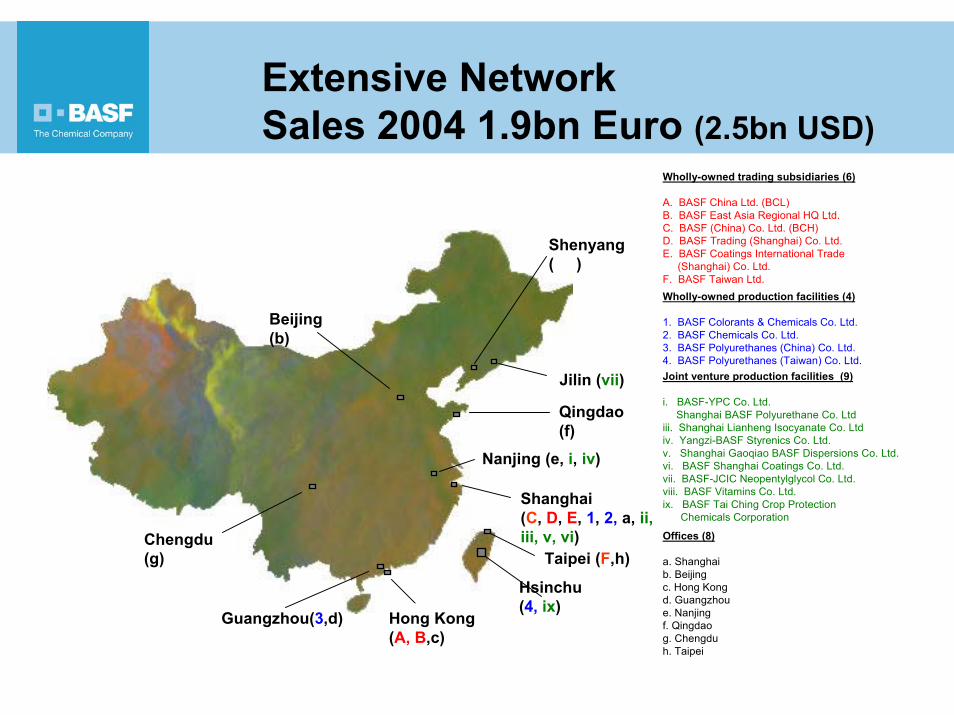
Extensive NetworkSales 2004 1.9bn Euro (2.5bn USD)
Wholly-owned trading subsidiaries (6)
A. BASF China Ltd. (BCL)B. BASF East Asia Regional HQ Ltd.C. BASF (China) Co. Ltd. (BCH)D. BASF Trading (Shanghai) Co. Ltd.E. BASF Coatings International Trade
(Shanghai) Co. Ltd.F. BASF Taiwan Ltd.Wholly-owned production facilities (4)
1. BASF Colorants & Chemicals Co. Ltd.2. BASF Chemicals Co. Ltd.3. BASF Polyurethanes (China) Co. Ltd.4. BASF Polyurethanes (Taiwan) Co. Ltd.Joint venture production facilities (9)
i. BASF-YPC Co. Ltd.ii. Shanghai BASF Polyurethane Co. Ltdiii. Shanghai Lianheng Isocyanate Co. Ltdiv. Yangzi-BASF Styrenics Co. Ltd.v. Shanghai Gaoqiao BASF Dispersions Co. Ltd.vi. BASF Shanghai Coatings Co. Ltd.vii. BASF-JCIC Neopentylglycol Co. Ltd.viii. BASF Vitamins Co. Ltd.ix. BASF Tai Ching Crop Protection
Chemicals Corporation
Nanjing (e, i, iv)
Jilin (vii)
Beijing(b)
Shenyang (viii)
Taipei (F,h)
Hong Kong(A, B,c)
Guangzhou(3,d)
Shanghai(C, D, E, 1, 2, a, ii, iii, v, vi)
Hsinchu(4, ix)
Offices (8)
a. Shanghai b. Beijingc. Hong Kong d. Guangzhou e. Nanjing f. Qingdao g. Chengdu h. Taipei
Qingdao(f)
Chengdu(g)

Major Investment Projects in China
Beijing
Nanjing
HongkongVerbund site
20062005
1,000*300*
Under constructionIsocyanates CaojingTHF / PTHF Caojing
20052,900*
Under construction
BYC Nanjing
Start upInvest.[Mio. USD]Company
Caojing
Chemical siteSite close to customers
* Total investment incl. utility / infrastructure
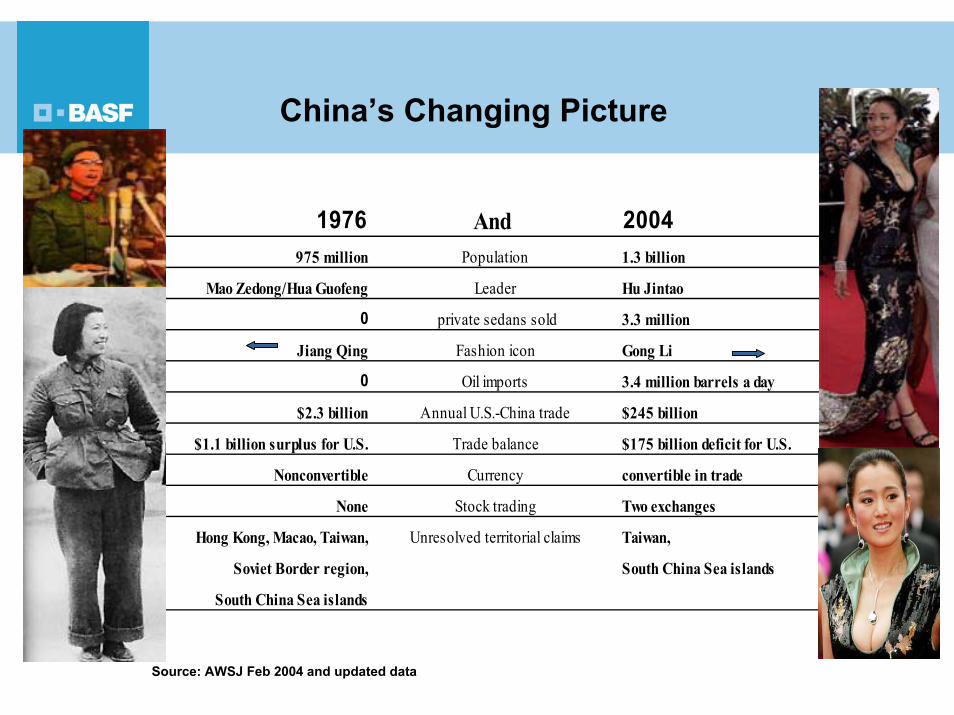
1976 And 2004975 million Population 1.3 billion
Mao Zedong/Hua Guofeng Leader Hu Jintao
0 private sedans sold 3.3 million
Jiang Qing Fashion icon Gong Li
0 Oil imports 3.4 million barrels a day
$2.3 billion Annual U.S.-China trade $245 billion
$1.1 billion surplus for U.S. Trade balance $175 billion deficit for U.S.
Nonconvertible Currency convertible in trade
None Stock trading Two exchanges
Hong Kong, Macao, Taiwan, Unresolved territorial claims Taiwan,
Soviet Border region, South China Sea islands
South China Sea islands
Source: AWSJ Feb 2004 and updated data
China’s Changing Picture

China’s GDP as a share of world GDP 1750 - Today
An early leader in technology, innovation, and the economy, China suffered a decline in global GDP generation and became increasingly marginalized by her Western competitors.
First Opium War(1839-1842)
Taiping Rebellion(1850-1865)
Second Opium War(1856-1860)
Sino-Japanese War (1894-1895)
Boxer Rebellion(1900)
0
10
20
30
40
1700 1820 1890 1952 1978 1995 2002
%
% of World GDPAt market prices
1913: China represents 15% of BASF’s worldwide revenues
2003: China represents 5% of BASF’s worldwide revenues
Source: Angus Maddison, OECD

0
2
4
6
8
10
0 200 400 600Segment size 2000 [€ bn]
Gro
wth
of s
egm
ents
2000
-201
5 [%
p.a
.]
Manufacturing
Services
Construction
Agriculture
= Segment size 2015
Mining
∅ 6.5 %
GDP: size 2000 = 1,169bn Eurogrowth = 6.5% p.a.
GDP more driven by service sector and construction (infrastructure)
Manufacturing and chemical demand expected to grow in line with GDP
Combined growth rate of manufacturing, agriculture and construction below 6% p.a.
Size and growth of
GDP segments 2000 - 2015

SIMPLY PUT…….CHINA IS GOING TO GROW FASTER THAN ANY OTHER ECONOMY(Urbanization of 10m people p.a. !!!!!) BASE CASE
GDP at PPPCAGR10-25
CAGR03-10
Real GDP development for selected economiesUS$ Billions (in 2002 US$) 2010F2003 2025F
823
713
585
498
415
1,921
2,217
2,252
4,671
13,566
2.0%
1.8%
2.6%
7.4%
5.7%
5.6%
3.7%
4.3%
5.2%
US
Japan
Germany
China*
UK
India
Korea
Brazil
Russia
Taiwan
3.4%
7,737
11,539
558
488
453
370
292
1,348
1,602
1,993
4,066
10,764
834
686
1,184
1,062
1,774
2,769
2,905
5,598
6,018
20,643 2.8%
1.7%
6.4%
1.7%
2.5%
5.3%
3.4%
4.1%
3.5%
3.4%
Germany
UK
India
Korea
Brazil
Russia
Taiwan
US
China** 23,031
US
JapanJapan
Germany
U.K
China
India
Korea
Brazil
Russia
Taiwan
* High case: real GDP of US$2.4 tri (8.6% CAGR) and GDP at PPP of US$11.4 tril (5.7% CAGR). Low case: real GDP of US$2.0 tri (5.9% CAGR) and GDP at PPP of US$11.7 tri (6.1% CAGR)
** High case: real GDP of US$7.2 tri (7.6% CAGR) and GDP at PPP of US$21.9 tri (4.4% CAGR). Low case: real GDP of US$3.7 tri (4.1% CAGR) and GDP at PPP of US$ 21.2 tri (4.1% CAGR)
Source: WEFA-WMM; McKinsey analysis

Development of Chemical Markets in Asia Pacific 2002-2015
374 bn EUR
598 bn EUR+3.7% p.a.
NAFTA 29%
WE 23%
SA 5%
2002 2015
37%
11%
11%4%
15%
22%
30%
11%8%4%11%
34%
NAFTA 31%
WE 25%
SA 5%
Asia Pacific
31%
AsiaPacific34%
20151,740 bn EUR
Greater China
Japan
OtherIndia
ANZAsean
South Korea
2%
20021,210 bn EUR
1 Euro = 0.945 USD
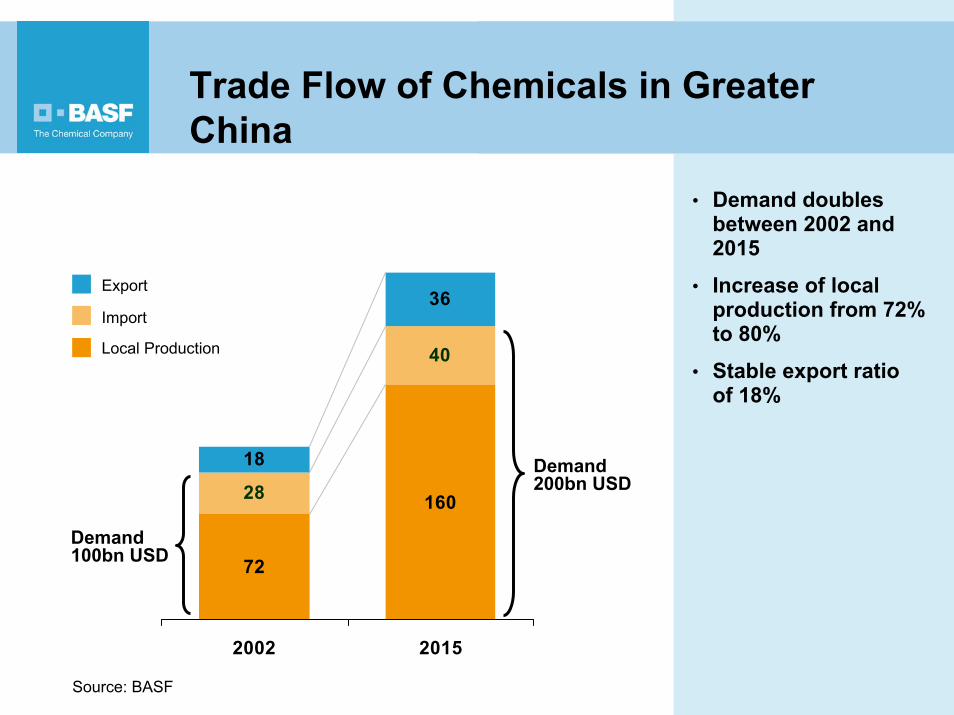
• Demand doubles between 2002 and 2015
• Increase of local production from 72% to 80%
• Stable export ratio of 18%
Trade Flow of Chemicals in Greater China
Demand100bn USD
Demand200bn USD
Source: BASF
72
16028
40
18
36
2002 2015
Local Production
Import
Export

Demand will Shift to Higher Value Chemicals
Source: A.T. Kearney, Frost & Sullivan, Henkel, DZ Bank
40 %58 %
7 %
6 %
18 %
15 %
35 %
21 %
2003 2015 (e)
Specialties
Intermediates forPharma
Agricultural Products
Base Chemicals
Segmentation of the Chinese chemical market:
100 bn USD
200 bn USD• Consumer industries
will shift to higher value products.
• This trend will be mirrored in the increased demand of specialty chemicals.

Plastics in Cars saves money and the environment
Amount of Plastics used in sedans in China:Santana 50 kg, Audi 94kg, Cherokee Jeep 103kg
Reducing the weight of a
car by 100 kg saves about
3,5 liters fuel per 1000 km.
Saving 150m liters fuel each year !

Competitive Environment Highly Fragmented
2002 2015Imports
24%Local production
76%
3%3%
15%
18%
15%
22%
9%
15%
KoreaOthers
MNC*
MNC*
Strong local companies
Others
Others
40%
12%
10%
4%1%
20%
13%
OthersMNC*
Taiwan
Sinopec / PetroChina
MNC*
Imports33%
Local fragmentedcompanies
Local production67%
Taiwan
Sinopec / PetroChina
* MNC= Multinational Companies (e.g. Dow, DuPont, Bayer)Source: BASF

Additions of Local Cracker Capacities Cannot Catch up With Demand Growth
Hainan
Hong Kong
Tianjin
Shandong
LiaoningHebei
BeijingShanxi
Anhui
Jiangsu
Hubei
Gansu
Inner Mongolia
Ningxia
Xinjiang
Xizang
Qinghai
GuizhouHunan
GuangdongGuangxiYunnan
Heilongjiang
Jilin
Henan
Sichuan Zhejiang
Fujian
JiangxiChongqing
ShaanxiShanghai
North China
South China
East China
2900
5100
1500
6100
0
10000
750
2800
0
10000
West China
4501800
0
10000
15.5005.5002003
28.50016.0002010
Total Demand
[kt/a]
Total Capacity
[kt/a]
capacity [kt/a]
Source: BASF
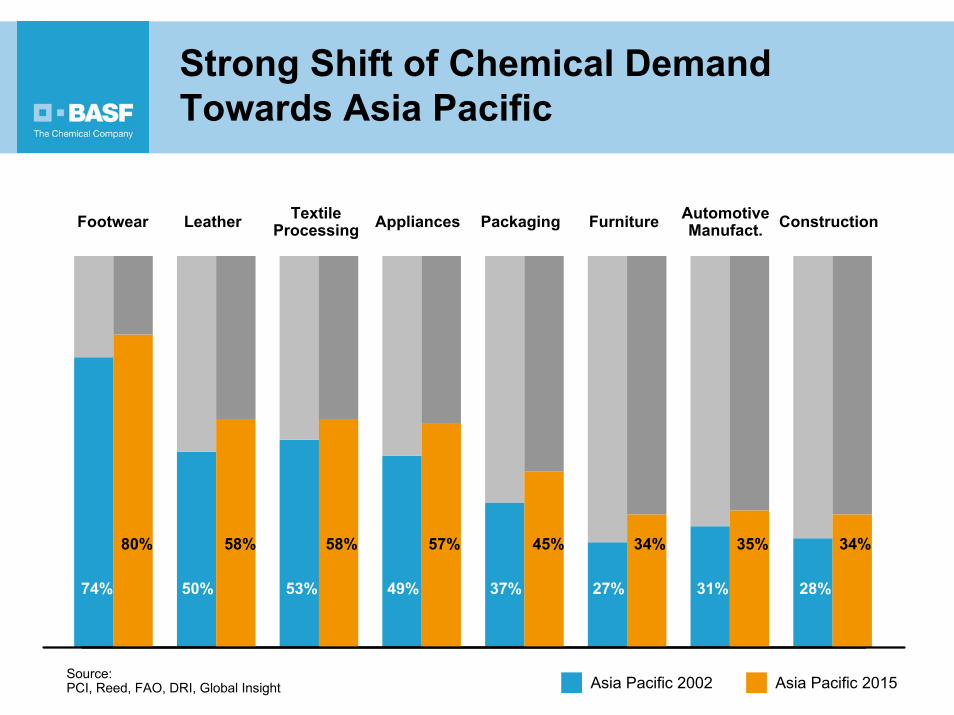
Strong Shift of Chemical Demand Towards Asia Pacific
AutomotiveManufact.Footwear Leather Textile
Processing Appliances FurniturePackaging Construction
50%74% 53% 49% 37% 27% 31% 28%
58%80% 58% 57% 45% 34% 35% 34%
Source: PCI, Reed, FAO, DRI, Global Insight Asia Pacific 2002 Asia Pacific 2015

Consumers of Chemical Products* in 2001
70mill. 76
mill.
Germany236 mill.
United States
JapanChina
110mill.
10 million consumers
2001 = 1.1 billion consumers (17% world population)Source: World Bank, EIU, US Census Bureau* A potential consumer of chemical products is defined by an annual income of 10.000 USD in purchasing power parity

Consumers of Chemical Products* in 2015
United StatesChina
76mill.
700 mill.
112mill.
284 mill.Germany
Japan
2015 = 2.0 billion consumers (29% world population)
10 million consumers
Source: World Bank, EIU, US Census Bureau* A potential consumer of chemical products is defined by an annual income of 10.000 USD in purchasing power parity
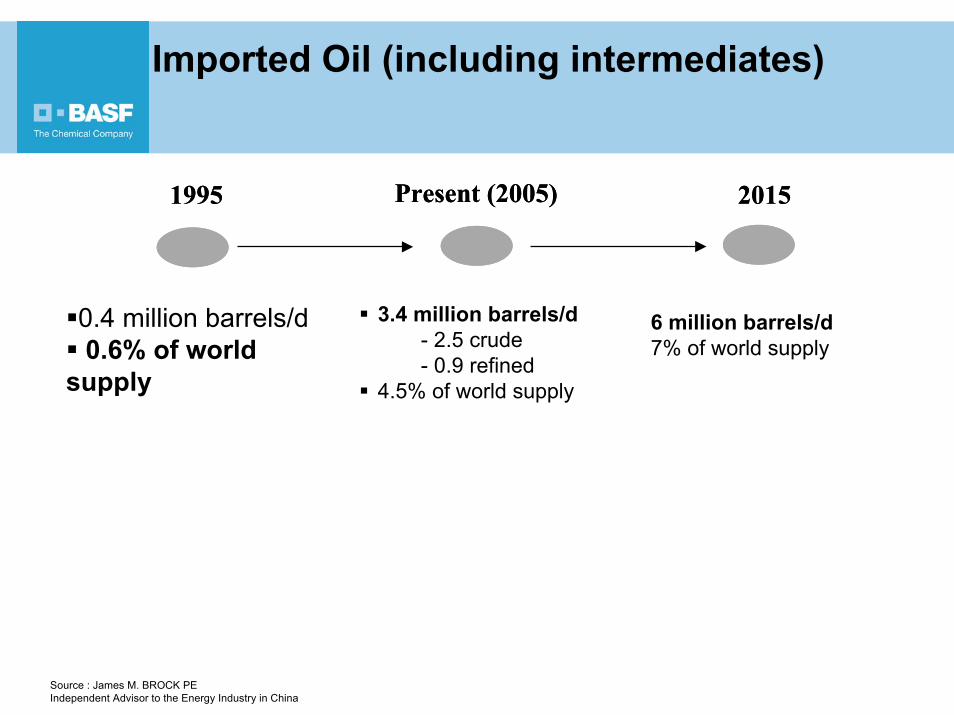
Imported Oil (including intermediates)
1995 2015Present (2005)1995 2015Present (2005)
0.4 million barrels/d0.6% of world
supply
3.4 million barrels/d- 2.5 crude- 0.9 refined
4.5% of world supply
Source : James M. BROCK PEIndependent Advisor to the Energy Industry in China
6 million barrels/d7% of world supply


