BASIC ASSESSMENT FOR A PROSPECTING RIGHT APPLICATION FOR OFFSHORE SEA CONCESSION 6C WEST COAST, SOUTH AFRICA Fisheries Assessment July 2018 PREPARED FOR: ON BEHALF OF: DE BEERS CONSOLIDATED MINES (PTY) LIMITED Capricorn Marine Environmental (Pty) Ltd Unit 15 Foregate Square, FW de Klerk Boulevard, Foreshore, 8001
Transcript
BASIC ASSESSMENT FOR A PROSPECTING RIGHT
APPLICATION FOR OFFSHORE SEA CONCESSION 6C
WEST COAST, SOUTH AFRICA Fisheries Assessment
July 2018
PREPARED FOR:
ON BEHALF OF:
DE BEERS CONSOLIDATED MINES (PTY) LIMITED
Capricorn Marine Environmental (Pty) Ltd Unit 15 Foregate Square, FW de Klerk Boulevard, Foreshore, 8001
19 July 2018
This report was prepared by Sarah Wilkinson and David Japp of CapMarine (Pty) Ltd. David Japp
has a BSC in Zoology, University of Cape Town (UCT) and an MSc degree in Fisheries Science from
Rhodes University. Sarah Wilkinson has a BSc (Hons) degree in 7Botany from UCT. Both are
professional natural scientists registered with the SA Council for Natural Scientific Professions
(SACNASP).
Mr Japp has worked in the field of Fisheries Science and resource assessment since 1987 and has
considerable experience in undertaking specialist environmental impact assessments relating to
fishing and fish stocks. His work has included environmental economic assessments and the
evaluation of the environmental impacts on fishing. Sarah Wilkinson has worked on marine resource
assessments, specializing in spatial and temporal analysis (GIS) as well as the economic impacts of
fisheries exploitation in the southern African region.
This specialist report was compiled for SLR Consulting (South Africa) (Pty) Ltd on behalf of De Beers
Consolidated Mines (Pty) Limited for their use in preparing a Basic Impact Assessment for proposed
offshore prospecting operations in Sea Concession 6C off the West Coast of South Africa.. We do
hereby declare that we are financially and otherwise independent of the Applicant and of SLR.
Dave Japp
Contact Details: Capricorn Marine Environmental (Pty) Ltd Unit 15, Foregate Square, FW de Klerk Boulevard, Foreshore, Cape Town South Africa P.O. Box 50035 Waterfront, 8001, South Africa Tel: +27 21 425 6226 E-mail: [email protected] Website: www.capfish.co.za
Basic Assessment for a Prospecting Right Application for Offshore Sea Concession 6C West Coast, South Africa 6C
Page ii
Figure 1.1: Location of Sea Concession 6C (Source: De Beers Consolidated Mines (Pty)
Ltd). ...................................................................................................................... 2 Figure 3.1: The geophysical survey techniques employed during Phase I of the proposed
prospecting operations would include swath bathymetry (left) and sub-bottom
Figure 3.2: Illustration of the current mining methods used to mine diamond-bearing
gravels; a) Vertical mining using large-diameter drills, and b) horizontal mining
using seabed crawlers (Source: De Beers Marine). ............................................. 4 Figure 4.1: Pie chart showing percentage of landings by weight of each commercial fishery
sector as a contribution to the landings for all commercial fisheries sectors
combined (2016)................................................................................................... 6 Figure 4.2: Generalised figure of the main fish recruiting process for species caught on the
West Coast of South Africa (after Hutchings et al., 2002). Figure shows the
West Coast nursery area and the western/central Agulhas Bank spawning
grounds. Light stippled area on the West Coast marks the main recruiting area
for the small pelagic fishery and dark stippled area on the Agulhas Bank marks
the main spawning grounds for small pelagic fish. ............................................... 8
Figure 4.3: Distribution of hake eggs (left) and larvae (right) off the West Coast of South
Africa between September and October 2005 (source: Institute of Marine
Research Bergen, Norway). ................................................................................. 9 Figure 4.4: Distribution of hake eggs (left) and larvae (right) off the West Coast of South
Africa between March and April 2007 (source: Institute of Marine Research
Figure 4.5: Sea Concession 6C (red polygon) in relation to major spawning areas of small
pelagic species in the southern Benguela region (Source: Pisces 2018 adapted
from Cruikshank 1990). ...................................................................................... 10 Figure 4.6: Spatial distribution of fishing grounds of the small pelagic purse-seine sector in
relation to the location of Sea Concession 6C. Fishing activity is reported by 10
x 10 nautical minute grid block and average annual effort is shown for the
period 2000 to 2016. Bathymetric contours are shown for 200m, 500m and
2000m. ................................................................................................................ 11 Figure 4.7a: Spatial distribution of fishing grounds of the demersal trawl sector in relation to
the location of Sea Concession 6C. Fishing activity is shown at a grid block
resolution of 5 x 5 nautical minutes and average annual effort is shown for the
period 2008 to 2016. Bathymetric contours are shown for 200m, 500m and
2000m. ................................................................................................................ 12 Figure 4.7b: Spatial distribution of fishing grounds of the demersal trawl sector in relation to
the location of Sea Concession 6C. Fishing activity is shown at a grid block
resolution of 5 x 5 nautical minutes and average annual effort is shown for the
period 2008 to 2016. .......................................................................................... 12 Figure 4.9a: Spatial distribution of fishing effort expended by the demersal longline sector
(2000 – 2017) in relation to Sea Concession 6C. The 200m, 500m and 2000m
bathymetric contours are shown. ....................................................................... 13 Figure 4.9b: Spatial distribution of fishing effort expended by the demersal longline sector
(2000 – 2017) in relation to Sea Concession 6C. Bathymetric contours are
shown at depth intervals of 100m from 100m to 1000m. ................................... 14
Figure 4.10: Spatial distribution of fishing grounds of the large pelagic longline sector in
relation to the location of Sea Concession 6C. Fishing activity is shown at a grid
block resolution of 60 x 60 nautical minutes (due to the spatial extent covered
CapMarine (Pty) Ltd
July 2018
Basic Assessment for a Prospecting Right Application for Offshore Sea Concession 6C West Coast, South Africa 6C
Page iii
by drifting longline gear) and average annual effort is shown for the period 2000
to 2016. The bathymetric contours shown are 200m, 500m and 2000m. .......... 15 Figure 4.11: Spatial distribution of fishing positions recorded between 2006 and 2016 by the
South African large pelagic longline sector in relation to Sea Concession 6C.
Bathymetric contours are shown at depth intervals of 100m depth from 100m to
1000m. ................................................................................................................ 15 Figure 4.12: Spatial distribution of fishing grounds of the tuna pole sector in relation to the
location of Sea Concession 6C. Fishing activity is shown at a grid block
resolution of 60 x 60 nautical minutes and average annual effort is shown for
the period 2007 to 2016. The bathymetric contours shown are 200m, 500m and
2000m. ................................................................................................................ 16 Figure 4.13: Spatial distribution of fishing effort expended by the South African traditional
linefish sector (2000 – 2016) in relation to Sea Concession 6C. The bathymetric
contours shown are 200m, 500m and 2000m. ................................................... 17 Figure 4.14: Graph showing national catch recorded by the west coast rock lobster sectors
for the period 2006 to 2016. Annual effort expenditure is indicated as the
number of traps hauled. ..................................................................................... 18
Figure 4.15: Graph showing average monthly catch (kg) and effort (number of traps hauled)
reported by the trapboat and bakkie sectors for west coast rock lobster over the
period 2006 to 2016. .......................................................................................... 19 Figure 4.16: Average catch per season (tons whole weight) of Jasus lalandii recorded by the
nearshore (bakkie) sector for the years 2006 to 2016. Catch is shown by
management subarea in relation to Sea Concession 6C. .................................. 19
Figure 4.17: Location of abalone ranching concession areas in relation to Sea Concession
Figure 4.18: Beach-seine and gillnet fishing areas and TAE (DAFF, 2014). ......................... 23 Figure 4.19: Number of rights issued for gillnet fishing areas A and B to a maximum depth of
50m (DAFF, 2016/17) in relation to Sea Concession 6C. .................................. 24
Figure 4.20: Location of seaweed rights areas in relation to Sea Concession 6C. ................ 26 Figure 4.21: Spatial distribution of trawling effort expended during research surveys
undertaken by DAFF to ascertain biomass of demersal fish species in relation to
Sea Concession 6C. The bathymetric contours shown are 200m, 500m and
2000m. ................................................................................................................ 27 Figure 4.22: Spatial distribution of tracks undertaken during biomass surveys of small
pelagic species undertaken by DAFF during 2010 and 2013. The survey
transects are shown in relation to Sea Concession 6C. The bathymetric
contours shown are 200m, 500m and 2000m. ................................................... 27
CapMarine (Pty) Ltd
Error! Unknown document property name.
Basic Assessment for a Prospecting Right Application for Offshore Sea Concession 6C West Coast, South Africa
Page 1
1. Introduction
De Beers Consolidated Mines (Pty) Limited (De Beers) is proposing to undertake prospecting operations
within Sea Concession 6C. Before these activities can be undertaken, authorisation is required in terms of
the National Environmental Management Act (NEMA), 1998 (No. 107 of 1998), as amended, and a
Prospecting Right have to be obtained in terms of the Mineral and Petroleum Resources Development Act
(MPRDA), 2002 (Act 28 of 2002).
The first step will be to conduct a regional scale geophysical survey in order to identify geological features of
interest for further exploration. Should geological features of interest be identified with the geophysical data,
then a decision will be made regarding the feasibility of proceeding to Phase 2 of the exploration. Geophysical
survey equipment will be deployed from a fit-for-purpose vessel suitable to the water depth and survey
method. The line spacing for this phase of prospecting is planned such as to enable full regional scale seabed
coverage.
Various exploration geophysical tools are available to DBM, including swathe bathymetry systems, sub-
bottom profilers, side-scan sonars, magnetometer surveys, Autonomous Underwater Vehicle (AUV), etc. The
swathe bathymetry system produces a digital terrain model of the seafloor and backscatter data may be
acquired to determine textural models. The sub-bottom profiler seismic systems generate profiles beneath
the seafloor to give a cross section view of the sediment layers. Side scan sonar systems produce acoustic
intensity images of the seafloor and are used to map the different sediment textures from associated
lithology of the seafloor. The magnetometer measures local variations in the intensity of the Earth’s magnetic
fields, which are caused by differences in composition of the sediment layers on or beneath the seafloor.
Each and/or all of these techniques may be used during prospecting.
Follow-up localised geophysical surveys may be undertaken during Phase 2, enabling refinement of the
definition of the target features. These detailed high resolution geophysical surveys will utilise similar tools
with the likely inclusion of an AUV survey. The AUV is used for survey in areas where survey line spacing is
generally <100m apart.
Should the result of the survey(s) indicate potential, follow-up sampling may also be undertaken to establish
the distribution of the diamondiferous material. Exploration sampling, which may include bulk sampling, will
be undertaken using a fit-for-purpose Tool using a vessel of opportunity (e.g. mv The Explorer and/or DBM’s
mv Coral Sea) sampling vessel. Sampling methodology will take advantage of the latest technologies
available to DBM. The sampling may be divided into stages with reviews and gate releases. A decision will
be made to select the fit-for-purpose sampling technology appropriate to each target area based on the
results of the preceding stage.
Bulk sampling may be undertaken using one of the vessels operated by DBM’s sister company De Beers
Marine Namibia (Pty) Ltd or a similar vessel. There are two basic configurations of vessel available: the
vertical method, utilising a large diameter drill bit and the horizontal method, using a seabed crawler. The
decision to undertake bulk sampling is dependent on the outcomes of the previous phase of work, and will
be undertaken in order to determine mining performance characteristics such as mining rate and
metallurgical recovery information that will be used in determining economic viability during feasibility
studies.
SLR Consulting (South Africa) (Pty) Ltd (SLR) has been appointed to undertake the Basic Assessment process
in terms of the NEMA, and in turn have commissioned CapMarine (Pty) Ltd to provide a spatial assessment
on the distribution of commercial fisheries off the West Coast in the vicinity of the sea concession areas.
CapMarine (Pty) Ltd
July 2018
Basic Assessment for a Prospecting Right Application for Offshore Sea Concession 6C West Coast, South Africa 6C
Page 2
Figure 1.1: Location of Sea Concession 6C (Source: De Beers Consolidated Mines (Pty) Ltd).
2. Scope of Work
This specialist report was compiled as a desktop study on behalf of SLR, for their use in preparing a
Basic Assessment Report for the proposed prospecting activities off the South African West Coast.
The following general terms of reference apply to the specialist study:
▪ Provide a description of the existing baseline fisheries characteristics within Sea Concession
6C (distribution of fish stocks and commercial, subsistence and recreational fishing activities).
▪ An introduction presenting a brief background to the study and an appreciation of the
requirements stated in the specific terms of reference for the study.
▪ Details of the approach to the study where activities performed and methods used are
presented.
▪ The specific identified sensitivity of fishing sectors related to the proposed activity.
▪ Map/s superimposing Concession 6C on the spatial distribution of effort expended by each
fishing sector.
▪ Calculation of the proportion of fishing ground that coincides with the proposed affected area.
▪ Assessment of potential impacts on fisheries using prescribed impact rating methodology.
▪ A description of any assumptions made and any uncertainties or gaps in knowledge.
▪ Recommendation of mitigation measures, where appropriate.
CapMarine (Pty) Ltd
July 2018
Basic Assessment for a Prospecting Right Application for Offshore Sea Concession 6C West Coast, South Africa 6C
Page 3
3. Description of the Proposed Project
A phased approach is proposed for the prospecting. The initial phase would involve a regional scale
geophysical survey to identify geological features of interest for further exploration.
3.1 Geophysical Surveys
Various exploration geophysical tools (Error! Reference source not found.) could be deployed from a
fit-for-purpose vessel, including:
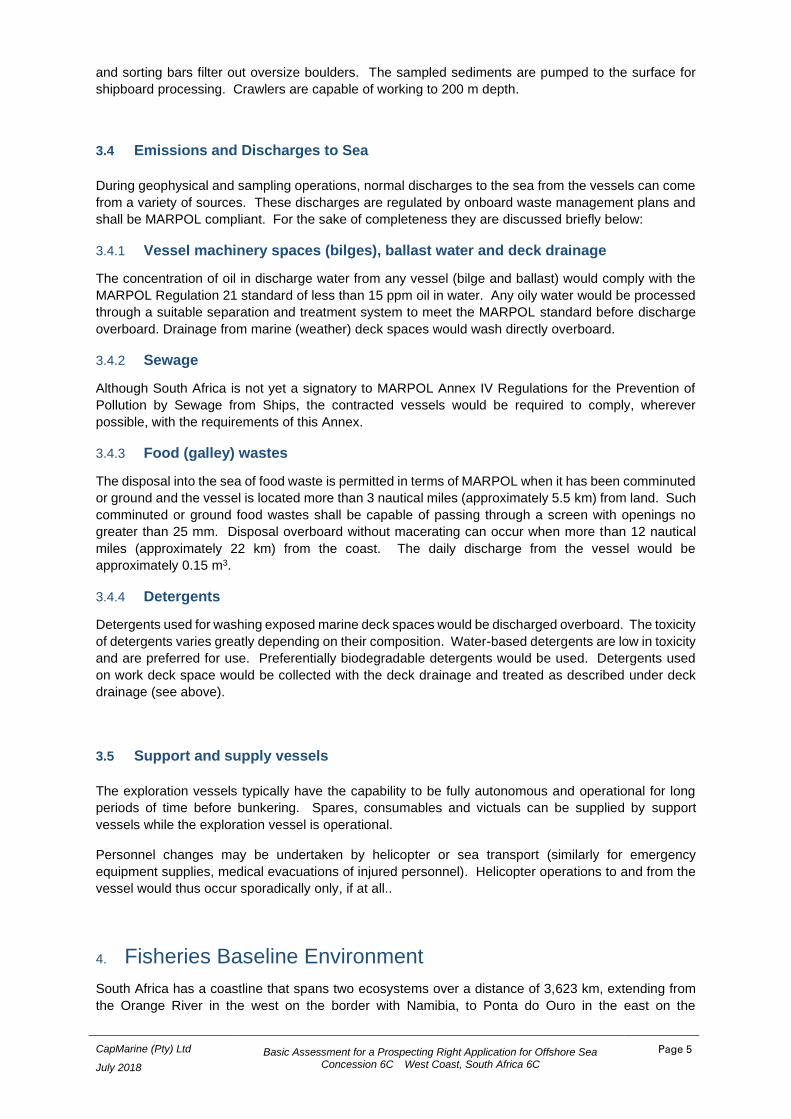
• swathe bathymetry systems, which produces a digital terrain model of the seafloor; backscatter
data may be acquired as part of the process to determine textural models;
• sub-bottom profiler seismic systems, which generate profiles beneath the seafloor to give a
cross section view of the sediment layers;
• side-scan sonar systems, which systems produce acoustic intensity images of the seafloor and
are used to map the different sediment textures from associated lithology of the seafloor; and
• magnetometer surveys, which measures local variations in the intensity of the Earth’s magnetic
fields, which are caused by differences in composition of the sediment layers on or beneath the
seafloor.
Figure 3.1: The geophysical survey techniques employed during Phase I of the proposed prospecting operations would include swath bathymetry (left) and sub-bottom profiling (right).
The line spacing for prospecting would be planned to enable full regional scale seabed coverage.
Sound levels from the acoustic equipment would range from 190 to 242 dB re 1 μPa at 1 m.
Should geological features of interest be identified, a decision regarding the feasibility of proceeding to
Phase 2 of the exploration will be made. During this phase follow-up localised geophysical surveys
would be undertaken, enabling refinement of the definition of the target features. These detailed high
resolution geophysical surveys will utilise similar tools with the likely inclusion of an Autonomous
Underwater Vehicle (AUV), which is typically used for surveying in areas where survey line-spacing is
generally <100 m apart.
3.2 Exploration Sampling
Should survey results indicate resource potential, subsequent exploration sampling to establish the
distribution of diamondiferous material would be undertaken to determine mining performance
characteristics (e.g. mining rate and metallurgical recovery information) that would be used in
CapMarine (Pty) Ltd
July 2018
Basic Assessment for a Prospecting Right Application for Offshore Sea Concession 6C West Coast, South Africa 6C
Page 4
determining economic viability during feasibility studies. Sampling would be undertaken in water depths
ranging from 70 m to 160 m from a sampling vessel of opportunity (e.g. mv The Explorer and/or DBM’s
mv Coral Sea) using a fit-for-purpose tool and taking full advantage of the latest sampling technologies
available. Sampling technologies selected would be appropriate to each target area and based on the
results of the preceding stage. The sampling would likely be divided into stages with reviews and gate
releases.
3.3 Bulk Sampling
Based on the results of the sampling programme, future bulk sampling may also be undertaken.
Should bulk sampling be undertaken, this would be conducted by one of the marine vessels operated
by DBM’s sister company De Beers Marine Namibia (Pty) Ltd, or a similar vessel of opportunity. The
vessels available for bulk sampling adopt either the vertical or horizontal approach (Figure 3.2).
Figure 3.2: Illustration of the current bulk sampling methods that may be used to bulk sample diamond-bearing gravels; a) Vertical method, and b) horizontal method (Source: De Beers Marine).
The vertical method involves a vertically mounted, large-diameter drill-head (currently ranging from 5.2 -
6.8 m in diameter), used to excavate diamond-bearing gravel in a systematic pattern of overlapping
circles in the target area. The drill-head consists of a large-diameter circular disc fitted with wheel
cutters and hardened steel scrapers, and is lowered to the seabed on an extendable pipe ‘drill string’.
Loosened rocks and sediment are fed along a semi-circular channel across the lower surface of the
plate, extracted through a central aperture and pumped to the surface through the drill string for onboard
processing. The drill is capable of penetrating about 2 - 3 m of sediment and partially consolidated
conglomerate or calcareous sandstone in water depths down to 150 m.
The horizontal method involves the use of a track-mounted seabed crawler fitted with highly accurate
acoustic seabed navigation and imaging systems, and equipped with an anterior suction system. The
crawler is lowered to the seabed and is controlled remotely from the surface support vessel through
power and signal umbilical cables. Water jets in the crawler's suction head loosen seabed sediments,
CapMarine (Pty) Ltd
July 2018
Basic Assessment for a Prospecting Right Application for Offshore Sea Concession 6C West Coast, South Africa 6C
Page 5
and sorting bars filter out oversize boulders. The sampled sediments are pumped to the surface for
shipboard processing. Crawlers are capable of working to 200 m depth.
3.4 Emissions and Discharges to Sea
During geophysical and sampling operations, normal discharges to the sea from the vessels can come
from a variety of sources. These discharges are regulated by onboard waste management plans and
shall be MARPOL compliant. For the sake of completeness they are discussed briefly below:
3.4.1 Vessel machinery spaces (bilges), ballast water and deck drainage
The concentration of oil in discharge water from any vessel (bilge and ballast) would comply with the
MARPOL Regulation 21 standard of less than 15 ppm oil in water. Any oily water would be processed
through a suitable separation and treatment system to meet the MARPOL standard before discharge
overboard. Drainage from marine (weather) deck spaces would wash directly overboard.
3.4.2 Sewage
Although South Africa is not yet a signatory to MARPOL Annex IV Regulations for the Prevention of
Pollution by Sewage from Ships, the contracted vessels would be required to comply, wherever
possible, with the requirements of this Annex.
3.4.3 Food (galley) wastes
The disposal into the sea of food waste is permitted in terms of MARPOL when it has been comminuted
or ground and the vessel is located more than 3 nautical miles (approximately 5.5 km) from land. Such
comminuted or ground food wastes shall be capable of passing through a screen with openings no
greater than 25 mm. Disposal overboard without macerating can occur when more than 12 nautical
miles (approximately 22 km) from the coast. The daily discharge from the vessel would be
approximately 0.15 m3.
3.4.4 Detergents
Detergents used for washing exposed marine deck spaces would be discharged overboard. The toxicity
of detergents varies greatly depending on their composition. Water-based detergents are low in toxicity
and are preferred for use. Preferentially biodegradable detergents would be used. Detergents used
on work deck space would be collected with the deck drainage and treated as described under deck
drainage (see above).
3.5 Support and supply vessels
The exploration vessels typically have the capability to be fully autonomous and operational for long
periods of time before bunkering. Spares, consumables and victuals can be supplied by support
vessels while the exploration vessel is operational.
Personnel changes may be undertaken by helicopter or sea transport (similarly for emergency
equipment supplies, medical evacuations of injured personnel). Helicopter operations to and from the
vessel would thus occur sporadically only, if at all..
4. Fisheries Baseline Environment
South Africa has a coastline that spans two ecosystems over a distance of 3,623 km, extending from
the Orange River in the west on the border with Namibia, to Ponta do Ouro in the east on the
CapMarine (Pty) Ltd
July 2018
Basic Assessment for a Prospecting Right Application for Offshore Sea Concession 6C West Coast, South Africa 6C
Page 6
Mozambique border. The western coastal shelf has highly productive commercial fisheries similar to
other upwelling ecosystems around the world, while the East Coast is considerably less productive but
has high species diversity, including both endemic and Indo-Pacific species. South Africa’s fisheries
are regulated and monitored by the Department of Agriculture, Forestry and Fisheries (DAFF) and are
managed either as commercial, small-scale or recreational sector. All fisheries in South Africa, as well
as the processing, sale in and trade of almost all marine resources, are regulated under the Marine
Living Resources Act, 1998 (No. 18 of 1998) (MLRA).
Approximately 14 different commercial fisheries sectors currently operate within South African waters.
Table 4.1 lists these along with ports and regions of operation, catch landings and number of active
vessels and rights holders (2016). Figure 4.1 shows the proportional volume of catch landed by each
of these sectors (2016). Primary fisheries in terms of economic value and overall tonnage of landings
are the demersal (bottom) trawl and long-line fisheries targeting the Cape hakes (Merluccius paradoxus
and M. capensis) and the pelagic-directed purse-seine fishery targeting pilchard (Sardinops sagax),
yellowtail (Seriola lalandi) and other reef fish. Crustacean fisheries comprise a trap and hoop net fishery
targeting West Coast rock lobster (Jasus lalandii), a line trap fishery targeting the South Coast rock
lobster (Palinurus gilchristi) and a trawl fishery based solely on the East Coast targeting penaeid
prawns, langoustines (Metanephrops andamanicus and Nephropsis stewarti), deep-water rock lobster
(Palinurus delagoae) and red crab (Chaceon macphersoni). Other fisheries include a mid-water trawl
fishery targeting horse mackerel (Trachurus trachurus capensis) predominantly on the Agulhas Bank,
South Coast and a hand-jig fishery targeting chokka squid
(Loligo vulgaris reynaudii) exclusively on the South Coast. In
addition to commercial sectors, recreational fishing occurs
along the coastline comprising shore angling and small, open
boats generally less than 10 m in length. The commercial and
recreational fisheries are reported to catch over 250 marine
species, although fewer than 5% of these are actively
targeted by commercial fisheries, which comprise 90% of
landed catch.
Figure 4.1: Pie chart showing percentage of landings by weight of each commercial fishery sector as a contribution to the landings for all commercial fisheries sectors combined (2016).
Most commercial fish landings must take place at designated fishing harbours. For the larger industrial
vessels targeting hake, only the major ports of Saldanha Bay, Cape Town, Mossel Bay and Port
Elizabeth are used. On the West Coast, St. Helena Bay and Saldanha Bay are the main landing sites
for the small pelagic fleets. These ports also have significant infrastructure for the processing of anchovy
into fishmeal as well as canning of sardine. Smaller fishing harbours on the West / South-West Coast
include Port Nolloth, Hondeklip and Laaiplek, Hout Bay and Gansbaai harbours. On the East Coast,
Durban and Richards Bay are deployment ports for the crustacean trawl and large pelagic longline
sectors. There are more than 230 small-scale fishing communities on the South African coastline,
ranging in size from small villages to towns (DAFF, 2016).
Only the sectors operational on the West Coast will be further described in the current report.
Small pelagic purse-seine
63%
Demersal trawl29%
CapMarine (Pty) Ltd
Error! Unknown document property name.
Basic Assessment for a Prospecting Right Application for Offshore Sea Concession 6C West Coast, South Africa
Page 7
Table 4.1: South African offshore commercial fishing sectors, base ports, areas of operation, landed catch, number of active vessels and rights holders by sector (Source: DAFF).
Sector Areas of Operation Main Ports in Priority No. of
Vessels
Rights Holders
(2016)
Landed
Catch (2016)
Target Species
Small pelagic purse-seine West Coast, South Coast St Helena Bay, Saldanha, Hout
South coast rock lobster South Coast Cape Town, Port Elizabeth 12 13 735 t Palinurus gilchristi
West coast rock lobster West Coast Hout Bay, Kalk Bay, St Helena 105 240 1 033 t Jasus lalandii
KwaZulu-Natal prawn trawl East Coast Durban, Richards Bay 5 6 181 t Tiger prawn (Panaeus monodon), white prawn
(Fenneropenaeus indicus), brown prawn (Metapenaeus
monoceros), pink prawn (Haliporoides triarthrus)
Squid jig South Coast Port Elizabeth, Port St Francis 138 92 8 500 t Squid/chokka (Loligo vulgaris reynaudii)
Gillnet West Coast False Bay to Port Nolloth N/a 162 634 t
Beach seine West, South, East Coast N/a N/a 28 1 600 t
Seaweeds West, South, East Coast N/a N/a 14 6 172 t Mixed beach-cast seaweeds including kelp, Gelidium spp and
Gracilaria spp
Abalone West Coat N/a N/a N/a 86 t Haliotis midae
CapMarine (Pty) Ltd
Error! Unknown document property name.
Basic Assessment for a Prospecting Right Application for Offshore Sea Concession 6C West Coast, South Africa
Page 8
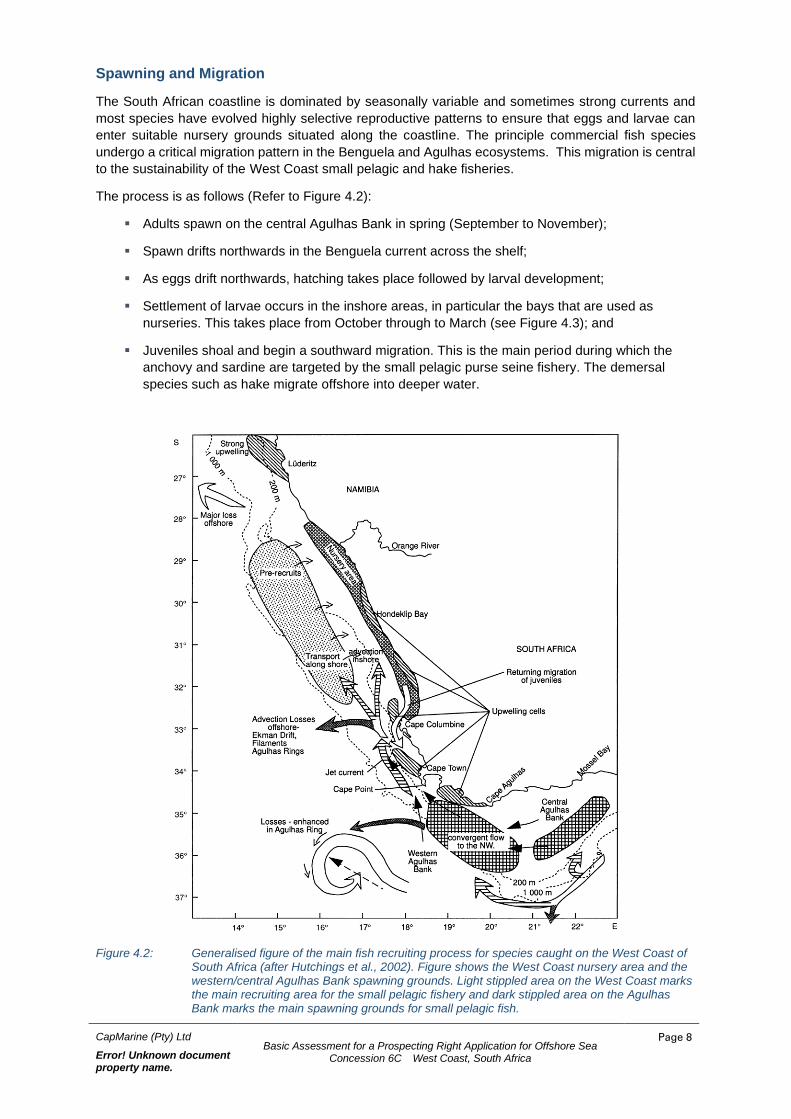
Spawning and Migration
The South African coastline is dominated by seasonally variable and sometimes strong currents and
most species have evolved highly selective reproductive patterns to ensure that eggs and larvae can
enter suitable nursery grounds situated along the coastline. The principle commercial fish species
undergo a critical migration pattern in the Benguela and Agulhas ecosystems. This migration is central
to the sustainability of the West Coast small pelagic and hake fisheries.
The process is as follows (Refer to Figure 4.2):
▪ Adults spawn on the central Agulhas Bank in spring (September to November);
▪ Spawn drifts northwards in the Benguela current across the shelf;
▪ As eggs drift northwards, hatching takes place followed by larval development;
▪ Settlement of larvae occurs in the inshore areas, in particular the bays that are used as
nurseries. This takes place from October through to March (see Figure 4.3); and
▪ Juveniles shoal and begin a southward migration. This is the main period during which the
anchovy and sardine are targeted by the small pelagic purse seine fishery. The demersal
species such as hake migrate offshore into deeper water.
Figure 4.2: Generalised figure of the main fish recruiting process for species caught on the West Coast of South Africa (after Hutchings et al., 2002). Figure shows the West Coast nursery area and the western/central Agulhas Bank spawning grounds. Light stippled area on the West Coast marks the main recruiting area for the small pelagic fishery and dark stippled area on the Agulhas Bank marks the main spawning grounds for small pelagic fish.
CapMarine (Pty) Ltd
July 2018
Basic Assessment for a Prospecting Right Application for Offshore Sea Concession 6C West Coast, South Africa 6C
Page 9
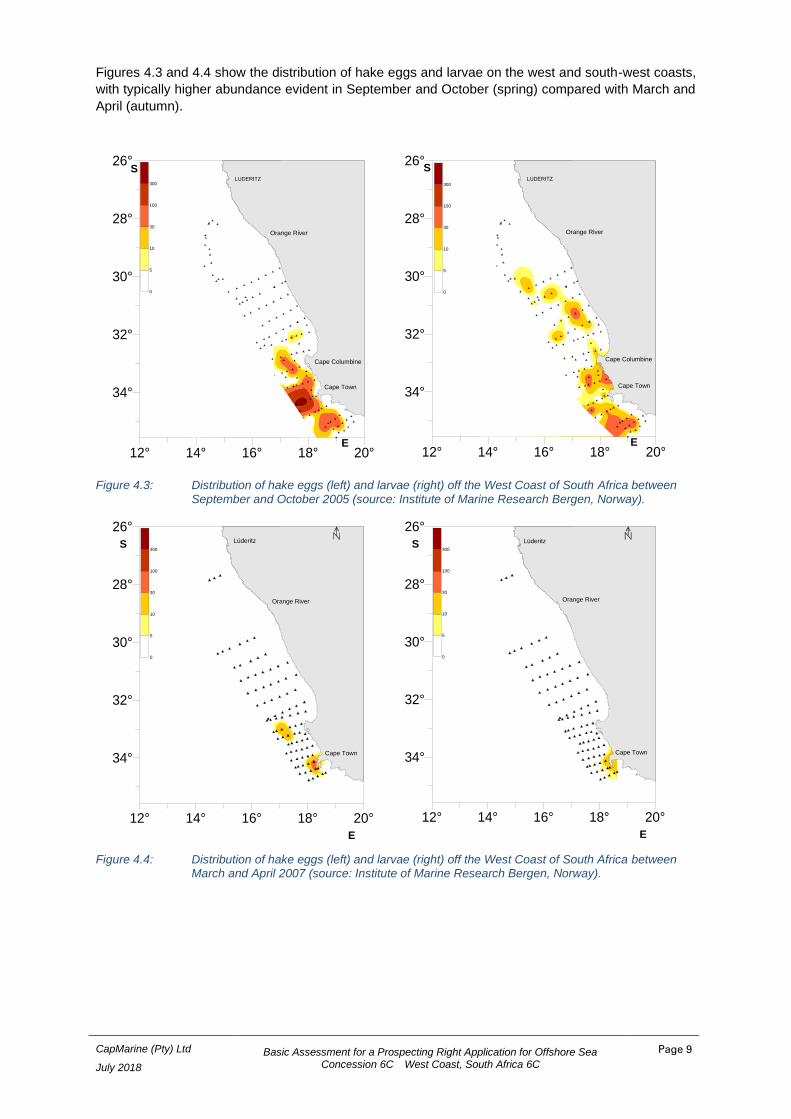
Figures 4.3 and 4.4 show the distribution of hake eggs and larvae on the west and south-west coasts,
with typically higher abundance evident in September and October (spring) compared with March and
April (autumn).
Figure 4.3: Distribution of hake eggs (left) and larvae (right) off the West Coast of South Africa between
September and October 2005 (source: Institute of Marine Research Bergen, Norway).
Figure 4.4: Distribution of hake eggs (left) and larvae (right) off the West Coast of South Africa between March and April 2007 (source: Institute of Marine Research Bergen, Norway).
12° 14° 16° 18° 20°
34°
32°
30°
28°
26°LUDERITZ
S
E
Orange River
Cape Columbine
Cape Town
0
5
10
30
100
300
12° 14° 16° 18° 20°
34°
32°
30°
28°
26°LUDERITZ
S
E
Orange River
Cape Columbine
Cape Town
0
5
10
30
100
300
12° 14° 16° 18° 20°
34°
32°
30°
28°
26°
S
E
Orange River
Cape Town
Lüderitz
0
5
10
30
100
300
12° 14° 16° 18° 20°
34°
32°
30°
28°
26°
S
E
Orange River
Cape Town
Lüderitz
0
5
10
30
100
300
CapMarine (Pty) Ltd
July 2018
Basic Assessment for a Prospecting Right Application for Offshore Sea Concession 6C West Coast, South Africa 6C
Page 10
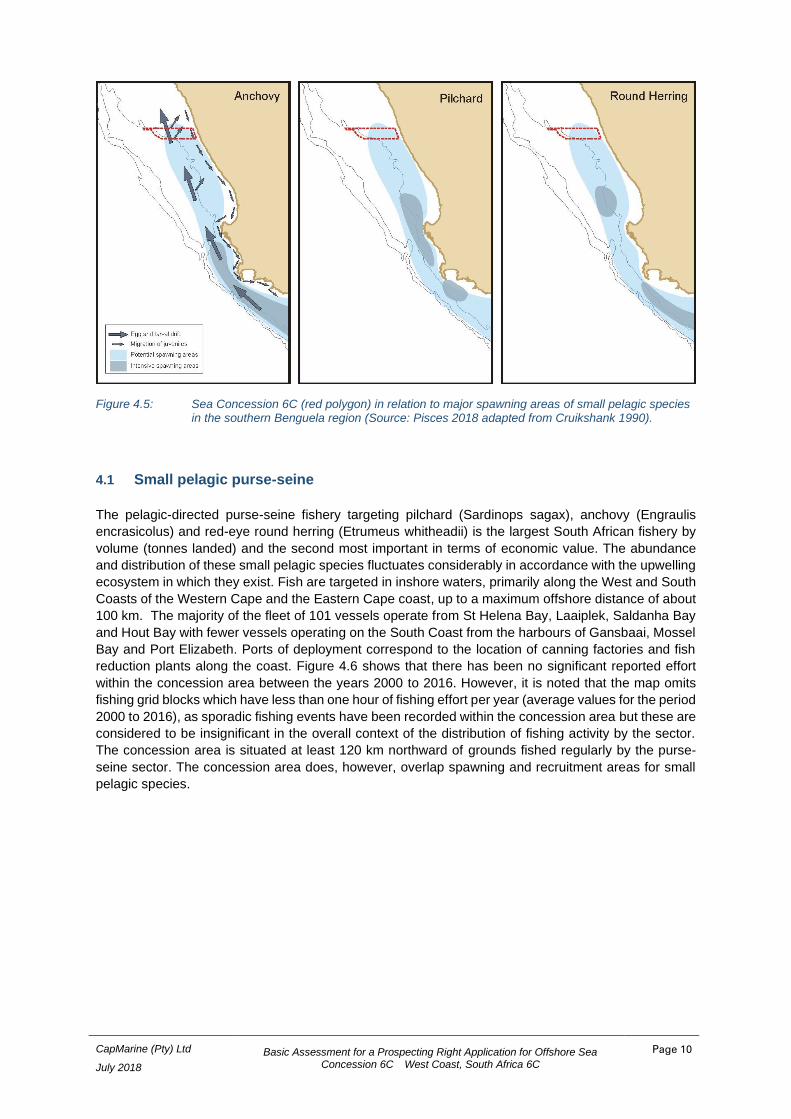
Figure 4.5: Sea Concession 6C (red polygon) in relation to major spawning areas of small pelagic species in the southern Benguela region (Source: Pisces 2018 adapted from Cruikshank 1990).
4.1 Small pelagic purse-seine
The pelagic-directed purse-seine fishery targeting pilchard (Sardinops sagax), anchovy (Engraulis
encrasicolus) and red-eye round herring (Etrumeus whitheadii) is the largest South African fishery by
volume (tonnes landed) and the second most important in terms of economic value. The abundance
and distribution of these small pelagic species fluctuates considerably in accordance with the upwelling
ecosystem in which they exist. Fish are targeted in inshore waters, primarily along the West and South
Coasts of the Western Cape and the Eastern Cape coast, up to a maximum offshore distance of about
100 km. The majority of the fleet of 101 vessels operate from St Helena Bay, Laaiplek, Saldanha Bay
and Hout Bay with fewer vessels operating on the South Coast from the harbours of Gansbaai, Mossel
Bay and Port Elizabeth. Ports of deployment correspond to the location of canning factories and fish
reduction plants along the coast. Figure 4.6 shows that there has been no significant reported effort
within the concession area between the years 2000 to 2016. However, it is noted that the map omits
fishing grid blocks which have less than one hour of fishing effort per year (average values for the period
2000 to 2016), as sporadic fishing events have been recorded within the concession area but these are
considered to be insignificant in the overall context of the distribution of fishing activity by the sector.
The concession area is situated at least 120 km northward of grounds fished regularly by the purse-
seine sector. The concession area does, however, overlap spawning and recruitment areas for small
pelagic species.
CapMarine (Pty) Ltd
July 2018
Basic Assessment for a Prospecting Right Application for Offshore Sea Concession 6C West Coast, South Africa 6C
Page 11
Figure 4.6: Spatial distribution of fishing grounds of the small pelagic purse-seine sector in relation to the location of Sea Concession 6C. Fishing activity is reported by 10 x 10 nautical minute grid block and average annual effort is shown for the period 2000 to 2016. Bathymetric contours are shown
for 200m, 500m and 2000m.
4.2 Demersal trawl
South Africa’s primary fisheries in terms of highest economic value are the trawl and long-line sectors
targeting Cape hakes (Merluccius paradoxus and M. capensis). Secondary species include a large
assemblage of demersal fish of which monkfish (Lophius vomerinus), kingklip (Genypterus capensis)
and snoek (Thyrsites atun) are the most commercially important. The demersal trawl fishery comprises
an offshore and inshore fleet, which differ primarily in terms of vessel capacity and the areas in which
they operate. Approximately 45 offshore vessels operate from most major harbours on both the West
and South Coasts. Trawlers target fish at an approximate depth range of 300 m to 1 000 m with fishing
grounds extending in an almost continuous band along the shelf edge from the Namibian maritime
border in the north to Port Elizabeth in the East. The inshore fleet comprises approximately 30 vessels
which operate off the South Coast from the harbours of Mossel Bay and Port Elizabeth. Inshore grounds
are located on the Agulhas Bank and extend eastward towards the Great Kei River. Sole is targeted at
a water depth range of between 50 m and 80 m, while hake is targeted at depths of between 100 m
and 160 m.
Figure 4.164.7a and b show the demersal trawling grounds in relation to Concession 6c. The Deepsea
Trawling Industry Association (SADSTIA) has implemented a self-imposed restriction which confines
fishing effort to a designated area (“the historical footprint of the fishery”). This spatial restriction is also
written into the permit conditions for the fishery. In the vicinity of the concession area, demersal trawling
is centred along the 500 m bathymetric contour but ranges to 300 m and to 200 m in places (e.g. around
Child’s Bank submarine canyon). There is no direct overlap between trawling grounds and Concession
6C, which is situated at least 30 km from the designated footprint of trawling ground. The concession
area does, however, coincide with spawning and recruitment areas for hake and other demersal
species.
CapMarine (Pty) Ltd
July 2018
Basic Assessment for a Prospecting Right Application for Offshore Sea Concession 6C West Coast, South Africa 6C
Page 12
Figure 4.7a: Spatial distribution of fishing grounds of the demersal trawl sector in relation to the location of Sea Concession 6C. Fishing activity is shown at a grid block resolution of 5 x 5 nautical minutes and average annual effort is shown for the period 2008 to 2016. Bathymetric contours are shown
for 200m, 500m and 2000m.
Figure 4.8b: Spatial distribution of fishing grounds of the demersal trawl sector in relation to the location of Sea Concession 6C. Fishing activity is shown at a grid block resolution of 5 x 5 nautical minutes
and average annual effort is shown for the period 2008 to 2016.
CapMarine (Pty) Ltd
July 2018
Basic Assessment for a Prospecting Right Application for Offshore Sea Concession 6C West Coast, South Africa 6C
Page 13
4.3 Demersal longline
Like the demersal trawl fishery, the target species of the longline fishery is the Cape hakes, with a small
amount of non-targeted commercial by-catch. Currently 64 hake-directed vessels are active within the
fishery, most of which operate from the harbours of Cape Town and Hout Bay. The targeting of demersal
sharks (soupfin and smoothhound shark) by longline is managed as a separate sector.
A demersal long-line vessel may deploy either a double or single line which is weighted along its length
to keep it close to the seafloor. Steel anchors, of 40 kg to 60 kg, are placed at the ends of each line to
anchor it, and are marked with an array of floats. If a double line system is used, top and bottom lines
are connected by means of dropper lines. Since the top-line (polyethylene, 10 – 16 mm diameter) is
more buoyant than the bottom line, it is raised off the seafloor and minimizes the risk of snagging or
fouling. The purpose of the top-line is to aid in gear retrieval if the bottom line breaks at any point along
the length of the line. Lines are typically between 10 km and 20 km in length, carrying between 6 900
and 15 600 hooks each. Baited hooks are attached to the bottom line at regular intervals (1 to 1.5 m)
by means of a snood. Gear is usually set at night at a speed of between five and nine knots. Once
deployed the line is left to soak for up to eight hours before it is retrieved. A line hauler is used to
retrieve gear (at a speed of approximately one knot) and can take six to ten hours to complete. Long-
line vessels vary in length from 18 m to 50 m and remain at sea for four to seven days at a time.
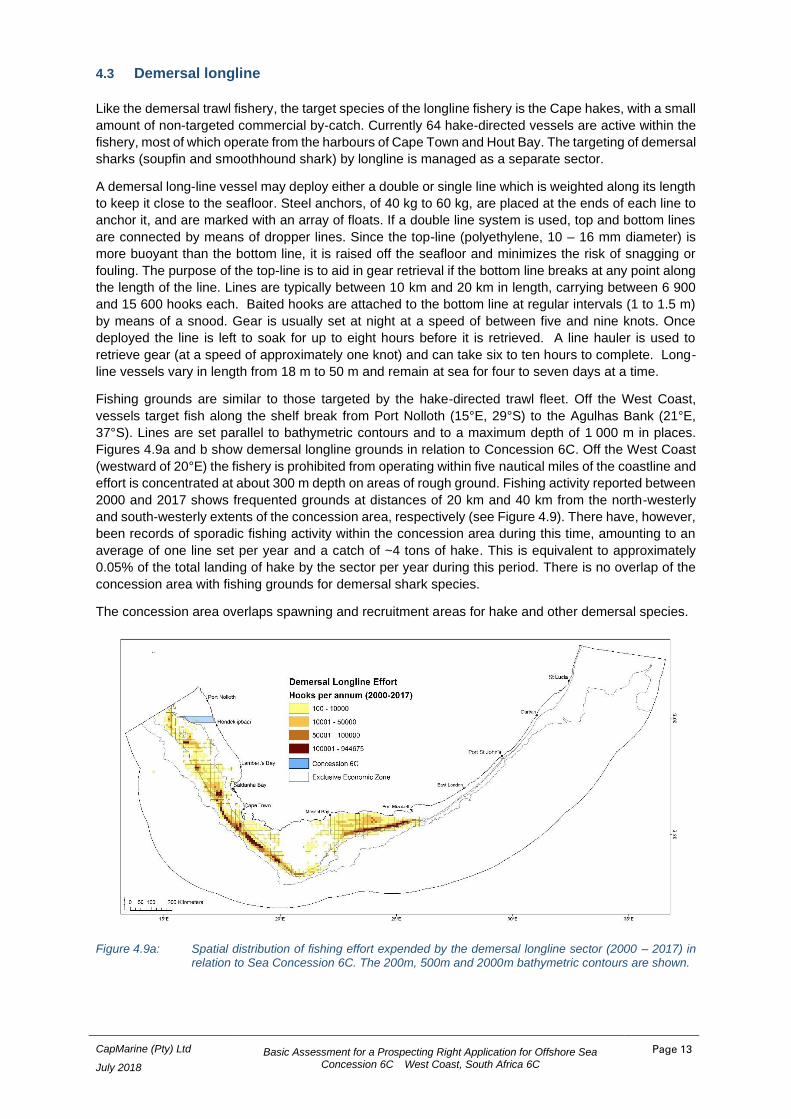
Fishing grounds are similar to those targeted by the hake-directed trawl fleet. Off the West Coast,
vessels target fish along the shelf break from Port Nolloth (15°E, 29°S) to the Agulhas Bank (21°E,
37°S). Lines are set parallel to bathymetric contours and to a maximum depth of 1 000 m in places.
Figures 4.9a and b show demersal longline grounds in relation to Concession 6C. Off the West Coast
(westward of 20°E) the fishery is prohibited from operating within five nautical miles of the coastline and
effort is concentrated at about 300 m depth on areas of rough ground. Fishing activity reported between
2000 and 2017 shows frequented grounds at distances of 20 km and 40 km from the north-westerly
and south-westerly extents of the concession area, respectively (see Figure 4.9). There have, however,
been records of sporadic fishing activity within the concession area during this time, amounting to an
average of one line set per year and a catch of ~4 tons of hake. This is equivalent to approximately
0.05% of the total landing of hake by the sector per year during this period. There is no overlap of the
concession area with fishing grounds for demersal shark species.
The concession area overlaps spawning and recruitment areas for hake and other demersal species.
Figure 4.9a: Spatial distribution of fishing effort expended by the demersal longline sector (2000 – 2017) in relation to Sea Concession 6C. The 200m, 500m and 2000m bathymetric contours are shown.
CapMarine (Pty) Ltd
July 2018
Basic Assessment for a Prospecting Right Application for Offshore Sea Concession 6C West Coast, South Africa 6C
Page 14
Figure 4.10b: Spatial distribution of fishing effort expended by the demersal longline sector (2000 – 2017) in relation to Sea Concession 6C. Bathymetric contours are shown at depth intervals of 100m from 100m to 1000m.
4.4 Large pelagic longline
Migratory tuna are caught on the high seas and seasonally within the South African Exclusive Economic
Zone (EEZ) by longline and pole fisheries. Targeted species include albacore (Thunnus alalunga),
bigeye tuna (T. obesus), yellowfin tuna (T. albacares) and swordfish (Xiphias gladius). Since tuna, tuna-
like species and billfishes are migratory stocks, they are managed as a shared resource amongst
various countries under the jurisdiction of the International Commission for the Conservation of Atlantic
Tunas (ICCAT) and the Indian Ocean Tuna Commission (IOTC). In the 1970s to mid-1990s the fishery
was exclusively operated by Asian fleets (up to 130 vessels) under bilateral agreements with South
Africa. From the early 1990s these vessels were banned from South African waters and South Africa
went through a period of low fishing activity as fishing rights issues were resolved. Thereafter a domestic
fishery developed and 50 fishing rights were allocated to South African companies only. Rights holders
now include a small fleet of local longliners although the fishery is still undertaken primarily with
Japanese vessels fishing in joint ventures with South African companies. There are currently 30
commercial large pelagic fishing rights issued and 21 active vessels. The fishery operates extensively
within the South African EEZ, primarily along the continental shelf break and further offshore.
Figure 4.10 shows the spatial distribution of fishing activity in the South African EEZ and in relation to
Concession 6C. Vessels operate predominantly from the shelf break and into deeper waters and are
prohibited from operating within 12 nm of the coastline (or within 20 nm of the coastline off KwaZulu-
Natal). In the vicinity of Concession 6C, vessels operate along and offshore of the 500 m depth contour,
which is situated about 90 km offshore of the concession area (see Figure 4.11). There is no direct
overlap of the concession area with either fishing ground or spawning and recruitment areas of large
pelagic species.
CapMarine (Pty) Ltd
July 2018
Basic Assessment for a Prospecting Right Application for Offshore Sea Concession 6C West Coast, South Africa 6C
Page 15
Figure 4.11: Spatial distribution of fishing grounds of the large pelagic longline sector in relation to the location of Sea Concession 6C. Fishing activity is shown at a grid block resolution of 60 x 60 nautical minutes (due to the spatial extent covered by drifting longline gear) and average annual effort is shown for the period 2000 to 2016. The bathymetric contours shown are 200m, 500m and 2000m.
Figure 4.12: Spatial distribution of fishing positions recorded between 2006 and 2016 by the South African large pelagic longline sector in relation to Sea Concession 6C. Bathymetric contours are shown at depth intervals of 100m depth from 100m to 1000m.
CapMarine (Pty) Ltd
July 2018
Basic Assessment for a Prospecting Right Application for Offshore Sea Concession 6C West Coast, South Africa 6C
Page 16
4.5 Tuna pole
Poling for tuna is predominantly based on the southern Atlantic longfin tuna stock also referred to as
albacore (T. alalunga). Other catch species include yellowfin tuna, bigeye tuna, skipjack tuna
(Katsuwonus pelamis), snoek and yellowtail. The South African fleet is currently comprised of 128
vessels based at the ports of Cape Town, Hout Bay and Saldanha Bay. Fishing occurs along the entire
West Coast, along the shelf break and beyond the 200 m isobath. Targeted fishing areas are situated
north of Cape Columbine and between 60 km and 120 km offshore from Saldanha Bay and the Cape
Canyon. Within southern Namibian waters albacore is targeted at Tripp Seamount, located south of
Lüderitz. The fishery is seasonal with vessels active predominantly between November and May and
peak catches recorded from November to January. Effort fluctuates according to the availability of fish
in the area, but once a shoal of tuna is located a number of vessels will move into the area and target
a single shoal which may remain in the area for days at a time.
Figure 4.12 shows the spatial distribution of fishing activity off the West Coast of South Africa and in
relation to Concession 6C. Although the main targeted fishing grounds off the West Coast are situated
south of the concession area, there are records of fishing activity which coincide with the north-western
extent of the concession area which is most likely due to vessels fishing en route to favoured grounds
off Tripp Seamount on the Namibian side of the maritime border. Over the period 2007 to 2016, 32
fishing events were reported within the concession area (this is comparable to 32 days of fishing effort)
with a cumulative catch of 58.3 tons of albacore over this period. This amounts to 5.8 tons per year
which is equivalent to 0.2% of the total albacore landed by the sector (nationally) over this period. There
is no expected overlap of the concession area with spawning and recruitment areas of large pelagic
species.
Figure 4.13: Spatial distribution of fishing grounds of the tuna pole sector in relation to the location of Sea Concession 6C. Fishing activity is shown at a grid block resolution of 60 x 60 nautical minutes and average annual effort is shown for the period 2007 to 2016. The bathymetric contours shown are 200m, 500m and 2000m.
CapMarine (Pty) Ltd
July 2018
Basic Assessment for a Prospecting Right Application for Offshore Sea Concession 6C West Coast, South Africa 6C
Page 17
4.6 Traditional line fishery
The linefishery is divided into the commercial and recreational sectors, with the subsistence sector now
falling under the classification of small-scale fishing. The commercial (or traditional) line fishery is the
country’s third most important fishery in terms of total tons landed and economic value. It is a long-
standing, nearshore fishery based on a large assemblage of different species. Within the Western Cape
the predominant catch species is snoek (Thyrsites atun) while other species such as Cape bream
and yellowtail (Seriola lalandi) are also important. Towards the East Coast the number of catch species
increases and includes resident reef fish (Sparidae and Serranidae), pelagic migrants (Carangidae and
Scombridae) and demersal migrants (Sciaenidae and Sparidae). The fishery operates along almost the
entire coastline (excluding certain protected areas) from Port Nolloth on the West Coast to Cape Vidal
on the East Coast (see Figure 4.13). Effort is managed geographically with the spatial effort of the
fishery divided into three zones. Most of the catch (up to 95%) is landed by the Cape commercial fishery,
which operates on the continental shelf from the Namibian border on the West Coast to the Kei River
in the Eastern Cape. Sea Concession 6C coincides with linefish management Zone A which extends
from the Namibian border to Cape Infanta. Fishing vessels generally range up to a maximum offshore
distance of about 70 km, although fishing at this outer limit and beyond is sporadic (C. Wilke, pers.
comm).
The traditional line fishery is defined by the use of a simple hook-and-line fishing system (excluding the
use of longlines and drumlines), with a limit of 10 hooks per line (DAFF 2017). There are 450 vessels
operating in the fishery, making it the largest fishing fleet in South Africa. Vessels are monitored by
Vessel Monitoring System (VMS) and permit conditions require that catch be reported for each fishing
trip; however, logbook data are unverified and may underestimate total landings (da Silva et al., 2015).
The recreational line fishery includes shore- and boat-based fishing with the predominant use of rod
and line. An estimated 500 000 participants are active in the recreational sector (Griffiths and Lamberth,
2002). Community-based fishing of linefish species for subsistence purposes is now managed under
South Africa’s small-scale fishery policy which was implemented in 2016 (DAFF 2016).
Figure 4.14: Spatial distribution of fishing effort expended by the South African traditional linefish sector (2000 – 2016) in relation to Sea Concession 6C. The bathymetric contours shown are 200m, 500m and
2000m.
CapMarine (Pty) Ltd
July 2018
Basic Assessment for a Prospecting Right Application for Offshore Sea Concession 6C West Coast, South Africa 6C
Page 18
Fishing activity is reported by landing point. In the vicinity of Sea Concession 6C, Hondeklipbaai is the
closest landing point. Over the period 2000 to 2016, an average of 182 kg per year were reported for
the area. Over the same period 2.5 tons of catch was reported for fishing positions in the vicinity of Port
Nolloth, situated 70 km northward of the concession area. The combined catch at Hondeklipbaai and
Port Nolloth is equivalent to ~ 0.03% of the overall national landings of the sector. The reporting of
fishing positions is not specific, but generally reported according to reference positions for different
areas. It is assumed that fishing could take place across the extent of Sea Concession 6C.
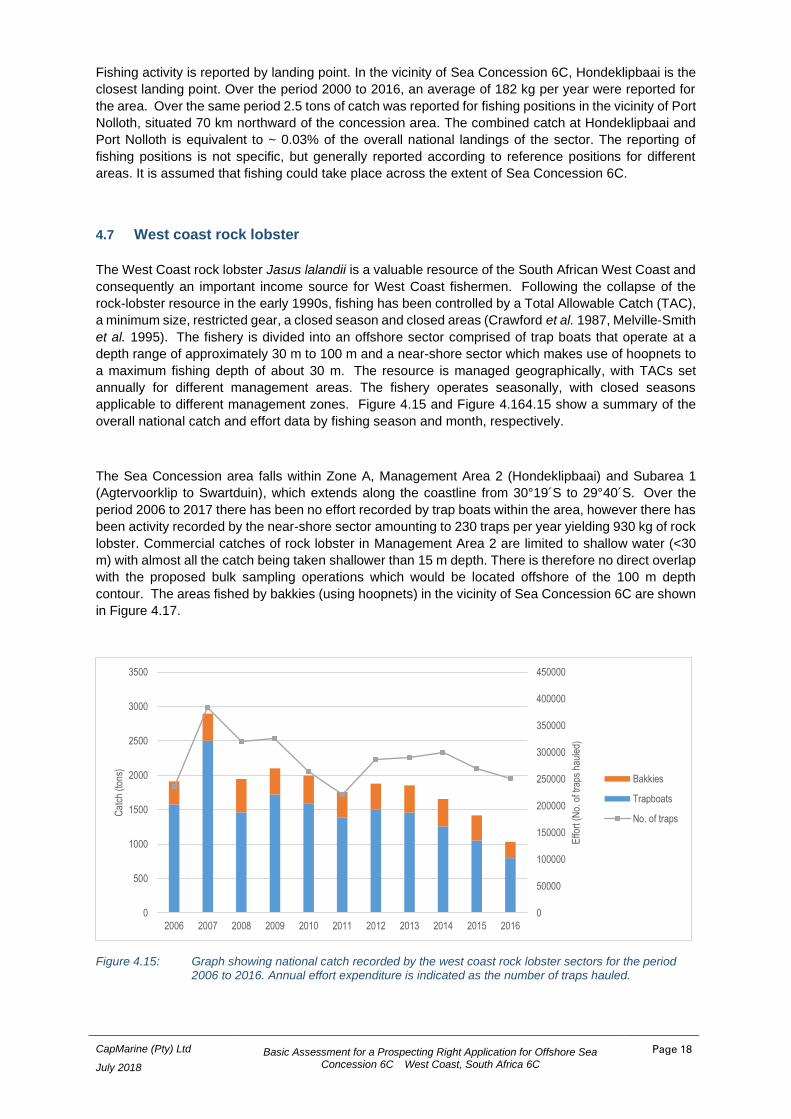
4.7 West coast rock lobster
The West Coast rock lobster Jasus lalandii is a valuable resource of the South African West Coast and
consequently an important income source for West Coast fishermen. Following the collapse of the
rock-lobster resource in the early 1990s, fishing has been controlled by a Total Allowable Catch (TAC),
a minimum size, restricted gear, a closed season and closed areas (Crawford et al. 1987, Melville-Smith
et al. 1995). The fishery is divided into an offshore sector comprised of trap boats that operate at a
depth range of approximately 30 m to 100 m and a near-shore sector which makes use of hoopnets to
a maximum fishing depth of about 30 m. The resource is managed geographically, with TACs set
annually for different management areas. The fishery operates seasonally, with closed seasons
applicable to different management zones. Figure 4.15 and Figure 4.164.15 show a summary of the
overall national catch and effort data by fishing season and month, respectively.
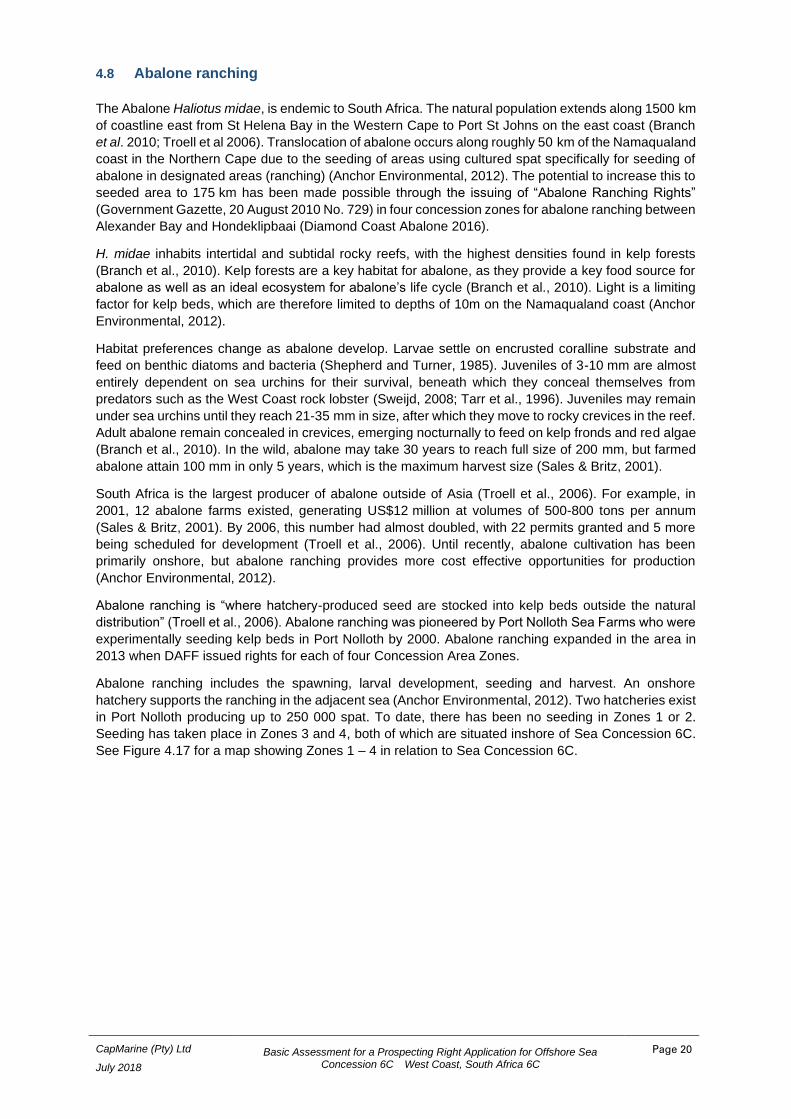
The Sea Concession area falls within Zone A, Management Area 2 (Hondeklipbaai) and Subarea 1
(Agtervoorklip to Swartduin), which extends along the coastline from 30°19´S to 29°40´S. Over the
period 2006 to 2017 there has been no effort recorded by trap boats within the area, however there has
been activity recorded by the near-shore sector amounting to 230 traps per year yielding 930 kg of rock
lobster. Commercial catches of rock lobster in Management Area 2 are limited to shallow water (<30
m) with almost all the catch being taken shallower than 15 m depth. There is therefore no direct overlap
with the proposed bulk sampling operations which would be located offshore of the 100 m depth
contour. The areas fished by bakkies (using hoopnets) in the vicinity of Sea Concession 6C are shown
in Figure 4.17.
Figure 4.15: Graph showing national catch recorded by the west coast rock lobster sectors for the period 2006 to 2016. Annual effort expenditure is indicated as the number of traps hauled.
Basic Assessment for a Prospecting Right Application for Offshore Sea Concession 6C West Coast, South Africa 6C
Page 19
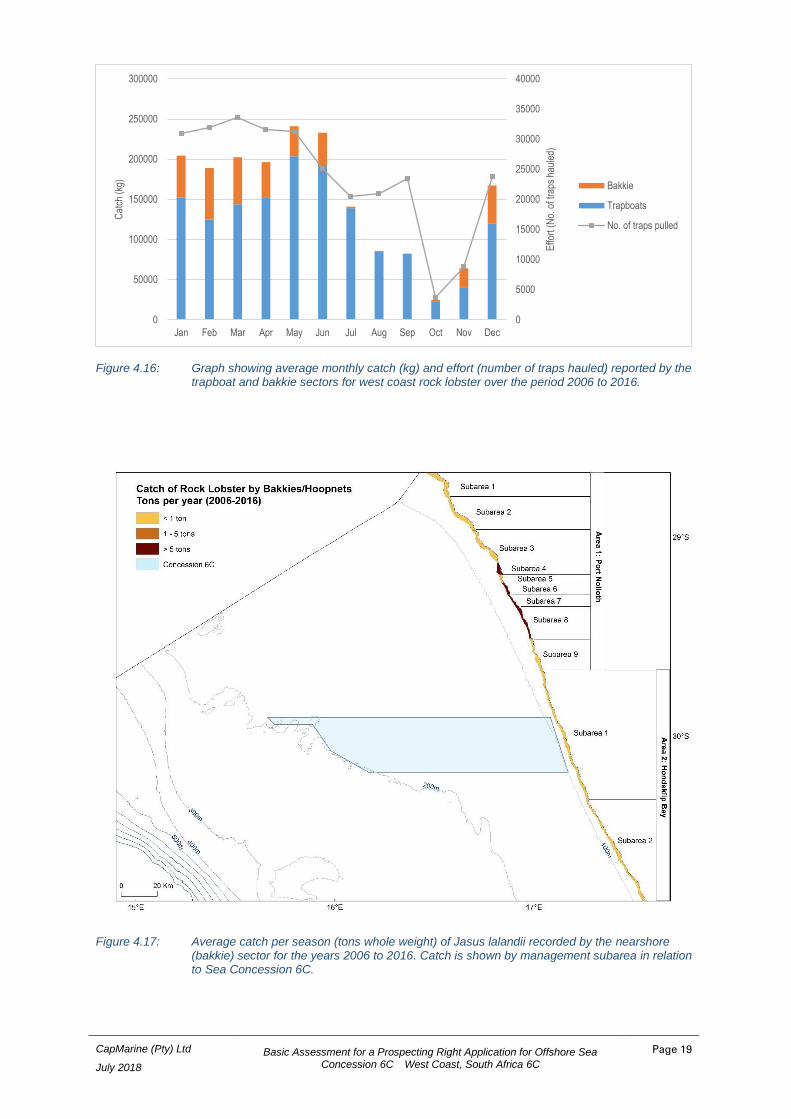
Figure 4.16: Graph showing average monthly catch (kg) and effort (number of traps hauled) reported by the trapboat and bakkie sectors for west coast rock lobster over the period 2006 to 2016.
Figure 4.17: Average catch per season (tons whole weight) of Jasus lalandii recorded by the nearshore (bakkie) sector for the years 2006 to 2016. Catch is shown by management subarea in relation to Sea Concession 6C.
0
5000
10000
15000
20000
25000
30000
35000
40000
0
50000
100000
150000
200000
250000
300000
Jan Feb Mar Apr May Jun Jul Aug Sep Oct Nov Dec
Effo
rt (
No.
of t
raps
hau
led)
Cat
ch (
kg)
Bakkie
Trapboats
No. of traps pulled
CapMarine (Pty) Ltd
July 2018
Basic Assessment for a Prospecting Right Application for Offshore Sea Concession 6C West Coast, South Africa 6C
Page 20
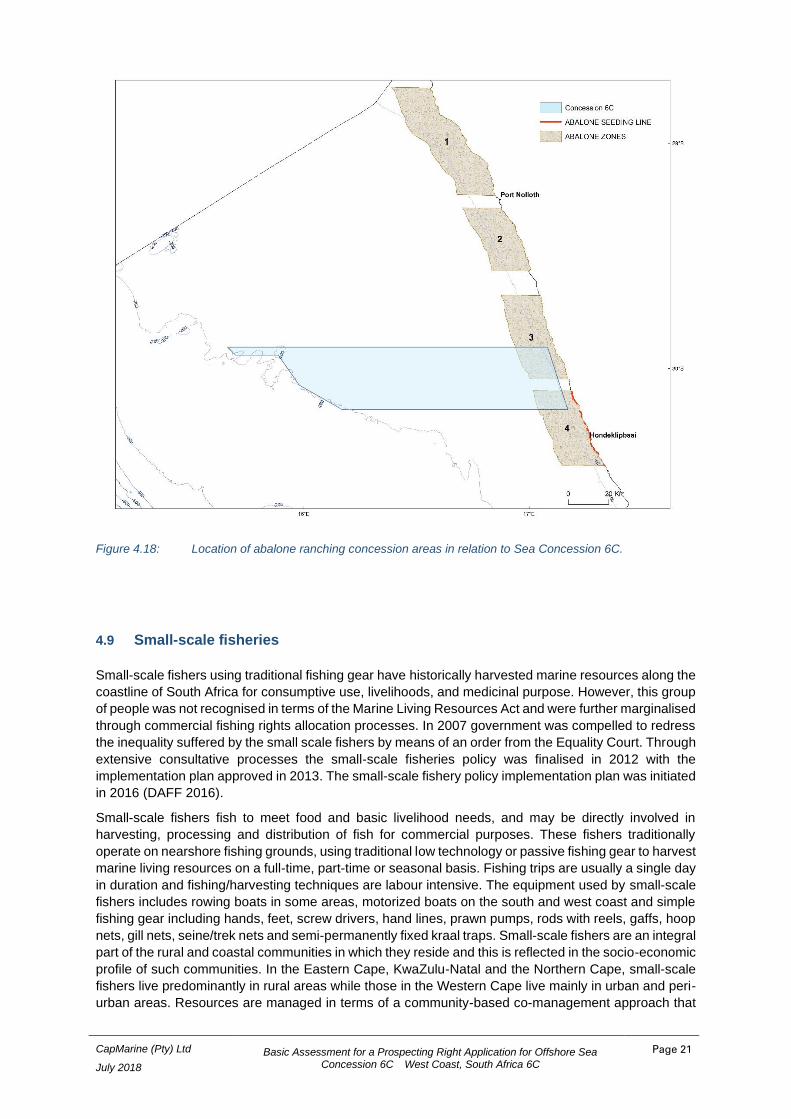
4.8 Abalone ranching
The Abalone Haliotus midae, is endemic to South Africa. The natural population extends along 1500 km
of coastline east from St Helena Bay in the Western Cape to Port St Johns on the east coast (Branch
et al. 2010; Troell et al 2006). Translocation of abalone occurs along roughly 50 km of the Namaqualand
coast in the Northern Cape due to the seeding of areas using cultured spat specifically for seeding of
abalone in designated areas (ranching) (Anchor Environmental, 2012). The potential to increase this to
seeded area to 175 km has been made possible through the issuing of “Abalone Ranching Rights”
(Government Gazette, 20 August 2010 No. 729) in four concession zones for abalone ranching between
Alexander Bay and Hondeklipbaai (Diamond Coast Abalone 2016).
H. midae inhabits intertidal and subtidal rocky reefs, with the highest densities found in kelp forests
(Branch et al., 2010). Kelp forests are a key habitat for abalone, as they provide a key food source for
abalone as well as an ideal ecosystem for abalone’s life cycle (Branch et al., 2010). Light is a limiting
factor for kelp beds, which are therefore limited to depths of 10m on the Namaqualand coast (Anchor
Environmental, 2012).
Habitat preferences change as abalone develop. Larvae settle on encrusted coralline substrate and
feed on benthic diatoms and bacteria (Shepherd and Turner, 1985). Juveniles of 3-10 mm are almost
entirely dependent on sea urchins for their survival, beneath which they conceal themselves from
predators such as the West Coast rock lobster (Sweijd, 2008; Tarr et al., 1996). Juveniles may remain
under sea urchins until they reach 21-35 mm in size, after which they move to rocky crevices in the reef.
Adult abalone remain concealed in crevices, emerging nocturnally to feed on kelp fronds and red algae
(Branch et al., 2010). In the wild, abalone may take 30 years to reach full size of 200 mm, but farmed
abalone attain 100 mm in only 5 years, which is the maximum harvest size (Sales & Britz, 2001).
South Africa is the largest producer of abalone outside of Asia (Troell et al., 2006). For example, in
2001, 12 abalone farms existed, generating US$12 million at volumes of 500-800 tons per annum
(Sales & Britz, 2001). By 2006, this number had almost doubled, with 22 permits granted and 5 more
being scheduled for development (Troell et al., 2006). Until recently, abalone cultivation has been
primarily onshore, but abalone ranching provides more cost effective opportunities for production
(Anchor Environmental, 2012).
Abalone ranching is “where hatchery-produced seed are stocked into kelp beds outside the natural
distribution” (Troell et al., 2006). Abalone ranching was pioneered by Port Nolloth Sea Farms who were
experimentally seeding kelp beds in Port Nolloth by 2000. Abalone ranching expanded in the area in
2013 when DAFF issued rights for each of four Concession Area Zones.
Abalone ranching includes the spawning, larval development, seeding and harvest. An onshore
hatchery supports the ranching in the adjacent sea (Anchor Environmental, 2012). Two hatcheries exist
in Port Nolloth producing up to 250 000 spat. To date, there has been no seeding in Zones 1 or 2.
Seeding has taken place in Zones 3 and 4, both of which are situated inshore of Sea Concession 6C.
See Figure 4.17 for a map showing Zones 1 – 4 in relation to Sea Concession 6C.
CapMarine (Pty) Ltd
July 2018
Basic Assessment for a Prospecting Right Application for Offshore Sea Concession 6C West Coast, South Africa 6C
Page 21
Figure 4.18: Location of abalone ranching concession areas in relation to Sea Concession 6C.
4.9 Small-scale fisheries
Small-scale fishers using traditional fishing gear have historically harvested marine resources along the
coastline of South Africa for consumptive use, livelihoods, and medicinal purpose. However, this group
of people was not recognised in terms of the Marine Living Resources Act and were further marginalised
through commercial fishing rights allocation processes. In 2007 government was compelled to redress
the inequality suffered by the small scale fishers by means of an order from the Equality Court. Through
extensive consultative processes the small-scale fisheries policy was finalised in 2012 with the
implementation plan approved in 2013. The small-scale fishery policy implementation plan was initiated
in 2016 (DAFF 2016).
Small-scale fishers fish to meet food and basic livelihood needs, and may be directly involved in
harvesting, processing and distribution of fish for commercial purposes. These fishers traditionally
operate on nearshore fishing grounds, using traditional low technology or passive fishing gear to harvest
marine living resources on a full-time, part-time or seasonal basis. Fishing trips are usually a single day
in duration and fishing/harvesting techniques are labour intensive. The equipment used by small-scale
fishers includes rowing boats in some areas, motorized boats on the south and west coast and simple
fishing gear including hands, feet, screw drivers, hand lines, prawn pumps, rods with reels, gaffs, hoop
nets, gill nets, seine/trek nets and semi-permanently fixed kraal traps. Small-scale fishers are an integral
part of the rural and coastal communities in which they reside and this is reflected in the socio-economic
profile of such communities. In the Eastern Cape, KwaZulu-Natal and the Northern Cape, small-scale
fishers live predominantly in rural areas while those in the Western Cape live mainly in urban and peri-
urban areas. Resources are managed in terms of a community-based co-management approach that
CapMarine (Pty) Ltd
July 2018
Basic Assessment for a Prospecting Right Application for Offshore Sea Concession 6C West Coast, South Africa 6C
Page 22
aims to ensure that harvesting and utilisation of the resource occurs in a sustainable manner in line with
the ecosystems approach.
The small-scale fisheries policy proposes that certain areas on the coast be prioritized and demarcated
as small-scale fishing areas. In some areas access rights could be reserved exclusively for use by
small-scale fishers. The community, once they are registered as a community-based legal entity, could
apply for the demarcation of these areas and should conflict arise, it should be referred to conflict
resolution under the Policy. The policy also requires a multi-species approach to allocating rights, which
will entail allocation of rights for a basket of species that may be harvested or caught within particular
designated areas. DAFF recommends five basket areas: 1. Basket Area A – The Namibian border to
Cape of Good Hope – 57 different resources 2. Basket Area B – Cape of Good Hope to Cape Infanta –
109 different resources 3. Basket Area C – Cape Infanta to Tsitsikamma – 107 different resources 4.
Basket Area D – Tsitsikamma to the Pondoland MPA – 138 different resources 5. Basket Area E –
Pondoland MPA to the Mozambican border – 127 different resources. Sea Concession 6C falls within
the area demarcated as Basket Area 1, within which Hondeklipbaai is the access point for participants
in the small-scale fishing sector.
4.10 Beach-seine and gillnet fisheries
There are a number of active beach-seine and gillnet operators throughout South Africa (collectively
referred to as the “netfish” sector). Initial estimates indicate that there are at least 7 000 fishermen active
in fisheries using beach-seine and gillnets, mostly (86%) along the West and South coasts. These
fishermen utilize 1 373 registered and 458 illegal nets and report an average catch of about 1 600 tons
annually, constituting 60% harders (also known as mullet, Liza richardsonii), 10% St Joseph shark
(Callorhinchus capensis) and 30% "bycatch" species such as galjoen (Dichistius capensis), yellowtail
(Seriola lalandii) and white steenbras (Lithognathus lithognathus). Catch-per-unit-effort declines
eastwards from 294 and 115 kg·net-day−1 for the beach-seine and gill-net fisheries respectively off the
West Coast to 48 and 5 kg·net-day−1 off KwaZulu-Natal. Consequently, the fishery changes in nature
from a largely commercial venture on the West Coast to an artisanal/subsistence fishery on the East
Coast (Lamberth et al. 1997).
The fishery is managed on a Total Allowable Effort (TAE) basis with a fixed number of operators in each
of 15 defined areas (see Table 4.2 for the number of rights issued and Figure 4.18 for the fishing areas).
The number of Rights Holders for 2014 was listed as 28 for beach-seine and 162 for gill-net (DAFF,
2014a). Permits are issued solely for the capture of harders, St Joseph and species that appear on the
‘bait list’. The exception is False Bay, where Right Holders are allowed to target linefish species that
they traditionally exploited.
The beach-seine fishery operates primarily on the West Coast of South Africa between False Bay and
Port Nolloth (Lamberth 2006) with a few permit holders in KwaZulu-Natal targeting mixed shoaling fish
during the annual winter migration of sardine (Fréon et al. 2010). Beach-seining is an active form of
fishing in which woven nylon nets are rowed out into the surf zone to encircle a shoal of fish. They are
then hauled shorewards by a crew of 6–30 persons, depending on the size of the net and length of the
haul. Nets range in length from 120 m to 275 m. Fishing effort is coastal and net depth may not exceed
10 m (DAFF 2014b). There are currently no rights issued for Area B (Hondeklipbaai).
The gillnet fishery operates from Yzerfontein to Port Nolloth on the West Coast. Surface-set gillnets
(targeting mullet) are restricted in size to 75 m x 5 m and bottom-set gillnets (targeting St Joseph shark)
are restricted to 75 m x 2.5 m (da Silva et al. 2015) and are set in waters shallower than 50 m. The
spatial distribution of effort is represented as the annual number of nets per kilometre of coastline and
ranges up to a maximum of 15 off St Helena Bay. Of a total of 162 right holders, two operate within
Area B (Hondeklipbaai).
CapMarine (Pty) Ltd
July 2018
Basic Assessment for a Prospecting Right Application for Offshore Sea Concession 6C West Coast, South Africa 6C
Page 23
Table 4.2: Recommended Total Allowable Effort (TAE, number of rights and exemption holders) and rights allocated in 2016-17 for each netfish area. Levels of effort are based on the number of fishers who could maintain a viable income in each area (DAFF 2017).
Area Locality Beach-seine
Gill/drift Total Rights
allocated
A Port Nolloth 3 4 7 4
B Hondeklipbaai The area between Kleinsee and the security fence at Mitchell’s Bay nearby the mouth of the Spoeg River.
0 2 2 0
C Olifantsriviermond-Wadrifsoutpansmond 2 8 10 4
D Wadrifsoutpansmond-Elandsbaai-Draaihoek 3 6 9 6
E Draaihoek, (Rochepan)-Cape Columbine, including Paternoster
4 80 84 84
F Saldhana Bay 1 5 6 5
G Langebaan Lagoon 0 10 10 10
H Yzerfontein 2 2 4 1
I Bokpunt (Melkbos)-Milnerton 3 0 3 1
J Houtbay beach 2 0 2 0
K Longbeach-Scarborough 3 0 3 1
L Smitswinkel Bay, Simonstown, Fishoek 2 0 2 2
M Muizenberg-Strandfontein 2 0 2 2
N Macassar* 0 0 0 (1)
OE Olifants River Estuary 0 45 45 45
Figure 4.19: Beach-seine and gillnet fishing areas and TAE (DAFF, 2014).
CapMarine (Pty) Ltd
July 2018
Basic Assessment for a Prospecting Right Application for Offshore Sea Concession 6C West Coast, South Africa 6C
Page 24
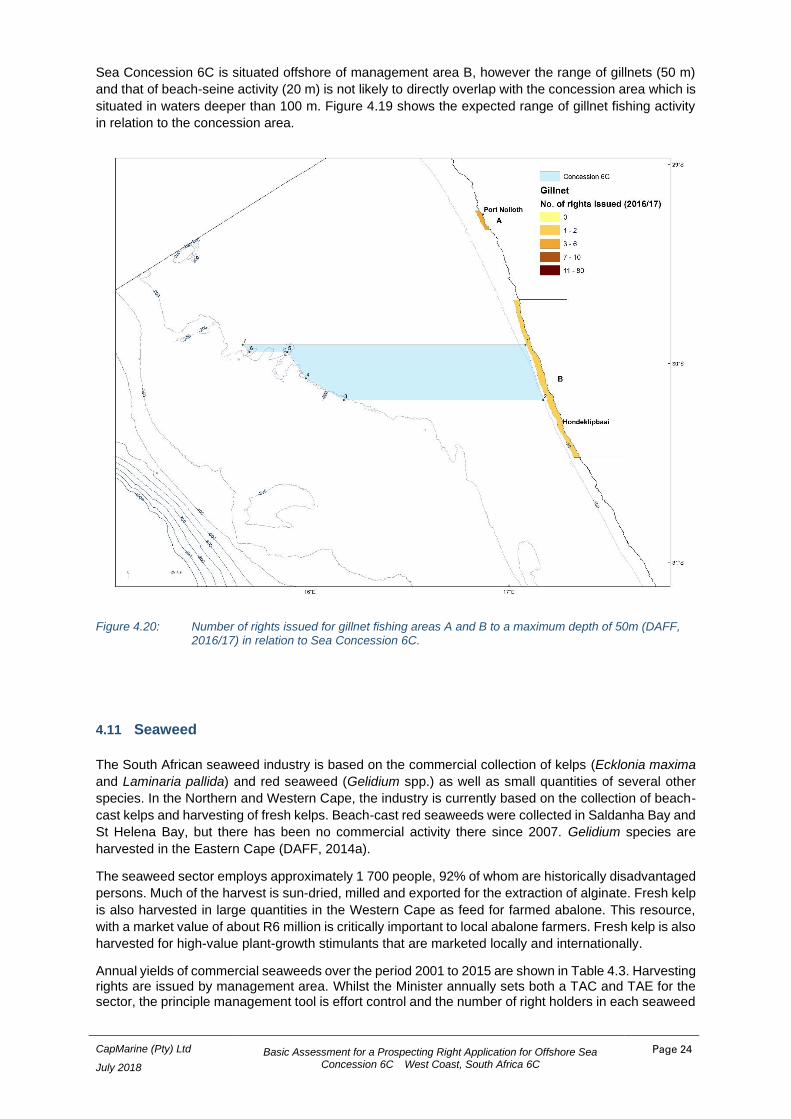
Sea Concession 6C is situated offshore of management area B, however the range of gillnets (50 m)
and that of beach-seine activity (20 m) is not likely to directly overlap with the concession area which is
situated in waters deeper than 100 m. Figure 4.19 shows the expected range of gillnet fishing activity
in relation to the concession area.
Figure 4.20: Number of rights issued for gillnet fishing areas A and B to a maximum depth of 50m (DAFF, 2016/17) in relation to Sea Concession 6C.
4.11 Seaweed
The South African seaweed industry is based on the commercial collection of kelps (Ecklonia maxima
and Laminaria pallida) and red seaweed (Gelidium spp.) as well as small quantities of several other
species. In the Northern and Western Cape, the industry is currently based on the collection of beach-
cast kelps and harvesting of fresh kelps. Beach-cast red seaweeds were collected in Saldanha Bay and
St Helena Bay, but there has been no commercial activity there since 2007. Gelidium species are
harvested in the Eastern Cape (DAFF, 2014a).
The seaweed sector employs approximately 1 700 people, 92% of whom are historically disadvantaged
persons. Much of the harvest is sun-dried, milled and exported for the extraction of alginate. Fresh kelp
is also harvested in large quantities in the Western Cape as feed for farmed abalone. This resource,
with a market value of about R6 million is critically important to local abalone farmers. Fresh kelp is also
harvested for high-value plant-growth stimulants that are marketed locally and internationally.
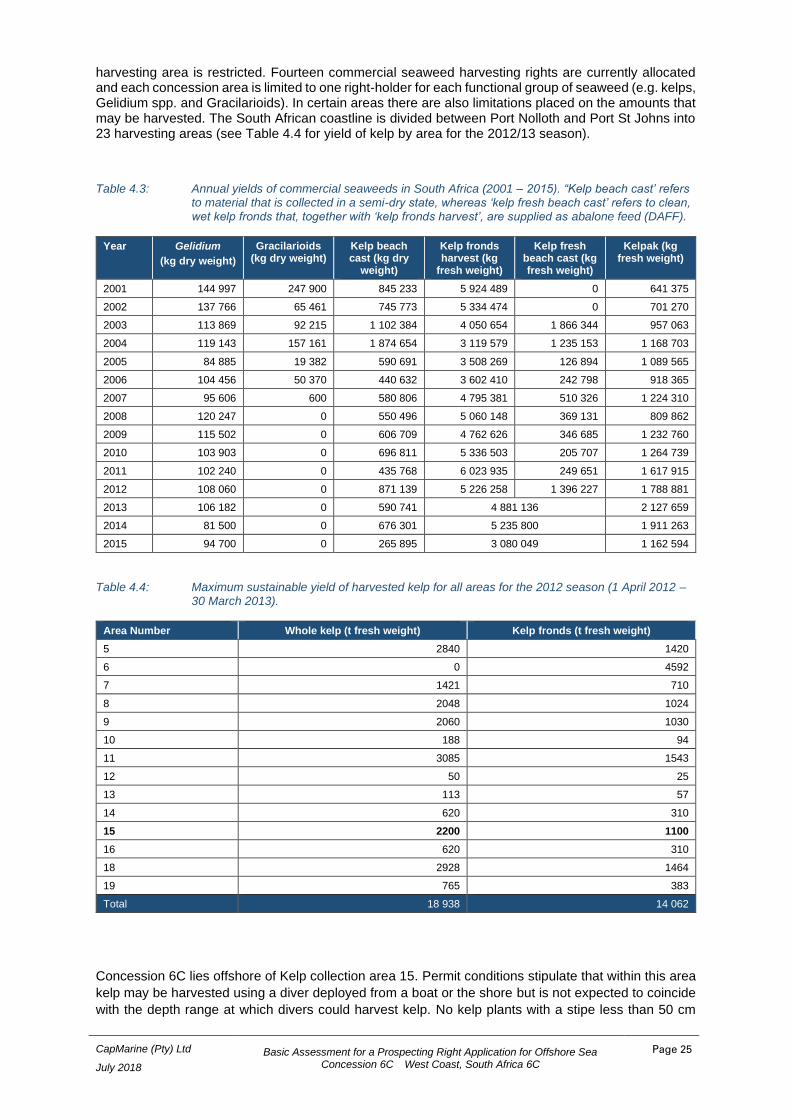
Annual yields of commercial seaweeds over the period 2001 to 2015 are shown in Table 4.3. Harvesting rights are issued by management area. Whilst the Minister annually sets both a TAC and TAE for the sector, the principle management tool is effort control and the number of right holders in each seaweed
CapMarine (Pty) Ltd
July 2018
Basic Assessment for a Prospecting Right Application for Offshore Sea Concession 6C West Coast, South Africa 6C
Page 25
harvesting area is restricted. Fourteen commercial seaweed harvesting rights are currently allocated and each concession area is limited to one right-holder for each functional group of seaweed (e.g. kelps, Gelidium spp. and Gracilarioids). In certain areas there are also limitations placed on the amounts that may be harvested. The South African coastline is divided between Port Nolloth and Port St Johns into 23 harvesting areas (see Table 4.4 for yield of kelp by area for the 2012/13 season).
Table 4.3: Annual yields of commercial seaweeds in South Africa (2001 – 2015). “Kelp beach cast’ refers to material that is collected in a semi-dry state, whereas ‘kelp fresh beach cast’ refers to clean, wet kelp fronds that, together with ‘kelp fronds harvest’, are supplied as abalone feed (DAFF).
Table 4.4: Maximum sustainable yield of harvested kelp for all areas for the 2012 season (1 April 2012 – 30 March 2013).
Area Number Whole kelp (t fresh weight) Kelp fronds (t fresh weight)
5 2840 1420
6 0 4592
7 1421 710
8 2048 1024
9 2060 1030
10 188 94
11 3085 1543
12 50 25
13 113 57
14 620 310
15 2200 1100
16 620 310
18 2928 1464
19 765 383
Total 18 938 14 062
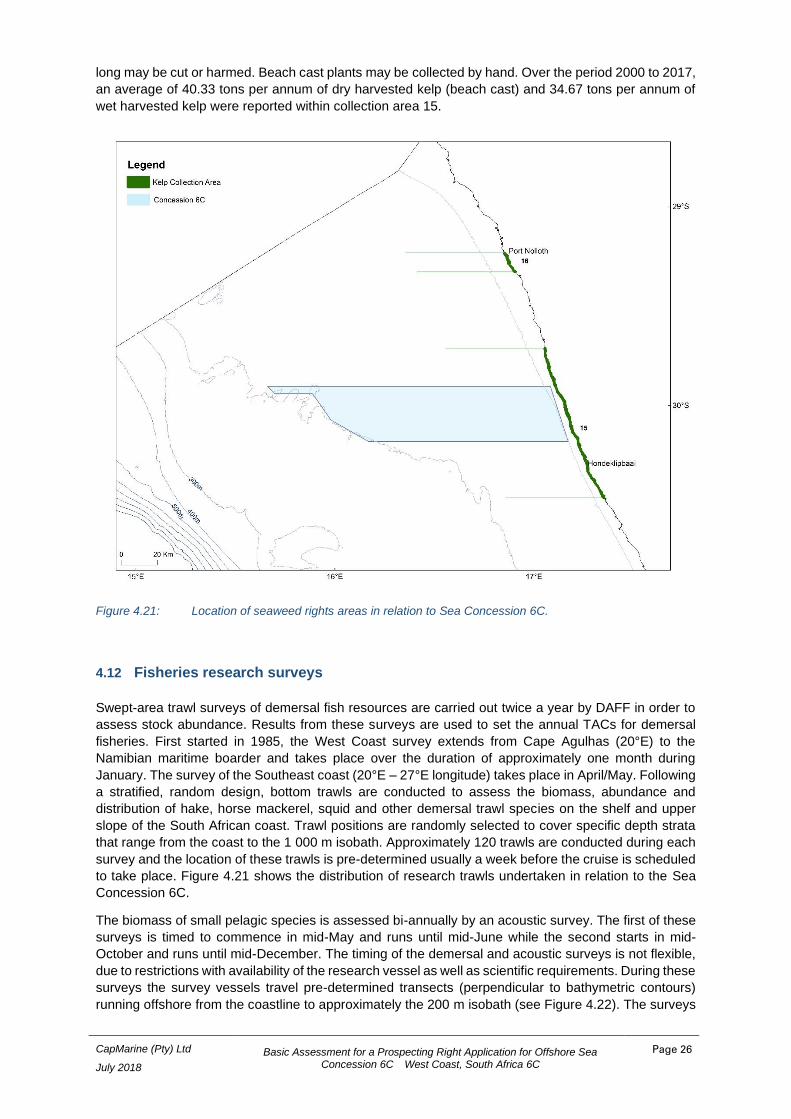
Concession 6C lies offshore of Kelp collection area 15. Permit conditions stipulate that within this area
kelp may be harvested using a diver deployed from a boat or the shore but is not expected to coincide
with the depth range at which divers could harvest kelp. No kelp plants with a stipe less than 50 cm
CapMarine (Pty) Ltd
July 2018
Basic Assessment for a Prospecting Right Application for Offshore Sea Concession 6C West Coast, South Africa 6C
Page 26
long may be cut or harmed. Beach cast plants may be collected by hand. Over the period 2000 to 2017,
an average of 40.33 tons per annum of dry harvested kelp (beach cast) and 34.67 tons per annum of
wet harvested kelp were reported within collection area 15.
Figure 4.21: Location of seaweed rights areas in relation to Sea Concession 6C.
4.12 Fisheries research surveys
Swept-area trawl surveys of demersal fish resources are carried out twice a year by DAFF in order to
assess stock abundance. Results from these surveys are used to set the annual TACs for demersal
fisheries. First started in 1985, the West Coast survey extends from Cape Agulhas (20°E) to the
Namibian maritime boarder and takes place over the duration of approximately one month during
January. The survey of the Southeast coast (20°E – 27°E longitude) takes place in April/May. Following
a stratified, random design, bottom trawls are conducted to assess the biomass, abundance and
distribution of hake, horse mackerel, squid and other demersal trawl species on the shelf and upper
slope of the South African coast. Trawl positions are randomly selected to cover specific depth strata
that range from the coast to the 1 000 m isobath. Approximately 120 trawls are conducted during each
survey and the location of these trawls is pre-determined usually a week before the cruise is scheduled
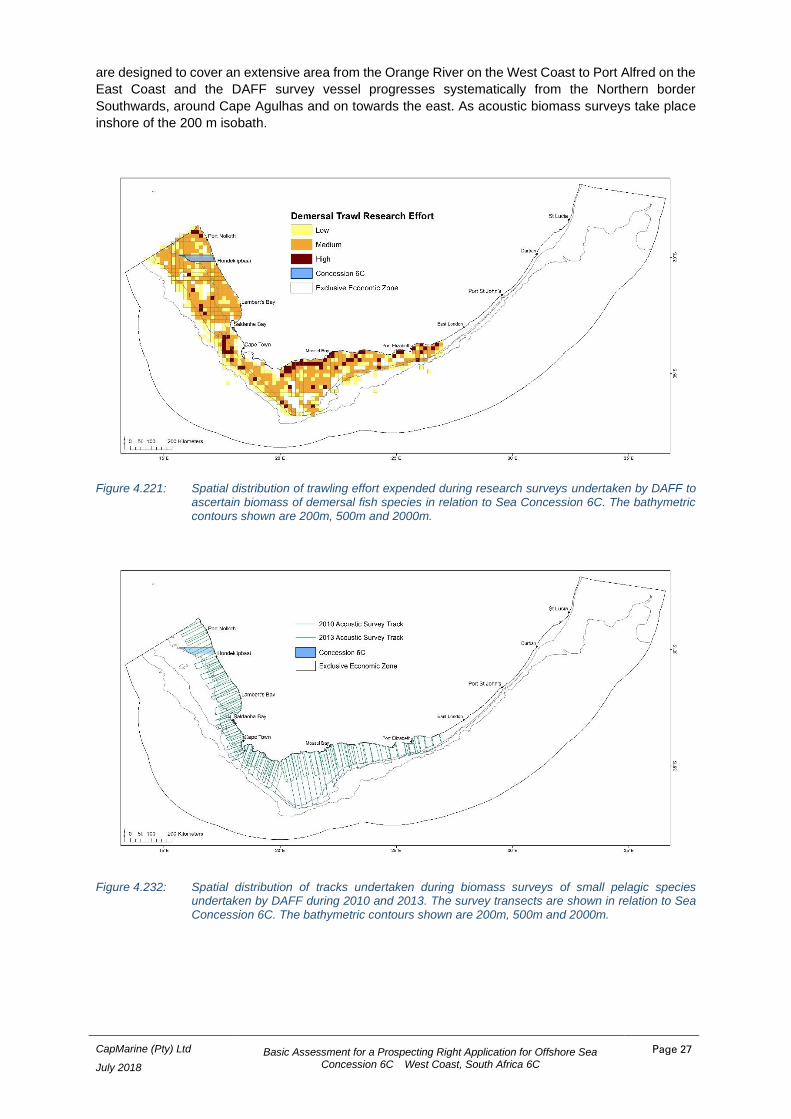
to take place. Figure 4.21 shows the distribution of research trawls undertaken in relation to the Sea
Concession 6C.
The biomass of small pelagic species is assessed bi-annually by an acoustic survey. The first of these
surveys is timed to commence in mid-May and runs until mid-June while the second starts in mid-
October and runs until mid-December. The timing of the demersal and acoustic surveys is not flexible,
due to restrictions with availability of the research vessel as well as scientific requirements. During these
surveys the survey vessels travel pre-determined transects (perpendicular to bathymetric contours)
running offshore from the coastline to approximately the 200 m isobath (see Figure 4.22). The surveys
CapMarine (Pty) Ltd
July 2018
Basic Assessment for a Prospecting Right Application for Offshore Sea Concession 6C West Coast, South Africa 6C
Page 27
are designed to cover an extensive area from the Orange River on the West Coast to Port Alfred on the
East Coast and the DAFF survey vessel progresses systematically from the Northern border
Southwards, around Cape Agulhas and on towards the east. As acoustic biomass surveys take place
inshore of the 200 m isobath.
Figure 4.221: Spatial distribution of trawling effort expended during research surveys undertaken by DAFF to ascertain biomass of demersal fish species in relation to Sea Concession 6C. The bathymetric contours shown are 200m, 500m and 2000m.
Figure 4.232: Spatial distribution of tracks undertaken during biomass surveys of small pelagic species undertaken by DAFF during 2010 and 2013. The survey transects are shown in relation to Sea Concession 6C. The bathymetric contours shown are 200m, 500m and 2000m.
CapMarine (Pty) Ltd
July 2018
Basic Assessment for a Prospecting Right Application for Offshore Sea Concession 6C West Coast, South Africa 6C
Page 28
5. Impact Assessment
This chapter describes and assesses the significance of potential impacts related to the proposed
exploration activities in Sea Concession 6C. All impacts are assessed according to the rating scale
defined in Section 5.1. Where appropriate, mitigation measures are proposed, which could ameliorate
the negative impacts or enhance potential benefits, respectively. The status of all impacts should be
considered negative unless otherwise stated. The significance of impacts with and without mitigation
is assessed.
5.1 Assessment Procedure
The following convention was used to determine significance ratings in the assessment:
Rating Definition of Rating
Intensity – establishes whether the magnitude of the impact is destructive or benign in relation to the sensitivity of the receiving environment
Zero to Very Low Negligible change, disturbance or nuisance. The impact affects the environment in such a way that natural functions and processes are not affected.
Low Minor (Slight) change, disturbance or nuisance. The impact on the environment is not detectable.
Medium Moderate change, disturbance or discomfort. Where the affected environment is altered, but natural functions and processes continue, albeit in a modified way.
High Prominent change, disturbance or degradation. Where natural functions or processes are altered to the extent that they will temporarily or permanently cease.
Duration – the time frame over which the impact will be experienced
Short-term <5 years
Medium-term 5 – 15 years
Long-term >15 years, but where the impact will eventually cease either because of natural processes or by human intervention
Permanent Where mitigation either by natural processes or by human intervention would not occur in such a way or in such time span that the impact can be considered transient
Extent – defines the physical extent or spatial scale of the impact
Local Extending only as far as the activity, limited to the site and its immediate surroundings
Regional Impacts are confined to the region; e.g. coast, basin, etc.
National Limited to the coastline of South Africa
International Extending beyond the borders of South Africa
Reversibility – defines the potential for recovery to pre-impact conditions
Irreversible Where the impact is permanent
Partially Reversible Where the impact can be partially reversed
Fully Reversible Where the impact can be completely reversed
Probability – the likelihood of the impact occurring
Improbable Where the possibility of the impact to materialise is very low either because of design or historic experience, i.e. ≤ 30% chance of occurring.
Possible Where there is a distinct possibility that the impact would occur, i.e. > 30 to ≤ 60% chance of occurring.
Probable Where it is most likely that the impact would occur, i.e. > 60 to ≤ 80% chance of occurring.
Definite Where the impact would occur regardless of any prevention measures, i.e. > 80% chance of occurring.
CapMarine (Pty) Ltd
July 2018
Basic Assessment for a Prospecting Right Application for Offshore Sea Concession 6C West Coast, South Africa 6C
Page 29
Rating Definition of Rating
Degree of confidence in predictions – in terms of basing the assessment on available information and specialist knowledge
Low Less than 35 % sure of impact prediction.
Medium Between 35 % and 70 % sure of impact prediction.
High Greater than 70 % sure of impact prediction
Degree to which impact can be mitigated - the degree to which an impact can be reduced / enhanced
None No change in impact after mitigation.
Very Low Where the significance rating stays the same, but where mitigation will reduce the intensity of the impact.
Low Where the significance rating drops by one level, after mitigation.
Medium Where the significance rating drops by two to three levels, after mitigation.
High Where the significance rating drops by more than three levels, after mitigation.
Loss of resources - the degree to which a resource is permanently affected by the activity, i.e. the degree to which a resource is irreplaceable
Low Where the activity results in a loss of a particular resource but where the natural, cultural and social functions and processes are not affected.
Medium Where the loss of a resource occurs, but natural, cultural and social functions and processes continue, albeit in a modified way.
High Where the activity results in an irreplaceable loss of a resource.
Using the core criteria above (namely extent, duration and intensity), the consequence of the impact
is determined:
Consequence – attempts to evaluate the importance of a particular impact, and in doing so incorporates extent, duration and intensity
VERY HIGH Impacts could be EITHER:
of high intensity at a regional level and endure in the long term;
OR of high intensity at a national level in the medium term;
OR of medium intensity at a national level in the long term.
HIGH Impacts could be EITHER:
of high intensity at a regional level enduring in the medium term;
OR of high intensity at a national level in the short term;
OR of medium intensity at a national level in the medium term;
OR of low intensity at a national level in the long term;
OR of high intensity at a local level in the long term;
OR of medium intensity at a regional level in the long term.
MEDIUM Impacts could be EITHER:
of high intensity at a local level and endure in the medium term;
OR of medium intensity at a regional level in the medium term;
OR of high intensity at a regional level in the short term;
OR of medium intensity at a national level in the short term;
OR of medium intensity at a local level in the long term;
OR of low intensity at a national level in the medium term;
OR of low intensity at a regional level in the long term.
LOW Impacts could be EITHER
of low intensity at a regional level, enduring in the medium term;
OR of low intensity at a national level in the short term;
OR of high intensity at a local level and endure in the short term;
OR of medium intensity at a regional level in the short term;
OR of low intensity at a local level in the long term;
OR of medium intensity at a local level, enduring in the medium term.
CapMarine (Pty) Ltd
July 2018
Basic Assessment for a Prospecting Right Application for Offshore Sea Concession 6C West Coast, South Africa 6C
Page 30
Consequence – attempts to evaluate the importance of a particular impact, and in doing so incorporates extent, duration and intensity
VERY LOW Impacts could be EITHER
of low intensity at a local level and endure in the medium term;
OR of low intensity at a regional level and endure in the short term;
OR of low to medium intensity at a local level, enduring in the short term;
OR Zero to very low intensity with any combination of extent and duration.
UNKNOWN Where it is not possible to determine the significance of an impact.
The consequence rating is considered together with the probability of occurrence in order to
determine the overall significance using the table below.
PROBABILITY
IMPROBABLE POSSIBLE PROBABLE DEFINITE
CO
NS
EQ
UE
NC
E VERY LOW INSIGNIFICANT INSIGNIFICANT VERY LOW VERY LOW
LOW VERY LOW VERY LOW LOW LOW
MEDIUM LOW LOW MEDIUM MEDIUM
HIGH MEDIUM MEDIUM HIGH HIGH
VERY HIGH HIGH HIGH VERY HIGH VERY HIGH
Nature of the Impact – describes whether the impact would have a negative, positive or zero effect on the
affected environment
Positive The impact benefits the environment
Negative The impact results in a cost to the environment
Neutral The impact has no effect
Type of impacts assessed:
Type of impacts assessed
Direct (Primary) Impacts that result from a direct interaction between a proposed project activity and
the receiving environment.
Secondary Impacts that follow on from the primary interactions between the project and its
environment as a result of subsequent interactions within the environment (e.g. loss
of part of a habitat affects the viability of a species population over a wider area).
Indirect Impacts that are not a direct result of a proposed project, often produced away from
or as a result of a complex impact pathway.
Cumulative Additive: impacts that may result from the combined or incremental effects of future
activities (i.e. those developments currently in planning and not included as part of
the baseline).
In-combination: impacts where individual project-related impacts are likely to affect
the same environmental features. For example, a sensitive receptor being affected
by both noise and drill cutting during drilling operations could potentially experience
a combined effect greater than the individual impacts in isolation.
The relationship between the significance ratings after mitigation and decision-making can be broadly
defined as follows:
CapMarine (Pty) Ltd
July 2018
Basic Assessment for a Prospecting Right Application for Offshore Sea Concession 6C West Coast, South Africa 6C
Page 31
Significance of residual impacts after Mitigation - considering changes in intensity, extent and duration
after mitigation and assuming effective implementation of mitigation measures
Very Low; Low Activity could be authorised with little risk of environmental degradation.
Medium Activity could be authorised with conditions and inspections.
High Activity could be authorised but with strict conditions and high levels of compliance
and enforcement.
Very High Potential fatal flaw
5.2 Identification of Impacts
The potential impacts to the fishing industry of the proposed geophysical prospecting operations are
changes to the catchability of fish related to the effects of noise generated during the survey.
The potential impacts to the fishing industry of the sampling operations relate to the temporary exclusion
from fishing grounds due to a safety zone that would be effected around the vessel.
5.3 Assessment of Impacts
5.3.1 Impact of Exclusion of Fishing Operations
Description of Impact
While the prospecting vessel is operational at a given location, a temporary 500 m operational safety
zone around the unit would be in force, i.e. no other vessels (except the support vessels) may enter this
area. A vessel conducting marine prospecting operations may operate on a 3 or 4 anchor spread with
unlit anchor mooring buoys. For the duration of prospecting operations a coastal navigational warning
would be issued by the South African Navy Hydrographic Office (SANHO) requesting a 2 nautical mile
clearance from the sampling vessel. The safety zones aim to ensure the safety both of navigation and
of the prospecting vessel, avoiding or reducing the probability of accidents caused by the interaction of
fishing boats and gears and the vessel. This safety zone could impact fisheries through the exclusion
of fishing vessels from localised areas of Sea Concession 6C for the duration of the activities.
The exclusion of vessels from entering the safety zone around a prospecting vessel poses a direct
impact to fishing operations in the form of loss of access to fishing grounds. Although the concession
area coincides with the designated management areas of the West Coast rock lobster, abalone
ranching, netfish and seaweed sectors, the depths exploited by these fisheries are less than 100 m and
therefore would not be expected to be affected. The following sectors could be affected by exclusion
from fishing grounds:
Demersal longline
Based on the commercial catch and effort data submitted by the demersal longline fishery over the
period 2000 and 2017, favoured fishing grounds are situated at least 20 km from the north-western and
40 km from the south-western extents of Sea Concession 6C. Sporadic fishing has been reported within
the concession area during this time, amounting to an average of one line set per year and
approximately 4 tons of catch. This is equivalent to some 0.05% of the total landing of hake by the
sector per year over this period. There is no overlap of the concession area with fishing grounds for
demersal shark species targeted by demersal longline.
Tuna pole
Over the period 2007 to 2016, 32 fishing events were reported within the concession area (this is
comparable to 32 days of fishing effort) with a cumulative catch of 58.3 tons of albacore over this period.
This amounts to 5.8 tons per year which is equivalent to 0.2% of the total albacore landed by the sector
(nationally) over this period.
CapMarine (Pty) Ltd
July 2018
Basic Assessment for a Prospecting Right Application for Offshore Sea Concession 6C West Coast, South Africa 6C
Page 32
Traditional linefish
Fishing activity is reported by landing point. In the vicinity of Sea Concession 6C, Hondeklipbaai is the
closest landing point. Over the period 2000 to 2016, an average of 182 kg per year were reported for
the area. Over the same period 2.5 tons of catch was reported for fishing positions in the vicinity of Port
Nolloth, situated 70 km northward of the concession area. The combined catch at Hondeklipbaai and
Port Nolloth is equivalent to ~ 0.03% of the overall national landings of the sector. The reporting of
fishing positions is not specific, but generally reported according to reference positions for different
areas. It is assumed that fishing could take place across the extent of Sea Concession 6C.
Fisheries research
Both demersal research trawls and acoustic surveys could be affected by exclusion from Sea
Concession 6C. Demersal surveys are random depth-stratified and adaptable. An average of three
trawls per survey have been recorded within the concession area, therefore it is likely that demersal
fisheries research could be affected by exclusion from this area. The nature of the random selection of
survey trawl sites is such that if a selected sampling station coincided with an exclusion area, an
alternative survey area could be randomly selected.
Acoustic transects are pre-determined and liaison between DAFF and the client would be necessary in
order to avoid disruption to acoustic survey activity.
Assessment
The impact of exclusion from fishing ground is expected to be of very low consequence for the demersal
longline, tuna pole, traditional linefish and fisheries research sectors and the overall significance of the
impact on these fisheries is expected to be very low. There is no impact expected on the small pelagic
purse-seine, demersal trawl, large pelagic longline, west coast rock lobster, abalone, netfish or seaweed
sectors.
Impacts of Preclusion from Fishing Ground
Without Mitigation Assuming Mitigation
Intensity Medium Low to Medium
Duration Short-term: for duration of survey Short-term
Extent Local: limited to sampling area Local
Consequence Very Low Very Low
Significance Very Low Very Low
Status Negative Negative
Probability Possible Possible
Confidence Medium Medium
Nature of Cumulative impact No cumulative impacts are anticipated during the sampling phase
Reversibility Fully reversible
Loss of resources Negligible
Mitigation potential Very Low
Mitigation
The mitigation measures listed below are unlikely to reduce the significance of potential impacts, but
they would minimise disruptions to prospecting and fishing / research operations.
• The most effective means of mitigation would be to ensure that the proposed prospecting
activities do not coincide with the research surveys between January and March. It is
recommended that prior to the commencement of the proposed activities, De Beers consult with
CapMarine (Pty) Ltd
July 2018
Basic Assessment for a Prospecting Right Application for Offshore Sea Concession 6C West Coast, South Africa 6C
Page 33
the managers of the DAFF research survey programmes to discuss their respective programmes
and the possibility of altering the prospecting programme in order to minimises or avoid
disruptions to both parties, where required.
• Prior to the commencement of the proposed sampling activities the following key stakeholders
should be consulted and informed of the proposed activities (including navigational co-ordinates
of the sampling areas, timing and duration of proposed activities) and the likely implications
thereof:
> Fishing industry associations (these include South African Tuna Association, South African
Tuna Longline Association, Fresh Tuna Exporters Association, South African Commercial
Linefish Association, Hake Longline Association, National SMME Fishing Forum, and
> Other: Department of Agriculture, Forestry and Fisheries (DAFF), South African Maritime
Safety Authority (SAMSA), South African Navy (SAN) Hydrographic office, overlapping
and neighbouring exploration right holders and applicants, and Transnet National Ports
Authority.
• The required safety zones around the sampling vessels should be communicated via the
issuing of Daily Navigational Warnings for the duration of the sampling operations through the
South African Naval Hydrographic Office;
• Any fishing vessel targets at a radar range of 12 nautical miles from the sampling vessel should
be called via radio and informed of the navigational safety requirements; and
• Affected parties should be notified through fishing industry bodies when the programme is
complete.
5.3.2 Impact of Sediment Plume on Fish Stock Recruitment
Description of Impact
The sampled seabed sediments are pumped to the surface and discharged onto sorting screens on the
sampling vessel. The screens separate the fine sandy silt and large gravel, cobbles and boulders from
the size fraction of interest, the ‘plantfeed’ (usually 2 - 20 mm). The fine tailings are immediately
discarded overboard where they form a suspended sediment plume in the water column which
dissipates with time. The ‘plantfeed’ is mixed with a high density ferrosilicon (FeSi) slurry and pumped
under pressure into a Dense Medium Separation (DMS) plant resulting in a high density concentrate.
The majority of the ferrosilicon is magnetically recovered for re-use in the DMS plant and the fine tailings
(-2 mm) from the DMS process are similarly deposited over board. Furthermore, fine sediment re-
suspension by the sampling tools will generate suspended sediment plumes near the seabed. The main
effect of plumes is an increase in water column turbidity. The relevance of this in terms of effects on
fisheries is the potential impairment of egg and/or larval development through high sediment loading.
Assessment
Typically fisheries stock recruitment is highly variable and shows a strong spatial and temporal signal.
For example, this variability would apply to the small pelagic species that comprise the largest
commercial fishery by volume on the West Coast of South Africa. Spawning and recruitment of these
small pelagic species as well as of many demersal species occurs primarily well to the south of
Concession 6C.
The spawn products from these fisheries typically drift northwards with the prevailing Benguela Current
and larval development mainly occurs nearshore and in bays along the West Coast of South Africa,
referred to as nursery areas. These areas provide a suitable niche for development of juveniles of these
species. Most of the species potentially impacted are broadcast spawners, with large volumes of spawn
products being dispersed over large areas. This would apply equally, for example, to west coast rock
lobster, hake and sardine.
Sea Concession 6C is situated offshore of the 100 m depth contour. Relative to the location of the
nursery areas, the sediment plumes generated during benthic sampling would be predominantly
dispersed northwards and offshore of the nursery areas. Whereas sediment plumes would result in a
CapMarine (Pty) Ltd
July 2018
Basic Assessment for a Prospecting Right Application for Offshore Sea Concession 6C West Coast, South Africa 6C
Page 34
negative impact on stock recruitment, the impact on fish recruitment is considered to be of very low
consequence and of overall insignificance due to the localised nature of the proposed sampling events
in relation to fish nursery areas. Since the impact is unlikely to result in a significant impact on fish stock
recruitment, mitigation against this impact is not considered necessary.
Impacts of Sediment Plume on Fish Stock Recruitment
Without Mitigation Assuming Mitigation
Intensity Medium Medium
Duration Short-term: for duration of sampling Short-term
Extent Local: limited to sampling area Local
Consequence Very Low Very Low
Significance Insignificant Insignificant
Status Negative Negative
Probability Improbable Improbable
Confidence Medium Medium
Nature of Cumulative impact No cumulative impacts are anticipated during the sampling phase
Reversibility Fully reversible
Loss of resources Negligible
Mitigation potential None
5.3.3 Acoustic Impacts of Geophysical Surveying
Description of Impact
The ocean is a naturally noisy place and marine animals are continually subjected to both physically
produced sounds from sources such as wind, rainfall, breaking waves and natural seismic noise, or
biologically produced sounds generated during reproductive displays, territorial defence, feeding, or in
echolocation (see references in McCauley 1994). Such acoustic cues are thought to be important to
many marine animals in the perception of their environment as well as for navigation purposes, predator
avoidance, and in mediating social and reproductive behaviour. Anthropogenic sound sources in the
ocean may thus interfere directly or indirectly with such activities. Of all human-generated sound
sources, the most persistent in the ocean is the noise of shipping. Depending on size and speed, the
sound levels radiating from vessels range from 160 to 220 dB re 1 µPa at 1 m (NRC 2003). Especially
at low frequencies between 5 to 100 Hz, vessel traffic is a major contributor to noise in the world’s
oceans, and under the right conditions, these sounds can propagate 100s of kilometres thereby
affecting very large geographic areas (Coley 1994, 1995; NRC 2003; Pidcock et al. 2003). Other forms
of anthropogenic noise include 1) aircraft flyovers, 2) multi-beam sonar systems, 3) seismic acquisition,
4) hydrocarbon and mineral exploration and recovery, and 5) noise associated with underwater blasting,
pile driving, and construction.
The cumulative impact of increased background anthropogenic noise levels in the marine environment
is an ongoing and widespread issue of concern (Koper & Plön 2012). Recent international research has
shown that noise energy generated during seismic surveys may cause physiological damage and/or
behavioural responses from fish and invertebrates (Caroll et al 2017). Threshold levels for underwater
noise impacts on fish have focused on the potential for physiological effects (injury or mortality) rather
than on quantifying noise levels with behavioural effects. A review of the literature and guidance on
appropriate thresholds for assessment of underwater noise impacts are provided in the 2014 Acoustical
Society of America (ASA) Technical Report Sound Exposure Guidelines for Fishes and Sea Turtles
(ASA, 2014). Reactions of fish to different types of anthropogenic sounds have been reviewed by
Hawkins et al. (2015), who concluded that more information is required on the effects of man-made
CapMarine (Pty) Ltd
July 2018
Basic Assessment for a Prospecting Right Application for Offshore Sea Concession 6C West Coast, South Africa 6C
Page 35
sounds on the distribution of fishes and their capture by different fishing gears as effects differ across
species, fishing ground and habitat type.
The acoustic impact of the proposed geophysical surveying on marine fauna has been assessed by
Pisces (2018). The findings of the Marine Fauna Assessment report are that the noise generated by
the acoustic equipment utilized during geophysical surveys would fall within the hearing range of most
fish, and at sound levels of between 190 to 242 dB re 1 μPa at 1 m, would be audible for considerable
distances (in the order of tens of km) before attenuating to below threshold levels (Findlay 2005).
However, unlike the noise generated by airguns during seismic surveys, the emission of underwater
noise from geophysical surveying and vessel activity would not be considered to be of sufficient
amplitude to cause auditory or non-auditory trauma in marine fauna in the region. Only directly below
the systems (within metres of the sources) would sound levels be in the 220 dB range where exposure
could result in trauma. As most pelagic species likely to be encountered within the concessions are
highly mobile, they would be expected to flee and move away from the sound source before trauma
could occur.
Similarly, the sound level generated by seabed crawler operations would fall within the 120-190 dB re
1 µPa range at the sampling unit, with main frequencies less than 0.2 kHz. The noise generated by
sampling operations would therefore fall within the hearing range of most fish, and would be audible for
considerable ranges (in the order of tens of kms) before attenuating to below threshold levels (Table
5.1). In a study evaluating the potential effects of vessel-based diamond mining on the marine
mammals community off the southern African West Coast, Findlay (1996) concluded that the
significance of the impact is likely to be minimal based on the assumption that the radius of elevated
noise level would be restricted to ~20 km around the mining vessel.
Table 5.1: Known hearing frequency and sound production ranges of various marine taxa (Pisces, 2018