1 Al Brooks Summary from I-TradeFutures......www.tradorslaboratory.com Chart Settings: • 5 Minute Candle Sticks • 20 Period EMA • Volume (Optional) Basic Bar Count Strategy: • H1 –First pullback in an uptrend, above 1 st bar that has a high above previous high. • H2 – Second time a High above previous bar in that same pullback • L1 - First pullback in a downtrend, below 1 st bar that has a low below previous low. • L2 – Second time a Low below previous bar in that same pullback
Transcript
1
Al Brooks Summary from I-TradeFutures......www.tradorslaboratory.com
Chart Settings:
• 5 Minute Candle Sticks
• 20 Period EMA
• Volume (Optional)
Basic Bar Count Strategy:
• H1 –First pullback in an uptrend, above 1st
bar that has a high above previous high.
• H2 – Second time a High above previous bar in that same pullback
• L1 - First pullback in a downtrend, below 1st
bar that has a low below previous low.
• L2 – Second time a Low below previous bar in that same pullback
2
ENTRIES
3
STOPS
4
HOW TO ENTER ON SIDEWAYS OR UPTRENDING MARKET:
HOW TO ENTER ON SIDEWAYS OR DOWNTRENDING MARKET:
5
TWO TYPES OF TRADES FOR BEGINNERS:
6
OTHER NUANCES AND SETUPS
MICRO-TRENDLINES
How to enter with Micro Trend Line:
• Connect the extreme of bars and construct Trend line. Enter 1 tick beyond the bar that broke the micro trend
line.
7
8
OTHER CHARTS:
Example of H2 failure, on micro trend line break, we expect to enter LONG WITH the trend. So next bar should rally, but
it did not so enter short.
9
REVERSALS:
TWO CRITERIA FOR REVERSALS:
1. Want to see a break beyond big picture trend line
2. A RETEST of the high or low, i.e. bull/bear flag
OTHER IMPORTANT NOTES:
• When 2 attempts are made, the market often reverses and does something else….i.e. double top or bottom
• “3 Push Pattern” constitutes a wedge or flag, even if it’s not perfect
10
ANOTHER EXMPLE OF TWO CRITERIA
Below, price had many doji bars in the in the pullback, this is an area of balance where neither bulls nor bears are
winning. Consider entering a reversal pattern expecting price to at least ‘snap back’ to that area temporarily.
11
Trend Channel Line over shoot below – Trend channel line would be the upper trend line in this case since in an uptrend.
12
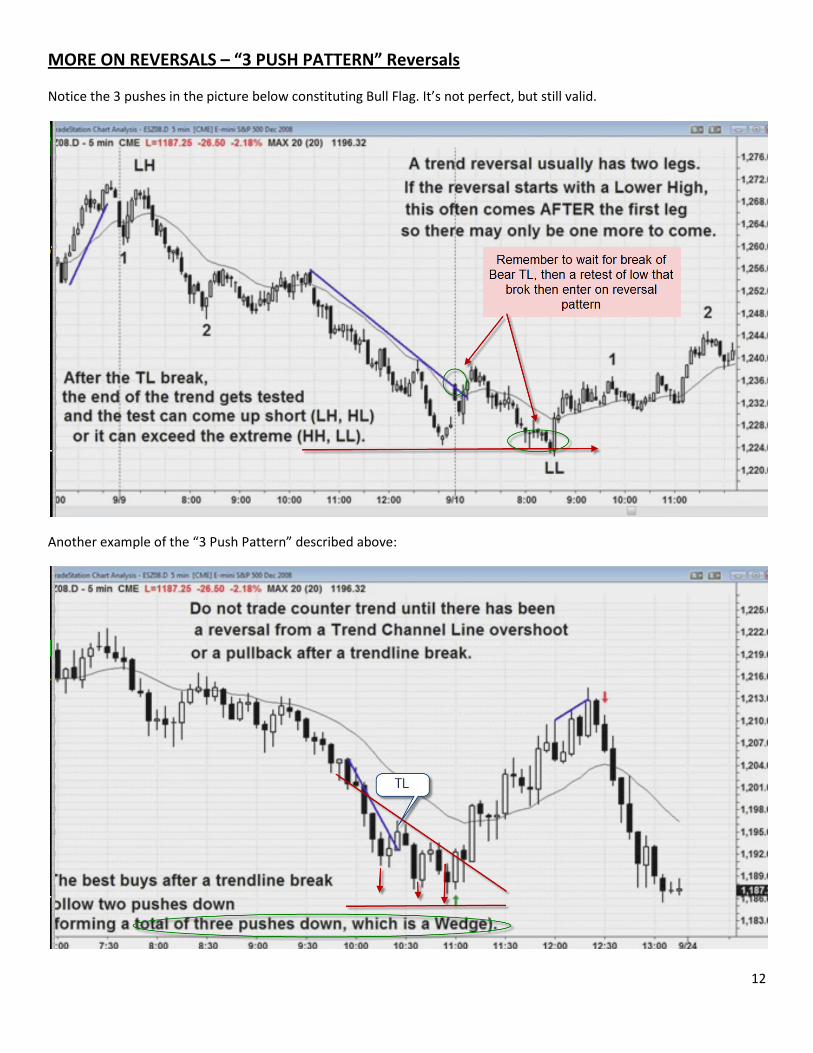
MORE ON REVERSALS – “3 PUSH PATTERN” Reversals
Notice the 3 pushes in the picture below constituting Bull Flag. It’s not perfect, but still valid.
Another example of the “3 Push Pattern” described above:
13
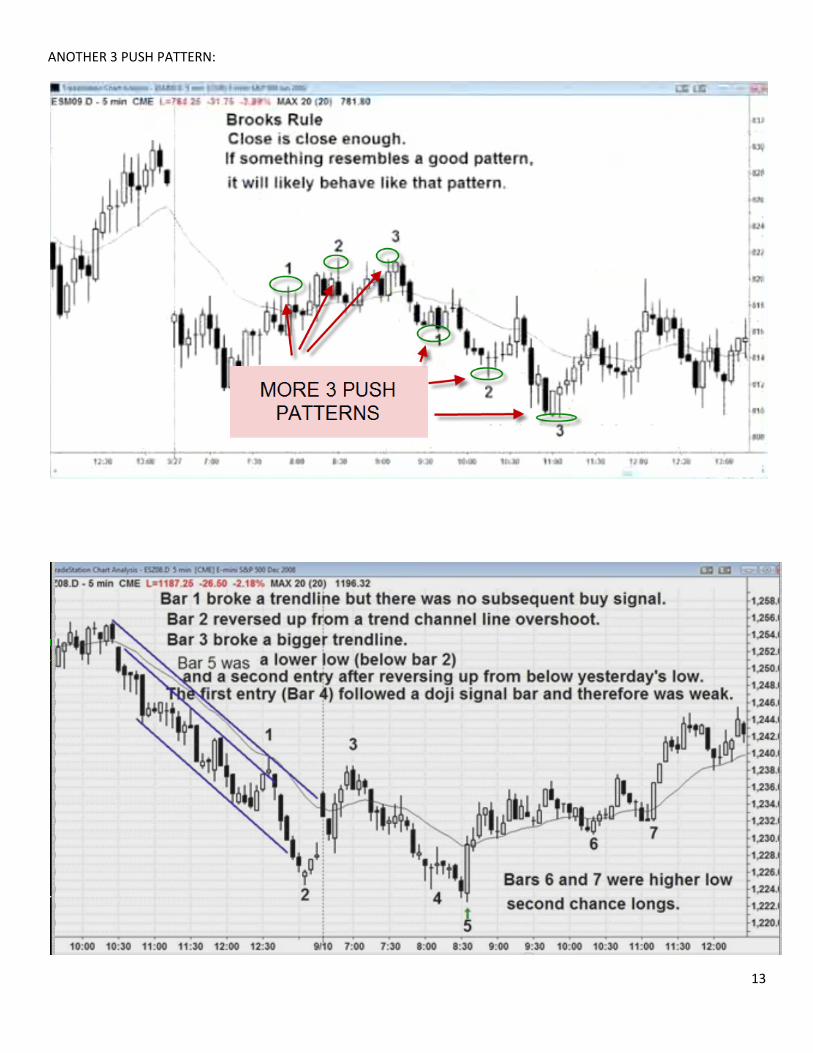
ANOTHER 3 PUSH PATTERN:
14
FAILED BREAKOUTS
• Big gap days have a high potential of trending….in either direction
15
MORE ON TRENDING:
WHEN WILL THE TREND STOP?
HOW BROOKS CLASSIFIES BARS BELOW. EITHER IT’S A TREND BAR OR WHAT HE CONSIDERS A DOJI.
16
TYPES OF TREND DAYS:
SPIKE AND CHANNEL BULL
17
CLEAR CHOP (ENGULFING CHOPPY TAILS IN THE MORNING SETS TONE)
SPIKE AND CHANNEL VARIANT – SPIKE IS THE GAP DOWN
18
TREND FROM THE OPEN DAY
BEAR DAY W/CONSOLIDATION IN THE MIDDLE, FOLLOWED BY RESUMPTION