16
Basic Guide Step by Step www.irrigateplus.com
Basic Guide Step by Step
www.irrigateplus.com

BASIC GUIDE – STEP BY STEP
For more information check the manual of Epanet www.irrigateplus.com
What is IrrigatePlus?
Irrigateplus is a program based on Epanet that includes, in a single program, all the necessary tools for the design and calculation of irrigation systems. For this reason, the original Epanet interface has been modified as little as possible, so users can find support in the multiple manuals, tutorials and examples that the program has.
A summary of the main four differences found in IrrigatePlus follows:
• Database with technical specifications of each sprinkler (Max. and Min. Pressure, Pressure-Radius function, Flow-Pressure function, average Radius,..)
• Design Tools (Sprinkler Drawing, Sectorization, Precipitation, Resize,….)
• Visualization Tools (Irrigated Area, Angle, Orientation,…)
• Calculation Engine (Specific emission exponents of each sprinkler)
Capabilities
• Includes commercial catalogs of major worldwide manufacturers of sprinklers and diffusers
• Maps the irrigation area for each sprinkler
• Manages the model, nozzle, angle and orientation for each sprinkler
• Simulates meshed or branched networks with no size limitation
• Calculates friction head loss
• Compatible with CAD and GIS
• Works with S.I. or US system units
• Includes minor head losses for bends, fittings, etc
• Models constant or variable speed pumps
• Computes pumping energy and cost
• Incorporates different types of valves, including shut-off, pressure and flow control valves
• Defines temporal patterns for each sector (irrigation schedules)
• Models water chemical quality
• Designs storage tanks of any shape
Applications
IrrigatePlus allows for improved management and design of sprinkler irrigation systems, assisting in the election of sprinklers and diffusers, valve positioning, pipe diameter optimization and the election of pumping equipment.
It allows for a quicker, safer and more efficient design process than when using more conventional methods, enabling performance planning and improvement of hydraulic systems.
Its DataBases allows for selection of sprinklers and diffusers in an easy and simple way without requiring other commercial tables and catalogs.

BASIC GUIDE – STEP BY STEP
For more information check the manual of Epanet www.irrigateplus.com
Creating a Project
The first step to work with IrrigatePlus is to define the defaults for our specific project. To do this, we have to open the main menu bar and select Project >> Defaults.
Once defaults have been configured, the software saves the settings for future projects so it will not be necessary to re-configure them unless changes are required.
In the Properties tab, enable the AutoLength (On) function to make sure the radius of the sprinklers are represented correctly.
Other settings, such as pipe diameter, node elevation or tank diameter, are less used, although it may be recommended to set their defaults for some projects.
In the Hydraulics tab, the units for flow can be specified in the International System (LPS, LPM, MLD, M3H or M3D) or in the US System (CFS,GPM, AFD, MGD or IMGD).
Specifying flow units in SI implies that the remaining units of measurement must also be expressed in the International System (length in meters, pipe diameters in mm, pressure in mca, etc). In the same way, flow units in the US System imply that the remaining units must use the same system.
In the Headloss Formula option, we can select the Darcy-Weisbach (D-W), Hazen-Williams (H-W), or Chezy-Manning (C-M) equations for the calculation of frictional losses.

BASIC GUIDE – STEP BY STEP
For more information check the manual of Epanet www.irrigateplus.com
METHOD DESCRIPTION
Hazen-Williams The Hazen-Williams is most common in the English-speaking world. It cannot be used with any fluid but water and it was originally developed for turbulent flow only
Darcy-Weisbach (Default)
The Darcy-Weisbach method is theoretically the most accurate. It can be applied on any fluid in any regime
Chezy-Manning The Chezy-Manning method is the most common method for open channel flow
Since each equation accounts for pipe roughness in a different way, changing the formula used may require updating all pipe roughness coefficients. The default setting will be assign by the Pipes Roughness field.
The following table shows roughness coefficients for different materials according to the calculation method.
ROUGHNESS COEFFICIENTS
MATERIAL
HAZEN-WILLIAMS
MANNING DARCY - WEISBACH
(dimensionless) (dimensionless)
International System
US System
(mm) (feets x 10-3)
Plastic (PE, PVC)
140-150 0.006-0.010 0.0015 0.005
Steel 130 0.010-0.011 0.03-0.09 0.15
Galvanized iron
120 0.015-0.017 0.06-0.24 0.5
Concrete 120-140 0.012-0.017 0.3-3.0 1 - 10
Loading background image
IrrigatePlus can load a background image (View >> Backdrop >> Load or selecting the icon
) to help in designing and positioning of sprinklers and piping. The background drawing must be a Windows Metafile (WMF), or a bitmap (.BMP and .JPG). Metafiles (vectors) behave better than bitmaps since the former can maintain its resolution when resized.
To resize the background image, we select Resize Map button and click with the mouse the beginning and end of a known distance. Then we write the measure known open in the dialog box. An easy way to check that the dimensions of the image are correct is to use the Measure
Distance tool and check that the known distance coincides with the distance on the workspace.

BASIC GUIDE – STEP BY STEP
For more information check the manual of Epanet www.irrigateplus.com
In the Map Units field, we choose meters if working with the International System (IS), or feet if working with the US System (US).
Note: It is recommended to set the coordinates of the drawing area immediately after creating a new project, since the units of measurement for length might be different than those used to measure the length of pipes.
IS US
Default Distance
Know Distance

BASIC GUIDE – STEP BY STEP
For more information check the manual of Epanet www.irrigateplus.com
Loading Database
This option is only available in the paid version. The free version includes only a basic catalog that allows for familiarization with the workflow of the program.
Databases include technical specifications for each sprinkler, such as maximum and minimum pressure, Pressure-Radius and Flow-Pressure functions, average radius or precipitation rate.
Once inside the Data Base manager menu, we select the commercial catalog of the manufacturer whose sprinklers we want to use in our design.
The Data Base manager can sort products by:
• Family
• Model
• Nozzle
• Angle
Loading Database

BASIC GUIDE – STEP BY STEP
For more information check the manual of Epanet www.irrigateplus.com
Drawing Sprinklers
To draw the sprinklers, we select the Add Sprinkler button and click with the mouse on the place where we want to position the sprinkler.
Once positioned, we choose the family, model, nozzle, angle and orientation until we attach it to the design area. The configuration for this sprinkler will be used for new sprinklers until changed.
To define the height (elevation) at which each sprinkler is positioned, we click on the sprinkler and fill in the Elevation field with the ground elevation at that point. Also, using the group edit tool, we can modify several sprinklers at once.
When designing, it may be convenient to enable the legend for the nodes with their precipitation rate. This will allow us to select sprinklers with similar precipitation rates regardless of the set angle.
As an example, a sprinkler with a 360 degrees angle will have a 2 times smaller precipitation rate than another sprinkler of identical specifications but with a 180 degrees angle.
Family
Drawing Sprinkler
Model
Nozzle
Angle
Orientation
Rotate
Angle
Radius
Radius

BASIC GUIDE – STEP BY STEP
For more information check the manual of Epanet www.irrigateplus.com
Drawing Pipes
To draw the piping, we click on the Add Pipe button and then select the initial and final elements (sprinkler, node, reservoir, ...) of the pipe.
The main parameters to define the pipe are:
• Length (which is auto filled if auto-length is enabled)
• Diameter
• Roughness (defined on the default settings)
The units for the diameter will be in mm if working in the International System or in inches if using the US System.
Roughness is a dimensionless coefficient (unless the Darcy-Weisbach equation is being used…) based on the material of the pipe.
Drawing Pipes

BASIC GUIDE – STEP BY STEP
For more information check the manual of Epanet www.irrigateplus.com
Drawing Network Connection
The most common way to model the water inlet to a system is by using a reservoir or a reservoir-fed pump.
Reservoir: Reservoirs represent an infinite external source or sink of water to the network. They are used to model such elements as the connection to the supply network, lakes, uptake from rivers, in which pressure and flow remain constant regardless of the flow demand of our irrigation system.
The only necessary parameter is the elevation at which the reservoir is located. This elevation must be equal to the pressure, expressed in m.c.a., measured at the connection at a point in time with no flow demand.
The flow value is not necessary as it's a function of the pressure and the pipe section at the connection. For residential gardens, the diameter of the pipe is usually conditioned by the section of the water meter, which limits the maximum flow and diameter of all pipes in the network.
Pump: The main parameters for a pump are its inlet (usually a reservoir) and outlet nodes, and its characteristic curve at nominal speed (ratio between outlet flow and provided height). Instead of entering its characteristic curve, the behavior of a pump can be modeled as a constant energy device that supplies a constant amount of energy to the fluid for all combinations of flow and height, which allows us to determine the height applied to the fluid based on the flow.
Network Connection
Reservoir

BASIC GUIDE – STEP BY STEP
For more information check the manual of Epanet www.irrigateplus.com
Sectorizing
The first step is to assign the same “Tag” to each pipe of a sector. Double clicking on the selected pipe, a pop-up window will display its parameters. The “Tag” field should reflect the name of our sector (Sector 1, Sector 2, S1, S2, …).
Another simpler way is to select all pipes of a sector with the multiple selection tool and define the “Tag” in Edit >> Group Edit.. >> For all “Pipes” >> Replace “Tag” >> with ”Sector name”.
Once all names (“Tag”) are assigned to the pipes, we can open the irrigation planner to manage the schedules for each sector.
To open or close a sector for a specific period of time, just click on its cell to change its color. Green cells show when the sector is irrigating, while red cells show that the pipes are closed.
The time period (Time Period) of each irrigation turn is a fixed value common to all sectors. In order to modify the irrigation time per sector we must go to the viewer located at the top-right corner, and then to Options >> Times >> Pattern Time Step and define the irrigation time (0:05 hrs by default).
Group Edit

BASIC GUIDE – STEP BY STEP
For more information check the manual of Epanet www.irrigateplus.com
The duration of the irrigation (Total Duration) will be the result of multiplying the irrigation time of the sectors (Pattern Time Step) by the number of sectors. In the same way, the duration of each simulation (Hydraulic Time Step) must be equal to the irrigation time of the sectors (Pattern Time Step).
Calculating
To run a hydraulic simulation, click on the button, located on the toolbar.
Any error or warning message will be shown in a pop-up window containing the status report.
There are many ways to see, directly on the Network Layout, the results of a simulations:
Layout nodes and lines can be colored, according to a pre-established color code in the Layout Legends, for magnitudes currently selected on the Layout Viewer located on the top-right corner.
The model, nozzle and angle of the sprinkler, the IDs, and the values of the current magnitude associated to nodes and lines, can also be plotted on the layout permanently by selecting the appropriate options in View >> Options >> Notation.
The Network Layout can be printed, copied to Windows clipboard or saved to a DXF file or Windows Metafile.
Irrigation Planner

BASIC GUIDE – STEP BY STEP
For more information check the manual of Epanet www.irrigateplus.com
IrrigatePlus includes visualization tools that can display irrigation areas for each sector and interval or the total range of all sprinklers jointly. In case the pressures in a sprinkler are higher than those defined in the data base as Maximum Pressure, the program will display the irrigation area in red. In the same way, if the pressure is lower than the Minimum pressure, the irrigation area for this sprinkler will not be displayed.
Visualization Tools
Run
Browser
BASIC GUIDE – STEP BY STEP
For more information check the manual of Epanet www.irrigateplus.com
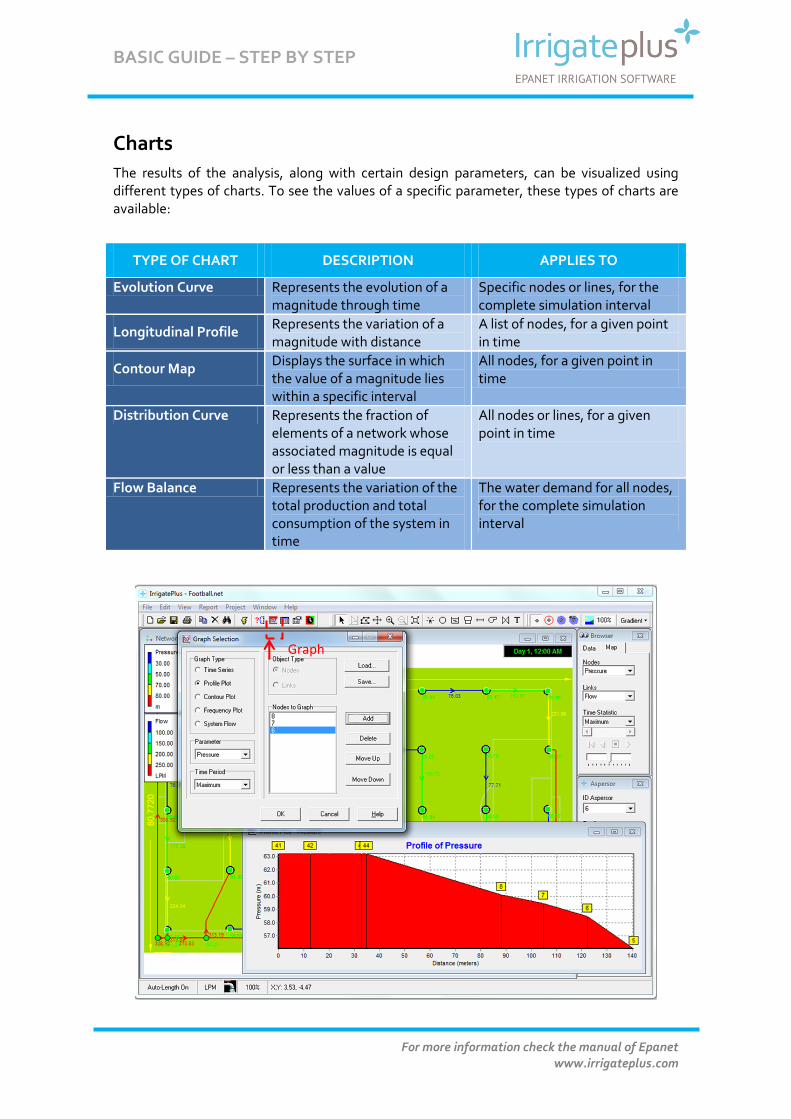
Charts
The results of the analysis, along with certain design parameters, can be visualized using different types of charts. To see the values of a specific parameter, these types of charts are available:
TYPE OF CHART DESCRIPTION APPLIES TO
Evolution Curve Represents the evolution of a magnitude through time
Specific nodes or lines, for the complete simulation interval
Longitudinal Profile Represents the variation of a magnitude with distance
A list of nodes, for a given point in time
Contour Map Displays the surface in which the value of a magnitude lies within a specific interval
All nodes, for a given point in time
Distribution Curve Represents the fraction of elements of a network whose associated magnitude is equal or less than a value
All nodes or lines, for a given point in time
Flow Balance Represents the variation of the total production and total consumption of the system in time
The water demand for all nodes, for the complete simulation interval
Graph

BASIC GUIDE – STEP BY STEP
For more information check the manual of Epanet www.irrigateplus.com
Tables
It's also possible to see certain project data and the results of the analysis in tabular form, using the following tables:
Network Elements: lists the properties and results of all nodes or lines of the network, for a given point in time.
Element Evolution: lists the properties and results of a specific node or line, for all time intervals.
To create a table: 1. Select the option Report >> Table... from the Menu Bar, or click on the button on the Standard Tool Bar. 2. Use the Table Selection dialog to choose:
• the type of table • the magnitudes to be displayed in each column • the filter to select the data to be displayed in the Table
Tables can be printed, copied to Windows clipboard, or saved to a file. In the main menu we select Edit >> Copy to... and the Clipboard or File.
Tables
BASIC GUIDE – STEP BY STEP
For more information check the manual of Epanet www.irrigateplus.com
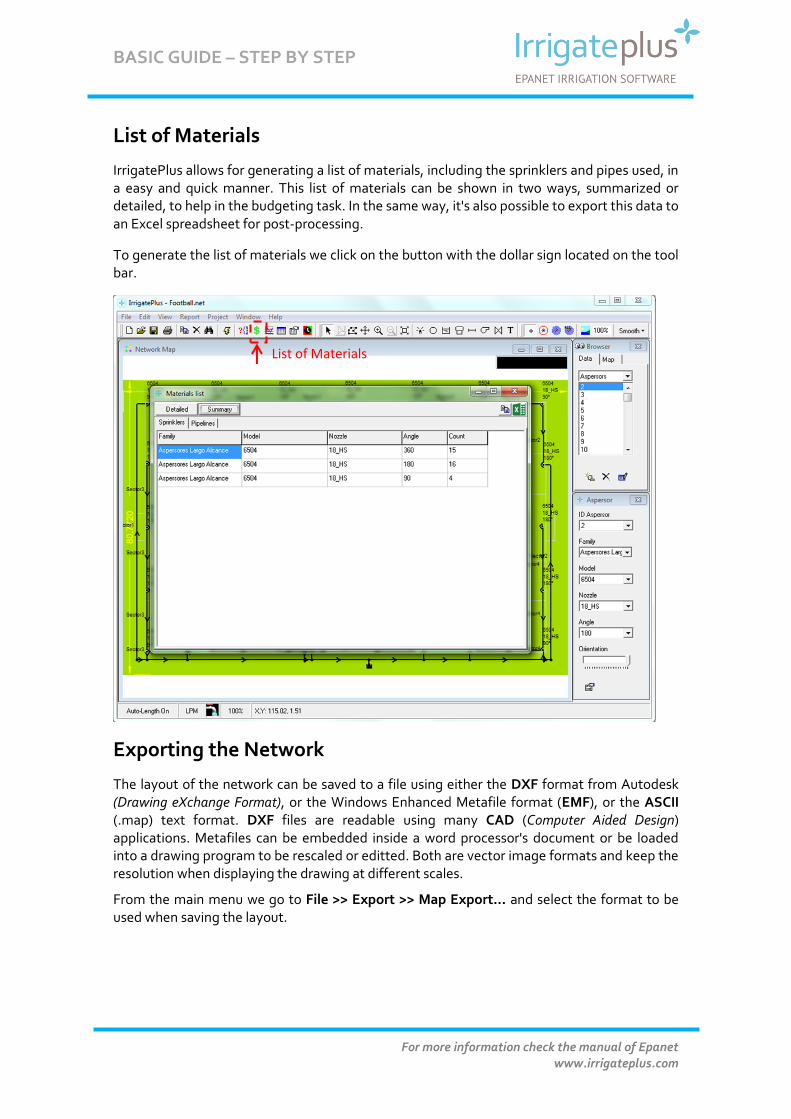
List of Materials
IrrigatePlus allows for generating a list of materials, including the sprinklers and pipes used, in a easy and quick manner. This list of materials can be shown in two ways, summarized or detailed, to help in the budgeting task. In the same way, it's also possible to export this data to an Excel spreadsheet for post-processing.
To generate the list of materials we click on the button with the dollar sign located on the tool bar.
Exporting the Network
The layout of the network can be saved to a file using either the DXF format from Autodesk (Drawing eXchange Format), or the Windows Enhanced Metafile format (EMF), or the ASCII (.map) text format. DXF files are readable using many CAD (Computer Aided Design) applications. Metafiles can be embedded inside a word processor's document or be loaded into a drawing program to be rescaled or editted. Both are vector image formats and keep the resolution when displaying the drawing at different scales.
From the main menu we go to File >> Export >> Map Export... and select the format to be used when saving the layout.
List of Materials


