Basic normal and pathological anatomy of human brain anatomy of human brain by Josef Spacek SynapseWeb http://synapses clm utexas edu/ SynapseWeb, http://synapses.clm.utexas.edu/ The purpose of brain studies of laboratory animals is to understand the df i f h h b i b hi l df i l structure and function of the human brain, because their structural and functional principles are very similar or identical. It appeared appropriate to make this overview available in spite of the fact that it is strongly reduced and only roughly informative. It was created for students, not for experts. Visual impact was informative. It was created for students, not for experts. Visual impact was emphasized, whereas text was minimized. All illustrations (except those from several cases donated from hospitals in Poland, Vietnam, Prague, Olomouc, and Litomysl, as well as several woodcuts adapted from the Toldt’s atlas) were taken f hi f th th d f th Fi l dD t t fP th l from archives of the author and of the Fingerland Department of Pathology, Charles University Prague, University Hospital in Hradec Kralove. Ultrastructural correlates are available in The Atlas of Ultrastructural Neurocytology (SynapseWeb, http://synapses.clm.utexas.edu/atlas/contents.stm).
Transcript
Basic normal and pathologicalanatomy of human brainanatomy of human brain
by Josef SpacekSynapseWeb http://synapses clm utexas edu/SynapseWeb, http://synapses.clm.utexas.edu/
The purpose of brain studies of laboratory animals is to understand thed f i f h h b i b h i l d f i lstructure and function of the human brain, because their structural and functional
principles are very similar or identical. It appeared appropriate to make this overview available in spite of the fact that it is strongly reduced and only roughly informative. It was created for students, not for experts. Visual impact wasinformative. It was created for students, not for experts. Visual impact was emphasized, whereas text was minimized. All illustrations (except those from several cases donated from hospitals in Poland, Vietnam, Prague, Olomouc, and Litomysl, as well as several woodcuts adapted from the Toldt’s atlas) were taken f hi f th th d f th Fi l d D t t f P th lfrom archives of the author and of the Fingerland Department of Pathology, Charles University Prague, University Hospital in Hradec Kralove. Ultrastructural correlates are available in The Atlas of Ultrastructural Neurocytology(SynapseWeb, http://synapses.clm.utexas.edu/atlas/contents.stm). ( y p p y p )
Representative figures are aligned in the following sequence:Representative figures are aligned in the following sequence:
Normal gross and microscopical anatomyCytopathology of nerve cellsP th h i l i l t ( d h i ti )Pathophysiological aspects (edema, herniation)InfectionsVascular diseasesTraumasTumorsDegenerative diseasesDemyelinating diseasesInborn metabolical errorsInborn metabolical errorsAnomalies and malformations
Normal gross anatomyNormal gross anatomy
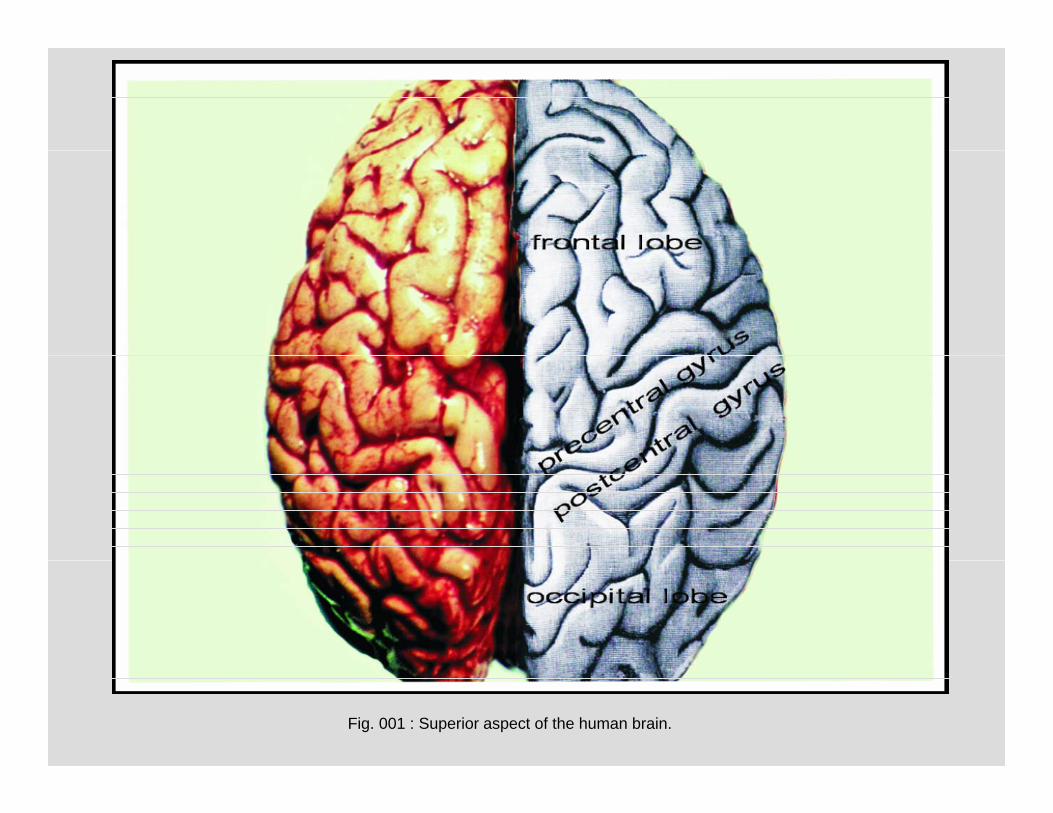
Fig. 001 : Superior aspect of the human brain.
Fig. 002 : Medial section through the human brain.
Fig. 003 : Basal aspect of the human brain.
Fig. 004 : Basal aspect of the human brain.g p
Fig. 005 : Basal aspect of the human brain.g p
Fig. 006 : Superior aspect of a horizontal section through the human brain.
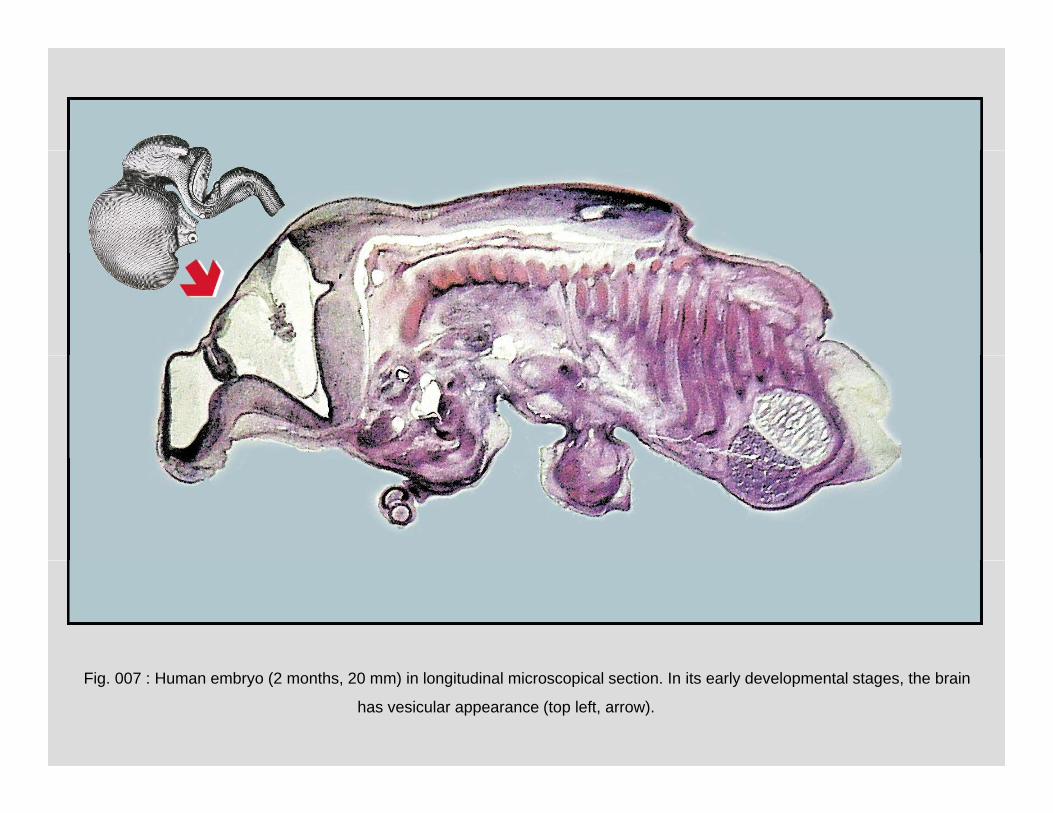
Fig. 007 : Human embryo (2 months, 20 mm) in longitudinal microscopical section. In its early developmental stages, the brain
has vesicular appearance (top left, arrow).
A B
Fig. 008 : Selected virtual sections (A – frontal vertical, B – horizontal). (NMR, man, 15 years.)
A BFig. 009: The same brain transformed into 3D from the NMR series. Together with connecting spinal cord, the brain forms central nervous system from which peripheral nerves originate and drift to body organs. (B – 3D reconstruction from a NMR series, man, 15 years.)
gray matter of cerebral cortex -->
hit ttwhite matter
<-- gray matterof basal gangliaof basal ganglia
Fig. 010 : Horizontal section through the human brain to show different colors ofthe gray and white matter. A focal hemorrhage is apparent (white arrow).
A B C
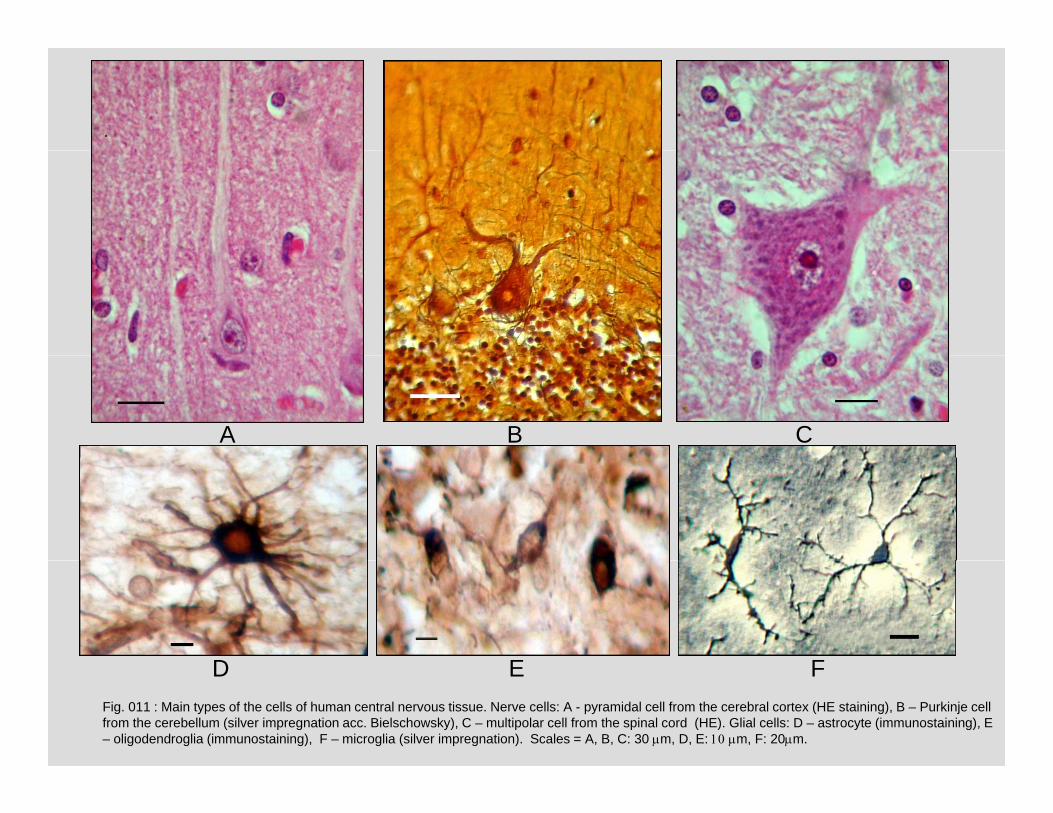
D E FFig. 011 : Main types of the cells of human central nervous tissue. Nerve cells: A - pyramidal cell from the cerebral cortex (HE staining), B – Purkinje cell from the cerebellum (silver impregnation acc. Bielschowsky), C – multipolar cell from the spinal cord (HE). Glial cells: D – astrocyte (immunostaining), E – oligodendroglia (immunostaining), F – microglia (silver impregnation). Scales = A, B, C: 30 m, D, E: m, F: 20m.
D E F
A B C
Fig. 012 : Human cerebral cortex. Pyramidal cells with their apical dendrites are apparent. Scales = A: 200 mB: 50 mC: 30 m.
A B
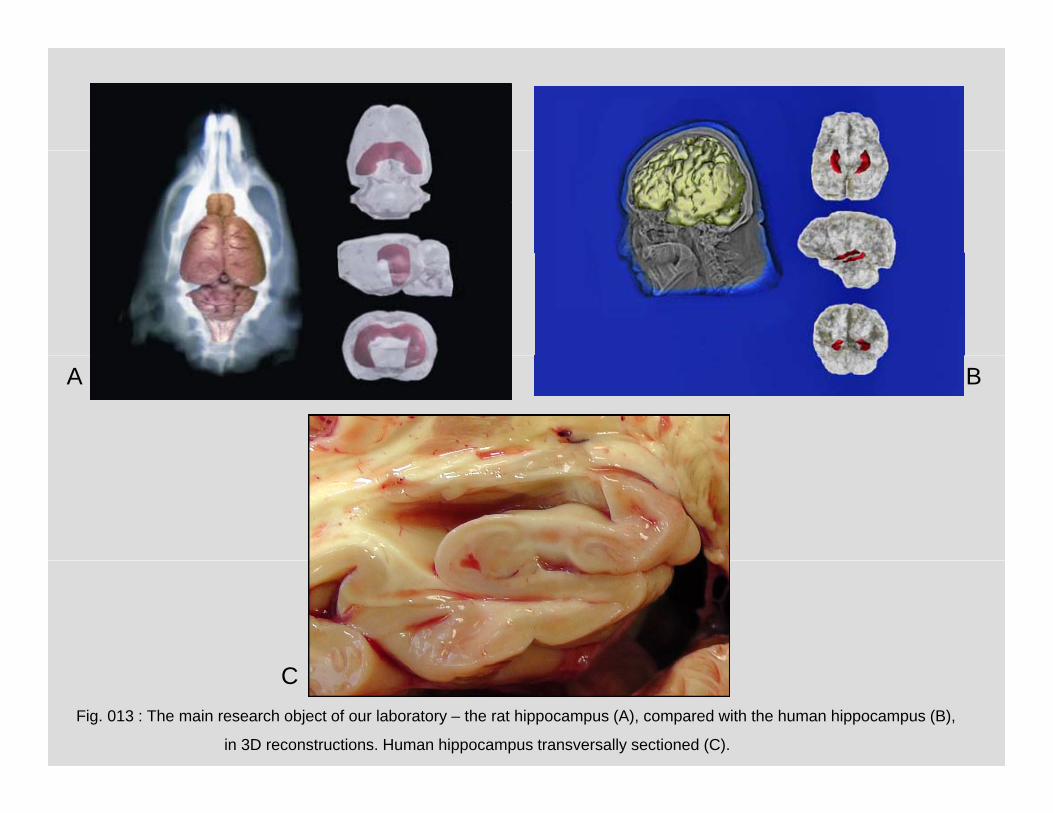
Fig. 013 : The main research object of our laboratory – the rat hippocampus (A), compared with the human hippocampus (B),
in 3D reconstructions. Human hippocampus transversally sectioned (C).
C
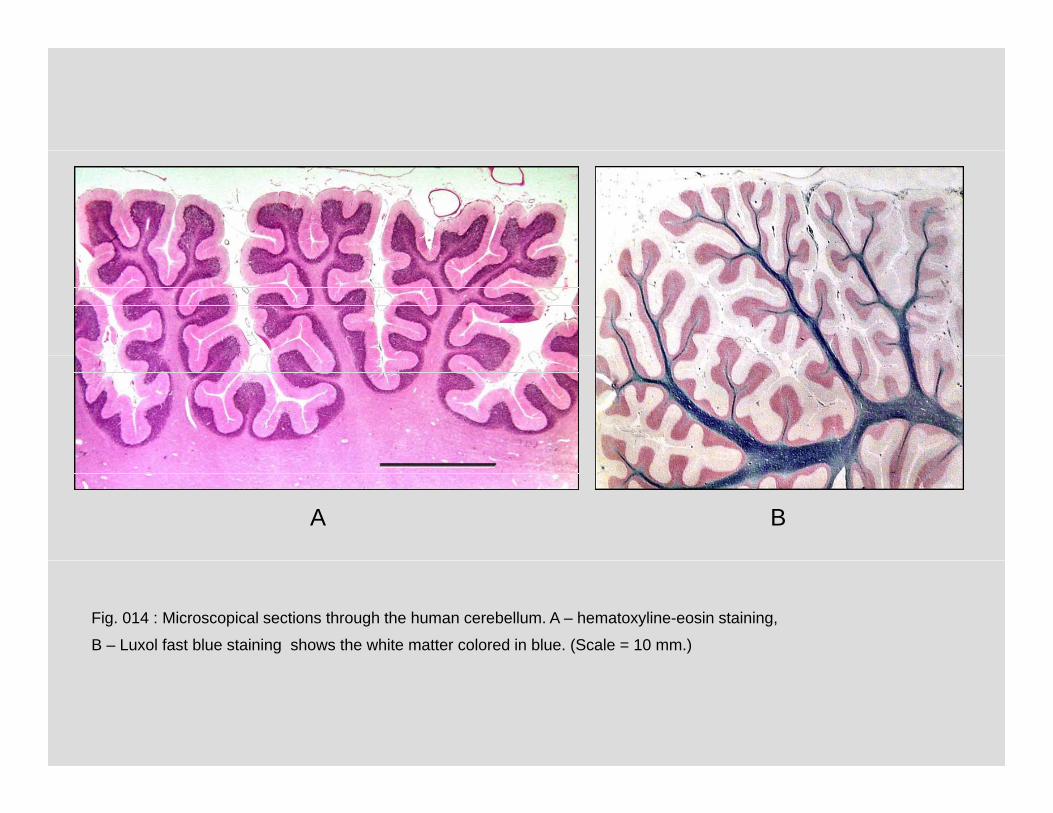
A B
Fig. 014 : Microscopical sections through the human cerebellum. A – hematoxyline-eosin staining,
B – Luxol fast blue staining shows the white matter colored in blue. (Scale = 10 mm.)
Fig. 015 : Area postrema (arrow): one of the circumventricular organs located in the wall of brain ventricles. They play a
role in neuro-endocrine interactions. Scale = 0.5 mm.
A
B
Fig. 016 : Spinal cord (A – cervical, B – lumbosacral). (The ventral roots are atrophic due to amyotrophic lateral sclerosis (motor neuron disease). (Woman, 55 y.)
B
A B
Fig. 017 : Spinal cord – transverse sections (A – HE staining, B – Luxol Fast Blue staining differentiating the white matterbl f th tt i k) D t ( ) d th i l d d th t S l 5– blue, from the gray matter – pink). Dura mater (arrow) surrounds the spinal cord and the roots. Scales = 5 mm.
A
B C
Fig. 018 : Spinal cord (Bielschowsky silver impregnation). Motoneurons in the ventral horn andtransversally sectioned axons in the ventral column are apparent. Scales = A: 3mm, B, C: 100 m
B C
pia materpia mater
Fig. 019 : Thin membranous pia mater (leptomeninx) covers the brain (exposed at arrows).
dura materdura mater
Fig. 020 : Thick fibrous dura mater isolates the brain from the skull bones. (The orange colored membrane in the
upper part is a xenogeneic pericardial graft to cover a postoperative defect of the dura - duraplasty).
Cytopathology of nerve cells
Fig. 021 : Normal (left) and “red” pyramidal neuron (right) from the cerebral cortex. A shrinkage, eosinophilia, chromatolysis, and nuclear pyknosis are signs of the acute neuronal injury accompanying mechanical contusion, hypoxia or ischemia, toxic
poisonings or infections. Scale = 20 m.
A B
Fig 022 : Neuronal calcifications associating encephalitis (A child 2 y ) toxoplasmosis (B child 1 y )
and from unknown reason (C). Scales = A, B: 50 m, C: 100 m.
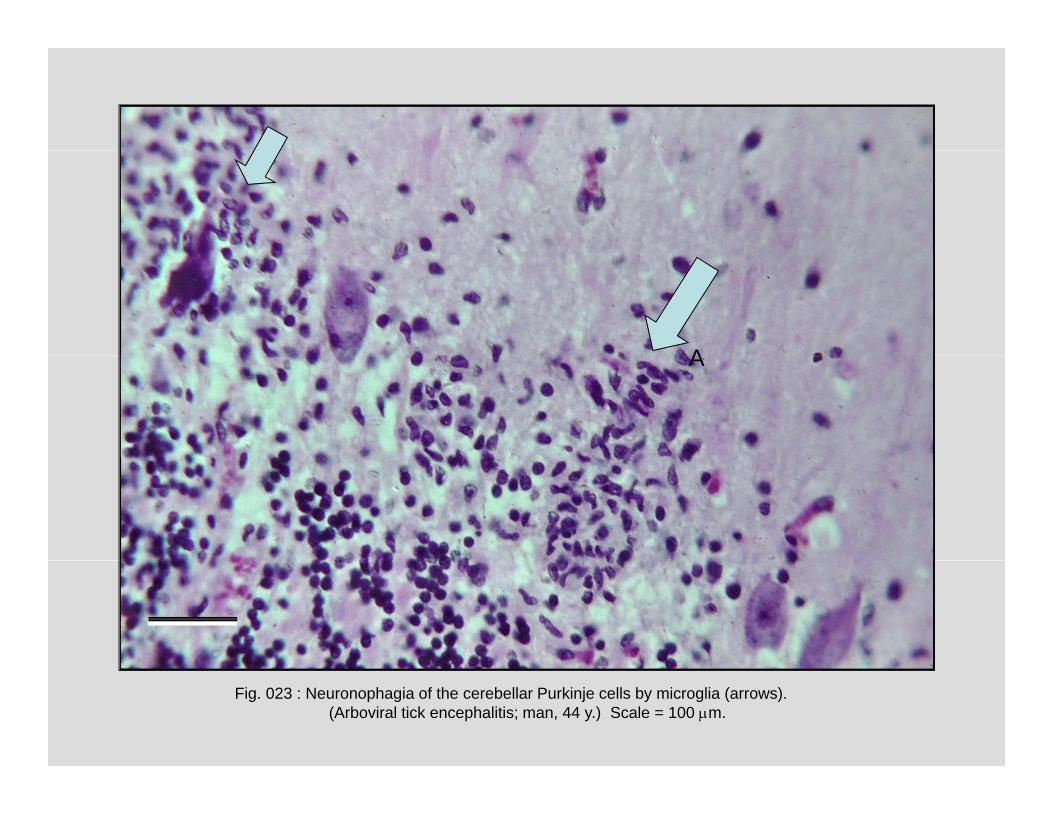
AA
Fig. 023 : Neuronophagia of the cerebellar Purkinje cells by microglia (arrows).(Arboviral tick encephalitis; man, 44 y.) Scale = 100 m.
Fig. 024 : Marinesco bodies in lipofuscin-containing neuron of substantia nigra (arrow). (Woman, 65 y.) Scale = 20 m.
A B
Fig. 025 : Negri body in the Purkinje neuron associated with rabies (A, arrow) and Lewy body in neuron of
substantia nigra (B, arrow) associated with parkinsonism. Scales = 20 m.
Pathophysiological aspects (edema, herniation)
Fig. 026 : Brain edema. The gyri are flattened.
Fig. 027 : Brain edema. Empty vacuolar spaces in neuropil – spongiosis (small arrow) and wide empty perivascular spaces(big arrow) are apparent. Scale = 20 m.
Fig. 028 : Herniation of the edematous brain tissue through the trepanation aperture. (Brain abscess and edema, woman, 31 y.)
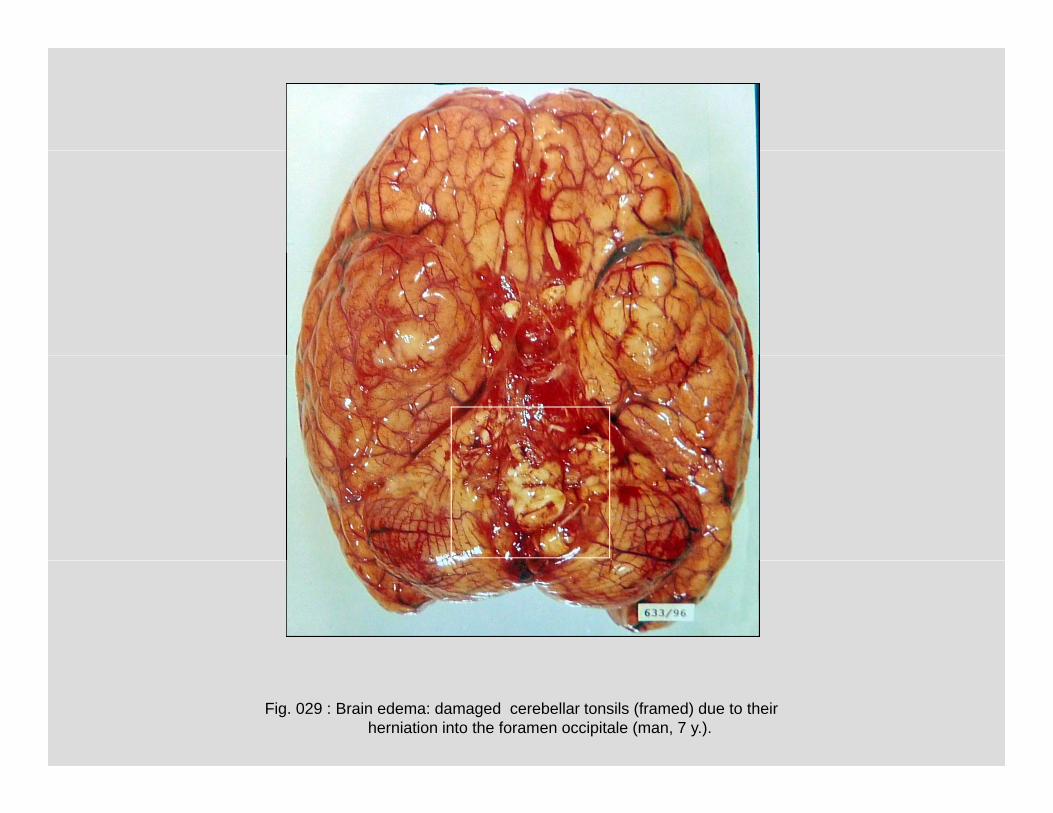
Fig. 029 : Brain edema: damaged cerebellar tonsils (framed) due to theirherniation into the foramen occipitale (man, 7 y.).
Fig. 030 : “The respirator brain”: an extreme brain edema accompanied with necrosis.Reduced or stopped blood perfusion due to highly raised intracranial pressure caused
global cerebral ischemia, autolysis and disintegration of brain. (Woman, 17 y., maintained on artificial ventilation.).
InfectionsInfections
B
C
Fig. 031 : Pyogenic (purulent) leptomeningitis with “pus cap “. Pus fills the subarachnoideal and perivascular
spaces (man 45 y ) Scales = B: 100 m C: 200 m
AC
spaces (man, 45 y.). Scales B: 100 m, C: 200 m.
Fig. 032 : Pus invades perineurium of a trigeminal nerve (arrow; man, 48 y.). Scale = 100m.
(B) contained numerous Mycobacteria (see next figure, woman, 6 y.). Scale = 200 m.
Fig. 037 : Acidoresistent Mycobacteria tuberculosis in the “specific“ granuloma (Ziehl-Nielsen staining, woman, 6 y.). Scale = 50 m.
A B
Fig. 038 : Fungal meningoencephalitis (Cryptococcus neoformans, torula). Torulous granuloma ( A - PAS staining; man, 28 y.) and numerous torulas in pia mater (B, Alcian blue staining, woman, 47 y.). Scales = A: 50 m, B: 100 m.
Fig. 039 : Cryptococci (torulas) under high power magnification. Scale = 50 m.
Fig. 040 : Multiple cryptococcal mini abscesses in basal ganglia. Whole-brain microscopical section, HE staining; man, 28 y.
A B C
D E
Fig. 041 : Poliomyelitis acuta anterior: normal ventral horn (A), loss of destroyed motoneurons (B), neuronophagia (C, D). Perivascular lymphocytic infiltrates are typical (E).
cystozoits of Toxoplasma gondii in cerebral cortex. C: toxoplasmic pseudocyst. Scales = B: 20 m, C: 50 m.
B C
Fig 046 : Brain toxoplasmic pseudocysts filled with cystozoits
A B
Fig. 046 : Brain toxoplasmic pseudocysts filled with cystozoits. Scales = A: 20 m, B: 10 m.
Fig. 047 : Cysticercosis: larval stage of Taenia solium in cerebral cysticercal pseudocyst.
A B
Scales = A: 2 mm, B: 0.5 mm.
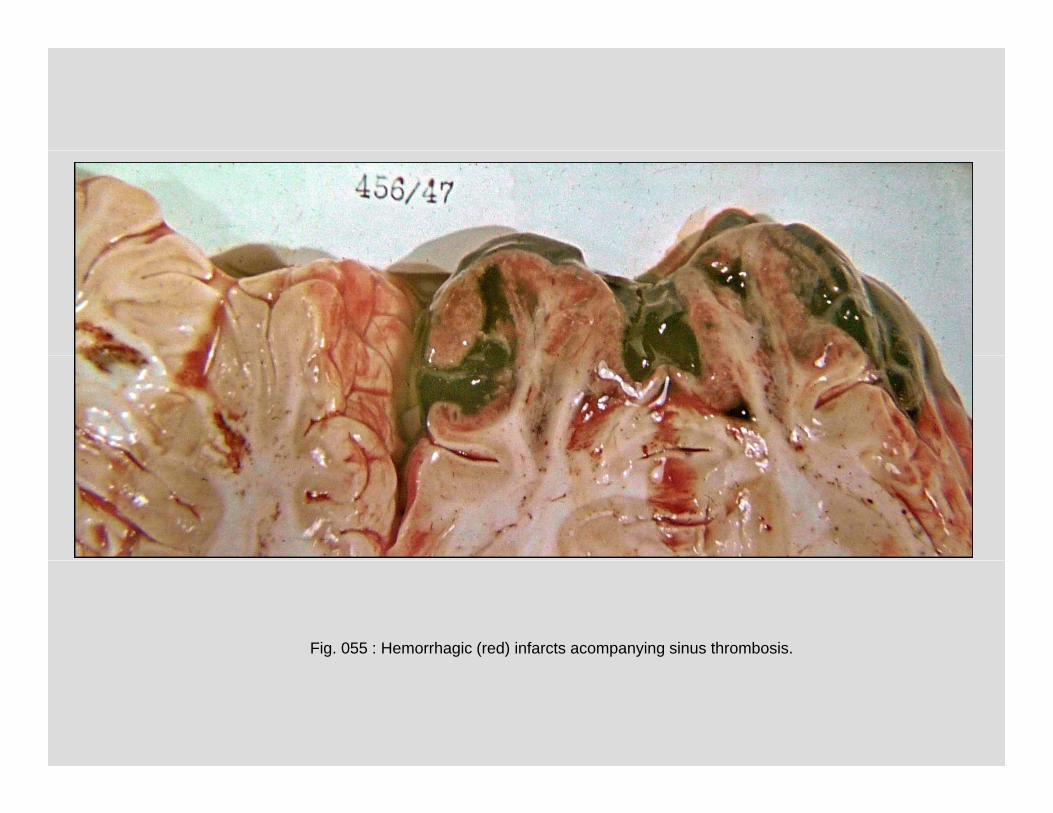
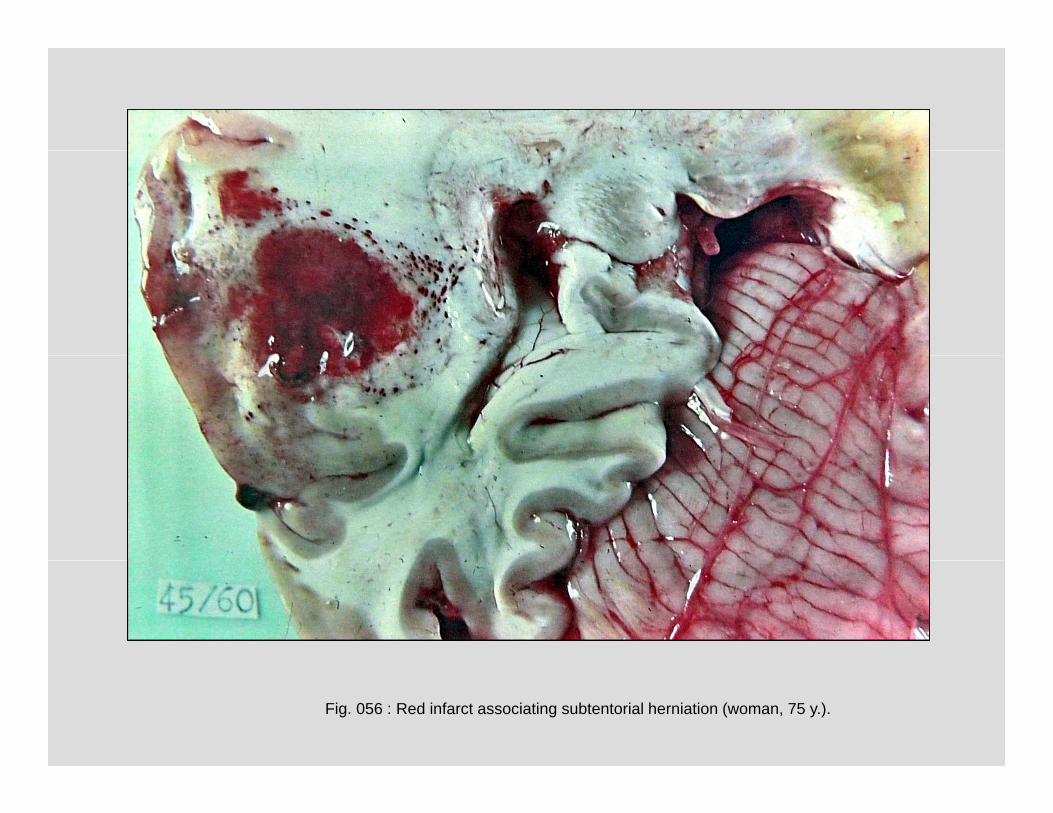
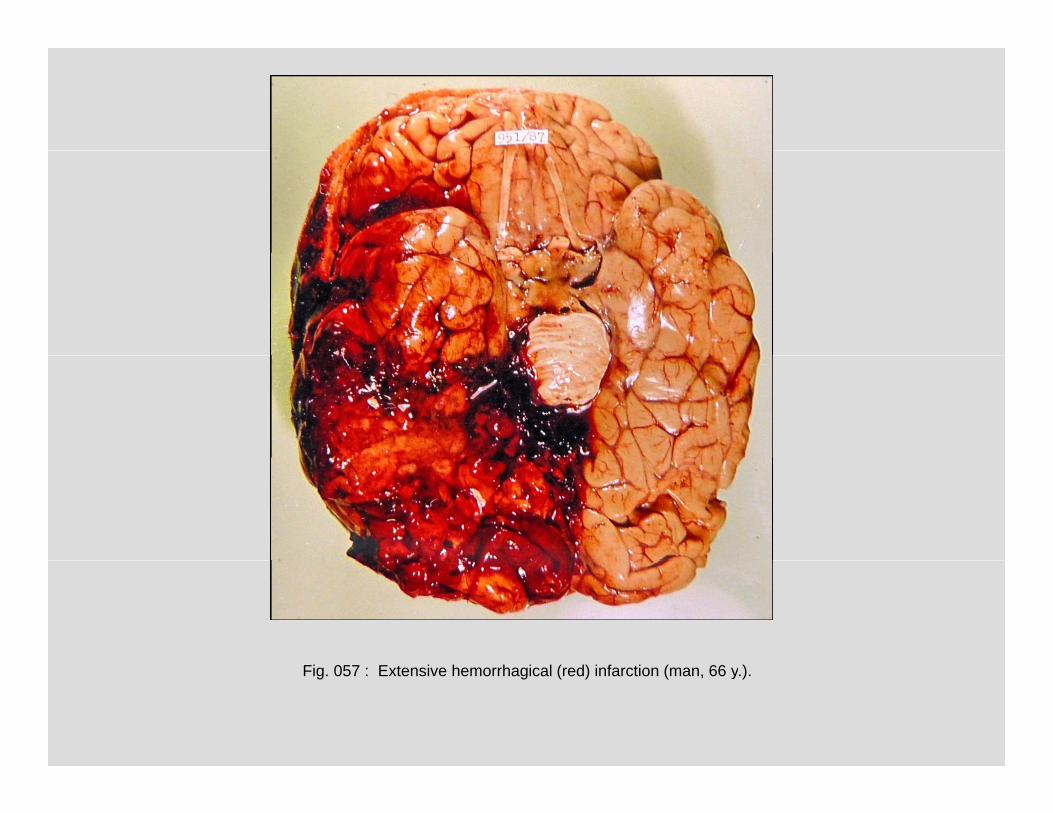
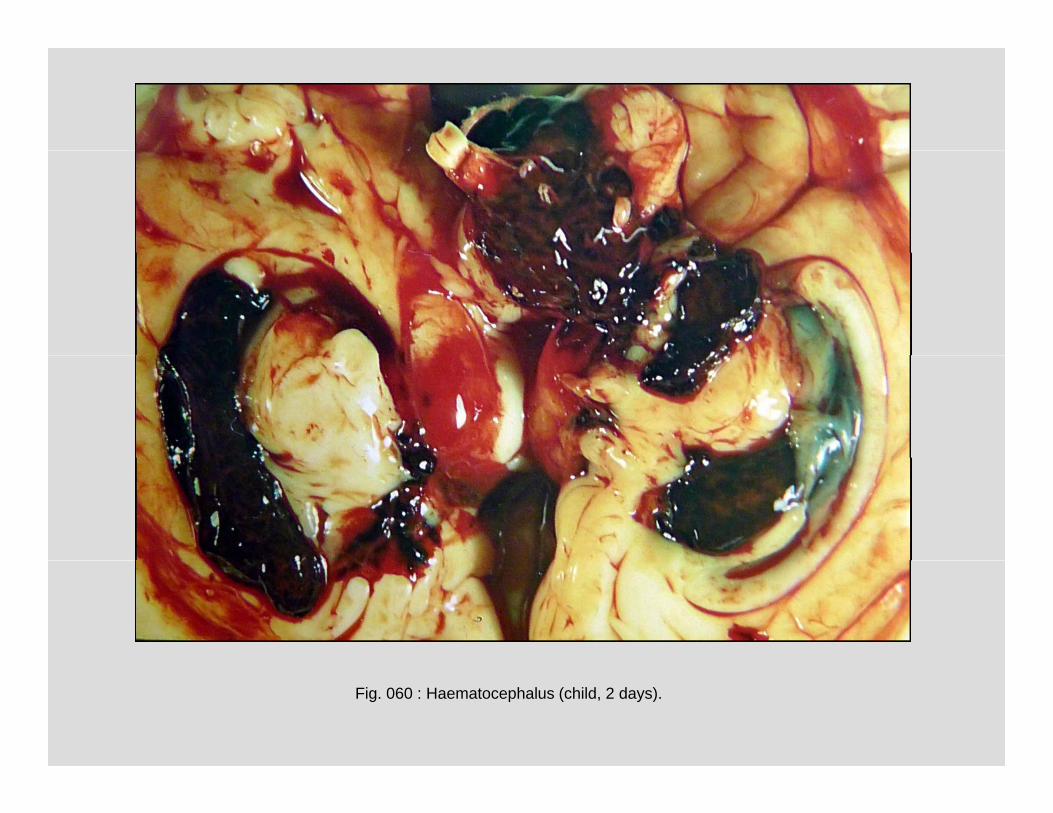
Vascular diseasesVascular diseases
Fig. 048 : Atherosclerosis of basilar artery (woman, 85 y. ; note hard yellowish atheromarous plaque in sigmoidly deformed artery).
A B C
Fig. 049 : CT of normal brain (A) compared with CT of the brain after a stroke (C). The infarct, 3D reconstructed in B, is
marked by arrow.
A
Fig. 050 : Necrotic tissue of the ischemic infarct (encephalomalacia – A, woman, 65 y.) is phagocytosed by activated
microglia and blood monocytes modified into spherical “gitter“ cells. Scales = B: 250 m, C: 100 m.
B C
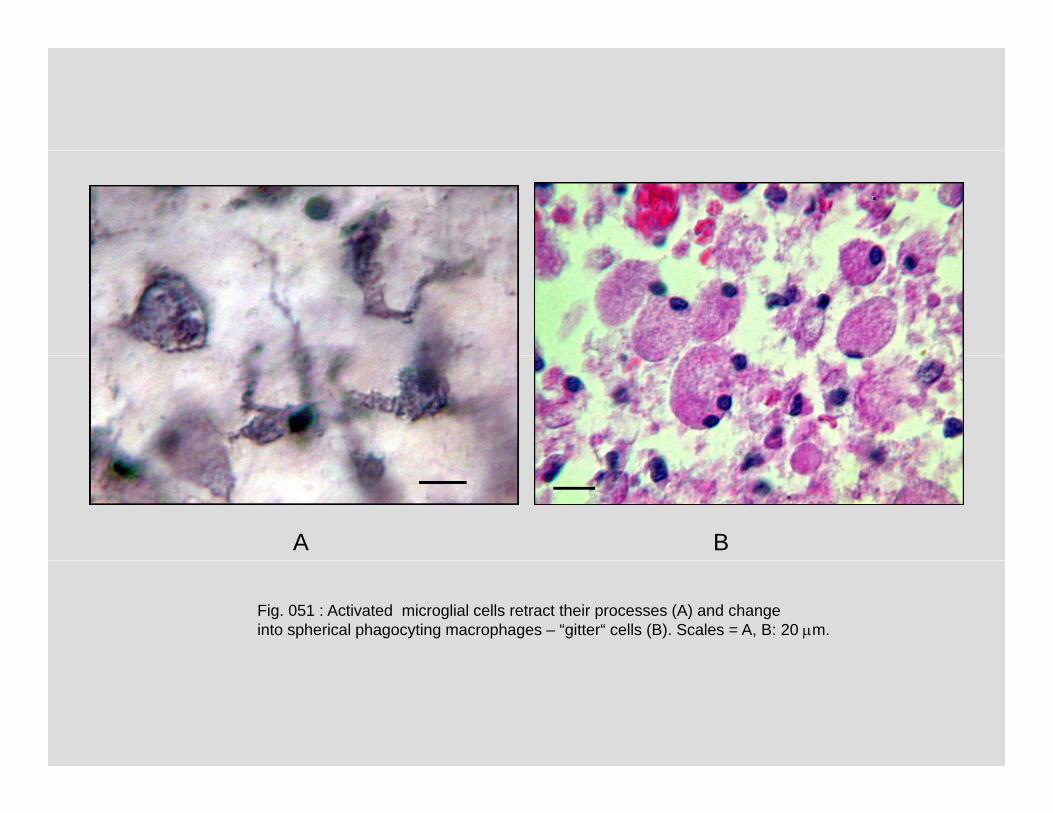
A B
Fig. 051 : Activated microglial cells retract their processes (A) and changeinto spherical phagocyting macrophages – “gitter“ cells (B). Scales = A, B: 20 m.
Fig. 052 : Postnecrotic pseudocyst in the pons (man, 42 y.). Scale = 5 mm.
A
B CFig. 053 : Astrocytes in a gliosis – a glial scar formed in the wall of older postnecrotic pseudocysts and in surroundings
of tumors are hypertrophic. Their enlarged cell bodies become rounded, sometimes binucleated. They are called gemistocytes. A – HE staining, B, C – Cajal gold sublimate impregnation.
g ( y ) y p y ( , ; , y ) yof lamina elastica is marked by arrow (B, fuchsin). Scale = 100 m.
B
A
B
Fig. 066 : Thrombosed aneurysm of basilar artery (A, arrow; man, 58 y.). B – transverse section.
A
g y y ( , ; , y )
Fig. 067 : Ruptured aneurysm of basilar artery (framed) caused extensive b h id h h (A 70 ) Ci l t i Willi i ith
A B
subarachnoid hemorrhage (A; man, 70 y.). Circulus arteriosus Willisi with aneurysm of anterior communicating artery was prepared out from subarachnoid hematoma (B).
TraumasTraumas
Fig. 068 : Brain parenchymal laceration associated with a head trauma (man, 25 y.).
A B
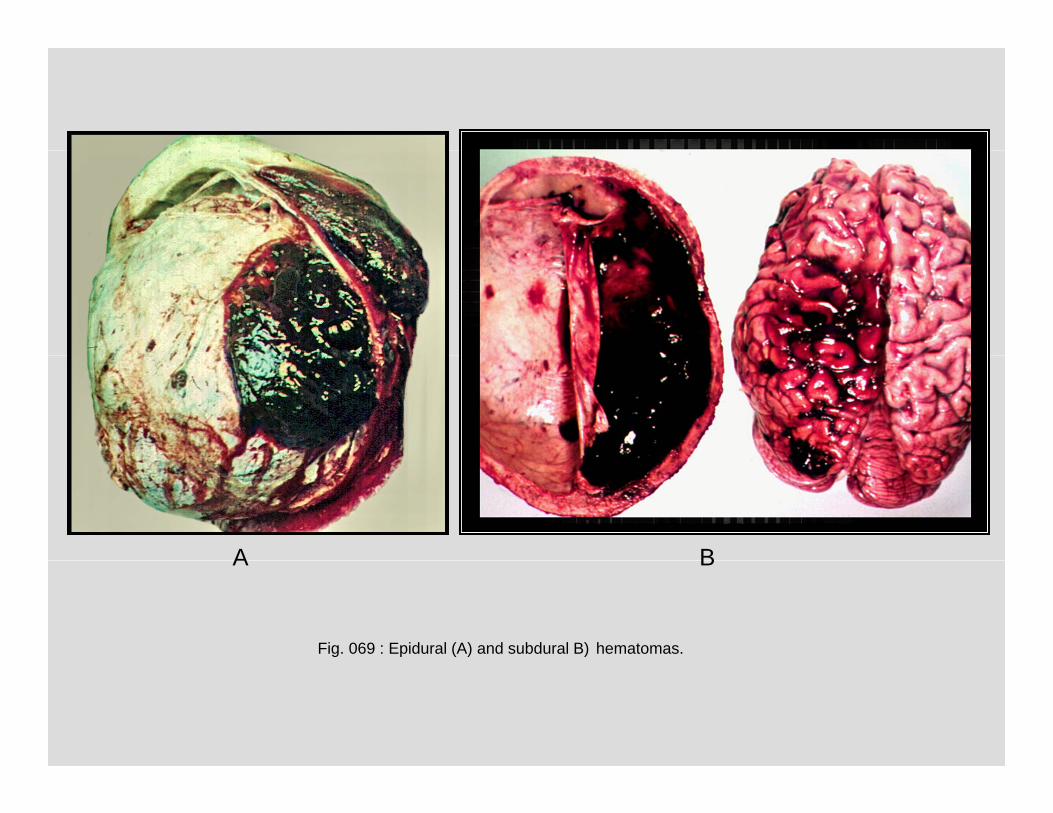
Fig. 069 : Epidural (A) and subdural B) hematomas.
A B
A B
Fig. 070 : Chronic subdural hematomas.
A B
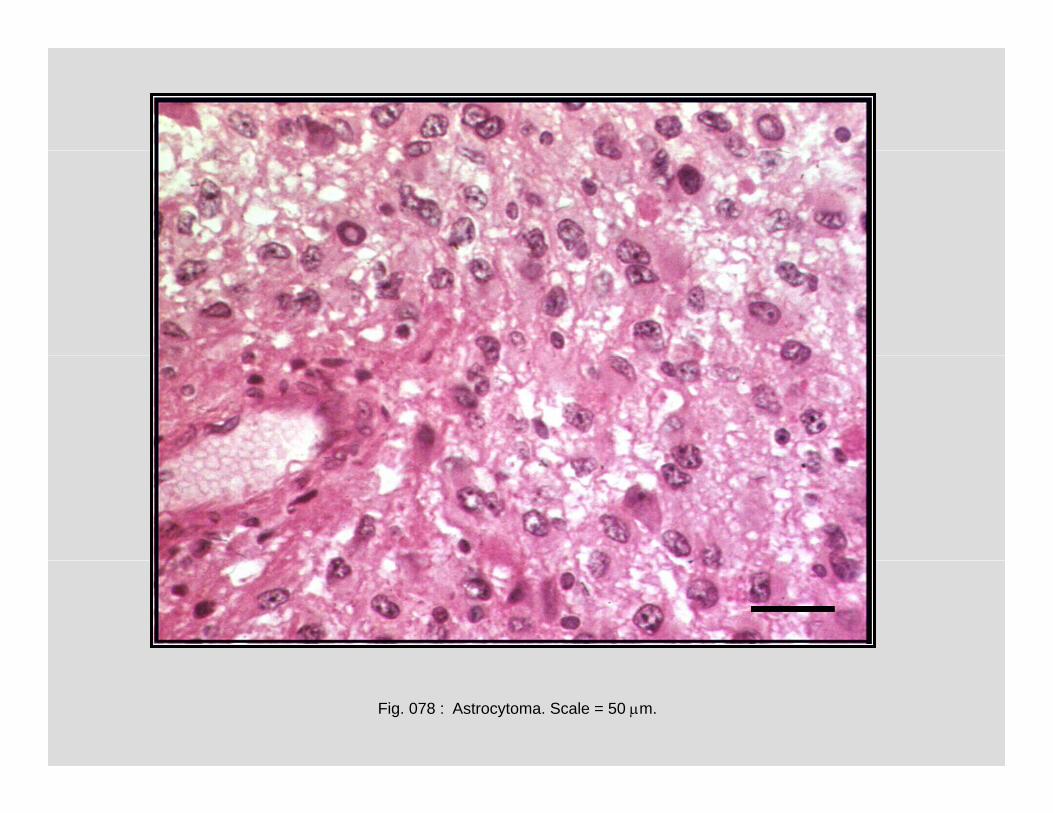
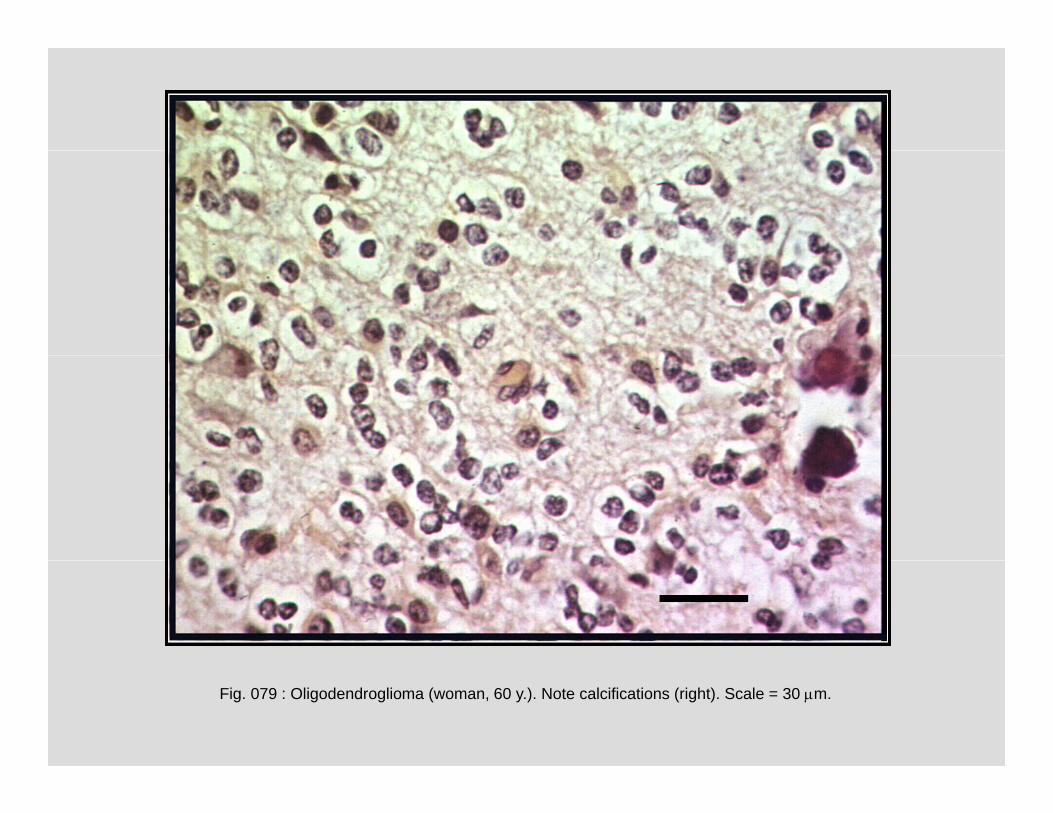
TumorsTumors
A B
C
Fig. 071 : Meningeoma. (B – an impression of tumor into the brain parenchyma.) Scale = 100 m.
C
Fig. 072 : Tumorous infiltration of leptomeninx by malignant lymphoma cells (child, 3 y.). Scale = 100 m.g p y g y p ( , y )
B
A C
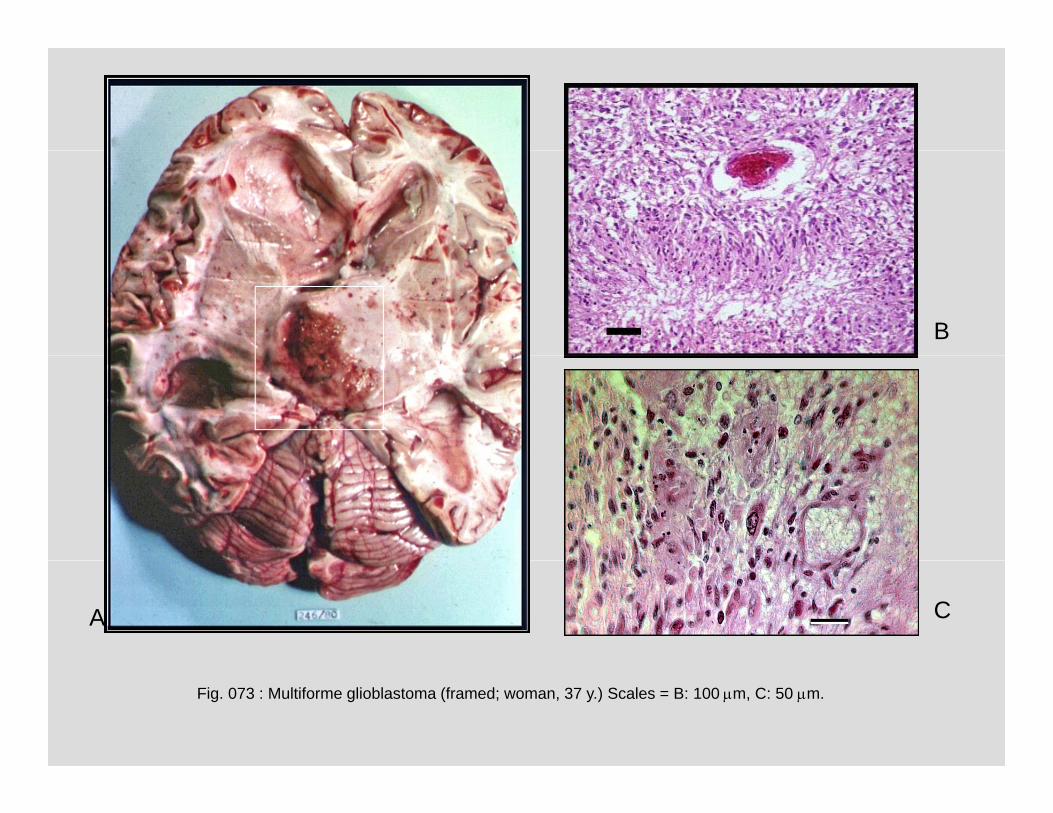
Fig. 073 : Multiforme glioblastoma (framed; woman, 37 y.) Scales = B: 100 m, C: 50 m.
Fig. 080 : Plexus papilloma (large field microscopical section, HE staining; man, 57 y.)
A B
Fig. 081 : Plexus papilloma (A - large field microscopical section, HE staining; arrow; man, 17 y.)Calcifying psammoma bodies were apparent (B - arrows). Scale = 200 m.
A B
Fig. 082 : Astroblastoma (malignant astrocytoma) in the pons (child, 1 y.).
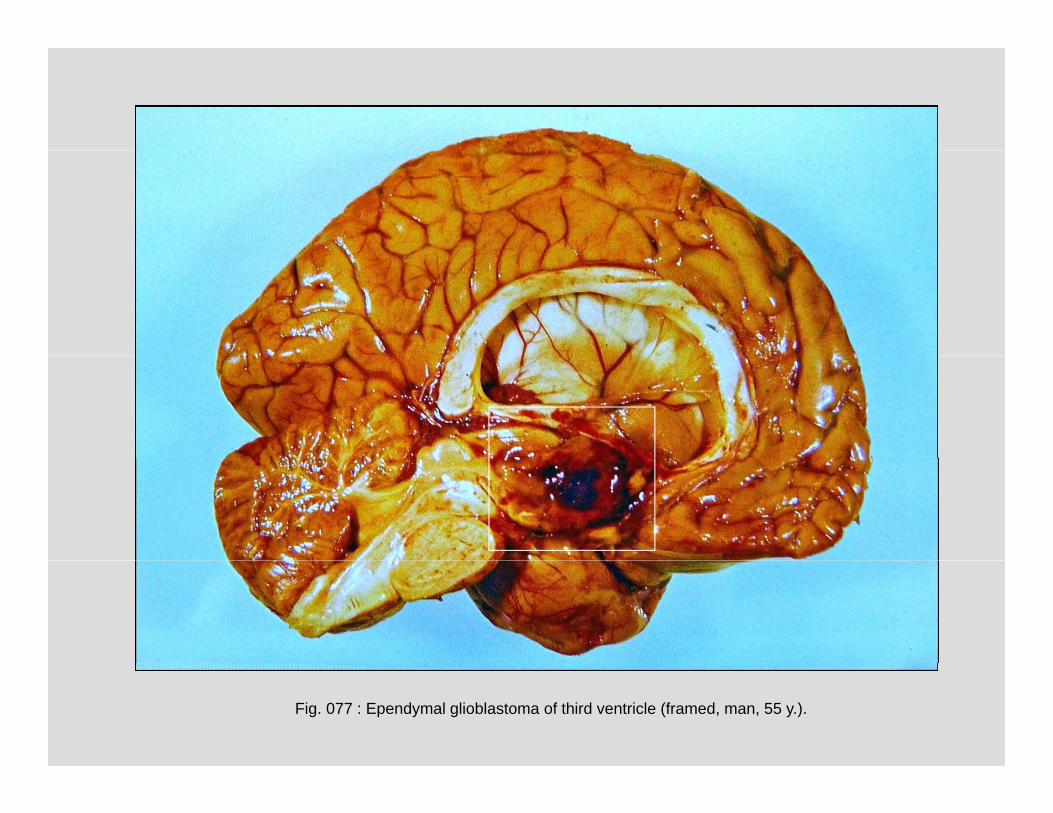
Fig. 083 : Glioma of medulla oblongata (man, 19 y).
A
B C
Fig. 084 : Neurinoma nervi VIII. (A, framed; man, 59 y.). Scales = B: 5 mm, C: 200 m.
Fig. 086 : Metastases of spinocellular carcinoma from lungs (framed; woman, 50 y.).
Fig. 087 : Metastasis of carcinoma in cerebellum (framed; man, 52 y.)
A B
Fig. 088 : Brain metastases of malignant melanoma (A) and lung carcinoma (B).Scales = 200 m.
Degenerative diseasesDegenerative diseases
Fig. 089 : Alzheimer’s disease: asteroid plaques in cerebral cortex (man, 71 y.) Scale = 100 m.
Fig. 090 : Alzheimer’s disease: neurofibrillar tangles in the pyramidal cell (arrow). Scale = 50 m.
Fig. 091 : Inclusions in astrocytes, in this case accompanying Alzheimer’s
A Bg y , p y g
and CADASIL (arteriopathic encephalopathy) disease (Masson trichrome staining; man, 71 y.). Scale = 20 m.
Fig. 092 : Alzheimer’s disease: cerebral atrophy. Note narrowed gyri and widened sulci among them.(Man, 65 y.)
Fig. 093 : Atrophy of the left hemisphere, in this case accompanying epilepsy.(Man, 17 y.)
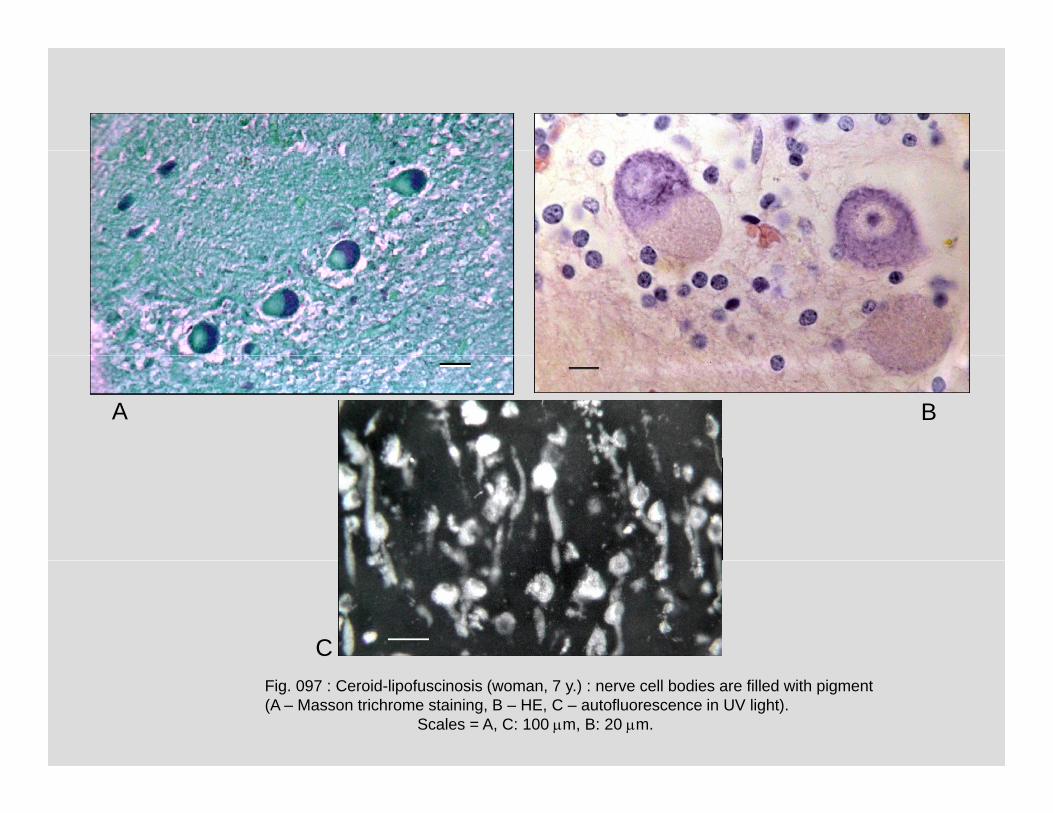
Demyelinating diseasesDemyelinating diseases
B
C
Fig. 094 : Multiple sclerosis: demyelinated plaques in the wall of the lateral ventricle (A, arrows; man, 69 y.), i l d (B L l F t Bl ) d i l t (C L l F t Bl t i k)
A
spinal cord (B, Luxol Fast Blue, arrow), and spinal root (C, Luxol Fast Blue, asterisk). Scales = B: 5 mm, C: 200 m.
CFig. 097 : Ceroid-lipofuscinosis (woman, 7 y.) : nerve cell bodies are filled with pigment(A – Masson trichrome staining, B – HE, C – autofluorescence in UV light).
Scales = A, C: 100 m, B: 20 m.
Fig. 098 : Schilder disease (adrenoleukodystrophy). Note the extensive demyelinization
of white matter in the right slice. (Woman, 3 y.).
A BA B
Fig. 099 : Schilder disease (man, 50 y.). Accumulation of sudanophilic macrophages,mainly perivascularly. A – HE. B – Sudan staining. Scales = 200 m.
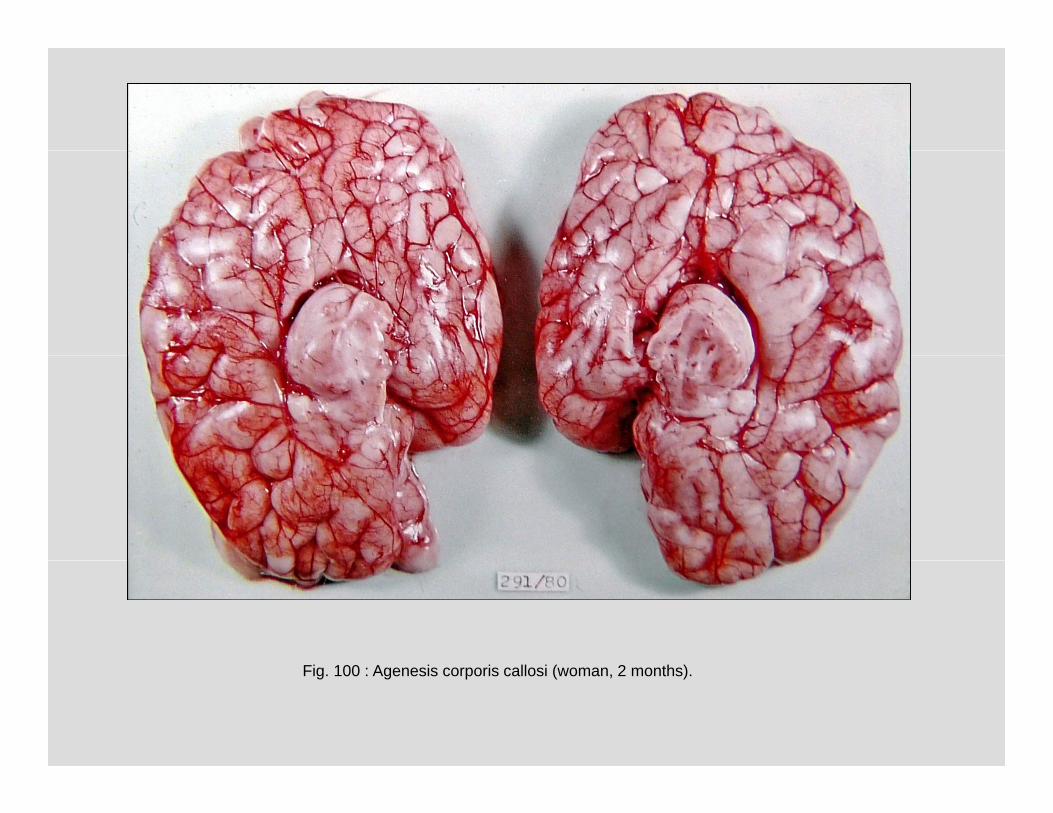
Anomalies and malformationsAnomalies and malformations
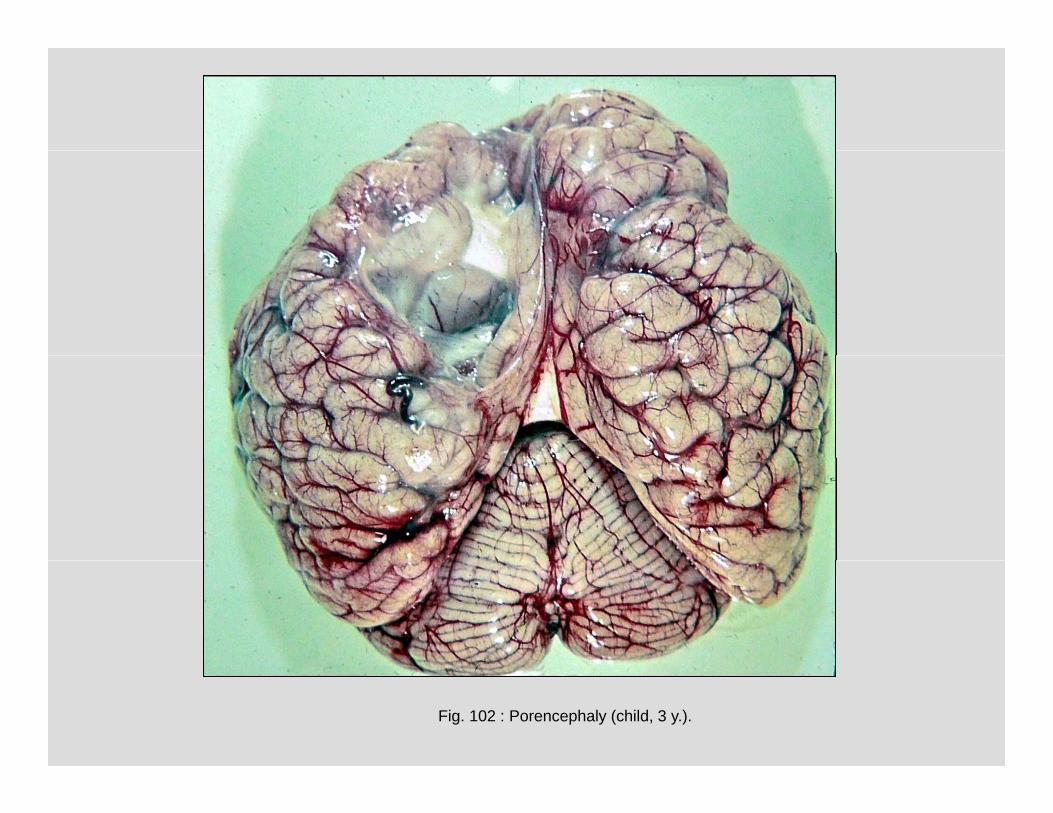
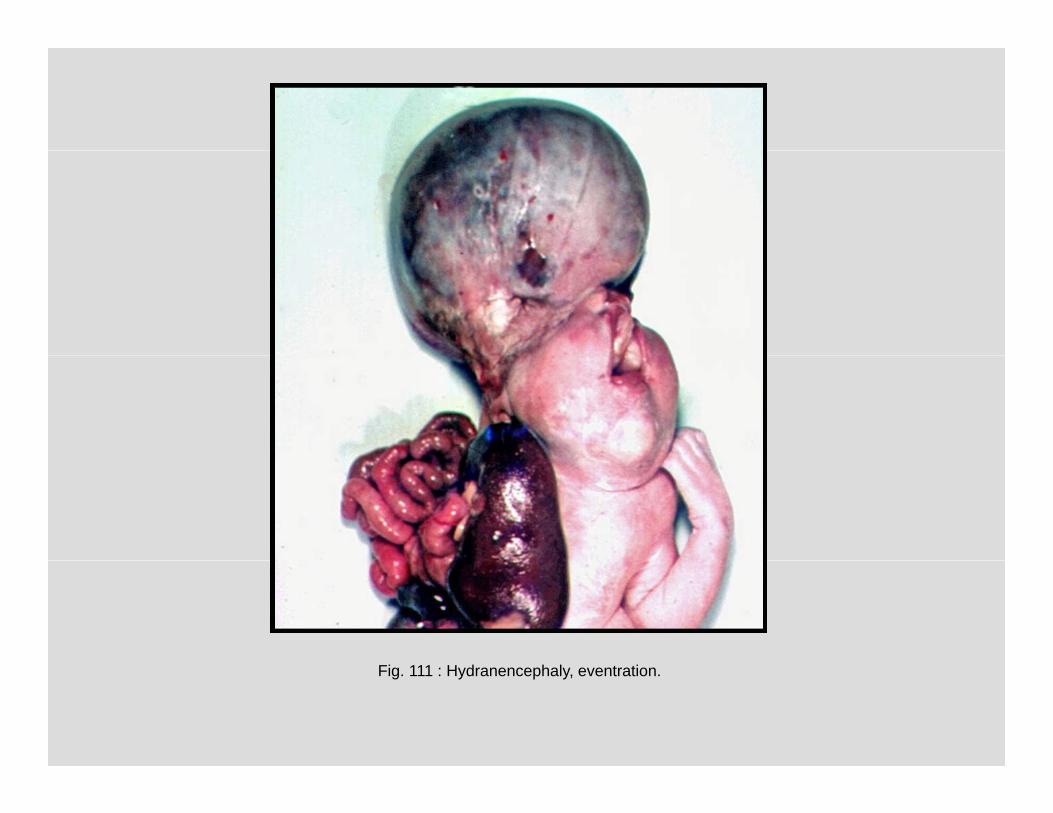
Fig. 100 : Agenesis corporis callosi (woman, 2 months).
Copyright 2013 Any use of this material should be cited:Copyright 2013. Any use of this material should be cited:SynapseWeb, http://synapses.clm.utexas.edu/