35
Basics of regression analysis Federico Tamagni IE/LEM, Scuola Superiore Sant’Anna Federico Tamagni Microeconometrics
Basics of regression analysis
Federico Tamagni
IE/LEM, Scuola Superiore Sant’Anna
Federico Tamagni Microeconometrics
Regression analysis
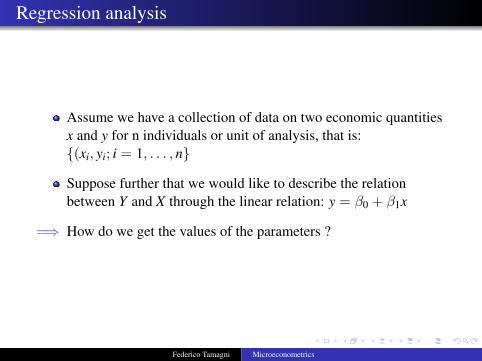
Assume we have a collection of data on two economic quantitiesx and y for n individuals or unit of analysis, that is:{(xi, yi; i = 1, . . . , n}
Suppose further that we would like to describe the relationbetween Y and X through the linear relation: y = β0 + β1x
=⇒ How do we get the values of the parameters ?
Federico Tamagni Microeconometrics
Linear Fit Problem
Federico Tamagni Microeconometrics
Linear Fit Problem
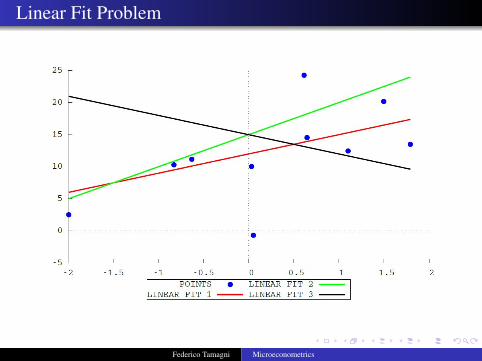
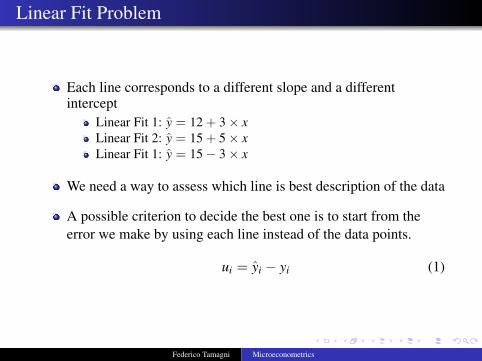
Each line corresponds to a different slope and a differentintercept
Linear Fit 1: y = 12 + 3× xLinear Fit 2: y = 15 + 5× xLinear Fit 1: y = 15− 3× x
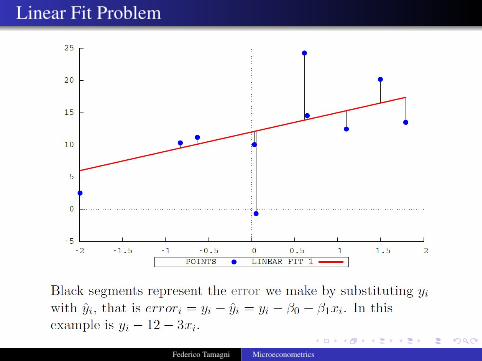
We need a way to assess which line is best description of the data
A possible criterion to decide the best one is to start from theerror we make by using each line instead of the data points.
ui = yi − yi (1)
Federico Tamagni Microeconometrics
Linear Fit Problem
Federico Tamagni Microeconometrics
Linear Fit Problem
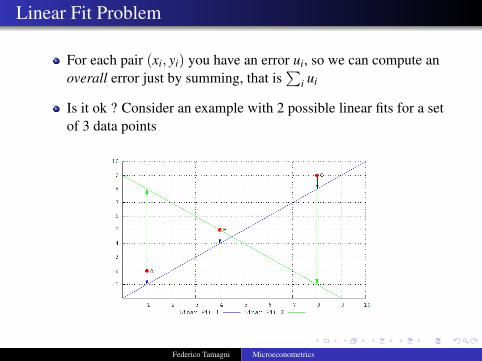
For each pair (xi, yi) you have an error ui, so we can compute anoverall error just by summing, that is
∑i ui
Is it ok ? Consider an example with 2 possible linear fits for a setof 3 data points
Federico Tamagni Microeconometrics

Linear Fit Problem
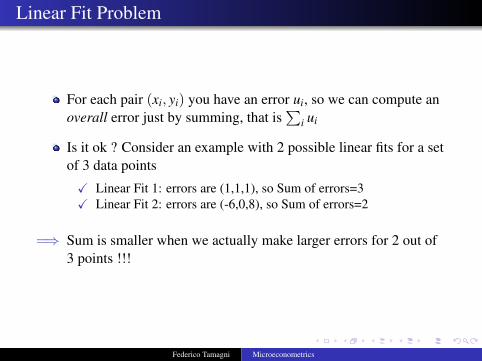
For each pair (xi, yi) you have an error ui, so we can compute anoverall error just by summing, that is
∑i ui
Is it ok ? Consider an example with 2 possible linear fits for a setof 3 data points
X Linear Fit 1: errors are (1,1,1), so Sum of errors=3X Linear Fit 2: errors are (-6,0,8), so Sum of errors=2
=⇒ Sum is smaller when we actually make larger errors for 2 out of3 points !!!
Federico Tamagni Microeconometrics
Linear Fit Problem
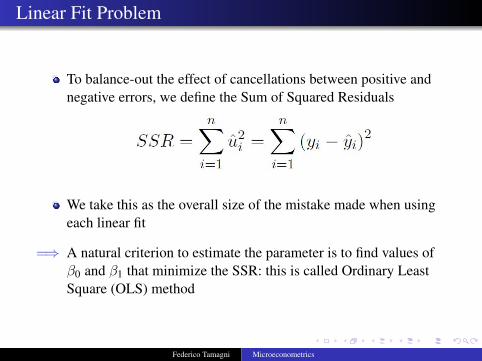
To balance-out the effect of cancellations between positive andnegative errors, we define the Sum of Squared Residuals
We take this as the overall size of the mistake made when usingeach linear fit
=⇒ A natural criterion to estimate the parameter is to find values ofβ0 and β1 that minimize the SSR: this is called Ordinary LeastSquare (OLS) method
Federico Tamagni Microeconometrics
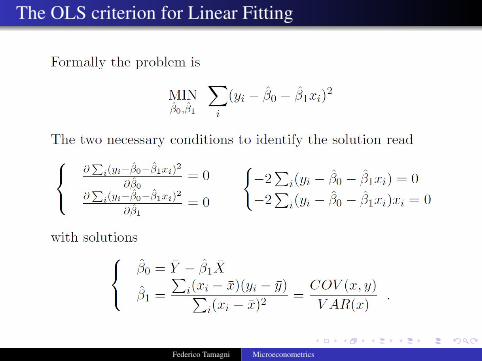
The OLS criterion for Linear Fitting
Federico Tamagni Microeconometrics
The OLS criterion for Linear Fitting
Federico Tamagni Microeconometrics
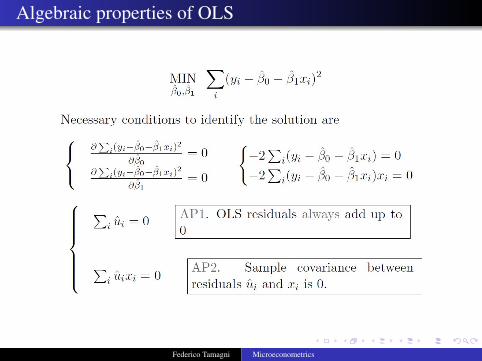
Algebraic properties of OLS
Federico Tamagni Microeconometrics
Why we like OLS ?
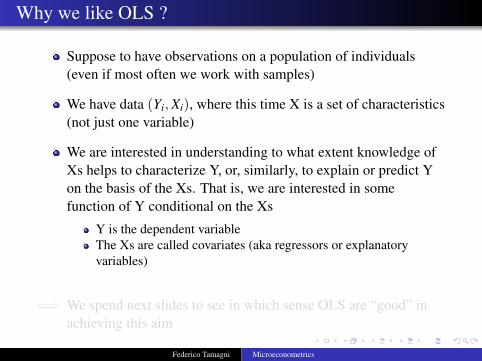
Suppose to have observations on a population of individuals(even if most often we work with samples)
We have data (Yi,Xi), where this time X is a set of characteristics(not just one variable)
We are interested in understanding to what extent knowledge ofXs helps to characterize Y, or, similarly, to explain or predict Yon the basis of the Xs. That is, we are interested in somefunction of Y conditional on the Xs
Y is the dependent variableThe Xs are called covariates (aka regressors or explanatoryvariables)
=⇒ We spend next slides to see in which sense OLS are “good” inachieving this aim
Federico Tamagni Microeconometrics
Why we like OLS ?
Suppose to have observations on a population of individuals(even if most often we work with samples)
We have data (Yi,Xi), where this time X is a set of characteristics(not just one variable)
We are interested in understanding to what extent knowledge ofXs helps to characterize Y, or, similarly, to explain or predict Yon the basis of the Xs. That is, we are interested in somefunction of Y conditional on the Xs
Y is the dependent variableThe Xs are called covariates (aka regressors or explanatoryvariables)
=⇒ We spend next slides to see in which sense OLS are “good” inachieving this aim
Federico Tamagni Microeconometrics

Why we like OLS ?
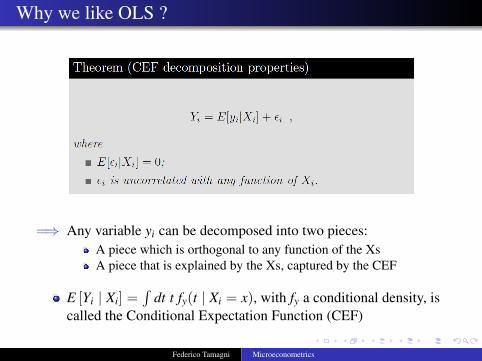
=⇒ Any variable yi can be decomposed into two pieces:A piece which is orthogonal to any function of the XsA piece that is explained by the Xs, captured by the CEF
E [Yi | Xi] =∫
dt t fy(t | Xi = x), with fy a conditional density, iscalled the Conditional Expectation Function (CEF)
Federico Tamagni Microeconometrics
Why we like OLS ?
=⇒ Any variable yi can be decomposed into two pieces:A piece which is orthogonal to any function of the XsA piece that is explained by the Xs, captured by the CEF
E [Yi | Xi] =∫
dt t fy(t | Xi = x), with fy a conditional density, iscalled the Conditional Expectation Function (CEF)
Federico Tamagni Microeconometrics

CEF example 1
Federico Tamagni Microeconometrics

CEF example 2
Federico Tamagni Microeconometrics
Why we like OLS ?
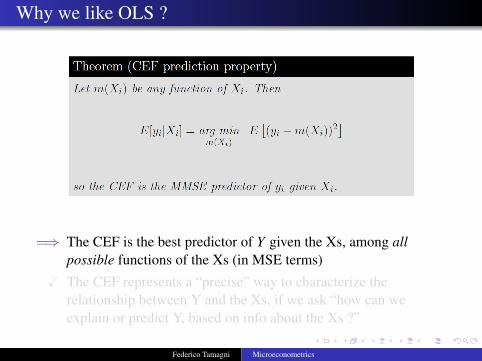
=⇒ The CEF is the best predictor of Y given the Xs, among allpossible functions of the Xs (in MSE terms)
X The CEF represents a “precise” way to characterize therelationship between Y and the Xs, if we ask “how can weexplain or predict Y, based on info about the Xs ?”
Federico Tamagni Microeconometrics
Why we like OLS ?
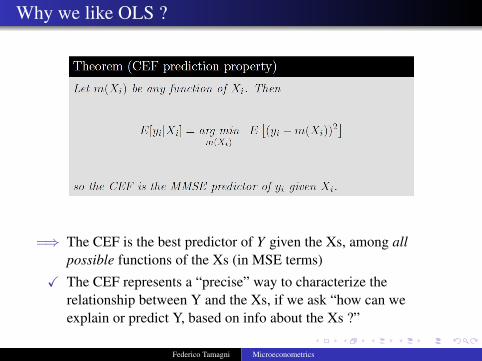
=⇒ The CEF is the best predictor of Y given the Xs, among allpossible functions of the Xs (in MSE terms)
X The CEF represents a “precise” way to characterize therelationship between Y and the Xs, if we ask “how can weexplain or predict Y, based on info about the Xs ?”
Federico Tamagni Microeconometrics
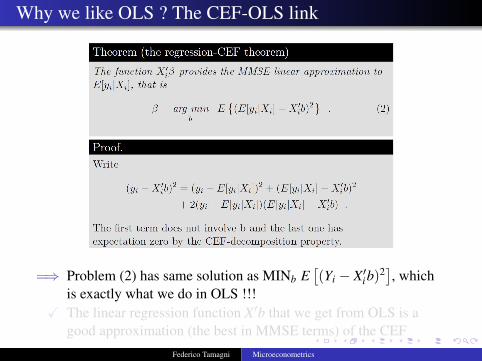
Why we like OLS ? The CEF-OLS link
=⇒ Problem (2) has same solution as MINb E[(Yi − X′
ib)2], which
is exactly what we do in OLS !!!X The linear regression function X′b that we get from OLS is a
good approximation (the best in MMSE terms) of the CEFFederico Tamagni Microeconometrics
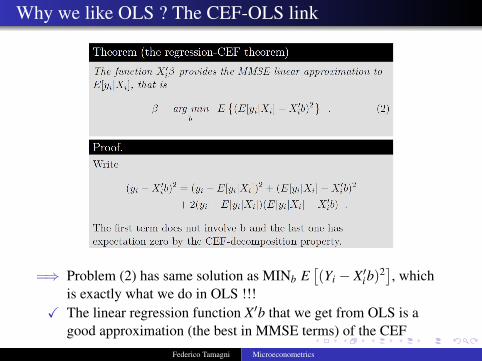
Why we like OLS ? The CEF-OLS link
=⇒ Problem (2) has same solution as MINb E[(Yi − X′
ib)2], which
is exactly what we do in OLS !!!X The linear regression function X′b that we get from OLS is a
good approximation (the best in MMSE terms) of the CEFFederico Tamagni Microeconometrics
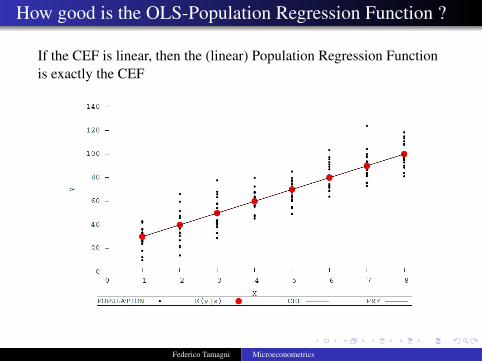
How good is the OLS-Population Regression Function ?
If the CEF is linear, then the (linear) Population Regression Functionis exactly the CEF
Federico Tamagni Microeconometrics
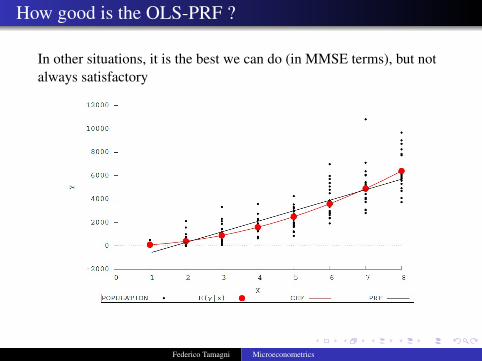
How good is the OLS-PRF ?
In other situations, it is the best we can do (in MMSE terms), but notalways satisfactory
Federico Tamagni Microeconometrics
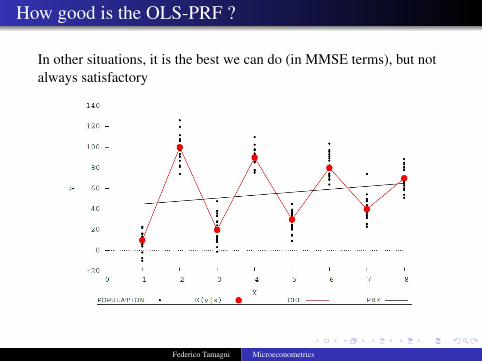
How good is the OLS-PRF ?
In other situations, it is the best we can do (in MMSE terms), but notalways satisfactory
Federico Tamagni Microeconometrics
OLS Regression recap and properties
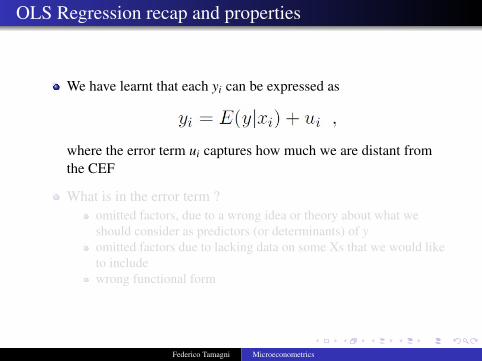
We have learnt that each yi can be expressed as
where the error term ui captures how much we are distant fromthe CEF
What is in the error term ?omitted factors, due to a wrong idea or theory about what weshould consider as predictors (or determinants) of yomitted factors due to lacking data on some Xs that we would liketo includewrong functional form
Federico Tamagni Microeconometrics
OLS Regression recap and properties
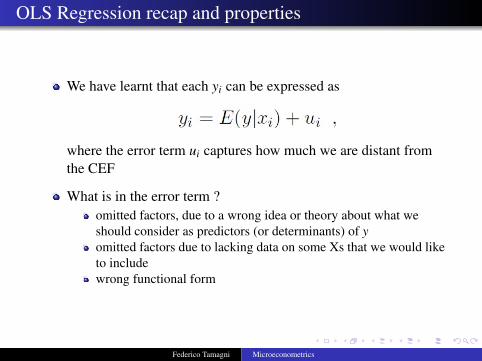
We have learnt that each yi can be expressed as
where the error term ui captures how much we are distant fromthe CEF
What is in the error term ?omitted factors, due to a wrong idea or theory about what weshould consider as predictors (or determinants) of yomitted factors due to lacking data on some Xs that we would liketo includewrong functional form
Federico Tamagni Microeconometrics
OLS Regression recap and properties
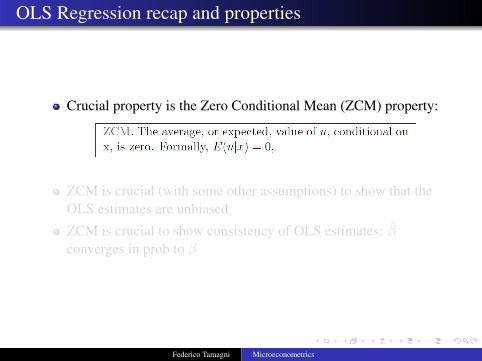
Crucial property is the Zero Conditional Mean (ZCM) property:
ZCM is crucial (with some other assumptions) to show that theOLS estimates are unbiased
ZCM is crucial to show consistency of OLS estimates: βconverges in prob to β
Federico Tamagni Microeconometrics

OLS Regression recap and properties
Crucial property is the Zero Conditional Mean (ZCM) property:
ZCM is crucial (with some other assumptions) to show that theOLS estimates are unbiased
ZCM is crucial to show consistency of OLS estimates: βconverges in prob to β
Federico Tamagni Microeconometrics
OLS Regression recap and properties
Do not forget that OLS confine the attention to the expectedvalue of the conditional distribution of y give X
In general, one may be interested into other features of the samedistribution, so we would need different techniques in that caseThe conditional expected value might be particularly meaninglessif y has a very skewed distribution, since in that case the mean ofy says little
Do not forget that the OLS weights a lot large errors (takingsquares of the distance from linear fit line)
This means that few outliers can dramatically influence theestimates of the parametersOften you either drop the outliers (if they are just few data-points)or look for different techniques that are less influenced by outliers
Federico Tamagni Microeconometrics

OLS Regression recap and properties
One popular and easy correction for outliers is Least AbsoluteDeviation (LAD)
Federico Tamagni Microeconometrics
OLS Regression: recap and properties
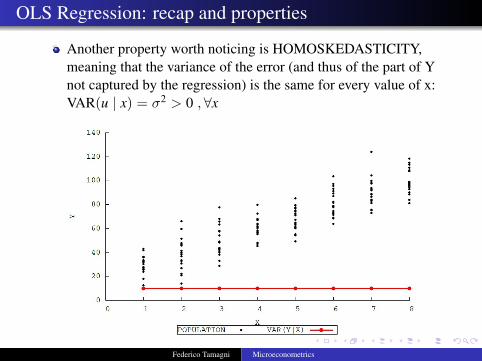
Another property worth noticing is HOMOSKEDASTICITY,meaning that the variance of the error (and thus of the part of Ynot captured by the regression) is the same for every value of x:VAR(u | x) = σ2 > 0 ,∀x
Federico Tamagni Microeconometrics
OLS Regression recap and properties
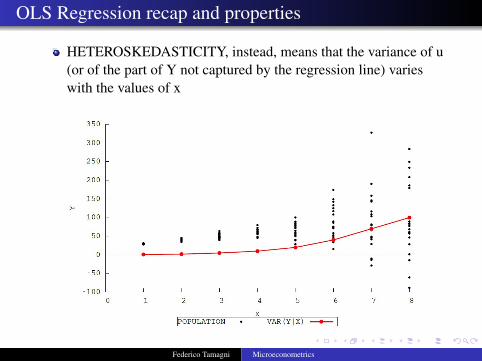
HETEROSKEDASTICITY, instead, means that the variance of u(or of the part of Y not captured by the regression line) varieswith the values of x
Federico Tamagni Microeconometrics
Regression analysis: final remarks
This was a highly simplified presentation: many other problemsremain in practical work
The practice of econometrics is mostly to deal with real-worldsituation where OLS assumptions are difficult to maintain (e.g.,recall sample-selection or endogeneity discussed in Gibrat’sregression)
Maximum-likelihood is a general alternative, flexible and able toalso account for non-linearities: the idea is to assume adistribution for the errors, and then write the joint probabilitydensity and maximize it (e.g., recall above discussion aboutparametric density estimation, or the non-linear estimation of thescaling relationship between variance of growth and size)
Nevertheless, it is useful as a benchmark: economists like toframe their research questions as “Is there an impact of a certainvariable X on the value of an outcome value Y, and if so howstrong is it ?”
Federico Tamagni Microeconometrics


