Basin-Scale Hydrological Impact of Geologic Carbon Sequestration in the Illinois Basin: A Full-Scale D l tS i Deployment Scenario Quanlin Zhou, Jens Birkholzer Earth Sciences Division Lawrence Berkeley National Laboratory, Berkeley, CA Hannes Leetaru, Edward Mehnert Illinois State Geological Survey Champaign IL Illinois State Geological Survey , Champaign, IL Midwest Geological Sequestration Consortium (MGSC) Yu-Feng Lin Yu-Feng Lin Illinois State Water Survey, Champaign, IL
Transcript
Basin-Scale Hydrological Impact of Geologic Carbon Sequestration in the Illinois Basin: A Full-Scale
World Oil Production in 2006: 4.3 × 10⁹ m3 (73.54 million barrel/day)World CO2 Emissions in 2006: 36.5 × 10⁹ m3 (29.2 billion metric ton CO2/year)
US Oil C ti i 2006 1 2 109 3 (7 55 billi b l / )
Year Year
US Oil Consumption in 2006: 1.2 × 10⁹ m3 (7.55 billion barrels/year)US CO2 Emissions in 2006: 7.4 × 10⁹ m3 (5.9 billion metric ton CO2/year)
US Class II Brine Injection: 2.8 × 10⁹ m3 (2 billion gallons/day in 144,000 wells)US G d t E t ti i 2000 117 0 109 3 (84 5 billi ll /d )US Groundwater Extraction in 2000: 117.0 × 10⁹ m3 (84.5 billion gallons/day)
The Scale and Magnitude of GCS is unprecedented
1.2. DOE Regional Partnerships
Site Characterization (2003-2005)
Validation Phase (2006-2009)
Demonstration Phase (2008-2017)
Illinois Basin Full-Scale Deployment (?-?)p y ( )
with the goal to effectively tomitigate climate change
1.3. Motivation and Objectives
1000
Wisconsin
Iowa
KRiv
erAr
ch
Wisconsin Arch
Km
GroundwaterResource Region
900
IndianaIllinois
Cincin
Kankakee Arch
Mis
siss
ippi
R
-500 m
700
800 Illinois Basin
nnatiArch
ADM Site
(Birkholzer et al., IJGGC, 2009)
S S C
-300-700-11001500
600
700
Ozark Dome
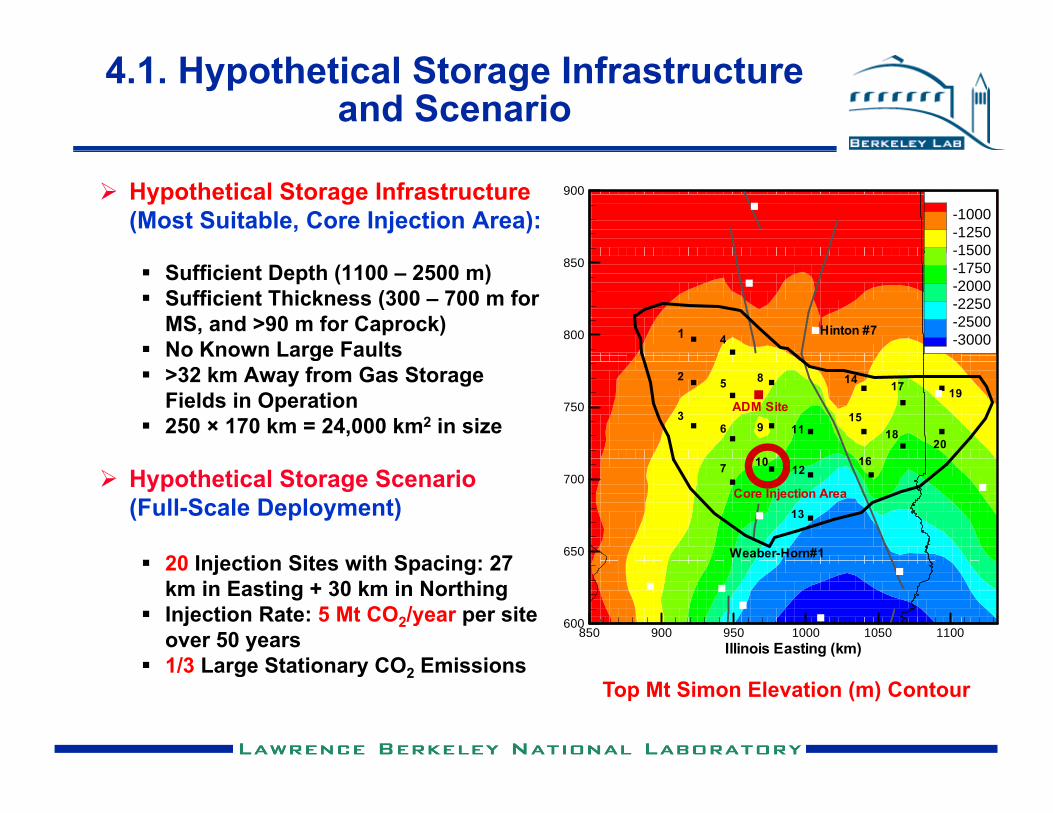
Core Injection Area m
Mt Simon Storage Capacity: 27-109 Gt CO2
Large Stationary CO2 Emissions:~300 Mt/Year
A U di Sl 8 /k
-1500-1900-2300-2700-3100-3500-3900-4300
500Missouri
Kentucky
Pascola Arch
-4300 m
Average Updip Slope: 8 m/km800 900 1000 1100 1200 1300 Km
Table of Contents
Site Characterization Groundwater Resources Development Natural Gas Storage Natural Gas Storage
Basin Hydrogeology Basin Geology H d l i P ti Hydrogeologic Properties Pre-Injection Conditions
Model Development Multi-Site CO2 Storage Scenario (Hypothetical) Three-Dimensional Basin-Scale Model
Simulation Results Plume-Scale Processes: CO2 Trapping Mechanisms Basin-Scale Processes: Pressure Buildup + Brine Migration Environmental Impact on Groundwater Resources Environmental Impact on Groundwater Resources
Summary and Conclusions
2. Site Characterization
Site Characterization Oil and Gas Exploration and Production Deep geo-boreholes for oil exploration One order of magnitude in production rate/volume less than GCS
Deep Waste Injection33 ll t 18 it i th Illi i B i 18 f hi h i t Mt Si 33 wells at 18 sites in the Illinois Basin, 18 of which are into Mt Simon
Injection rate of 1.2 million m3 in Illinois in 1984 Natural Gas Storage (Analog) G d t R D l t (A l ) Groundwater Resources Development (Analog) Ongoing Geologic Carbon Sequestration
Objectives To determine basin hydrogeology To have analogs for multiscale GCS processes To understand potential discharge/leakage pathways To know the scale of the problems
2.1 Basin Stratigraphy
Top
Maquoketa
Eau Claire
Ironton
bria
n
ian
Coal
Eau Claire
St. Peter
Cam
Ord
ovic
Mt. Simon
Precambrian GranitePrecambrian Granite
BottomPetroleum Production
2.2. Natural Gas Storage
2006 USA Illinois + Indiana
EIA, 2004
2006 USA Illinois + Indiana# of Aquifer Storage Fields 44 30Storage Capacity (109 m3, Standard T&P) 38.4 27.3Storage Capacity (109 m3, T=24oC, P=105 bar) 0.29 0.21
2.2. Natural Gas Storage (Cont.)
(5 km)
(18 km)
Manlove Natural Gas Storage Field
Secondary Seals(18 km) Secondary Seals
(Figures from Morse & Leetaru, MGSC, 2003)Herscher Natural Gas Storage Field
2.3. Groundwater Development) 450
500
ate
(106
m3 )
350
400
450
North-Central Illinois
umpi
ngR
a
200
250
300
Displaced Brine
Ann
ualP
u
50
100
150
(a)Metro-Chicago Region
Displaced BrineBy Injected CO2
1860
1870
1880
1890
1900
1910
1920
1930
1940
1950
1960
1970
1980
1990
2000
0
Metro Chicago Region
(a) CO2 Storage Rate vs. Pumping Rate (Mandle and Kontis, 1992, Northern Midwest RASA)
3. Hydrogeology of the Illinois Basin
Basin Geology (Deep Formations)Basin Geology (Deep Formations) Mount Simon Sandstone
Formation Properties (Porosity and Permeability) Vertical Variability at 0.15 m scale from deep wells S ti l V i bilit Ch t i ti Spatial Variability Characterization
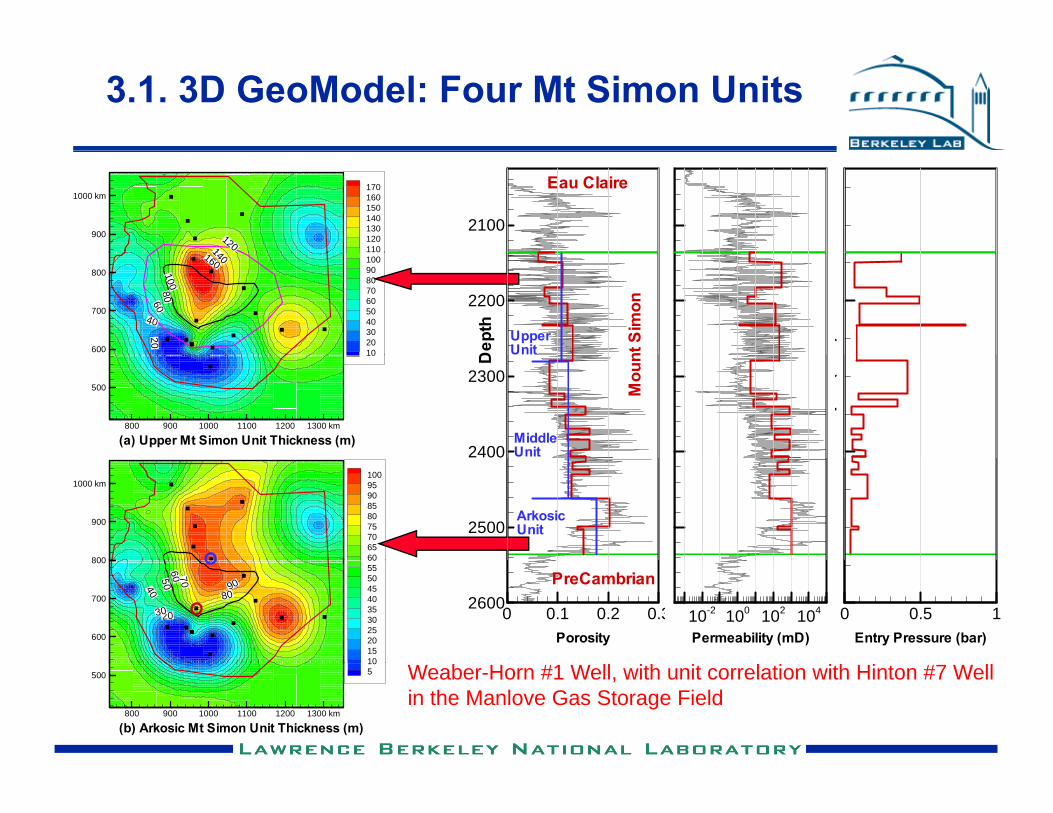
(a) Upper Mt Simon Unit Thickness (m)800 900 1000 1100 1200 1300 km
500
p(2300
2400
Mou
n
MiddleUnit
D1009590858075706560800
900
1000 km
2500ArkosicUnit
2030
4050
60 70
8090
6055504540353025201510
600
700
800
Permeability (mD)10-2 100 102 104
Entry Pressure (bar)0 0.5 1
Porosity0 0.1 0.2 0.32600
PreCambrian
105
(b) Arkosic Mt Simon Unit Thickness (m)800 900 1000 1100 1200 1300 km
500 Weaber-Horn #1 Well, with unit correlation with Hinton #7 Well in the Manlove Gas Storage Field
4. Basin-Scale Model Development
A Hypothetical Storage Scenario for Full-Scale GCS Deploymentp y
3D Mesh Generation3D Mesh Generation
B d d I iti l C ditiBoundary and Initial Conditions
TOUGH2/ECO2N (Pruess, 2005) Runs Two-phase CO2-brine flow at the plume scale Single-phase brine flow at the basin scale Single-phase brine flow at the basin scale
4.1. Hypothetical Storage Infrastructure and Scenario
Pre-Injection Pressure 136-279 barFractional Pressure Buildup 0.12-0.22Gas Storage Used Val e 0 13Gas-Storage-Used Value 0.13Regulated Value 0.65Fracturing Value 1.05
No Caprock Geomechanical Damage is Expected
5.3. Basin-Scale Pressure Buildup and Brine Migration (1)
1100(a) Case A: 50 yearskm Cut-Off=0.01 bar (b) Case A: 100 years
0900
1000
(a) Case A: 50 yearskm Cut Off 0.01 bar
1
0.2
30
( ) y
bar
1025
0.21
800
900
8 642
10
25201510
2030
600
70086421
800 900 1000 1100 1200 1300500
km 800 900 1000 1100 1200 1300
10.2
km
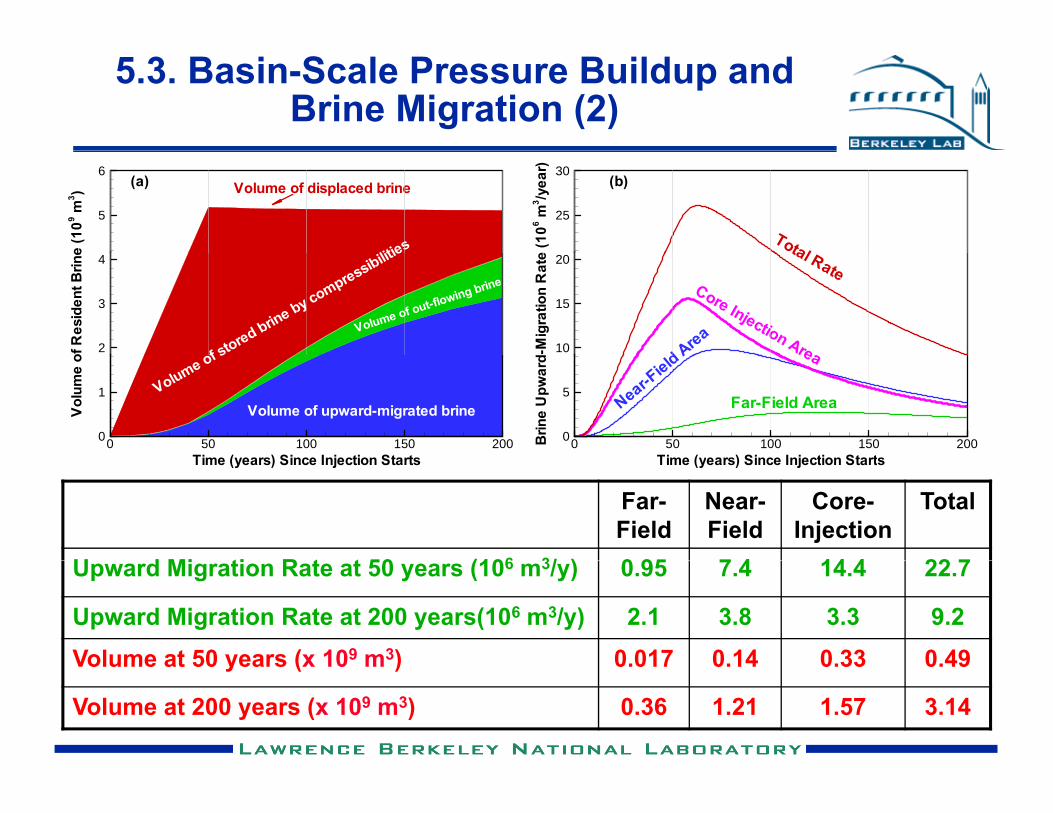
5.3. Basin-Scale Pressure Buildup and Brine Migration (2)
e(1
09m
3 )
5
6(a)
lities
Volume of displaced brine
e(1
06m
3 /yea
r)
25
30(b)
Total
ofR
esid
entB
rine
2
3
4
Volume of out-flowing brine
of stored brine by compressibilitie
d-M
igra
tion
Rat
e
10
15
20
d Area
Core Injection Area
tal Rate
Time (years) Since Injection Starts
Vol
ume
o
0 50 100 150 2000
1Volume of upward-migrated brine
Volume of s
Time (years) Since Injection Starts
Brin
eU
pwar
d
0 50 100 150 2000
5Far-Field AreaNear-F
ieldA rea
Far-Field
Near-Field
Core-Injection
Total
U d Mi ti R t t 50 (106 3/ ) 0 95 7 4 14 4 22 7
Time (years) Since Injection Starts Time (years) Since Injection Starts
Upward Migration Rate at 50 years (106 m3/y) 0.95 7.4 14.4 22.7
Volume at 50 years (x 109 m3) 0 017 0 14 0 33 0 49Volume at 50 years (x 10 m ) 0.017 0.14 0.33 0.49
Volume at 200 years (x 109 m3) 0.36 1.21 1.57 3.14
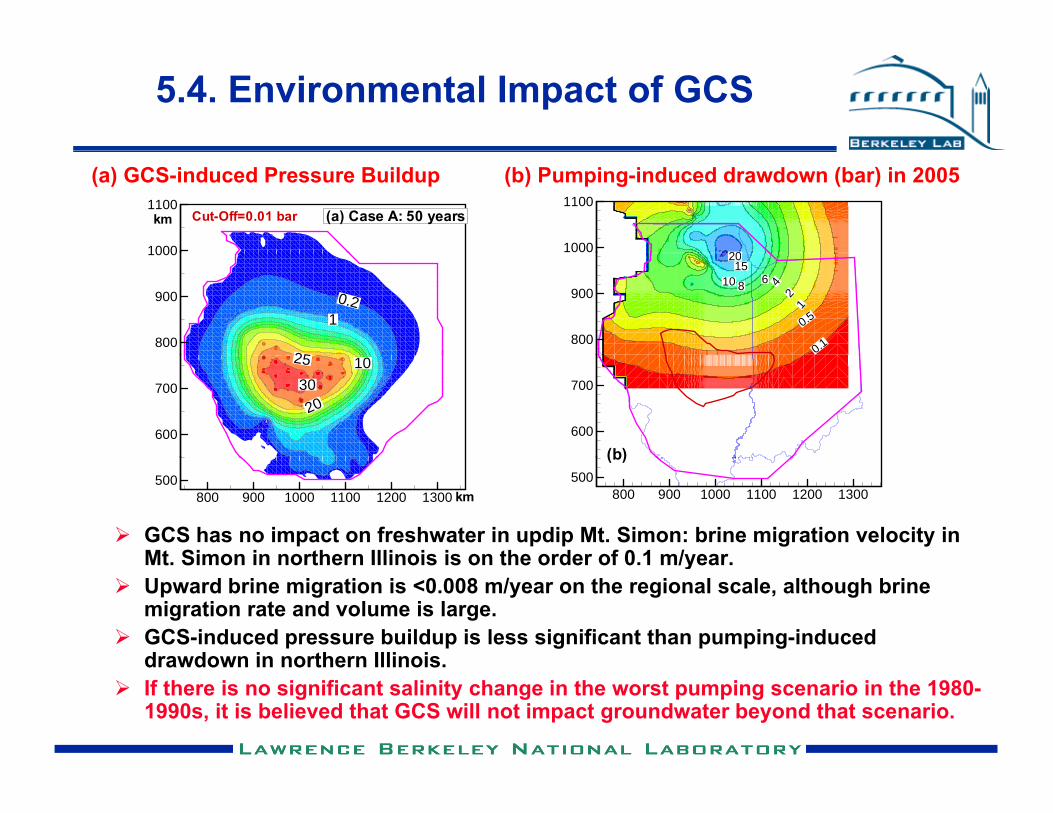
5.4. Environmental Impact of GCS
(a) GCS-induced Pressure Buildup (b) Pumping-induced drawdown (bar) in 2005
201000
1100
1000
1100(a) Case A: 50 yearskm Cut-Off=0.01 bar
0.1
0.5
12
4681015
20
800
900
25
0.21
800
900
1000
600
700
(b)
10
20
25
30
600
700
GCS has no impact on freshwater in updip Mt. Simon: brine migration velocity in Mt Simon in northern Illinois is on the order of 0 1 m/year
800 900 1000 1100 1200 1300500
(b)
800 900 1000 1100 1200 1300500
km
Mt. Simon in northern Illinois is on the order of 0.1 m/year. Upward brine migration is <0.008 m/year on the regional scale, although brine
migration rate and volume is large. GCS-induced pressure buildup is less significant than pumping-induced
drawdown in northern Illinoisdrawdown in northern Illinois. If there is no significant salinity change in the worst pumping scenario in the 1980-
1990s, it is believed that GCS will not impact groundwater beyond that scenario.
5. Summary and Conclusions
An integrated model was developed to represent a hypothetical full-scale deployment scenario of carbon sequestration in the Illinois Basin
Simulated plume-scale behavior indicates favorable conditions for CO2 storage in Mt Simon: High-K and high-Φ Arkosic Unit provides Excellent CO Injectivity in lower Mt High-K and high-Φ Arkosic Unit provides Excellent CO2 Injectivity in lower Mt
Simon, Secondary seals Significantly Retards upward CO2 migration, Thick, extensive Mt Simon provides Large CO2 Storage Capacity, and Thick regional-scale Eau Claire seal ensures Long-Term CO2 Containment in the c eg o a sca e au C a e sea e su es o g e CO2 Co ta e t t e
storage formation.
Simulated basin-scale behavior indicates that High hydraulic diffusivity helps reduce pressure buildup in the core injection High hydraulic diffusivity helps reduce pressure buildup in the core injection
area, thus enhancing caprock geomechanical integrity, High regional caprock permeability allows for natural attenuation of pressure in
the storage formation, thus enhancing storage capacity of Mt Simon, Brine upward migration occurs in the core injection area, into a thick series of p g j
overlying saline aquifers and aquitards, at a maximum velocity of ~8 mm/year
5. Summary and Conclusions (Cont.)
Environmental Impact on Groundwater Resources Environmental concerns of brine migration into the updip Mt Simon in northern
Illinois and southern Wisconsin may not be an issue,Illinois and southern Wisconsin may not be an issue, Moderate pressure buildup is obtained in northern Illinois, where upward brine
migration might be a concern, if local seal imperfections exists, Impact of GCS on shallow freshwater resources in northern Illinois may be less
than that ind ced b hea p mping from o erl ing fresh ater aq ifersthan that induced by heavy pumping from overlying freshwater aquifers.
Further research is needed to couple a regional groundwater flow d l ith th i t t d d l f i t l i tmodel with the integrated model for environmental impact
assessment
Acknowledgment
This work was funded by the Assistant Secretary for Fossil Energy, Office of Sequestration, gy qHydrogen, and Clean Coal Fuels, National Energy Technology Laboratory (NETL), of the U.S. Department of Energy The project is jointlyDepartment of Energy. The project is jointly coordinated by NETL and the U.S. Environmental Protection Agency (USEPA).