58
Basis of Reporting 2013 reporting Page 1 of 58 Basis of Reporting 2013 Reporting
Basis of Reporting
2013 reporting Page 1 of 58
Basis of Reporting
2013 Reporting
Basis of Reporting
2013 reporting Page 2 of 58
Summary
The Basis of Reporting (BoR) outlines the scope of each of the 18 key performance indicators (KPIs)
assured in our 2013 CR Performance Review and Annual Report and Accounts.
Deloitte have assured our KPIs as stated within their Assurance statement, available at www.centrica.com/CRassurance. To review the assured KPIs see:
2013 CR Performance Review, page 42 or visit:
www.centrica.com/crperformancereview
2013 Annual Report and Accounts, pages 185-186 or visit:
www.centrica.com/annualreport
Table of contents
Treating customers fairly
British Gas Net Promoter Score (NPS)
Direct Energy Net Promoter Score (NPS)
Vulnerable households helped by British Gas initiatives
Safeguarding the environment
Total carbon emissions
Internal carbon footprint (property, fleet and travel)
Carbon intensity of power generation
Smart meter installations (residential and business customers)
Caring for our people and communities
Employees
Employee engagement
Retention
Absence
Safety
Lost time injury frequency rate (LTIFR)
Total recordable injury rate (TRIR)
Significant process safety event
Road safety incidents – number of high severity incidents and low severity rate
Fatalities
Community
Community investment contributions
Basis of Reporting
2013 reporting Page 3 of 58
British Gas Net Promoter Score (NPS)
Description
NPS is a measure of customer advocacy and has been shown to be linked to company growth. It uses a
scale of 0 to 10, to measure how much a customer would recommend a company.
Calculation methodology
Unit of measure
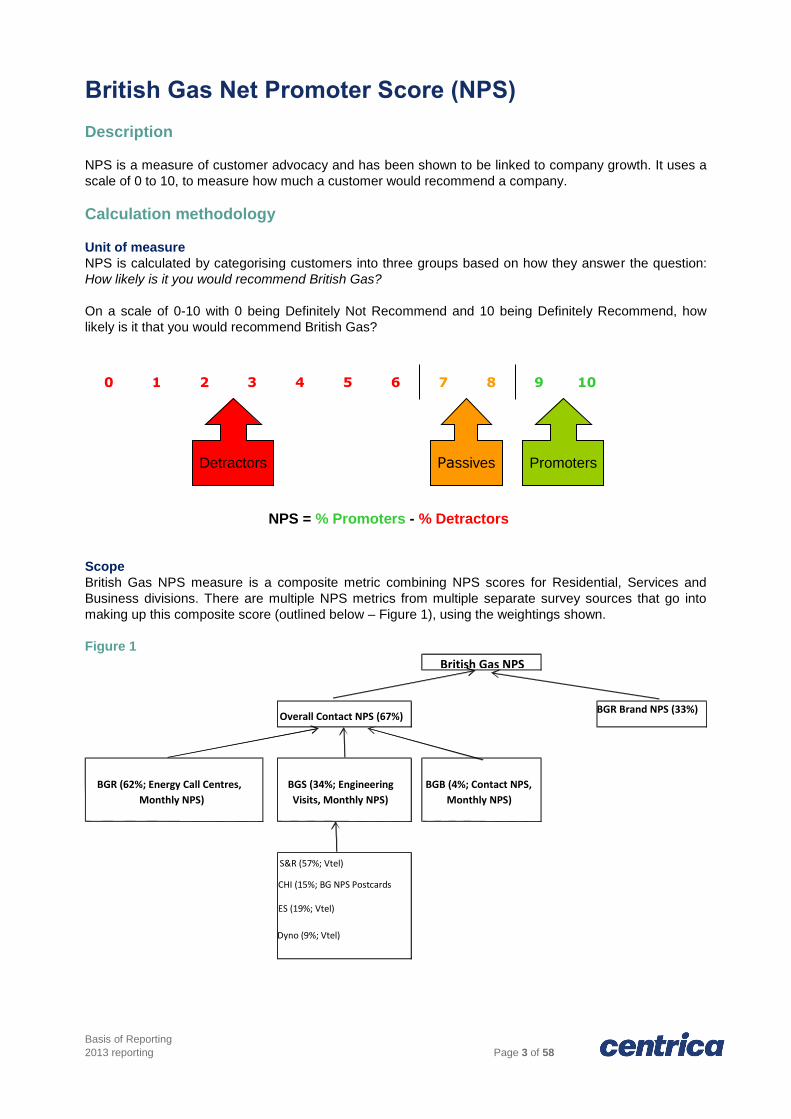
NPS is calculated by categorising customers into three groups based on how they answer the question:
How likely is it you would recommend British Gas?
On a scale of 0-10 with 0 being Definitely Not Recommend and 10 being Definitely Recommend, how
likely is it that you would recommend British Gas?
Scope
British Gas NPS measure is a composite metric combining NPS scores for Residential, Services and
Business divisions. There are multiple NPS metrics from multiple separate survey sources that go into
making up this composite score (outlined below – Figure 1), using the weightings shown.
Figure 1
British Gas NPS
Overall Contact NPS (67%) BGR Brand NPS (33%)
BGR (62%; Energy Call Centres, Monthly NPS)
BGS (34%; Engineering Visits, Monthly NPS)
BGB (4%; Contact NPS, Monthly NPS)
S&R (57%; Vtel)
CHI (15%; BG NPS Postcards
ES (19%; Vtel)
Dyno (9%; Vtel)
10 9 8 7 6 5 4 3 2 1 0
Detractors Passives Promoters
NPS = % Promoters - % Detractors

Basis of Reporting
2013 reporting Page 4 of 58
Types of measurement
The British Gas NPS is made up of two types of measurement: Contact NPS across Residential Energy,
Services and Business divisions and Brand NPS across Residential Energy and Services divisions. The
Contact NPS measures customer advocacy soon after an interaction (call centre or engineer visit). Brand
NPS measures customer advocacy among all Residential customers, including customers with no recent
interaction with the business.
Table A - Outlines type of measurement used
Calculation methodology
For all business areas within the contact measurement types, the NPS is calculated monthly by
calculating the percentage of promoters for that month, the percentage of detractors for the month and
subtracting detractors from promoters.
Contact NPS metrics capture customer experience, yearend scores are based on full year survey data
where available to encompass our customers’ views over the full period. The year-end score for BGR
Metric Measurement
type
Composition / inputs
(1) British Gas NPS
Blend of Contact
and Brand NPS
British Gas Contact NPS (67%) + British Gas Brand
NPS (33%)
(2) British Gas Contact NPS
Blend of British
Gas Residential,
British Gas
Services and
British Gas
Business NPS
British Gas Residential NPS (62%) + British Gas
Services NPS (34%) + British Gas Business NPS
(4%), each of these scores are in themselves derived
from scores based on multiple surveys.
(3) British Gas Brand NPS
Brand NPS calculated from one survey which is
representative of residential customers. End of year
score is based on rolling three months to ensure
robustness and to eliminate any spikes in the monthly
survey data.
(4) British Gas
Residential (BGR) NPS
Contact Combination of BGR Customer Services NPS and
BGR Customer Relations (complaint handling) NPS.
End of year score is based on the survey data for the
12 months from January to December 2013. No
weightings are applied.
(5) British Gas
Services (BGS) NPS
Contact Composite of Service & Repair (S&R, 57%), Central
Heating Installation (CHI, 15%), Electrical Services
(ES, 19%) and Dyno (9%), British Gas Community
Energy is no longer part of BGS Engineer Visit NPS
Metric, as of Dec 2011. NPS scores weighted based
on 2012 expected gross profits in each area.
End of year score is based on an average of the 12
monthly weighted scores (from January to December
2013).
(6) British Gas
Business (BGB) NPS
Contact NPS score is based on result of eDigital surveys sent
to a selection of customers who have been in contact
with BGB. For the overall BGB NPS metric no filtering
is applied and so covers all departments. No
weightings are applied.
End of year score is based on e-Digital survey data
from October to December 2013.

Basis of Reporting
2013 reporting Page 5 of 58
Contact NPS has been calculated using the underlying survey data for January to December. The same
methodology has been used for BGB Contact NPS however due to the change in process only the new e-
Digital surveys carried out from October to December have been included.
BGS Contact NPS year end score is an average of the January to December monthly scores for
simplicity. However calculating the year end score using the underlying survey data results in the same
end of year score and so the average is seen to be accurate.
Brand NPS year end score is the 3 month rolling average at December 2013, and so includes survey data
from October to December. Brand NPS is a strategic metric reflecting the standing of the brand, the end
of the year score has been used as it reflects current consumer opinion Brand NPS
The Brand NPS survey provides a monthly NPS score for the British Gas residential customer base. The
study is designed to ensure that the results are representative of residential customers and as such are
weighted based on whether customers are duel fuel or single fuel, what type of Homecare product they
purchase, and their method of payment (cash/cheque, direct debit or Pay As You Go).
The monthly total completed surveys among British Gas residential customers are 1,500 (3 month
average based on 4,500). The 2013 Brand NPS year-end score is the 3 month rolling average at
December 2013 (Oct-Dec 2013).
British Gas Residential NPS
The overall British Gas Residential (BGR) NPS score is derived from 2 surveys. One covers customer
service calls and the other covers complaint handling calls. No weighting is applied and the 2013 NPS is
calculated from the arithmetical sums of the promoter responses and detractor responses obtained from
the 2 surveys for the year.
British Gas Services NPS
The overall British Gas Services (BGS) NPS score is created based on a two stage process. First, NPS is
calculated for each of the business areas (S&R, CHI, ES and Dyno). Next, an overall BGR NPS score is
calculated by combining the four metrics and weighing based on 2012 expected gross profits in each
area. Weightings are reviewed and updated every 2-3 years as they remain quite consistent during this
period.
The average monthly number of completed surveys for British Gas Services in 2013 was 63,715.
The yearend score for British Gas Services NPS is the moving annual total (MAT), calculated across
January 2013 to December 2013.
Note: British Gas CE is no longer part of BGS Engineer Visit NPS Metric, as of December 2011. British Gas Business Contact NPS
NPS is based on e-Digital surveys. This scheme piloted at BGB from August 2013, starting with the
Contact Centres only. The full launch of the new process covering all departments and decommissioning
of the previous telephone based NPS process took place in October 2013. The end of year BGB NPS
score has been based on e-Digital survey data from this point. Surveys prior to this date were based on a
different methodology and for consistency have been excluded from the calculation.
The overall BGB NPS score is non-weighted, reflective of the actual number of completed surveys. The
2013 year end score for British Gas Business Contact NPS is based on the e-Digital surveys completed
since the pilot commenced to December 2013.
British Gas Contact NPS
The British Gas Contact NPS is calculated by combining British Gas Residential, British Gas Services
and British Gas Business NPS scores using the weighting outlined in Figure 1.
British Gas NPS

Basis of Reporting
2013 reporting Page 6 of 58
The Overall British Gas NPS is calculated by then creating a weighted average of British Gas Residential
(BGR) Brand NPS (33%) and British Gas Contact NPS (67%).
Data quality, collection and reporting frequency
British Gas Residential NPS
The BGR Customer Service NPS survey uses an automated Interactive Voice Response methodology.
Respondents are called back within an hour of their conversation with a contact centre agent. Some
respondents are screened out by the system, for example if they have recently filled in a survey,
otherwise all are dialled. The contact centre agent does not select the calls that will get the survey. This
methodology was introduced at the beginning of 2013. The survey had 286,000 responses in the year.
The number of responses was lower in January and February whilst it was in its trial period. The number
of responses was also reduced in August and December due to systems issues.
The BGR Complaints NPS survey uses an ‘agent select’ IVR methodology. Respondents are asked by
the contact centre agent whether they would like to participate in the survey. If they agree the agent puts
them through to the survey at the end of their call. The survey had 87,000 responses in 2013.
British Gas Residential reporting is available on a weekly basis, the monthly scores are calculated from
the summation of the weekly data.
British Gas Services NPS
In 2013 CHI customers are surveyed by post, administered internally by British Gas. Each week each
business area pulls together a list of all customers who have had an engineer visit in the prior week. All of
these customers are sent a paper survey. Completed surveys sent back by customers are analysed by
British Gas and NPS scores created.
S&R, Dyno and ES customers are surveyed by an outbound automated phone survey. Each day a dialler
file is created for all customers who have had an Engineer visit in the previous day. The file is uploaded to
internally hosted secure site, and customers are called automatically and invited to participate in the
survey.
The BG Management Information (MI) analysts from ES, Dyno, CHI and S&R then process the raw
survey data and calculate the monthly NPS figure. All MI reports are published on the MI portal.
British Gas Services reporting is published monthly. British Gas Business NPS
Data is delivered in three files received daily from eDigital. Weekly NPS scores are calculated every
Monday after the import of that days files. The monthly values are generated on a Monday once the
correct weeks have been completed.
British Gas Residential (BGR) Brand NPS
Interviews are conducted by telephone by an external research agency. Interview quotas are set on
joint/single status, fuel mix (single v dual), payment method, and Services product holding. Corrective
weights are added to the final data to ensure the data represents the customer base
Fieldwork takes place on a daily basis. About 1,500 interviews with British Gas residential customers are
completed monthly. Customers surveyed in the last month for any British Gas survey are excluded from
the sample, as are customers who have completed the Brand NPS survey itself within the last six
months. British Gas provides the external agency with a randomly generated customer file on a monthly
basis for use during the following month. The customer records are transferred securely via an site. The
external agency conducts interviewing and collates the resulting data via their CATI (Computer-Aided
Telephone Interviewing) tool, Askia Vista. The Brand NPS figure is published to the business monthly.
In addition interviews are also conducted among customers of British Gas’s five main competitors, around
250 per competitor per month in order to give the business an understanding of their relative position in
the market. However these interviews are separate from the British Gas customer interviews and have
no impact on the British Gas Brand NPS score.

Basis of Reporting
2013 reporting Page 7 of 58
Direct Energy Net Promoter Score (NPS)
Description
NPS is a measure of customer advocacy and has been shown to be linked to company growth. It uses a
scale of 0 to 10, to measure how much a customer would recommend a company.
The North America Direct Energy NPS metric reflects customer advocacy from residential and business
energy customers and home services customers from across its operating markets in the United States
and Canada.
Calculation methodology
Unit of measure
NPS is calculated by categorising our customers into three groups based on how they answer the
question: How likely are you to recommend {Brand Name} to friends or colleagues?
Customers rate their likelihood to recommend on a scale of 0 to 10, with zero being ‘definitely would not
recommend’ and 10 being ‘definitely would recommend’. As depicted in the image below, customers are
grouped three ways based on how they rate their likelihood to recommend:
0 to 6 are detractors 7 or 8 are passive 9 or 10 are promoters
Types of measurement
Direct Energy employs two methods for measuring NPS: ‘relationship’ and ‘moment of truth’. The
relationship approach is used to measure residential and business energy customers’ advocacy. It
measures the ‘likelihood to recommend’ at an overall brand level on a monthly basis by region and
commodity where applicable.
The moment of truth approach is used to measure Home Services customers. Moment of truth measures
the ‘likelihood to recommend’ at an overall brand level following a moment of truth customer interaction
with respect to a service / maintenance visit and a furnace / air conditioning installation.
Scope
The North America Direct Energy (NA DE NPS) metric measures Direct Energy’s residential and
business energy customers and home services customers across Direct Energy’s various operating
regions. The table below outlines the scope of the metric and indicates the type of measurement used.
Basis of Reporting
2013 reporting Page 8 of 58
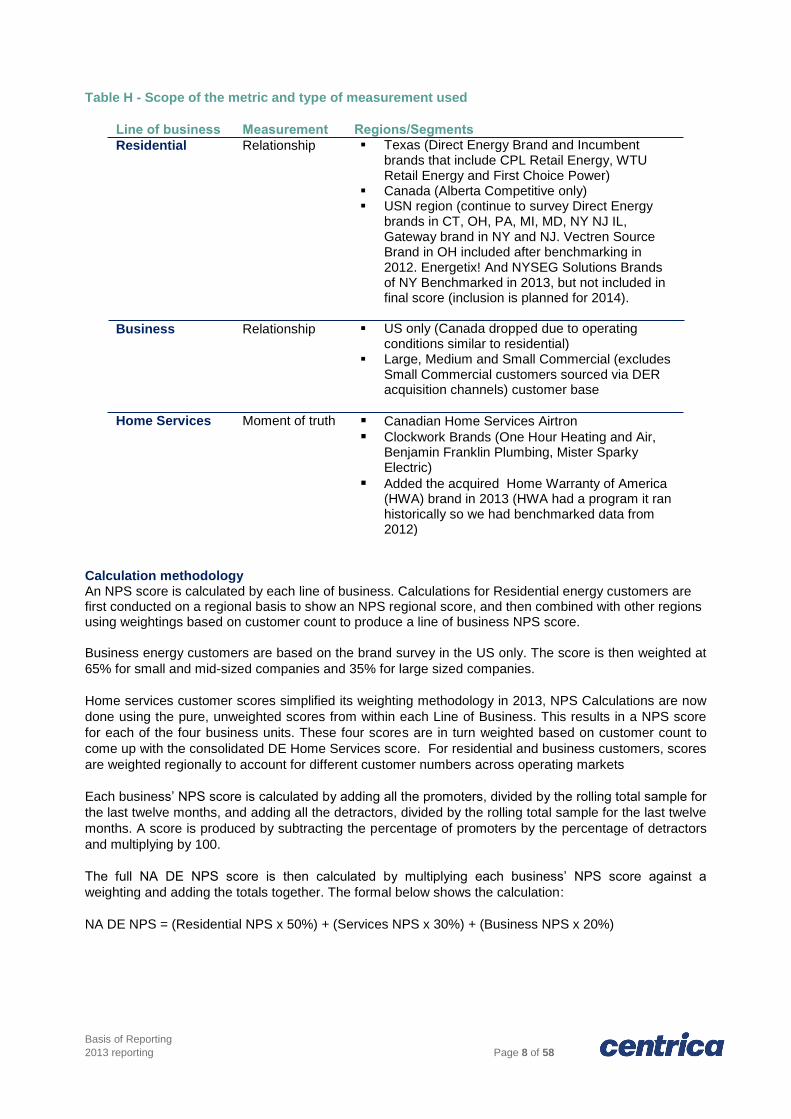
Table H - Scope of the metric and type of measurement used
Line of business Measurement Regions/Segments
Residential Relationship Texas (Direct Energy Brand and Incumbent brands that include CPL Retail Energy, WTU Retail Energy and First Choice Power)
Canada (Alberta Competitive only) USN region (continue to survey Direct Energy
brands in CT, OH, PA, MI, MD, NY NJ IL, Gateway brand in NY and NJ. Vectren Source Brand in OH included after benchmarking in 2012. Energetix! And NYSEG Solutions Brands of NY Benchmarked in 2013, but not included in final score (inclusion is planned for 2014).
Business Relationship US only (Canada dropped due to operating conditions similar to residential)
Large, Medium and Small Commercial (excludes Small Commercial customers sourced via DER acquisition channels) customer base
Home Services Moment of truth Canadian Home Services Airtron
Clockwork Brands (One Hour Heating and Air, Benjamin Franklin Plumbing, Mister Sparky Electric)
Added the acquired Home Warranty of America (HWA) brand in 2013 (HWA had a program it ran historically so we had benchmarked data from 2012)
Calculation methodology An NPS score is calculated by each line of business. Calculations for Residential energy customers are first conducted on a regional basis to show an NPS regional score, and then combined with other regions using weightings based on customer count to produce a line of business NPS score.
Business energy customers are based on the brand survey in the US only. The score is then weighted at
65% for small and mid-sized companies and 35% for large sized companies.
Home services customer scores simplified its weighting methodology in 2013, NPS Calculations are now
done using the pure, unweighted scores from within each Line of Business. This results in a NPS score
for each of the four business units. These four scores are in turn weighted based on customer count to
come up with the consolidated DE Home Services score. For residential and business customers, scores
are weighted regionally to account for different customer numbers across operating markets
Each business’ NPS score is calculated by adding all the promoters, divided by the rolling total sample for
the last twelve months, and adding all the detractors, divided by the rolling total sample for the last twelve
months. A score is produced by subtracting the percentage of promoters by the percentage of detractors
and multiplying by 100.
The full NA DE NPS score is then calculated by multiplying each business’ NPS score against a
weighting and adding the totals together. The formal below shows the calculation:
NA DE NPS = (Residential NPS x 50%) + (Services NPS x 30%) + (Business NPS x 20%)

Basis of Reporting
2013 reporting Page 9 of 58
Deliverables – data and reporting Data collection – relationship NPS
Data is collected through telephone interviews conducted by research agencies. Direct Energy provides
the agencies with a random sample of DE customer records. Data management aligns to industry best
practices with the research agency performing the cleaning to ensure no duplications exist. The agency
collates interview responses and provides data to the respective Direct Energy team (Residential data to
the Customer insights team and Business to the Customer Experience committee team) who calculates
the final NPS score (excluding don’t know responses) with data being cleaned of errors and de-
duplicated.
Data collection – Moment of Truth Home Services NPS
For Canadian Home Service (CHS), data is collected through the daily execution of mail and email NPS
surveys the day following the MOT customer interaction. All eligible customers (not on Do Not Contact
list) with an email address are surveyed. For mail, a random 25% sample is selected for Service while
100% of Installs are selected. The mail vendor and email vendors deliver daily response files. The survey
execution files and the response files are loaded daily to database tables. Derivation and reporting of
NPS scores is performed by Customer Insights and Analytics team in Toronto by querying a database
view table that consolidates the NPS database tables across all DES business units.
A similar process is followed for each of Clockwork and Airtron with the exception that only mail surveys
are conducted for Airtron with 25% sampling of Service and 100% sampling of install. For Clockwork, mail
surveys are executed only for the install customers who do not have an email address. Derivation and
reporting of Clockwork and Airtron NPS scores is performed by Customer Insights and Analytics in
Toronto team by querying the consolidated view table noted above.
For HWA/DEPP, an email survey is sent to every homeowner who had a claim in which a vendor
(contractor) was assigned. The data is collected, and results of those surveys are stored in a various
database tables. Every Monday an automated job queries the above referenced tables, and sends an
encrypted NPS file to the Customer Insights and Analytics team in Toronto
Reporting timelines
The NA DE NPS is reported on monthly and on a rolling 12 month basis for each year. The metric is
reported to management, corporate affairs and back to each business. The 2013 figure is based on
results for the calendar year 1st January 2013 to 31
st December 2013.
HWA provides a weekly response file to the Canadian Home Services Customer Relationship
Management team to enable weekly and monthly reporting of DES business unit scores and a
consolidated DES score.

Basis of Reporting
2013 reporting Page 10 of 58
Vulnerable households helped by British Gas
initiatives
Description
The metric measures the total number of vulnerable households helped through British Gas initiatives. A
‘vulnerable household’ is where one or more of its residents are defined as ‘vulnerable’.
Those households impacted are where a specific product or service is provided to help improve the service experienced or ensure the household is able to manage their gas or electric supply.
The broad industry definition of vulnerability agreed with Energy UK and the big six UK energy suppliers is:
A customer is vulnerable if for reasons of age, health, disability or severe financial
insecurity, they are unable to safeguard their personal welfare or the personal
welfare of other members of the household.
British Gas has defined more specific criteria to enable us to apply this framework. The criteria include any one of the following:
Customers suffering from severe financial insecurity:
o Customers claiming Means Tested Benefits; and / or o Customers with a household income of < £16,190 o Customers spending >10% household income on fuel per year for adequate heating
(usually 21 degrees for the main living area, and 18 degrees for other occupied rooms)
Age, disability or long term illness - households with one or more of the following:
o Households with children aged 16 years or under; o A household member of pensionable age; o A household member who requires constant carer’s assistance; o Relies on mains powered medical equipment; o Long term/chronic ill health including terminal illness e.g. cancer; o Claiming disability benefits or registered disabled
Customers suffering from severe stress or any other mental health problems:
o People living with dementia (Alzheimer’s is the most common form) o Very confused or stressed and unable to understand basic information, hold a normal
conversation or make a decision
Products and services available to vulnerable customers may differ, depending on the vulnerability criteria being met.
For customers who are identified as vulnerable, an indicator is added to their gas and / or electricity account to ensure their status is recognised in future interactions, and as a trigger for our agents to offer appropriate products and services that the customer may be entitled to, or in need of. Customer status is periodically reassessed. Once identified as “vulnerable”, a customer is reported as fitting this definition until such a periodic assessment has been performed and concluded that the customer household no longer meets this definition.
Calculation methodology
Unit of measure Total number of households that benefited in 2013 from one or more of British Gas’ social programmes designed to assist vulnerable customers.

Basis of Reporting
2013 reporting Page 11 of 58
Scope The metric covers British Gas residential customers and programmes. Each of the seven vulnerable customer programmes that British Gas offers are shown below, including the products offered within each. Data is sourced from these products to produce the metric.
Table I – British Gas Vulnerable customer programmes
1. Debt Customers
Products which support vulnerable households suffering from debt. These products differ for the energy they receive (e.g. electricity or gas). Customers are considered in debt with outstanding arrears of greater than 28 days. PAYGE customers are identified where a debt was added to their meter at the point of meter exchange from credit to prepayment. Fuel Direct supports customers on certain benefits to repay their debt. A weekly repayment value is agreed with Department for Work and Pensions, and with the customer’s permission.
2. British Gas Energy Trust (BGET)
Grants to help vulnerable customers manage their energy debt.
3. Home Energy Care and Extra Care
HEC scheme (also known as PSR or Priority Service Register) provides additional help to customers who are elderly, disabled or on long term sick; as well as those on means tested benefits with children under 5. Forms of help include bills in alternative formats, annual free gas safety checks and specially designed appliance controls. Extra Care is the umbrella term for the process of identifying vulnerable customers, which then flags their customer profile to protect them from disconnection due to debt at any time.
4. Energy Efficiency
Customers can have insulation and / or a boiler installed to help with managing their energy use.
5. Benefits Assessment / Income Maximisation
Customers on low income are offered advice and guidance on eligibility and application for government benefit.
6. Vulnerable Customers Off Supply
Where customers are without fuel due to faulty meter or card / key, a visit is undertaken to get them back onto supply within four hours where practicable to do so. This service is measured in terms of successful visits / measures (some measures may include providing alternative sources of heat or cooking or paying for a taxi to stay at a relative’s house).
7. Warm Home Discount Scheme
Customers who qualify for a one off payment to help with their electricity fuel costs. Customers are either identified by data sharing with Department for Work and Pensions, who notify suppliers of Pension Credit recipients (criteria changes each year). This is known as the Core Group. Suppliers also have their own Broader Group Scheme, with criteria which is approved by Ofgem. These customers are assessed for the Scheme either verbally, or via an application form, and once qualified, will receive a payment equal to that of Core Group customers.
Data collection, quality and reporting frequency
Data collection and quality Data is collected for the seven programmes from eight individuals. The customer data for each of these programmes is sent to data analytics. Etiquette marketing database is used to match the addresses against those held in the database and perform any de-duplications. Where more than one product is assigned to one house, the figure is consolidated to produce a total number of unique households.
Reporting frequency Some of the individual vulnerable customer products are collated and reported monthly, but the metric for all vulnerable customer programmes and products is measured on a half-yearly basis.

Basis of Reporting
2013 reporting Page 12 of 58
Total carbon emissions Description
Centrica’s total carbon emissions are important non-financial indicators for the company and are included
in both Centrica’s Annual and Corporate Responsibility reports.
The reporting of the company’s total carbon emissions demonstrates our understanding of our
greenhouse gas (GHG) footprint, a pre-requisite for the successful management of such emissions and
enables comparison with other companies.
Reporting methodology
Unit of measure
Tonnes of carbon dioxide equivalent (tCO2e)
Scope and organisational boundaries
Centrica has committed to reporting its total carbon emissions based on the Scope 1 and 2 GHG
emissions from all wholly owned or partially owned reporting entities across the group1. This
encompasses all global activities associated with our brands, British Gas, Centrica Energy, Centrica
Storage and Direct Energy. Where Centrica has only part equity in a reporting entity, (e.g. joint ventures),
the emissions are pro-rated to reflect Centrica’s share. This equity share approach to our organisational
boundaries is an approach supported by the GHG Protocol. It is intended that the reporting approach
aligns as closely as possible with the financial accounting approach used in the same reports. This
enables the relationship between carbon and financial performance to be compared directly.
Companies in the oil and gas industry often have particularly complex organisation structures as is the
case with our gas and oil exploration and production business. Whilst Centrica follows the equity share
approach described by the GHG Protocol; we also draw from the IPIECA guidelines2, to assist in the
application of the GHG Protocol to these complex organisational structures (IPIECA is the global oil and
gas industry association for environmental and social issues). Section 3.2.1 of the IPIECA guidelines
interprets the GHG Protocol equity approach for the oil and gas industry as below:
Because these guidelines recommend that the selected organizational boundary (equity share,
operational control or financial control) be applied at the reporting unit level, all of the emissions
from sources in assets managed by the company’s reporting units are used as the basis for
consolidation without regard to whether specific emission sources are owned or leased. The
emissions sources in assets managed by the company’s reporting units are accounted for as
Scope 1 emissions and would be consolidated as part of the total emissions of the reporting unit
following the method the company selected for establishing its organizational boundaries.
Therefore Centrica applies the company’s equity share to the organisation that controls the assets and
not the assets themselves. Hence, where the organisation has contractually exclusive use of assets such
as operating and financial leased properties, vehicles and platforms, these are included within Scope 1
and 2 (Sub-leases are excluded irrelevant of their lease type). For consistency, this approach is applied to
all the company’s business units and not just the oil and gas parts of the business.
Note, this approach is a slight departure from the GHG Protocol’s stated approach where only assets that
are financial or capital leases are included under the equity share control approach, but it is considered
the most transparent and appropriate approach for Centrica.
A calendar year reporting period is adopted for GHG reporting i.e.1st January to 31
st December. This
aligns with the company’s financial reporting periods.
1 Note: Where an entity is operated as a component of another entity and the environmental regulators treat the
facilities as a whole, they are reported as a single reporting entity at the equity of the main facility. 2 Petroleum Industry Guidelines for Reporting Greenhouse Gas Emissions (Second Edition): May 2011

Basis of Reporting
2013 reporting Page 13 of 58
Materiality
For entities and assets, in which we have equity, all material GHG emissions are reported. However,
GHG emissions not material to the business are only reported when they are readily available, including,
where Centrica is the operator of the asset. The criterion for material emissions is dependent on the
central business of the asset, as summarised in Appendix B. This is consistent with ISO 14064-13.
This materiality approach is applied across the whole organisation, but to date, it is only the non-operated
offshore oil and gas production assets where non material GHG emissions are omitted. These omitted
emissions equate to approximately 0.1% of the company’s Scope 1 emissions.
Greenhouse Gas Emission Sources
The GHG emissions include emissions from:
Scope 1
The combustion of fossil fuels in the premises, vehicles, equipment and machinery
owned/controlled4 by the reporting entity
5
The leakage or escape of GHG emissions from the above
Scope 2
The GHG emissions associated with the electricity, heat and steam we import for use in our
premises, vehicles, equipment and machinery
Greenhouse gasses are defined in section 92 of the Climate Change Act 2008 (c. 27) as carbon dioxide
(CO2), methane (CH4), nitrous oxide (N2O), hydrofluorocarbons (HFCS), perfluorocarbons (PFCS) and
sulphur hexafluoride (SF6).
Other GHG’s including HCFC’s are also captured and reported where relevant.
Also, in accordance with the GHG Protocol, greenhouse gases that are released during the combustion of
biologically sequestered carbon (biomass and biofuels) are reported as a separate line of the Scope 1
emissions. Currently the company has low volumes of stationary biofuels and biomass consumption, in
addition to the biofuel component of UK vehicle petrol and diesel which will also be captured in this
separate line.
3 BS ISO 14064-1 states “The organisation may exclude from quantification direct or indirect GHG sources or sinks
whose contribution to GHG emissions or removals is not material or whose quantification would not be technically
feasible or cost effective.” 4 Owned can mean owned or exclusively leased by the reporting entity (refer below).
5 The equity approach is applied to the reporting entity and does not necessarily reflect the actual ownership of the
assets used by that reporting entity. For example, we lease many of the offices and vehicles that we use, but we report them as scope 1 and apportion the emissions based on the equity we have in the reporting entity that uses them.

Basis of Reporting
2013 reporting Page 14 of 58
Table G below, details which emissions are in scope
Table G – Scope 1 & 2 Emissions
In scope Out of scope
Offices and Depots
Scope 1
Emissions from offices that we wholly or
partially own or lease
Gas use
Diesel use
Refrigerant leakage
Biofuels used onsite to generate heat
and power for on and offsite use
(sequestered carbon to be reported as
a separate line)
Scope 2
Emissions from offices that we wholly or
partially own or lease
Imported power (whether from Centrica
or other supplier)
Scope 1
Emissions from offices that we sub-lease to others
Scope 2
Emissions from offices that we sub-lease to others
In scope Out of scope
Fleet
Scope 1
Emissions from:
Commercial fleet
Company cars (business travel only -
via mileage expenses or fuel card
records)
Rental cars where the fuel is claimed
back as expensed mileage (typically
where it is a temporary company car)
Scope 1
Emissions from:
Personal mileage in company cars, including
commuting
Rental car fuel use unless claimed back as
expensed mileage
Grey Fleet (personally owned cars used for
company business)
Power Generation Reporting Entities
Scope 1
Emissions from power generating entities
where we have equity:
Carbon dioxide (CO2) from fuel
combustion & fugitive emissions
Fugitive GHG (incl. methane (CH4) from
gas turbines, Sulphur Hexafluoride
(SF6) leakage, fugitive natural gas
emissions, refrigerant leakage (HFCS
and PFCS); and emissions of Nitrous
Oxide (N2O))
Scope 1
Emissions below the materiality threshold (see
Appendix B)

Basis of Reporting
2013 reporting Page 15 of 58
Scope 2
Imported power for plant consumption (whether
from Centrica or other supplier)
Scope 2
Emissions from power purchased for resale
i.e. Tolling and Power Purchase Agreements
(PPA6)
Hydrocarbon Production Reporting Entities
Scope 1
GHG emissions from reporting entities where
we have equity:
Carbon dioxide (CO2) from fuel
combustion including flaring
Venting and fugitive GHG (incl.
methane (CH4) from gas turbines,
Carbon dioxide (CO2) from hydrocarbon
processing, Sulphur Hexafluoride (SF6)
leakage, fugitive natural gas emissions,
refrigerant leakage (HFCS and PFCS);
and emissions of Nitrous Oxide (N2O)
Scope 1
Emissions below the materiality threshold
(see Appendix B)
Scope 2
Imported power for plant (whether from
Centrica or other supplier)
n/a
6 PPA and Tolling agreements, as well as open market power purchases, are Scope 3 emissions and therefore
outside of the Scope of this BoR, even though the financial gains from them are included in our financial accounts.

Basis of Reporting
2013 reporting Page 16 of 58
Calculation methodology
Scope 1 – Direct GHG Emissions
Scope 1 emissions are the sum of:
1. EU Emission Trading Scheme [EU ETS] values where available. Where reporting entities are not
part of the EU ETS scheme, including in North America, the equivalent to the EU ETS is
calculated. This being the sum of CO2 emissions from fossil fuel combustion (including flaring).
2. Plant fugitive and venting GHG emissions
3. Fleet and property combustion and refrigerant emissions
Site specific emission factors are used where available and when there is site specific variation (e.g.
unprocessed natural gas) to convert activity data into GHGs. Where there is negligible site specific
variation, standard emission factors, from published sources are applied, including:
The Greenhouse Gas Protocol – Revised Edition from the WRI and WBCSD
Guidelines to DEFRA/DECC’s GHG Conversion Factors for Company Reporting by DEFRA
United States Energy Information Administration (EIA)
eGrid
Environment Canada
Where activity data is submitted in energy units (e.g. kWh of gas consumption), the emission factor is
based on the assumption that the energy units are the gross calorific value, unless specified otherwise.
This is based on natural gas suppliers typically quoting gas consumption in gross energy units and
natural gas being the main fuel source used.
Scope 2: Electricity indirect GHG emissions
Scope 2 GHG emissions are from the generation of purchased electricity, heat or steam consumed by the
company. Centrica currently imports neither heat nor steam. Purchased electricity is defined as electricity
that is purchased or otherwise brought into the organisational boundary of the company. Scope 2
emissions physically occur at the facility where electricity is generated.
The DEFRA Total Direct GHG one-year average is used to calculate the carbon emissions of our
imported power for UK and Rest of World (DEFRA provide values for all countries). The United States of
America emission factors are sourced from the latest Emissions & Generation Resource Integrated
Database eGRID Summary Tables. The Canadian emission factors are sourced from Environment
Canada Electricity Intensity Tables.
In the UK, where we purchase grid power from ourselves, we could justifiably use Centrica’s own (lower)
power carbon intensity to calculate GHG emissions for this imported power. Moreover, as we already
report the emissions associated with power generation within the Scope 1 emissions of our exporting
assets, it could be argued that we are double counting the same emissions in the Scope 2 emissions of
our importing assets. A solution would be to report our Scope 2 emissions as zero in these cases or
remove the relevant emissions from our Scope 1 totals. However, we have retained the approach of
reporting our Scope 2 emissions as if they are imported from another generating organisation using the
countries’ standard grid emission factors. This ensures transparent accounting of our total Scope 1 and 2
emissions and enables trends in our imported electricity consumption to be understood.
Almost 70% of the power we purchase for our UK sites is 100% Agreed Renewable Source Electricity,
which is therefore theoretically, zero carbon. However, we take the conservative approach of applying
the UK year average emission factor to it; this is consistent with UK government guidance.

Basis of Reporting
2013 reporting Page 17 of 58
Data quality, collection and reporting frequency
Data quality
All the data is submitted in the ourEnvironment software system by the business units, sites or associated
functions.
In the ourEnvironment system, all the Scope 1 and 2 Indicators have a tolerance check activated, where
the value entered must be within 50% of the value for the same period in the previous year. Where the
value is +/- 50% of the previous value, an explanatory comment must be made and/or supporting
documentation attached.
All emissions are to be submitted in accordance with the Group Procedure for Environmental Reporting.
This includes:
The data being provided in the time frames required
The most accurate data at the time of submission to be used, following the hierarchy of accuracy
(direct measurement, if not then calculation, if not then estimation)
Records to be maintained on site to provide an audit trail
The EU Emissions Trading Scheme (ETS) emissions are externally verified annually and represent
almost half of our total Scope 1 emissions. Hence where there is an EU ETS value, it is used. This
maximises the integrity of the total Scope 1. However, the EU ETS emissions data are subject to annual
verification during March/April of the following year. When the total carbon emissions are reported
externally by Centrica prior to receiving the EU ETS verification, the emissions are caveated to that
extent. In the compilation of the EU ETS values, two approaches are used:
Unverified emissions calculations – calculated internally - based on gas chromatography
samples of actual gas consumed at sites; and
Verified emissions calculations – evaluated annually using the finalised internal view of
emissions for the calendar year and then verified by an accredited third party for compliance
with the EU ETS.
GHG emissions associated with office fuel use and vehicle emissions are not covered by EU ETS,
however the majority of these emissions are covered by the assurance for the Carbon Trust Standard.
The UK office GHG emissions are also covered by the CRC Energy Efficiency Scheme.
The group totals are compiled by Centrica Group Environment with sign off from:
1. Group Environmental Reporting Manager
2. Group Head of Environment
3. Group Director of Health, Safety, Environment and Security
Assumptions
The GHG emission methodologies and associated assumptions are included in Tables H.

Basis of Reporting
2013 reporting Page 18 of 58
Table H – Calculations and assumptions
UK and European Building and Vehicle Emissions Category Source Calculation Emission factors Assumptions
Buildings
Electricity Solely occupied sites: meter
readings validated against bills
Consumption (kWh) x
emission factor
DEFRA’s One-year Average n/a
Serviced offices: calculated
using average Centrica power
use per FTE
Average Centrica European
power use per FTE x FTE in
office x emission factor
As above There will be a lower rate of
improvement in the serviced
offices; therefore an average
(2009) Centrica power use/FTE
value is applied to all years
‘Green’ Electricity Treated the same as other electricity (refer above)
Gas Solely occupied sites: meter
readings validated against bills
Consumption (kWh) x
emission factor
DEFRA’s Gross Calorific Value n/a
Serviced offices: calculated
using average Centrica gas use
per FTE
Average Centrica European
gas use per FTE x FTE in
office x emission factor
As above There will be a lower rate of
improvement in the serviced
offices; therefore an average
(2009) Centrica gas use/FTE
value is applied to all years
Biodiesel blends Group Property Measurement of biodiesel
consumption for on-site power
generation
Biodiesel consumption (litres) x
Scope 1&3 emission factor
Biodiesel blends
Mineral diesel
consumption x
emission factor
DEFRA emission factor for the
transport and processing
(scope 3) of waste cooking oil
plus the Scope 1 emissions
relating to direct tailpipe
emissions of methane (CH4)
and nitrous oxide (N2O)
The biodiesel used originates
from UK cooking oil. Best
practice for carbon accounting
of biofuels is to include the
Scope 1 and 3 emissions
associated with it
Mineral diesel consumption x
emission factor
Basis of Reporting
2013 reporting Page 19 of 58
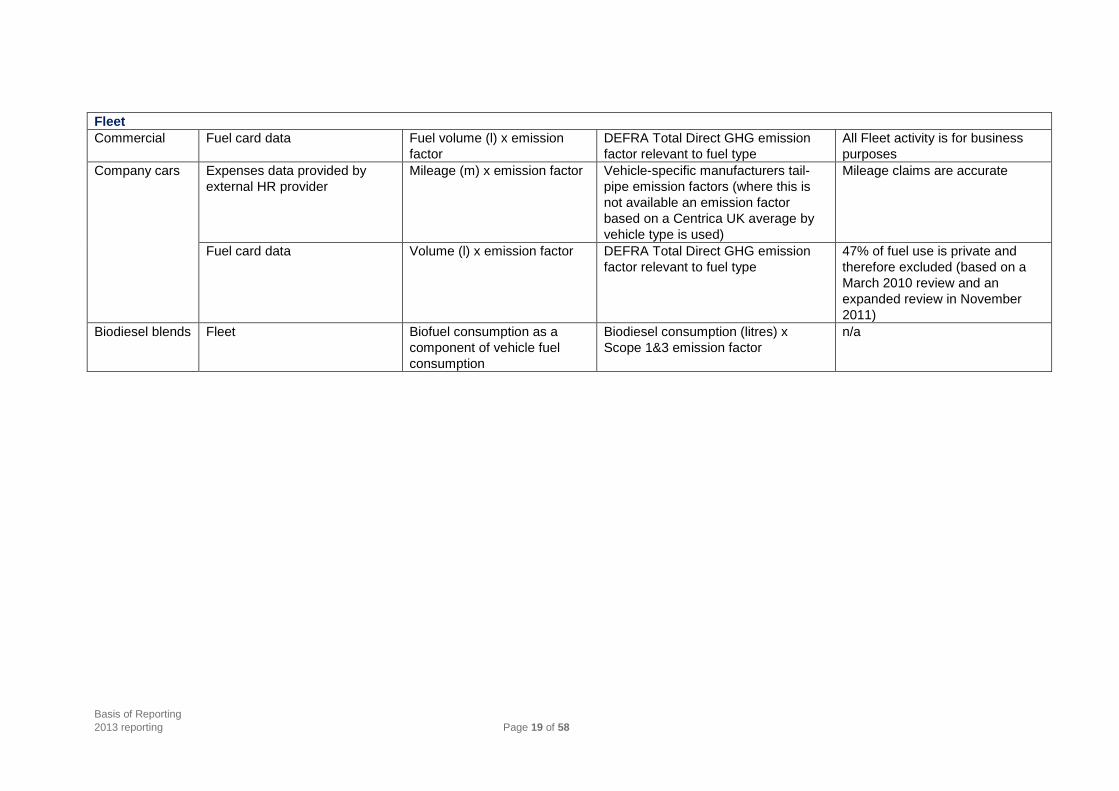
Fleet
Commercial Fuel card data Fuel volume (l) x emission
factor
DEFRA Total Direct GHG emission
factor relevant to fuel type
All Fleet activity is for business
purposes
Company cars Expenses data provided by
external HR provider
Mileage (m) x emission factor Vehicle-specific manufacturers tail-
pipe emission factors (where this is
not available an emission factor
based on a Centrica UK average by
vehicle type is used)
Mileage claims are accurate
Fuel card data Volume (l) x emission factor DEFRA Total Direct GHG emission
factor relevant to fuel type
47% of fuel use is private and
therefore excluded (based on a
March 2010 review and an
expanded review in November
2011)
Biodiesel blends Fleet Biofuel consumption as a
component of vehicle fuel
consumption
Biodiesel consumption (litres) x
Scope 1&3 emission factor
n/a

Basis of Reporting
2013 reporting Page 20 of 58
North American – Building and Vehicle Emissions
Category Source Calculation Emission factors Assumptions
Buildings
Electricity Solely occupied sites:
meter readings
validated against bills
Consumption (kWh) x location
specific emission factors
Emissions & Generation Resource Integrated
Database eGRID Year 2007 Summary Tables
Environment Canada Electricity Intensity Tables
2008 data
n/a
Serviced offices:
square footage and
type
Square footage x consumption rate (by
property type) x state/province emission
factor
(as above)
Consumption rates (by location and building type)
from Energy Information Administration (EIA)
n/a
Gas Solely occupied sites:
meter readings
validated against bills.
Consumption (m3) x gas emission factor United States Energy Information Administration
(EIA)
n/a
Serviced offices:
square footage and
type
Square footage x consumption rate (by
property type) x gas emission factor
Consumption rates (by building type) from EIA n/a
Fleet
Commercial Fuel card data Fuel volume (l) x emission factor GHG Protocol Tools (WRI), GHG emissions from
transport or mobile sources 2011
All Fleet activity is for
business purposes

Basis of Reporting
2013 reporting Page 21 of 58
Power Generation Emissions
Category Source Calculation Emission factors Assumptions
Fuel Consumption for EU ETS sites
EU ETS of
gas fuelled
power stations
Provided bi-annually
Verified emissions data
provided annually by an
accredited third party
Sum of emission volumes in tonnes,
across months, and across all
reporting entities
Site specific dependent on
analysis of calorific value of
fuel used
Unverified emissions, are derived from gas
consumption, and are indicative until verified
emissions are available. Where carbon
intensity is reported externally prior to the
provision of verified emissions, the figures
carry a caveat to that extent.
Nuclear
Emissions
Power Business
Development, Centrica
Energy
Nuclear power stations have low, but
not zero emissions, as a result of
standby combustion plant. Centrica
does not have sight of these
emissions pre verification, and as
such, for the purposes of the CI
metric, assume a carbon intensity of
0.48g/kWh.
The 0.48g/kWh is an
assumption based on the
actual verified carbon
intensity of the nuclear
generation for 2012
Pro-rated for partially
owned assets to reflect
Centrica’s equity
Unverified emissions, are derived from a
prudent assumption, and are indicative until
verified emissions are available.
Fuel Consomption for non-EU ETS sites
Natural gas/
diesel/fuel oil
consumption
Provided in
ourEnvironment bi-
annually for the preceding
6 months
Gas consumption meter readings
(energy units) x gross emission
factor (site specific if available,
otherwise published)
Diesel and Fuel oil (volume x
published emission factor)
Vary depending on
geography and year and
published or site specific
In the case of diesel and fuel oil, reported
volumes may be based on delivery volumes
or consumption
Fugitive Emissions
Methane from
Gas turbines
Provided in
ourEnvironment bi-
annually for the preceding
6 months
Start-up/Shut down: Gas
volume x duration
Unburnt during
combustion: Gas volume x
Emission factor
Methane (CH4) 100 year
Global Warming Potential
(GWP) IPCC’s Second
Assessment Report: 21
Assumes all natural gas is methane
Fugitive gas
emissions
Provided in
ourEnvironment bi-
annually for the preceding
Calculation using gas composition,
flow volume, size, design and age of
facility (often calculation); or,
Methane (CH4) 100 year
Global Warming Potential
(GWP) IPCC’s Second
Assumes all natural gas is methane
Basis of Reporting
2013 reporting Page 22 of 58
6 months calculated based on estimated gas
escapes that result in exterior gas
alarms being activated
Assessment Report: 21
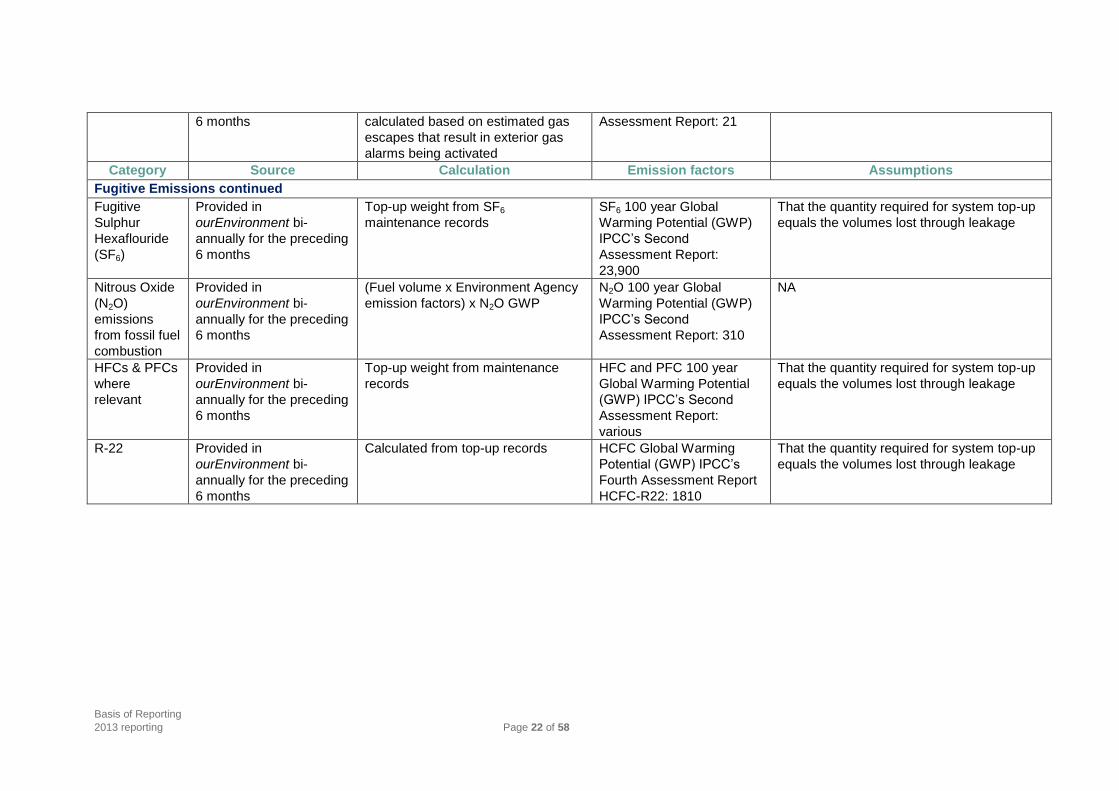
Category Source Calculation Emission factors Assumptions
Fugitive Emissions continued
Fugitive
Sulphur
Hexaflouride
(SF6)
Provided in
ourEnvironment bi-
annually for the preceding
6 months
Top-up weight from SF6
maintenance records
SF6 100 year Global
Warming Potential (GWP)
IPCC’s Second
Assessment Report:
23,900
That the quantity required for system top-up
equals the volumes lost through leakage
Nitrous Oxide
(N2O)
emissions
from fossil fuel
combustion
Provided in
ourEnvironment bi-
annually for the preceding
6 months
(Fuel volume x Environment Agency
emission factors) x N2O GWP
N2O 100 year Global
Warming Potential (GWP)
IPCC’s Second
Assessment Report: 310
NA
HFCs & PFCs
where
relevant
Provided in
ourEnvironment bi-
annually for the preceding
6 months
Top-up weight from maintenance
records
HFC and PFC 100 year
Global Warming Potential
(GWP) IPCC’s Second
Assessment Report:
various
That the quantity required for system top-up
equals the volumes lost through leakage
R-22 Provided in
ourEnvironment bi-
annually for the preceding
6 months
Calculated from top-up records HCFC Global Warming
Potential (GWP) IPCC’s
Fourth Assessment Report
HCFC-R22: 1810
That the quantity required for system top-up
equals the volumes lost through leakage
Basis of Reporting
2013 reporting Page 23 of 58
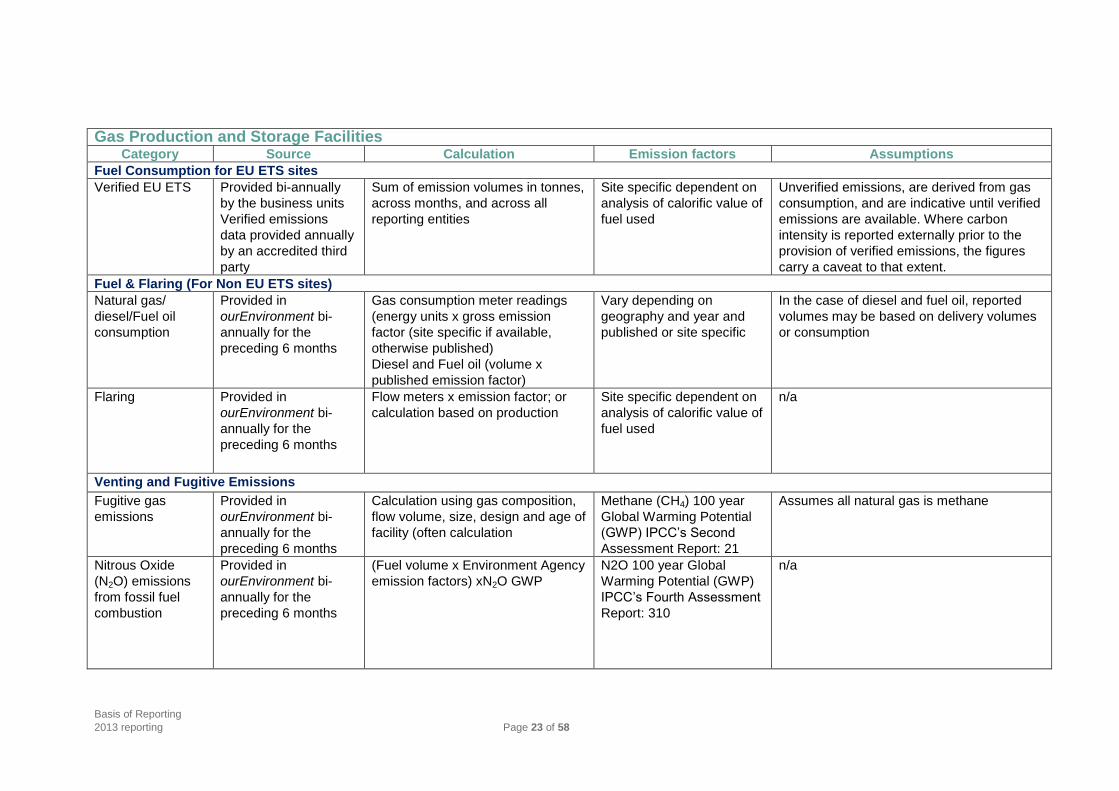
Gas Production and Storage Facilities
Category Source Calculation Emission factors Assumptions
Fuel Consumption for EU ETS sites
Verified EU ETS Provided bi-annually
by the business units
Verified emissions
data provided annually
by an accredited third
party
Sum of emission volumes in tonnes,
across months, and across all
reporting entities
Site specific dependent on
analysis of calorific value of
fuel used
Unverified emissions, are derived from gas
consumption, and are indicative until verified
emissions are available. Where carbon
intensity is reported externally prior to the
provision of verified emissions, the figures
carry a caveat to that extent.
Fuel & Flaring (For Non EU ETS sites)
Natural gas/
diesel/Fuel oil
consumption
Provided in
ourEnvironment bi-
annually for the
preceding 6 months
Gas consumption meter readings
(energy units x gross emission
factor (site specific if available,
otherwise published)
Diesel and Fuel oil (volume x
published emission factor)
Vary depending on
geography and year and
published or site specific
In the case of diesel and fuel oil, reported
volumes may be based on delivery volumes
or consumption
Flaring Provided in
ourEnvironment bi-
annually for the
preceding 6 months
Flow meters x emission factor; or
calculation based on production
Site specific dependent on
analysis of calorific value of
fuel used
n/a
Venting and Fugitive Emissions
Fugitive gas
emissions
Provided in
ourEnvironment bi-
annually for the
preceding 6 months
Calculation using gas composition,
flow volume, size, design and age of
facility (often calculation
Methane (CH4) 100 year
Global Warming Potential
(GWP) IPCC’s Second
Assessment Report: 21
Assumes all natural gas is methane
Nitrous Oxide
(N2O) emissions
from fossil fuel
combustion
Provided in
ourEnvironment bi-
annually for the
preceding 6 months
(Fuel volume x Environment Agency
emission factors) xN2O GWP
N2O 100 year Global
Warming Potential (GWP)
IPCC’s Fourth Assessment
Report: 310
n/a

Basis of Reporting
2013 reporting Page 24 of 58
Category Source Calculation Emission factors Assumptions
Venting and Fugitive Emissions continued
HFCs & PFCs
where relevant
Provided in
ourEnvironment bi-
annually for the
preceding 6 months
Top-up weight from
maintenance records
Various based on GWP
sources from: 2012
Guidelines to
DEFRA/DECC’s GHG
Conversion Factors
That the quantity required for system top-up
equals the volumes lost through leakage
R-22 Provided in
ourEnvironment bi-
annually for the
preceding 6 months
Measurement of inventory
levels
HCFC Global Warming
Potential (GWP) IPCC’s
Fourth Assessment Report
HCFC-22: 1810
That the quantity required for system top-up
equals the volumes lost through leakage
Methane from
Nitrogen Removal
Units
Provided in
ourEnvironment bi-
annually for the
preceding 6 months
Flow meters [volume] x spot
sampling (concentration)*x GWP
Methane (CH4) 100 year
Global Warming Potential
(GWP) IPCC’s Second
Assessment Report: 21
Assumes concentration does not vary
between spot samples
Carbon Dioxide
from Thermal
Oxidisers
Provided in
ourEnvironment bi-
annually for the
preceding 6 months
Flow meters x CO2 concentration
(based on spot samples)
N/A Assumes concentration does not vary
between spot samples

Basis of Reporting
2013 reporting Page 25 of 58
Appendix A – Glossary of Terms Term Definition
Greenhouse Gas
(GHG)
The six greenhouse gases (GHGs) listed in the Kyoto Protocol (CO2,
CH4, N2O, HFCs, PFCs and SF6).
Total carbon
emissions
Gross Scope 1 and 2 GHG emissions based on stated
organisational boundary.
Scope 1 A reporting organisation’s direct GHG emissions.
Scope 2 A reporting organisation’s emissions associated with the generation
of electricity, heating/ cooling, or steam purchased for own
consumption.
Carbon dioxide
equivalent (CO2e)
The universal unit of measurement to indicate the global warming
potential (GWP) of each of the six greenhouse gases, expressed in
terms of the GWP of one unit of carbon dioxide. It is used to evaluate
releasing (or avoiding releasing) different greenhouse gases against
a common basis.
tCO2e Metric tonnes of carbon dioxide equivalent (refer above)
Equity Share Percentage of Centrica’s ownership within an entity which reflects
the extent of the financial risks and rewards of the entity we are
entitled to.
Reporting Entity The level that the equity share is applied. Ensuring that this is at the
level appropriate to fairly and accurately reflect our investments.
Exclusive use of
asset
In most cases ‘Owned’ is where we own or have exclusive use of an
asset. However in the case of buildings and vehicles, the term
‘owned’ covers where we use all or part of them for the long term.
EU ETS European Union Emission Trading Scheme
CO2 Carbon Dioxide
CH4 Methane
N2O Nitrous Oxide
SF6 Sulphur Hexafluoride
HFCS Hydrofluorocarbons
HCFC Hydrochlorofluorocarbon
PFCS Perfluorocarbons
Grey Fleet Private cars used on business
CFC Chlorofluorocarbon
CRC Carbon Reduction Commitment
Appendix B – Material and Immaterial Emissions Centrica reports all material GHG emissions from our wholly owned or partially owned reporting
entities across the group. Immaterial emissions are reported when they are readily available, for
example, where Centrica is also the operator of the asset.
Table C below, identifies what are considered the material and immaterial emission sources for
different business activities.
Table C - Materiality by Business Activity
Business activity Material emission sources Immaterial emission sources
Production & power
generation
Stationary combustion
Flaring Fugitive emissions
Venting Vehicle & building emissions
Imported electricity
Fleet based business Fleet fuel emissions Building emissions
Office based business Building electricity use Fleet fuel emissions
Building fuel use

Basis of Reporting
2013 reporting Page 26 of 58
Internal carbon footprint (property, fleet and travel) Target
Centrica has committed to reduce the annual carbon footprint of our core offices, company
vehicles and travel by 20% by the end of 2015 (from 2007 base year).
Target structure
Centrica has not set an absolute reduction target to our entire (present and future) business due
to our planned expansion. We are however committed to applying good practice in reducing the
impacts of both our existing and future businesses. Accordingly, we have set ourselves an
ambitious target in relation to our core business (existing in 2007) and are committed to
applying the same good practice to our future businesses where practicable.
This target uses a 2007 base year.
Scope of target
Organisational boundary
Table C - Organisational boundaries of the target
Emissions included in scope Emissions excluded from scope
Existing business All in-scope assets and activities
associated with the businesses
within Centrica plc as at 31
December 2007.
Organic growth of the existing
business which does not involve
new assets
Activities and assets associated
with organic growth or new
business that cannot be isolated in
the financial accounts
Emissions from new businesses7
acquired through merger or
acquisition (including equity share)
and joint ventures since 31
December 2007
Emissions from new assets8 since
31 December 2007 that can be
isolated in the financial accounts
Emissions from business
divestments since 2007
Geography Activity associated with Centrica’s
global businesses
n/a
New businesses and new assets are excluded on the basis that the company is in growth mode
thus allowing for consistency of scope and on-going comparability with our 2007 baseline
business.
Furthermore, we aim to ensure new businesses have best technology applied from the outset
(e.g. a low emission vehicle fleet), thus limiting the opportunity for further significant
improvement during the target period.
Out of scope assets and activities will be accounted for separately. In only excluding future
growth that can be isolated within the accounts, a conservative approach is taken and our on-
going carbon footprint is over-estimated rather than under-estimated.
7 A new line of business that can be individually isolated through the financial accounts (typically through cost codes)
8 A new asset is an additional asset, whether additional vehicle or office, which does not replace an existing asset
(irrespective of whether it’s a result of new business or organic growth)

Basis of Reporting
2013 reporting Page 27 of 58
Operational boundary
Table D - Operational boundaries of the target
Emissions included in scope Emissions excluded from scope
Internal
carbon
footprint
Annual emissions associated
with energy and fuel
consumption from our
occupation of offices, our
commercial fleet, our company
cars and our business travel
(see below)
Annual emissions from upstream (gas terminals,
power stations, etc.) assets
Annual emissions from assets and activities other
than listed opposite
Offices Office accommodation
permanently occupied by
Centrica personnel, including
wholly occupied and partially
occupied, owned and leased
offices
Emissions associated with the
use of gas, biodiesel; biomass
and electricity for servicing the
office
Offices on sites and for the express purpose of
upstream generation and storage (gas terminals
and power stations)
Offices and other facilities owned or leased by
Centrica but not occupied by Centrica employees
Home-worker offices
Use of ozone depleting substances (ODS) within
office facilities9
Emissions from generating power for export under
Short Term Operating Reserve (STOR) contracts10
Commercial
fleet Utility vehicles used by Centrica,
including downstream service
engineers and upstream site
based vehicles
Vehicles used by long-term
contractors working under
Centrica management control
Shuttle buses11
Non road legal vehicles, including heavy plant
Franchisee commercial vehicles
Company
cars Emissions from cars owned,
leased or hired by Centrica for
use by Centrica employees for
business purposes
Emissions associated with personal mileage
Emissions associated with privately-owned
vehicles used for business purposes (which
includes Direct Energy since company cars are
not provided)
Instances where fuel costs are claimed, as
opposed to mileage12
Business
travel Air and rail travel undertaken by
Centrica employees booked via
corporate travel providers
Air and rail travel undertaken by Centrica
employees not booked via corporate travel
providers (with the exception of North American
flights in 2007 and 2008)13
International rail travel, e.g. Eurostar
North America rail travel
Taxis
Buses
9 Emissions of ODS are not considered to have a material impact on the total footprint and therefore are not included
10 At a number of our UK sites, we have Short Term Operating Reserve (STOR) contracts with National Grid to provide
self-generated power to the grid. While we capture the emissions associated with this power generation in our Total Carbon Emissions metric, they are outside of the scope of the Internal Carbon Footprint. 11
Buses used to transport Centrica staff to and from Centrica offices and local public transport/amenity facilities 12
Claiming fuel costs as opposed to mileage for business purposes is not in line with Centrica expenses policy and therefore is a rare occurrence and considered immaterial 13
A central booking system was not fully implemented until 2009 in North America, refer to Table F for further details
Basis of Reporting
2013 reporting Page 28 of 58
Period of target
2007 base year to 2015 target year. All data years are calendar years (January to December)
Rationale for target period
Selection of base year - the Greenhouse Gas (GHG) Protocol produced by the World
Resources Institute and the World Business Council for Sustainable Development states;
‘Companies should choose as a base year the earliest relevant point in time for which they have
reliable data’
2007 has been selected as a base year for Centrica as it is the earliest year for which we have
reliable data.
2015 is the end year. This means that the emissions associated with the 12 months of 2015 will
be compared to those of 2007 to determine the overall reduction.
Calculation methodology Base year re-calculation
The 2007 base year emissions will not be re-calculated for mergers and acquisitions (outside
scope), but in order to ensure we do not claim credit for simply down-sizing our business, the
base year emissions will be reduced following divestment of any part of the existing business
that was in existence during 2007.
This will entail the identification of the in-scope emissions associated with the assets and
activities of the divested business and the removal of such, from the 2007 base year emissions.
We recognise that GHG accounting at the individual level can be difficult and that the separation
of divested businesses is not always clear cut. Accordingly, in an effort to remain credible, a
conservative approach will be taken designed to avoid positive bias in the data (i.e.
overestimation of the base year footprint) and detailed records maintained for transparency.
Base year to end year comparison
The following methodology will be applied to ensure an accurate comparison between the 2007
base year and the 2015 end year.
The property portfolio, as defined in the boundaries and scope, in existence in 2007 is
documented along with the corresponding energy use and GHG emissions. This forms
the core property of the ‘existing businesses’.
Should any site close or be vacated, we will cease to account for emissions from the
point of vacancy. Historical emissions data will not be removed from the baseline and
subsequent years unless the office was vacated due to a divestment. Where vacated
sites are directly replaced by a new site(s), the new site will be included in scope from
the point of occupation. The replaced site(s) will also stay in scope so that the data
during Centrica’s occupation is retained.
The commercial and company car fleet portfolio, as defined in the scope, during 2007
is documented along with the corresponding fuel use and GHG emissions. This forms
the core fleet of the ‘existing businesses’.
Business travel is accounted by cost centre. In this way, any travel associated with
new, out of scope business can be identified and accounted for discretely.

Basis of Reporting
2013 reporting Page 29 of 58
Data quality
Where available we will take direct use/sources as defined in Table E. Estimations are made
for serviced offices14
and fuel card user private mileage, see Table E. Data collection and reporting frequency
Data is compiled on a quarterly basis, using an online software solution - ourEnvironment. The
system is designed to receive the data by reporting entity and by indicator. The data providers
(such as fleet department) submit and validate the data in the system and can attach supporting
documents, as well as commentary. Where appropriate, the system automatically calculates the
carbon dioxide equivalent (CO2e) using referenced emission factors where required.
The internal footprint is internally reported to the Centrica Executive Committee (CEC) on a
quarterly basis and reported externally on an annual basis through the Corporate Responsibility
report.
Emission factors
Emission factors relevant to each year will be applied, recognising that a time-lag maybe
present. The guidance provided on using the emission factors, in association with the emission
factors themselves, will be applied unless specifically stated otherwise.
The ‘Total GHG’ direct emission factors are used. These include the global warming potential of
carbon dioxide, methane and nitrous oxides. This total GHG approach is considered to be most
reflective of the company’s actual in-scope carbon footprint.
The emission factors used include Scope 1, 2 and 3, but exclude ‘out of scope’ emissions.
Refer to Tables E and F for the actual emission factor values used (correct as of November
2013).
14
Serviced offices – Centrica occupies space within a number of third party owned offices. Staff numbers can range
from hundreds to less than five. In most cases we do not have access to energy use data and have little or no influence
on the energy efficiency of the building or the actions of the other occupants. For completeness, we do include these
offices within our emission data, but calculate the emissions in accordance with Tables E and F

Basis of Reporting
2013 reporting Page 30 of 58
Table E - UK and European emission factors
Category Owner Source Calculation Emission factors Assumptions
Offices
Electricity Group
Property
Solely occupied sites:
meter readings
validated against bills
Consumption (kWh) x
emission factor
DEFRA’s one year average
factors15
n/a
Serviced offices:
calculated using
average Centrica
power use per FTE
Average Centrica power
use per FTE x FTE in
office x emission factor
As above There will be a lower rate
of improvement in the
serviced offices; therefore
an average (2009)
Centrica power use/FTE
value is applied to all
years
Gas Group
Property
Solely occupied sites:
meter readings
validated against bills.
Consumption (kWh) x
emission factor
DEFRA’s Gross Calorific Value n/a
Serviced offices:
calculated using
average Centrica gas
use per FTE
Average Centrica gas use
per FTE x FTE in office x
emission factor
As above There will be a lower rate of
improvement in the serviced
offices; therefore an average
(2009) Centrica gas use/FTE
value is applied to all years
Biodiesel
blends
Group
Property
Measurement of
biodiesel consumption
for on-site power
generation
Biodiesel consumption
(litres) x Scope 1&3
emission factor.
Mineral diesel
consumption x emission
factor
DEFRA emission factor for the transport and
processing (scope 3) of waste cooking oil plus
the Scope 1 emissions relating to direct
tailpipe emissions of methane (CH4) and
nitrous oxide (N2O)16
The biodiesel used originates
from UK cooking oil. Best
practice for carbon
accounting of biofuels is to
include the Scope 1 and 3
emissions associated with it
Biofuel Group
Property
Quantity of biofuel
(woodchips) purchase
invoices
Biofuel (tonnes) x Scope
1 & 3 emission factors
As above n/a
Fleet
15
The 2013 DEFRA carbon reporting guidelines changed the emission factor methodology. From 2013 the emission factors are no longer retrospectively applied and the electricity emission factors are
no longer based on the five year grid rolling average, but on the one year average. 16
Direct emissions of CO2 are set to 0 for biofuels, as the same amount of CO2 is absorbed in the growth of the feedstock from which the biofuel is produced.
Basis of Reporting
2013 reporting Page 31 of 58
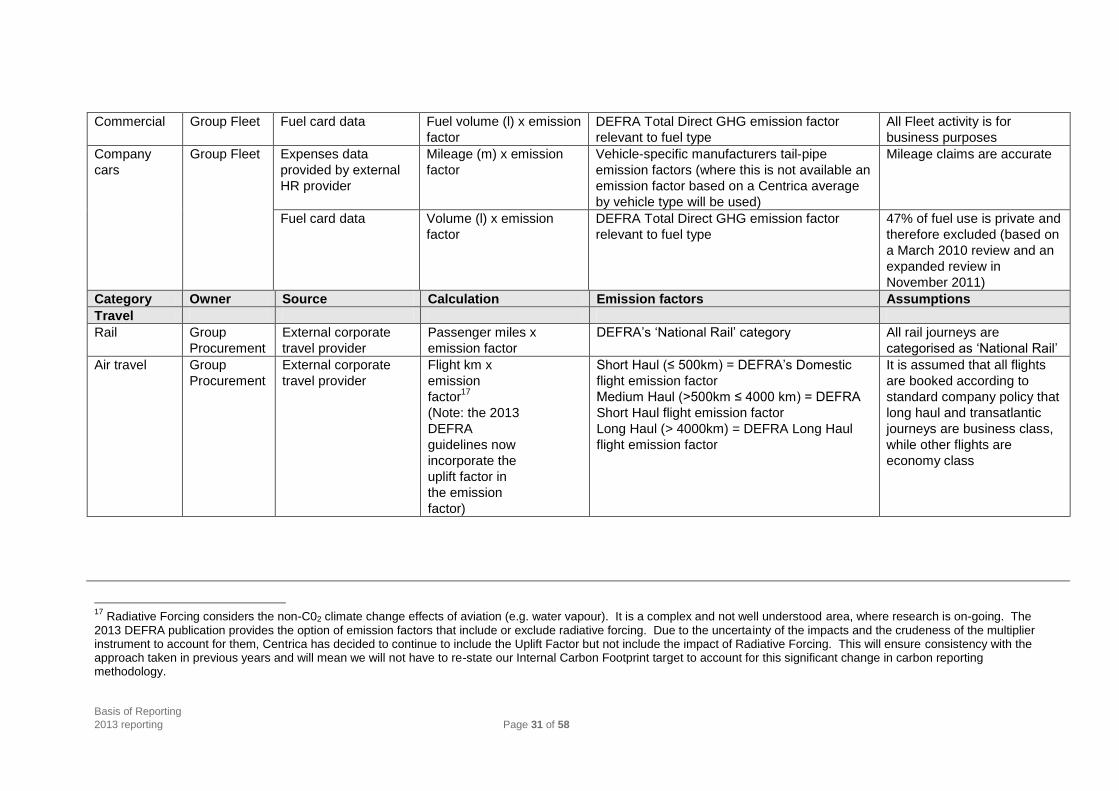
Commercial Group Fleet Fuel card data Fuel volume (l) x emission
factor
DEFRA Total Direct GHG emission factor
relevant to fuel type
All Fleet activity is for
business purposes
Company
cars
Group Fleet Expenses data
provided by external
HR provider
Mileage (m) x emission
factor
Vehicle-specific manufacturers tail-pipe
emission factors (where this is not available an
emission factor based on a Centrica average
by vehicle type will be used)
Mileage claims are accurate
Fuel card data Volume (l) x emission
factor
DEFRA Total Direct GHG emission factor
relevant to fuel type
47% of fuel use is private and
therefore excluded (based on
a March 2010 review and an
expanded review in
November 2011)
Category Owner Source Calculation Emission factors Assumptions
Travel
Rail Group
Procurement
External corporate
travel provider
Passenger miles x
emission factor
DEFRA’s ‘National Rail’ category All rail journeys are
categorised as ‘National Rail’
Air travel Group
Procurement
External corporate
travel provider
Flight km x
emission
factor17
(Note: the 2013
DEFRA
guidelines now
incorporate the
uplift factor in
the emission
factor)
Short Haul (≤ 500km) = DEFRA’s Domestic
flight emission factor
Medium Haul (>500km ≤ 4000 km) = DEFRA
Short Haul flight emission factor
Long Haul (> 4000km) = DEFRA Long Haul
flight emission factor
It is assumed that all flights
are booked according to
standard company policy that
long haul and transatlantic
journeys are business class,
while other flights are
economy class
17
Radiative Forcing considers the non-C02 climate change effects of aviation (e.g. water vapour). It is a complex and not well understood area, where research is on-going. The 2013 DEFRA publication provides the option of emission factors that include or exclude radiative forcing. Due to the uncertainty of the impacts and the crudeness of the multiplier instrument to account for them, Centrica has decided to continue to include the Uplift Factor but not include the impact of Radiative Forcing. This will ensure consistency with the approach taken in previous years and will mean we will not have to re-state our Internal Carbon Footprint target to account for this significant change in carbon reporting methodology.

Basis of Reporting
2013 reporting Page 32 of 58
Table F – Non-European emission factors
Category Owner Source Calculation Emission factors Assumptions
Offices
Electricity Group
Property
Solely occupied sites:
meter readings
validated against bills
Consumption
(kWh) x
location specific
emission
factors
Emissions & Generation Resource Integrated
Database eGRID Year 2007 Summary Tables
Environment Canada Electricity Intensity
Tables 2008 data
n/a
Serviced offices:
square footage and
type
Square footage
x consumption
rate (by
property type) x
state/province
emission factor
(as above)
Consumption rates (by location and building
type) from Energy Information Administration
(EIA)
Gas Group
Property
Solely occupied sites:
meter readings
validated against bills.
Consumption
(m3) x gas
emission factor
National Inventory Report 1990-2006,
Environment Canada
n/a
Serviced offices:
square footage and
type
Square footage x
consumption rate
(by property type)
x gas emission
factor
Consumption rates (by building type) from EIA
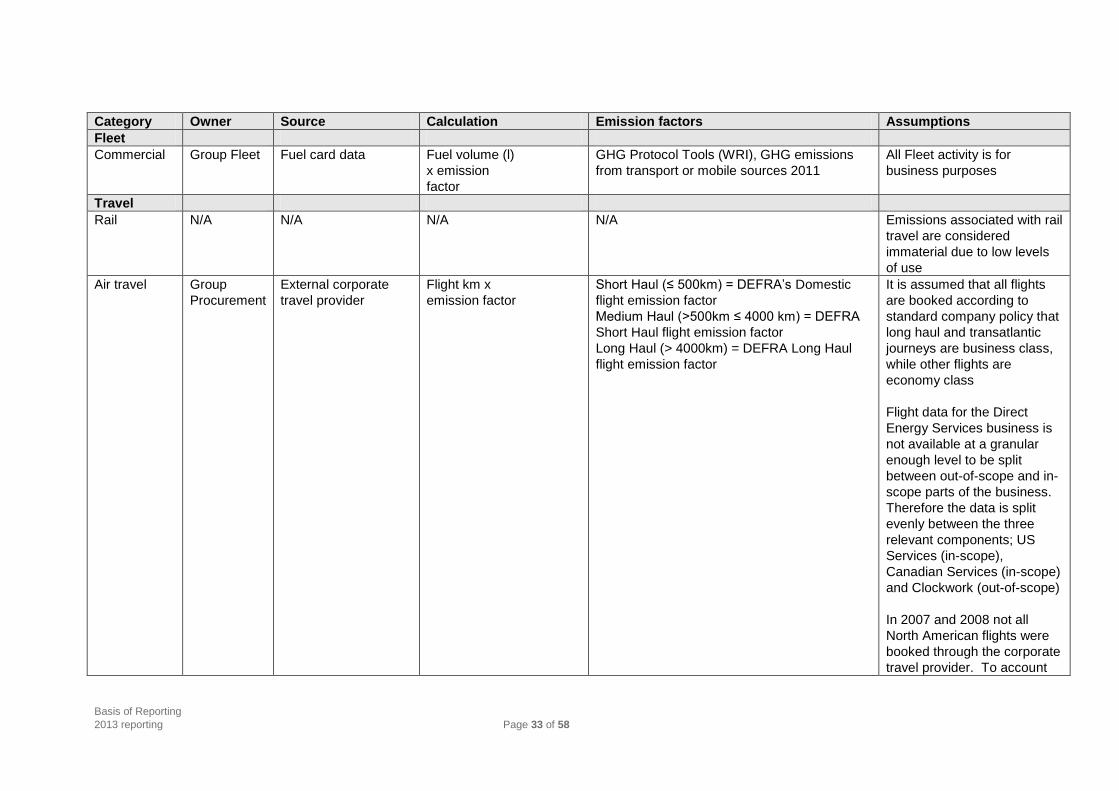
Basis of Reporting
2013 reporting Page 33 of 58
Category Owner Source Calculation Emission factors Assumptions
Fleet
Commercial Group Fleet Fuel card data Fuel volume (l)
x emission
factor
GHG Protocol Tools (WRI), GHG emissions
from transport or mobile sources 2011
All Fleet activity is for
business purposes
Travel
Rail N/A N/A N/A N/A Emissions associated with rail
travel are considered
immaterial due to low levels
of use
Air travel Group
Procurement
External corporate
travel provider
Flight km x
emission factor
Short Haul (≤ 500km) = DEFRA’s Domestic
flight emission factor
Medium Haul (>500km ≤ 4000 km) = DEFRA
Short Haul flight emission factor
Long Haul (> 4000km) = DEFRA Long Haul
flight emission factor
It is assumed that all flights
are booked according to
standard company policy that
long haul and transatlantic
journeys are business class,
while other flights are
economy class
Flight data for the Direct
Energy Services business is
not available at a granular
enough level to be split
between out-of-scope and in-
scope parts of the business.
Therefore the data is split
evenly between the three
relevant components; US
Services (in-scope),
Canadian Services (in-scope)
and Clockwork (out-of-scope)
In 2007 and 2008 not all
North American flights were
booked through the corporate
travel provider. To account

Basis of Reporting
2013 reporting Page 34 of 58
for the ‘leakage’ a 1.5
correction factor has been
applied to the corporate travel
provider data to more
accurately reflect actual
emissions. The factor was
calculated by assessing the
flight spend ratio between the
corporate travel provider
spend and the total flight
spend
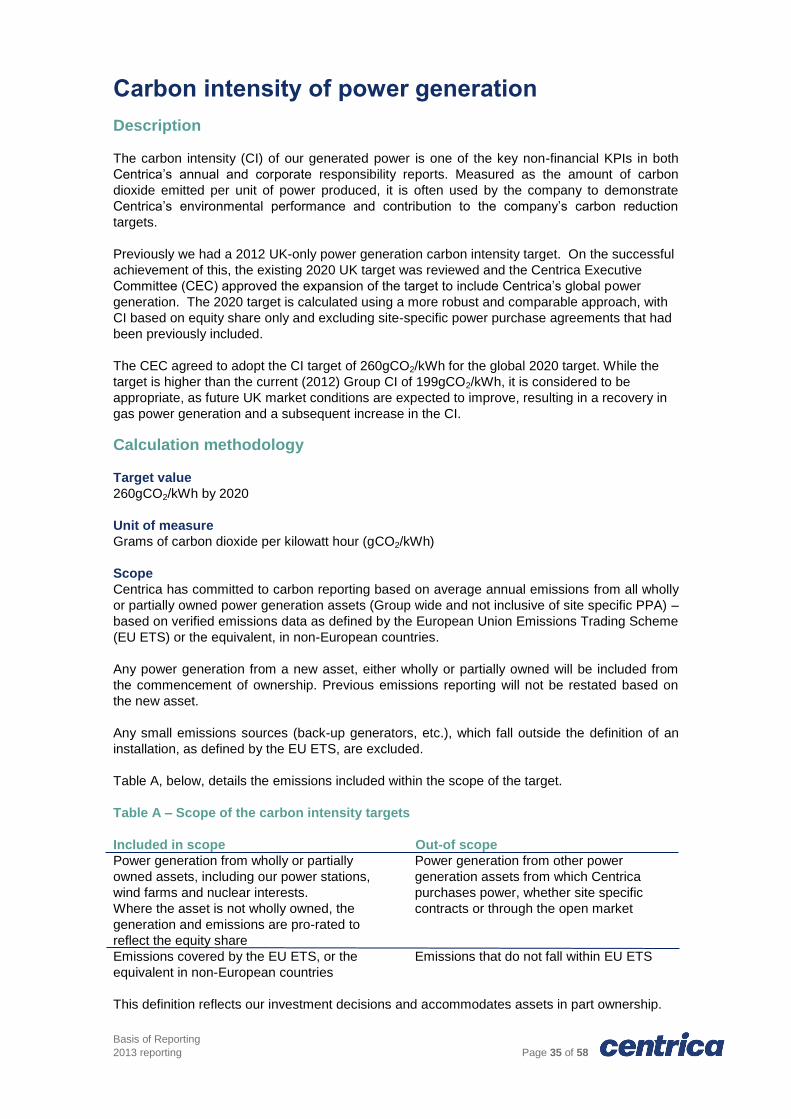
Basis of Reporting
2013 reporting Page 35 of 58
Carbon intensity of power generation Description
The carbon intensity (CI) of our generated power is one of the key non-financial KPIs in both
Centrica’s annual and corporate responsibility reports. Measured as the amount of carbon
dioxide emitted per unit of power produced, it is often used by the company to demonstrate
Centrica’s environmental performance and contribution to the company’s carbon reduction
targets.
Previously we had a 2012 UK-only power generation carbon intensity target. On the successful
achievement of this, the existing 2020 UK target was reviewed and the Centrica Executive
Committee (CEC) approved the expansion of the target to include Centrica’s global power
generation. The 2020 target is calculated using a more robust and comparable approach, with
CI based on equity share only and excluding site-specific power purchase agreements that had
been previously included.
The CEC agreed to adopt the CI target of 260gCO2/kWh for the global 2020 target. While the
target is higher than the current (2012) Group CI of 199gCO2/kWh, it is considered to be
appropriate, as future UK market conditions are expected to improve, resulting in a recovery in
gas power generation and a subsequent increase in the CI.
Calculation methodology
Target value
260gCO2/kWh by 2020
Unit of measure
Grams of carbon dioxide per kilowatt hour (gCO2/kWh)
Scope
Centrica has committed to carbon reporting based on average annual emissions from all wholly
or partially owned power generation assets (Group wide and not inclusive of site specific PPA) –
based on verified emissions data as defined by the European Union Emissions Trading Scheme
(EU ETS) or the equivalent, in non-European countries.
Any power generation from a new asset, either wholly or partially owned will be included from
the commencement of ownership. Previous emissions reporting will not be restated based on
the new asset.
Any small emissions sources (back-up generators, etc.), which fall outside the definition of an
installation, as defined by the EU ETS, are excluded.
Table A, below, details the emissions included within the scope of the target.
Table A – Scope of the carbon intensity targets
Included in scope Out of scSOut-of scope
Power generation from wholly or partially
owned assets, including our power stations,
wind farms and nuclear interests.
Where the asset is not wholly owned, the
generation and emissions are pro-rated to
reflect the equity share
Power generation from other power
generation assets from which Centrica
purchases power, whether site specific
contracts or through the open market
Emissions covered by the EU ETS, or the
equivalent in non-European countries
Emissions that do not fall within EU ETS
This definition reflects our investment decisions and accommodates assets in part ownership.

Basis of Reporting
2013 reporting Page 36 of 58
Calculation methodology
Carbon intensity will be calculated as:
Carbon Intensity (gCO2/kWh) = Sum of EU ETS emissions (or equivalent) from all in-
scope generation sites during subject period /sum of power available for sale from all
in-scope generation sites during the subject period.
Power available for sale is that provided to the distribution network and is net of any
transmission losses on the generation side. Losses associated with supplier distribution are not
accounted for.
Data quality, collection and reporting frequency
Data quality
The EU ETS emissions data used to calculate the carbon intensity are subject to annual
verification during March/April of the following year. Only these verified EU ETS figures can be
used to calculate the official annual carbon intensity figure.
The North American emissions are not assured through an equivalent verification process and
therefore their carbon intensity can be considered official on completion of Centrica’s own
assurance processes.
Data collection and reporting frequency
Carbon intensity figures are compiled quarterly based on the preceding three months data, for
internal tracking of cumulative carbon intensity reported as Mean Annual Total (MAT). The
carbon intensity figure for the previous calendar year is reported externally on an annual basis.
Emission calculations
In the compilation of carbon intensity figures, two general approaches are used:
Unverified emissions calculations – calculated internally – each quarter - based on gas
chromatography samples of actual gas consumed for all thermal generation assets;
and
Verified emissions calculations – evaluated annually using the finalised internal view
of emissions for the calendar year and then verified by an accredited third party for
compliance with the EU ETS.
Assumptions Assumptions are included in Table B.

Basis of Reporting
2013 reporting Page 37 of 58
Table B – Calculations and assumptions
Category Owner Source Calculation Assumptions
Power from wholly
and partially
owned assets
Power Business,
Centrica Energy
Power Business, Direct
Energy
Provided quarterly, for the
preceding three months, by
respective power business units
Sum of power available for sale,
volumes in MWh, across months,
and across all assets.
Pro-rated for partially owned
assets to reflect Centrica’s equity
n/a
Gas Turbine
Emissions
Power Business,
Centrica Energy
Power Business, Direct
Energy
Provided quarterly for the
preceding three months, by
respective power business units
Verified EU ETS emissions data
provided annually by an
accredited third party for
European emissions.
Sum of emission volumes in
tonnes, across months, and
across all assets.
Pro-rated for partially owned
assets to reflect Centrica’s equity
Emissions are derived from gas
consumption
EU ETS emissions are
considered indicative until verified
emissions are available
Nuclear
Emissions
Power Business
Development, Centrica
Energy
Nuclear power stations have low,
but not zero emissions, as a
result of standby combustion
plant. Centrica does not have
sight of these emissions pre
verification, and as such, for the
purposes of the CI metric,
assume a carbon intensity of
0.48g/kWh.
The 0.48g/kWh is an assumption
based on the actual verified
carbon intensity of the nuclear
generation for the previous year
Pro-rated for partially owned
assets to reflect Centrica’s equity
Unverified emissions, are derived
from a prudent assumption, and
are indicative until verified
emissions are available.
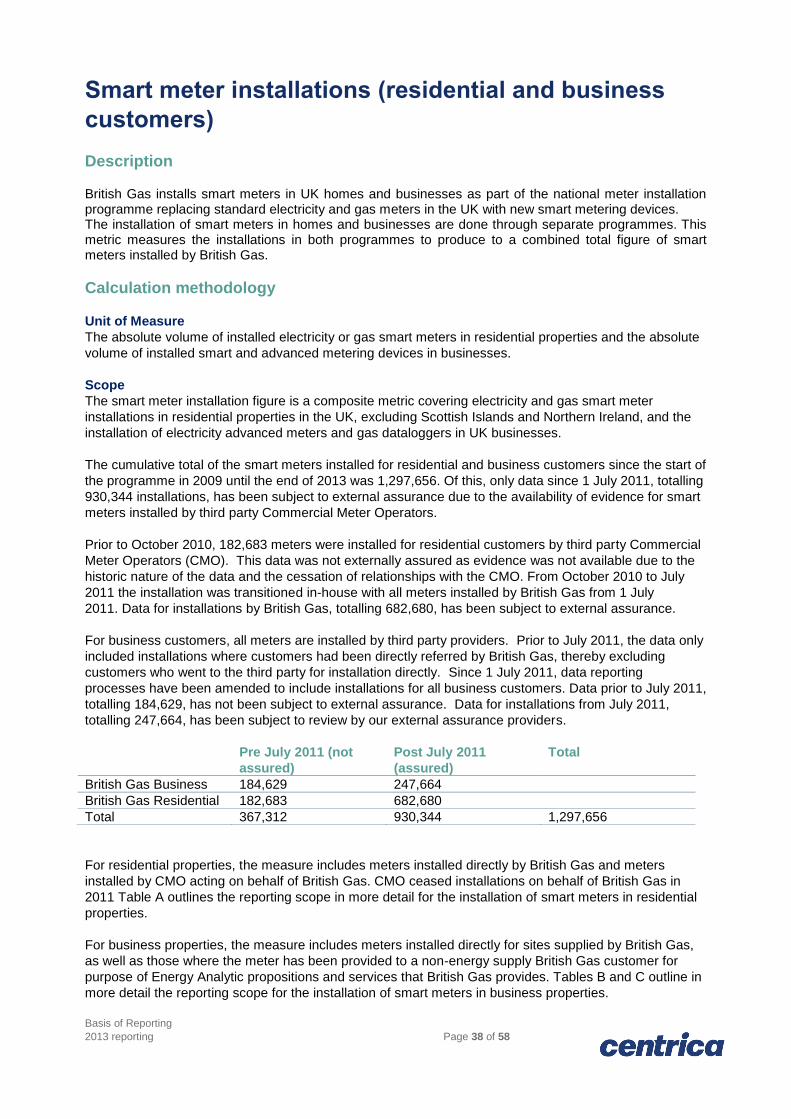
Basis of Reporting
2013 reporting Page 38 of 58
Smart meter installations (residential and business
customers)
Description British Gas installs smart meters in UK homes and businesses as part of the national meter installation programme replacing standard electricity and gas meters in the UK with new smart metering devices. The installation of smart meters in homes and businesses are done through separate programmes. This metric measures the installations in both programmes to produce to a combined total figure of smart meters installed by British Gas.
Calculation methodology
Unit of Measure
The absolute volume of installed electricity or gas smart meters in residential properties and the absolute
volume of installed smart and advanced metering devices in businesses.
Scope
The smart meter installation figure is a composite metric covering electricity and gas smart meter
installations in residential properties in the UK, excluding Scottish Islands and Northern Ireland, and the
installation of electricity advanced meters and gas dataloggers in UK businesses.
The cumulative total of the smart meters installed for residential and business customers since the start of
the programme in 2009 until the end of 2013 was 1,297,656. Of this, only data since 1 July 2011, totalling
930,344 installations, has been subject to external assurance due to the availability of evidence for smart
meters installed by third party Commercial Meter Operators.
Prior to October 2010, 182,683 meters were installed for residential customers by third party Commercial
Meter Operators (CMO). This data was not externally assured as evidence was not available due to the
historic nature of the data and the cessation of relationships with the CMO. From October 2010 to July
2011 the installation was transitioned in-house with all meters installed by British Gas from 1 July
2011. Data for installations by British Gas, totalling 682,680, has been subject to external assurance.
For business customers, all meters are installed by third party providers. Prior to July 2011, the data only
included installations where customers had been directly referred by British Gas, thereby excluding
customers who went to the third party for installation directly. Since 1 July 2011, data reporting
processes have been amended to include installations for all business customers. Data prior to July 2011,
totalling 184,629, has not been subject to external assurance. Data for installations from July 2011,
totalling 247,664, has been subject to review by our external assurance providers.
Pre July 2011 (not
assured)
Post July 2011
(assured)
Total
British Gas Business 184,629 247,664
British Gas Residential 182,683 682,680 Total 367,312 930,344 1,297,656 For residential properties, the measure includes meters installed directly by British Gas and meters
installed by CMO acting on behalf of British Gas. CMO ceased installations on behalf of British Gas in
2011 Table A outlines the reporting scope in more detail for the installation of smart meters in residential
properties.
For business properties, the measure includes meters installed directly for sites supplied by British Gas,
as well as those where the meter has been provided to a non-energy supply British Gas customer for
purpose of Energy Analytic propositions and services that British Gas provides. Tables B and C outline in
more detail the reporting scope for the installation of smart meters in business properties.
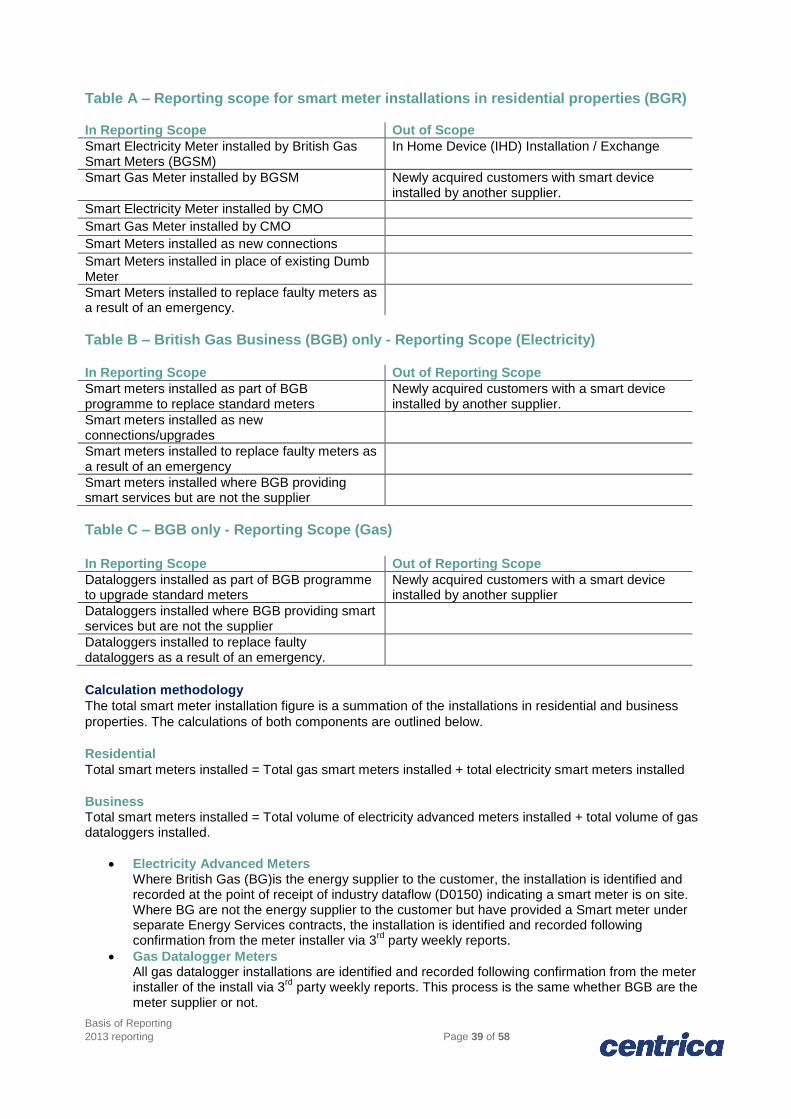
Basis of Reporting
2013 reporting Page 39 of 58
Table A – Reporting scope for smart meter installations in residential properties (BGR) In Reporting Scope Out of Scope Smart Electricity Meter installed by British Gas Smart Meters (BGSM)
In Home Device (IHD) Installation / Exchange
Smart Gas Meter installed by BGSM Newly acquired customers with smart device installed by another supplier.
Smart Electricity Meter installed by CMO Smart Gas Meter installed by CMO Smart Meters installed as new connections Smart Meters installed in place of existing Dumb Meter
Smart Meters installed to replace faulty meters as a result of an emergency.
Table B – British Gas Business (BGB) only - Reporting Scope (Electricity) In Reporting Scope Out of Reporting Scope Smart meters installed as part of BGB programme to replace standard meters
Newly acquired customers with a smart device installed by another supplier.
Smart meters installed as new connections/upgrades
Smart meters installed to replace faulty meters as a result of an emergency
Smart meters installed where BGB providing smart services but are not the supplier
Table C – BGB only - Reporting Scope (Gas)
In Reporting Scope Out of Reporting Scope Dataloggers installed as part of BGB programme to upgrade standard meters
Newly acquired customers with a smart device installed by another supplier
Dataloggers installed where BGB providing smart services but are not the supplier
Dataloggers installed to replace faulty dataloggers as a result of an emergency.
Calculation methodology
The total smart meter installation figure is a summation of the installations in residential and business
properties. The calculations of both components are outlined below.
Residential
Total smart meters installed = Total gas smart meters installed + total electricity smart meters installed
Business Total smart meters installed = Total volume of electricity advanced meters installed + total volume of gas dataloggers installed.
Electricity Advanced Meters Where British Gas (BG)is the energy supplier to the customer, the installation is identified and recorded at the point of receipt of industry dataflow (D0150) indicating a smart meter is on site. Where BG are not the energy supplier to the customer but have provided a Smart meter under separate Energy Services contracts, the installation is identified and recorded following confirmation from the meter installer via 3
rd party weekly reports.
Gas Datalogger Meters All gas datalogger installations are identified and recorded following confirmation from the meter installer of the install via 3
rd party weekly reports. This process is the same whether BGB are the
meter supplier or not.

Basis of Reporting
2013 reporting Page 40 of 58
Data Quality
For residential installations, a record of the installation is recorded in SAP, via H1 Handheld terminal. Any
connectivity issues leading to potentially inaccurate data in SAP is amended by the Site Support team in
SAP and within an externally maintained database to ensure accurate reporting.
For business installations, figures for electricity are only recognised through receipt of formal industry
dataflow D0150 that indicate to the rest of the industry that a smart meter is present on site. Where British
Gas is not the supplier or a gas datalogger has been installed, it is confirmed through agent reports. The
overall installation figures are reconciled in December with our strategic install partners through these
routes. Successful installs are also monitored through tracking and receipt of polled reads from those
meters, customer NPS surveys and tracking of customer complaints.
Data collection Detailed outlines of the collection for residential installations can be found in Table D and for business installations in Table E.
Table D – data collection for residential installations
Source Provider Fuel Frequency Purpose Assumptions
SAP British Gas Gas/Elec Daily Data for British Gas field operation
All Smart Meters identified by Service Order Description (i.e. type of job booked)
Tracker Database
British Gas Gas/Elec Daily Additional data for operations not updated successfully in SAP. These are retrospectively captured within SAP. Approximately 4% of operations.
Data is manually edited by Site Support team. All Smart Meters identified by Service Order Description (i.e. type of job booked)
Table E – data collection for business installations
Source Provider Fuel Frequency Purpose Assumptions
Industry DataFlows (D0149/D0150)
Meter Operator
Elec Weekly Industry confirmation of smart meter installation where British Gas is the supplier
All Smart Meters identified through Meter Type defined as RCAMR, NCAMR or RCAMY. Only sites where British Gas is the supplier
Agent Weekly Report
Meter Installer
Elec Weekly Confirmation of all installs completed on behalf of British Gas
Meter Installer confirmation of smart installation for British Gas led installations including sites where British Gas is not the supplier. Does not include details for non-led installations such as faulty meters.
Agent Weekly Report
Meter Installer
Gas Weekly Confirmation of all installs completed on behalf of British Gas
Meter installer confirmation of advanced metering device (datalogger) for British Gas led installations, including sites where British Gas is not the supplier.
Polled Reads
Data Collector
Elec Monthly Successful polled (P) meter read via D0010 dataflow provides confirmation of successful smart installation and communications set-up.
Applicable Data Collector must be appointed before P reads can be delivered to British Gas.

Basis of Reporting
2013 reporting Page 41 of 58
Employee engagement
Description Employee Engagement is defined as ‘an emotional state driven by individuals’ perception of different
components within an organisation, which in turn has a measurable impact on business performance.’ It
is generally measured annually, by an external provider (Centrica currently uses ETSplc) via a survey
delivered either online or via paper copy to all employees. In some instances it is also appropriate to
include some contractors and third party employees – in these cases a revised questionnaire is issued.
Calculation methodology The employee engagement score takes the mean of six questions which represent the Feel and Do
element of the ETS model. The final engagement score is calculated by taking the average of the means
of each of the six engagement questions.
Employees are asked to respond to six specific questions:
FEEL:
I feel passionate about the job I’m doing
I am proud to work for (Brand Name)
I feel a strong sense of commitment for (Brand Name)
DO:
I am motivated by my business area to do the best job I can
I tell others outside this company the great things about working here
I intend to be working at (Brand Name) in one year’s time
The questions are answered using a 6 point scale:
Strongly Disagree
Disagree
Slightly Disagree
Slightly Agree
Agree
Strongly Agree
Scope
All direct Centrica employees are invited to complete the Centrica Employee Engagement survey and
where agreed with the relevant brand, third party contractors (on and offshore) are also included.
The administration of the survey is agreed annually and is generally administered annually unless
otherwise agreed by the Centrica Executive Committee (CEC). The survey generally runs for three
weeks.
Timeframe
In 2013, the survey ran at slightly different times and to slightly different durations to accommodate the
needs of each Brand.
Centrica Storage, Centrica Energy, and BG Business ran the survey for five weeks to accommodate the
shift pattern of their employees (three weeks on, two weeks off).
Brand Survey Open Survey Closed
Centrica Storage 27 Aug 27 Sept (online)
30 Sep (paper)
Centrica Energy 27 Aug
27 Sept (online)
30 Sept (paper)
Direct Energy 9Sept 27 Sept (online)
30 Sep (paper)
Centrica Corporate Centre 9 Sept 27 Sept
British Gas 9 Sept 27 Sept (online)
Basis of Reporting
2013 reporting Page 42 of 58
30 Sept (paper)
Exclusions
The overall Centrica engagement index excludes contractors, 3rd
party and agency staff. However where
contractor and third party staff provide a significant contribution to business operations some of the
Centrica businesses do include agency and third party staff. Results are presented as including or
excluding contractors and third party staff as appropriate.
Languages and Geography
The survey was administered primarily in English with a small number being printed in French Canadian
(29), Vietnamese (39) and Spanish (37). Translation of which was a joint approach between ETS - who
conducted the initial translation, and a representative from the appropriate business area, who reviewed
and signed off the translations.
The primary countries of distribution are:
United Kingdom
Norway
The Netherlands
Trinidad and Tobago
America
Canada
Data quality, collection and reporting frequency
Data Quality
Employee data for all Centrica employees, including the organisational hierarchy is initially extracted from
the Centrica SAP database. This data is then checked, verified and updated manually by teams placed
within in each brand to ensure accuracy.
The survey is administered primarily on-line, however where employees do not have online access, paper
copies of the survey are also printed and either locally distributed or posted directly to home addresses.
ETS invite employees to take part, either via an e-mail invitation or by a paper copy of the survey
delivered either to the local office or to home addresses.
Collection
Responses are captured directly by ETS, either via the online survey, or posted, freepost directly back to
ETS.
Reporting Frequency
Reports are developed annually for the CEC and leadership teams. Detailed reports, down to individual
manager level, are cascaded throughout each business. Each manager who receives 5 or more
responses against their team code receives their own tailored manager report.

Basis of Reporting
2013 reporting Page 43 of 58
Retention
Description The retention rate is the complementary ratio to the unplanned or regrettable attrition rate and is the
proportion of the workforce that remains with the business in a given reporting period. There would be
some level of correlation between retention rates and Employee Engagement scores, in that a fully
engaged workforce is more likely to stay in the business.
Calculation methodology
Unit of measure
The number of employees who stay with the business in a given reporting period expressed as a
percentage of the average headcount in the period.
Scope
In this calculation ‘Leavers’ only includes unplanned leavers (i.e. employee initiated and not within the
control of Centrica) as this is the part of attrition that the business has no control over.
Unplanned leavers includes: o Resignation (Personal/Career Progression) o Death In Service
Planned Leavers are subtracted from the average headcount before calculation and are not included. They are: o Retirement (Normal, early, late & ill health) o Redundancy (Voluntary & Compulsory) o Mutual Consent o Career break (e.g. Sabbatical) o Business Divestment
Dismissals are also subtracted from the average headcount before calculation. They are: o Capability o Misconduct
Retention is measured and reported for the UK & North American Business Units. Headcount is the total number of individuals undertaking an activity, irrespective of whether they work full or part time. It includes:
Employed staff – Individuals paid through Centrica’s payroll on either a full time or part time basis. This also includes fixed term contract staff (FTC) that are paid through Centrica’s payroll and have received pay for a service.
Head count data is collected for all the Business Units in the UK and NA as follows:
Corporate Centre
British Gas Residential
British Gas Services
British Gas Business
British Gas New Energy
Centrica Energy
Centrica Storage
Direct Energy – data is available at BU level but it is summarised at DE level for reporting purposes
For the calculation a mean average headcount is calculated for each business unit, Centrica UK, DE and
then Group (UK+DE) over a twelve consecutive month range.
The retention rate is the complementary ratio to the attrition rate, which is the number of unplanned leavers in a given reporting period expressed as a percentage of the average headcount (minus planned
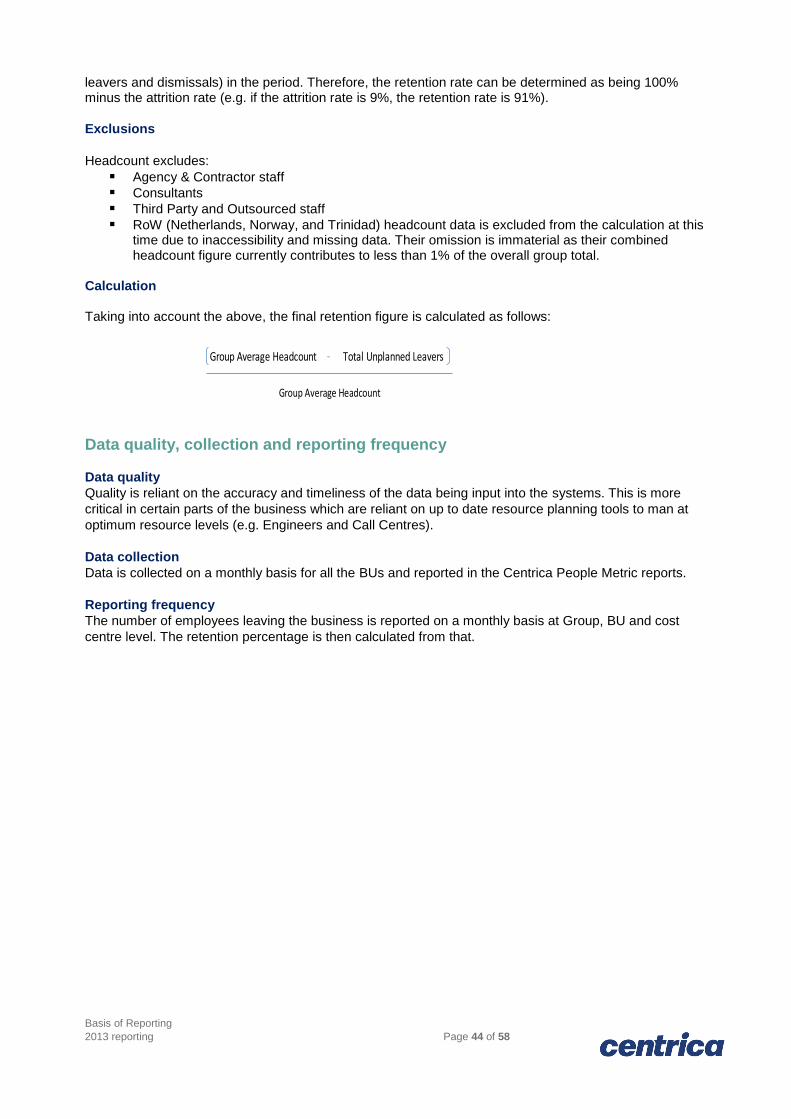
Basis of Reporting
2013 reporting Page 44 of 58
leavers and dismissals) in the period. Therefore, the retention rate can be determined as being 100% minus the attrition rate (e.g. if the attrition rate is 9%, the retention rate is 91%).
Exclusions
Headcount excludes:
Agency & Contractor staff
Consultants
Third Party and Outsourced staff
RoW (Netherlands, Norway, and Trinidad) headcount data is excluded from the calculation at this time due to inaccessibility and missing data. Their omission is immaterial as their combined headcount figure currently contributes to less than 1% of the overall group total.
Calculation Taking into account the above, the final retention figure is calculated as follows:
Data quality, collection and reporting frequency
Data quality
Quality is reliant on the accuracy and timeliness of the data being input into the systems. This is more
critical in certain parts of the business which are reliant on up to date resource planning tools to man at
optimum resource levels (e.g. Engineers and Call Centres).
Data collection
Data is collected on a monthly basis for all the BUs and reported in the Centrica People Metric reports.
Reporting frequency
The number of employees leaving the business is reported on a monthly basis at Group, BU and cost
centre level. The retention percentage is then calculated from that.
Group Average Headcount
Group Average Headcount - Total Unplanned Leavers
Basis of Reporting
2013 reporting Page 45 of 58
Absence
Description Employee sickness absence relates to the number of days lost to sickness absence in a given reporting
period.
Calculation methodology
Unit of measure
The MAT sickness per FTE is calculated by adding the monthly sickness per FTE for twelve consecutive
months. The sickness per FTE rate is calculated by dividing the total absence days by the full time
equivalent for the same month.
Scope
Absence is measured and reported for the UK and North American Business Units. Absence data is not
available for the European entities and Trinidad. Given that these employees represent less than 1% of
the 2013 headcount, these are not considered to be material from a Group absence perspective.
Contractors are not included in absence calculations.
Data is collected for all the Business Units in the UK and North America as follows:
Corporate Centre
British Gas Residential
British Gas Services
British Gas Business
British Gas New Energy
Centrica Energy
Centrica Storage
Direct Energy – data is available at BU level but it is summarised at DE level for absence reporting purposes
Data Calculation
For each business the total number of absence days in the month is divided by the business’ FTE for that
month. For the Corporate Responsibility Report, the MAT sickness/FTE figure covers the period from
January 2013 to December 2013. The total figure is calculated by adding together the monthly rates for
this period.
Data quality, collection and reporting frequency Data quality Quality is reliant on the accuracy and timeliness of the data being input into the systems. This is more critical in certain parts of the business which are reliant on up-to-date resource planning tools to deliver at optimum resource levels (e.g. Engineers and Call Centres). Data collection Data is collected on a monthly basis for all the BUs and reported in the Centrica People Metric reports. In July 2011 a new absence reporting system was introduced in the British Gas BUs, known as “Absence Manager”. The operational system allows employees to contact a 24/7 telephone line where they can provide details of their absence from work and estimated return to work date, which is communicated to their line manager via email and text message. When the employee is fit to return to work they call the helpline again to confirm their return date and the manager is informed of this via email and text message. The system provides real time information on levels of employee absence. This key reporting tool now covers 93% of the UK employee population and a business decision has not yet been made to roll out the system to the remaining 7% to Centrica Energy, Centrica Storage and Corporate Centre.

Basis of Reporting
2013 reporting Page 46 of 58
As Direct Energy uses a different version of SAP to the UK there is currently no plan to introduce this system in North America and this decision sits with the HR Director for Direct Energy. Irrespective of whether Absence Manager has been launched in a Business Unit, all managers in Centrica are responsible for completing a notification form of absence and sending it to Centrica People Services so that the SAP system is updated, including payroll. Reporting frequency Absence data is reported by line managers on a daily basis to a central team, where the data is then uploaded onto the HR system. Data is then reported monthly at Group, BU and cost centre level.
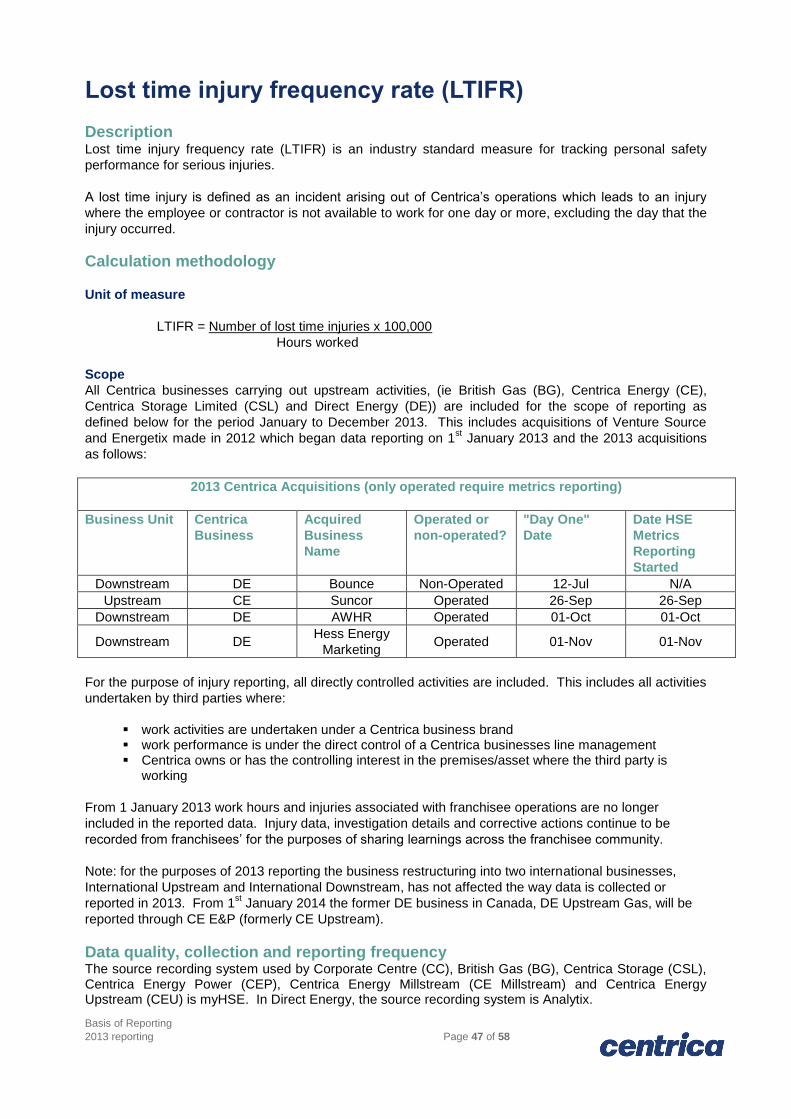
Basis of Reporting
2013 reporting Page 47 of 58
Lost time injury frequency rate (LTIFR)
Description Lost time injury frequency rate (LTIFR) is an industry standard measure for tracking personal safety
performance for serious injuries.
A lost time injury is defined as an incident arising out of Centrica’s operations which leads to an injury
where the employee or contractor is not available to work for one day or more, excluding the day that the
injury occurred.
Calculation methodology
Unit of measure
LTIFR = Number of lost time injuries x 100,000
Hours worked
Scope
All Centrica businesses carrying out upstream activities, (ie British Gas (BG), Centrica Energy (CE),
Centrica Storage Limited (CSL) and Direct Energy (DE)) are included for the scope of reporting as
defined below for the period January to December 2013. This includes acquisitions of Venture Source
and Energetix made in 2012 which began data reporting on 1st January 2013 and the 2013 acquisitions
as follows:
2013 Centrica Acquisitions (only operated require metrics reporting)
Business Unit Centrica
Business
Acquired
Business
Name
Operated or
non-operated?
"Day One"
Date
Date HSE
Metrics
Reporting
Started
Downstream DE Bounce Non-Operated 12-Jul N/A
Upstream CE Suncor Operated 26-Sep 26-Sep
Downstream DE AWHR Operated 01-Oct 01-Oct
Downstream DE Hess Energy
Marketing Operated 01-Nov 01-Nov
For the purpose of injury reporting, all directly controlled activities are included. This includes all activities
undertaken by third parties where:
work activities are undertaken under a Centrica business brand work performance is under the direct control of a Centrica businesses line management Centrica owns or has the controlling interest in the premises/asset where the third party is
working
From 1 January 2013 work hours and injuries associated with franchisee operations are no longer
included in the reported data. Injury data, investigation details and corrective actions continue to be
recorded from franchisees’ for the purposes of sharing learnings across the franchisee community.
Note: for the purposes of 2013 reporting the business restructuring into two international businesses,
International Upstream and International Downstream, has not affected the way data is collected or
reported in 2013. From 1st January 2014 the former DE business in Canada, DE Upstream Gas, will be
reported through CE E&P (formerly CE Upstream).
Data quality, collection and reporting frequency The source recording system used by Corporate Centre (CC), British Gas (BG), Centrica Storage (CSL), Centrica Energy Power (CEP), Centrica Energy Millstream (CE Millstream) and Centrica Energy Upstream (CEU) is myHSE. In Direct Energy, the source recording system is Analytix.

Basis of Reporting
2013 reporting Page 48 of 58
The required data is then transferred to an Excel template for the purpose of reporting to Centrica Group. A nominated person from each business extracts the relevant data from the source recording system to complete the reporting template. Where actual worked hours are available these are used to calculate LTIFR, if actual work hours are not maintained, for example salaried personnel, the following calculation is used to estimate work hours across the group:
monthly average FTE (equivalent full time employees) x 8 hours x number of working days in the
month (excluding weekends and national holidays)
Note: for off-shore workers a 24 hour working day should be used for the days off-shore.
It may generally be assumed that actual work hours are available for industrial personnel; hours for office
based personnel are generally estimated (including agency workers). Contractor hours are provided by
the contractor as agreed in the contract.
Any other work hour estimations must be submitted to Group HSES for approval before 1 December of
the preceding recording year by the business HSE Director, no approvals were requested or made in
2013.
Reporting frequency
Data is reported monthly to Group HSE from by each business unit on the Group HSES provided
spreadsheet. All data is verified by the business unit HSES Director, or nominated deputy, prior to
submission to Group HSES. Group HSES conduct necessary assurance on the submitted data and
consolidated business unit data in to a single performance report for the Centrica Executive Committee
monthly.

Basis of Reporting
2013 reporting Page 49 of 58
Total recordable injury rate (TRIR)
Description Total recordable injury frequency rate (TRIFR) is an industry standard measure for tracking personal
safety performance for serious injuries.
Recordable injuries include all work related injuries apart from first aid. This includes fatalities, lost time,
restricted duty and medical treatment (Note: all needle stick and sharps injuries are recordable). Only
first aid injuries described as below are excluded:
a) Using a non-prescription medication at nonprescription strength (for medications available in both prescription and non-prescription form, a recommendation by a physician or other licensed health care professional to use a non-prescription medication at prescription strength is considered medical treatment for recordkeeping purposes);
b) Administering tetanus immunizations (other immunizations, such as Hepatitis B vaccine or rabies vaccine, are considered medical treatment)
c) Cleaning, flushing or soaking wounds on the surface of the skin
d) Using wound coverings such as bandages, Band-AidsTM
, gauze pads, etc.; or using butterfly bandages or Steri-Strips
TM (other wound closing devices such as sutures, staples, etc., are
considered medical treatment)
e) Using hot or cold therapy
f) Using any non-rigid means of support, such as elastic bandages, wraps, non-rigid back belts, etc. (devices with rigid stays or other systems designed to immobilize parts of the body are considered medical treatment for recordkeeping purposes)
g) Using temporary immobilization devices while transporting an accident victim (e.g., splints, slings, neck collars, back boards, etc.)
h) Drilling of a fingernail or toenail to relieve pressure, or draining fluid from a blister
i) Using eye patches
j) Removing foreign bodies from the eye using only irrigation or a cotton swab
k) Removing splinters or foreign material from areas other than the eye by irrigation, tweezers, cotton swabs or other simple means
l) Using finger guards
m) Using massages (physical therapy or chiropractic treatment are considered medical treatment for recordkeeping purposes)
n) Drinking fluids for relief of heat stress.
Calculation methodology
Unit of measure
TRIFR = Number of recordable injuries x 100,000
Hours worked
Scope
All Centrica businesses (ie British Gas (BG), Centrica Energy (CE), Centrica Storage Limited (CSL) and
Direct Energy (DE) Upstream Gas) are included for the scope of reporting as defined below for the period
January to December 2013. This includes acquisitions of Venture Source and Energetix made in 2012
which began data reporting on 1st January 2013 and the 2013 acquisitions as follows:
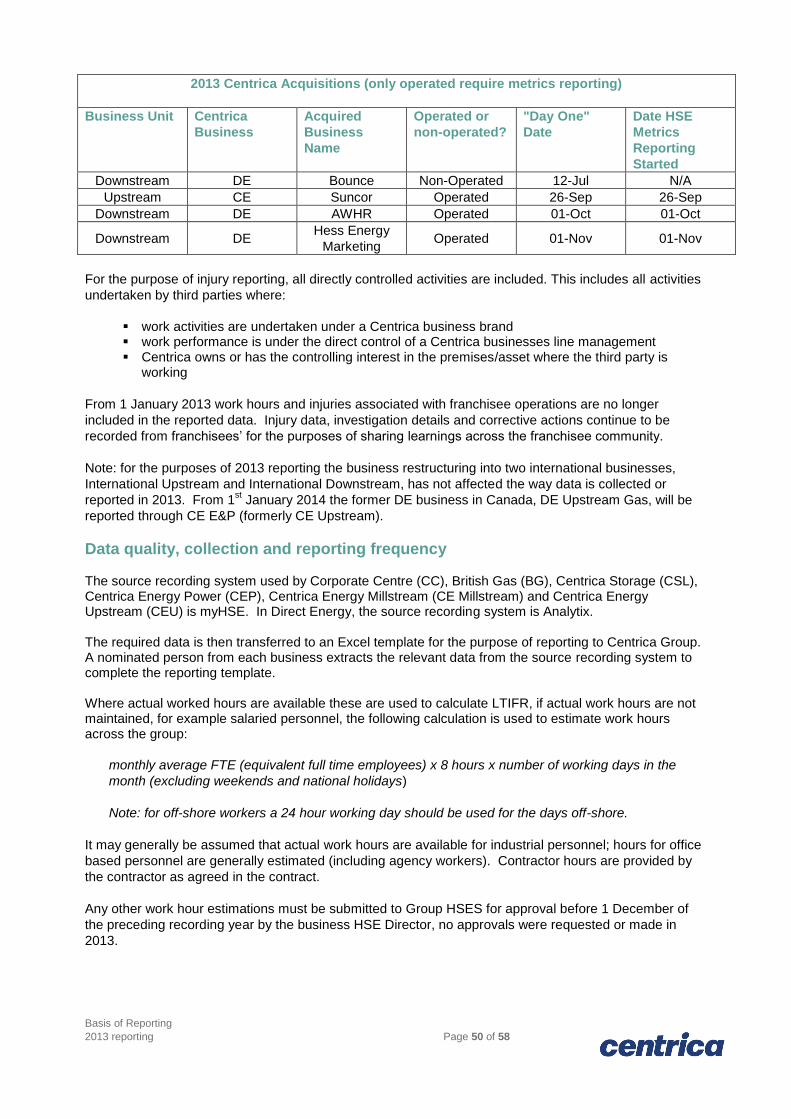
Basis of Reporting
2013 reporting Page 50 of 58
2013 Centrica Acquisitions (only operated require metrics reporting)
Business Unit Centrica
Business
Acquired
Business
Name
Operated or
non-operated?
"Day One"
Date
Date HSE
Metrics
Reporting
Started
Downstream DE Bounce Non-Operated 12-Jul N/A
Upstream CE Suncor Operated 26-Sep 26-Sep
Downstream DE AWHR Operated 01-Oct 01-Oct
Downstream DE Hess Energy
Marketing Operated 01-Nov 01-Nov
For the purpose of injury reporting, all directly controlled activities are included. This includes all activities
undertaken by third parties where:
work activities are undertaken under a Centrica business brand work performance is under the direct control of a Centrica businesses line management Centrica owns or has the controlling interest in the premises/asset where the third party is
working
From 1 January 2013 work hours and injuries associated with franchisee operations are no longer
included in the reported data. Injury data, investigation details and corrective actions continue to be
recorded from franchisees’ for the purposes of sharing learnings across the franchisee community.
Note: for the purposes of 2013 reporting the business restructuring into two international businesses,
International Upstream and International Downstream, has not affected the way data is collected or
reported in 2013. From 1st January 2014 the former DE business in Canada, DE Upstream Gas, will be
reported through CE E&P (formerly CE Upstream).
Data quality, collection and reporting frequency The source recording system used by Corporate Centre (CC), British Gas (BG), Centrica Storage (CSL), Centrica Energy Power (CEP), Centrica Energy Millstream (CE Millstream) and Centrica Energy Upstream (CEU) is myHSE. In Direct Energy, the source recording system is Analytix. The required data is then transferred to an Excel template for the purpose of reporting to Centrica Group. A nominated person from each business extracts the relevant data from the source recording system to complete the reporting template. Where actual worked hours are available these are used to calculate LTIFR, if actual work hours are not maintained, for example salaried personnel, the following calculation is used to estimate work hours across the group:
monthly average FTE (equivalent full time employees) x 8 hours x number of working days in the
month (excluding weekends and national holidays)
Note: for off-shore workers a 24 hour working day should be used for the days off-shore.
It may generally be assumed that actual work hours are available for industrial personnel; hours for office
based personnel are generally estimated (including agency workers). Contractor hours are provided by
the contractor as agreed in the contract.
Any other work hour estimations must be submitted to Group HSES for approval before 1 December of
the preceding recording year by the business HSE Director, no approvals were requested or made in
2013.

Basis of Reporting
2013 reporting Page 51 of 58
Reporting frequency Data is reported monthly to Group HSE from by each business unit on the Group HSES provided spreadsheet. All data is verified by the business unit HSES Director, or nominated deputy, prior to submission to Group HSES. Group HSES conduct necessary assurance on the submitted data and consolidated business unit data in to a single performance report for the Centrica Executive Committee monthly.

Basis of Reporting
2013 reporting Page 52 of 58
Significant process safety event
Description Process safety is defined by the International Association of Oil & Gas Producers as (OGP): “a disciplined
framework for managing the integrity of operating systems and processes that handle hazardous
substances. It relies on good design principles, engineering, operating and maintenance practices.”
At Centrica the effectiveness of our process safety programmes are tracked through both lagging and
leading indicators. These lagging and leading indicators are defined from recommended best practices
published by OGP (Process Safety – Recommended Practice on Key Performance Indicators, Report No.
456 November 2011) and the American Petroleum Institute’s (API) (Process Safety Performance
Indicators for the Refining and Petrochemical Industries, RP 754) and adapted for applicability to
Centrica’s activities.
Process safety events form a hierarchy of severity from proactive or leading indicators, defined as Tier 4
& 5 indicators, to actual process safety events with increasing severity from Tier 3 to Tier 1, referred to as
lagging indicators. Metrics relating to significant process safety events (Tier 1) are publically reported.
Calculation methodology Tier 1 Event Definition
A Tier 1 process safety is defined as follows:
“An uncontrolled release of flammable gas, steam or hot water under pressure causing a major injury or fatality; or the uncontrolled release of an environmentally hazardous substance causing significant impairment of sensitive receivers.”
Scope
The following Centrica business: Centrica Energy (CE), Centrica Storage Limited (CSL) and Direct
Energy (DE), reported process safety metrics related to their drilling, completions, processing, generation,
storage and supply of energy activities for the period January to December 2013.
Tier 1 process safety events are reported for all directly controlled activities, this includes all activities
undertaken by third parties where:
work activities are undertaken under a Centrica business brand work performance is under the direct control of a Centrica businesses line management Centrica owns or has the controlling interest in the premises/asset where the third party is
working
Data quality, collection and reporting frequency The source recording system used by Corporate Centre (CC), British Gas (BG), Centrica Storage (CSL), Centrica Energy Power (CEP), Centrica Energy Millstream (CE Millstream) and Centrica Energy Upstream (CEU) is myHSE. In Direct Energy, the source recording system is Analytix. The required data is then transferred to an Excel template for the purpose of reporting to Centrica Group. A nominated person from each business extracts the relevant data from the source recording system to complete the reporting template.
Reporting frequency
Data is reported monthly to Group HSE from by each business unit on the Group HSES provided
spreadsheet. All data is verified by the business unit HSES Director, or nominated deputy, prior to
submission to Group HSES. Group HSES conduct necessary assurance on the submitted data and
consolidated business unit data in to a single performance report for the Centrica Executive Committee
monthly.
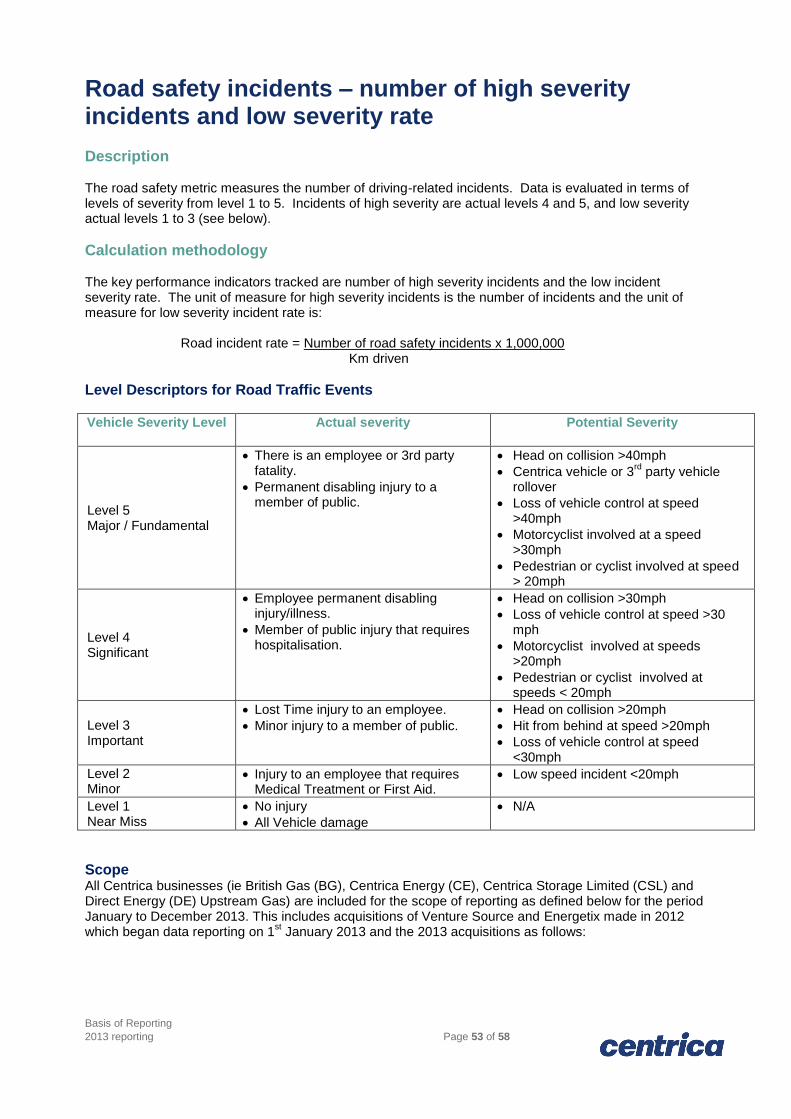
Basis of Reporting
2013 reporting Page 53 of 58
Road safety incidents – number of high severity incidents and low severity rate Description The road safety metric measures the number of driving-related incidents. Data is evaluated in terms of levels of severity from level 1 to 5. Incidents of high severity are actual levels 4 and 5, and low severity actual levels 1 to 3 (see below).
Calculation methodology The key performance indicators tracked are number of high severity incidents and the low incident severity rate. The unit of measure for high severity incidents is the number of incidents and the unit of measure for low severity incident rate is:
Road incident rate = Number of road safety incidents x 1,000,000 Km driven
Level Descriptors for Road Traffic Events
Vehicle Severity Level
Actual severity Potential Severity
Level 5 Major / Fundamental
There is an employee or 3rd party fatality.
Permanent disabling injury to a member of public.
Head on collision >40mph
Centrica vehicle or 3rd
party vehicle rollover
Loss of vehicle control at speed >40mph
Motorcyclist involved at a speed >30mph
Pedestrian or cyclist involved at speed > 20mph
Level 4 Significant
Employee permanent disabling injury/illness.
Member of public injury that requires hospitalisation.
Head on collision >30mph
Loss of vehicle control at speed >30 mph
Motorcyclist involved at speeds >20mph
Pedestrian or cyclist involved at speeds < 20mph
Level 3 Important
Lost Time injury to an employee.
Minor injury to a member of public.
Head on collision >20mph
Hit from behind at speed >20mph
Loss of vehicle control at speed <30mph
Level 2 Minor
Injury to an employee that requires Medical Treatment or First Aid.
Low speed incident <20mph
Level 1 Near Miss
No injury
All Vehicle damage
N/A
Scope All Centrica businesses (ie British Gas (BG), Centrica Energy (CE), Centrica Storage Limited (CSL) and Direct Energy (DE) Upstream Gas) are included for the scope of reporting as defined below for the period January to December 2013. This includes acquisitions of Venture Source and Energetix made in 2012 which began data reporting on 1
st January 2013 and the 2013 acquisitions as follows:

Basis of Reporting
2013 reporting Page 54 of 58
2013 Centrica Acquisitions (only operated require metrics reporting)
Business Unit Centrica
Business
Acquired
Business
Name
Operated or
non-operated?
"Day One"
Date
Date HSE
Metrics
Reporting
Started
Downstream
DE Bounce Non-Operated 12-Jul N/A
Upstream
CE Suncor Operated 26-Sep 26-Sep
Downstream
DE AWHR Operated 01-Oct 01-Oct
Downstream DE Hess Energy
Marketing
Operated 01-Nov 01-Nov
All road traffic events occurring while driving on company business are reported by employees, agency workers and contractors regardless of whether the vehicle is company owned, rented/leased or privately owned. Franchisee events are recorded but not included in the reported metrics. Note: for the purposes of 2013 reporting the business restructuring into two international businesses, International Upstream and International Downstream, has not affected the way data is collected or reported in 2013. From 1
st January 2014 the former DE business in Canada, DE Upstream Gas, will be
reported through CE E&P (formerly CE Upstream). Only business related distance is used for calculation of the incident rate. For the small number of fuel card holders in the UK (less than 2% of overall distance travelled within UK) who can purchase fuel for personal and business use, an estimate of personal distance travelled is made to exclude this from the data (47% is assumed personal from Fleet data). For Business Unit performance, the distance travelled is allocated to businesses based on headcount where aligned cost centres are not available.
Data quality, collection and reporting frequency Data collection Data is reported through incident reporting systems in each business. The source recording system used by Corporate Centre, British Gas, Centrica Storage, Centrica Energy Power, CE Millstream and Centrica Energy Upstream (CEU) is myHSE. In Direct Energy the source recording system is Analtyx. The required data is then transferred to a template for the purpose of reporting to Group. A nominated person from each business extracts the relevant data from the source reporting system to complete the reporting template. Distance travelled data is reported to Group HSE on a quarterly basis. British Gas Fleet provides data for the UK commercial fleet and company car fleet. Direct Energy Fleet provides data for North America. Reporting frequency
Data is reported monthly to Group HSE from by each business unit on the Group HSES provided
spreadsheet. All data is verified by the business unit HSES Director, or nominated deputy, prior to
submission to Group HSES. Group HSES conduct necessary assurance on the submitted data and
consolidated business unit data in to a single performance report for the Centrica Executive Committee
monthly.
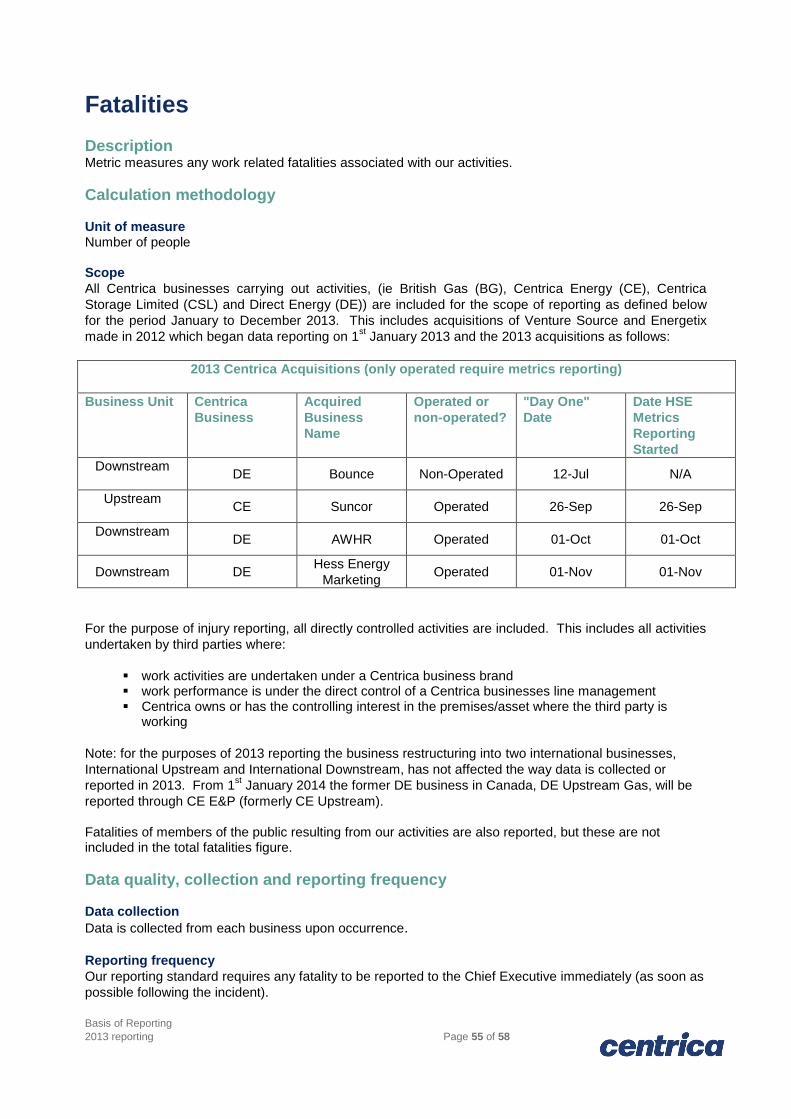
Basis of Reporting
2013 reporting Page 55 of 58
Fatalities Description Metric measures any work related fatalities associated with our activities.
Calculation methodology Unit of measure Number of people Scope
All Centrica businesses carrying out activities, (ie British Gas (BG), Centrica Energy (CE), Centrica
Storage Limited (CSL) and Direct Energy (DE)) are included for the scope of reporting as defined below
for the period January to December 2013. This includes acquisitions of Venture Source and Energetix
made in 2012 which began data reporting on 1st January 2013 and the 2013 acquisitions as follows:
2013 Centrica Acquisitions (only operated require metrics reporting)
Business Unit Centrica
Business
Acquired
Business
Name
Operated or
non-operated?
"Day One"
Date
Date HSE
Metrics
Reporting
Started
Downstream
DE Bounce Non-Operated 12-Jul N/A
Upstream
CE Suncor Operated 26-Sep 26-Sep
Downstream
DE AWHR Operated 01-Oct 01-Oct
Downstream DE Hess Energy
Marketing Operated 01-Nov 01-Nov
For the purpose of injury reporting, all directly controlled activities are included. This includes all activities
undertaken by third parties where:
work activities are undertaken under a Centrica business brand work performance is under the direct control of a Centrica businesses line management Centrica owns or has the controlling interest in the premises/asset where the third party is
working
Note: for the purposes of 2013 reporting the business restructuring into two international businesses,
International Upstream and International Downstream, has not affected the way data is collected or
reported in 2013. From 1st January 2014 the former DE business in Canada, DE Upstream Gas, will be
reported through CE E&P (formerly CE Upstream). Fatalities of members of the public resulting from our activities are also reported, but these are not included in the total fatalities figure.
Data quality, collection and reporting frequency Data collection
Data is collected from each business upon occurrence. Reporting frequency
Our reporting standard requires any fatality to be reported to the Chief Executive immediately (as soon as
possible following the incident).

Basis of Reporting
2013 reporting Page 56 of 58
Community investment contributions
Description
We undertake a range of activities that can have a positive impact on the communities in which we live
and work. We measure our contributions to better understand the impact we have. We use two key
performance indicators to calculate the contributions we make:
Total community contributions
Total employee volunteering hours
Reporting methodology
Units of measure
Community contributions are measured in British sterling.
Employee volunteering is measured in hours.
Scope
Both measures encompass contributions made across the whole of Centrica, including British Gas,
Centrica Energy, Centrica Storage, Direct Energy and Corporate Centre. Data is reported by calendar
year: 1 January – 31 December 2013.
Total community contributions
The total community contributions metric comprises charitable spend, mandatory contributions and
voluntary contributions.
Charitable spend – Contributions made to charitable organisations based on the independent London Benchmarking Group (LBG) methodology
18 as set out in the Table A.
Mandatory contributions – Payments made as required by government or regulators. British Gas make significant investments to vulnerable customers which are mandated through Government social and environmental schemes (e.g. Warm Home Discount and the Energy Company Obligation). Centrica Energy and Centrica Storage are required to invest in local community trusts as part of their licence to operate.
Voluntary contributions - Payments made for our customers which are not mandated by government or regulators. Investments made to only customers are not considered charitable within LBG methodology. E.g. Contributions by Direct Energy to the Neighbor-to-Neighbor bill assistance programme.
18
More information on LBG is available on their website and within the Guidance Manual.
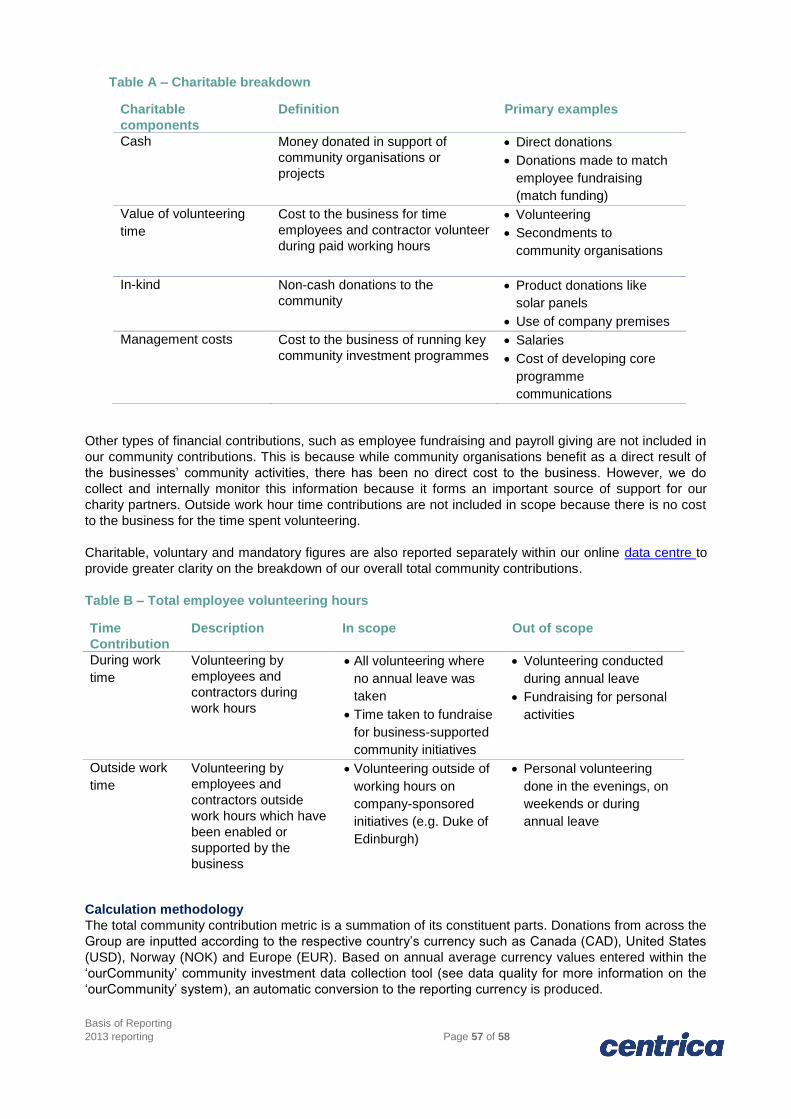
Basis of Reporting
2013 reporting Page 57 of 58
Table A – Charitable breakdown
Other types of financial contributions, such as employee fundraising and payroll giving are not included in
our community contributions. This is because while community organisations benefit as a direct result of
the businesses’ community activities, there has been no direct cost to the business. However, we do
collect and internally monitor this information because it forms an important source of support for our
charity partners. Outside work hour time contributions are not included in scope because there is no cost
to the business for the time spent volunteering.
Charitable, voluntary and mandatory figures are also reported separately within our online data centre to
provide greater clarity on the breakdown of our overall total community contributions.
Table B – Total employee volunteering hours
Calculation methodology
The total community contribution metric is a summation of its constituent parts. Donations from across the
Group are inputted according to the respective country’s currency such as Canada (CAD), United States
(USD), Norway (NOK) and Europe (EUR). Based on annual average currency values entered within the
‘ourCommunity’ community investment data collection tool (see data quality for more information on the
‘ourCommunity’ system), an automatic conversion to the reporting currency is produced.
Charitable
components
Definition Primary examples
Cash Money donated in support of
community organisations or
projects
Direct donations
Donations made to match
employee fundraising
(match funding)
Value of volunteering
time
Cost to the business for time
employees and contractor volunteer
during paid working hours
Volunteering
Secondments to
community organisations
In-kind Non-cash donations to the
community Product donations like
solar panels
Use of company premises
Management costs Cost to the business of running key
community investment programmes Salaries
Cost of developing core
programme
communications
Time
Contribution
Description In scope Out of scope
During work
time
Volunteering by
employees and
contractors during
work hours
All volunteering where
no annual leave was
taken
Time taken to fundraise
for business-supported
community initiatives
Volunteering conducted
during annual leave
Fundraising for personal
activities
Outside work
time
Volunteering by
employees and
contractors outside
work hours which have
been enabled or
supported by the
business
Volunteering outside of
working hours on
company-sponsored
initiatives (e.g. Duke of
Edinburgh)
Personal volunteering
done in the evenings, on
weekends or during
annual leave
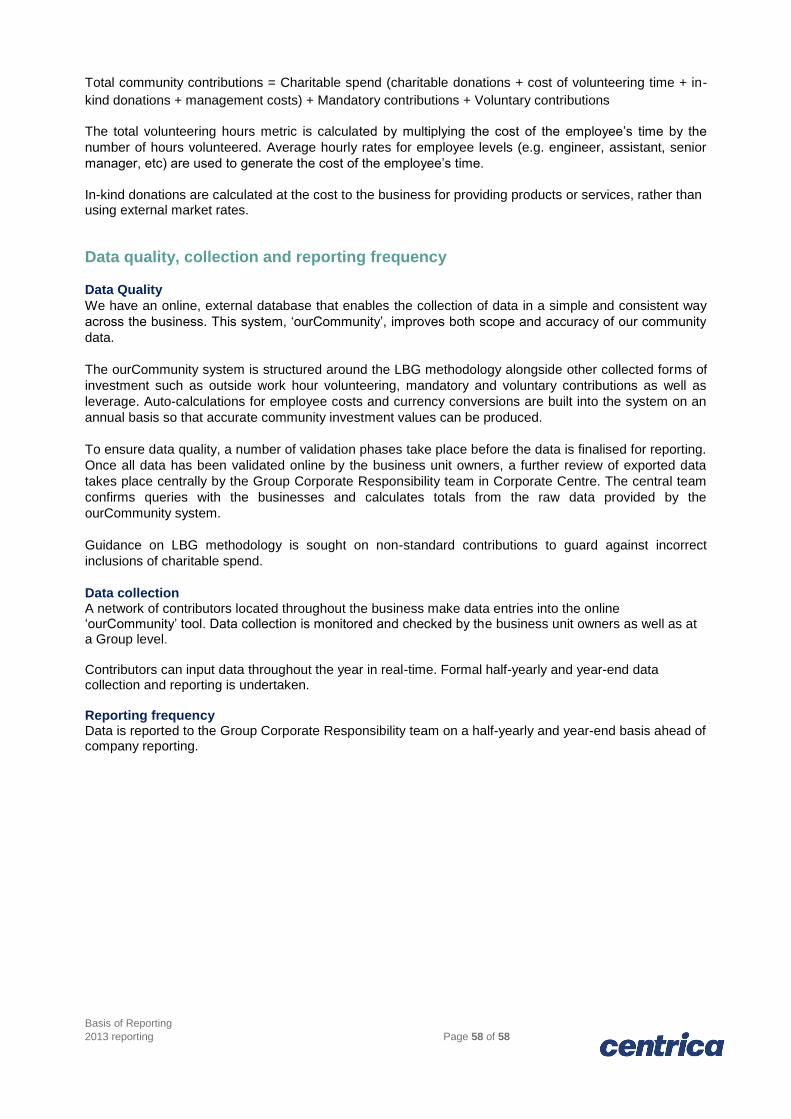
Basis of Reporting
2013 reporting Page 58 of 58
Total community contributions = Charitable spend (charitable donations + cost of volunteering time + in-
kind donations + management costs) + Mandatory contributions + Voluntary contributions
The total volunteering hours metric is calculated by multiplying the cost of the employee’s time by the
number of hours volunteered. Average hourly rates for employee levels (e.g. engineer, assistant, senior
manager, etc) are used to generate the cost of the employee’s time.
In-kind donations are calculated at the cost to the business for providing products or services, rather than using external market rates.
Data quality, collection and reporting frequency
Data Quality
We have an online, external database that enables the collection of data in a simple and consistent way
across the business. This system, ‘ourCommunity’, improves both scope and accuracy of our community
data.
The ourCommunity system is structured around the LBG methodology alongside other collected forms of
investment such as outside work hour volunteering, mandatory and voluntary contributions as well as
leverage. Auto-calculations for employee costs and currency conversions are built into the system on an
annual basis so that accurate community investment values can be produced.
To ensure data quality, a number of validation phases take place before the data is finalised for reporting.
Once all data has been validated online by the business unit owners, a further review of exported data
takes place centrally by the Group Corporate Responsibility team in Corporate Centre. The central team
confirms queries with the businesses and calculates totals from the raw data provided by the
ourCommunity system.
Guidance on LBG methodology is sought on non-standard contributions to guard against incorrect
inclusions of charitable spend.
Data collection A network of contributors located throughout the business make data entries into the online ‘ourCommunity’ tool. Data collection is monitored and checked by the business unit owners as well as at a Group level. Contributors can input data throughout the year in real-time. Formal half-yearly and year-end data collection and reporting is undertaken. Reporting frequency Data is reported to the Group Corporate Responsibility team on a half-yearly and year-end basis ahead of company reporting.


