Appendix 1: Scoping Report February 2000Environmental Services Department, Hydro Consulting
Basslink Integrated Impact Assessment Statement 1Potential Effects of Changes to Hydro Power Generation
EXECUTIVE SUMMARYThe aims of this scoping report are to identify the type and extent of likely changes to the Tasmaniannon-marine aquatic environment arising from the changed operation of hydro power stations after theinstallation of Basslink, and to identify further work required to clarify potential environmental andsocial issues resulting from these changes.
The methodology pursued for this scoping exercise involved:
1. Review of the Hydro’s simulation model of the Tasmanian generating system under theNational Electricity Market, TEMSIM (based on the Hydro’s systems operation model,SYSOP), and assessment of the effect of Basslink scenarios on power station (PS) and storagebehaviour.
2. Running the TEMSIM model under a range of scenarios including no cable (the ‘base case’),and a range of cable sizes (300, 450 and 600 MW);
3. Analysis of the hydrological (water-related) outputs of TEMSIM to allow identification ofthose waters affected by Basslink. This involved comparing the outputs of the Basslink cablescenarios with those for the ‘base case’, and where appropriate, comparison to historical data.
4. Identification, as far as possible, of the environmental and social issues associated with thosewaters.
5. Recommendations on studies / assessments and potential mitigation strategies required tofurther evaluate and address these environmental and social issues.
Results from the modelling show that the most significant changes to Hydro waterways will bedownstream of the major storages in the system. Discharges out of both the Gordon and PoatinaPower Stations are likely to show the same trends under Basslink. Notably, these are increased short-term variability in flow discharges, increased frequency of short duration (and weekend) shutdowns,and changes in the seasonality of flows. Changes in the seasonal nature of discharges out of the JohnButters Power Station are indicated, and possibly some alterations in the already highly variable pulsesof discharge.
No significant changes are indicated by the modelled results for any of the lakes within the Hydro’sgenerating system. Modelling has shown that these lakes are managed similarly to historical patterns.In addition, many lakes are currently constrained by lake level agreements. These constraints willcontinue in operation after the commissioning of Basslink. The present lake level agreements will bereviewed and assessed in relation to environmental and social issues as part of the Water ManagementReview process that the Hydro is engaging in with Department of Primary Industries, Water andEnvironment over the next 5 years.
Planned environmental investigations into the effects of the Basslink cable on the Gordon River willaddress geomorphology, instream ecological health, meromictic lakes, water quality and culturalheritage issues. Environmental investigations on the waterways downstream of Poatina Power Stationwill address geomorphology, instream ecological health, water quality, cultural heritage, and publicuse issues. Investigations downstream of the John Butters Power Station will address geomorphology,water quality, instream ecological health and tourism issues in the King River, and water quality inMacquarie Harbour.
Appendix 1: Scoping Report February 2000Environmental Services Department, Hydro Consulting
Basslink Integrated Impact Assessment Statement 2Potential Effects of Changes to Hydro Power Generation
PREFACE AND ACKNOWLEDGEMENTSThis report has been prepared as part of the Hydro’s Basslink Project. The environmental componentof this Project is headed by Andrew Scanlon. This report describes preliminary investigations into theenvironmental and social impacts of a proposed Basslink cable across the Bass Strait on the Tasmanianaquatic environment.
This report, and the material therein in no way represents any final or fully evaluated EnvironmentalImpact Assessment for the Basslink cable.
This report is a product of numerous contributions from different areas within the Hydro:
• TEMSIM modelling was provided by the Hydro’s Systems Studies section, including Roger Allen,Roger Parkyn, Dr. Michael Connarty, and Gregg Barker.
• Hydrological analyses were provided by the Hydro’s Hydrology section, including Lennie Palmer,Kirsten Adams and Holly Taylor.
• Interpretation of data, identification of environmental issues and other aspects of report productionhave been conducted by the Hydro’s Environmental Services section, including Andrew Scanlon,Mick Howland, Jackie Griggs, Helen Locher and Vanessa McNeair.
The contributions of Dr. Peter Davies, the Hydro’s SGIS section, and Stephen Stolp are gratefullyacknowledged.
Appendix 1: Scoping Report February 2000Environmental Services Department, Hydro Consulting
Basslink Integrated Impact Assessment Statement 3Potential Effects of Changes to Hydro Power Generation
CONTENTS
EXECUTIVE SUMMARY ..................................................................................................................... 1PREFACE AND ACKNOWLEDGEMENTS ........................................................................................ 2GLOSSARY AND LIST OF ACRONYMS ........................................................................................... 91 INTRODUCTION ......................................................................................................................... 11
1.1 This Document .......................................................................................................................... 111.1.1 Objectives and Content...................................................................................................... 111.1.2 Structure............................................................................................................................. 11
1.3 Legislative Framework .............................................................................................................. 131.3.1 Water Management Act 1999............................................................................................ 131.3.2 State Policy on Water Quality Management 1997............................................................. 14
1.4 The Hydro’s Aquatic Environment Program............................................................................. 151.4.1 Environmental and Aquatic Policies ................................................................................. 151.4.2 Water Management Reviews............................................................................................. 161.4.3 Waterway Health Monitoring ............................................................................................ 161.4.4 Biological Studies.............................................................................................................. 161.4.5 Water for the Environment ................................................................................................ 171.4.6 Lake Level Agreements..................................................................................................... 17
1.5 Current Operating System ......................................................................................................... 181.5.1 Storages ............................................................................................................................. 201.5.2 Spills .................................................................................................................................. 211.5.3 Power Station Operation.................................................................................................... 211.5.4 Load on the System ........................................................................................................... 211.5.5 Thermal Control Rule........................................................................................................ 23
2 MODELLING OF THE HYDRO BASSLINK OPERATING SYSTEM..................................... 242.1 Introduction ............................................................................................................................... 242.2 Description of the TEMSIM model........................................................................................... 26
2.2.1 Overview ........................................................................................................................... 262.2.2 Modelling of the Tasmanian Generating System .............................................................. 272.2.3 Offers in TEMSIM ............................................................................................................ 272.2.4 Dispatch in TEMSIM ........................................................................................................ 28
2.3 Model Inputs.............................................................................................................................. 292.3.1 Determination of System Marginal Price (SMP)............................................................... 292.3.2 Inflow Database................................................................................................................. 292.3.3 2.4.3 Efficiency Curves ..................................................................................................... 30
2.4 TEMSIM Model Outputs........................................................................................................... 312.5 Model Runs ............................................................................................................................... 32
2.5.1 General............................................................................................................................... 322.5.2 Assumptions ...................................................................................................................... 322.5.3 Limitations of the TEMSIM Model................................................................................... 33
2.6 Hydrological Analyses .............................................................................................................. 342.6.1 Hydrological Changes of Ecological Significance ............................................................ 342.6.2 Data Analyses and Presentation for Lakes ........................................................................ 352.6.3 Data Analyses and Presentation for Power Stations.......................................................... 352.6.4 Method and Statistical Analyses for Assessment of Downstream River Reaches ............ 35
2.7 Assessment of Environmental and Social Issues....................................................................... 362.8 Limitations and Constraints in Study Methodology.................................................................. 36
Appendix 1: Scoping Report February 2000Environmental Services Department, Hydro Consulting
Basslink Integrated Impact Assessment Statement 4Potential Effects of Changes to Hydro Power Generation
3.1 Performance of the model.......................................................................................................... 373.2 Gordon Catchment..................................................................................................................... 38
3.2.1 Lake Gordon ...................................................................................................................... 383.2.2 Gordon River ..................................................................................................................... 40
3.3 Great Lake / South Esk Catchment............................................................................................ 483.3.1 Arthurs Lake, Woods Lake, Lake Augusta........................................................................ 483.3.2 Great Lake ......................................................................................................................... 483.3.3 Lake Trevallyn................................................................................................................... 503.3.4 Poatina Power Station Discharges ..................................................................................... 513.3.5 Trevallyn Power Station .................................................................................................... 59
3.4 West Coast Catchments ............................................................................................................. 593.4.1 Lake Burbury..................................................................................................................... 593.4.2 King River ......................................................................................................................... 613.4.3 Pieman-Anthony Scheme Lakes........................................................................................ 643.4.4 Reece Power Station Discharges ....................................................................................... 69
3.5 Derwent Catchment ................................................................................................................... 723.5.1 Storages ............................................................................................................................. 723.5.2 Meadowbank Power Station Discharges ........................................................................... 73
3.6 Mersey-Forth Catchment ........................................................................................................... 733.6.1 Storages ............................................................................................................................. 743.6.2 Downstream Discharges for the Mersey-Forth.................................................................. 78
4.1 Overview ................................................................................................................................... 804.2 Downstream Gordon Power Station .......................................................................................... 80
4.2.1 Introduction ....................................................................................................................... 804.2.2 Geomorphology ................................................................................................................. 824.2.3 Instream Ecological Health................................................................................................ 834.2.4 Meromictic Lakes .............................................................................................................. 844.2.5 Water Quality .................................................................................................................... 854.2.6 Public Use.......................................................................................................................... 854.2.7 Summary of Gordon River Environmental and Social Investigations............................... 86
4.3 Downstream Poatina Power Station .......................................................................................... 864.3.1 Introduction ....................................................................................................................... 864.3.2 Geomorphology ................................................................................................................. 864.3.3 Instream Ecological Health................................................................................................ 894.3.4 Water Quality .................................................................................................................... 894.3.5 Public Use.......................................................................................................................... 904.3.6 Summary of Downstream Poatina Environmental and Social Investigations ................... 91
4.4 Downstream John Butters Power Station .................................................................................. 924.4.1 Introduction ....................................................................................................................... 924.4.2 King River ......................................................................................................................... 944.4.3 Macquarie Harbour Water Quality .................................................................................... 954.4.4 Summary of Downstream John Butters Environmental and Social Investigations ........... 96
4.5 Summary of Aquatic Environmental and Social Investigations Associated with Basslink....... 965 PROPOSED STUDIES ................................................................................................................. 97
5.1 Overview ................................................................................................................................... 975.2 Gordon River Basslink Environmental Investigations .............................................................. 99
5.2.1 Gordon River Geomorphology Study................................................................................ 995.2.2 Gordon River Instream Ecological Health Study ............................................................ 1005.2.3 Gordon River Meromictic Lake Study ............................................................................ 1015.2.4 Gordon River Water Quality Study ................................................................................. 1015.2.5 Gordon River Cultural Heritage Study ............................................................................ 102
Appendix 1: Scoping Report February 2000Environmental Services Department, Hydro Consulting
Basslink Integrated Impact Assessment Statement 5Potential Effects of Changes to Hydro Power Generation
5.3.2 Downstream Poatina Instream Ecological Health and Fishery Study ............................. 1045.3.3 Downstream Poatina Water Quality Study...................................................................... 1045.3.4 Downstream Poatina Cultural Heritage Study................................................................. 1055.3.5 Downstream Poatina Public Use Study ........................................................................... 106
5.4 Downstream John Butters Basslink Environmental Investigations......................................... 1075.4.1 King River Geomorphology Study.................................................................................. 1075.4.2 King River Water Quality Study ..................................................................................... 1075.4.3 King River Instream Ecological Health Study ................................................................ 1085.4.4 King River Tourism Study............................................................................................... 1085.4.5 Macquarie Harbour Water Quality Study........................................................................ 109
Appendix 1: Scoping Report February 2000Environmental Services Department, Hydro Consulting
Basslink Integrated Impact Assessment Statement 6Potential Effects of Changes to Hydro Power Generation
FIGURES
Figure 1.1 – Location map of Hydro Storages and Power Stations..................................................18Figure 1.2 – Representative Load Curve ..........................................................................................22Figure 2.1 – Study Methodology......................................................................................................25Figure 2.2 – Overview of TEMSIM Operation ................................................................................26Figure 2.3 – Long term storages price curve. PLT is Price Long-term ...........................................27Figure 2.4 – An example of an intermediate storages/downstream cascade systems price curve....28Figure 2.5 – Typical Efficiency Curve for a Single Turbine (denoted A)........................................31Figure 2.6 – Typical Efficiency Curve Shape for Multiple Turbines (denoted A, B and C)............31Figure 3.1 – Lake level time-series plot for Lake Gordon. The time period shown (1976 to 1998)
represents the time since the filling of the impoundment after dam closure in 1974. The top andbottom lines indicate FSL and NMOL for the storage.............................................................39
Figure 3.2 – Average monthly lake levels for Lake Gordon based on the 65 year modelling period. Thehistorical averages for the period 1979 - 1998 are shown for comparison. The top and bottomlines indicate FSL and NMOL for the storage.........................................................................39
Figure 3.3 – Natural (pre-dam) flow time-series for the Gordon River at the Gordon dam site. .....41Figure 3.4 – Discharge time-series plots for Gordon Power Station during a wet year (1994) for
historical operations (top), OMW, 300MW, 450MW and 600MW TEMSIM scenarios. .......42Figure 3.5 - Discharge time-series plots for Gordon Power Station during a dry year (1982) for
historical operations (top), OMW, 300MW, 450MW and 600MW TEMSIM scenarios. .......43Figure 3.6 – Monthly median flows for Gordon Power Station. Monthly medians of zero indicate that
the power station is operating less than 50% of the time during that month and does not necessarydesignate a total shutdown over that period.............................................................................44
Figure 3.7a – Shutdown (zero flow) event duration analysis for the Gordon River. Bars representaverage number of shutdown days per year for each duration category..................................45
Figure 3.7b – Event (above zero flow) duration frequency analysis for Gordon Power Station. Barsrepresent average number of shutdown days per year for each duration category. .................46
Figure 3.8 – Comparison of hydrographs for the Gordon Power Station tailrace and the Warners(Jones) Landing gauge site showing minimal influence of the power station on river levels in thetidal sections of the river..........................................................................................................47
Figure 3.9 - Lake level time-series plot for Great Lake. The time period shown in this figure (1976 -1998) represents the operation of this lake since the commissioning of the Poatina Power Stationand therefore gives the most valid comparison to recent historical operation. The top and bottomlines indicate FSL and NMOL for the storage.........................................................................49
Figure 3.10 – Lake level duration plot for Great Lake. The historical averages for the period 1978 -1998 are shown for comparison. The top and bottom lines indicate FSL and NMOL for thestorage......................................................................................................................................49
Figure 3.11 – Average monthly lake levels for Great Lake based on the 65 year modelling period. Thehistorical averages for the period 1924-98 (all operations) and 1978-98 (recent operations) areshown for comparison. The top and bottom lines indicate FSL and NMOL for the storage. ..50
Figure 3.12 - Lake level time-series plot for Lake Trevallyn. The time period shown in this figure(1955 - 1998) represents the operation of this lake since the commissioning of the TrevallynPower Station. The top and bottom lines indicate FSL and NMOL for the storage, and the middleline indicates the minimum level to be met by the lake level agreement. ...............................51
Figure 3.13 – Discharge time-series plots for Poatina Power Station during a wet year (1994) forhistorical operations (top), OMW, 300MW, 450MW and 600MW TEMSIM scenarios. .......52
Figure 3.14 – Discharge time-series plots for Poatina Power Station during a dry year (1982) forhistorical operations (top), OMW, 300MW, 450MW and 600MW TEMSIM scenarios. .......53
Figure 3.15 – Shutdown (zero flow) event duration analysis for Poatina Power Station. Bars representaverage number of shutdown days per year for each duration category..................................54
Figure 3.16 – Event (above 2 cumecs) duration frequency analysis for Poatina Power Station. Barsrepresent average number of shutdown days per year for each duration category. .................55
Appendix 1: Scoping Report February 2000Environmental Services Department, Hydro Consulting
Basslink Integrated Impact Assessment Statement 7Potential Effects of Changes to Hydro Power Generation
Figure 3.17 – Median monthly flows from the Poatina Power Station. Monthly medians of zeroindicate that the power station is operating less than 50% of the time during that month and doesnot necessary designate a total shutdown over that period. .....................................................56
Figure 3.18 – Event (above 50 cumecs) duration frequency analysis for OMW, 300MW, 450MW and600MW TEMSIM scenarios below the junction of Brumbys Creek and the Macquarie River.This level corresponds to the level at which a minor flood alert is given for this region of theriver..........................................................................................................................................57
Figure 3.19 – Event (above 320 cumecs) duration frequency analysis for OMW, 300MW, 450MW and600MW TEMSIM scenarios below the junction of the Macquarie and South Esk rivers. Thislevel corresponds to the level at which a minor flood alert is given for this region of the river.58
Figure 3.20 - Lake level time-series plot for Lake Burbury. The short period of record is due to therecent construction of this reservoir. The top and bottom lines indicate FSL and NMOL for thestorage......................................................................................................................................60
Figure 3.21 – Lake level duration plot for Lake Burbury. The historical averages for the period 1992-1998 are shown for comparison. The top and bottom lines indicate FSL and NMOL for thestorage......................................................................................................................................60
Figure 3.22 – Average monthly lake levels for Lake Burbury based on the 65 year modelling period.The historical averages for the period 1992-1998 are shown for comparison. The top and bottomlines indicate FSL and NMOL for the storage.........................................................................61
Figure 3.23 – Discharge time-series plots for John Butters Power Station during a wet year (1994) forhistorical operations (top), OMW, 300MW, 450MW and 600MW TEMSIM scenarios. .......62
Figure 3.24 – Discharge time-series plots for John Butters Power Station during a dry year (1995) forhistorical operations (top), OMW, 300MW, 450MW and 600MW TEMSIM scenarios. .......63
Figure 3.25 – Median monthly flows from the John Butters Power Station. Monthly medians of zeroindicate that the power station is operating less than 50% of the time during that month and doesnot necessary designate a total shutdown over that period. .....................................................64
Figure 3.26 - Lake level time-series plot for Lake Plimsoll. The short period of record is due to therecent construction of this lake. The top and bottom lines indicate FSL and NMOL for thestorage......................................................................................................................................64
Figure 3.27 - Lake level time-series plot for Lake Mackintosh. The time period shown in this figure(1971 - 1998) represents the operation of this lake since it was built. The top and bottom linesindicate FSL and NMOL for the storage. ................................................................................65
Figure 3.28 – Lake level duration plot for Lake Mackintosh. The historical averages for the period1982 - 1998 are shown for comparison. The top and bottom lines indicate FSL and NMOL forthe storage. ...............................................................................................................................65
Figure 3.29 – Average monthly lake levels for Lake Mackintosh. The historical averages for theperiod 1982 - 1998 are shown for comparison. The top and bottom lines indicate FSL and NMOLfor the storage. .........................................................................................................................66
Figure 3.30 - Lake level time-series plot for Lake Pieman. The time period shown in this figure (1986 -1998) represents the operation of this lake since it was built. The top and bottom lines indicateFSL and NMOL for the storage. ..............................................................................................66
Figure 3.31 – Discharge time-series plots for Reece Power Station during a wet year (1994) forhistorical operations (top), OMW, 300MW, 450MW and 600MW TEMSIM scenarios. .......67
Figure 3.32 – Discharge time-series plots for Reece Power Station during a dry year (1995) forhistorical operations (top), OMW, 300MW, 450MW and 600MW TEMSIM scenarios. .......68
Figure 3.33 – Median monthly flows from the Reece Power Station. Monthly medians of zero indicatethat the power station is operating less than 50% of the time during that month and does notnecessary designate a total shutdown over that period. ...........................................................69
Figure 3.34 – Shutdown (zero flow) event duration analysis for Reece Power Station. Bars representaverage number of shutdown days per year for each duration category..................................70
Figure 3.35 – Event (above 0 cumecs) duration frequency analysis for Reece Power Station. Barsrepresent average number of shutdown days per year for each duration category. .................71
Figure 3.36: Lake level time-series plot for Lake King William. The time period shown in this figure(1968 - 1998) represents the operation of this lake since it was built. The top and bottom linesindicate FSL and NMOL for the storage. ................................................................................72
Appendix 1: Scoping Report February 2000Environmental Services Department, Hydro Consulting
Basslink Integrated Impact Assessment Statement 8Potential Effects of Changes to Hydro Power Generation
Figure 3.37 - Lake level time-series plot for Lake Echo. The time period shown in this figure (1951 -1998) represents the operation of this lake since it was built. The top and bottom lines indicateFSL and NMOL for the storage. ..............................................................................................73
Figure 3.38 - Lake level time-series plot for Lake Rowallan. The time period shown in this figure(1967 - 1998) represents the operation of this lake since it was built. The top and bottom linesindicate FSL and NMOL for the storage. ................................................................................74
Figure 3.39 – Lake level duration plot for Lake Rowallan. The historical averages for the period 1967 -1998 are shown for comparison. The top and bottom lines indicate FSL and NMOL for thestorage......................................................................................................................................75
Figure 3.40 – Average monthly lake levels for Lake Rowallan. The top and bottom lines indicate FSLand NMOL for the storage.......................................................................................................75
Figure 3.41 - Lake level time-series plot for Lake Gairdner. The time period shown in this figure (1970- 1998) represents the operation of this lake since it was built. Top and bottom lines indicate FSLand NMOL...............................................................................................................................76
Figure 3.42 – Lake level duration plot for Lake Gairdner. The historical averages for the period 1971 -1998 are shown for comparison. The top and bottom lines indicate FSL and NMOL for thestorage......................................................................................................................................76
Figure 3.43 - Lake level time-series plot for Lake Barrington. The time period shown in this figure(1969 - 1998) represents the operation of this lake since it was built. The top and bottom linesindicate FSL and NMOL for the storage. ................................................................................77
Figure 3.44 – Lake level duration plot for Lake Barrington. The historical averages for the period1971-1998 are shown for comparison. The top and bottom lines indicate FSL and NMOL for thestorage......................................................................................................................................77
Figure 3.45 – Average monthly lake levels for Lake Barrington based on the 65 year modellingperiod. The historical averages for the period 1971-1998 are shown for comparison. The top andbottom lines indicate FSL and NMOL for the storage.............................................................78
Figure 4.1 – Downstream of Gordon Power Station ........................................................................80Figure 4.2 – Downstream of Poatina Power Station.........................................................................88Figure 4.3 – Downstream of John Butters Power Station ................................................................92
TABLES
Table 1.1 – Categories of Hydro Storages........................................................................................20Table 2.1: Classification of available generation.........................................................................28Table 2.2 – Current Operational Constraints on the Hydro System .................................................33Table 2.3 –Lake Level Data .............................................................................................................35Table 2.4 –Power Station Discharge Data........................................................................................35Table 5.1 – Summary of Recommended Studies..............................................................................98
Appendix 1: Scoping Report February 2000Environmental Services Department, Hydro Consulting
Basslink Integrated Impact Assessment Statement 9Potential Effects of Changes to Hydro Power Generation
GLOSSARY AND LIST OF ACRONYMS
The following is a list of terms and acronyms used in this report.
Term Definition
Active Storage Storage volume situated above the normal minimum operating level ofa lake, drawn from to generate power.
ASL Altitude above Sea Level
BDB Basslink Development Board
EOL Economic Operating Level - The monthly or seasonal level abovewhich the reservoir should be maintained to maximise energypotential.
Efficient Load Power station energy generation at maximum efficiency
Following Stations Generally run-of-river stations, downstream stations which operate atsame time as immediately upstream stations, utilising water dischargedfrom the immediately upstream station.
Full Gate Maximum power generation from a given power station
FSL Full Supply Level - The maximum level at which water can be storedindefinitely, equal to the crest level of the spillway.
Head Storage Usually a medium-sized storage, situated at the top of ‘run-of-river’systems defined below.
JAP Joint Advisory Panel
LLA Lake level agreement
LTMC Long-Term Marginal Cost
Major Storage Largest storages with inter-annual variation in major storage capacity;ie Lake Gordon, Great Lake
Medium-Sized Storage Large storages with inter-seasonal variation in major storage capacity;e.g. Lakes Burbury and Rowallan.
MOL Minimum Operating Level - Minimum level at which power can begenerated.
NEM National Electricity Market
NMOL Normal Minimum Operating Level - The lowest level of storage atwhich all the machines in the power station can be simultaneously andcontinuously operated at full gate opening.
PEV Protected Environmental Value
PS Power Station
RPDC Resource Planning and Development Commission
Run-of-River Storage Small storages with limited variation in level, usually in a sequence,and responding largely to inflows (river flows and rainfall); e.g. inDerwent, Pieman and Forth systems
Appendix 1: Scoping Report February 2000Environmental Services Department, Hydro Consulting
Basslink Integrated Impact Assessment Statement 10Potential Effects of Changes to Hydro Power Generation
SMP System Marginal Price
SYSOP The current Hydro operating system simulation model
TEIS Total Energy in Storage
TEMSIM Tasmanian Electricity Market Simulation model
VoLL Value of Lost Load
WMP Water Management Plan
WQG Water Quality Guideline
WQO Water Quality Objective
Appendix 1: Scoping Report February 2000Environmental Services Department, Hydro Consulting
Basslink Integrated Impact Assessment Statement 11Potential Effects of Changes to Hydro Power Generation
1 INTRODUCTION1.1 This Document
1.1.1 Objectives and Content
The objectives of this report are:
• to give an approximation of likely operational changes from the existing generating regime of theTasmanian Hydro System under a number of Basslink scenarios;
• to identify any significant potential environmental or social issues resulting from these changes;and
• to outline scopes of work to further examine these identified issues.
This report details how the current Hydro system is operated in Tasmania, describes the model used topredict possible changes under Basslink, presents the modelling results, highlights possibleenvironmental and social issues arising from changes in operations, and gives general scopes for theHydro’s works program to address these issues.
A fundamental approach of this study was the utilisation of a Tasmanian Hydro Energy Systemsimulation model (TEMSIM). Outputs from this model allowed a comparative evaluation of a varietyof scenarios with different Basslink cable sizes (300, 450 and 600 MW), and a Tasmanian competitiveelectricity market without the Basslink cable (0 MW). The TEMSIM model was used to identifyhydrological (lake level and river flow) changes associated with Basslink and allowed comparisonwith historical system operations.
1.1.2 Structure
The document is structured as follows:
Section 1 Gives relevant background information including the legislative framework for theBasslink project as it relates to the Hydro-Electric Corporation, and the way in whichthe Hydro system is used to meet current electricity demand. Provides backgroundinformation on the Hydro’s current environmental programs.
Section 2 Describes the TEMSIM model and how it works. The model inputs, outputs and thescenarios modelled are described, and limitations and constraints to the study arisingfrom the methodology followed are outlined.
Section 3 Presents the results of the model runs for the differing Basslink scenarios and dataanalyses. Data is presented by Hydro catchment, detailing effects on lakes and thendownstream discharge. Explanation of the results and their limitations is provided inthis section.
Section 4 Discusses the environmental and social issues, which arise from the results aspresented in Section 3.
Section 5 Defines in detail environmental studies to investigate the environmental and socialissues associated with the Basslink cable, which were identified in Chapter 4.
Appendix 1: Scoping Report February 2000Environmental Services Department, Hydro Consulting
Basslink Integrated Impact Assessment Statement 12Potential Effects of Changes to Hydro Power Generation
1.2 Background
1.2.1 Context
Basslink is the planned undersea power cable across Bass Strait that will link Tasmania’s electricitygrid with Australia's national electricity grid. Basslink will allow Tasmania to export its hydro-electricity into the National Electricity Market (NEM) to obtain high returns at peak times, andbalance its electricity needs by importing lower cost electricity produced by Victoria, NSW and otherstates in the NEM during offpeak times.
The Basslink development includes:
• a high voltage direct current undersea cable across Bass Strait (approximately 250 kilometres);
• AC/DC converter stations in Tasmania and Victoria;
• DC connecting lines from the converter stations; and
• AC transmission connections to the Tasmanian and Victorian transmission networks.
To facilitate the development of Basslink, the Tasmanian government has appointed a BasslinkDevelopment Board (BDB). The BDB has received expressions of interest in the construction ofBasslink from three private consortia. The successful consortium will be announced in early February2000.
The Tasmanian government has also announced that the Basslink project is a Project of StateSignificance. It will be subject to a combined environmental assessment and development approvalsprocess to satisfy statutory requirements under current Tasmanian, Victorian, and Commonwealth law.A Joint Advisory Panel (JAP), consisting of Tasmania’s Resource Planning and DevelopmentCommission and Victorian and Commonwealth representatives, will be appointed to carry out thisprocess. The JAP will prepare a draft integrated assessment report, hold hearings into submissions onthe report, and finalise the report. This assessment process is scheduled for April to September 2000.
The integrated assessment is to address the environmental, social, economic, and community impactsof Basslink. Preliminary studies on baseline conditions associated with the potential route corridorsfor Basslink have been commissioned by the BDB. When the successful proponent is announced inFebruary 2000, they will be responsible for the continuation of those studies.
1.2.2 Assessment Requirements for Tasmanian Rivers
The management of Tasmanian waterways for electricity generation is the responsibility of the Hydro-Electric Corporation. Basslink will create a changed market for electricity and, as a consequence,changes will occur to the lake levels and downstream flows in the Hydro-Electric Corporation’ssystem as managed by the Hydro.
The Ministerial direction to the Resource Planning and Development Commission (RPDC) on theBasslink assessment process includes a requirement to consider:
a) the likely environmental impacts upon rivers, hydro-electric storages and other inland waters ofany changes to the operation of Tasmania’s hydro-electric electricity generation system that mayarise from connection to the National Electricity Market, in particular from managing that systemto meet power demand variations on the Australian mainland;
b) any likely environmental impacts upon the natural heritage or cultural heritage values of theTasmanian Wilderness World Heritage Area, as identified in the nomination of that area for
Appendix 1: Scoping Report February 2000Environmental Services Department, Hydro Consulting
Basslink Integrated Impact Assessment Statement 13Potential Effects of Changes to Hydro Power Generation
inclusion on the World Heritage List under the Convention for the Protection of the WorldCultural and Natural Heritage;
c) any social, economic and community impacts flowing from the environmental impacts to whichclauses (a) and (b) refer; and
d) means proposed for managing any impacts identified under clauses (a), (b), and (c).
Further, in considering the issues to which the above refers, the RPDC is to liaise with the Departmentof Primary Industries, Water and the Environment in relation to requirements under the State’s watermanagement and environment protection legislation.
The above directive recognises that current water and environmental legislation is designed to protectthe important environmental, social and economic values of Tasmania’s waterways. This legislativeframework includes:
• The Water Management Act 1999;
• The State Policy on Water Quality Management 1997; and
• The Environmental Management and Pollution Control Act 1994.
This regulatory framework should ensure that the Hydro-Electric Corporation operates its waterwaysin a manner that does not have unacceptable environmental, economic or social impacts.
To assist in meeting these obligations the Hydro-Electric Corporation is conducting its ownassessment of potential impacts on its lakes and waterways as a result of the Basslink project. Thisdocument is part of that assessment.
The remainder of this chapter provides background information useful for understanding the currentstatus of environmental issues in Hydro waterways. Subsequent sections include the relevantlegislative framework (Section 1.3), the Hydro’s Aquatic Environment Program (Section 1.4), and thecurrent operating system for hydro-electric power generation (Section 1.5).
1.3 Legislative Framework
1.3.1 Water Management Act 1999
The Tasmanian Parliament recently passed the Water Management Act 1999. This Act is expected tobe proclaimed in January / February 2000. It will bring the Hydro-Electric Corporation under a newregulatory framework. The objectives of the Act are to further the objectives of the ResourceManagement and Planning System of Tasmania. They specify the need to:
• promote sustainable use and facilitate economic development of water resources;
• recognise and foster the significant social and economic benefits resulting from the sustainable useand development of water resources for the generation of hydro-electricity and for the supply ofwater for human consumption and commercial activities dependant on water;
• maintain ecological processes and genetic diversity for aquatic ecosystems;
• provide for the fair, orderly and efficient allocation of water resources to meet the communitiesneeds;
• increase the communities understanding of aquatic ecosystems and the need to use and managewater in a sustainable and cost efficient manner; and
• encourage community involvement in water resource management.
Appendix 1: Scoping Report February 2000Environmental Services Department, Hydro Consulting
Basslink Integrated Impact Assessment Statement 14Potential Effects of Changes to Hydro Power Generation
The Act gives high priority to the needs of ecosystems (Section 94).
1.3.1.1 Hydro Special Licence
The Hydro-Electric Corporation is granted a Special Licence under “Schedule 4 Savings andTransitional Provisions” of the Water Management Act 1999.
The draft terms and conditions of the Hydro’s Special Licence spell out its requirements to implementenvironmental provisions of a Water Management Plan.
1.3.1.2 Water Management Plans
The Water Management Act 1999 allows for the development of Water Management Plans for:
(a) a watercourse or several joined watercourses or part of a watercourse; or
(b) a lake; or
(c) a groundwater area; or
(d) any combination of paragraphs (a), (b) and (c), whether the water resources are joinednaturally or artificially –
and may include surface water that normally flows into or replenishes the water resource or waterresources in the plan (Clause 14(1), Division 1, Part 4, Water Management Act 1999).
Clause 14(2) of the Act prescribes that the scope of a WMP is to include:
a) an assessment of the quantity of water needed by the ecosystems that depend on a waterresource and the times at which, or the periods during which, those ecosystems will need thatwater; and
b) an assessment of likely detrimental effects, arising from the taking or use of water from theresource, on the quantity of water that is available to meet the needs of the ecosystems thatdepend on the resource; and
c) an assessment of likely detrimental effects of the plan on the quality of the water.
The Hydro is committed to working with the Department of Primary Industries, Water andEnvironment in the development and implementation of Water Management Plans for the catchmentsin which it operates. This process is already underway in the Great Lake / South Esk Catchment.
1.3.2 State Policy on Water Quality Management 1997
The principal purpose of this Policy is to maintain or enhance Tasmania’s groundwater resources andsurface waters while allowing for sustainable development, as set out in the objectives of theTasmanian Resource Management and Planning System (Clause 5.1, State Policy on Water QualityManagement 1997).
1.3.2.1 Protected Environmental Values
The first step in implementing the Policy is to set Protected Environmental Values (PEVs) for waterquality. The PEVs will be used by Department of Primary Industries, Water and Environment(DPIWE) to set Water Quality Guidelines (WQGs) and Water Quality Objectives (WQOs).
Appendix 1: Scoping Report February 2000Environmental Services Department, Hydro Consulting
Basslink Integrated Impact Assessment Statement 15Potential Effects of Changes to Hydro Power Generation
Protected Environmental Values (PEVs) are values or uses of the environment for which it has beendetermined that a given area of the environment should be protected. Water quality objectives thatunderpin these values may be set for surface waters and ground waters in Tasmania by determiningwhich of the following protected environmental values should apply to each body of water:
• Protection of Aquatic Ecosystems (eg. pristine or modified);
• Recreational Water Quality and Aesthetics;
• Raw Water for Drinking Water Supply;
• Agricultural Water Uses; and
• Industrial Water Supply.
PEVs will be set by DPIWE in consultation with the community.
1.3.2.2 Water Quality Guidelines and Water Quality Objectives
Once PEVs are set, Water Quality Guidelines (WQGs) will be determined for each value. WQGs areestimates of indicator levels that need to be met in order to protect an environmental value. Guidelineswill be determined by DPIWE on a case by case basis using site specific information whereappropriate. Alternatively, the Australian Water Quality Guidelines and any other appropriateinformation can be used.
The most stringent water quality guidelines for a specific body of water are known as Water QualityObjectives. These objectives offer a range of pollutant limits and are designed to ensure that the waterquality of a nominated body of water is maintained at a level to achieve all of the PEVs developed forthat body of water. Implementation of WQOs is through planning authorities with jurisdiction overthese water bodies, and where relevant, the water management authorities with jurisdiction over waterbodies.
1.4 The Hydro’s Aquatic Environment Program
In recent years, the Hydro has put significant efforts into developing and implementing its AquaticEnvironment Program. The aims of the Hydro’s aquatic environmental management program are tomanage its resources in an environmentally sustainable manner, be more aware of community viewsand values and be more responsive to community concerns. The Hydro recognises that it is a majorwater manager in Tasmania as well as a generator of electricity, and needs to manage resources in anecologically sound way. This will ensure future generations can enjoy the benefits of both a healthyenvironment and a clean, renewable source of energy.
1.4.1 Environmental and Aquatic Policies
To meet the objectives of this program, the Hydro developed an Environmental Policy in 1992, and anAquatic Environmental Policy in 1998 (see Attachment 1). The Aquatic Environmental Policydescribes the Hydro’s position regarding environmental management of its waterways in six key areas.These areas are: sustainable development, responsible environmental management, compliance withenvironmental policy and legislation, water management decisions, reviews of performance, andenvironmental expertise and availability. The Aquatic Environment Program is aimed at ensuringcompliance with Hydro environmental policies, and is also responding to the recent regulatory waterreforms as mentioned in previous sections.
Appendix 1: Scoping Report February 2000Environmental Services Department, Hydro Consulting
Basslink Integrated Impact Assessment Statement 16Potential Effects of Changes to Hydro Power Generation
1.4.2 Water Management Reviews
The Hydro has commenced a process of review of its water management practices across the State, ona catchment-by-catchment basis. The aim of this review is ensure that the Hydro is managing itsresources in an environmentally and economically sustainable manner. The review process involvesgathering background information, consulting the community and stakeholders, researching options toaddress any outstanding water management issues, analysing the results and then proposing options toaddress the issues.
The Hydro’s water management reviews are being conducted alongside and with the full endorsementof the Department of Primary Industries, Water and Environment. DPIWE will take the outcomes ofthe Hydro’s water management reviews one step further, and develop Water Management Plans forthese catchments under the Water Management Act 1999. The first of the Hydro water managementreviews is presently underway in the Great Lake / South Esk catchment.
In support of this process, the Hydro is producing review documents on Hydro aquatic environmentalissues for each of its six major catchment areas. The first of these, for the Great Lake and South Eskcatchment area, has just been finalised.
1.4.3 Waterway Health Monitoring
The waterway health component of the Aquatic Environment Program aims to assess the health oflakes and rivers influenced by Hydro activities. The Hydro, in conjunction with the Inland FisheriesCommission, conducts regular monitoring of water quality, biological and physical conditionassessments in its lakes and rivers, along with more detailed monitoring of some problem waterbodies.This ensures the Hydro can respond appropriately to aquatic issues. In addition, for the past 10 yearsthe Hydro has been part of a program to monitor the water quality of the Pieman catchment,particularly in regard to heavy metals. This program has support from the Hydro, members of theMining Industry, and the Tasmanian Government.
An example of more detailed monitoring is a project to improve water quality in the Lagoon ofIslands, an ecologically significant water body. Problems with increased turbidity and nutrient levelsin Lagoon of Islands have resulted in poor water quality and increased algal blooms. The Hydro has aprogram of research, monitoring, consultation and action to address these problems. Through thisprogram, an improvement in the environmental conditions within the lagoon has been achieved.
1.4.4 Biological Studies
The Aquatic Environment Program contains a detailed fish migration project which is documentingthe dispersal and migratory needs of native species. This project involves an in-depth analysis ofexisting Hydro structures and natural barriers to fish migration, as well as the biology and ecology ofTasmania's native fish fauna. The Hydro is investigating fish passage structures suitable for nativespecies that are likely to be effective in Tasmanian dams. The design and installation of Australia'sfirst elver ladder at Trevallyn late in 1996 was an early initiative of this program. By allowing elversto migrate upstream, the sustainability of the commercial Tasmanian eel fishery is enhanced and theecological balance of upstream areas is maintained. The Hydro is currently implementing amonitoring program to assess the effectiveness of the ladder.
Similarly, threatened species are given a high priority in Hydro studies. Distributions of these speciesare analysed in conjunction with risk analyses and evaluation of threat sources using GIS software.The Hydro has made a strategic review of threatened species found within its catchments as a first steptowards sustainable management of this issue.
Appendix 1: Scoping Report February 2000Environmental Services Department, Hydro Consulting
Basslink Integrated Impact Assessment Statement 17Potential Effects of Changes to Hydro Power Generation
The Hydro has been a major contributor to a recovery plan for several Tasmanian native fish species:the Pedder galaxias, swamp galaxias and saddled galaxias. For example, the Hydro has modified itsoperation of Woods Lake to improve the environment for the saddled galaxias. It has also modifiedthe Strathgordon water supply dam to create a secure predator-free environment for Pedder galaxias.In conjunction with a translocation program to nearby Lake Oberon, this habitat will form animportant component of the recovery plan for this species.
The primary threat to the continued survival of many native species is predation by introduced exoticfish. The Hydro is actively involved in reducing opportunities for these fish to colonise new areasthrough active water level management, installing barriers and being involved in public educationcampaigns. Lake Pedder is now kept at least one metre higher than Lake Gordon to ensure a watervelocity barrier prevents Redfin perch colonising Lake Pedder and threatening swamp galaxias andany Pedder galaxias which may remain. Fish barriers have been installed at Penstock Lagoon andLiaweenee Canal to control movement of exotic fish. Ongoing monitoring of exotic fish distributionsis conducted in key areas of the Hydro’s waterway network.
1.4.5 Water for the Environment
Managing water for environmental objectives is an important priority for the Hydro. For example, ithas recently completed the following projects:
• the Mersey River Flow and Catchment Assessment, which culminated in the Hydro releasing aminimum flow down the Mersey River out of Parangana Dam;
• a study of the Ouse River and its tributaries following excessive algal and macrophyte growth inthe river; and
• major studies into impacts on the instream biota downstream of hydro-electric power stations.
The Mersey River project commenced in 1996, following concerns about flows in the Mersey Riverbelow the Parangana Dam. The Hydro, a number of government agencies and the local communityinvestigated the environmental health of the river and its tributaries. This study utilised a habitat-based technique to determine an appropriate environmental flow. A key step in the process was torequire environmental monitoring to be carried out prior to and following flow trials. This was toallow the environmental benefits of any release from Parangana Dam to be scientifically evaluated andensure that any flow releases remain economically, socially and environmentally justifiable in the longterm. The Hydro has now implemented the recommendations of the study at an approximate cost of$700,000 per annum. Furthermore, a release valve at Parangana Dam has been automated at a cost of$100,000 to ensure a minimum flow of two cumecs in the middle Mersey River at Liena. The Hydro isalso funding the ongoing biological monitoring of the flow release.
1.4.6 Lake Level Agreements
The Hydro has voluntarily made agreements to manage water levels in several Tasmanian lakes toachieve environmental objectives. This has been done in consultation with various governmentagencies, particularly the Inland Fisheries Commission, and members of the community. The lakeswhere agreements are in place include Little Pine Lagoon, Shannon Lagoon, Bronte Lagoon, PenstockLagoon, Lagoon of Islands, Arthurs Lake and Woods Lake. The aim of these agreements is toimprove water quality, increase habitat for aquatic biota including vulnerable native fish species, andimprove fishing conditions and other recreational activities. Lake St. Clair has a lake level agreementto minimise the extent of erosion around its shoreline. This has been negotiated with the Parks andWildlife Service and is included in the Tasmanian Wilderness World Heritage Area Management Plan.
Appendix 1: Scoping Report February 2000Environmental Services Department, Hydro Consulting
Basslink Integrated Impact Assessment Statement 18Potential Effects of Changes to Hydro Power Generation
1.5 Current Operating System
The Hydro generating system consists of a network of 51 dams and 27 hydro-electric power stations.In addition, a thermal power station is located at Bell Bay and can be utilised to supplement generationif there is a projected short-fall in system security. An overview of the Hydro’s storages andinfrastructure is shown in Figure 1.1. The objectives of the current operating system are twofold:
1. to operate a secure power system in order to meet customer requirements in terms of energy andquality of supply; and
2. to operate the integrated hydro power system efficiently while satisfying hydrological, electrical,social and environmental constraints.
Appendix 1: Scoping Report February 2000Environmental Services Department, Hydro Consulting
Basslink Integrated Impact Assessment Statement 19Potential Effects of Changes to Hydro Power Generation
Figure 1.1 – Location map of Hydro Storages and Power Stations
Appendix 1: Scoping Report February 2000Environmental Services Department, Hydro Consulting
Basslink Integrated Impact Assessment Statement 20Potential Effects of Changes to Hydro Power Generation
To meet these objectives, the Hydro has developed and uses a system planning regime. The operatingsystem is planned for:
• the long term (2 – 10 years);
• the medium term (1 week – 2 years);
• the short term and scheduling (1/2 hour to 1 week); and
• real–time operation and modifications to plans (immediate to next ½ hour).
In planning the operation of the system, various constraints apply, including safety, electrical andhydraulic, maintenance, irrigation, environmental, commercial and recreational considerations. Thefollowing sections outline how the system is currently operated in relation to storages and powerstations.
1.5.1 Storages
The Hydro’s storages can be categorised into three sizes: major; medium; and minor. These categoriesare based on the life cycle of the storage, that is, typical time taken to fill or empty the storage undernormal weather conditions. Table 1.1 gives the categories for the Hydro’s storages.
Table 1.1 – Categories of Hydro Storages
MAJOR
(long period cycling)
MEDIUM
(annual cycling)
MINOR
(run-of-river)
Great Lake Lake Echo Lake Liapootah Lakes Pedder + Gordon Bronte Lagoon+ Bradys Lake
+ Lake Binney + Tungatinah Lagoon
Wayatinah Lagoon
Lakes St. Clair + King William Lake Catagunya Lake Rowallan Lake Repulse Lake Mackenzie Cluny Lagoon Lakes Murchison + Mackintosh Lake Meadowbank Lake Burbury Lake Trevallyn Lake Gairdner Lake Parangana Lake Plimsoll Lake Cethana
Lake Barrington Lake Paloona Lake Rosebery Lake Pieman
Where Table 1.1 has joint listings (e.g. Lakes Murchison + Mackintosh), these storages canconveniently be regarded as one for this classification purpose as one is the hydrological extension ofthe other via river, tunnel or canal. Despite this, the TEMSIM modelling used for this report assessesthese aggregated storages separately in order to quantify individual potential environmental impacts.
Most of the minor storages supply run-of-river power stations and have only limited storage.Consequently, these lakes can theoretically cycle (fill and empty) over a period of hours to days.Medium storages are usually the top lakes of a run-of-river chain and can cycle over a monthly orseasonal basis, and the two major storages cycle over a period of decades. The long-term system
Appendix 1: Scoping Report February 2000Environmental Services Department, Hydro Consulting
Basslink Integrated Impact Assessment Statement 21Potential Effects of Changes to Hydro Power Generation
supply security (security of generation supply during times of drought) at present depends on the twomajor storages.
The Bell Bay thermal Power Station is only prepared for service if there is a real risk of not meetingpower demand through the hydro-electric system. This is currently controlled by the thermal controlrule (Section 1.5.5), but the need for this will be replaced by the system security offered by a Basslinkcable.
1.5.2 Spills
Dams will fill during periods when inflows (ie. rainfall) exceed the associated power station’sdischarge. Spill of water from storages will occur when the water level exceeds the full supply level(FSL) and cannot be controlled by power station discharge. Spills are usually made via a spillwaynear the dam wall, but may occur via tunnels, canals or the opening of gates. Spills will bypass theturbines of a power station and therefore represent a loss of generation revenue. Consequently, theHydro system is managed to reduce the incidence of spills, and priority of power stations within aschedule is determined largely by the proximity of its storage to spilling.
1.5.3 Power Station Operation
Power stations are not utilised continuously. The Hydro has an installed capacity of 2262 MW(hydro-electric stations only), but currently only generates an average of 1104 MW, with a systempeak of around 1562 MW. The operational schedule for the network of Hydro power stations isdetermined by the following (in priority order):
1. Use any storage spill. This is water that would otherwise spill and therefore bypass the turbines.
2. Use pickup to run-of-river stations. These dams have limited storage and are therefore likely tospill if not utilised; and
3. Storage release. Release of water from dams is prioritised by the size of storage. Small storagesare utilised first to maximise their storage potential. Medium storages are scheduled next and areprioritised according to their immediate probability of spill. The major storages are last on thepriority list because they are unlikely to spill, and can provide the reserve energy when water isnot available within the rest of the Hydro system (for example, during summer months).
1.5.4 Load on the System
The energy demand on the Hydro system fluctuates on annual, seasonal, weekly and hourlytimeframes. To efficiently operate the system with the required level of security of supply, the load onthe system needs to be estimated (at different levels of resolution) hours, days, weeks, months andyears in advance. Forward planning is essential, as water needs to be stored and available in advanceof power demand, and needs to take into account all the constraints on the system.
The Hydro system simulation program SYSOP is currently utilised to predict and run the Hydrosystem as it currently is without a freely competitive electricity market. An alternate model called theTasmanian Electricity Market simulation model (TEMSIM) has been developed to enable betterpredictions of system usage under a competitive electricity market (see Section 2).
Figure 1.2 is provided to clarify some further terms related to load - base load, step load, deficit load,frequency, and peak power. Figure 1.2 shows a representative load curve, and how power stations areoperated to meet this load. Time (24 hours) is shown on the x-axis, and load (in MW) is shown on they-axis. ‘Peak load’ occurs in the morning and early evening, and is shown by the two peaks.
Appendix 1: Scoping Report February 2000Environmental Services Department, Hydro Consulting
Basslink Integrated Impact Assessment Statement 22Potential Effects of Changes to Hydro Power Generation
Certain power stations are scheduled to supply ‘base load’, the load that is constantly required duringthe day, shown at the bottom of the daily load curve. If there is sufficient rainfall to utilise the run-of-river storages, water will be drawn from them to generate base load. Power stations operating in basemode generate a constant load all day, and if sufficient water, keep generating that constant load thenext day as well.
Load above the base load in Figure 1.2 is divided into steps of differing magnitude at different parts ofthe day. This is known as ‘step load’. Specific power stations are turned on for set periods of the day,running at their efficient load (or full gate if the storage is close to spill). Power stations operating instep mode are generally turned on at some point in the day, generate power at a constant load for acertain number of hours (e.g. 6-18), and then turn off.
‘Deficit load’ is the additional load above step load that constitutes the remainder of the daily loadcurve. It is supplied by power stations operating in deficit or frequency mode. These power stationsvary their generation within a particular range (somewhere around their efficient load if possible) tomeet the fluctuations of the daily load curve. Discharge from these power stations is variable over veryshort time periods.
Appendix 1: Scoping Report February 2000Environmental Services Department, Hydro Consulting
Basslink Integrated Impact Assessment Statement 23Potential Effects of Changes to Hydro Power Generation
1.5.5 Thermal Control Rule
Bell Bay is the Hydro’s only thermal generator in Tasmania and is only brought into operation whenthe total system energy in storage falls below the Thermal Control Level. This level is derived toensure a desired system security with minimum expenditure on thermal generation, whilst allowing thetotal hydro energy in storage to increase sufficiently. The thermal control rule does not just describe astatic emergency level. The threshold changes continually in response to forecasted load and storagelevels.
Appendix 1: Scoping Report February 2000Environmental Services Department, Hydro Consulting
Basslink Integrated Impact Assessment Statement 24Potential Effects of Changes to Hydro Power Generation
2 MODELLING OF THE HYDRO BASSLINK OPERATINGSYSTEM
2.1 Introduction
This chapter describes the five stepped methodology used for modelling changes to Hydro’s operatingregime resulting from the introduction of the Basslink cable. The methodology used in this report issummarised in Figure 2.1. This figure shows five numbered steps that are explained as follows:
1. The basic tool for this study is the Tasmanian Electricity Market Simulation model, known asTEMSIM. TEMSIM is described in detail in Section 2.2.
2. To provide the desired outputs for this study, the TEMSIM model has a number of inputs andoutputs.
a) Inputs to TEMSIM include a finance model (PROPHET), efficiency curves and an inflowdatabase. These are described in Section 2.3.
b) Outputs from TEMSIM include lake level fluctuations and power station (PS) discharges.These are described in Section 2.4.
3. Model runs include three different Basslink cable sizes (with assumptions). These are comparedto the projected way the current system would be operated in 2003 without the Basslink cable butincludes competition within the system, and to the historical pattern of operation. These modelruns are outlined in Section 2.5, along with assumptions and limitations of the TEMSIM model.
4. Hydrological data analyses conducted on the model output data are identified in Section 2.6.
5. Environmental and social issues are identified according to the methodology described in Section2.7.
Section 2.8 details the limitations and constraints in the study methodology as a whole.
Appe
ndix
1: S
copi
ng R
epor
tFe
brua
ry 2
000
Envi
ronm
enta
l Ser
vice
s Dep
artm
ent,
Hyd
ro C
onsu
lting
Bass
link
Inte
grat
ed Im
pact
Ass
essm
ent S
tate
men
t25
Pote
ntia
l Effe
cts o
f Cha
nges
to H
ydro
Pow
er G
ener
atio
n
Figu
re 2
.1 –
Stu
dy M
etho
dolo
gy
TEM
SIM
Mod
el
Mod
el R
un S
cena
rios
Bas
e C
ase
(no
cabl
e)3
cabl
e si
zes (
300,
450
and
600
MW
)
inpu
ts
outp
uts
PRO
PHET
fina
ncia
lm
odel
, effi
cien
cycu
rves
, 75
year
s of
inflo
w re
cord
s
Pow
er st
atio
ndi
scha
rges
, lak
ele
vel f
luct
uatio
ns
Hyd
rolo
gica
l Dat
a A
naly
sis
a.
Tim
e se
ries p
lots
b.
Dur
atio
n cu
rves
c.
Even
t dur
atio
n an
d fre
quen
cy a
naly
sis
d.
Rat
e of
rise
and
fall
Pote
ntia
l Aff
ecte
d W
ater
s
Iden
tify
Pote
ntia
l Env
ironm
enta
l and
Soc
ial
Issu
es
Prop
ose
furth
er st
udie
s req
uire
d
Appendix 1: Scoping Report February 2000Environmental Services Department, Hydro Consulting
Basslink Integrated Impact Assessment Statement 26Potential Effects of Changes to Hydro Power Generation
2.2 Description of the TEMSIM model
2.2.1 Overview
TEMSIM, the Tasmanian Electricity Market Simulation model, is a detailed simulation model of theTasmanian generating system operating according to market rules within the National ElectricityMarket (NEM). A finite connection to the Victorian region (Basslink) is included in the model. Themodel sets a generating schedule based on a NEM-type dispatch process that is founded on generationoffers from participating generators.
The five major catchments of the Tasmanian hydro system are interpreted as the five virtual generatorsof TEMSIM. These virtual generators offer generation in a coordinated manner in order to achieveefficient use of Tasmanian supply resources. Basslink transfers are determined using forecasts ofSystem Marginal Price (explained in Section 2.4.1). The operation of TEMSIM consists of threestages, as outlined in Figure 2.2:
Figure 2.2 – Overview of TEMSIM Operation
At the beginning of each simulated day
1. Virtual generatorsdetermine offers ofgeneration for each ofthe following 24 hours
2. These offers are comparedwith an hourly forecast ofVictorian System marginalprice (SMP) and an assumedSMP elasticity to determine anhourly least cost dispatch of thegenerators. The dispatchprocess determines hourlyBasslink transfers
3. Dispatch instructions areforwarded to each virtualgenerator, which thendetermine their ownoperating schedule for theday. This operatingschedule is designed toefficiently meet the dispatchrequirement
STAGE 1:
STAGE 2:
STAGE 3:
During each simulated day
The entire system is operated on anhour by hour basis according to theoperating schedules determined at thebeginning of each day
System operation includes operation ofall storages, power stations, pumps,siphons, conduits etc. that relate to theTasmanian generating system
At the end of each simulated day
Generation levels of each virtual unit,hourly Basslink transfers and regionalSMPs are stored for post simulationanalysis
Appendix 1: Scoping Report February 2000Environmental Services Department, Hydro Consulting
Basslink Integrated Impact Assessment Statement 27Potential Effects of Changes to Hydro Power Generation
2.2.2 Modelling of the Tasmanian Generating System
In TEMSIM, the Tasmanian generating system is modelled in considerable detail and is based onexisting infrastructure. All 40 significant water storages, all 27 power stations, all conduits, pumps andsiphons are included in the model. The power stations are represented individually, with allmachine/turbine efficiency characteristics modelled.
The TEMSIM model can also incorporate the thermal control rule (as it relates to Bell Bay ThermalStation), setting the threshold approximately where there is a 2% annual risk of storage depletion to acritical (‘emergency’) level, below which, the system may be unable to meet power demand (seeSection 1.5.5). This is only incorporated in the no Basslink scenario (See section 2.5.1 - case 1).
75 years (1924-98) of historical inflow data is available and used in the model (the inflow data base isexplained in more detail in Section 2.4.2). TEMSIM can be operated using a single sequence ofinflows into water storages or with multiple sequences in order to evaluate the effects of hydrologicalvariability. For the purposes of this scoping study, a single sequence of 75 years of inflow data wasused.
System demand is determined hourly and is derived from average annual load forecasts. Theseforecasts are disaggregated into hourly fragments that reflect seasonal, weekday/weekend and withinday variations. Constraints on generation resulting from current environmental or riparianrequirements (e.g. lake level agreements) are included in the model.
2.2.3 Offers in TEMSIM
At the start of each simulated day offer prices and volumes are determined for the following 24 hoursfor each virtual generator.
For the long term storage generators (Gordon and Great Lake), prices are based on the long-termmarginal cost (LTMC) function, which relates LTMC to total energy in storage (TEIS). Figure 2.3illustrates the modelled price curve for long term storages in TEMSIM.
Figure 2.3 shows that prices are lower when more water is held in storage in Great Lake and LakeGordon/Lake Pedder. As storage levels decrease, usually during summer months, the price per MWhour increases towards Value of Lost Load (VoLL). The LMTC curve differs for each month of theyear.
Figure 2.3 – Long term storages price curve. PLT is Price Long-term
PLT
LTMC
Pric
e$/
MW
h
% Energy in Storage
100%CurrentPosition
Appendix 1: Scoping Report February 2000Environmental Services Department, Hydro Consulting
Basslink Integrated Impact Assessment Statement 28Potential Effects of Changes to Hydro Power Generation
For the intermediate storage/downstream cascade systems (see Figure 2.4), head storage prices are setusing empirical relationships between storage and price. This relationship is based on the assumptionthat the value of water in these storages is equal to the long-term marginal cost (PLT – price of Gordonand Poatina electricity) when the storage is at its seasonal target level/economic operating level. Eachstorage has a ‘target level’ or ‘economic operating level’ (EOL) for each month of the year.
In order to determine offers for the intermediate storage/downstream cascade systems, TEMSIM usesthe following approach:-
The current storage situation is assessed (i.e. current level in Figure 2.4, including inflows for thecoming day) and available generation volumes (V1 to V5) are estimated. Classification of generationvolumes are outlined in Table 2.1.
Table 2.1: Classification of available generation.
1. Energy generation to avoid spill V12. Operation of run-of-river storages to target level V23. Operation of head storages to target level V34. Operation of run-of-river storages to NMOL V45. Operation of head storages NMOL V5
In general, prices associated with these volumes are also based on the LTMC function for the systemin total together with empirical price functions for the intermediate (head) storages.
Figure 2.4 illustrates a case where the intermediate storage price is less tan the long term storage price(PLT). This would result in the use of the intermediate storage (in this case Lake Burbury and JohnButters Power Station) prior to the long term storages (Great Lake and Lake Gordon).
eg. John Butters Electricity
Figure 2.4 – An example of an intermediate storages/downstream cascade systems price curve.
2.2.4 Dispatch in TEMSIM
The dispatch module in TEMSIM determines dispatch of generated electricity in two regionsconnected by a Basslink cable. The module receives generation offers from the 5 virtual generatorsoperating in the Tasmanian region. Offers for notional Victorian generators are constructed aroundforecasted System Marginal Price (SMP). These notional offers are submitted to the dispatchalgorithm along with real offers from the Tasmanian generators.
Current Level
EOL 100%
Pric
e$/
MW
h
Storage Level
PLTPrice of Gordon &Poatina electricity
Price of JohnButters electricity
LTMC
Appendix 1: Scoping Report February 2000Environmental Services Department, Hydro Consulting
Basslink Integrated Impact Assessment Statement 29Potential Effects of Changes to Hydro Power Generation
The dispatch process involves “taking” generation from a prioritised list of offers (lowest price offeredfirst) to meet demand in the two regions. Initially, offers from generators are placed against demand inthe region that the generator is located in. If demand has been met in that region, offers may then beused against demand in the other region by means of a link transfer. The list of offers is therebytransformed into a generation dispatch schedule for both regions.
2.3 Model Inputs
2.3.1 Determination of System Marginal Price (SMP)
The Basslink TEMSIM model requires a projection of hourly mainland electricity spot prices to beinput, which provides an hourly time series of mainland prices. These prices are based on a forecast ofmainland pool prices provided by the PROPHET model which was developed by Intelligent EnergySystems (IES 1997).
The PROPHET model simulated the currently interconnected systems of NSW, Victoria, Snowy,South Australia and the proposed NSW – Queensland interconnection. The model is designed toimplement the principal NEM rules and was used to generate price distribution in Victoria underfuture scenario assumptions. TEMSIM modelling was based on the results generated for 2003, as thisis when it is likely Basslink will become operational.
The SMP set in each region is influenced by whether the cable is constrained or not. When demand inboth Tasmania and Victoria have been met, or all offers have been dispatched, the SMP is determinedfor these two regions. If the link is constrained by Basslink being at full capacity, a region’s SMP isset by the last dispatched offer of a generator in that region. If the link is unconstrained, the SMPs inthe two regions are equal (ignoring link losses) and set to the last dispatched generator in theimporting region. If demand has not been met in a region, the SMP for that region is set to Value ofLost Load (VoLL which is currently set at $5000/MWh). SMPs can never exceed VoLL.
Generally, if the SMP for Tasmania is less than the SMP for Victoria, then electricity will be exportedfrom Tasmania to Victoria, usually during Victorian peak price periods. If the SMP for Tasmania isgreater than the SMP for Victoria, then cheaper electricity will be imported from Victoria. A possiblescenario leading to a link transfer from Victoria is during summer when our storages are low andprices are higher (refer to Figure 2.3).
In determining link transfers, an assumed 10% loss has been incorporated into the model. This dictatesthat there must be at least a 10% differential in SMPs for a transfer to occur, and for each 1MW sentover the link only 0.9MW arrives at the other end.
The key point for this study is that the mainland electricity market model (PROPHET) which forms animportant input to the Basslink TEMSIM model is derived from a detailed and complex study. Thereare uncertainties in prediction of future market behaviour, but price data input into the BasslinkTEMSIM model is based on the best analysis available. The dispatch process in TEMSIM wasreviewed and approved by Macquarie Bank in August 1999.
2.3.2 Inflow Database
The TEMSIM model relies on a database of storage inflows comprising 75 years of record between1924 and 1998. Wherever possible, Hydro has used direct flow measurements to determine inflowsequences for various basins. This is considered the most reliable method and provides a true pictureof daily and seasonal variations.
Appendix 1: Scoping Report February 2000Environmental Services Department, Hydro Consulting
Basslink Integrated Impact Assessment Statement 30Potential Effects of Changes to Hydro Power Generation
The TEMSIM model is based upon the SYSOP model, which is currently used to model the Hydrosystem. BC Hydro (1996) audited SYSOP and the inflow database that both it and TEMSIM are basedupon. The BC Hydro audit team estimated uncertainties in the inflow database for the SYSOP model.These varied with catchment, and were generally between ±3% to ±5%. The audit team noted that“uncertainty in the basin inflow estimates do not necessarily translate into the same uncertainty insystem energy estimates, as there is expected to be a random variation in the sign of uncertaintiesbetween basins” (BC Hydro 1996, p.2-12). Errors in data used in the simulation were assumed to be inthe order of ±5%, and the error in energy output significantly lower than that, in the order of 1.5% (BCHydro 1996). It is considered that the conclusions drawn by the BC Hydro audit team werereasonable, in so far as they were based on a fairly broad overview of SYSOP’s performance andhistorical database. SYSOP is a suitable basis for the development of TEMSIM.
The TEMSIM model utilises the 75 years of inflow data for the system with its present dayinfrastructure. Changes in infrastructure in the Hydro operating system over the 75 year period are notconsidered in the model. Model outputs are a simulation of what the power station discharges andlake level fluctuations would have been during the 75 year period of inflow record if the present dayinfrastructure had been in place over those 75 years. The aim is to forecast outcomes under the currentsystem operations.
2.3.3 2.4.3 Efficiency Curves
TEMSIM estimates all discharges from power stations using a suite of ‘efficiency curves’. Thesecurves are plots which show the effective turbine kW per cumec at different turbine discharges (incumecs). An example of the shape of one of these curves is provided in Figure 2.5. In Figure 2.5, pointA is the most efficient load for a single turbine power station.
These curves are unique to each power station turbine. For power stations where there are multipleturbines, the efficiency curve becomes a series of the shapes, such as that shown in Figure 2.6 for ahypothetical power station with three turbines.
In Figure 2.6, the overall power station efficiency curve (shown with the solid line) is created from theoverlap of three efficiency curves, one for each turbine. Point A in Figure 2.6 is the most efficient loadfor the first turbine, which corresponds with a particular discharge rate. Point B is the efficient load forthe first and second turbine together, which corresponds with a higher discharge but lower efficiency.Point C is the efficient load for all three turbines.
Appendix 1: Scoping Report February 2000Environmental Services Department, Hydro Consulting
Basslink Integrated Impact Assessment Statement 31Potential Effects of Changes to Hydro Power Generation
A
kW percumec
discharge (cumecs)
Figure 2.5 – Typical Efficiency Curve for a Single Turbine (denoted A)
A B
C
kW percumec
discharge (cumecs)
Figure 2.6 – Typical Efficiency Curve Shape for Multiple Turbines (denoted A, B and C)
For TEMSIM modelling, individual curves were used for all turbines in the system. Most efficiencycurves were provided by the turbine manufacturer, and there may be a degree of unquantified error intheir exact form. These efficiency curves do not originate at zero discharge and do not detail lowflows, because flows close to zero are not in the range for which the turbines were intended togenerate energy. Most turbines are operated as close to the maximum efficiency as possible.
2.4 TEMSIM Model Outputs
Information obtainable as outputs from the model include:
• Hourly SMP values in the Tasmanian and Victorian regions;
Appendix 1: Scoping Report February 2000Environmental Services Department, Hydro Consulting
Basslink Integrated Impact Assessment Statement 32Potential Effects of Changes to Hydro Power Generation
• Hourly storage volumes (cumec-days);
• Power station discharges (cumecs); and
• Hourly Basslink transfers.
The large amounts of data generated by the TEMSIM model runs posed a number of logisticaldifficulties for this study. Each run generated an output file that had separate results for each of thehydro-power stations (both spill and discharge) and the storages. Power station discharge and spillsneeded to be detailed on an hourly time-step over the 75 years of record, in order to capture the rapidfluctuations in water releases which may occur with a change to supply of peak load power. Lake levelchanges were run on a daily time-step as they would not change as rapidly.
To reduce the amount of data analysed, point sources in the generating system where power stationdischarges occur were carefully assessed. Discharges from power stations which went directly intoanother hydro storage were not modelled as there was no riverine receiving system (e.g. many of thepower stations in the run-of-river cascades in the Mersey-Forth, Pieman and Derwent).
2.5 Model Runs
2.5.1 General
There were four model runs conducted for this study. These were:
Case 1 (0MW): 0MW import/0MW export, present day infrastructure and operating constraints,without the Basslink cable but includes competition within the system, andoperation of Bell Bay;
Case 2 (300MW): 300MW import/300MW export and includes a Basslink loss factor of 10%export/import, with no operation of Bell Bay;
Case 3 (450MW): 450MW import/450MW export, including the 10% loss factor, with no operationof Bell Bay; and
Case 4 (600MW): 600MW import/600 MW export including the 10% loss factor, with no operationof Bell Bay.
Case 1 is the base case (TEMSIM 0MW). This was used to predict system operation in 2003 if theBasslink cable was not available. It is based on the TEMSIM model and so treats the current system asdivided into five “virtual” generator groups (based on hydro-catchments), in a competitive electricitymarket with each other. The operation of Bell Bay is included in the prediction, as it would still berequired for additional system security if the installation of a Basslink cable was not undertaken. Theother three cases modelled three different cable sizes, only one of which would be implemented underBasslink.
2.5.2 Assumptions
For all three cable sizes (300 MW, 450 MW and 600 MW), Bell Bay was excluded from modelling, asit would not be part of the system under Basslink, as Victoria would provide security of supply.
The TEMSIM model also incorporated the current system operational constraints. These include lakelevel agreements and downstream maximum or minimum flow discharges which are present on anumber of lakes and rivers. Major operational constraints are shown in Table 2.2. Constraints alsoexist on a number of other minor storages, for example Penstock Lagoon, Shannon Lagoon, Little PineLagoon, Bronte Lagoon and Woods Lake.
Appendix 1: Scoping Report February 2000Environmental Services Department, Hydro Consulting
Basslink Integrated Impact Assessment Statement 33Potential Effects of Changes to Hydro Power Generation
Table 2.2 – Current Operational Constraints on the Hydro System
Lake levelAgreements
NMOL
(mASL)
FSL min LLA max LLA Reason, duration, other info.
Arthurs Lake 943.05 952.82 948 - Habitat enhancement
Lake Augusta 1141.63 1150.62 1146.86 - To prevent sand blowing into intake area
Lake Meadowbank 67.06 73.15 71.86 Maintain irrigation offtakes under water.Water level maintained within 0.15m ofFSL
Lake Pedder 305.41 308.46 306.93 308.46 Protection of lake from excessive erosion.Additionally, water is released throughMcPartlans canal only when L. Pedder is 1m or more higher than L. Gordon
Lake Rosebery 151 159.4 156 - Maintain town and mine water supplyintakes under water. Only drops below minLLA for maintenance
Lake St Clair 734.58 736.72 - 735.6 Protection of lake from excessive erosion.Above this level less than 6% of time - formodel 735.6 was taken as a max lake level.
Lake Trevallyn 117.96 126.49 124.97 - Drawn down for flood events, to preventdamage to urban areas.
Downstream Rules
mindischarge(cumecs)
maxdischarge(cumecs) Reason, duration, other info.
Poatina PS 2 For Cressy town water supply
Butlers Gorge PS 20 To prevent downstream canal from spilling
Meadowbank PS 20 Hobart water supply - riparian valve usedwhen PS is off
Parangana Dam up to 2 Environmental flow for Mersey River
NB. See Glossary for explanation of acronyms / abbreviations
The forecast annual Tasmanian system load, as calculated by forward load predictions to 2003 (whenBasslink would come on line), was set at 1135 MW for all cases. This was taken from the SystemController 1998 planning statement and is the official load forecast. Start storages for the model weredetermined by taking the storage levels at June 1999 (76%) and running SYSOP to predict the storagelevels at January 1, 2003.
2.5.3 Limitations of the TEMSIM Model
As with any model, TEMSIM has a number of limitations. The first is that it models the currentgeneration system in Tasmania, and does not allow for any new infrastructure such as wind power andgas. It also does not take into account future cloud seeding activities (the historical inflow databaseincludes the influence of past cloud seeding activities on the catchments, however future projectionsdo not). The way the storages are “bid in” reflects best available future predictions, but this maychange or be refined in the future. The mainland market is also modelled as is, in regards to currentinfrastructure and bidding system. There is also an assumption of a degree of price elasticity, howeverthe import of power into the Tasmanian system may affect prices on the mainland in slightly differentways to that predicted and modelled.
Appendix 1: Scoping Report February 2000Environmental Services Department, Hydro Consulting
Basslink Integrated Impact Assessment Statement 34Potential Effects of Changes to Hydro Power Generation
Maintenance can involve some periods of power station shutdown. Maintenance shutdown schedulingis not present in TEMSIM, as it is not possible to predict timing and level of maintenance as a result ofBasslink-induced changes to operations. With the additional security provided by Basslink,scheduling of maintenance is anticipated to be significantly more flexible (S. Stolp, pers. comm.)although still constrained by power production demands.
TEMSIM does not simulate any transmission constraints. Transend have an ongoing program toaddress existing system weaknesses. Overall, TEMSIM provides the best available prediction of howBasslink will affect the Tasmanian system in the future. The Hydro is refining the modelling of itssystem, and will continue to review the environmental implications of any changes to the waterwayspredicted by the model.
2.6 Hydrological Analyses
2.6.1 Hydrological Changes of Ecological Significance
The output data consisted of hourly power station discharges and daily lake level fluctuations over 75years of record. Detailed consideration was given to how the output data from the model runs wouldbe analysed for this study. Hydrological statistics were selected which best indicated the potential forenvironmental impacts. Environmental and social risks were assessed where significant differenceoccurred between future predictions without Basslink (0MW) compared to predictions with a cable(300MW etc.) in place. Comparison was also made between historical and predicted systemoperations.
The components of the hydrological regime which are most critical for maintenance of downstreamecosystem integrity have been the subject of widespread investigation for the purpose of settingenvironmental flows. For example, Clausen and Biggs (1997) undertook a rigorous analysis of 35streamflow variables for use in ecological studies. Such rigour was beyond the scope and resources ofthe present study, and it drew on the more general guidelines provided in the 1996 State of theEnvironment Australia report.
The State of the Environment Australia report flags the following five changes in river flows assignificant in affecting channel form, sediment transport, water quality, habitats and biota ofAustralian streams (Wasson et al. 1996):
1. decreases in the volume of discharge or occasional increases (e.g. with interbasin transfers);
2. changes in and reversal of seasonal flow patterns (e.g. higher summer instead of winter flows);
3. reduction or enhancement of the natural variability of flows on scales of hours, months or years;
4. changes in the frequency (typically suppression) of small to medium floods; and
5. changes in the form of floods, especially the rate of rise and fall.
In addition, the following was considered to be of significance:
• the incidence (frequency and duration) of extreme low or zero flow events; and
• the frequency and magnitude of rates of rise and fall about specific river levels or discharges.
For lakes, the following were important:
• the long term and seasonal pattern of lake levels;
• the duration and incidence of low lake level events at long time scales; and
• the relationship between lake levels and key bathymetric and biological features.
Appendix 1: Scoping Report February 2000Environmental Services Department, Hydro Consulting
Basslink Integrated Impact Assessment Statement 35Potential Effects of Changes to Hydro Power Generation
Each of these aspects of flow regimes were considered, and a suite of outputs selected for theTEMSIM model runs to ensure assessment of these key aspects could be made.
2.6.2 Data Analyses and Presentation for Lakes
For lakes, three sets of statistics were conducted, as shown in Table 2.3. These show the effect ofBasslink in regards to magnitude, frequency, duration and timing of lake level fluctuations.
Table 2.3 –Lake Level Data
Statistical Indicator Time Step
Lake Level Duration Daily
Monthly Average Lake levels Daily
Lake Level over Time Daily
2.6.3 Data Analyses and Presentation for Power Stations
Table 2.4 summarises the statistics that were generated for power stations discharge. These statisticsare easier to display graphically so explanation is deferred until Section 3, with the presentation ofresults.
Table 2.4 –Power Station Discharge Data
Statistical Indicator Time Step
Monthly Medians hourly
Monthly Maximums hourly, daily
Annual time series daily
Weekly time series hourly
Zero event duration analysis hourly
Positive event duration hourly
2.6.4 Method and Statistical Analyses for Assessment of Downstream River
Reaches
For those power stations outflows shown to be most subject to hydrological change under Basslink,additional analyses were conducted to demonstrate how changes at the power station would bemanifested downstream. This was done with the construction of hydrological models of thedownstream reaches, which utilised tributary flows, rainfall records, rating curves and stream leveldata, catchment areas, and any other relevant data.
Appendix 1: Scoping Report February 2000Environmental Services Department, Hydro Consulting
Basslink Integrated Impact Assessment Statement 36Potential Effects of Changes to Hydro Power Generation
2.7 Assessment of Environmental and Social Issues
‘Environmental and social issues’ examined in this study include impacts on aquatic ecosystems,supply to downstream users, and changes in recreational and aesthetic values.
Environmental risks were assessed using the following techniques:
• review of relevant literature;
• review of relevant historical environmental data;
• downstream hydrological analyses;
• initial stakeholder consultation; and
• specialist consultation.
Initial consultation on environmental issues was conducted with Dr P Davies, Freshwater Systems,Tasmania, during 1998 and 1999. This was limited to staff of relevant government agenciesresponsible for managing water, fishery and other natural values, as well as for abstractive use, andwas designed to identify which environmental issues were relevant, what their relationship withBasslink might be, and what various actions (mitigation and studies) might be required. Consultationstook the form of meetings and/or phone conversations, and were largely limited to seeking informationon the nature of the environmental issues.
Stakeholder consultation will continue as part of the Hydro’s Basslink environmental investigationsinto Tasmanian waterways. On-going public and stakeholder consultation regarding the Hydro’spresent and future operations will also be conducted through the Hydro’s water management review(as described in Section 1.4.2).
2.8 Limitations and Constraints in Study Methodology
As this report is intended as a scoping document, field assessments were not undertaken. The fieldknowledge of the study team and consulted specialists and stakeholders was extensive and was felt toprovide adequate information for scoping the environmental issues.
The assumptions used in modelling possible scenarios under Basslink are clearly stated in Chapter 3.It is impossible to model all future electricity market and water management scenarios. Neverthelessthe output of the modelling should provide a good indication of potential water management issues,upon which to base further study.
Appendix 1: Scoping Report February 2000Environmental Services Department, Hydro Consulting
Basslink Integrated Impact Assessment Statement 37Potential Effects of Changes to Hydro Power Generation
3 MODELLING RESULTSThis section describes the modelled response of the Hydro system to changes in electricity demandpatterns under various Basslink cable capacity scenarios. The modelled cable capacities are 300MW,450MW and 600MW for both import and export of electricity to and from the mainland. Additionallya 0MW scenario describes the base case, with no transfers over a Basslink cable but including all theother model assumptions and constraints.
A historical plot line is included in some analyses where available to indicate past water managementpractices. Comparison with historical trends should be interpreted with awareness of changes in thegenerating system over time; for example, the Pieman system was completed in 1987, and Kingscheme in 1992, and the Anthony scheme in 1994. Generally, historical analyses were restricted to theperiod reflecting current operations to provide the most realistic comparison.
The results of the modeling are presented on a catchment by catchment basis. Within the discussion ofeach catchment, modelled results for lakes are presented first, then river discharges downstream ofpower stations.
As there are 51 main storages and 27 hydro power stations in the Hydro system, not all of the resultsare presented in this report. Power stations which discharge to major riverine environments havereceived particular attention in the analyses conducted for this report – notably downstream of theGordon and Poatina Power Stations. Results are not presented for power stations which dischargedirectly to lake environments. Minor and run-of-river storages exhibiting similar characteristics arediscussed as a group and are illustrated by one or two examples typical of their operation.
3.1 Performance of the model
The TEMSIM model used in the current study is an improvement on previous models in that it factorsin a competitive electricity market in Tasmania where 5 ‘virtual’ generators (based on the 5 majorpower generating catchments) bid into the market. This model allows assessment of the impacts of acompetitive electricity market within Tasmania as well as the effect of the Basslink cable itself.
As with any model, there are a number of constraints in the TEMSIM model that need to beconsidered when interpreting the modelled results. Particular constraints to be aware of with theTEMSIM model are:
• TEMSIM uses full-gate operation for many of the power stations even when there is no imminentrisk of spill, and so modelling results indicate a marked increase in full gate discharges frompower stations. This represents inefficient usage of the Hydro’s water resource. In reality, fullgate discharge is likely to occur only when the electricity market is accepting high priced bids.
• The TEMSIM model is, on average, about 5% less water efficient than the preceding SYSOPmodel. The inefficiencies arise from competition between the 5 virtual Tasmanian generatorsbidding against each other, and the need for each of the 5 major catchments to supply a largerproportion of its own system security.
• There are inadequacies in the scheduling of small to medium-sized power stations in the lowerparts of cascade systems (ie. Derwent and Mersey Forth). This results in the electricity load beingmet by generation from the upper power stations in a run-of-river cascade without fully utilizingthis water as it travels (spills) down subsequent lakes in the cascade. This would not occur inreality and leads to some of the inefficiencies noted above. As a consequence, the dischargepatterns downstream of Meadowbank and Paloona Power Stations in particular are not correctlyrepresented by the TEMSIM model. Balancing of multiple head storage operation (Derwent and
Appendix 1: Scoping Report February 2000Environmental Services Department, Hydro Consulting
Basslink Integrated Impact Assessment Statement 38Potential Effects of Changes to Hydro Power Generation
Mersey Forth) is also not fully optimised in the TEMSIM model. Future improvements in thesystem modelling will address these issues.
A detailed discussion of the modelling results is presented on a catchment by catchment basis in therest of this section.
3.2 Gordon Catchment
The Gordon Power Scheme consists of two large storages – Lake Pedder and Lake Gordon. LakePedder acts as a diversion storage and is constrained in operating range to 1.53 m through legislation,to protect it from erosion. Levels in this lake are governed by natural seasonal inflows. The lake leveldoes not fluctuate in response to electricity demand and will therefore not affected by changes inoperation of the Gordon Power Station. The main outflow from Lake Pedder is via McPartlan Canalto Lake Gordon.
The Gordon Power Station draws water from Lake Gordon and principally controls downstreamdischarges to the Gordon River. There is also a facility to release water from Lake Pedder via riparianvalves at Serpentine Dam to the Serpentine River and subsequently to the Gordon River. This facilityacts as the spillway for the Pedder-Gordon system, but has only been operated to test the riparianvalves.
3.2.1 Lake Gordon
Lake Gordon lake levels have historically cycled up and down on a time scale of decades. TEMSIMmodelling indicates that Lake Gordon will continue to operate on the long- term cycling basis underdifferent Basslink scenarios. The major change is that the operating range is reduced under a TEMSIMmarket model (0 – 600MW) in comparison to historical operations. The overall variation in lake levelfor historical operations is 40m, under a market model this is reduced to a 30 m range with the top 10m of the storage not utilised under the modelled scenarios. The 300 MW and 0 MW scenarios showgreater variability and lower levels of operation than do the 450 and 600 MW scenarios.
Behaviour of the lake under the different cable sizes is a function of the Long Term Marginal Cost(LTMC) curve and of the ability of a Basslink cable to import power during times of high electricitydemand when the system security of the lake is compromised. When the lake is drawn low, the priceof the water is higher (see Section 2.2.3) and consequently, bids for energy generated from this waterare less likely to be accepted by the market. This negative feedback therefore prevents the lake frombeing drawn too low. Alternatively, high lake levels result in a low price being assigned to the waterand it is successfully bid into the market.
Appendix 1: Scoping Report February 2000Environmental Services Department, Hydro Consulting
Basslink Integrated Impact Assessment Statement 39Potential Effects of Changes to Hydro Power Generation
250
255
260
265
270
275
280
285
290
295
300
305
310
1976
1979
1982
1984
1987
1990
1993
1995
1998
Lake
Lev
el (m
)
0 MW300 MW450 MW600 MWHistorical
Figure 3.1 – Lake level time-series plot for Lake Gordon. The time period shown (1976 to 1998)represents the time since the filling of the impoundment after dam closure in1974. The top and bottom lines indicate FSL and NMOL for the storage.
250
260
270
280
290
300
310
Janu
ary
Februa
ryMarc
hApri
lMay
June Ju
ly
Augus
t
Septem
ber
Octobe
r
Novem
ber
Decem
ber
Lake
leve
l (m
)
0 MW
300 MW
450MW
600MW
Historical 1979-1998
Figure 3.2 – Average monthly lake levels for Lake Gordon based on the 65 year modellingperiod. The historical averages for the period 1979 - 1998 are shown forcomparison. The top and bottom lines indicate FSL and NMOL for the storage.
The lower lake levels under the 300 MW cable scenario (see Figure 3.1) are a result of low inflowsduring the warmer months into other Tasmanian storages and therefore a shortfall in the ability of therun-of-river stations to meet electricity demand. At the same time, no Bell Bay thermal backup isavailable and there is only limited (300MW) security provided by the Basslink cable. Under suchconditions high priced energy bid into the market by Gordon Power Station would be accepted to takeup the unsatisfied demand and Lake Gordon would be drawn lower than normal. This variation is stillwithin the historical fluctuation range.
Appendix 1: Scoping Report February 2000Environmental Services Department, Hydro Consulting
Basslink Integrated Impact Assessment Statement 40Potential Effects of Changes to Hydro Power Generation
Larger cable scenarios (450 and 600 MW) display a reduced propensity to react in this way duelargely to the increased ability to import power from the mainland when Lake Gordon’s price is high(lake level is low). This results in the larger cables on average holding the lake higher than both the300 MW cable and the 0MW (no cable) scenarios (Figure 3.2). Figure 3.2 also shows that theseasonality of lake level fluctuations changes somewhat between historical operations and theTEMSIM simulations, with highest levels being attained in October rather than December. Thedifference in level between these times in any of the cable sizes is less than 1 m and is not consideredan issue in the management of this lake.
Overall no significant environmental or social disadvantages have been identified relating to changesin the management of Lake Gordon under Basslink. Consequently, no studies are recommended aspart of the detailed environmental investigations to be conducted by the Hydro on the potential effectsof Basslink. In fact, it is likely that the maintenance of the lake level below the top 10m of the storagewould have some environmental benefits:
• The possibility of redfin perch being able to invade Lake Pedder is greatly reduced. This is anaggressive introduced piscivorous fish that inhabits Lake Gordon. It has been able to disperse intoMcPartlan Canal when Lake Gordon has been at high levels. Reduced levels in Lake Gordon willincrease the exposure of barriers to this fish’s ability to move into the canal, thereby significantlyreducing the possibility of this fish invading Lake Pedder. The Hydro currently has an operationalrule in place to maintain a water flow velocity barrier at the canal gate to exclude this fish fromLake Pedder for the protection of the threatened Pedder and swamp galaxias, and the recreationaltrout fishery. Operation of this rule will be significantly reduced under the different Basslinkscenarios, and its associated enhanced risk of spillage from the Serpentine valve will be avoided.
• The absence of high lake levels within Lake Gordon also limit the potential movement of Redfinperch into some tributary streams of the Lake that are known to harbour remnant populations ofswamp galaxias, and therefore Basslink could help to protect these colonies.
• The overall reduction in lake level fluctuation will result in sustainable vegetation regeneration inthe upper dewatered zones, and the possible need for weed management.
3.2.2 Gordon River
There is only a short period of record available for pre-dam flows in the Gordon River (Figure 3.3).The hydrograph for this period shows a significant level of variability with floods reaching up toapproximately 475 cumecs, and almost zero flows in December 1965. It is likely that floods wouldhave reached far higher magnitudes as monitoring did not appear to identify any low-frequency floodsduring the three year period of pre-dam record.
The presence of the dams on the Gordon and Serpentine rivers has reduced the incidence of largefloods, with the maximum amount of water discharged under normal operations being ~260 cumecs (3turbines at full gate). Only under exceptional circumstances would the Serpentine Dam valve beopened to release large volumes of water (a maximum of 242 cumecs), and this scenario would onlybe likely when the river would naturally be in flood.
Appendix 1: Scoping Report February 2000Environmental Services Department, Hydro Consulting
Basslink Integrated Impact Assessment Statement 41Potential Effects of Changes to Hydro Power Generation
0
100
200
300
400
500
600
1964
1965
1966
1967
1968
Flow
(cum
ecs)
Figure 3.3 – Natural (pre-dam) flow time-series for the Gordon River at the Gordon dam site.
Historically, the operation of the Gordon Power Station is determined largely by the availability ofwater in other catchments in the state. During wet years there is plenty of water available for the run-of-river power stations, particularly during winter. The water in the run-of-river schemes is utilizedbefore it spills, whilst inflows to Lake Gordon are stored and the power station is operated minimallyduring the wetter months. The historical time series plot in Figure 3.4 shows that in a typical wet year,the station operates over much of summer and autumn, but is largely shutdown for over 6 months ofthe year which include winter.
With the introduction of a competitive electricity market in Tasmania but with no Basslink cable (the0MW scenario Figure 3.4), there is still a notable seasonal difference in power station operation.There is, however, more power station operation in winter whereas historically there was minimal,because with the market scenario generation bids get accepted over winter/spring during short dryperiods when the smaller storages are at relatively lower levels. During the driest part of the year(February-March), the station operates largely at full gate due to limited amounts of water beingavailable within the intermediate storages.
Increases in Basslink cable size introduce more frequent changes in operation from efficient loaddischarge (~210 cumecs) to zero flow (known as hydro peaking) throughout the year in comparison tohistorical. The larger cables increase the peaking frequency, with many of the shutdownscorresponding to weekend low load periods. This pattern reflects the ability of the larger cables toexport power to the mainland during weekdays periods, and the ability for the thermal power stationson the mainland to undercut the Tasmanian market on the weekends when these slower reacting powerstations have surplus energy available. Hydro-electric power stations can change their generating loadin a few minutes, in comparison to thermal power stations which can take a few hours to change theirgenerating load. Hydro station can also switch on and of and on again in minutes whereas it takes afew days for a thermal station to turn on and off and on again.
Figure 3.5 shows the times series of Gordon Power Station operation for a typical dry year. In thehistorical case, Gordon is discharging base load throughout most of the year, as there is insufficientwater in the run-of-river storages to provide base flow. The modelled market and Basslink scenariosall show an increase in the incidence of step load operation of the power station. Similar patterns offrequent on-off operation are seen with larger cables sizes for both dry and wet years. This indicatesthat system security is less of an issue with these cable sizes, and that market forces are the majordriver of power station operation.
Appendix 1: Scoping Report February 2000Environmental Services Department, Hydro Consulting
Basslink Integrated Impact Assessment Statement 42Potential Effects of Changes to Hydro Power Generation
Figure 3.4 – Discharge time-series plots for Gordon Power Station during a wet year (1994) forhistorical operations (top), OMW, 300MW, 450MW and 600MW TEMSIMscenarios.
Appendix 1: Scoping Report February 2000Environmental Services Department, Hydro Consulting
Basslink Integrated Impact Assessment Statement 43Potential Effects of Changes to Hydro Power Generation
Figure 3.5 - Discharge time-series plots for Gordon Power Station during a dry year (1982) forhistorical operations (top), OMW, 300MW, 450MW and 600MW TEMSIMscenarios.
Appendix 1: Scoping Report February 2000Environmental Services Department, Hydro Consulting
Basslink Integrated Impact Assessment Statement 44Potential Effects of Changes to Hydro Power Generation
Figure 3.6 shows monthly median flows for the Gordon Power Station. The historical plot shows apattern of relatively high summer discharge, and almost no discharge in winter. This trend isexaggerated with the 0 MW scenario, with higher than historical summer discharges and virtually nodischarge for a longer winter period. Care should be taken when interpreting this result; monthlymedians of zero only indicate that the power station was operating less than 50% of the time duringthat month, and do not necessarily indicate a total shutdown of the power station.
0
40
80
120
160
200
240
280Ja
nuar
y
Febr
uary
Mar
ch
April
May
June July
Augu
st
Sept
embe
r
Oct
ober
Nov
embe
r
Dec
embe
r
Med
ian
Flow
s (c
umec
s)
TEMSIM 0MW300 MW450 MW600 MWHistorical
Figure 3.6 – Monthly median flows for Gordon Power Station. Monthly medians of zero indicatethat the power station is operating less than 50% of the time during that monthand does not necessary designate a total shutdown over that period.
The 300 – 600 MW cable scenarios in Figure 3.6 show quite a different pattern to the historical or 0MW case. The same high summer discharges are shown, but there is a notable second peak in earlywinter. This reflects the increased discharge of the power station during winter months that wasevident in the annual time series. The progressively larger cable sizes show a gradual decrease in thesummer discharges and increase in the winter discharges, reflecting the increasingly market drivenoperation of the power station during winter months with the larger cable sizes.
There is a notable difference in the incidence of power station shutdown periods between the 0 MWand the three Basslink cable scenarios. The duration of modelled shutdown events (zero flows) ispresented in Figure 3.7a. The x-axis is the duration of the shutdown event in hours, the y-axis is theaverage number of shutdown events in a given year. Figure 3.7a clearly shows an increase betweenthe 0MW and various Basslink cable sizes in short-term shutdown events of less than 24 hours. Thereis an increase in the number of very short-term (<12 hours) shutdown events for the larger cables,reflecting the increased peak load operation shown in Figs. 3.4 and 3.5. Similarly, the incidence of 72hour (weekend) shutdowns is increased under Basslink as shown in these figures. Longer durationshutdowns are minimised with the Basslink scenarios.
Appendix 1: Scoping Report February 2000Environmental Services Department, Hydro Consulting
Basslink Integrated Impact Assessment Statement 45Potential Effects of Changes to Hydro Power Generation
000M W
0
10
20
30
40
1 3 5 7 9 11 16 24 32 40 48 96 144
336
>504
R elease E vent D uration (h rs)
Num
ber o
f Eve
nts
3 00M W
0
10
20
30
40
1 3 5 7 9 11 16 24 32 40 48 96 144
336
>504
R elease E vent D uration (hrs)
Num
ber o
f Eve
nts
4 50 M W
0
10
20
30
40
1 3 5 7 9 11 16 24 32 40 48 96 144
336
>504
R elease E ven t D u ra tion (h rs )
Num
ber o
f Eve
nts
6 00M W
0
10
20
30
40
1 3 5 7 9 11 16 24 32 40 48 96 144
336
>504
R elease E ven t D u ratio n (h rs )
Num
ber o
f Eve
nts
Figure 3.7a – Shutdown (zero flow) event duration analysis for the Gordon River. Barsrepresent average number of shutdown days per year for each duration category.
Appendix 1: Scoping Report February 2000Environmental Services Department, Hydro Consulting
Basslink Integrated Impact Assessment Statement 46Potential Effects of Changes to Hydro Power Generation
000M W
0102030405060
1 3 5 7 9 11 16 24 32 40 48 96 144
336
>504
R elease E vent D uration (hrs)
Num
ber o
f Eve
nts
3 00M W
0102030405060
1 3 5 7 9 11 16 24 32 40 48 96 144
336
>504
R elease E vent D uration (hrs)
Num
ber o
f Eve
nts
4 50 M W
0102030405060
1 3 5 7 9 11 16 24 32 40 48 96 144
336
>504
R elease E ven t D u ra tion (h rs )
Num
ber o
f Eve
nts
6 00M W
0102030405060
1 3 5 7 9 11 16 24 32 40 48 96 144
336
>504
R elease E ven t D u ratio n (h rs )
Num
ber o
f Eve
nts
Figure 3.7b – Event (above zero flow) duration frequency analysis for Gordon Power Station.Bars represent average number of shutdown days per year for each durationcategory.
Appendix 1: Scoping Report February 2000Environmental Services Department, Hydro Consulting
Basslink Integrated Impact Assessment Statement 47Potential Effects of Changes to Hydro Power Generation
The number of short-duration startup events is increased within increasing Basslink cable size (Figure3.7b). Conversely, there is a decrease in the number of long-term events indicating more hydro-peaking under Basslink. The major increases in event frequency related to durations of less than 10hours and in the 24 to 72 hour range. The event analysis shown here indicates flow increases abovezero cumecs and does not highlight variability in non-zero flows. The discharge time-series shown inFigures 3.4 and 3.5 (wet and dry years), shows that there are additional fluctuations above this levelfor the larger cable sizes. The increase in peaking exhibited here is likely to be a function of diurnalpeaking of mainland power demand coupled with the varying ability of the other Tasmanian powerstations to bid generation in at competitive prices.
Figure 3.8 shows a comparison of hydrographs for the Gordon Power Station tailrace and the Warners(Jones) Landing Gauge site in the tidally influenced reach of the Gordon River. This was examinedbecause of the presence of the unique meromictic lakes on the Lower Gordon River floodplain. Thisfigure indicates that the Gordon Power Station discharges have only a small influence on short-termlevel fluctuations of the tidal sections of the river. Changes in stage height at the tailrace of up to 5 m(3 turbines) appears to raise the level of the estuary if discharged over a prolonged period, howevershort-term fluctuations corresponding to power station output do not appear in the hydrographic recordat the estuary. This is mainly due to the attenuation of flow pulses over the length of the river,frictional losses (and slowing down of the pulse) due to the river bed and the various hydraulicconstrictions at a number of locations along the river (e.g. Abel Gorge, the Splits). External factorsaffecting the estuary height such as tide, wind over Macquarie Harbour, barometric pressure and theincreased cross-sectional area of the river channel in the estuary all combine to dampen the effect thatpower station has on river level at this point. These are important considerations to take account ofwhen making management strategies for the meromictic lakes on the Lower Gordon River floodplain.
Figure 3.8 – Comparison of hydrographs for the Gordon Power Station tailrace and theWarners (Jones) Landing gauge site showing minimal influence of the powerstation on river levels in the tidal sections of the river.
Appendix 1: Scoping Report February 2000Environmental Services Department, Hydro Consulting
Basslink Integrated Impact Assessment Statement 48Potential Effects of Changes to Hydro Power Generation
Although the river levels may not be greatly affected much in the estuary, it has been well documentedthat the Gordon Power Station has a major influence on the intrusion of the salt wedge into the estuary(Hodgson & Tyler, 1996). The inverted seasonal flow regime under historical operations has all buteliminated the saline recharge of the meromictic lakes of the lower Gordon River floodplain. Thereturn to more natural seasonal flow regimes may provide more effective penetration of the salt-wedgeinto the Gordon River estuary. Combined with the additionally security offered by the larger Basslinkcables, this may provide opportunities to protect these unique ecosystems through carefully timedshutdowns of the power station to allow saline recharge into these lakes.
In summary, the Hydro is likely to significantly alter the way it operates the Gordon Power Stationunder Basslink. The main changes are:
• Increased short-term variability in flow discharges;
• Increased frequency of short duration (and weekend) shutdowns; and
• Changes in the seasonality of flows.
There is no change in the magnitude of peak flows. The environmental issues associated with thesechanges are discussed in Chapter 4.
3.3 Great Lake / South Esk Catchment
The Great Lake catchment consists of two highland storages (Lake Augusta and Arthurs Lake) thatdivert water into Great Lake, the major storage of the catchment. Great Lake supplies water to PoatinaPower Station, which then discharges water to Brumbys Creek and eventually into Lake Trevallyn.Trevallyn Power Station takes this water and discharges directly to the Tamar Estuary. Woods Lake isa small impounded natural lake downstream of Arthurs Lake that is used for irrigation purposes.
3.3.1 Arthurs Lake, Woods Lake, Lake Augusta
Arthurs Lake, Woods Lake and Lake Augusta all have lake level agreements and are thereforeconstrained to operating within these ranges under the TEMSIM model. Additionally, there areconstraints on the rates of change in lake levels due to constricted discharges. Lake Augustadischarges water to Great Lake via Liawenee Canal, which has a maximum capacity of approximately18 cumecs and Arthurs Lake water is pumped to Great Lake via the Pumphouse Bay pump, which hasa maximum capacity of 4.7 cumecs. Because of these constraints, these lakes do not have theflexibility to change their operation, and so are not considered to present any issues under any of theBasslink scenarios.
3.3.2 Great Lake
The operation of Great Lake is very similar to Lake Gordon. This is expected as both storages arelinked via the LTMC and will therefore react similarly in response to the inflow time series. Figure3.9 shows that the operation of Great Lake under a Basslink scenario occurs within the historicalparameters, with the TEMSIM outputs showing a slight flattening of operation in comparison to thehistorical operation of the lake. The 300MW cable shows the most pronounced changes and producesthe lower lake levels than other Basslink scenarios.
Appendix 1: Scoping Report February 2000Environmental Services Department, Hydro Consulting
Basslink Integrated Impact Assessment Statement 49Potential Effects of Changes to Hydro Power Generation
1015
1020
1025
1030
1035
1040
1976
1978
1980
1982
1984
1986
1988
1990
1992
1994
1996
1998
Lake
Lev
el (m
)
0 MW300 MW450 MW600 MWHistorical
Figure 3.9 - Lake level time-series plot for Great Lake. The time period shown in this figure(1976 - 1998) represents the operation of this lake since the commissioning of thePoatina Power Station and therefore gives the most valid comparison to recenthistorical operation. The top and bottom lines indicate FSL and NMOL for thestorage.
Great Lake - S13
1015
1020
1025
1030
1035
1040
0 10 20 30 40 50 60 70 80 90 100
Percentage of time level exceeded
Lake
Lev
el (m
)
0 MW300MW450MW600MWHistoric 1978-98
Figure 3.10 – Lake level duration plot for Great Lake. The historical averages for the period1978 -1998 are shown for comparison. The top and bottom lines indicate FSL andNMOL for the storage.
An analysis of the long-term average lake level duration for Great Lake (Figure 3.10) shows that thelarger cable sizes (450 and 600 MW) consistently hold the lake higher than the 300 MW or 0 MWoptions. Seasonality of level fluctuations within Great Lake shows a similar pattern between historicaland all the TEMSIM scenarios. The peak average lake level with the TEMSIM models is in October,one month earlier than historical operation (Figure 3.11). The annual variation in the timing of thepeak level is a reflection of a combination of factors including the timing of inflows and the timing ofpower station discharges.
Appendix 1: Scoping Report February 2000Environmental Services Department, Hydro Consulting
Basslink Integrated Impact Assessment Statement 50Potential Effects of Changes to Hydro Power Generation
Figure 3.11 – Average monthly lake levels for Great Lake based on the 65 year modelling period.The historical averages for the period 1924-98 (all operations) and 1978-98(recent operations) are shown for comparison. The top and bottom lines indicateFSL and NMOL for the storage.
As with Lake Gordon, there are no significant changes to the operation of Great Lake betweenhistorical and the modelled TEMSIM scenarios. Consequently, there are no direct environmentalissues associated with Basslink for Great Lake, and no Basslink related studies are recommended forthis lake.
The Hydro recognises the importance of this waterbody for numerous threatened species residing inthe lake as well as its importance as a recreational fishery. The Hydro is committed to ensuring that itmanages this waterway in a sustainable manner and will be addressing any stakeholder concerns aspart its Water Management Review process.
3.3.3 Lake Trevallyn
Lake Trevallyn is a designated recreational area and is maintained at a minimum level of 124.9 mASLfor recreational and water supply purposes under an agreement between the Hydro and the LauncestonCity Council. The lake is normally operated to this level, but may be drawn down for maintenancepurposes or in order to create more storage capacity when a flood event is predicted. As there is a lakelevel agreement in place for the operation of Lake Trevallyn, it is envisioned that there will be noissues with the management of this lake under any Basslink scenarios. This was reflected in themodelling outputs for this lake (Figure 3.12).
Appendix 1: Scoping Report February 2000Environmental Services Department, Hydro Consulting
Basslink Integrated Impact Assessment Statement 51Potential Effects of Changes to Hydro Power Generation
112
114
116
118
120
122
124
126
128
130
1955
1958
1961
1964
1967
1970
1973
1976
1979
1982
1985
1988
1991
1994
1997
Lake
Lev
el (m
)
O MW300 MW450 MW600 MWHistorical
Figure 3.12 - Lake level time-series plot for Lake Trevallyn. The time period shown in this figure(1955 - 1998) represents the operation of this lake since the commissioning of theTrevallyn Power Station. The top and bottom lines indicate FSL and NMOL forthe storage, and the middle line indicates the minimum level to be met by the lakelevel agreement.
3.3.4 Poatina Power Station Discharges
The discharge regime for Poatina Power Station shows change in response to Basslink. The historicaloperation of the station in a wet year (Figure 3.13) shows that there is minimal operation during thewetter months, but the station is heavily scheduled most of the other months. (The dip in generationover February-March of this year may be due to a maintenance shutdown.) Over the comparativeperiod in the TEMSIM 0MW scenario, Poatina was run at full gate almost continuously for twosummer months, indicating that Great Lake was above the LTMC and Poatina was bid in at afavourable price to the run-of-river stations. This 0 MW scenario shows the exaggeration of historicalseasonal trend that was indicated by the Gordon monthly median flows (Figure 3.6). The 300 – 600MW cable scenarios show a notable increase in step load operation, with possibly an increased numberof discharge events with increasing cable size. There appears to be a steady relationship betweenincreasing cable size and the number of peaking events.
Historically, during dry years (Figure 3.14), Poatina Power Station is critical in supplying power as therun-of-river stations would not have enough water, and so is run steadily throughout the year. Duringthese times Great Lake levels would begin to fall as shown in Figure 3.9. The 0MW scenario showssimilar operation to historical, although the period of shutdown is slightly greater and is interruptedless by short-duration discharges. The 300 – 600 MW cable scenarios show the same increasing on-off trend as they did for the wet year, showing as did the Gordon Power Station plots that systemsecurity is less of an issue with these Basslink cable sizes, and that market forces are the major driverof power station operation with these cables.
Appendix 1: Scoping Report February 2000Environmental Services Department, Hydro Consulting
Basslink Integrated Impact Assessment Statement 52Potential Effects of Changes to Hydro Power Generation
Figure 3.13 – Discharge time-series plots for Poatina Power Station during a wet year (1994) forhistorical operations (top), OMW, 300MW, 450MW and 600MW TEMSIMscenarios.
Appendix 1: Scoping Report February 2000Environmental Services Department, Hydro Consulting
Basslink Integrated Impact Assessment Statement 53Potential Effects of Changes to Hydro Power Generation
Figure 3.14 – Discharge time-series plots for Poatina Power Station during a dry year (1982) forhistorical operations (top), OMW, 300MW, 450MW and 600MW TEMSIMscenarios.
Appendix 1: Scoping Report February 2000Environmental Services Department, Hydro Consulting
Basslink Integrated Impact Assessment Statement 54Potential Effects of Changes to Hydro Power Generation
000M W
0
5
10
15
20
1 3 5 7 9 11 16 24 32 40 48 96 144
336
>504
R elease E vent D uration (hrs)
Num
ber o
f Eve
nts
3 00M W
0
5
10
15
20
1 3 5 7 9 11 16 24 32 40 48 96 144
336
>504
R elease E vent D uration (hrs)
Num
ber o
f Eve
nts
4 50 M W
0
5
10
15
20
1 3 5 7 9 11 16 24 32 40 48 96 144
336
>504
R elease E ven t D u ra tio n (h rs)
Num
ber o
f Eve
nts
6 00M W
0
5
10
15
20
1 3 5 7 9 11 16 24 32 40 48 96 144
336
>504
R elease E ven t D u ratio n (h rs )
Num
ber o
f Eve
nts
Figure 3.15 – Shutdown (zero flow) event duration analysis for Poatina Power Station. Barsrepresent average number of shutdown days per year for each duration category.
Appendix 1: Scoping Report February 2000Environmental Services Department, Hydro Consulting
Basslink Integrated Impact Assessment Statement 55Potential Effects of Changes to Hydro Power Generation
000M W
0
5
10
15
1 3 5 7 9 11 16 24 32 40 48 96 144
336
>504
R elease E vent D uration (hrs)
Num
ber o
f Eve
nts
3 00M W
-113579
111315
1 3 5 7 9 11 16 24 32 40 48 96 144
336
>504
R elease E vent D uration (hrs)
Num
ber o
f Eve
nts
4 50 M W
-113579
111315
1 3 5 7 9 11 16 24 32 40 48 96 144
336
>504
R elease E ven t D u ra tio n (h rs)
Num
ber o
f Eve
nts
600MW
-113579
111315
1 3 5 7 9 11 16 24 32 40 48 96 144 336 >504
Release Event Duration (hrs)
NumberofEvents
Figure 3.16 – Event (above 2 cumecs) duration frequency analysis for Poatina Power Station.Bars represent average number of shutdown days per year for each durationcategory.
Appendix 1: Scoping Report February 2000Environmental Services Department, Hydro Consulting
Basslink Integrated Impact Assessment Statement 56Potential Effects of Changes to Hydro Power Generation
An analysis of minimum flow events for the Poatina Power Station (Figure 3.15) shows that longduration low flows (>48 hours) are less likely with increasing cable capacity. Correspondingly, thenumber of short-duration low flows (<12 hours) increases with cable size, indicating more extensivehydro-peaking as this station takes advantage of peaks in the power demand curve from the mainland.As per the Gordon Power Station, it is likely that the mainland power demand variations will producethese short-term low flows over weekends when power demand is lower.
Poatina Power Station must discharge a minimum flow release for the pumps at the township ofCressy, on the Macquarie River. Analysis of the duration of events above this minimum flow of 2cumecs (Figure 3.16) shows a slight increase in the number of long duration events (>48 hours) for the300 – 600 MW cable scenarios compared to the 0MW option. The number of short duration eventsparticularly between 4 and 24 hours increases significantly with the Basslink cables compared to the 0MW case, as was indicated by the time series.
0
20
40
60
Janu
ary
Febr
uary
Mar
ch
April
May
June July
Augu
st
Sept
embe
r
Oct
ober
Nov
embe
r
Dec
embe
r
Med
ian
Flow
s (c
umec
s)
TEMSIM 0MW300 MW450 MW600 MWHistorical
Figure 3.17 – Median monthly flows from the Poatina Power Station. Monthly medians of zeroindicate that the power station is operating less than 50% of the time during thatmonth and does not necessary designate a total shutdown over that period.
Figure 3.17 shows the monthly median flows for the historical and modelled scenarios. The trends arealmost identical to those shown for the Gordon Power Station (Figure 3.6). Larger Basslink cablestend to have an equalising effect on the monthly seasonality of flows downstream during both wet(Figure 3.13) and dry (Figure 3.14) years, reflecting the ability of the cable to export power fromPoatina Power Station to the mainland. This results in a distinct change in the monthly flow patternfor the two largest Basslink cables. The peaks in winter flows that are introduced to the river systemwith the Basslink cables reflect a more natural pattern of flow seasonality. This may be of benefit toaquatic biota downstream that rely of flow induced natural cues as part of their life-cycle.
Appendix 1: Scoping Report February 2000Environmental Services Department, Hydro Consulting
Basslink Integrated Impact Assessment Statement 57Potential Effects of Changes to Hydro Power Generation
000M W
0
10
20
30
40
1 3 5 7 9 11 16 24 32 40 48 96 144
336
>504
R elease E vent D uration (hrs)
Num
ber o
f Eve
nts
3 00M W
05
10152025303540
1 3 5 7 9 11 16 24 32 40 48 96 144
336
>504
R elease E vent D uration (hrs)
Num
ber o
f Eve
nts
4 50 M W
05
10152025303540
1 3 5 7 9 11 16 24 32 40 48 96 144
336
>504
600M W
05
10152025303540
1 3 5 7 9 11 16 24 32 40 48 96 144
336
>504
Figure 3.18 – Event (above 50 cumecs) duration frequency analysis for OMW, 300MW, 450MWand 600MW TEMSIM scenarios below the junction of Brumbys Creek and theMacquarie River. This level corresponds to the level at which a minor flood alertis given for this region of the river.
Appendix 1: Scoping Report February 2000Environmental Services Department, Hydro Consulting
Basslink Integrated Impact Assessment Statement 58Potential Effects of Changes to Hydro Power Generation
000M W
0.00.10.20.30.40.50.6
1 3 5 7 9 11 16 24 32 40 48 96 144
336
>504
R elease E vent D u ration (hrs)
Num
ber o
f Eve
nts
3 00M W
0.00.10.20.30.40.50.60.7
1 3 5 7 9 11 16 24 32 40 48 96 144
336
>504
R elease E vent D uration (hrs)
Num
ber o
f Eve
nts
4 50 M W
0 .00 .10 .20 .30 .40 .50 .60 .7
1 3 5 7 9 11 16 24 32 40 48 96 144
336
>504
R elease E ven t D u ratio n (h rs )
Num
ber o
f Eve
nts
6 00M W
0 .00 .10 .20 .30 .40 .50 .60 .7
1 3 5 7 9 11 16 24 32 40 48 96 144
336
>504
R elease E ven t D uratio n (h rs )
Num
ber o
f Eve
nts
Figure 3.19 – Event (above 320 cumecs) duration frequency analysis for OMW, 300MW,450MW and 600MW TEMSIM scenarios below the junction of the Macquarieand South Esk rivers. This level corresponds to the level at which a minor floodalert is given for this region of the river.
Appendix 1: Scoping Report February 2000Environmental Services Department, Hydro Consulting
Basslink Integrated Impact Assessment Statement 59Potential Effects of Changes to Hydro Power Generation
The increase in winter discharges out of the Poatina power has implications for downstream flooding.A preliminary assessment of the risk of enhanced flood peaks during natural flooding events in thelower Macquarie and South Esk Rivers was conducted, using exceedance of the Bureau ofMeteorology (BOM) flood alert levels as an indication of flood risk. The frequency of flow eventscorresponding to minor flood alert below the junction of Brumbys Creek and the Macquarie River ispresented in Figure 3.18, and below the junction of the Macquarie and the South Esk rivers in Figure3.19. Figure 3.18 shows an increase in the number of short-term minor flood events (<24 hours) in theMacquarie River with the Basslink cables, which can easily be related to the increased winteroperation of the power station. Figure 3.19 shows that the Basslink cables add to the incidence ofshort-duration (<6 hour) flood events in the South Esk River, and introduces some alteration to thelonger duration events.
In summary, changes to the operation of Poatina Power Station due to Basslink are likely to be verysimilar to those for the Gordon Power station. Notably, the main changes are increased short termflow variability, increased frequency of short duration (and weekend) shutdowns, and changes in theseasonality of flows. The implications of these changes downstream of the Poatina Power Station aresomewhat different than downstream of the Gordon River, because of the very different land tenure,catchment features and magnitude of discharges. All environmental implications of the hydrologicalchanges shown for the Poatina Power Station are examined fully in Chapter 4.
3.3.5 Trevallyn Power Station
Trevallyn Power Station discharges directly to the Tamar River Estuary, therefore bypassing thesection of the South Esk River below Trevallyn Dam. Changes in the estuary due to any changes inTrevallyn Power Station operation are assumed to be negligible, because the water level fluctuationsdue to current operations are minimal, and the volume of water in the estuary largely dampens anyeffects.
3.4 West Coast Catchments
The West Coast catchment consists of two major schemes – the King and the Pieman-Anthony PowerDevelopments. Both schemes are relatively recent and therefore have short historical records for bothlake operations and power station discharges. The King Scheme was completed in 1992 and consistsof one medium sized storage (Lake Burbury), and one power station (John Butters) that dischargesinto the King River and ultimately into Macquarie Harbour. The Pieman Scheme was operational by1986 and consists of a cascade of medium-sized lakes and power stations, terminating with LakePieman and the Reece Power Station. The Anthony Power Development was completed in 1994 andincorporates a number of small diversions that supply water to Lake Plimsoll from where it is passedthrough the Tribute Power Station and discharged into the top of the Pieman Scheme.
3.4.1 Lake Burbury
The historical record for Lake Burbury is very short and occurs over a relatively wet period, thereforethe operation of this lake on a historical basis does not reflect its future operations under differingclimatic and load conditions. TEMSIM modelling showed that the level of fluctuation under a 0MWscenario was comparable to historic operations and utilised around 75% of the active storage range(Figure 3.20). The Basslink cable scenarios followed a more conservative pattern, with lessfluctuation and slightly lower lake levels than found with historical operations or the 0MW scenario.The average lake levels under all of the TEMSIM modelling (averaged over a 65 year period) waslower than historical. This can be accounted for by the relatively wet and short (seven year) period ofhistorical record.
Appendix 1: Scoping Report February 2000Environmental Services Department, Hydro Consulting
Basslink Integrated Impact Assessment Statement 60Potential Effects of Changes to Hydro Power Generation
225
227
229
231
233
235
237
1991
1992
1993
1994
1995
1996
1997
1998
Lake
Lev
el (m
)
0 MW300 MW450 MW600 MWHistorical
Figure 3.20 - Lake level time-series plot for Lake Burbury. The short period of record is due tothe recent construction of this reservoir. The top and bottom lines indicate FSLand NMOL for the storage.
225
227
229
231
233
235
0 10 20 30 40 50 60 70 80 90 100
Percentage of time level exceeded
Lake
Lev
el (m
)
0MW300MW450MW600MWHistorical 1992-98
Figure 3.21 – Lake level duration plot for Lake Burbury. The historical averages for the period1992-1998 are shown for comparison. The top and bottom lines indicate FSL andNMOL for the storage.
The 0MW scenario tended to hold Lake Burbury fuller (Figure 3.21) than any of the Basslink cablescenarios for a greater period of time, and is a function of the price curve for this lake in relation tomainland demand. The seasonality of lake levels under Basslink (Figure 3.22) remains similar tohistorical, and therefore does not present an issue.
Appendix 1: Scoping Report February 2000Environmental Services Department, Hydro Consulting
Basslink Integrated Impact Assessment Statement 61Potential Effects of Changes to Hydro Power Generation
Lake Burbury
224
226
228
230
232
234
236
Janu
ary
Februa
ryMarc
hApri
lMay
June Ju
ly
Augus
t
Septem
ber
Octobe
r
Novem
ber
Decem
ber
Lake
leve
l (m
)
0 MW300 MW450 MW600 MWHistorical 1992-98
Figure 3.22 – Average monthly lake levels for Lake Burbury based on the 65 year modellingperiod. The historical averages for the period 1992-1998 are shown forcomparison. The top and bottom lines indicate FSL and NMOL for the storage.
3.4.2 King River
As shown in the annual time series for the John Butters Power Station (Figures 3.23 and 3.24),discharges out of this power station are highly variable under current operating conditions. JohnButters plays a key role in the Hydro’s operating system as a provider of step and deficit load, and isgenerally not operated for base load power. As a consequence, the increase in provision of peak loadpower which is likely under a Basslink scenario fits in with the way John Butters has always beenoperated.
The only notable trend for the wet year time series (Figure 3.23) is a seasonal shift showing moreconsistent and higher discharge periods in winter than in summer. This is an interesting trend in that itwould mimic natural seasonal patterns more closely. This same seasonal pattern is shown for the dryyear (Figure 3.24).
The monthly median flows are shown in Figure 3.25. The historical operation of the power stationshows a bimodal pattern, with peaks in April/May (late Autumn) and Sep-Nov (Spring). The 0 MWcase shows a flattening of the peaked pattern, with a very slight peak during winter. The 300 – 600MW cable scenarios have a strong unimodal peak during the winter months, much more similar to anatural river system.
Appendix 1: Scoping Report February 2000Environmental Services Department, Hydro Consulting
Basslink Integrated Impact Assessment Statement 62Potential Effects of Changes to Hydro Power Generation
Figure 3.23 – Discharge time-series plots for John Butters Power Station during a wet year(1994) for historical operations (top), OMW, 300MW, 450MW and 600MWTEMSIM scenarios.
Appendix 1: Scoping Report February 2000Environmental Services Department, Hydro Consulting
Basslink Integrated Impact Assessment Statement 63Potential Effects of Changes to Hydro Power Generation
Figure 3.24 – Discharge time-series plots for John Butters Power Station during a dry year(1995) for historical operations (top), OMW, 300MW, 450MW and 600MWTEMSIM scenarios.
Appendix 1: Scoping Report February 2000Environmental Services Department, Hydro Consulting
Basslink Integrated Impact Assessment Statement 64Potential Effects of Changes to Hydro Power Generation
0
40
80
120
Janu
ary
Febr
uary
Mar
ch
April
May
June July
Augu
st
Sept
embe
r
Oct
ober
Nov
embe
r
Dec
embe
r
Med
ian
Flow
s (c
umec
s)TEMSIM 0MW300 MW450 MW600 MWHistorical
Figure 3.25 – Median monthly flows from the John Butters Power Station. Monthly medians ofzero indicate that the power station is operating less than 50% of the time duringthat month and does not necessary designate a total shutdown over that period.
3.4.3 Pieman-Anthony Scheme Lakes
Lake Plimsoll shows very little variation between any of the TEMSIM modelling results (Figure 3.26)and does not appear to present any Basslink related issues.
504
506
508
510
512
514
1993
1994
1996
1997
Lake
Lev
el (m
)
0 M W300 M W450 M W600 M WH is torica l
Figure 3.26 - Lake level time-series plot for Lake Plimsoll. The short period of record is due tothe recent construction of this lake. The top and bottom lines indicate FSL andNMOL for the storage.
Appendix 1: Scoping Report February 2000Environmental Services Department, Hydro Consulting
Basslink Integrated Impact Assessment Statement 65Potential Effects of Changes to Hydro Power Generation
The operation of Lake Mackintosh is very similar to historical under all TEMSIM scenarios (Figures3.27, 3.28, 3.29). The historical plot shown in Figure 3.27 utilizes most of the storages active range,however TEMSIM appears to be somewhat conservative in the management of this lake and tends tooperate slightly higher within the storage. Lake Murchison (not shown) exhibits very similarcharacteristics. Lake Rosebery is significantly constrained to an operating range of 3.4 m by anexisting lake level agreement.
Lake Mackintosh - (Levels compared since lake operation)
218
220
222
224
226
228
230
232
1980
1983
1986
1988
1991
1994
1997
Lake
Lev
el (m
)
0 MW300 MW450 MW600 MWHistoric 1980-98
Figure 3.27 - Lake level time-series plot for Lake Mackintosh. The time period shown in thisfigure (1971 - 1998) represents the operation of this lake since it was built. Thetop and bottom lines indicate FSL and NMOL for the storage.
218
220
222
224
226
228
230
0 10 20 30 40 50 60 70 80 90 100
Percentage of time level exceeded
Lake
Lev
el (m
)
0 MW300 MW450 MW600 MWHistorical 1982-98
Figure 3.28 – Lake level duration plot for Lake Mackintosh. The historical averages for theperiod 1982 - 1998 are shown for comparison. The top and bottom lines indicateFSL and NMOL for the storage.
Appendix 1: Scoping Report February 2000Environmental Services Department, Hydro Consulting
Basslink Integrated Impact Assessment Statement 66Potential Effects of Changes to Hydro Power Generation
Lake Mackintosh
218
220
222
224
226
228
230
Janu
ary
Februa
ryMarc
hApri
lMay
June Ju
ly
Augus
t
Septem
ber
Octobe
r
Novem
ber
Decem
ber
Lake
leve
l (m
)
0 MW300 MW450 MW600 MWHistorical 1982-98
Figure 3.29 – Average monthly lake levels for Lake Mackintosh. The historical averages for theperiod 1982 - 1998 are shown for comparison. The top and bottom lines indicateFSL and NMOL for the storage.
92
93
94
95
96
97
98
1986
1987
1988
1989
1990
1991
1992
1993
Lake
Lev
el (m
)
600 MW0 MW300 MW450 MWHistorical
Figure 3.30 - Lake level time-series plot for Lake Pieman. The time period shown in this figure(1986 - 1998) represents the operation of this lake since it was built. The top andbottom lines indicate FSL and NMOL for the storage.
The modelled results for Lake Pieman (Figure 3.30) also closely follow historical operations, althoughthe lake is held higher and spills more often under Basslink. The low historical lake level recorded in1990 is due to a drawdown for maintenance purposes and does not reflect normal operation. Themodelling results for this lake suffer from some of the problems discussed in section 3.1, and thisaccounts for this increased spill. In reality, it is most likely that the lake will be operated in a verysimilar pattern to historical in order to ensure maximum efficiency in the use of water from this lake.
Appendix 1: Scoping Report February 2000Environmental Services Department, Hydro Consulting
Basslink Integrated Impact Assessment Statement 67Potential Effects of Changes to Hydro Power Generation
Figure 3.31 – Discharge time-series plots for Reece Power Station during a wet year (1994) forhistorical operations (top), OMW, 300MW, 450MW and 600MW TEMSIMscenarios.
Appendix 1: Scoping Report February 2000Environmental Services Department, Hydro Consulting
Basslink Integrated Impact Assessment Statement 68Potential Effects of Changes to Hydro Power Generation
Figure 3.32 – Discharge time-series plots for Reece Power Station during a dry year (1990) forhistorical operations (top), OMW, 300MW, 450MW and 600MW TEMSIMscenarios.
Appendix 1: Scoping Report February 2000Environmental Services Department, Hydro Consulting
Basslink Integrated Impact Assessment Statement 69Potential Effects of Changes to Hydro Power Generation
The modelling results indicate that none of these lakes present issues associated with a Basslink cable,and do not warrant study as part of the environmental investigations for Basslink.
3.4.4 Reece Power Station Discharges
Historically, Reece Power Station operates similarly between wet (Figure 3.31) and dry (Figure 3.32)years. Under the 0MW scenario, the discharges tend to stay at full gate more often, but exhibit similarrates of fluctuation to the historical.
Median monthly flows (Figure 3.33) from this power station are similar for all TEMSIM scenarios,and follow the historical pattern closely. The zero median flows shown in this figure for January toMarch indicate that the power station is operated for less than 50% of the time during these months,but do not indicate a total shutdown over this period.
0
40
80
120
160
200
240
280
Janu
ary
Febr
uary
Mar
ch
April
May
June July
Augu
st
Sept
embe
r
Oct
ober
Nov
embe
r
Dec
embe
r
Med
ian
Flow
s (c
umec
s)
TEMSIM 0MW300 MW450 MW600 MWHistorical
Figure 3.33 – Median monthly flows from the Reece Power Station. Monthly medians of zeroindicate that the power station is operating less than 50% of the time during thatmonth and does not necessary designate a total shutdown over that period.
There is a small increase in the number of short-term (<12 hour) shutdown events with increasingBasslink cable size (Figure 3.34), and a slight increase in the number of 16-32 hour flow releaseevents with the larger cables (Figure 3.35).
In general there are minimal changes in the operation of the Reece Power Station arising due toBasslink, suggesting an absence of Basslink related issues for this power station.
Appendix 1: Scoping Report February 2000Environmental Services Department, Hydro Consulting
Basslink Integrated Impact Assessment Statement 70Potential Effects of Changes to Hydro Power Generation
000M W
05
10152025
1 3 5 7 9 11 16 24 32 40 48 96 144
336
>504
R elease E vent D uration (hrs)
Num
ber o
f Eve
nts
3 00M W
0
5
10
15
20
25
1 3 5 7 9 11 16 24 32 40 48 96 144
336
>504
R elease E vent D uration (hrs)
Num
ber o
f Eve
nts
4 50 M W
0
5
10
15
20
25
1 3 5 7 9 11 16 24 32 40 48 96 144
336
>504
R elease E ven t D u ra tio n (h rs)
Num
ber o
f Eve
nts
6 00M W
0
5
10
15
20
25
1 3 5 7 9 11 16 24 32 40 48 96 144
336
>504
R elease E ven t D u ratio n (h rs )
Num
ber o
f Eve
nts
Figure 3.34 – Shutdown (zero flow) event duration analysis for Reece Power Station. Barsrepresent average number of shutdown days per year for each duration category.
Appendix 1: Scoping Report February 2000Environmental Services Department, Hydro Consulting
Basslink Integrated Impact Assessment Statement 71Potential Effects of Changes to Hydro Power Generation
000M W
05
1015202530
1 3 5 7 9 11 16 24 32 40 48 96 144
336
>504
R elease E vent D uration (hrs)
Num
ber o
f Eve
nts
3 00M W
05
1015202530
1 3 5 7 9 11 16 24 32 40 48 96 144
336
>504
R elease E vent D uration (hrs)
Num
ber o
f Eve
nts
4 50 M W
05
1015202530
1 3 5 7 9 11 16 24 32 40 48 96 144
336
>504
R elease E ven t D u ra tio n (h rs)
Num
ber o
f Eve
nts
6 00M W
05
1015202530
1 3 5 7 9 11 16 24 32 40 48 96 144
336
>504
R elease E ven t D u ratio n (h rs )
Num
ber o
f Eve
nts
Figure 3.35 – Event (above 0 cumecs) duration frequency analysis for Reece Power Station. Barsrepresent average number of shutdown days per year for each duration category.
Appendix 1: Scoping Report February 2000Environmental Services Department, Hydro Consulting
Basslink Integrated Impact Assessment Statement 72Potential Effects of Changes to Hydro Power Generation
3.5 Derwent Catchment
The Derwent catchment consists of a long sequence of run-of-river power stations fed by twoheadwater storage chains. Lake St. Clair and Lake King William are at the head of the naturalDerwent River and form one of these storage chains. Lake Echo feeds into Dee Lagoon, Bradys Lake,Lake Binney and Tungatinah Lagoon to form the other main head storage. There are also numerousdiversions, canals and pipelines within the upper parts of this catchment. The main cascade sequenceof lakes and power stations begins at Lake Liapootah and follows through Wayatinah Lagoon, LakeCatagunya, Lake Repulse, Cluny Lagoon and Lake Meadowbank before discharge to the lowerDerwent River via Meadowbank Power Station. There is a significant length of river below this lastdam extending downstream to Hobart and the Derwent Estuary.
3.5.1 Storages
The complexity of the Derwent system and the relatively small size of most of the storages make itvery difficult to model the effect of operation changes accurately. The numerous interactions betweenthe upper storages mean that generation has to be balanced effectively to optimally utilise thesestorages. The TEMSIM model does not fully optimise the management of these lakes.
Modelling data have only been presented for the two major head storages within this catchment. LakeKing William (Figure 3.36) is held higher under TEMSIM modelling than it has been historically,suggesting that this lake is not being used as efficiently as it could be for water storage and powergeneration. This is also true for Lake Echo (Figure 3.37), however recent operation of this lake hasbeen more conservative than before the 1970s.
690
695
700
705
710
715
720
725
1968
1970
1972
1974
1976
1978
1980
1982
1984
1986
1988
1990
1992
1994
1996
1998
Lake
Lev
el (m
)
0 MW300 MW450 MW600 MWHistorical
Figure 3.36: Lake level time-series plot for Lake King William. The time period shown in thisfigure (1968 - 1998) represents the operation of this lake since it was built. Thetop and bottom lines indicate FSL and NMOL for the storage.
Appendix 1: Scoping Report February 2000Environmental Services Department, Hydro Consulting
Basslink Integrated Impact Assessment Statement 73Potential Effects of Changes to Hydro Power Generation
830
832
834
836
838
840
842
844
846
848
1951
1954
1957
1960
1963
1966
1969
1972
1975
1978
1981
1984
1987
1990
Lake
Lev
el (m
)
0 M WH is to rica l30 0 M W45 0 M W60 0 M W
Figure 3.37 - Lake level time-series plot for Lake Echo. The time period shown in this figure(1951 - 1998) represents the operation of this lake since it was built. The top andbottom lines indicate FSL and NMOL for the storage.
The TEMSIM model provides good indicative information for the header lakes, but the sequence ofsmall to medium sized run-of-river power stations in the cascade has not been properly optimised bythe TEMSIM model. In reality, the lakes down the cascade are likely to be managed very similarly topresent, and are not expected to change significantly with the connection of a Basslink cable. LakeMeadowbank, the lowest in the cascade sequence, has a lake level agreement. There are not believedto be any Basslink related issues in relation to the Derwent storages, and existing environmental issueswill be addressed through the Hydro’s Water Management Review process. The Hydro is committedto ensuring sustainable management of all of its waterways, and will continue to abide by any existinglake level agreements.
3.5.2 Meadowbank Power Station Discharges
Meadowbank Power Station is the last in the run-of-river cascade on the Derwent River. Much of itsoperation is governed by the requirement to maintain a continuous 20 cumec flow down the river forthe control of salinity intrusion downstream at Fletcher Challenge Paper and Bryn Estyn (Hobart watersupply) intakes. Provision of the minimum 20 cumec flow is maintained during power stationmaintenance by releasing water through a riparian valve.
Despite some of the problems relating to modelling of the Derwent system, it is not envisaged thatthere will be any significant environmental issues below Meadowbank Power Station associated withintroduction of Basslink.
3.6 Mersey-Forth Catchment
The Mersey-Forth power development harnesses the waters of the Mersey, Forth, Wilmot and FisherRivers. Similar to the Derwent catchment, this scheme consists of two main head storages (LakeMackenzie and Lake Rowallan) and a run-of-river series of stepped lakes (Lakes Cethana, Barringtonand Paloona). The Wilmot River is diverted to Lake Cethana by Wilmot Dam (Lake Gairdner). LakeParangana is a medium storage that receives the waters of Rowallan and Fisher Power Stations before
Appendix 1: Scoping Report February 2000Environmental Services Department, Hydro Consulting
Basslink Integrated Impact Assessment Statement 74Potential Effects of Changes to Hydro Power Generation
diverting water to Lake Cethana. Discharge from the whole scheme is via Paloona Power Station tothe Forth River.
3.6.1 Storages
Results for Lake Rowallan showed that when modelled under TEMSIM, the lake behaved verysimilarly to historical operations. TEMSIM did not attain the extremely low lake levels featured inthe historical record (Figure 3.38), and indicates generation bids from Rowallan Power Station in theTEMSIM model were not low enough in comparison to other competitors in the market. This resultsin more conservative management of Lake Rowallan. The lake level duration plot (Figure 3.39)shows that the TEMSIM runs hold the lake slightly lower than historical in the top part of the lake’sactive range, leading to fewer spills. The Basslink cables draw the lake down slightly more than the0MW case, showing that water is sold off with Basslink when the storage is above its EOL.
4 6 5
4 6 7
4 6 9
4 7 1
4 7 3
4 7 5
4 7 7
4 7 9
4 8 1
4 8 3
4 8 5
4 8 7
4 8 9
1967
1969
1971
1973
1975
1977
1979
1981
1983
1985
1987
1989
1991
1993
1995
1997
Lake
Lev
el (m
)
0 M W3 0 0 M W4 5 0 M W6 0 0 M WH is to r ic a l
Figure 3.38 - Lake level time-series plot for Lake Rowallan. The time period shown in this figure(1967 - 1998) represents the operation of this lake since it was built. The top andbottom lines indicate FSL and NMOL for the storage.
There is a slight shift in the average seasonal variations of the lake under the 0MW and Basslink cablescenarios (Figure 3.40). This is similar to other medium storages that were modelled, which produceda peak approximately one month earlier than historical operation. This is not considered to raise anysignificant environmental issues.
Appendix 1: Scoping Report February 2000Environmental Services Department, Hydro Consulting
Basslink Integrated Impact Assessment Statement 75Potential Effects of Changes to Hydro Power Generation
466
468
470
472
474
476
478
480
482
484
486
488
0 10 20 30 40 50 60 70 80 90 100
Percentage of time level exceeded
Lake
Lev
el (m
)
Historical 1967-980 MW300 MW450 MW600 MW
Figure 3.39 – Lake level duration plot for Lake Rowallan. The historical averages for the period1967 - 1998 are shown for comparison. The top and bottom lines indicate FSLand NMOL for the storage.
466
470
474
478
482
486
Janu
ary
Februa
ryMarc
hApri
lMay
June Ju
ly
Augus
t
Septem
be
Octobe
r
Novem
be
Decem
be
Lake
leve
l (m
)
0 MW300 MW450MW600MWHistoric 1968-98
Figure 3.40 – Average monthly lake levels for Lake Rowallan. The top and bottom lines indicateFSL and NMOL for the storage.
Lake Gairdner behaves similar to historical trends in the TEMSIM model. Most of the active range ofthe lake is utilised as is the case presently (Figure 3.41). The lake level duration curves (Figure 3.42)show that the lake is held more consistently in the middle ranges of its storage with Basslink thanunder the 0MW or historical scenarios. The deviation between the 0MW and Basslink cables is due tothe ability of the cable to import electricity when the lakes are approaching their EOLs. There are nosignificant variations between the various Basslink scenarios, indicating that cable size does notinfluence the management of this lake. The analysis of lake level seasonality (Figure 3.43) shows that
Appendix 1: Scoping Report February 2000Environmental Services Department, Hydro Consulting
Basslink Integrated Impact Assessment Statement 76Potential Effects of Changes to Hydro Power Generation
the lake is historically variable throughout the year, but is maintained higher during the warmermonths with TEMSIM. No environmental issues appear to be raised by this mode of operation.
4 6 0
4 6 2
4 6 4
4 6 6
4 6 8
4 7 0
4 7 2
4 7 4
1970
1972
1974
1976
1978
1980
1982
1984
1986
1988
1990
1992
1994
1996
1998
Lake
Lev
el (m
)0 M W3 0 0 M W4 5 0 M W6 0 0 M WH is to r ic a l
Figure 3.41 - Lake level time-series plot for Lake Gairdner. The time period shown in this figure(1970 - 1998) represents the operation of this lake since it was built. Top andbottom lines indicate FSL and NMOL.
460
462
464
466
468
470
472
0 10 20 30 40 50 60 70 80 90 100
Percentage of time level exceeded
Lake
Lev
el (m
)
Historical 1971-980 MW300 MW450 MW600 MW
Figure 3.42 – Lake level duration plot for Lake Gairdner. The historical averages for the period1971 -1998 are shown for comparison. The top and bottom lines indicate FSL andNMOL for the storage.
Lake Barrington is held higher under the Basslink model than has been shown by historicalmanagement of the lake (Figure 3.44). The 0MW scenario occasionally draws the lake down closer toNMOL, and signifies acceptance of high priced generation bids from Devils Gate Power Station.Figure 3.45 illustrates the similarities in water level management of the lake in the upper part of the
Appendix 1: Scoping Report February 2000Environmental Services Department, Hydro Consulting
Basslink Integrated Impact Assessment Statement 77Potential Effects of Changes to Hydro Power Generation
storage, and indicates slightly more spill when the level exceeds the FSL. The Basslink scenarios areclearly shown here to hold the lake above ~120 m. Monthly average levels (Figure 3.45) indicate thatthe lake is maintained at similar average levels year round. Based on the results of this modellingthere are no issues relating to Lake Barrington that warrant detailed environmental studies in relationto Basslink.
116
118
120
122
124
1969
1971
1973
1975
1977
1979
1981
1983
1985
1987
1989
1991
1993
1995
1997
Lake
Lev
el (m
)
0 M WH is to rica l300 M W450 M W600 M W
Figure 3.43 - Lake level time-series plot for Lake Barrington. The time period shown in thisfigure (1969 - 1998) represents the operation of this lake since it was built. Thetop and bottom lines indicate FSL and NMOL for the storage.
116
118
120
122
124
0 10 20 30 40 50 60 70 80 90 100Percentage of time level exceeded
Lake
Lev
el (m
)
0MW300 MW450 MW600 MWHistorical
Figure 3.44 – Lake level duration plot for Lake Barrington. The historical averages for theperiod 1971-1998 are shown for comparison. The top and bottom lines indicateFSL and NMOL for the storage.
Appendix 1: Scoping Report February 2000Environmental Services Department, Hydro Consulting
Basslink Integrated Impact Assessment Statement 78Potential Effects of Changes to Hydro Power Generation
Lake Barrington
116
117
118
119
120
121
122
123
Janu
ary
Februa
ryMarc
hApri
lMay
June Ju
ly
Augus
t
Septem
ber
Octobe
r
Novem
ber
Decem
ber
Lake
leve
l (m
)
0 MW300 MW450MW600MWHistorical 1971- 98
Figure 3.45 – Average monthly lake levels for Lake Barrington based on the 65 year modellingperiod. The historical averages for the period 1971-1998 are shown forcomparison. The top and bottom lines indicate FSL and NMOL for the storage.
3.6.2 Downstream Discharges for the Mersey-Forth
The TEMSIM model did not adequately model discharges from Paloona Power Station nor the likelyfrequency of spill events over Paloona Dam. This is largely due to the run-of-river schedulingproblems described in Section 3.1 and will be refined as part of the system model development workbeing undertaken by the Hydro.
Paloona Power Station startups are staged (ramped) in order to give downstream users warning ofrising water levels to maximise the safety of users downstream. Once loaded, the station is run toensure water supply for the North West Regional Water Authority and in the interests of public safety.This pattern of operation is unlikely to change under Basslink.
3.7 Summary
It is apparent from the modelled results presented in this chapter that the most significant changes toHydro waterways will be downstream of the major storages in the system. Discharges out of both theGordon and Poatina Power Stations are likely to show the same trends under Basslink. Notably, theseare:
• increased short-term variability in flow discharges;
• increased frequency of short duration (and weekend) shutdowns; and
• changes in the seasonality of flows.
Changes in the seasonal nature of discharges out of the John Butters Power Station are indicated, andpossibly some alterations in the already highly variably pulses of discharge.
No significant changes in lake level are indicated by the modelled results for any of the lakes withinthe Hydro’s generating system. Modelling has shown that these lakes are managed similarly tohistorical patterns. In addition, many lakes are currently constrained by lake level agreements. Theseconstraints will continue in operation after the commissioning of Basslink. The present lake level
Appendix 1: Scoping Report February 2000Environmental Services Department, Hydro Consulting
Basslink Integrated Impact Assessment Statement 79Potential Effects of Changes to Hydro Power Generation
agreements will be reviewed and assessed in relation to environmental and social issues as part of theWater Management Review process that the Hydro is engaging in with Department of PrimaryIndustries, Water and Environment.
Some areas of the Hydro system could not be modelled effectively by TEMSIM. These areas includethe downstream reaches of run-of-river cascades with small to medium power stations, and thebalancing of multiple head storages (in both the Derwent and Mersey-Forth catchments). Thesemodelling issues are being addressed by the Hydro. It is considered unlikely that minor adjustmentsrequired for the model will raise issues not already identified in this chapter. As a guiding principle,the Hydro recognises the ecological and multiple use values of all of its waterways and will ensurethat these areas are managed sustainably into the future through its Water Management Reviewprocess.
Appendix 1: Scoping Report February 2000Environmental Services Department, Hydro Consulting
Basslink Integrated Impact Assessment Statement 80Potential Effects of Changes to Hydro Power Generation
4 ENVIRONMENTAL ISSUES4.1 Overview
From the analysis of the modelling results, changes in the Hydro operating system under a Basslinkcable primarily affect discharges out of the Gordon and Poatina Power Stations, and to a lesser degreeout of the John Butters Power Station. The Gordon and Poatina Power Stations are likely toexperience increased short-term variability in flow discharges, increased frequency of short duration(and weekend) shutdowns, and changes in the seasonality of flows. Changes in the seasonal nature ofdischarges out of the John Butters Power Station are indicated, and possibly some alterations in thealready highly variably pulses of discharge. Notably, the magnitude of releases from any of the powerstations will be no greater than the present full gate capacities.
The expected hydrological changes may have consequences for aquatic biota, fluvial geomorphology,water quality and other users of the waterways.
This chapter discusses the environmental implications of the changes in flow regimes observed as aresult of the introduction of Basslink. It addresses downstream of the Gordon Power Station, thePoatina Power Station and the John Butters Power Station in turn. It describes the key environmentalissues in these waterways, and how they may be affected by the hydrological changes anticipated byBasslink. The following chapter will describe the environmental investigations planned in thesewaterways to more definitively quantify the environmental issues and management options.
4.2 Downstream Gordon Power Station
4.2.1 Introduction
Almost the entire catchment of the Gordon Power Scheme and the Gordon River downstream ofGordon Dam (Figure 4.1) are within either the Franklin-Gordon Wild Rivers National Park or theSouth-West National Park. These National Parks form part of the Tasmanian Wilderness WorldHeritage Area (WHA). The key uses of the Gordon River downstream of the Gordon Dam aretourism, recreation and wilderness experiences. In the lower Gordon River area, tourist boat tours andscenic wilderness flights are popular, and rafting and canoeing trips are conducted on the tributaryrivers such as the Franklin River. A key overarching issue in the Gordon River is to ensure that anyenvironmental impacts attributed to the Basslink development do not jeopardise the natural andcultural heritage values for which this area was nominated as a WHA.
A number of fundamental environmental changes to the Gordon River occurred as a result ofconstruction and operation of the Gordon River power scheme. Because of the remoteness andinaccessibility of particularly the middle Gordon River (downstream of the Gordon Dam), theenvironmental effects of the dam development itself are not well quantified. In these investigations,the environmental issues that may arise due to Basslink must be separated out from those which areattributed to the dam development.
Appe
ndix
1: S
copi
ng R
epor
tFe
brua
ry 2
000
Envi
ronm
enta
l Ser
vice
s Dep
artm
ent,
Hyd
ro C
onsu
lting
Bass
link
Inte
grat
ed Im
pact
Ass
essm
ent S
tate
men
t81
Pote
ntia
l Effe
cts o
f Cha
nges
to H
ydro
Pow
er G
ener
atio
n
Figu
re 4
.1 –
Dow
nstr
eam
of G
ordo
n Po
wer
Sta
tion
Appendix 1: Scoping Report February 2000Environmental Services Department, Hydro Consulting
Basslink Integrated Impact Assessment Statement 82Potential Effects of Changes to Hydro Power Generation
In evaluation of the modelling results and discussions with specialists, the issues of geomorphology,cultural heritage, instream ecological health, ecological health of the meromictic lakes, water qualityand public use are considered the key environmental issues which are subject to alterations underBasslink.
4.2.2 Geomorphology
Erosion in the lower tidal section of the Gordon River is considered a major geomorphic issue. Thesebanks have been extensively mapped and monitored by Bradbury et al. (1995). The Tasmanian Parksand Wildlife Service attributes the bank erosion most predominantly to boat wakes from touristvessels, as the Hydro influence on water levels so far downstream of the Gordon Power Station isminimal.
The shift from a predominantly base load power station operation during summer months to a morestep load dominated operation throughout the year may have implications for the geomorphology ofthe Gordon River. The key area of risk is that the increase in rapid fluctuation (hydro-peaking) on-offpower station discharges will exacerbate sediment bank erosion. In consultation with the Parks andWildlife Service, it was agreed that geomorphic investigations related to Basslink should be conductedin the middle Gordon River, from the Gordon Dam down to the Franklin River tributary (Figure 4.1).
Hydro-peaking can contribute to river bank erosion in situations where water tables are left suspendedwithin cohesive banks during rapid river level drawdown. Depending on the exact composition andpermeability of the banks, these can be prone to slumping as water drains out of the banks toward theriver channel. This fallen material may be mobilised by the next high flow event, leading to increasedrates of bank retreat and sediment transport.
Key questions related to the risk of draw-down induced erosion which must be answered in fieldinvestigations are:
• Is river level drawdown a dominant bank erosion mechanism given the composition andpermeability of the Gordon River sediment banks; and
• Do the frequency and rates of river level drawdown vary under a Basslink scenario as compared topresent?
Geomorphic investigations in the Gordon River must seek to understand the current geomorphicprocesses that are occurring in the post-dam river. Depending on the bank materials and channelhydraulics, transport of river bank sediments may be driven more by prolonged high flow events thanby fluctuations in river level. Transport of the river bed material depends on exceedance of the criticalshear stress, a parameter strongly influenced by the particle diameter and the water surface slope; dothese sediment transporting events increase or decrease with the Basslink scenarios? The dominantprocesses are likely to vary with distance downstream as natural tributary inflows dilute the influenceof the power station. The zone of impact due to the power station under current conditions must bediscerned, and any adjustments to this current zone of impact due to Basslink predicted.
In relation to all these questions, it is critical to understand the downstream propagation of the flowwave created by the turning on of the power station, and how this propagation is influenced byincreased fluctuations in power station discharges.
Another geomorphic question, which will need to be addressed, relates to the occurrence of tributaryrejuvenation, which is channel adjustment at tributary mouths in response to changed flow regimes(Germanoski & Ritter 1988). If such a process is identified as occurring in any of the Gordon Rivertributaries, the potential for exacerbation of this process due to Basslink must be considered in theBasslink environmental investigations.
Appendix 1: Scoping Report February 2000Environmental Services Department, Hydro Consulting
Basslink Integrated Impact Assessment Statement 83Potential Effects of Changes to Hydro Power Generation
The increased operation of the Gordon Power Station in winter will alter the flood frequency statisticsfor the Gordon River, with consequent effects on the sediment transporting events in the river.Alterations to current geomorphic processes associated with alterations to the flooding regime willneed to be investigated.
Finally, there are notable occurrences of karst in the Gordon and Franklin River systems, withassociated cave features and cave fauna. Geomorphic investigations into Basslink must consider anypossible affects on these karst features.
An issue interlinked with geomorphological changes is that of the preservation of cultural heritageartefacts. No systematic surveys have been carried out in the Gordon River, and the only evidence ofAboriginal occupation is a chance find artefact scatter just upstream of the junction with the DenisonRiver (Collett 1996). However, a number of the Gordon River tributaries have undergone surveys,including the Franklin and Denison rivers, and these have shown significant evidence of Aboriginaloccupation and use of the area (Blain et al. 1983; Jones et al. 1983; Kiernan et al. 1983, all cited inCollett 1996). Because of these surveys it is considered likely that the Gordon River was used in asimilar fashion, and any implications of a Basslink development on cultural heritage artefacts in theGordon River will need to be assessed.
4.2.3 Instream Ecological Health
Recent work by Davies et al. (1999) has shown that the diversity of invertebrates sampled from riffleareas within the Gordon River is reduced in the reaches immediately downstream of the power stationcompared to other river reaches in the catchment. Diversity gradually increases below the confluenceof other tributaries, in particular the Denison River (Figure 4.1). Clearly the power station operationaffects instream biota, however, the extent of its influence downstream is not yet known.
Increased flow fluctuations due to hydro-peaking are known to put stresses on aquatic organisms inrivers. They create changes in aquatic habitat availability, shear-stress fluctuations on the bed of theriver, stranding of organisms during rapid drawdown and disruption of flow and water quality relatedcues that trigger biological responses (such as breeding behaviour) in aquatic organisms. Thesechanges in combination with changes in seasonality have the potential to further alter the biota of theGordon River.
As with the geomorphological issues, it is critical to understand downstream propagation of the flowwave created by the turning on of the power station to quantify any likely changes to key hydraulicparameters such as bed shear stresses. It will be important to make predictions on any alterations tothe existing zone of impact which may be attributed to Basslink operations. Alterations to the existingzone may in fact vary seasonally, and the implications of the seasonal alterations in flow on theinstream biota will need to be identified.
The work of Davies et al. (1999) will need to be extended as part of the Basslink assessment processto include more sites below the Denison River, and to incorporate sampling of other major instreamhabitats for both invertebrates and fish. In order to address issues of aquatic habitat availability withinthe river channel, cross-sectional habitat and hydraulic surveys using methods such as Instream FlowIncremental Methodology (IFIM) or related techniques should be employed (Bovee, 1982). Shearstress conditions, which dictate biotic impacts on biota from hydro ‘peaking’ operations, should alsobe assessed in key bar-riffle habitats during typical peak on-off sequences. These observations shouldbe used to assist in recommending flow recession or ‘ramping’ rates to minimise impacts on instreambiota.
A number of rare species of plant and birdlife occur within the Gordon River catchment, but there areno rare, threatened or vulnerable species currently reported from the Gordon River or immediateenvirons that might be affected by Basslink. Major exceptions are the unique microbial and planktonic
Appendix 1: Scoping Report February 2000Environmental Services Department, Hydro Consulting
Basslink Integrated Impact Assessment Statement 84Potential Effects of Changes to Hydro Power Generation
species found in the lower Gordon meromictic lakes. The issues associated with these lakes arediscussed in the following section.
4.2.4 Meromictic Lakes
The lower Gordon River contains several unique, highly stratified meromictic lakes of globalconservation significance. These lakes are characterised by a saline water layer overlain by afreshwater layer. ‘Recharge’ of these lake systems with semi-saline water from the Gordon River iscritical to their ecological integrity, as unique microbial and planktonic life forms are dependent on thestable stratification of these dark water lakes. In addition, the stratified waters have protected thefragile layering of silt on the bottom of these lakes which contains a valuable palaeolimnologicalrecord of particularly high resolution (Bowling & Tyler, 1984).
Recharge is dependent on three critical events which provide an appropriate combination of tidalconditions and river flows for saline water to flow into the lakes and maintain their meromictic state.The three conditions required for recharge to occur are as follows:
1. salt wedge penetration upstream in the vicinity of the lakes;
2. turbulent mixing of the salt wedge into the upper water column; followed by
3. high river levels to ensure flow from the river into the lakes.
Tyler (1986) and Hodgson & Tyler (1996) assessed the effects of Gordon Power Station operations onthe stability of lake meromixis. They concluded that meromixis has declined and become moreunstable in Lake Fiddler, Sulphide Pool and Lake Morrison since the mid-1970’s, due to operation ofthe Gordon Power Station. They recommended a management strategy for recharging these lakes andmaintaining their meromictic state that requires:
• a power station shutdown during periods of low river flows (summer – autumn); and
• an ensuing power station startup timed so that flow would occur from the river into the lakes.
These previous studies have demonstrated that the Gordon meromictic lakes have been negativelyimpacted by the flow regulation resulting from the operation of the Gordon Power Station to providebase-load during the summer months. This has limited the penetration of the salt wedge into theGordon Estuary. Hodgson & Tyler (1996) observed that only limited recharge has occurred duringGordon Power Station shutdown events. Current historical and the modelled 0MW scenario shutdownevents occur primarily during late winter and spring (August to October) when run-of-river stationsare capable of supplying maximum power.
Power station maintenance under Basslink is likely to be more flexible in both timing and duration (S.Stolp, Hydro, pers. comm.). Thus, maintenance scheduling may be able to occur during summer lowflows. This presents a potential environmental benefit for restoring and/or maintaining meromixis inthese internationally significant World Heritage Area lakes.
Carefully planned re-scheduling of maintenance shutdown events under Basslink may result in asignificant benefit. The possibility of managing meromictic stability through pumping of saline waterhas not been investigated, and may also be an effective management option. However, it would bepreferable to facilitate natural recharge mechanisms to remain consistent with the values of a WorldHeritage Area. The potential for enhancement of the natural recharge mechanisms in the Gordonmeromictic lakes under Basslink should be investigated as part of the Basslink environmental studies.
Appendix 1: Scoping Report February 2000Environmental Services Department, Hydro Consulting
Basslink Integrated Impact Assessment Statement 85Potential Effects of Changes to Hydro Power Generation
4.2.5 Water Quality
There are three identified water quality issues associated with flow regulation in the Gordon River.These are release of anoxic water, upstream migration of the saline wedge, and mercuryconcentrations.
Lake Gordon has been identified as having the ability to stratify, and first stratified during constructionwith a layer of oxygen deficient water forming at about the same depth as the intake. Release ofanoxic water through the power station may raise environmental problems downstream, although nonehave been identified to date. Bowles (1998) recently documented the seasonal stratification in LakeGordon, and describes the mechanisms by which it forms and the factors that influence it. Lake levelvariations in Lake Gordon attributed to Basslink are relatively minor, but the implications of these inconjunction with the increased variability in power station discharges on release of anoxic water needsto be addressed.
Alterations to upstream migration of the saline wedge arising from Basslink predominantly raiseissues associated with the meromictic lakes, which have been discussed in the previous section and areplanned to be investigated in the Basslink environmental studies.
Lake Gordon has naturally high levels of mercury, which overall is within safe limits. Mercury inwaters discharged out of the Gordon Power Station are not believed to be a significant environmentalissue, but should be considered in any water quality assessment (Bowles 1998).
The aquaculture industry in Macquarie Harbour is reliant on clean flows from the Gordon River tomaintain water quality. The Gordon River dilutes the polluted flows from the King River.Aquaculture activities within Macquarie Harbour have generally been concentrated on the southernside of the harbour mouth to take advantage of the flushing effect of the cleaner Gordon River water inthis area. The Basslink water quality investigations should confirm that the altered operations of theGordon and John Butters Power Stations which are predicted by the TEMSIM modelling will notcreate water quality risks for the Macquarie Harbour aquaculture industry.
4.2.6 Public Use
The water resources in the Gordon catchment are under less pressure from multiple uses than are mostother waters in the State, as the region is virtually unpopulated. Wilderness tourism, recreation andaquaculture in Macquarie Harbour are the major uses. Wilderness appreciation is the main focus ofrecreational activities in the Gordon River and its tributaries.
No particular public use studies are proposed as part of the Basslink environmental investigations,because the anticipated changes due to Basslink affect the middle Gordon River which is largelyinaccessible. Visitation rates to the middle Gordon are minimal, due in part to restricted access,rafting is recognized as dangerous in the middle Gordon as a result of the existing fluctuating flowregime, and warnings about fluctuating flow levels are posted at major access points.
Safety for recreational fishers and tourists in the lower Gordon River is unlikely to be compromiseddue to Basslink, as changes in levels resulting from power station releases under present operations areminimal so far downstream of the dam.
Extreme changes in flows as experienced below hydro-peaking stations can result in the decline of fishpopulations due to loss of stable rearing and spawning habitat conditions. Recreational fishing in thelower Gordon catchment is largely focussed on brown trout fishing in the tidal reaches. It is unlikelythat trout and native fish populations found in the lower Gordon River will be adversely affected bychanges in upstream flow regimes resulting from Basslink. Examination of relationships between
Appendix 1: Scoping Report February 2000Environmental Services Department, Hydro Consulting
Basslink Integrated Impact Assessment Statement 86Potential Effects of Changes to Hydro Power Generation
rearing and spawning habitat for native fish and trout and flows would assist in evaluating this issuefurther, and will be conducted as part of the studies on instream ecological health.
4.2.7 Summary of Gordon River Environmental and Social Investigations
In summary, the planned environmental investigations into the effects of the Basslink cable on theGordon River will address geomorphology, instream ecological health, meromictic lakes, waterquality and cultural heritage issues.
In order to maintain its reputation as an environmentally responsible supplier of renewable energy, theHydro will be addressing any current (i.e. not associated with Basslink) management issues associatedwith the Gordon catchment in its Water Management Review process. As previously stated, this is along-term strategy with a goal to develop community-accepted Water Management Plans under thenew Water Management Act 1999. As part of this commitment, the Hydro is continuing to monitorwater quality and other aspects of the ecology of Lake Gordon and Lake Pedder through its AquaticEnvironment Program.
4.3 Downstream Poatina Power Station
4.3.1 Introduction
In contrast to the unpopulated and unmodified nature of the Gordon River catchment, the riversdownstream of the Poatina Power Station are in highly modified catchments. The primary land usedownstream of the Poatina Power Station is agriculture. Water abstractions for agricultural irrigation,domestic purposes, township supplies and even aquaculture occur in Brumbys Creek, the MacquarieRiver and the South Esk River downstream of Poatina Power Station. The riparian zones of thesestreams are highly modified due to clearing, invasion of willows, bank erosion and stock access.
The most fundamental change downstream since the commissioning of Poatina Power Station hasbeen greatly increased flow volumes discharged into the river systems, due to the diversion of GreatLake water into this catchment area. The response of the downstream rivers to the Poatina PowerStation discharges is complicated by the influence of the numerous other variables, which have beenmodified by human uses. As with the Gordon River studies, environmental issues that may arise dueto Basslink must be separated out from those that are attributed to the Poatina power developmentitself.
In evaluation of the modelling results and discussions with specialists, geomorphology, culturalheritage, instream ecological health, water quality and public use issues are considered the keyenvironmental issues which are subject to alterations under Basslink. These are discussed in thefollowing sections in turn.
4.3.2 Geomorphology
Discharges from Poatina Power Station flow through the Poatina tailrace and into Brumbys Creek,which is now a major tributary of the lower Macquarie River (Figure 4.2). Bank erosion due toenhanced discharge and fluctuating water levels has been a significant issue in Brumby’s Creek for thehistorical pattern of power station discharges. Major channel adjustment has occurred since 1964,with the addition of large volumes of high velocity, low turbidity alpine water to what was a small,lowland agricultural stream.
Much of this was anticipated by the then Hydro-Electric Commission, which purchased much of theland adjacent to Brumbys Creek during the 1960’s. Landowners adjacent to Brumbys Creek haveexpressed concerns regarding bank erosion and sedimentation for a number of years and in recent
Appendix 1: Scoping Report February 2000Environmental Services Department, Hydro Consulting
Basslink Integrated Impact Assessment Statement 87Potential Effects of Changes to Hydro Power Generation
years the Upper Brumbys Landcare group has been formed. In response to existing issues, arehabilitation and management plan was prepared in December 1998. This report aimed to identifyand quantify the problems as well as to investigate and describe options for rehabilitation or mitigationstrategies. During 1999, the Hydro also initiated activities on weed management.
Rapid, short-term fluctuations in discharge are known to cause bank slumping and collapse in alluvialriver channels, the primary factor being the frequency of occurrence and rate of flow decline (Simons& Li 1982). The potential for further bank erosion and channel adjustment under Basslink in bothBrumbys Creek and the lower Macquarie River requires further evaluation. Modelling results for theBasslink cable scenarios indicate that there will be more intermittency in flows with a greater numberof short-term low flows. This represents a change to a more erosive flow regime, given that the majorareas of erosion are immediately downstream of the power station tailrace canal discharge.
Appendix 1: Scoping Report February 2000Environmental Services Department, Hydro Consulting
Basslink Integrated Impact Assessment Statement 88Potential Effects of Changes to Hydro Power Generation
Figure 4.2 – Downstream of Poatina Power Station
Appendix 1: Scoping Report February 2000Environmental Services Department, Hydro Consulting
Basslink Integrated Impact Assessment Statement 89Potential Effects of Changes to Hydro Power Generation
As discussed for the Gordon River, it is important to ascertain the downstream propagation of the flowreleases out of the Poatina Power Station. There are three weir ponds in the downstream part ofBrumbys Creek which may dampen much of the flow variability, which would mean that the erosiveeffects of this change to the discharge pattern is largely confined to discrete sections of BrumbysCreek.
If flow variability affects downstream of Brumbys Creek into the Macquarie River, it will benecessary to understand the role of drawdown on these sediment banks. Bank erosion and channelchanges have been long observed on the Macquarie River, and it will be important to discern the roleof flow regulation on erosive processes.
Flooding is a key issue downstream of the Poatina Power Station, and will need to be assessed in thegeomorphic studies because of the ensuing channel changes which can occur during times of flood.With the increased operation of the power station in winter, there is the potential to exacerbate winterfloods in the Macquarie and South Esk rivers. The Hydro has an existing flood rule which curtails theoperation of Poatina during times of flood, and because flood restrictions would remain in place underBasslink it is unlikely that there will be any changes to the major floods. It is likely that there will bean increased incidence of bankfull (i.e. the water level will reach to the top of the river bank) releasesduring the winter period which has implications for the geomorphology, and this will need to beassessed.
Associated with channel erosion is the potential for cultural heritage sites to be impacted. Consultationwith the Cultural Heritage Branch of the Parks and Wildlife Service indicated an area of Holocenesandsheets which have the potential to contain cultural heritage sites (Don Ranson, Manager CulturalHeritage Branch, 2 August 1999). Consequently, cultural heritage investigations downstream of thePoatina Power Station are planned to be included as part of the Basslink environmental investigations.
4.3.3 Instream Ecological Health
An increased incidence of low flow events and flow pulses may result in some loss of habitat as wellas a decline in habitat suitability for invertebrates, fish and platypus in Brumbys Creek. The extent ofchanges in habitat availability in Brumbys Creek and the lower Macquarie and South Esk Riversrequires evaluation. Changes in seasonality also need to be considered. The potential for mitigatingthe impact of changes in flow regimes on the Brumbys Creek fishery by physical habitat manipulationshould be assessed.
Changes to channel form through bank erosion are known to impact on bank-associated fauna andflora. A species of burrowing crayfish, Engaeus nulloporius, is endemic to the lower Macquarie,South Esk and west Tamar valleys. Enhancement of bank erosion in the lower Macquarie and SouthEsk Rivers may impact on the status of this species, and this should be considered in the Basslinkinvestigations.
4.3.4 Water Quality
Water quality downstream of Poatina Power Station is generally considered to be good, particularlywhen the power station is discharging because the water quality in the Great Lake storage is relativelypristine. Releases into Brumbys Creek are often cooler than the surrounding streams because GreatLake is situated at a much higher elevation.
Water quality issues in the agricultural catchments downstream of Poatina include turbidity andelectrical conductivity (EC), and these are most notable when Poatina is not discharging water.Unacceptable levels of faecal indicators have been found in the Macquarie River where stock havedirect access to the river. Turbidity due to bank erosion is the only water quality issue which could bedirectly linked to Hydro operations, and in general the Hydro improves water quality through dilution.
Appendix 1: Scoping Report February 2000Environmental Services Department, Hydro Consulting
Basslink Integrated Impact Assessment Statement 90Potential Effects of Changes to Hydro Power Generation
Because water quality is an issue of concern to stakeholders in the rivers downstream of Poatina, anassessment will be made in these Basslink investigations of changes to water quality which may arisedue to Basslink. These changes may in fact be positive if Poatina discharges more regularlythroughout the year.
4.3.5 Public Use
In this highly modified catchment area, there are multiple uses of the waterways affected by Poatina.These can be grouped into broadly into abstractive uses, which includes agriculture, irrigation,industry, township and domestic water supply (Figure 4.2); and recreational uses which includesboating and fishing. Each is discussed in turn.
4.3.5.1 Abstractive Uses
Downstream water entitlements for irrigation vary, and will be converted into licences under theWater Management Act 1999. The main abstraction for irrigation in Brumbys Creek is from theCressy-Longford Irrigation Scheme, to which the Hydro supplies 12,000 ML of water per annumsourced from the Poatina tailrace canal. Peak demand for water from the tailrace occurs in Decemberand January. The current system has no buffering storage, and therefore requires flow throughout theirrigation season (October-April), with a peak demand of 150 ML/day. Security of supply is a majorissue to the Cressy-Longford Irrigation Scheme.
Irrigators in the Macquarie River downstream of Brumbys Creek as far as Longford (where theMacquarie meets the South Esk) are assured of sufficient irrigation water by the Hydro as a StatutoryRight. This right was under the Electricity Supply Industry Restructuring (Savings and TransitionalProvisions) Act 1995, and is now under the Water Management Act 1999. Irrigators in the South EskRiver would have entitlements to water such as Commissional Water Rights, which will be convertedto water licences under the new legislation. The Hydro makes available a quantity of water(approximately 18,000 ML/yr) in the South Esk catchment, for allocation by the Department ofPrimary Industries, Water and Environment.
Sevrup is a commercial trout farm on Brumbys Creek which has a Commissional Water Right. It isdependent on Brumbys Creek for its water supply, and draws water from Weir 3 via a culvert andopen channel to the fish farm. Water which passes through the fish farm is eventually returned toBrumbys Creek.
Several townships rely on Poatina Power Station water, namely Poatina (from the Poatina PowerStation penstock), Cressy (from the Macquarie River), and Longford (Back Creek and the MacquarieRiver). Discussions with Northern Midlands Council staff indicated that water supply to Cressy andLongford is only affected by Poatina Power Station operations during prolonged shutdowns of theorder of 1–2 months. Short term flow fluctuations and shutdowns do not pose a risk to supplysecurity. Poatina township draws water from the Poatina penstock (i.e. upstream of the power station).It is unlikely to be affected by power station operations except under the case of prolonged shutdownsfor tunnel maintenance.
The implications of altered flow regimes arising from Basslink on these abstractive users will need tobe discussed in a consultative fashion. Basslink investigations will include explanation of thehydrological changes to the key stakeholders and exploration of any issues that may be raised in thesediscussions. This will include an assessment of any flood risk issues that may arise due to Basslink. Ifnecessary, mitigation options will need to be explored to ensure compatibility of any Basslink flowregimes with these users.
Appendix 1: Scoping Report February 2000Environmental Services Department, Hydro Consulting
Basslink Integrated Impact Assessment Statement 91Potential Effects of Changes to Hydro Power Generation
4.3.5.2 Recreational Uses
Popular recreational uses of the waterways downstream of Poatina Power Station are boating,swimming and fishing. Boating is particularly popular in a designated recreational area in Longford,at the confluence of the Macquarie and South Esk rivers. It is unlikely that this area would be greatlyaffected by hydrological changes due to Basslink, but this will be able to be stated with more certaintywith more precise downstream hydrological analysis of the Basslink changes.
Fishing is particularly of interest, as Brumby’s Creek and the lower Macquarie and South Esk Rivers(downstream of the Brumbys Creek junction) have high recreational angler visitation rates. BrumbysCreek receives some 11,000 angler days fishing effort a year from around 2,100 anglers and ranksfourth in the state’s riverine fisheries (in the top ten of the state’s trout fisheries, Inland FisheriesCommission unpub. data). It has a high national profile as a valued fly fishery and has a relativelyhigh proportion of tourist anglers. Overall, fishing effort represents some $0.5M annual expenditureby anglers in these reaches (P. Davies unpub. data).
The South Esk downstream of the Macquarie River receives 3,900 angler days fishing effort per year,42% of the total angling effort expended in the South Esk River (Davies & Humphries 1996). TheMacquarie River downstream of Brumbys Creek receives 3,000 angler days fishing effort, 54% of thetotal angling effort expended in the Macquarie River (Davies & Humphries 1996).
The effects of a more intermittent, pulsed flow regime in Brumbys Creek on the fishery in the creekand in the lower Macquarie River needs to be assessed in terms of changes to fish andmacroinvertebrate habitat suitability and hence fishery productivity, and any public safety issues. Thepublic safety issues need to be addressed in the same consultative fashion as the abstractive issues, andrely on good hydrological information on likely Basslink changes at identified sites downstream ofPoatina. Existing on-site warning signage of variable flows may need to be reviewed in relation to thesafety of bankside anglers and swimmers.
In order to maintain its reputation as an environmentally responsible supplier of renewable energy, theHydro will be will be addressing any current (i.e. not associated with Basslink) management issues inthe Great Lake – South Esk catchment in its Water Management Review process. This is a long-termstrategy to assist in the development of community accepted Water Management Plans under the newWater Management Act 1999. As part of this commitment, the Hydro is continuing to monitor waterquality and other aquatic aspects of Great Lake and river reaches downstream of Poatina through itsAquatic Environment Program. This process will be carried out in conjunction with some of theBasslink studies.
4.3.6 Summary of Downstream Poatina Environmental and Social
Investigations
In summary, the planned environmental investigations into the effects of the Basslink cable on thewaterways downstream of Poatina Power Station will address geomorphology, instream ecologicalhealth, water quality, cultural heritage, and public use issues.
As with the Gordon catchment, the Hydro will be addressing any current (ie. not associated withBasslink) management issues in the Great Lake–South Esk catchment in its Water ManagementReview process. This process has already commenced, and the Hydro will ensure that consultation forthe Water Management Review and for the Basslink investigations is carefully planned and interlinkedas appropriate.
Appendix 1: Scoping Report February 2000Environmental Services Department, Hydro Consulting
Basslink Integrated Impact Assessment Statement 92Potential Effects of Changes to Hydro Power Generation
4.4 Downstream John Butters Power Station
4.4.1 Introduction
The King River downstream of the John Butters Power Station (Figure 4.3) is unpopulated but has ahistory of human interaction. The most notable catchment activity is the Mount Lyell Copper Mine inQueenstown, which for 78 years discharged tailings (very fine grained sediments) and waste waterinto the Queen River. The Queen River transported these discharges to the King River and from thereon into Macquarie Harbour. The tailings discharge continued until as recently as December 1994,several years after commissioning of the John Butters Power Station. Acidic, metal-rich waste waterscontinue to be discharged from the mine site into the King catchment.
Considerable research has been conducted into interactions of power station operations with thetailings and waste water from Mount Lyell (Koehnken 1996, 1997; Locher 1997). Of major concernwas the risk these waste discharges posed to the growing aquaculture industry in the downstreamreceiving body, Macquarie Harbour (see Locher & Koehnken 1993). These environmentalinvestigations commenced while tailings were still being discharged, and continued for several yearsafter tailings discharges had permanently ceased. The main conclusions of these studies were that thevast majority of effort towards remediation of this river system should be directed at treatment ofwaste water off of the Mount Lyell lease site.
At present, considerable effort and cost is going into identification of appropriate treatmenttechnologies, and construction of a full-scale treatment plan at Mount Lyell. A treatment plant isplanned for construction during 2001, and so would be operational prior to a Basslink cable. Basslinkenvironmental investigations must address whether or not the Basslink operating patterns would in anyway jeopardise the success of the remediation efforts being undertaken for this river system.
The hydrological changes downstream of the John Butters Power Station predicted by the TEMSIMmodel are not major. Typical power station discharges under the present operating regime are highlyvariable, and this frequent on-off pattern may increase very slightly. There is a difference in theseasonality of discharges, with increased winter discharges.
Appe
ndix
1: S
copi
ng R
epor
tFe
brua
ry 2
000
Envi
ronm
enta
l Ser
vice
s Dep
artm
ent,
Hyd
ro C
onsu
lting
Bass
link
Inte
grat
ed Im
pact
Ass
essm
ent S
tate
men
t93
Pote
ntia
l Effe
cts o
f Cha
nges
to H
ydro
Pow
er G
ener
atio
n
Figu
re 4
.3 –
Dow
nstr
eam
of J
ohn
But
ters
Pow
er S
tatio
n
Appendix 1: Scoping Report February 2000Environmental Services Department, Hydro Consulting
Basslink Integrated Impact Assessment Statement 94Potential Effects of Changes to Hydro Power Generation
In evaluation of the John Butters modelling results and discussions with specialists, the issues ofgeomorphology, water quality, ecological health and tourism are considered the key environmentalissues in the King River to be addressed by these Basslink investigations. The King River willincreasingly become a focus of tourism visitation with the development of the Abt Railway. Waterquality in Macquarie Harbour is also a key issue. These are discussed in the following sections inturn.
4.4.2 King River
4.4.2.1 Geomorphology
The geomorphology of the lower King River was heavily impacted by historical operations of theMount Lyell mine, with major changes in sediment transport dynamics, sediment storage and channelform. Prior to commencement of power station operations, massive mine sediment loads resulted inthe development of tailings banks in the lower King River, infilling of the river bed, and formation ofa major delta at the mouth of the river (Figure 4.3).
The power station discharges no longer interact with these continuous tailings inputs to the river, asthere is now a tailings dam located at the Mount Lyell mine site. Consequently, over the past 4 to 5years the river has been adjusting to a new set of conditions of ongoing flow regulation and theabsence of fresh sediment inputs. The result has been erosion of the sediment banks, possibly somelowering and movement of the bed sediments, and erosion off of the outer (harbour) face of the delta.It is unknown at this stage to what degree of equilibrium the river has obtained to these newconditions, nor to what degree natural and assisted revegetation and stabilisation of the river banks hasbeen achieved.
It is important that any new developments affecting the King River do not introduce a new set ofinfluencing variables that will affect the geomorphological equilibrium towards which the river ismoving. An understanding of the current rates and processes of the key geomorphological processes -bank erosion, and river channel and delta adjustment – will allow analysis of the likely changes whichcould be linked to the Basslink discharge pattern.
4.4.2.2 Water Quality
In the post-tailings river system (post-1994), acid mine drainage from the Mount Lyell lease site is themost major environmental issue affecting the King River system. Extremely acidic water containinghigh levels of iron, copper, aluminium, sulphate and manganese enters the King River via the QueenRiver just one kilometre downstream of the John Butters tailrace. Discharges from John Butters are amajor influence on the dilution and transport of this water in the King River. Not surprisingly,dilution is greatest when the power station is discharging, and least when the power station is off.
The worst case scenario arises when the power station is off for prolonged periods, for example duringmaintenance shutdowns. This allows relatively large volumes of metal-laden Queen River water intothe King with very little dilution. When the power station eventually comes back on line, this ‘block’of highly concentrated water is pushed out of the King River as a mass, creating a plume in MacquarieHarbour.
Seasonality is a factor in this scenario; in winter there are high fluxes of metals into the Queen River(derived from the lease area surface run-off) but at relatively low concentrations, whereas in summerthere are lower fluxes at higher concentrations. Therefore the key Basslink issues affecting KingRiver water quality are the duration of the shutdown periods between discharge events, the schedulingof maintenance shutdowns, and the implications of a seasonal shift in discharge patterns.
Appendix 1: Scoping Report February 2000Environmental Services Department, Hydro Consulting
Basslink Integrated Impact Assessment Statement 95Potential Effects of Changes to Hydro Power Generation
4.4.2.3 Instream Ecological Health
Fish are completely absent from the lower King River, but a study by Davies et al. (1996) found nativegalaxiids and eels occurring in tributary streams within the lower King catchment. These fish were ofan age range which suggested they migrated prior to commencement of power station operations whenlate winter to early summer floods sufficiently diluted heavy metals.
An initial remediation target for the lower King River is to improve water quality to the point at whichmigratory fish species can migrate into the King River tributaries. Present research being conducted atMount Lyell into the most appropriate treatment technologies involves toxicity tests to determine therelative toxicity of the different metals (notably copper and aluminium) on the organisms likely tocolonise downstream. The selection of treatment technology will have a certain remediation targetrelated to biological recovery. Evaluation of the impact of more frequently low flows on the toxicityof Queen inflows on King River biota (and its potential to recover) is required.
Seasonal variation in flows from the power station for all the Basslink cable scenarios mimicsnaturally high flows in winter and may be of benefit to instream biota by restoring natural seasonalflow cues. Some assessment of the implications on the seasonal changes in John Butters operationwith regard to the biological remediation targets needs to be included in the King River studies. Underthe present operating conditions at John Butters, it has been estimated that 99% of the acid drainagefrom the lease site requires remediaiton to encourage the re-establishment of a modified but healthyecosystem in the Lower King River (Dr. L. Koehnken, Technical Advice on Water, pers. comm.).Based on this, it is evident that the implementation of Basslink could not increase the level ofremediation required, and might provide more flexibility for environmental management.
4.4.2.4 Tourism
Tourism is a growing use of the King River system. Jet boat tours and driving tours of the lower KingRiver have been conducted for a number of years. The Abt Railway development is a major andcostly effort to reinstate the historical railway which runs along the Queen and King rivers. Theimplications of the Basslink changes on the viability of this industry must be considered.
4.4.3 Macquarie Harbour Water Quality
There is a strong interaction between the regulated flow regimes in the King and Gordon rivers withwater quality conditions in Macquarie Harbour. Fish farms are concentrated in the western part of theharbour because of its proximity to Strahan, but they have to balance this logistical convenienceagainst the poor water quality emanating out of the King River. Consequently the fish farms aremostly located on the southern shore of the harbour, taking advantage of clean water from the GordonRiver.
The fish farms encounter three distinct types of water in Macquarie Harbour – clean freshwater out ofthe Gordon River, polluted freshwater out of the King River, and more dense saline ocean waterentering through Hells Gates. The Gordon River contributes five times the flow of the King. Inwinter a thick freshwater layer from natural inflows into Macquarie Harbour blocks intrusion of saltwater into the harbour; this blockage is reduced in summer and more salt water is allowed to intrude.Seasonal shifts in both the Gordon and John Butters Power Stations may have implications for theinteractions of these different waters.
The hydrodynamics of Macquarie Harbour as they relate to water quality were intensively investigatedas part of the Mount Lyell Remediation Research and Development Program (Koehnken 1997). Asimple mixing model of the harbour exists (Koehnken pers. comm), which should be used to assessimplications of Basslink induced changes in the Gordon and King River flows on Macquarie Harbourhydrodynamics, water quality and biological suitability. These findings should be reviewed in light of
Appendix 1: Scoping Report February 2000Environmental Services Department, Hydro Consulting
Basslink Integrated Impact Assessment Statement 96Potential Effects of Changes to Hydro Power Generation
the predicted changes to Gordon and John Butters Power Station operation, to ascertain whether thereare water quality issues which will influence the viability of the harbour aquaculture industry.
4.4.4 Summary of Downstream John Butters Environmental and Social
Investigations
In summary, the planned environmental investigations into the effects of the Basslink cable on thewaterways downstream of the John Butters Power Station will address geomorphology, water quality,instream ecological health and tourism issues in the King River, and water quality in MacquarieHarbour.
As with the other hydro catchments, the Hydro will be addressing any current (i.e. not associated withBasslink) management issues through its Water Management Review process.
4.5 Summary of Aquatic Environmental and Social Investigations
Associated with Basslink
Planned environmental investigations into the effects of the Basslink cable on the Gordon River willaddress geomorphology, instream ecological health, meromictic lakes, water quality and culturalheritage issues.
Environmental investigations on the waterways downstream of Poatina Power Station will addressgeomorphology, instream ecological health, fishery, water quality, cultural heritage, and public useissues.
Investigations downstream of the John Butters Power Station will address geomorphology, waterquality, instream ecological health and tourism issues in the King River, and water quality inMacquarie Harbour.
Appendix 1: Scoping Report February 2000Environmental Services Department, Hydro Consulting
Basslink Integrated Impact Assessment Statement 97Potential Effects of Changes to Hydro Power Generation
5 PROPOSED STUDIES5.1 Overview
In this chapter, the studies proposed to address the environmental issues identified in the previouschapter are outlined. In accordance with the Ministerial direction to the Resource Planning andDevelopment Commission (RPDC) on the Basslink assessment process, these studies must consider:
• the likely environmental impacts on Tasmanian waterways arising from Basslink, with particularattention to WHA impacts;
• any social, economic and community impacts associated with the likely environmental impacts;and
• means proposed for managing any of these impacts.
Section 5.2 describes the Gordon River studies, Section 5.3 the downstream Poatina studies, andSection 5.4 the downstream John Butters studies. These are summarised in Table 5.1. An outline ofeach study is provided. Each study summary clearly states the key research question, specific studyobjectives, essential elements of the methodology, and study outcomes.
Appendix 1: Scoping Report February 2000Environmental Services Department, Hydro Consulting
Basslink Integrated Impact Assessment Statement 98Potential Effects of Changes to Hydro Power Generation
Table 5.1 – Summary of Recommended StudiesRiver
System Issue to be Studied Broad Study Description
Geomorphology Bank erosion and altered geomorphological processes in themiddle Gordon River; karst features.
Instream EcologicalHealth
Habitat assessment of representative reaches, using GordonRiver catchment species habitat data; assessment of shear stressconditions.
Meromictic Lakes Modelling and evaluation of meromictic lake stability study inrelation to Gordon River flow, tidal and power stationoperational regime.
Water Quality Evaluation of deoxygenated water releases under Basslink.
DOWN-STREAMGORDONPOWER
STATION
Cultural Heritage Assessment of cultural heritage sites in the Gordon River andpotential impacts on those sites.
Geomorphology Brumbys Creek channel erosion, sediment transport, MacquarieRiver channel adjustments, role of flooding
Instream EcologicalHealth
Assessment of possible effects on instream biota and the troutfishery downstream of Poatina Power Station.
Water Quality Assessment of possible effects on water quality downstream ofPoatina Power Station.
Cultural Heritage Assessment of cultural heritage sites downstream of PoatinaPower Station and potential impacts on those sites.
DOWN-STREAMPOATINAPOWER
STATION
Public Use Issues Consultative process involving discussion of Basslinkhydrological changes with key stakeholders
King RiverGeomorphology
Analysis of potential issues associated downstream flows belowJohn Butters Power Station including Macquarie Harbour –stakeholder consultation, water quality modelling.
King River WaterQuality
Assessment of implications of Basslink on water quality in theKing River, particularly in relation to the Mount Lyellremediation program.
King River InstreamEcological Health
Assessment of possible effects on ecological health in the KingRiver, particularly in relation to the biological recovery targetsassociated with the Mount Lyell remediation program.
King River Tourism Consultative process involving discussion of Basslinkhydrological changes with key tourism ventures.
DOWN-STREAM
JOHNBUTTERSPOWER
STATION
Macquarie HarbourWater Quality
Assessment of the implications of altered Gordon and JohnButters Power Stations discharges on Macquarie Harbour waterquality, particularly with regard to their implications for theaquaculture industry, stakeholder consultation.
General Tasmanian WildernessWorld Heritage Area
Analyse world heritage area values in regards to Basslink
Appendix 1: Scoping Report February 2000Environmental Services Department, Hydro Consulting
Basslink Integrated Impact Assessment Statement 99Potential Effects of Changes to Hydro Power Generation
5.2 Gordon River Basslink Environmental Investigations
Planned environmental investigations into the effects of the Basslink cable on the Gordon River willaddress geomorphology, instream ecological health, meromictic lakes, water quality and culturalheritage issues.
5.2.1 Gordon River Geomorphology Study
5.2.1.1 Key Research Question
Will Basslink alter the current geomorphological processes in the middle Gordon River, and if so whatare strategies to mitigate any adverse environmental impacts arising from these changes?
5.2.1.2 Specific Study Objectives• Ascertain current geomorphic processes in terms of bank erosion mechanisms, sediment transport
and depositional patterns, channel adjustments, movement of bed material, and stability oftributary streams.
• Relate these processes to hydrological and hydraulic conditions under the present operatingregime.
• Examine modelled Basslink hydrological data for key locations downstream of the power stationand identify implications.
• If possible or necessary, consider management options which would alleviate any negativeimpacts arising from the Basslink changes.
5.2.1.3 Essential Elements of the Methodology• Identification of geomorphological zones in the middle Gordon River.• Establishment of monitoring and investigative stations in selected zones, including hydrological
monitoring.• Installation of erosion pins and scour chains.• Augering and analysis of sediment bank materials.• Monitoring of water table dynamics in the near river sediment banks, associated with monitoring
of river level.• Mapping of bed material in cobble bars, and experimental monitoring of transport of these
materials.• General reconnaissance and mapping of notable geomorphic features.• Investigation of any identified karst features and assessment of their vulnerability to Basslink
changes.
5.2.1.4 Study Outcomes• An intensive field-based investigation and baseline monitoring program conducted by a
collaborative team involving the Hydro’s Environmental Services Department, the University ofTasmania, Melbourne University, Monash University and the Co-operative Research Centre forCatchment Hydrology.
• Understanding of key geomorphic processes acting in the Gordon River, spatial and temporalvariations in these processes, and influencing factors.
• A report section identifying likely changes to these processes and any geomorphic heritagefeatures in the WHA arising from Basslink, and proposing management strategies to address anynegative impacts.
Appendix 1: Scoping Report February 2000Environmental Services Department, Hydro Consulting
Basslink Integrated Impact Assessment Statement 100Potential Effects of Changes to Hydro Power Generation
5.2.2 Gordon River Instream Ecological Health Study
5.2.2.1 Key Research Question
Will Basslink alter the ecological health of the middle Gordon River, and if so what are strategies tomitigate any adverse environmental impacts arising from these changes?
5.2.2.2 Specific Study Objectives• Ascertain the current status of the ecological health of the middle Gordon River, in terms of fish,
macro-invertebrates, platypus and aquatic flora.• Develop relationships between hydrology, instream habitat availability and biological conditions
in the middle Gordon River under the present power station operating regime.• Assess changes in shear stress at different river discharges.• Examine modelled Basslink hydrological data for key locations downstream of the power station
and identify implications for ecological health.• If possible or necessary, consider management options which would alleviate any negative
impacts arising from the Basslink changes.
5.2.2.3 Essential Elements of the Methodology• Establishment of study reaches in the Gordon for the assessment of instream habitat under selected
flow conditions.• Baseline aquatic fauna surveys, including fish, macro-invertebrate and platypus surveys between
the Gordon Power Station and the Franklin River junction. These will build on some existingmacro-invertebrate sampling sites and will follow the nationally accepted RIVPACS model;
• Identification of key ecological processes in the Gordon which may be affected by changes to theflow regime under Basslink.
• Development of relationships between biological suitability, habitat and hydrology for the GordonRiver, taking into account any key ecological processes, using IFIM and shear stress.
• Use of IFIM and shear stress relationships to formally assess risks to instream biota for flowregimes predicted, using the outputs from TEMSIM, under specific Basslink operationalscenarios.
• Identify the optimum operational conditions for the protection and/or maintenance of instreamecological values whilst maximising the Hydro’s ability to meet electricity demand.
5.2.2.4 Study Outcomes• Description of habitat-flow relationships in the middle-lower Gordon for aquatic fauna;• Identification of threatened species known to exist in the area;• Assessment of changes to habitat-flow relationships under Basslink;• Key stakeholder participation in identification of Basslink environmental management needs and
agreement on habitat protection required for instream fauna in the Gordon River through flowmitigation under Basslink; and
• A report section detailing the likely impacts of Gordon River Power Station operations underBasslink on the instream biota of the Gordon River
Appendix 1: Scoping Report February 2000Environmental Services Department, Hydro Consulting
Basslink Integrated Impact Assessment Statement 101Potential Effects of Changes to Hydro Power Generation
5.2.3 Gordon River Meromictic Lake Study
5.2.3.1 Key Research Question
Will Basslink alter flow regimes affecting the lower Gordon River meromictic lakes, and does itpresent opportunities to mitigate existing environmental impacts due to flow regulation?
5.2.3.2 Specific Study Objectives• Review scientific data already available on lakes Morrison, Fidler and Sulphide Pool;• Determine the relationship between flow regimes in the Gordon River and the mixing dynamics of
these meromictic lakes;• Establish required field instrumentation and infrastructure for the ongoing management of the
three lower Gordon River meromictic lakes;• Determine the current status of meromixis in the three lakes through the measurement of
conductivity and temperature profiles and design an on-going monitoring program;• Conduct two trials to assess the success of summer Gordon Power Station shut-down-startup
cycles for the recharge and stabilisation of meromictic state in all three lakes; and• Develop operational rules under Basslink for the restoration and maintenance of meromixis in the
three lakes.
5.2.3.3 Essential Elements of the Methodology• Utilisation and refinement of existing salinity models for Macquarie Harbour/Gordon River.• Installation of water quality and flow gauges to monitor salinity and flow characteristics in the
lower estuary and in the channels connecting the meromictic lakes to the Gordon River.• Experimental shutdowns of the Gordon Power Station to allow calibration of salinity models and
to investigate the effects of these trials on the water quality within these lakes.• Development of operating rules for the Gordon Power Station to allow for the continued
protection of the meromictic lakes with minimal loss of generation flexibility.
5.2.3.4 Study Outcomes• Report section detailing an assessment of the meromictic lakes status (current stratification
regime) and susceptibility to impact under Basslink;• Recommendations for operational constraints and flow mitigation to enhance lake meromixis;• Modelling parameters for system modelling of recommended changes; and• Infrastructure for on-going management of the meromictic lakes.
5.2.4 Gordon River Water Quality Study
5.2.4.1 Key Research Question
Will Basslink alter any aspects of water quality in the middle Gordon River, and if so what arestrategies to mitigate any adverse environmental impacts arising from these changes?
5.2.4.2 Specific Study Objectives• Ascertain current water quality status and influencing factors in the middle Gordon River.• Review hydrological model predictions for Basslink.• Identify any alterations to water quality in terms of concentrations, zone of impact and seasonality
issues which may arise due to Basslink.• Identify the implications of these alterations on WHA values.
Appendix 1: Scoping Report February 2000Environmental Services Department, Hydro Consulting
Basslink Integrated Impact Assessment Statement 102Potential Effects of Changes to Hydro Power Generation
• If possible or necessary, identify management options to mitigate negative impacts.
5.2.4.3 Essential Elements of the Methodology• Review of available water quality data in Lake Gordon and the Gordon River.• Desktop review of modelled hydrological data for 0MW and Basslink scenarios.
5.2.4.4 Study Outcomes
• Identification of any implications of Basslink on water quality.
5.2.5 Gordon River Cultural Heritage Study
5.2.5.1 Key Research Question
Will Basslink affect sites of Aboriginal and European cultural heritage significance or any culturallandscape values in the Gordon River, and if so what are strategies to mitigate any adverseenvironmental impacts arising from these changes?
5.2.5.2 Specific Study Objectives• Identification of sites of Aboriginal and European cultural heritage significance, and to identify
the cultural landscape values associated with the development area.• Assessment of risk to these sites and values arising from Basslink.• Provision of management recommendations for these sites and values.
5.2.5.3 Essential Elements of the Methodology• Consultation with the Cultural Heritage Branch, Parks and Wildlife Service. Input from an
Aboriginal Heritage Officer acceptable to the Tasmanian Aboriginal Land Council (TALC) willbe obtained for the Aboriginal heritage component of the work.
• A literature review and possible field assessment of current data on cultural heritage sites in theGordon River, concentrating on areas most likely to be affected by erosion;
• Access and review the Tasmanian Aboriginal Site Index (TASI) and Tasmanian Historic PlacesInventory (THPI) for sites within and adjacent to the study areas.
• Liaison, as necessary, with relevant government and non-government bodies on matters relating tosites of Aboriginal and European cultural heritage significance.
• Identification and documentation of the cultural landscape values associated with the study areasand immediate surrounds.
• An assessment of likely impacts on known sites from the Basslink development.• Stakeholder consultation, particularly with the Tasmanian Aboriginal community and the Heritage
Council.
5.2.5.4 Study Outcomes• Location, documentation and assessment of sites of Aboriginal and European cultural significance
within the study areas.• Liaison with relevant government and non-government bodies on matters relating to sites of
Aboriginal and European cultural heritage significance.• Identification and documentation of the cultural landscape values.• Provision of recommendations for managing significant sites and cultural landscape values that
may be identified.
Appendix 1: Scoping Report February 2000Environmental Services Department, Hydro Consulting
Basslink Integrated Impact Assessment Statement 103Potential Effects of Changes to Hydro Power Generation
Environmental investigations on the waterways downstream of Poatina Power Station will addressgeomorphology, instream ecological health, water quality, cultural heritage, and public use issues.
5.3.1 Downstream Poatina Geomorphology Study
5.3.1.1 Key Research Question
Will Basslink alter the current geomorphological processes acting on the waterways downstream ofthe Poatina Power Station, and if so what are strategies to mitigate any adverse environmental impactsarising from these changes?
5.3.1.2 Specific Study Objectives• Ascertain the influence of power station discharges on current geomorphic processes in the
waterways downstream of Poatina Power Station under present operating conditions and thosepredicted to be due to Basslink.
• Examine modelled Basslink hydrological data for key locations downstream of the power stationand identify which geomorphic processes are most vulnerable to change.
• Conduct field assessments to assist these investigations.• If possible or necessary, consider management options which would alleviate any negative
impacts arising from the Basslink changes.
5.3.1.3 Essential Elements of the Methodology• Run a hydraulic model for the study area under different Basslink operating scenarios.• Analysis of hydrological and hydraulic data for current operations and Basslink to more clearly
identify zones susceptible to geomorphic change.• Examination of historical and current channel cross sectional surveys to examine channel changes.• Comparison of historical and recent aerial photography to examine channel changes.• Establishment of monitoring and investigative stations in selected zones downstream of the
Poatina Power Station.• Installation of erosion pins and long-term monitoring stations.• Augering and analysis of sediment bank materials to assess characteristics such as permeability
and transmissivity.• Monitoring of water table dynamics in the near river sediment banks, associated with monitoring
of river level, to assess processes such as drawdown induced erosion.
5.3.1.4 Study Outcomes• An intensive field-based investigation and baseline monitoring program.• Understanding of the interrelationships of power station operations with key geomorphic
processes downstream of the Poatina Power Station, particularly flow variability and flood riskissues.
• A report section identifying likely changes to these processes, and proposing managementstrategies to address any negative impacts.
Appendix 1: Scoping Report February 2000Environmental Services Department, Hydro Consulting
Basslink Integrated Impact Assessment Statement 104Potential Effects of Changes to Hydro Power Generation
5.3.2 Downstream Poatina Instream Ecological Health and Fishery Study
5.3.2.1 Key Research Question
Will Basslink alter the ecological health of the waterways downstream of the Poatina Power Station,and if so what strategies can be utilised to mitigate any adverse environmental impacts arising fromthese changes?
5.3.2.2 Specific Study Objectives• Describe the current ecological health downstream of Poatina Power Station.• Describe the relationships of key aspects of ecological health in the study area to power station
operations.• Evaluate fish habitat status in Brumbys Creek and lower Macquarie River.• Examine modelled Basslink hydrological data for key locations downstream of the power station
and identify implications for ecological health.• If possible or necessary, consider management options which would alleviate any negative
impacts arising from the Basslink changes.
5.3.2.3 Essential Elements of the Methodology• Literature review for available information on ecological health downstream of Poatina Power
Station.• Identification of areas of primary habitat, and key indicator species within this primary habitat.• Desktop assessment of implications of modelled hydrological data for with and without Basslink
scenarios.
5.3.2.4 Study Outcomes• A report section detailing the likely impacts of Poatina Power Station operations under Basslink
on the instream biota of Brumby’s Creek and the Macquarie / South Esk River.• If needed, identification of flow mitigation needs for habitat protection and fishery maintenance
required for instream fauna under Basslink.
5.3.3 Downstream Poatina Water Quality Study
5.3.3.1 Key Research Question
Will Basslink alter any aspects of water quality downstream of Poatina Power Station, and if so whatare strategies to mitigate any adverse environmental impacts arising from these changes?
5.3.3.2 Specific Study Objectives• Ascertain current water quality status and influencing factors downstream of Poatina Power
Station.• Review hydrological model predictions for Basslink.• Identify any alterations to water quality in terms of concentrations, zone of impact and seasonality
issues which may arise due to Basslink.• If possible or necessary, identify management options to mitigate negative impacts.
5.3.3.3 Essential Elements of the Methodology• Review of available water quality data downstream of Poatina Power Station.
Appendix 1: Scoping Report February 2000Environmental Services Department, Hydro Consulting
Basslink Integrated Impact Assessment Statement 105Potential Effects of Changes to Hydro Power Generation
• Collection of field data particularly on sources of water of varying quality.• Desktop assessment of implications of modelled hydrological data for with and without Basslink.
5.3.3.4 Study Outcomes
• Report identifying any implications of Basslink on water quality, and proposing managementstrategies if required.
5.3.4 Downstream Poatina Cultural Heritage Study
5.3.4.1 Key Research Question
Will Basslink affect sites of Aboriginal and European cultural heritage significance or any culturallandscape values downstream of Poatina Power Station, and if so what are strategies to mitigate anyadverse environmental impacts arising from these changes?
5.3.4.2 Specific Study Objectives• Identification of sites of Aboriginal and European cultural heritage significance, and to identify
the cultural landscape values associated with the development area.• Assessment of risk to these sites and values arising from Basslink.• Provision of management recommendations for these sites and values.
5.3.4.3 Essential Elements of the Methodology• Consultation with the Cultural Heritage Branch, Parks and Wildlife Service. Input from an
Aboriginal Heritage Officer acceptable to the Tasmanian Aboriginal Land Council (TALC) willbe obtained for the Aboriginal heritage component of the work.
• A literature review and possible field assessment of current data on cultural heritage sites inBrumbys Creek or the downstream Macquarie and South Esk rivers, concentrating on areas mostlikely to be affected by erosion;
• Access and review the Tasmanian Aboriginal Site Index (TASI) and Tasmanian Historic PlacesInventory (THPI) for sites within and adjacent to the study areas.
• Liaison, as necessary, with relevant government and non-government bodies on matters relating tosites of Aboriginal and European cultural heritage significance.
• Identification and documentation of the cultural landscape values associated with the study areasand immediate surrounds.
• An assessment of likely impacts on known sites from the Basslink development.• Stakeholder consultation, particularly with the Tasmanian Aboriginal community and the Heritage
Council.
5.3.4.4 Study Outcomes• Location, documentation and assessment of sites of Aboriginal and European cultural significance
within the study areas.• Liaison with relevant government and non-government bodies on matters relating to sites of
Aboriginal and European cultural heritage significance.• Identification and documentation of the cultural landscape values.• Provision of recommendations for managing significant sites and cultural landscape values that
may be identified.
Appendix 1: Scoping Report February 2000Environmental Services Department, Hydro Consulting
Basslink Integrated Impact Assessment Statement 106Potential Effects of Changes to Hydro Power Generation
5.3.5 Downstream Poatina Public Use Study
5.3.5.1 Key Research Question
Will Basslink disadvantage any users of the waterways downstream of the Poatina Power Station, andif so what are strategies to mitigate any adverse environmental impacts arising from these changes?
5.3.5.2 Specific Study Objectives• Determination of current and Basslink hydrology at selected points downstream of Poatina Power
Station.• Targeted stakeholder consultation to identify any public use issues arising from Basslink changes.• Integration of consultation with that required for the Hydro’s South Esk – Great Lake Water
Management Review.
5.3.5.3 Essential Elements of the Methodology• Detailed hydraulic and hydrological modelling• Stakeholder consultation, particularly in relation to the requirements of downstream water users
and recreational fishing.
5.3.5.4 Study Outcomes• A report section detailing the perceived impacts of Basslink on water users downstream of Poatina
Power Station.• Recommendations on operating patterns, flood rules, signage and any other aspects of Hydro
management of these waterways.
Appendix 1: Scoping Report February 2000Environmental Services Department, Hydro Consulting
Basslink Integrated Impact Assessment Statement 107Potential Effects of Changes to Hydro Power Generation
5.4 Downstream John Butters Basslink Environmental Investigations
Investigations downstream of the John Butters Power Station will address geomorphology, waterquality, instream ecological health and tourism issues in the King River, and water quality inMacquarie Harbour.
5.4.1 King River Geomorphology Study
5.4.1.1 Key Research Question
Will Basslink alter the current geomorphological processes in the King River, and if so what arestrategies to mitigate any adverse environmental impacts arising from these changes?
5.4.1.2 Specific Study Objectives• To ascertain the current state of geomorphological equilibrium in the King River.• To identify the geomorphological implications of hydrological information on current and
Basslink power station discharges.
5.4.1.3 Essential Elements of the Methodology• Field reconnaissance.• Re-surveying of channel cross-sections and delta profiles and comparison with previous.• Review of relevant hydrological information on current and Basslink power station operations.• Literature review.
5.4.1.4 Study Outcomes
• A report section identifying any implications of Basslink on King River geomorphology, andproposing management strategies if required.
5.4.2 King River Water Quality Study
5.4.2.1 Key Research Question
Will Basslink jeopardise the success of improvements in water quality in the King River system, and ifso what are strategies to mitigate any adverse environmental impacts arising from these changes?
5.4.2.2 Specific Study Objectives• Understand the implications of the water quality remediation program at Mount Lyell for King
River water quality.• Understand the interrelationships between water quality and John Butters Power Station
operations.• Review the current and Basslink hydrology for the King River.• Identify any implications of Basslink changes for King River water quality.
5.4.2.3 Essential Elements of the Methodology• Literature review• Specialist consultation• Hydrology review
Appendix 1: Scoping Report February 2000Environmental Services Department, Hydro Consulting
Basslink Integrated Impact Assessment Statement 108Potential Effects of Changes to Hydro Power Generation
• Desk-top analysis
5.4.2.4 Study Outcomes
• A report section identifying any implications of Basslink on King River water quality, andproposing management strategies if required.
5.4.3 King River Instream Ecological Health Study
5.4.3.1 Key Research Question
Will Basslink affect biological remediation targets for the King River, and if so what are strategies tomitigate any adverse environmental impacts arising from these changes?
5.4.3.2 Specific Study Objectives• Understand the link between water quality objectives arising from the Mount Lyell Remediation
Program with biological remediation targets in the King River.• Review the current and Basslink hydrology for the King River.• Identify any implications of Basslink changes for King River ecological health.
5.4.3.3 Essential Elements of the Methodology• Literature review• Specialist consultation• Hydrology review• Desk-top analysis
5.4.3.4 Study Outcomes
• A report section identifying any implications of Basslink on King River ecological health, andproposing management strategies if required.
5.4.4 King River Tourism Study
5.4.4.1 Key Research Question
Will Basslink affect any tourism operations in the King River, and if so what are strategies to mitigateany adverse environmental impacts arising from these changes?
5.4.4.2 Specific Study Objectives• Prepare a summary of current and Basslink hydrology for stakeholder discussions• Consult with key stakeholders• Assess implications of stakeholder issues.
5.4.4.3 Essential Elements of the Methodology• Identification of key stakeholders• Hydrological analysis and review• Stakeholder consultation• Assessment of issues
Appendix 1: Scoping Report February 2000Environmental Services Department, Hydro Consulting
Basslink Integrated Impact Assessment Statement 109Potential Effects of Changes to Hydro Power Generation
5.4.4.4 Study Outcomes
• A report section identifying any implications of Basslink on King River tourism, and proposingmanagement strategies if required.
5.4.5 Macquarie Harbour Water Quality Study
5.4.5.1 Key Research Question
Will alterations to the Gordon and John Butters Power Station operating patterns affect water qualityin Macquarie Harbour, and if so what are strategies to mitigate any adverse environmental impactsarising from these changes?
5.4.5.2 Specific Study Objectives• Assess changes to Macquarie Harbour hydrodynamics due to alterations in Gordon and John
Butters Power Station operations under Basslink.• Identify implications of these changes on the aquaculture industry.
5.4.5.3 Essential Elements of the Methodology• Literature and hydrodynamic model review.• Hydrology review.• Stakeholder and specialist consultation.• Desk-top analysis using hydrodynamic model of harbour.
5.4.5.4 Study Outcomes
• A report section identifying any implications of Basslink on Macquarie Harbour water quality, andproposing management strategies if required.
Appendix 1: Scoping Report February 2000Environmental Services Department, Hydro Consulting
Basslink Integrated Impact Assessment Statement 110Potential Effects of Changes to Hydro Power Generation
6 REFERENCES
BC Hydro (1996). System Rating Audit. Report to the Hydro Electric Commission, BC HydroInternational Ltd., Report No. BCHIL.054. October 1996.
Bovee K. (1982). A guide to stream habitat analysis using the Instream Flow IncrementalMethodology, Instream flow information paper No. 12. US Fish and Wildlife ServiceWashington, 249 pp.
Bowles K. (1998). The Cycling of Mercury in Australasian Aquatic Systems, University of Canberra,Canberra, p 428.
Bowling, L. C. & Tyler, P.A. (1984). Endangered lakes of scientific and cultural value in the WorldHeritage Area of south-west Tasmania, Biological Conservation 30: 201-209.
Bradbury J., Cullen P., Dixon G. & Pemberton M. (1995). Monitoring and management of streambankerosion and natural revegetation on the lower Gordon River, Tasmanian Wilderness WorldHeritage Area. Environmental Management 19, 259-272.
Clausen B. & Biggs B.J.F. (1997). Flow variables for ecological studies in New Zealand rivers, 24thHydrology and Water Resources Symposium Proceedings, Auckland, New Zealand, pp. 101-108.
Collette, D. (1996). A review of existing information on Aboriginal Sites in the catchments of thePedder and Gordon Reservoirs. Report prepared for the Tasmanian Hydro-Electric Commission.Hobart.
Davies, P., Cook, I. & McKenny, C. (1999). The influence of changes in flow regime on aquatic biotaand habitat downstream of hydro-electric dams and Power Stations in Tasmania. Final Reportto the Hydro-Electric Corporation, Tasmania and the Australian Electricity Supply IndustryResearch Board.
Davies, P. & Humphries P. (1996). An environmental flow study of the Meander, Macquarie andSouth Esk Rivers, Tasmania. Final Report to Landcare Program. DPIF Hobart Tas. 151 pp.
Davies, P., N. Mitchell & L. Barmuta (1996) Mt. Lyell Remediation Project - The impact of historicalmining operations at Mt Lyell on the water quality and biological health of the King and QueenRiver catchments, Western Tasmania. Supervising Scientist Report No. 118. Commonwealth ofAustralia. Canberra.
Department of Primary Industries, Water & Environment, (1999). Proposed EnvironmentalManagement Goals for Tasmanian Surface Waters, Gordon River System, Public DiscussionPaper. Draft 1/9/1999.
Germanoski D. & Ritter D.F. (1988). Tributary response to local base level lowering below a dam,Regulated Rivers Research and Management. 2, 11-24.
HEC/SECV, (1991a). Interconnection between Tasmanian and Mainland Electricity Systems - Reporton Pre-Feasibility Studies. SECV, February 1991.
Appendix 1: Scoping Report February 2000Environmental Services Department, Hydro Consulting
Basslink Integrated Impact Assessment Statement 111Potential Effects of Changes to Hydro Power Generation
HEC/SECV, (1991b). Interconnection between Tasmanian and Mainland Electricity Systems -Basslink Feasibility Study Report. SECV, November 1991.
HEC/SECV, (1992). Basslink Feasibility Study - Environmental and Social Issues. SECV, June 1992.
HEC/SECV, (1993). Interconnection between Tasmanian and Mainland Electricity Systems - BasslinkSupplementary Studies Report. SECV, March 1993.
Hodgson D. & Tyler P. (1996). The impact of a hydro-electric dam on the stability of meromicticlakes in south west Tasmania, Australia. Archiv fur Hydrobiologie 137, 301 – 323.
IES, (1997). Price Forecasts for the National Electricity Market, Final Report February 1997,Intelligent Energy Systems Pty Ltd report prepared for the Hydro-Electric Corporation,Tasmania.
Koehnken, L. (1996) Macquarie Harbour – King River Study: Technical Report. Department ofEnvironment & Land Management. Hobart.
Koehnken L. (1997). Mount Lyell Remediation – Final Report Mt Lyell Remediation Research andDemonstration Project. Supervising Scientist Report 126. 93 pp. Commonwealth of Australia.Canberra.
Locher H. & Koehnken L. (1993). Fish Kills in Macquarie Harbour - A Review. TasmanianDepartment of Environment & Land Management Report, March 1993.
Locher H. (1997). Sediment Storage and Transport in the King River, Tasmania, PhD Thesis, Co-operative Research Centre for Catchment Hydrology, Department of Civil Engineering, MonashUniversity, Melbourne.
Ministerial Direction to the Resource Planning and Development Commission in relation to theBasslink Project. 19 April 1999. Section 20 State Policies and Projects Act 1993,.
Simons D.B. & Li R. (1982). Bank erosion in regulated rivers. In: Gravel Bed Rivers. R.D. Hey, J.C.Bathurst & C.R. Thorne (eds) John Wiley & Sons, Chichester, pp. 717-754.
Steane, M. S. & P. A. Tyler (1978). Lower Gordon River Scientific Survey, Headwaters of the LowerGordon River; Physical and Chemical Characteristics; a Preliminary Study, Hobart, Hydro-Electric Commission.
Steane M. & Tyler P. (1982). Anomalous stratification behaviour of Lake Gordon, headwater reservoirof the lower Gordon River, Tasmania, Australian Journal of Marine and Freshwater Research33, 739 – 760.
Tyler P (1986). Anthropological limnology in the land of Moinee In: Limnology in Australia.Dedekker P. and Williams W. (eds.): CSIRO Melbourne and Junk, Dordrecht.
Wasson B., Banens B., Davies P., Volker R. & Tait D. (1996). Inland Waters In: State of theEnvironment 1996 Environmental Australia.
Appendix 1: Scoping Report February 2000Environmental Services Department, Hydro Consulting
Basslink Integrated Impact Assessment Statement 112Potential Effects of Changes to Hydro Power Generation
ATTACHMENT 1
THE HYDRO’S ENVIRONMENTAL POLICY AND
THE HYDRO’S AQUATIC ENVIRONMENTAL POLICY
Appendix 1: Scoping Report February 2000Environmental Services Department, Hydro Consulting
Basslink Integrated Impact Assessment Statement 113Potential Effects of Changes to Hydro Power Generation
Appendix 1: Scoping Report February 2000Environmental Services Department, Hydro Consulting
Basslink Integrated Impact Assessment Statement 114Potential Effects of Changes to Hydro Power Generation


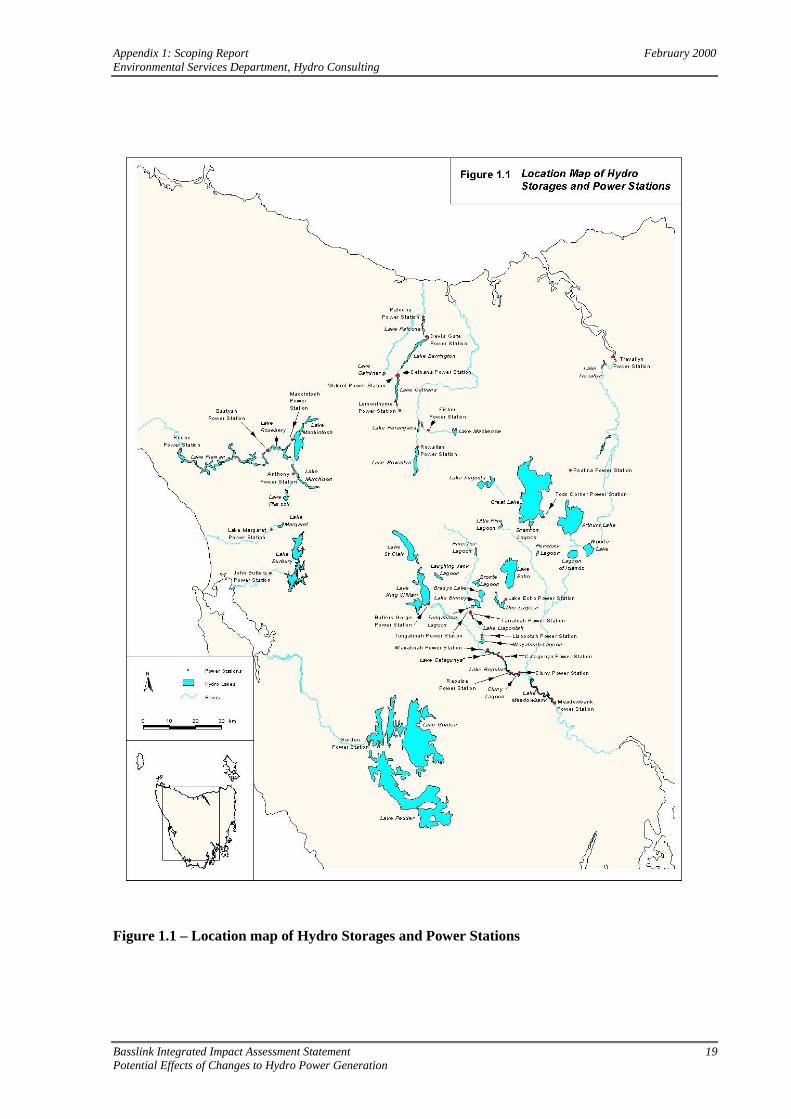


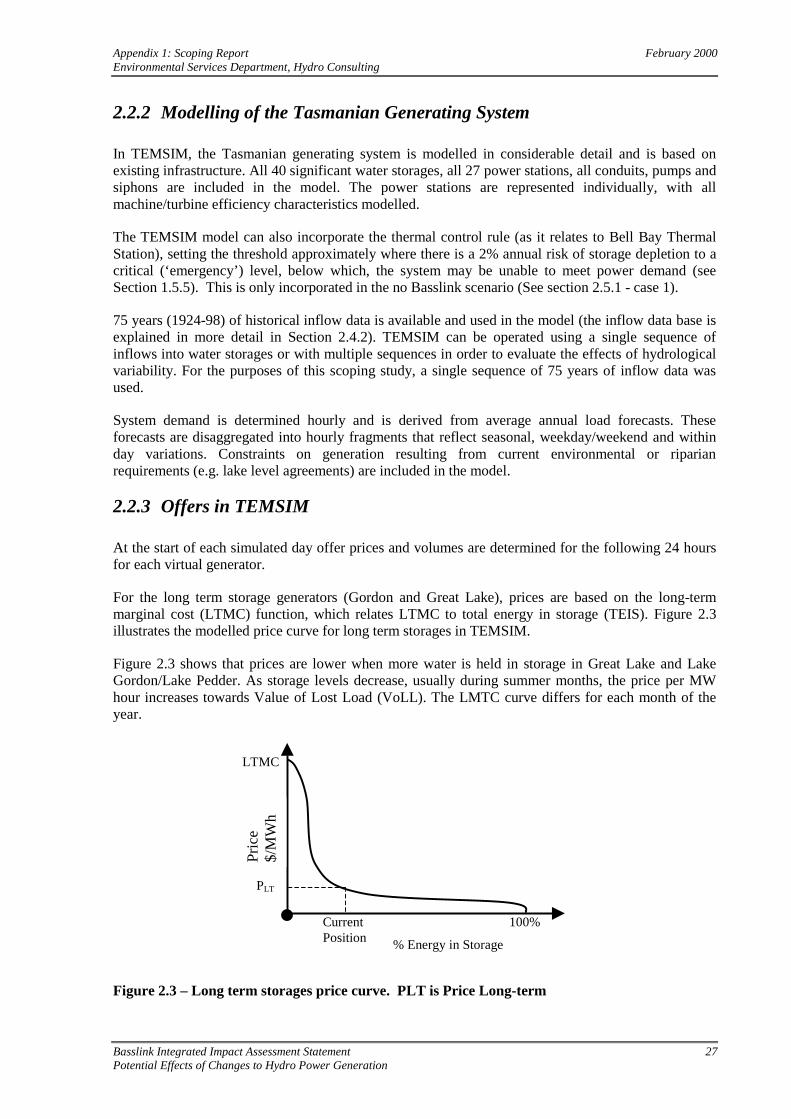


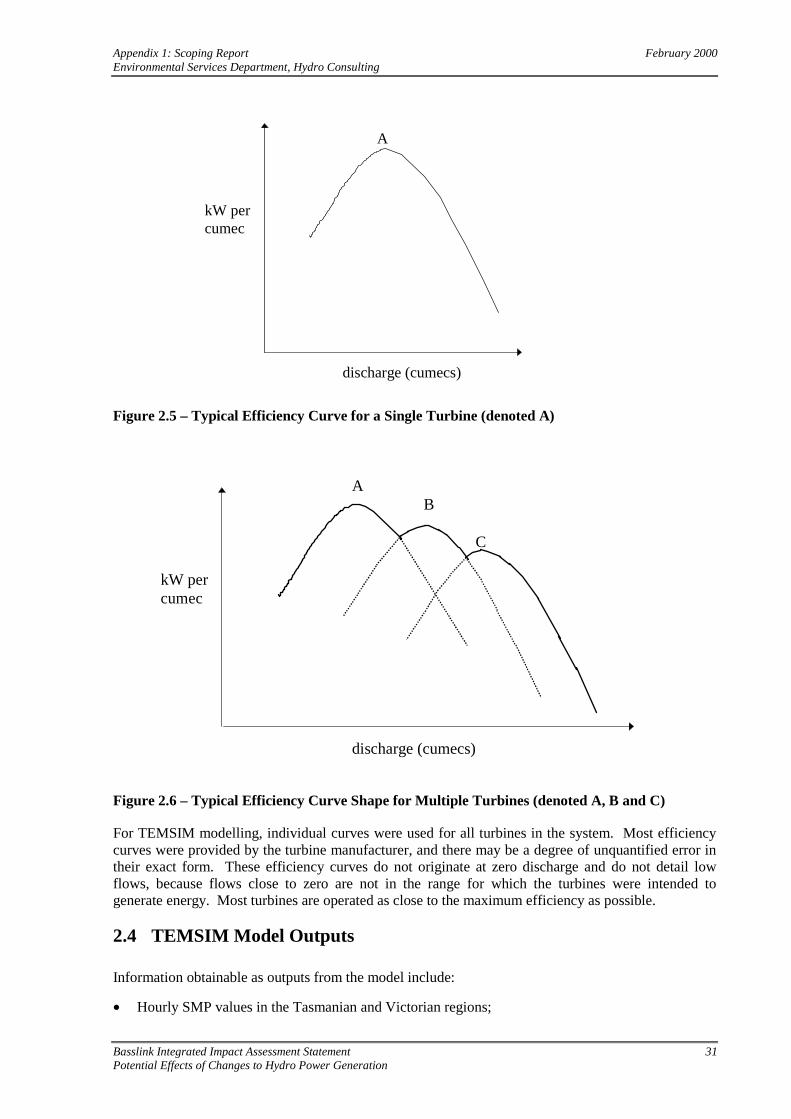
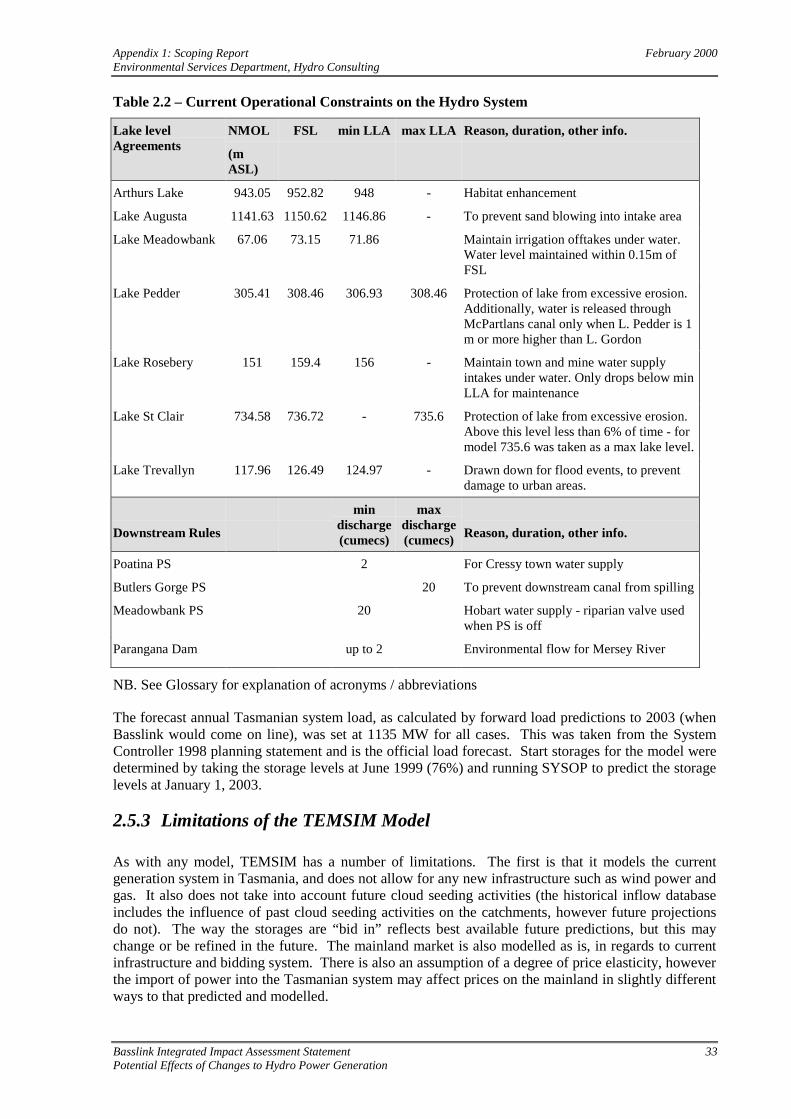


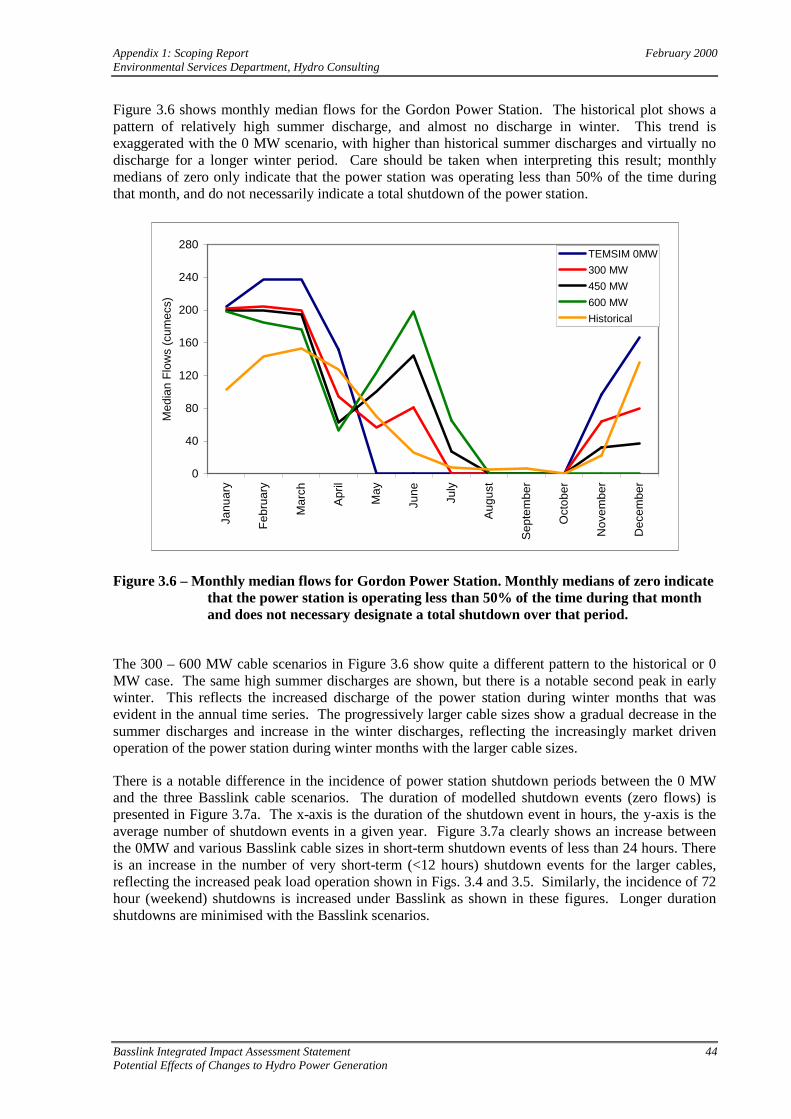
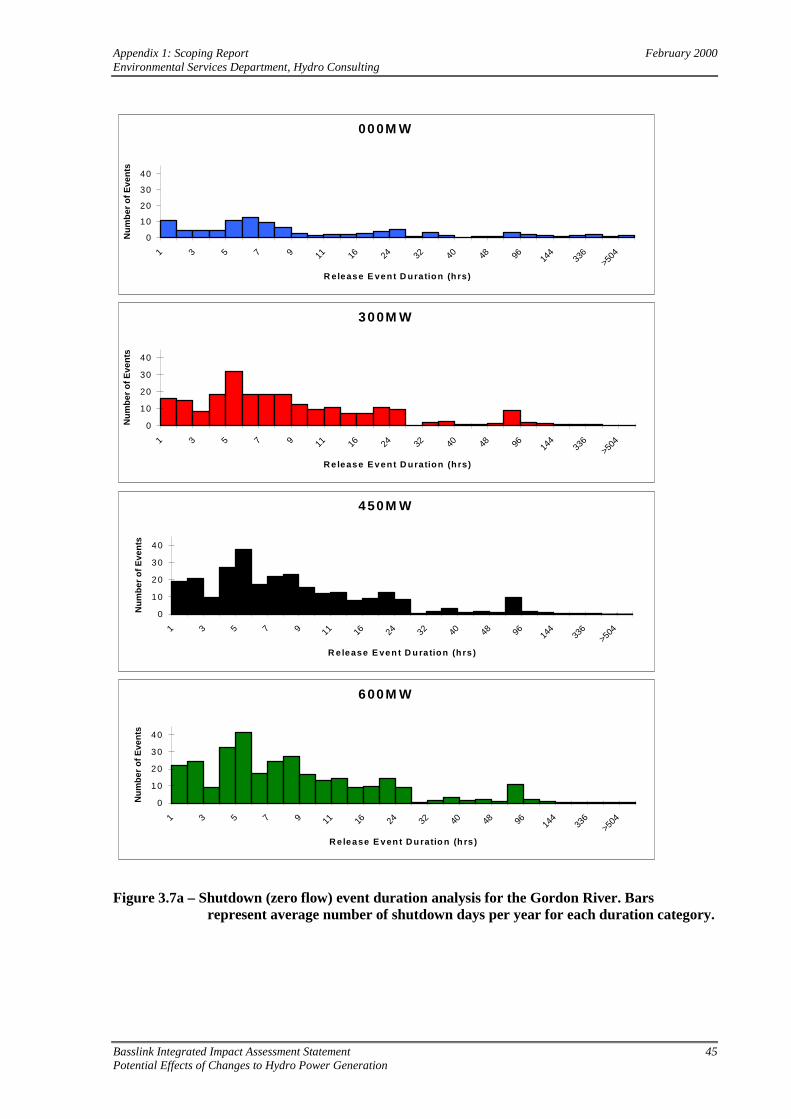

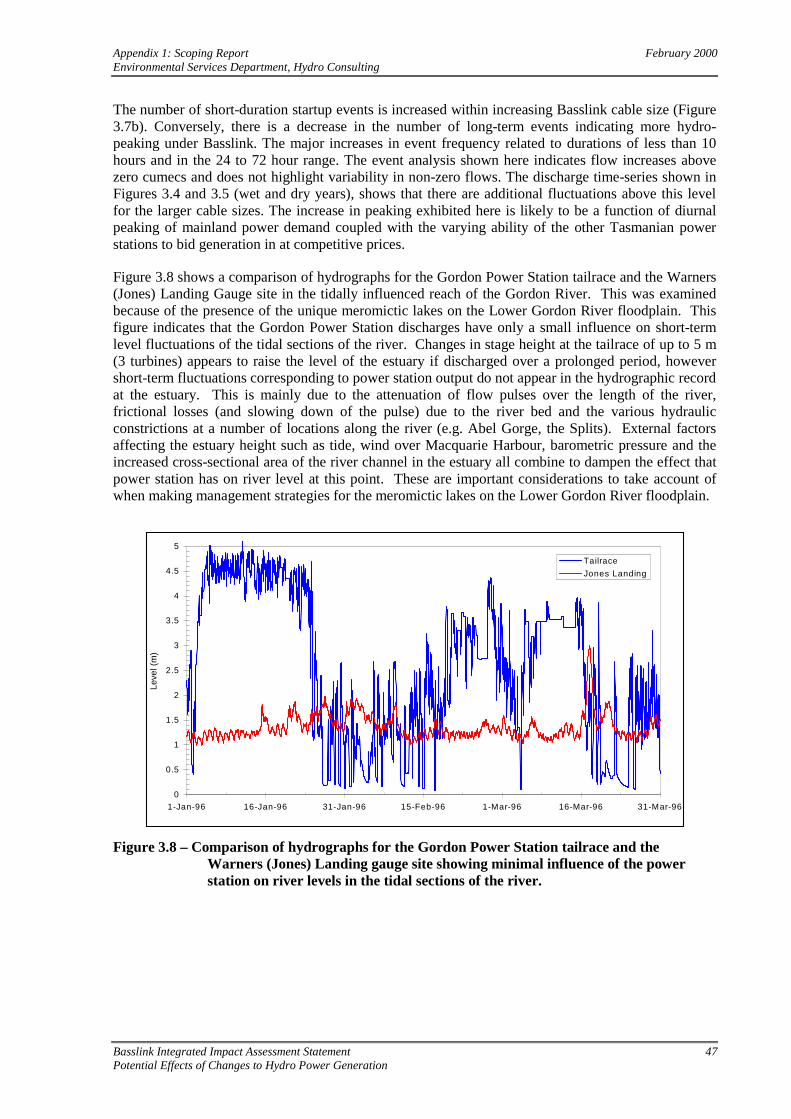

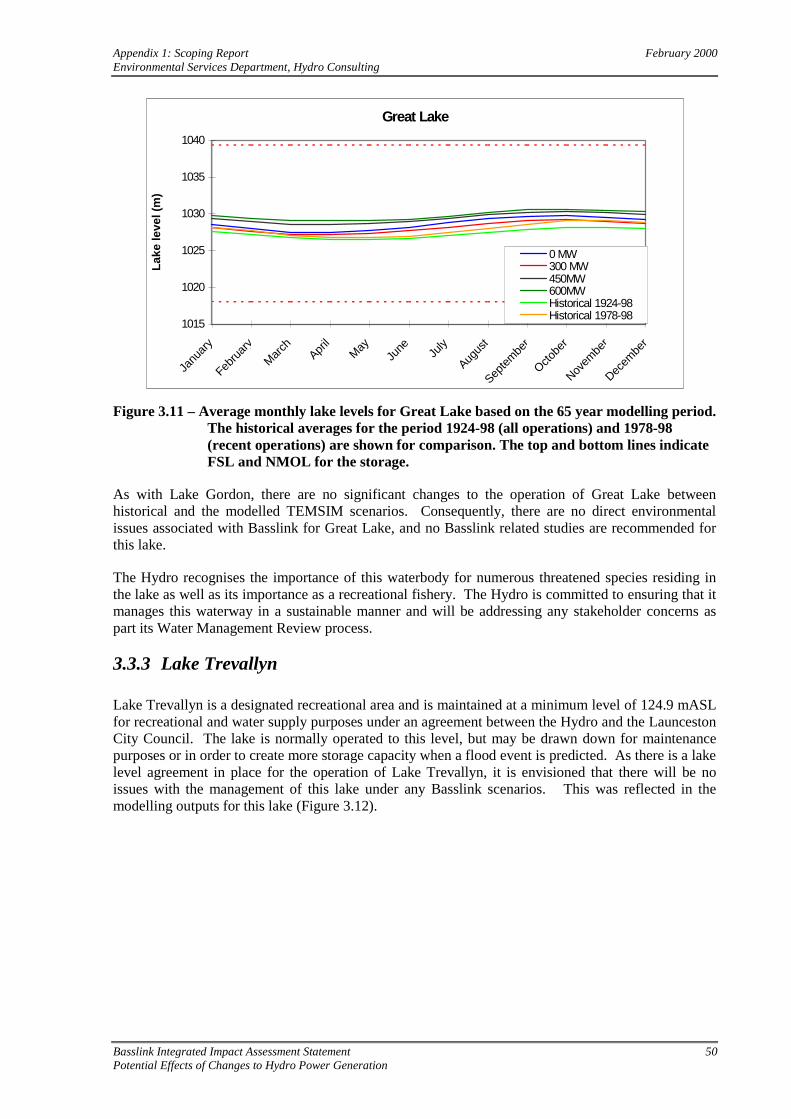
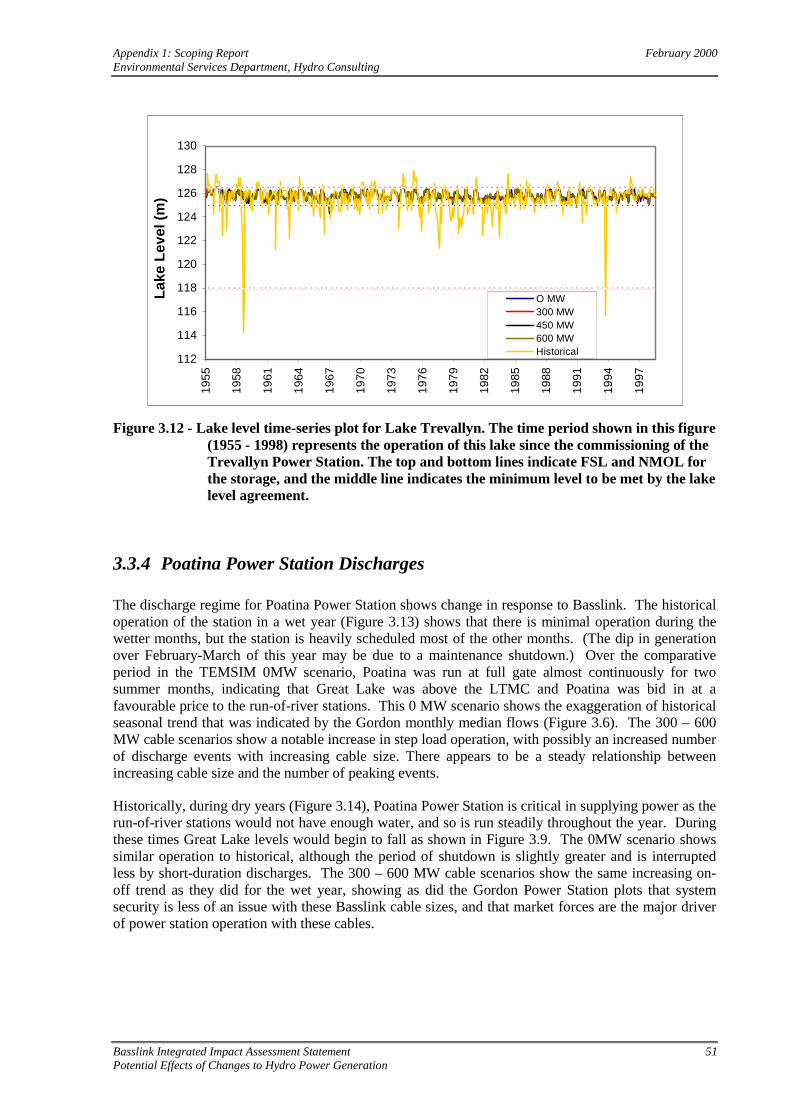
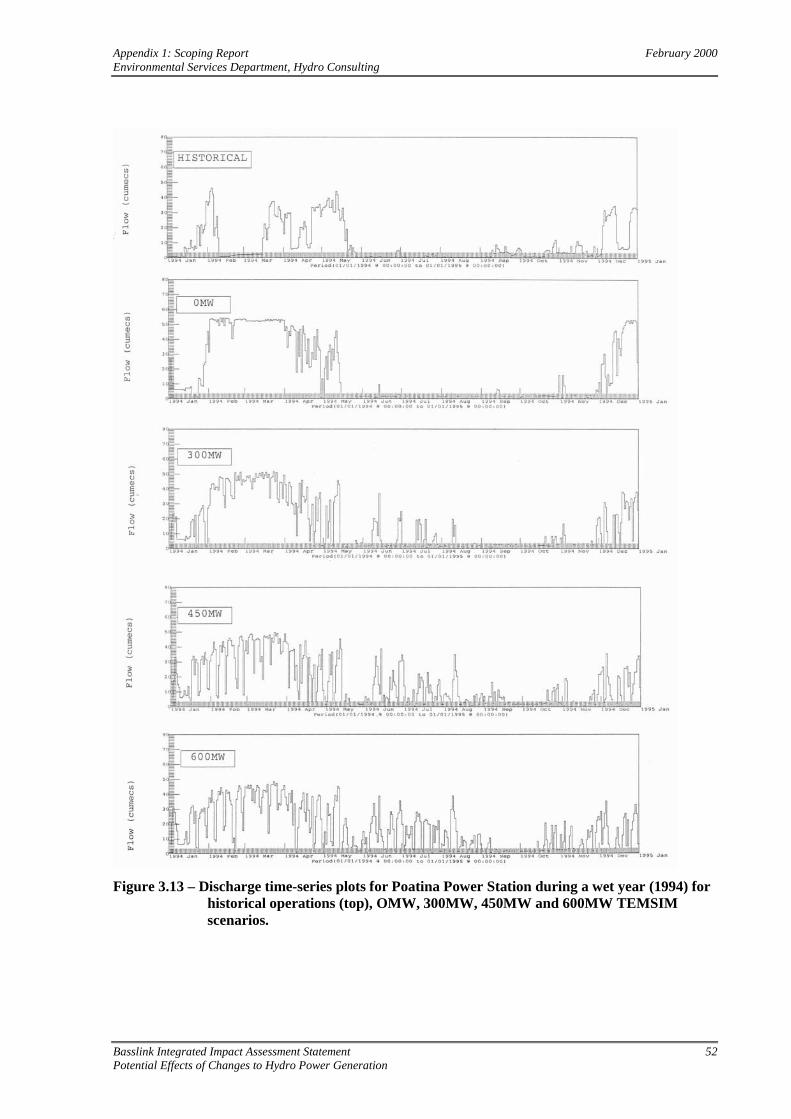


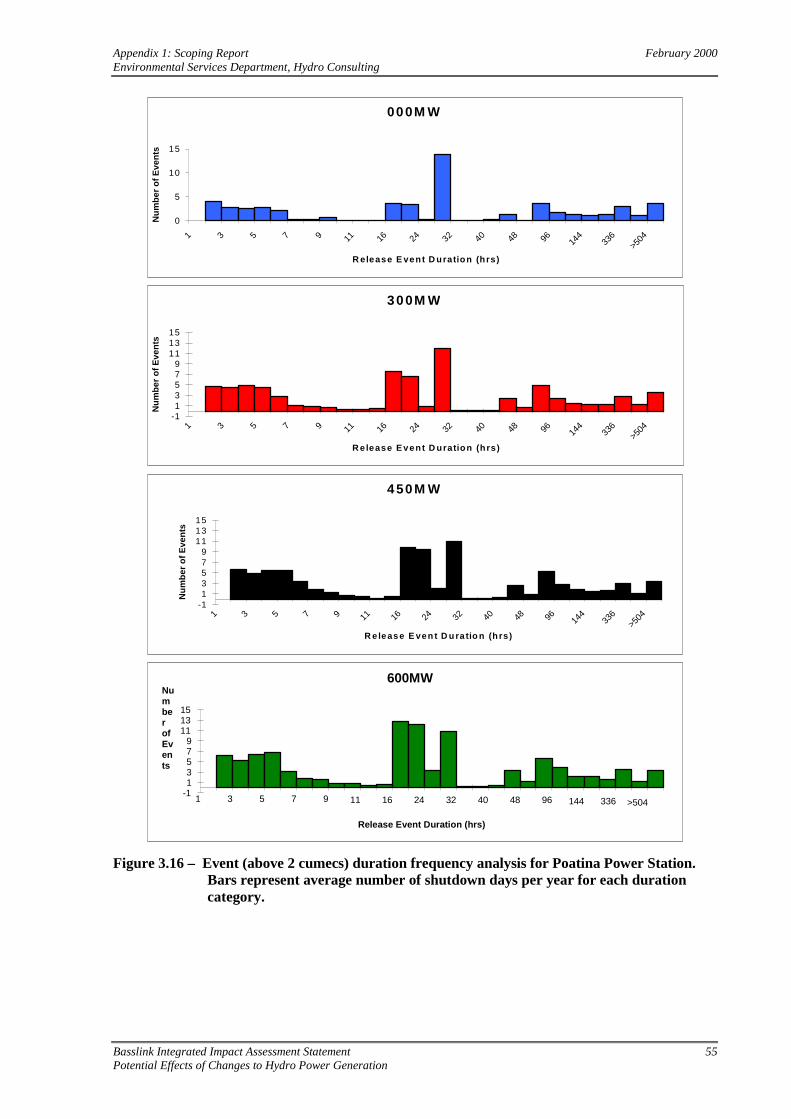
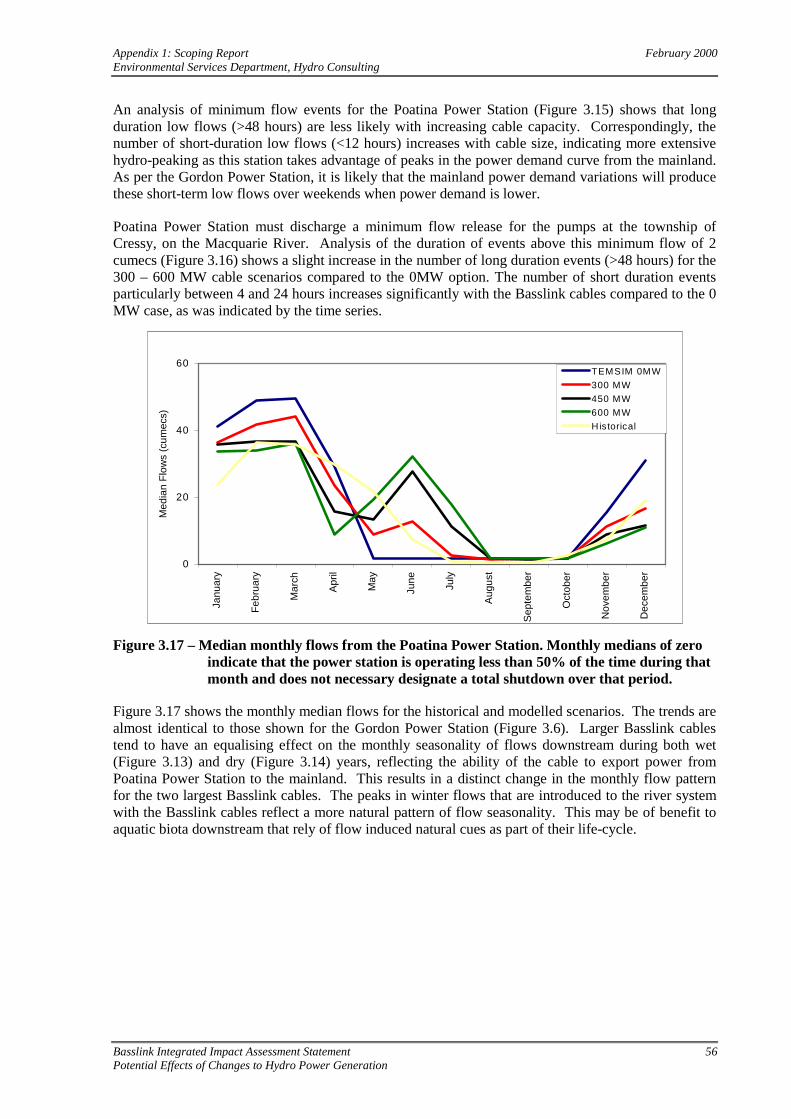


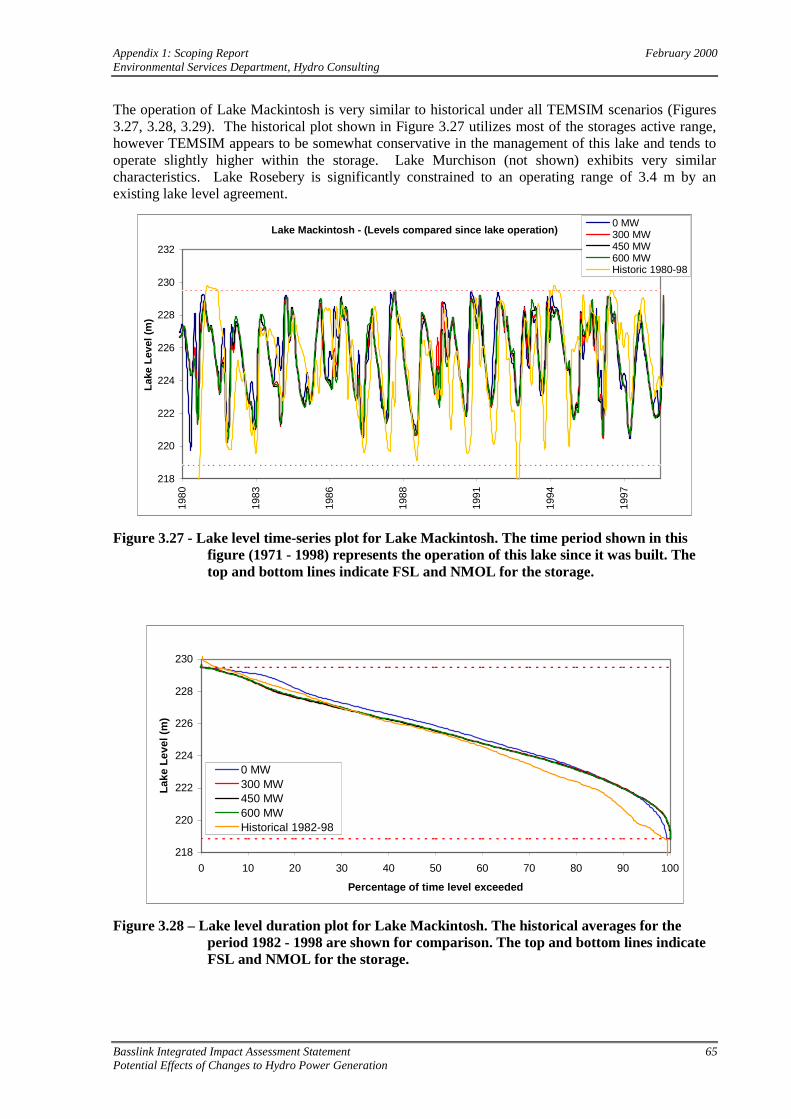

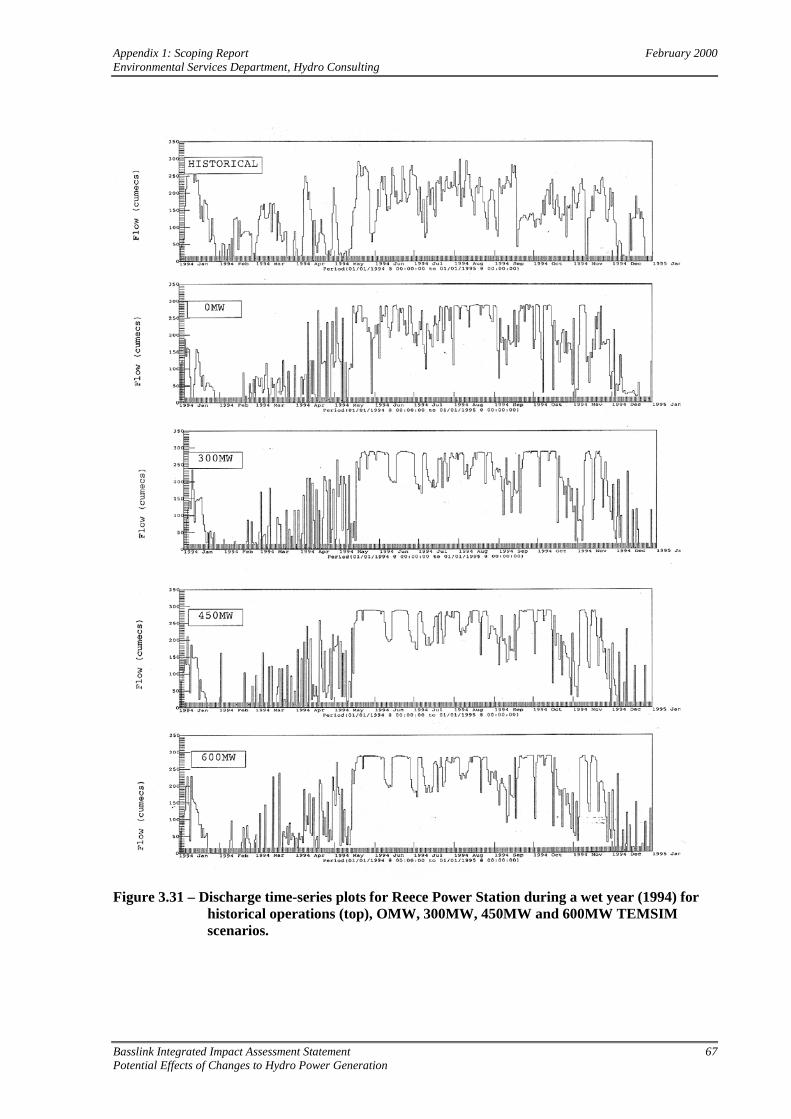


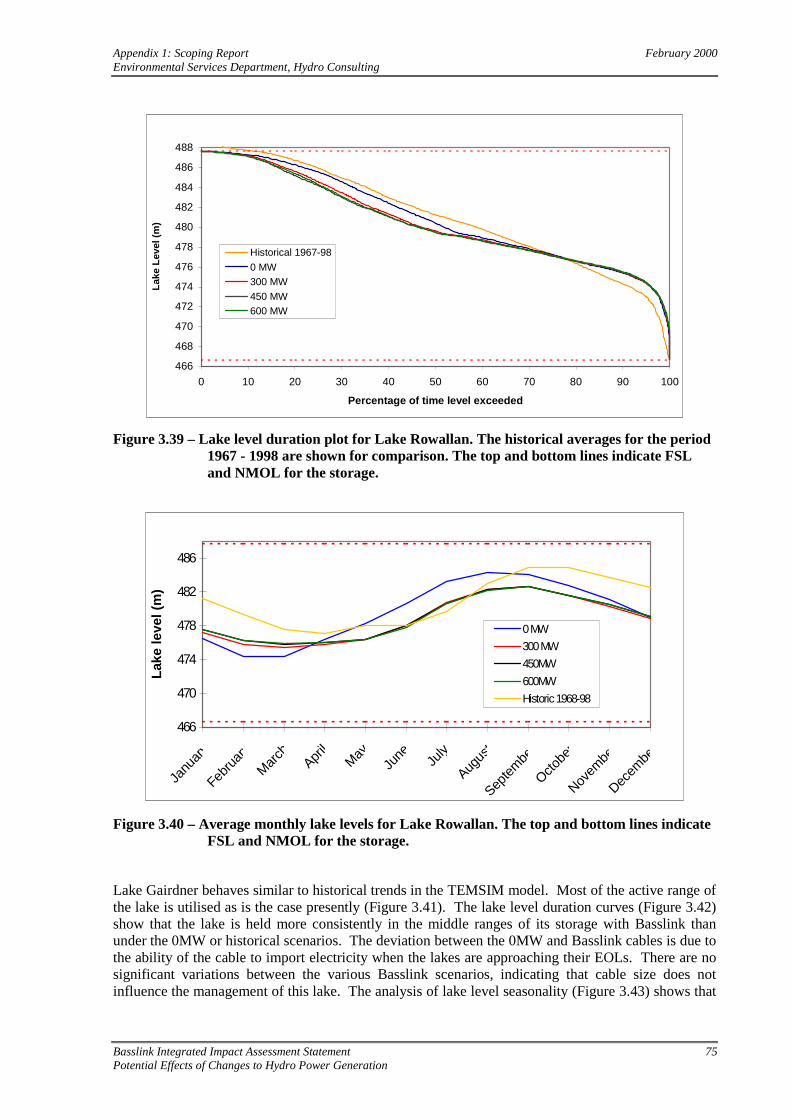


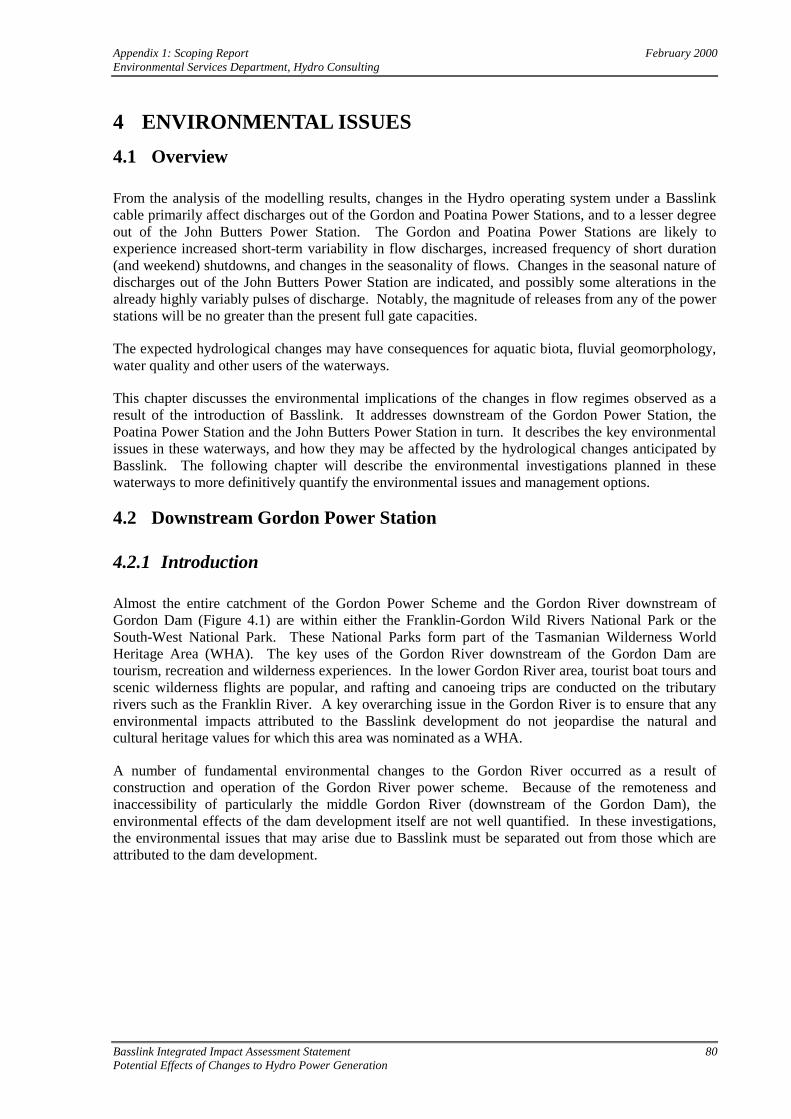
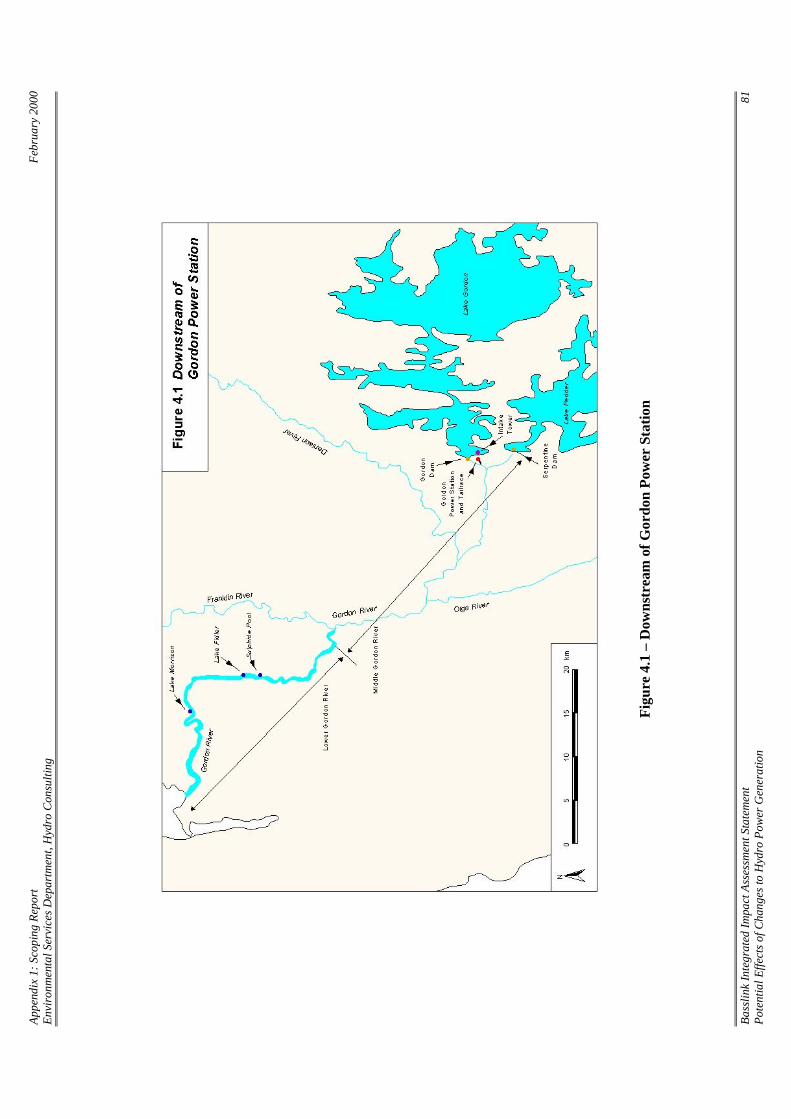


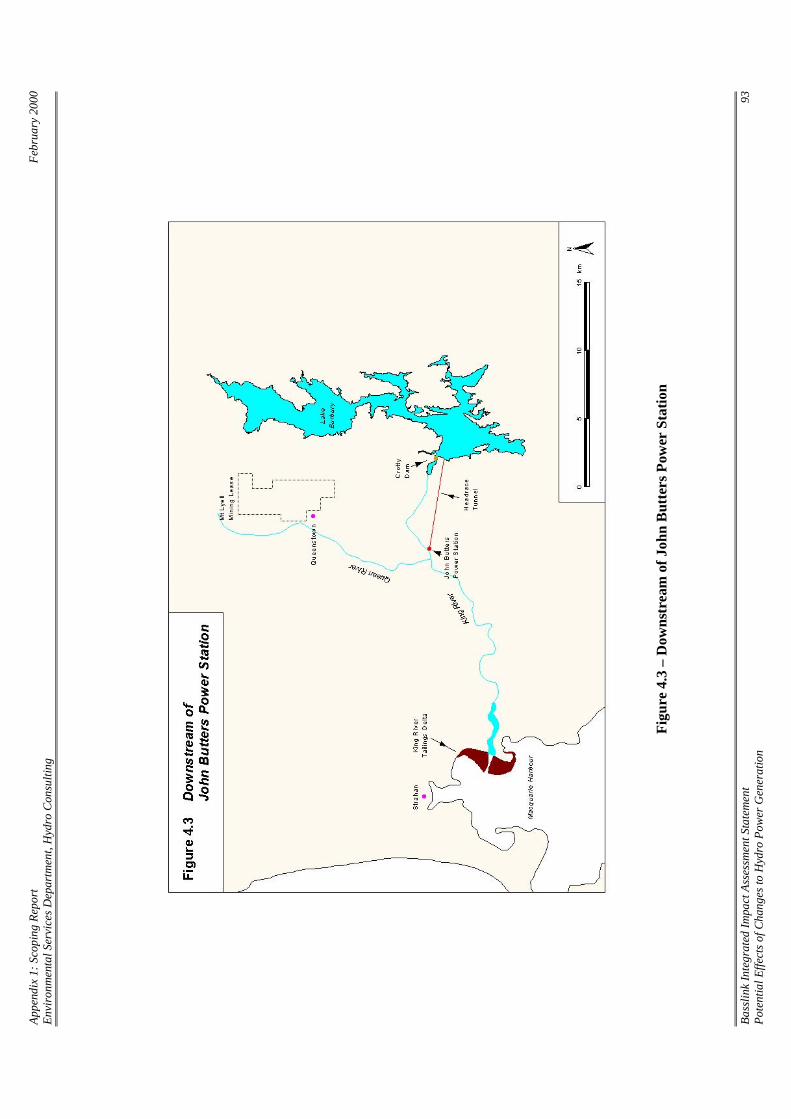


![Web viewfrom word version] Craig Mickle. Partner. Table of Contents. 1.Executive Summary1. ... Basslink is the world’s second longest subsea electricity interconnector,](https://static.documents.pub/doc/80x56/5a8181107f8b9a38478d525e/viewfrom-word-version-craig-mickle-partner-table-of-contents-1executive-summary1.jpg)


