BAT Software Package BAT Software Package BAT Software Package BAT Software Package For Energy Application For Energy Application May, 2015 Designing the Solution for Electrochemistry Potentiostat/Galvanostat І Battery Cycler І Fuel Cell Test Station Potentiostat/Galvanostat І Battery Cycler І Fuel Cell Test Station +82-2-578-6516 І [email protected]www.wonatech.com І www.zivelab.com І www.fctest.com
Transcript
BAT Software Package BAT Software Package BAT Software Package BAT Software Package For Energy ApplicationFor Energy Application
May, 2015
Designing the Solution for ElectrochemistryPotentiostat/Galvanostat І Battery Cycler І Fuel Cell Test StationPotentiostat/Galvanostat І Battery Cycler І Fuel Cell Test Station+82-2-578-6516 І [email protected] І www.zivelab.com І www.fctest.com
BAT Software
•BAT software package is for Energy device test such as
- Battery
- Super capacitor
- Solar cell
- Fuel cell
•This software function in SM software needs a license. (SP1 model has this software as
Standard)Standard)
•BAT provides additional control functions in sequence editor and technique menu.
Strong Points in Energy Application (Software)
Bipolar pulse capability for GSM, CDMA
sine wave control for charger simulation
EVS, GITT,PITT test
Various cutoff setting
Automatic safety limit
C rate control, Crate cutoff
Load, Power control
CC-CV,Crate-CV,CP-CV,CR-CV control
Current step, Voltage step controlIR measurement during battery testIR measurement during battery test
Batch control
PC Independent Operation
• Using 350,000 data points internal memory points internal memory and DSP/FPGA, system works even if PC Xconnection failure
• When PC recovered,
XLater …
stored data will transfer to PC
t ti ll ith t automatically without stopping experiment
Sequence Editor
Control
Sampling
•Tree
Cut-OffSampling
Complex or user defined test can be scheduled using sequence editor.
BAT Control Functions in Sequence Editor
Software package name Standard BAT
GSTAT Yes Yes
Constant
Crate No Yes
PSTAT Yes Yes
POWER No YesLOAD No Yes
CC-CV No YesCrate-CV No Yes
CP-CV No YesCL-CV No YesCL CV No Yes
STEPGSTAT No Yes
PSTAT No Yes
SWEEPGSTAT Yes Yes
SWEEPPSTAT Yes Yes
REST Yes Yes
PulseVpulse No Yes
Ipulse No Yesp
GSINE No Yes
PSINE No Yes
Terminology for Constant Control
• C Rate
Constant control in BAT
C RateThe rate of the current divided by a batteries nominal capacity. If battery norminal capacity is 2000mAhr and 1Amp discharged, Crate is 0.5. 0.5C charging will take 2hours for 2Ahr battery.
• PowerP C V lPower = Current x Voltage. The system reads voltage and control current by I=P/V formula.
• Load Load = Voltage/Current.Load Voltage/Current. The system reads voltage and control current(I) by I=Voltage/load formula
Standard constant control
• GstatConstant galvanostatic control. This means constant current control.
• Pstat
Standard constant control
• PstatConstant potentiostatic control. This means constant voltage control.
Terminology for Step Control
Step control in BAT
• Gstat• GstatGalvanostatic step control. This means current staircase control. Using this function constantcapacity control is available. (Automatic current ranging available)
• PstatPotentiostatic step control. This means voltage staircase control. This control can be used for steady state control.
Data sampling can be selected Data sampling can be selected
Staircase sampling
Terminology for CC-CV Control
CC-CV control in BAT
• CC-CVConstant current-Constant voltage charging or discharging
• Crate-CVCrate-Constant voltage charging or dischargingCrate Constant voltage charging or discharging.
• Constant power-CVConstant power-Constant voltage charging or discharging
• Constant load-CV• Constant load CVConstant load-Constant voltage charging or discharging
Terminology for Pulse Control
Pulse control in BAT
• GstatGalvanostatic pulse control. This means current pulse control. Using this function pulse charging/discharging available (GSM, CDMA etc). Bipolar pulse for reconditioning etc is available.
• Pstat• PstatPotentiostatic pulse control. This means voltage pulse control.
• Time resolution: 50usec
• Max pulse profile No : 3 profiles for current pulse 3 profiles for voltage pulse• Max pulse profile No.: 3 profiles for current pulse, 3 profiles for voltage pulse
• Max pulse segments : 10 segments
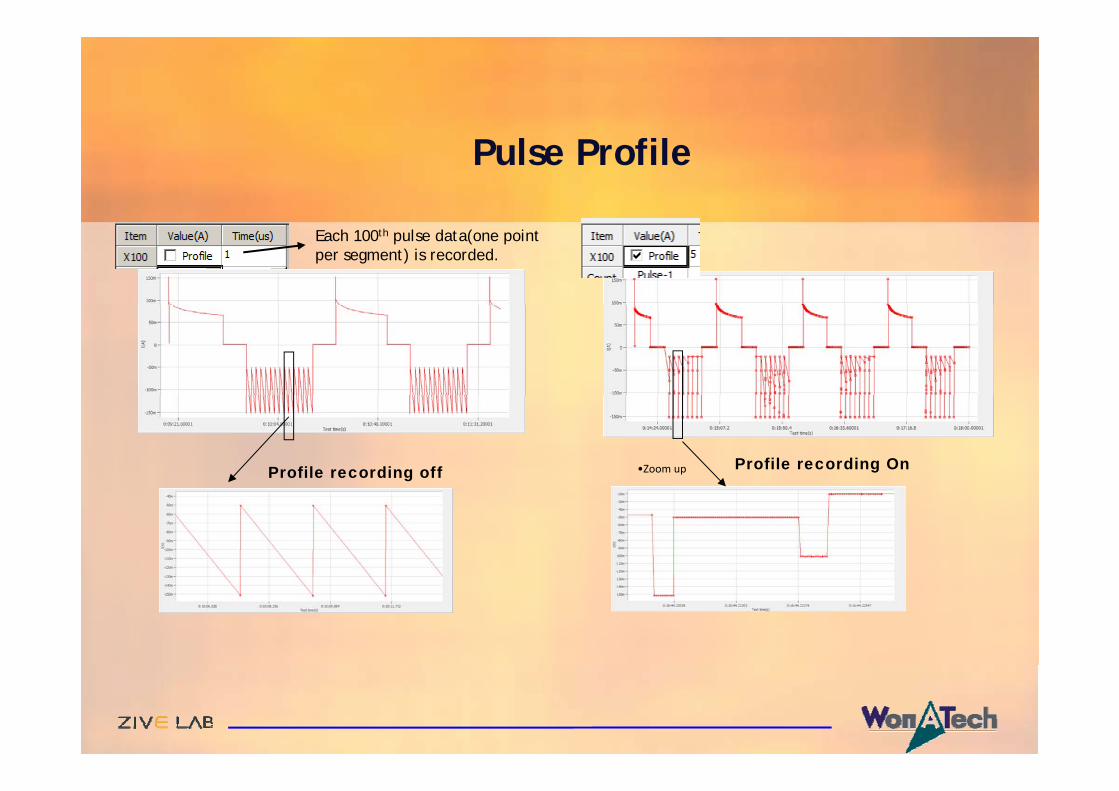
• Pulse profile recording availableth l ll b d d h l bl• Every 100th pulse will be recorded. X100, x200, x300th… setting available.
Pulse Profile
Control value
max. pulse profile: 3 Every 500th pulse recording
4
seg7
seg1
seg4
seg1
seg10
time
Pulse Profile
Each 100th pulse data(one point per segment) is recorded.
•Zoom up Profile recording On Profile recording off
Terminology for Pulse Control
Pulse control in BAT
• GsineGalvanostatic sine wave control. This means current sine wave control. Using this function charger simulation is available.
DC Bias selectionDC Bias selection
- Gsine current: current bias(offset) control
- Gsine power: power Bias(offset) control
l d l d b ( ff ) l- Gsine load: load bias(offset) control
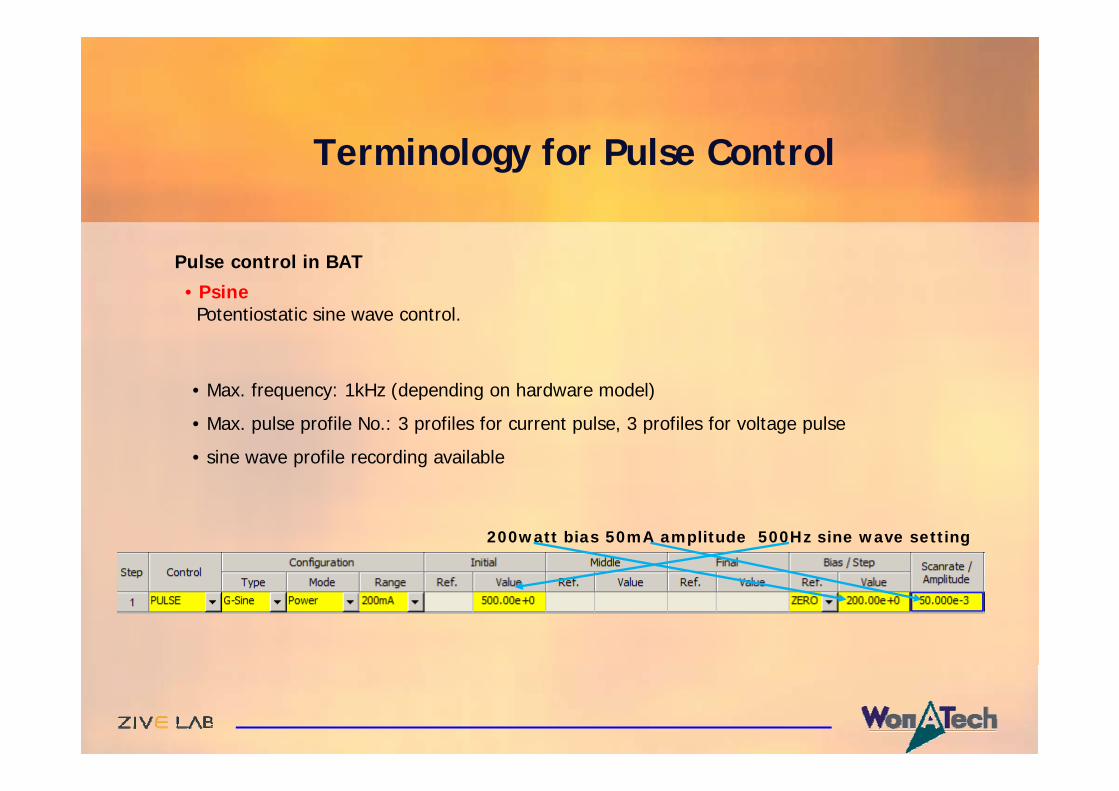
Terminology for Pulse Control
Pulse control in BAT
• PsinePotentiostatic sine wave control.
• Max. frequency: 1kHz (depending on hardware model)Max. frequency: 1kHz (depending on hardware model)
• Max. pulse profile No.: 3 profiles for current pulse, 3 profiles for voltage pulse
• sine wave profile recording available
200watt bias 50mA amplitude 500Hz sine wave setting
Gsine/Psine
Profile recording Sine waveform
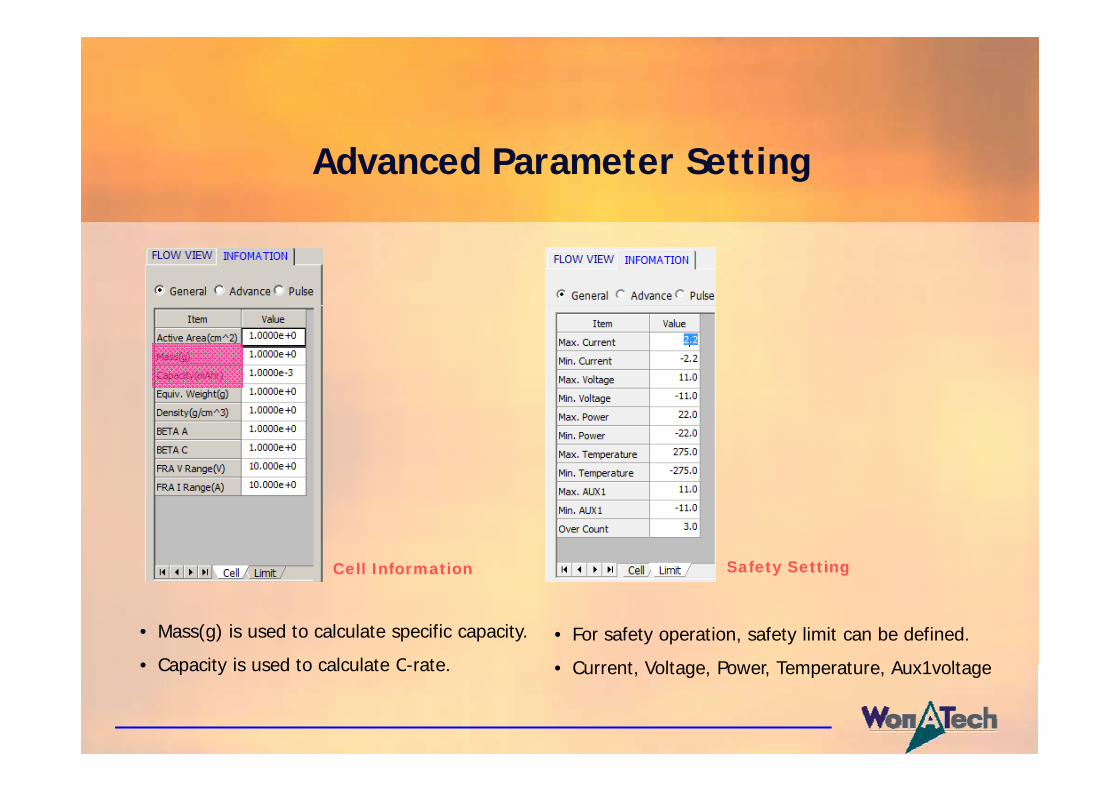
Advanced Parameter Setting
Safety SettingCell Information y g
• Mass(g) is used to calculate specific capacity.
• Capacity is used to calculate C-rate
• For safety operation, safety limit can be defined.
• Current Voltage Power Temperature Aux1voltage• Capacity is used to calculate C-rate. • Current, Voltage, Power, Temperature, Aux1voltage
CC(CP,Crate,CR)-CV
• Sequential control in one step: Constant (I,Crate,P,L)-Constant voltage
Constant(I Crate P L) control Constant voltage controlConstant(I,Crate,P,L) control
V•No time delay
Constant voltage control
Constant voltage Value
Time
Last Value Control
Constant (V,I,P,L), Sweep(V,I), Step(V,I)
Prev. Step Current Step
V
Constant LastValue
Time delay to setup new step
Sweep LastValue
Time
Last value control is based on the reading value of last point in previous step.
Cut-Off Condition
Step TimeVoltage
FCDLCC
Loop timeEoc VoltVoltage
CurrentCurrent densityCapacity
LCCLCDPowerTotal Ahr
|dV/dt||dI/dt||dT/dt| (BAT)
-dVEocWHrFCC
Total WhrCycle timeTest timeLoop ne t
AuxV1,AuxV2,V3(BAT)DI input(BAT)StependFCC Loop next Stepend
Timer
• Step Time, Test time• C-time=> Cycle TimeC time Cycle Time• L-time=> Loop time
CycleLoop
Test time
Step time
Test time
Percent Capacity_Cut Off
LCC(Percent Capacity Of Last Cycle Charge): Percentage based on previous cycle’s charging capacity value
LCD(Percent Capacity Of Last Cycle Discharge): Percentage based on previous cycle’s discharging capacity value
FCC(Percent Capacity Of First Cycle Charge):FCC(Percent Capacity Of First Cycle Charge): Percentage based on the first cycle’s charging capacity value
FCD(Percent Capacity Of First Cycle Discharge): Percentage based on the first cycle’s discharging capacity valuePercentage based on the first cycle s discharging capacity value
Cut-Off Condition (And/Or Logic)
And Logic
Priority Or Logic
Sampling
Or Logic
Time Unit Input :Time Unit Input :
####=>sec,
AA B C => AA hr, B min C sec
AA:B:C => AA hr, B min C sec
Advanced Setting Advanced Setting For Each StepFor Each Step
User can change hardware setting for each step following experiment conditionUser can change hardware setting for each step following experiment condition
For discharging• Low voltage (limit voltage) • Discharging capacity
For charging• charging time • Charging capacitysc a g g capac ty
• Discharging current for CV discharging
• discharging time
C a g g capac ty• Charging current at CV charge• Limit current for constant voltage
charging
CC/CC Technique
• CC/CC technique is for NiCd battery etc. charging/discharging cyclic test
• Charging/discharging selection
•Constant current
•C rate
•Constant Power
•Constant Load
•Voltage pulse1,2,3
•Current pulse1,2,3
• Step end condition
•For discharging
•Low voltage (limit voltage)
•discharging time, capacity
•For charging
•High voltage (limit voltage)
•charging time
•–dV for NiCd battery application etc.
•Capacity
Discharging Technique
• Discharging selection
- Constant current discharging
- Constant Crate discharging
- Constant power discharging
- Constant load discharging
- Current pulse discharging
- Voltage pulse discharging
End condition① Low voltage (limit voltage)② Total time
EVS Technique
EVS raw data
EVS graph format(dQ/dV vs V)(dQ/dV vs. V)
GITT Technique
GITT waveform
GITT raw data
•GITT will apply current pulse with relaxation time to cell. Each current step will keep for input interval(s) time and cell off for rest limit time or until voltage variation meet <dV/dtrest limit time or until voltage variation meet <dV/dt condition
PITT Technique
PITT waveform
PITT raw data
•PITT will apply constant potential for interval time and do rest for rest limit This technique will repeat these two step rest for rest limit. This technique will repeat these two step until potential meet middle potential or final potential
Variable Scanrate CV Technique
This technique will apply several cyclic voltammetry with variable scan rate. Max. scan rate CV cycles are 10.
Steady State CV Technique
In Steady state CV(SSV) , the potential range is scanned starting at the initial potential and ending at the final
i l b i i l i Th potential by staircase potential increment. The current is acquired at end of each step and is plotted as the function of potential. Default data sampling for each step is averaging of 100% step duration.
Potentiostatic IV Curve Technique
In Pstat IV(PIV), the potential range is scanned starting at the initial potential and ending at the final potential by staircase potential increment. The current is acquired at end of each step and is plotted as the function of potentialand is plotted as the function of potential.
Galvanostatic IV Curve Technique
In Gstat IV(GIV), the current range is scanned starting at the initial current and ending at the final current by staircase current increment. The voltage is acquired at end of each step and is plotted as the function of potentialacquired at end of each step and is plotted as the function of potential.
Auto current ranging is available.
Batch File Function
Batch file is for sequential operation with sequence file and/or technique file.
Cycling(looping) availableCycling(looping) available
Editing available for each sequence file or technique file
Control Menu
Virtual Control Panel
Single channel control/Status view
Multichannel control / Status view
Start Experiment
Single channel menu Multichannel Menu
Automatic file name available
User defined folder saving available
Real Time GraphSingle channel
DC data real time plot
Real Time Graph Setting
axis setting for sequence data axis setting for Technique data
Real Time Graph for Multichannel
Single channel operation Multichannel operation
Strip Chart(Real Time)
Simple Monitor
Highest layer locationColor
• For DC test• For EIS test
Highest layer location• Grey: idle
• Violet: charging
• Blue: discharging• Blue: discharging
• Green: EIS measurement
• Yellow: calibration
• Red: error (safety limit etc.)
Data Files
DC data only : File(SDO)- DC graph & cycle graph
DC data and EIS data : File(SDE)- DC/EIS/Cycle Graph
IVMANTM software reads SDO, SDE file for DC data analysis.
D C i Data Converting (Binary to Ascii or Excel Format)
Multiple data files conversionMultiple data files conversion
Data conversion from graph
Conversion from report
Advanced Graph Setting
Graph Option
DC Graph Shortcut
Shortcut iconShortcut icon
DC Graph Parameters•X axis: total test time(test time), Voltage(Eref), current(I,I_s,I_d), Aux1, Aux2, Aux3, Temperature, Log(I,I_d,I_s), load,Load_s,Load_d, Charging capacity(ChQ,ChQ_s,ChQ_d), discharging capacity(DchQ, DchQ_s, DchQ_d), charging power(Ch P, Ch P_s, Ch P_d), di h i (D h P D h P D h P d) h i (Ch Wh Ch Wh Ch Wh d) discharging power(Dch P, Dch P_s, Dch P_d), charging energy(Ch-Wh, Ch-Wh_s, Ch-Wh_d), discharging energy(Dch-Wh, Dch-Wh_s, Dch-Wh_d), accumulated energy(Sum Wh, Sum Wh_s, Sum Wh_d)), Accumulated capacity(Sum Q, Sum Q_d, Sum Q_s), absolute accumulated capacity(Sum |Q|, Sum |Q_s|, Sum |Q_d|), absolute capacity(|Q|,|Q_s|,|Q_d|), Cycle time, Step time,
•Max 4 Y axis
•Y1,Y2,Y3,Y4axis: Voltage(Eref), current(I), current(I,I_s,I_d), Aux1, Aux2, Aux3, Temperature, Log(I,I_d,I_s), load,Load_s,Load_d, Charging capacity(ChQ,ChQ_s,ChQ_d), discharging capacity(DchQ, DchQ_s, DchQ_d), charging power(Ch P, Ch P_s, Ch P_d), discharging power(Dch P, Dch P_s, Dch P_d), charging energy(Ch-Wh, Ch-Wh_s, Ch-Wh_d), di h i (D h h D h h D h h d) l d (S h S h discharging energy(Dch-Wh, Dch-Wh_s, Dch-Wh_d), accumulated energy(Sum Wh, Sum Wh_s, Sum Wh_d)), Accumulated capacity(Sum Q, Sum Q_d, Sum Q_s), absolute accumulated capacity(Sum |Q|, Sum |Q_s|, Sum |Q_d|), absolute capacity(|Q|,|Q_s|,|Q_d|), Polarization resistance(Rp), Capacity difference vs. voltage difference(dQ/dV, dQ_s/dV, dQ_d/dV)Q_ )
•The parameters related to current such as current, capacity, energy, power, load etc will be changed specific or density when you select weight or active area. If you select specific, _s will be added to parameter name and if you select density, _d will be added to parameter name automatically.
Cycle Graph Shortcut
Shortcut iconShortcut icon
Cycle Graph Parameters
•X axis: l b (C l N ) h i i (Ch Q) di h i icycle number(Cycle No), charging capacity(Ch Q), discharging capacity
i lt (M V) ifi h i it (ChQ ) ifimaximum voltage(MaxV), specific charging capacity(ChQs), specific discharging capacity(DchQ), charging average voltage(ChVavg), discharging average voltage(DchVavg), cycle average voltage(Vavg), depth of discharge
•Y axis:Y axis: charging capacity(Ch Q), discharging capacity(Dch Q), accumulated capacity(Sum Q), Coulomb efficiency(Coulomb Eff), charging energy(Ch-Wh), discharging energy(Dch-Wh), accumulated energy(Sum Wh), energy efficiency(Energy Eff), minimum voltage(MinV), maximum voltage(MaxV),efficiency(Energy Eff), minimum voltage(MinV), maximum voltage(MaxV), specific charging capacity(ChQs), specific discharging capacity(DchQ), charging average voltage(ChVavg), discharging average voltage(DchVavg), cycle average voltage(Vavg), cycle number, Log(cycle number)
Report/Data editing
DC data report
Filtering
Data delete
Editing
IVMAN Software Module
IVMAN Diff. Software• Battery test data analysis• Electrochemical voltage spectroscopy (dQ/dV vs. V)• Voltage vs. capacity analysis (V vs. Q)
Photovoltaic cell analysis• photo induced current, diode quality factor, series resistance, etc. •-open circuit voltage, open circuit current, max. power, efficiency•Automatic analysis of parameters• g p y y ( )
• Cycle graph (Q vs. cycle)• Differential voltage graph(dV/dQ vs. Q)
Extractor• Extracting data by cycle number or step
Peak Find ModuleI d d t k fi di ft Extracting data by cycle number or step