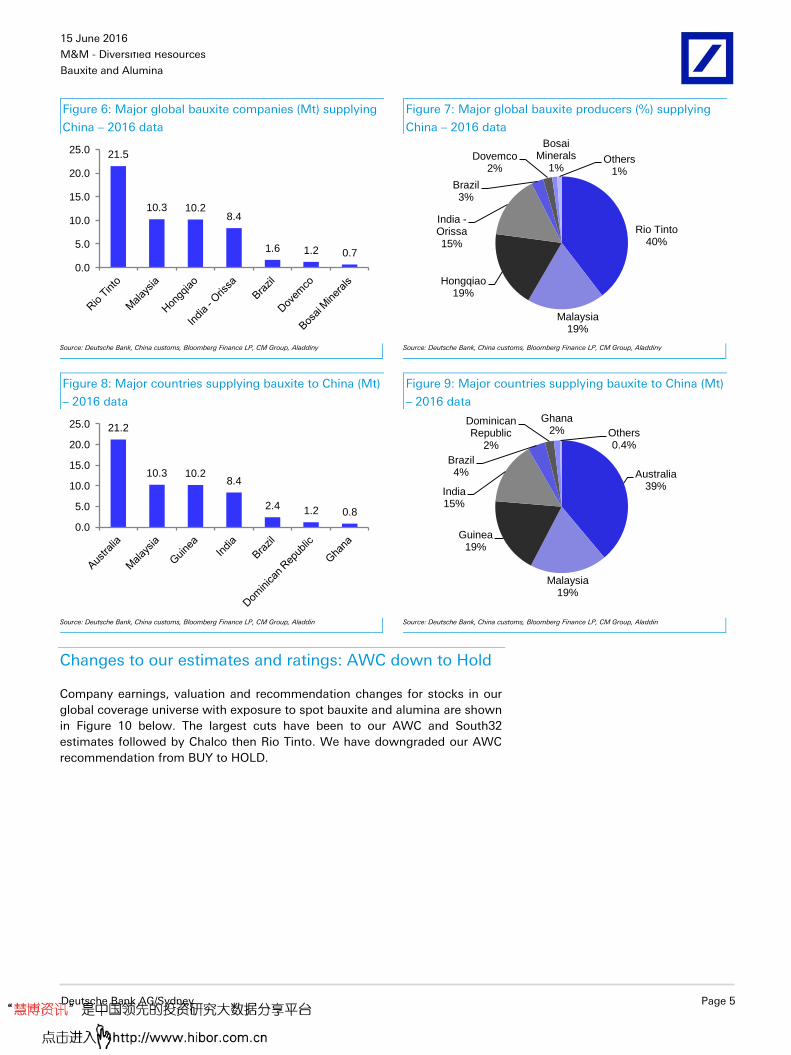
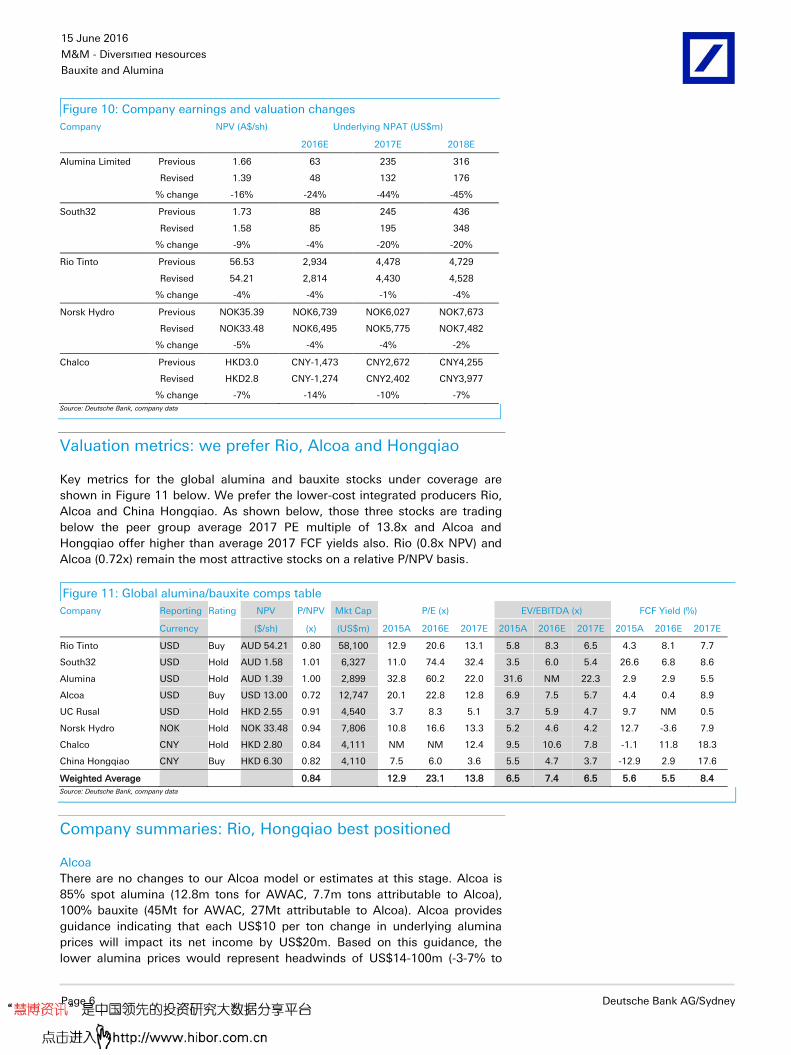
Deutsche Bank Markets Research Australasia Australia M&M - Diversified Resources Industry Bauxite and Alumina Date 15 June 2016 Forecast Change Global deep dive: China well supplied Downgrading seaborne alumina and bauxite price forecasts ________________________________________________________________________________________________________________ Deutsche Bank AG/Sydney Deutsche Bank does and seeks to do business with companies covered in its research reports. Thus, investors should be aware that the firm may have a conflict of interest that could affect the objectivity of this report. Investors should consider this report as only a single factor in making their investment decision. DISCLOSURES AND ANALYST CERTIFICATIONS ARE LOCATED IN APPENDIX 1. MCI (P) 057/04/2016. Paul Young Research Analyst (+61) 2 8258-2587 [email protected]Anna Mulholland, CFA Research Analyst (+44) 20 754-18172 [email protected]Jorge Beristain, CFA Research Analyst (+1) 203 863-2381 [email protected]Sharon Ding Research Analyst (-) - - [email protected]Grant Sporre Research Analyst (+44) 20 754-58170 [email protected]George Buzhenitsa Research Analyst (+971) 4 361-1734 [email protected]Rene Kleyweg Research Analyst (+44) 20 754-18178 [email protected]Key Changes Company Target Price Rating RIO.AX 56.50 to 54.20(AUD) - S32.AX 1.70 to 1.60(AUD) - NHY.OL 33.00 to 31.00(NOK) - AWC.AX 1.65 to 1.40(AUD) Buy to Hold 2600.HK 3.00 to 2.80(HKD) - 0486.HK 2.55 to 2.45(HKD) - Source: Deutsche Bank Companies Featured Rio Tinto (RIO.AX),AUD42.96 Buy South32 (S32.AX),AUD1.57 Hold Norsk Hydro (NHY.OL),NOK31.15 Hold Alumina (AWC.AX),AUD1.36 Hold Alcoa (AA.N),USD9.10 Buy Chalco (2600.HK),HKD2.36 Hold China Hongqiao Group Ltd. (1378.HK),HKD5.18 Buy United Company RUSAL (0486.HK),HKD2.32 Hold Vedanta Resources (VED.L),GBP373.00 Hold Source: Deutsche Bank China is the world's largest alumina producer and largest consumer of third party seaborne bauxite importing around 40% of their bauxite needs. Our recent field trip to Henan province in China uncovered that alumina refineries began restarting at US$245-250/t (seaborne Eq price). Also, our seaborne bauxite SD model shows that China is well supplied until 2020. We are downgrading our alumina price forecasts by an average 15% with 2016 down to US$236/t (vs. spot at US$246/t) and lowering our bauxite price forecast from 2018 onwards. We are downgrading AWC to a HOLD. In our global alumina/bauxite coverage we prefer Hongqiao, Alcoa, and Rio Tinto (all BUYs). Seaborne alumina: Chinese restarts and capacity growth weigh on price Based on new capacity build and restarts we expect a 7% increase in Chinese alumina production in 2016 to 61.5Mt and then a further 6% growth to 65Mt in 2017. The recent recovery in the Chinese domestic alumina price to RMB1,950/t (US$250/t seaborne equivalent) has resulted in 4.5Mt of restarts. We see RMB1,900/t (US$245/t) as the critical price level. Above this, more idled capacity will restart and below this more capacity will be curtailed. However this “equilibrium price” level continues to decline as new low cost refineries are brought on-line. As such, this should weigh on alumina imports and we have downgraded our seaborne alumina price forecasts by 6% in 2016 to US$236/t and by 13% in 2017 to US$245/t. We have also downgraded our long run price by 9% to US$290/t (real). We see this as the price required to incentivize restarts of high-cost curtailed refineries in the Atlantic. Seaborne bauxite: oversupplied until 2020 Chinese bauxite imports have increased from 30Mt in 2010 to 56Mt in 2015, and are forecast to increase to 80Mtpa by 2020. China appears to be well supplied until the end of the decade however. Our Chinese bauxite SD model predicts a rising market surplus, increasing to 10Mt in 2018. This is mainly due to increasing exports from Australia and Guinea, which is offsetting a drop from Malaysia. We also see the risk that Indonesia resumes exports in 2017. In addition, we estimate that China has 34Mt or 40 weeks of supply of imported bauxite stocks. Over the long run, we see China’s bauxite deposits declining in quality, pushing the market into deficit by 2021, even with Rio Tinto’s 22Mtpa Amrun project. The bauxite price has declined from US$75/t in 2014 to US$46/t, and we expect prices to stay under pressure over the medium term. Hongqiao, Rio Tinto, Alcoa/AWC best positioned The largest sellers of third party alumina are AWC and Alcoa (AWAC JV) and Chalco while Rio Tinto is the largest seller of third-party bauxite. Chinese companies Hongqiao and Chalco are the largest third party buyers of bauxite to supply their domestic alumina refineries. The most integrated and lowest cost company is China Hongqiao. From a valuation and market position perspective, we prefer Hongqiao, Alcoa and Rio Tinto (all BUYs). Valuation and sector risks Our PT’s are set broadly in-line with our DCF derived valuations. Company risks include adverse commodity and currency movements (pg. 28). This report changes price targets, recommendations and estimates for several companies under coverage; for details, please see Figure 10.
Transcript
Deutsche Bank Markets Research
Australasia
Australia
M&M - Diversified Resources
Industry
Bauxite and Alumina
Date
15 June 2016
Forecast Change
Global deep dive: China well supplied
Downgrading seaborne alumina and bauxite price forecasts
Deutsche Bank does and seeks to do business with companies covered in its research reports. Thus, investors should be aware that the firm may have a conflict of interest that could affect the objectivity of this report. Investors should consider this report as only a single factor in making their investment decision. DISCLOSURES AND ANALYST CERTIFICATIONS ARE LOCATED IN APPENDIX 1. MCI (P) 057/04/2016.
China is the world's largest alumina producer and largest consumer of third party seaborne bauxite importing around 40% of their bauxite needs. Our recent field trip to Henan province in China uncovered that alumina refineries began restarting at US$245-250/t (seaborne Eq price). Also, our seaborne bauxite SD model shows that China is well supplied until 2020. We are downgrading our alumina price forecasts by an average 15% with 2016 down to US$236/t (vs. spot at US$246/t) and lowering our bauxite price forecast from 2018 onwards. We are downgrading AWC to a HOLD. In our global alumina/bauxite coverage we prefer Hongqiao, Alcoa, and Rio Tinto (all BUYs).
Seaborne alumina: Chinese restarts and capacity growth weigh on price Based on new capacity build and restarts we expect a 7% increase in Chinese alumina production in 2016 to 61.5Mt and then a further 6% growth to 65Mt in 2017. The recent recovery in the Chinese domestic alumina price to RMB1,950/t (US$250/t seaborne equivalent) has resulted in 4.5Mt of restarts. We see RMB1,900/t (US$245/t) as the critical price level. Above this, more idled capacity will restart and below this more capacity will be curtailed. However this “equilibrium price” level continues to decline as new low cost refineries are brought on-line. As such, this should weigh on alumina imports and we have downgraded our seaborne alumina price forecasts by 6% in 2016 to US$236/t and by 13% in 2017 to US$245/t. We have also downgraded our long run price by 9% to US$290/t (real). We see this as the price required to incentivize restarts of high-cost curtailed refineries in the Atlantic.
Seaborne bauxite: oversupplied until 2020 Chinese bauxite imports have increased from 30Mt in 2010 to 56Mt in 2015, and are forecast to increase to 80Mtpa by 2020. China appears to be well supplied until the end of the decade however. Our Chinese bauxite SD model predicts a rising market surplus, increasing to 10Mt in 2018. This is mainly due to increasing exports from Australia and Guinea, which is offsetting a drop from Malaysia. We also see the risk that Indonesia resumes exports in 2017. In addition, we estimate that China has 34Mt or 40 weeks of supply of imported bauxite stocks. Over the long run, we see China’s bauxite deposits declining in quality, pushing the market into deficit by 2021, even with Rio Tinto’s 22Mtpa Amrun project. The bauxite price has declined from US$75/t in 2014 to US$46/t, and we expect prices to stay under pressure over the medium term.
Hongqiao, Rio Tinto, Alcoa/AWC best positioned The largest sellers of third party alumina are AWC and Alcoa (AWAC JV) and Chalco while Rio Tinto is the largest seller of third-party bauxite. Chinese companies Hongqiao and Chalco are the largest third party buyers of bauxite to supply their domestic alumina refineries. The most integrated and lowest cost company is China Hongqiao. From a valuation and market position perspective, we prefer Hongqiao, Alcoa and Rio Tinto (all BUYs).
Valuation and sector risks Our PT’s are set broadly in-line with our DCF derived valuations. Company risks include adverse commodity and currency movements (pg. 28). This report changes price targets, recommendations and estimates for several companies under coverage; for details, please see Figure 10.
15 June 2016
M&M - Diversified Resources
Bauxite and Alumina
Page 2 Deutsche Bank AG/Sydney
Table Of Contents
Chinese alumina well supplied until 2020 .......................... 3 Downgrading seaborne alumina and bauxite prices ........................................... 3 Company exposures ........................................................................................... 4 Changes to our estimates and ratings: AWC down to Hold ............................... 5 Valuation metrics: we prefer Rio, Alcoa and Hongqiao ...................................... 6 Company summaries: Rio, Hongqiao best positioned ........................................ 6
Chinese Alumina market .................................................. 10 Chinese alumina price driving seaborne alumina price .................................... 10 Chinese Supply/Demand .................................................................................. 12 The Chinese cost curve ..................................................................................... 16 The Global cost curve ....................................................................................... 18
Seaborne Bauxite market ................................................. 19 China well supplied until 2020 .......................................................................... 19 The seaborne bauxite price ............................................................................... 22 Global seaborne (China bound) bauxite costs and margins .............................. 23
Company Financials ......................................................... 27 Valuation and risks ........................................................................................... 27
15 June 2016
M&M - Diversified Resources
Bauxite and Alumina
Deutsche Bank AG/Sydney Page 3
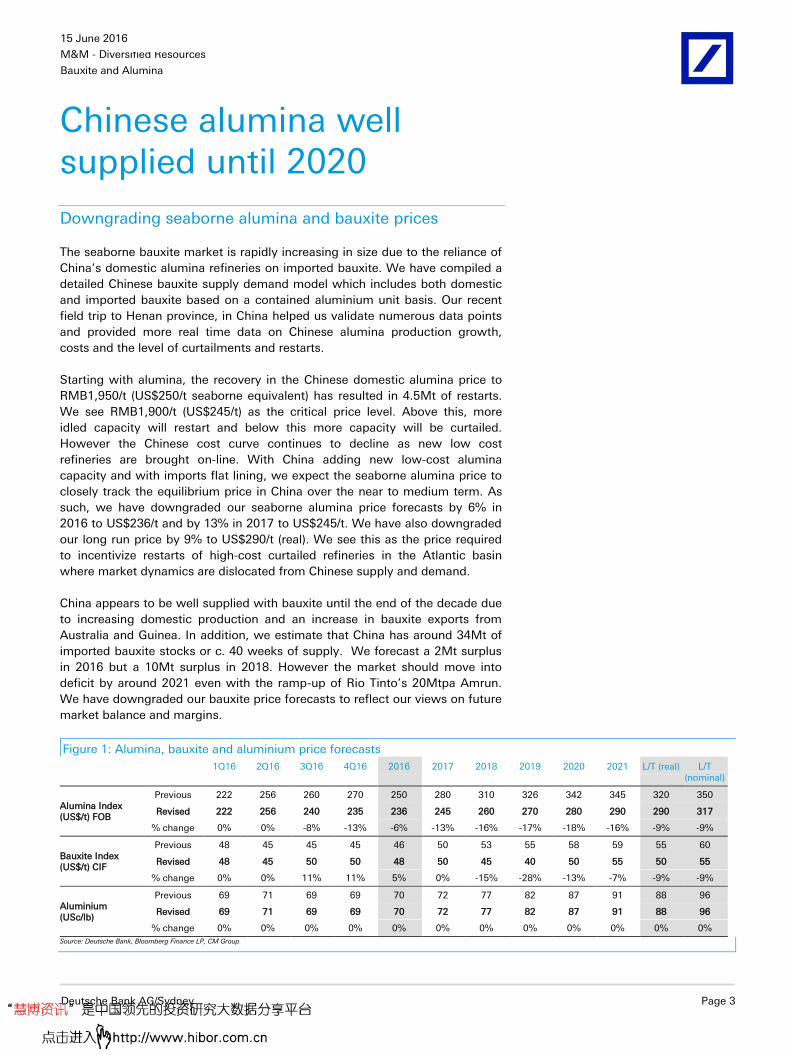
Chinese alumina well supplied until 2020
Downgrading seaborne alumina and bauxite prices
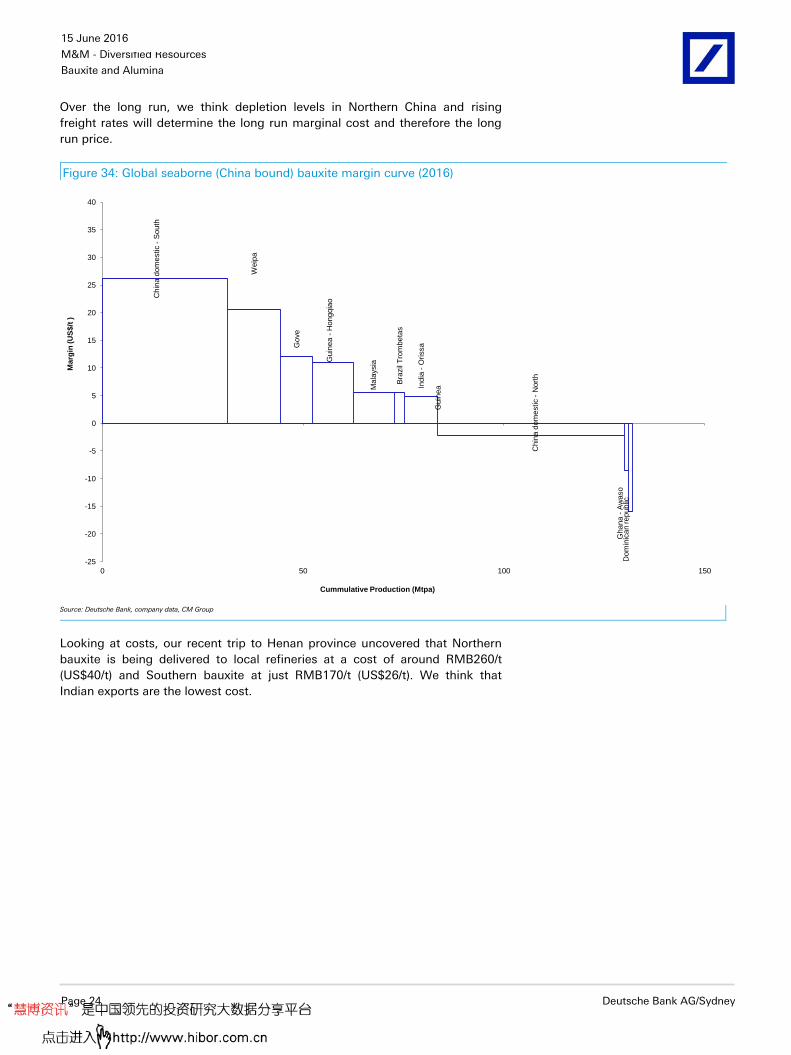
The seaborne bauxite market is rapidly increasing in size due to the reliance of
China’s domestic alumina refineries on imported bauxite. We have compiled a
detailed Chinese bauxite supply demand model which includes both domestic
and imported bauxite based on a contained aluminium unit basis. Our recent
field trip to Henan province, in China helped us validate numerous data points
and provided more real time data on Chinese alumina production growth,
costs and the level of curtailments and restarts.
Starting with alumina, the recovery in the Chinese domestic alumina price to
RMB1,950/t (US$250/t seaborne equivalent) has resulted in 4.5Mt of restarts.
We see RMB1,900/t (US$245/t) as the critical price level. Above this, more
idled capacity will restart and below this more capacity will be curtailed.
However the Chinese cost curve continues to decline as new low cost
refineries are brought on-line. With China adding new low-cost alumina
capacity and with imports flat lining, we expect the seaborne alumina price to
closely track the equilibrium price in China over the near to medium term. As
such, we have downgraded our seaborne alumina price forecasts by 6% in
2016 to US$236/t and by 13% in 2017 to US$245/t. We have also downgraded
our long run price by 9% to US$290/t (real). We see this as the price required
to incentivize restarts of high-cost curtailed refineries in the Atlantic basin
where market dynamics are dislocated from Chinese supply and demand.
China appears to be well supplied with bauxite until the end of the decade due
to increasing domestic production and an increase in bauxite exports from
Australia and Guinea. In addition, we estimate that China has around 34Mt of
imported bauxite stocks or c. 40 weeks of supply. We forecast a 2Mt surplus
in 2016 but a 10Mt surplus in 2018. However the market should move into
deficit by around 2021 even with the ramp-up of Rio Tinto’s 20Mtpa Amrun.
We have downgraded our bauxite price forecasts to reflect our views on future
market balance and margins.
Figure 1: Alumina, bauxite and aluminium price forecasts
Chinese alumina market balance Seaborne alumina price
Source: Deutsche Bank, Aladdiny, CM Group, Wood Mackenzie
Refinery restarts accelerating
Since 2014 there have been almost 19Mt of refining capacity curtailments.
This has mostly occurred in Shandong, Henan and Shanxi provinces where
refineries are more reliant on imported bauxite. The average utilization rate of
the Chinese alumina fleet was around 75% in early 2016. This has since
increased as refineries have restarted with the recovery in the alumina price.
Figure 20: Chinese refining production and idled capacity in late 2015
16.3
9.7
15.2
3.8
7.5
2.3
54.8
7.0
4.0
4.4
0.9
0.42.3
18.9
0
10
20
30
40
50
60
70
80
Shandong Henan Shanxi Guizhou Guangxi Other Total
Mtpa
Operating Idle
Source: Deutsche Bank, Aladdiny, CM Group
We estimate that 9.8Mtpa of the 18.9Mt of curtailed refining capacity was
actually closed during 4Q15 as the price declined to a low of RMB1,596/t. The
largest refineries that were shut during 4Q15 are those owned by Chalco and
Xinfa in Shandong, Shanxi and Henan provinces which rely on imported
bauxite and are non-integrated.
15 June 2016
M&M - Diversified Resources
Bauxite and Alumina
Page 14 Deutsche Bank AG/Sydney
Figure 21: Chinese refining curtailments since 4Q15
Refinery Capacity (kt)
Chalco Shanxi 1,100
Chalco Henan 1,400
Chalco Shandong 500
Shandong Xinfa 2,000
Heungkong Wanji 600
Guizhou Galuminium 600
Guizhou Qiya 500
Henan Nonferrous Huiyuan 300
Sanmenxia Yixiang 100
Coalmine Aluminium 400
Zouping Gaoxin 1,000
Lubei Enterprise 100
Qixing High-tech 100
Nanchuan Xianfeng 200
SPIC Shanxi 400
Guangxi Xinfa 400
Guizhou Huafei 50
Total 9,750 Source: Deutsche Bank, Aladdiny, CM Group
The recovery in price during 1Q16 has incentivized alumina refineries to restart.
We estimate that 5.7Mt of capacity is in the process of restarting including one
of Xinfa’s 1.8-2Mtpa refineries in Shandong. We think that 4.5Mt of this has
already restarted and will ramp-up over 2016. The remaining curtailed capacity
requires prices well north of RMB2,100/t to justify restarting, in our view.
Figure 22: China refinery capacity curtailments since 4QQ15
Refinery Max Resumed Capacity (kt) Already Resumed Capacity (kt)
Shandong Xinfa 1,800 1,800
Zouping Gaoxin 1,000 500
Guizhou Qiya 500 500
Guizhou Galuminium 600 600
Heungkong Wanji 600
Xing'an Chemical 700 700
Sanmenxia Yixiang 100 100
Others 400 300
Total 5,700 4,500
Source: Deutsche Bank, Aladdiny, CM Group
New capacity additions
There is also a significant amount of new low cost refining capacity being
commissioned in 2016. The majority of this new capacity will be supplied by
seaborne bauxite rather than domestic Chinese bauxite production. In total, we
estimate that 6.4Mt of new capacity will be commissioned during 2016 with
2.9Mt operating by the end of 1H16.
15 June 2016
M&M - Diversified Resources
Bauxite and Alumina
Deutsche Bank AG/Sydney Page 15
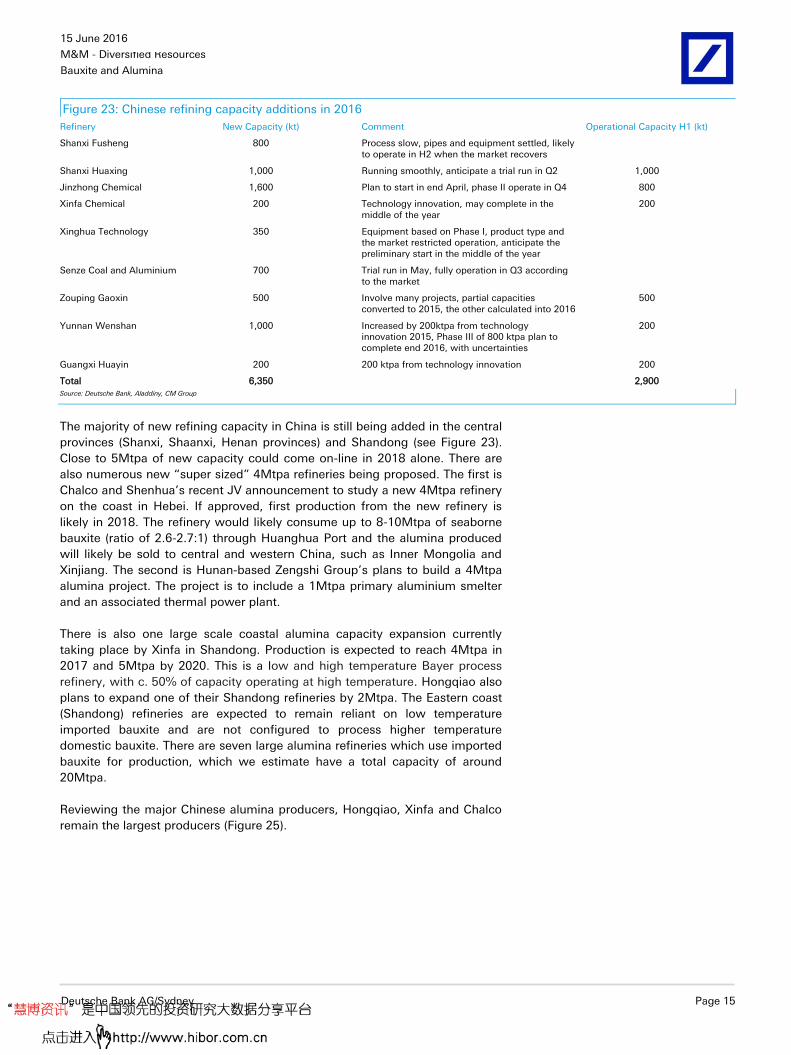
Figure 23: Chinese refining capacity additions in 2016
Refinery New Capacity (kt) Comment Operational Capacity H1 (kt)
Shanxi Fusheng 800 Process slow, pipes and equipment settled, likely to operate in H2 when the market recovers
Shanxi Huaxing 1,000 Running smoothly, anticipate a trial run in Q2 1,000
Jinzhong Chemical 1,600 Plan to start in end April, phase II operate in Q4 800
Xinfa Chemical 200 Technology innovation, may complete in the middle of the year
200
Xinghua Technology 350 Equipment based on Phase I, product type and the market restricted operation, anticipate the preliminary start in the middle of the year
Senze Coal and Aluminium 700 Trial run in May, fully operation in Q3 according to the market
Zouping Gaoxin 500 Involve many projects, partial capacities converted to 2015, the other calculated into 2016
500
Yunnan Wenshan 1,000 Increased by 200ktpa from technology innovation 2015, Phase III of 800 ktpa plan to complete end 2016, with uncertainties
200
Guangxi Huayin 200 200 ktpa from technology innovation 200
Total 6,350 2,900
Source: Deutsche Bank, Aladdiny, CM Group
The majority of new refining capacity in China is still being added in the central
provinces (Shanxi, Shaanxi, Henan provinces) and Shandong (see Figure 23).
Close to 5Mtpa of new capacity could come on-line in 2018 alone. There are
also numerous new “super sized” 4Mtpa refineries being proposed. The first is
Chalco and Shenhua’s recent JV announcement to study a new 4Mtpa refinery
on the coast in Hebei. If approved, first production from the new refinery is
likely in 2018. The refinery would likely consume up to 8-10Mtpa of seaborne
bauxite (ratio of 2.6-2.7:1) through Huanghua Port and the alumina produced
will likely be sold to central and western China, such as Inner Mongolia and
Xinjiang. The second is Hunan-based Zengshi Group’s plans to build a 4Mtpa
alumina project. The project is to include a 1Mtpa primary aluminium smelter
and an associated thermal power plant.
There is also one large scale coastal alumina capacity expansion currently
taking place by Xinfa in Shandong. Production is expected to reach 4Mtpa in
2017 and 5Mtpa by 2020. This is a low and high temperature Bayer process
refinery, with c. 50% of capacity operating at high temperature. Hongqiao also
plans to expand one of their Shandong refineries by 2Mtpa. The Eastern coast
(Shandong) refineries are expected to remain reliant on low temperature
imported bauxite and are not configured to process higher temperature
domestic bauxite. There are seven large alumina refineries which use imported
bauxite for production, which we estimate have a total capacity of around
20Mtpa.
Reviewing the major Chinese alumina producers, Hongqiao, Xinfa and Chalco
remain the largest producers (Figure 25).
15 June 2016
M&M - Diversified Resources
Bauxite and Alumina
Page 16 Deutsche Bank AG/Sydney
Figure 24: Chinese alumina capacity growth (by region). Figure 25: Major Chinese alumina producers (2016 data)
0.0
1.0
2.0
3.0
4.0
5.0
6.0
7.0
2015E 2016E 2017E 2018E
(Mt)
Central China Eastern China
Western China Southern China
16.4
12.6
9.6
4.8
0.0
2.0
4.0
6.0
8.0
10.0
12.0
14.0
16.0
18.0
Chalco Xinfa Hongqiao Jingjiang Group
Source: Deutsche Bank, Chinese NBS data
Source: Deutsche Bank, Wood Mackenzie
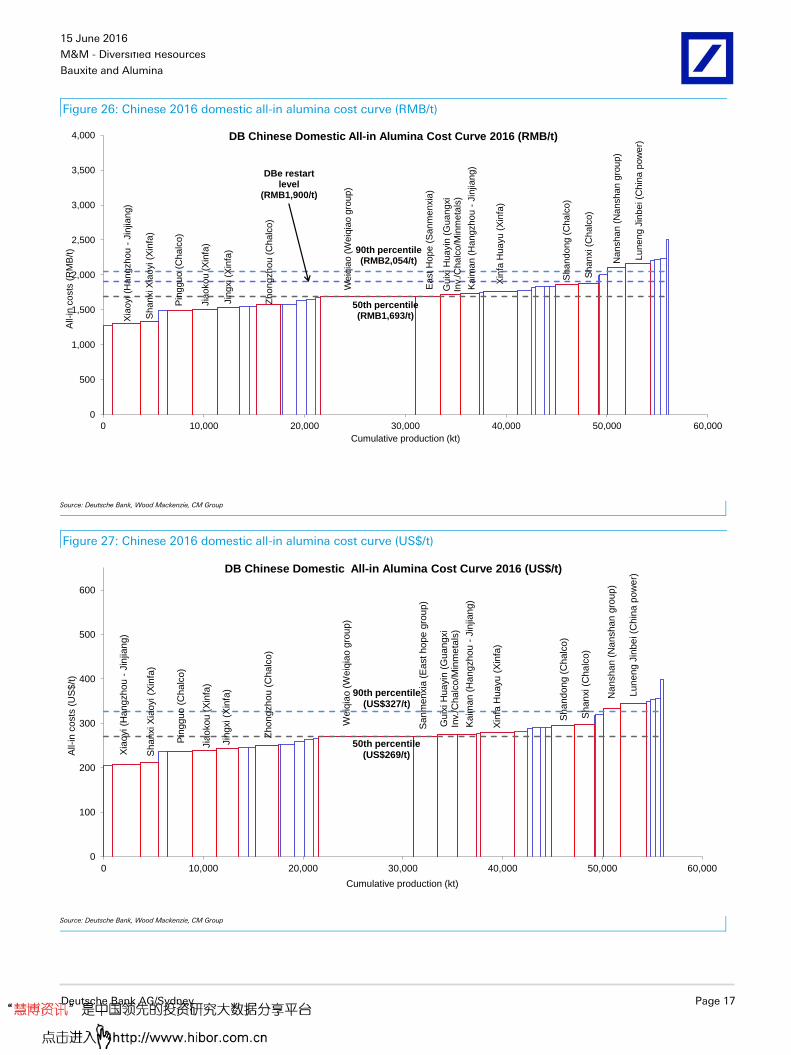
The Chinese cost curve
The Chinese domestic cost curve continues to fall with the addition of new
larger, low-cost more efficient refining capacity. Industry experts suggest that
average all-in costs (50th percentile) have fallen 13% YoY from RMB2,236/t in
2015 to RMB1,954/t in 2016. This includes sustaining capex, VAT and
financing costs. In seaborne alumina terms, this translates to a fall from
US$289/t to US$253/t when adjusting for VAT. Our all-in Chinese cost curve
(shown in Figure 26) based on just C1 costs + sustaining capex shows a lower
average cost, with the RMB1,950/t level representing the 80th percentile,
however on the ground evidence shows that a price of around RMB1,900/t is
the trigger point for restarts. The highest cost refineries are in Shandong and
Henan and the lowest cost refineries are located in the south in Guizhou and
Guangxi provinces. During early 1Q16 we estimate that over 50% of Chinese
refineries were unprofitable.
With the recent drop in energy and bauxite costs in China and the level of
integration increasing, we expect the equilibrium price to continue to move
lower in 2017. The seaborne alumina price should continue to be priced
around the Chinese domestic alumina equilibrium price. At prices below
US$240-250/t (FOB ex Australia) we think higher cost refineries will curtail
production and above this level we think refineries will restart.
The majority of new greenfield and brownfield refineries are integrated with
smelter and power plants and hence are lowering the Chinese cost curve
further. Over the long run we expect costs to move higher in RMB terms as
labour and power costs rise and as refineries become more reliant on imported
bauxite. However we only see this pressure occurring early next decade; we
expect imported bauxite to exceed domestic production from 2020.
15 June 2016
M&M - Diversified Resources
Bauxite and Alumina
Deutsche Bank AG/Sydney Page 17
Figure 26: Chinese 2016 domestic all-in alumina cost curve (RMB/t)
Weiq
iao
(W
eiq
iao
gro
up
)
Xin
fa H
ua
yu
(X
infa
)
Xia
oyi (H
an
gzh
ou
-Jin
jian
g)
Lu
ne
ng J
inb
ei (C
hin
a p
ow
er)
Pin
ggu
o (
Ch
alc
o)
Jia
oko
u (
Xin
fa)
Zh
on
gzh
ou
(C
ha
lco
)
Sh
an
do
ng (
Ch
alc
o)
Jin
gxi (X
infa
)
Gu
ixi H
ua
yin
(G
ua
ngxi
Inv.
/Cha
lco/M
inm
eta
ls)
Sh
an
xi (C
ha
lco)
Ka
ima
n (
Ha
ngzh
ou
-Jin
jian
g)
Sh
an
xi X
iao
yi (X
infa
)
Nan
sh
an
(N
an
sh
an
gro
up
)
Ea
st H
op
e (
Sa
nm
en
xia
)
50th percentile (RMB1,693/t)
90th percentile (RMB2,054/t)
0
500
1,000
1,500
2,000
2,500
3,000
3,500
4,000
0 10,000 20,000 30,000 40,000 50,000 60,000
All-
in c
osts
(R
MB
/t)
Cumulative production (kt)
DB Chinese Domestic All-in Alumina Cost Curve 2016 (RMB/t)
DBe restart level
(RMB1,900/t)
Source: Deutsche Bank, Wood Mackenzie, CM Group
Figure 27: Chinese 2016 domestic all-in alumina cost curve (US$/t)
Weiq
iao
(W
eiq
iao
gro
up
)
Xin
fa H
ua
yu
(X
infa
)
Xia
oyi (H
an
gzh
ou
-Jin
jian
g)
Lu
ne
ng J
inb
ei (C
hin
a p
ow
er)
Pin
ggu
o (
Ch
alc
o)
Sa
nm
en
xia
(E
ast h
op
e g
rou
p)
Jia
oko
u (
Xin
fa)
Zh
on
gzh
ou
(C
ha
lco
)
Sh
an
do
ng (
Ch
alc
o)
Jin
gxi (X
infa
)
Gu
ixi H
ua
yin
(G
ua
ngxi
Inv.
/Ch
alc
o/M
inm
eta
ls)
Sh
an
xi (C
ha
lco
)
Ka
ima
n (
Ha
ngzh
ou
-Jin
jian
g)
Sh
an
xi X
iao
yi (X
infa
)
Na
nsh
an
(N
an
sh
an
gro
up
)
50th percentile(US$269/t)
90th percentile (US$327/t)
0
100
200
300
400
500
600
0 10,000 20,000 30,000 40,000 50,000 60,000
All-
in c
osts
(U
S$
/t)
Cumulative production (kt)
DB Chinese Domestic All-in Alumina Cost Curve 2016 (US$/t)
Source: Deutsche Bank, Wood Mackenzie, CM Group
15 June 2016
M&M - Diversified Resources
Bauxite and Alumina
Page 18 Deutsche Bank AG/Sydney
The Global cost curve
On a global level, we see the average cost on a C1 basis (50th percentile) at
around US$235/t (Figure 28). A number of high cost refineries were curtailed in
2015 with the fall in the seaborne price including Alcoa’s Point Comfort and
Suriname refineries, and other Atlantic basin refineries.
We think that costs will continue to decline in 2016, but over the medium term
(from 2018) we expect the Atlantic basin alumina market to tighten on
increased aluminium demand and expect the seaborne alumina price to rise to
incentivize higher cost refinery restarts.
Figure 28: Global 2016 alumina cost curve (C1), FOB (US$/t)
Alu
ma
r (S
32
/AW
AC
/RIO
)
Pin
jarr
a (
AW
AC
)
Wageru
p (
AW
AC
)
Ras A
l K
ha
ir (
AW
AC
)
Wors
ley (
S3
2)
Kw
ina
na
(A
WA
C)
Po
int C
om
fort
(A
WA
C)
Gla
dsto
ne
(R
IO/U
C R
usa
l)
Va
ud
reu
il (R
IO)
Sa
n C
ipriá
n (
AW
AC
)
Ya
rwu
n (
RIO
)
Ach
insk (
UC
Rusa
l)
Alu
no
rte (
No
rsk h
yd
ro)
Bo
go
slo
vsk (
UC
Rusa
l)
Ura
lsk (
UC
Rusa
l)
Ew
art
on
(U
C R
usa
l)
Nik
ola
ev (
UC
Ru
sa
l)
Au
gh
inis
h (
UC
Rusa
l)
La
njig
arh
(V
ed
an
ta)
50th percentile (US$235/t)
90th percentile (US$284/t)
0
50
100
150
200
250
300
350
400
450
500
0 20,000 40,000 60,000 80,000 1,00,000 1,20,000
C1 c
ash
co
sts
(U
S$
/t)
Cumulative production (Mt)
DB Global Alumina Refinery C1 Cash Costs Curve (2016)
Source: Deutsche Bank, company data, Wood Mackenzie, CM Group
15 June 2016
M&M - Diversified Resources
Bauxite and Alumina
Deutsche Bank AG/Sydney Page 19
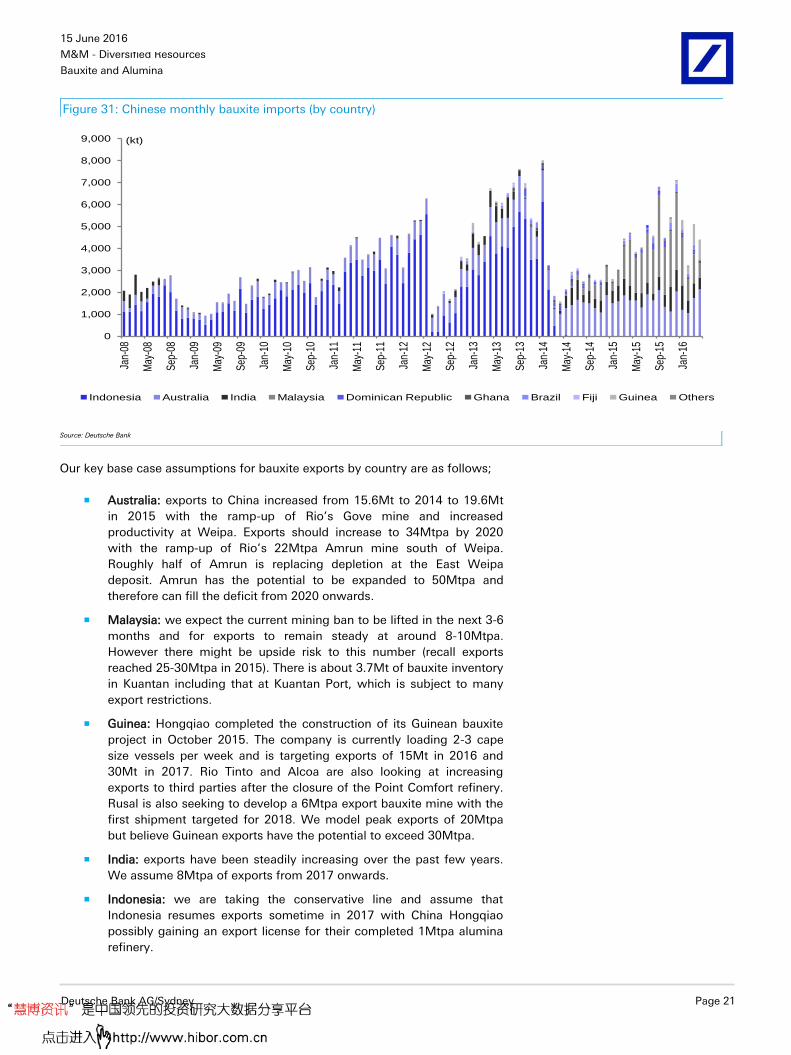
Seaborne Bauxite market
China well supplied until 2020
The global contestable seaborne bauxite market has grown significantly over
the past five years with the rise in Chinese alumina production. China has
increased bauxite imports from just 30Mt in 2010 to 56Mt in 2015 and we
expect imports to increase to 81Mtpa by 2020. China produces around 75Mt of
its own bauxite and therefore imports around 40% of their bauxite
requirements. The total global bauxite market is around 260Mt.
Our Chinese seaborne bauxite supply & demand model shows that China is
currently well supplied due to increasing domestic production and rising
imports from Australia and Guinea. In addition, we estimate that China has
around 34Mt of imported bauxite stocks or c. 40 weeks of supply. Also we
believe that it is probable that Indonesia resumes exports sometime in 2017 if
China Hongqiao receives an export license for their completed 1Mtpa alumina
refinery in Indonesia.
We forecast a 2Mt surplus in 2016 but a 10Mt surplus in 2018. Over the long
run, anecdotal evidence suggests that China’s northern bauxite deposits will
start to decline in quality around 2020 both in tonnage and grade (alumina to
silica ratio or AS ratio). The market should move into deficit by around 2021
even with the ramp-up of Rio Tinto’s 22Mtpa Amrun project in Australia.
Source: Deutsche Bank, company data, China Customs, CM Group, Aladdiny
15 June 2016
M&M - Diversified Resources
Bauxite and Alumina
Deutsche Bank AG/Sydney Page 27
Company Financials
Our detailed company financial estimates are shown from Page 28 onwards.
Valuation and risks
For the mining sector, our company valuations are based on DCF-derived NPVs
over the life of the operations and projects. An NPV multiple is applied in
some cases when setting the share price target. Multiples applied to DB
stocks are dependent on the company’s product types, exposure to
commodity prices, earnings growth and upside potential, and risks associated
with the development of projects. Forward multiples are also taken into
consideration at times when setting price targets. Typically though, PTs are set
broadly in-line with NPVs.
Risks associated with the mining sector include deviations in the commodity
and currency prices away from DB forecast assumptions. Other risks specific
to the sector are potential variations to capex budgets and schedules
associated with project development. For those operations in production,
operations can be affected by mechanical and technical challenges as well as
inclement weather. The operating costs can vary over time as the price of
labour, consumables and fuels change.
Alumina: We have set our PT broadly in line with our life-of-mine derived DCF
NPV, which assumes a LT Al price of US88c/lb (real), Index alumina of
US$290/t (real), US$350/t caustic soda, 0.75 AUDUSD and 10% nominal
WACC (in-line with the sector). We calculate our AWC valuation by
discounting AWC's operating cash flows from the alumina and aluminium
production. Key downside risks include; a drop in both the aluminium and
alumina price, alumina supply to emerge from inland China and aluminium
supply to emerge from Western China, the threat of China subsidizing loss-
making refineries, currency price strength and cost pressure from rising
caustic soda, labour, and energy (natural gas).Key upside risks include higher
commodity prices, lower operating currencies along with further efficiency
gains from assets.
15 June 2016
M&M - Diversified Resources
Bauxite and Alumina
Page 28 Deutsche Bank AG/Sydney
Model updated:06 June 2016
Running the numbers
Australasia
Australia
M&M - Diversified Resources
Rio Tinto Reuters: RIO.AX Bloomberg: RIO AU
Buy Price (15 Jun 16) AUD 42.96
Target Price AUD 54.20
52 Week range AUD 37.03 - 56.34
Market Cap (m) AUDm 77,546
USDm 57,046
Company Profile
Rio Tinto is a global diversified mining company with interests in aluminum, borax, coal, copper, diamonds, gold, iron ore, titanium dioxide feedstock, uranium and zinc. Rio Tinto's key mining operations are located in Australia, New Zealand, South Africa, South America, the United States, Europe, and Canada. Rio Tinto's management structure is based primarily on six principal global products businesses Aluminium, Diamonds, Copper, Energy (coal and uranium), Industrial Minerals, and Iron Ore supported by worldwide exploration and technology groups.
Total 19,665 12,621 10,312 12,881 13,140 13,809 14,928 17,554
Source: Company data, DB estimates
Aluminium20%
Copper11%
Diamonds2%
Minerals4.0%
Energy4%
Iron Ore59%
Aluminium 20%
Copper21%
Diamonds 1%
Minerals4%
Energy4%
Iron Ore50%
Aluminium49%
Copper22%
Diamonds1%
Minerals1.9%
Energy0%
Iron Ore26%
Source: Deutsche Bank, company data
15 June 2016
M&M - Diversified Resources
Bauxite and Alumina
Page 30 Deutsche Bank AG/Sydney
Model updated:06 June 2016
Running the numbers
Australasia
Australia
M&M - Other Metals
Alumina Reuters: AWC.AX Bloomberg: AWC AU
Hold Price (15 Jun 16) AUD 1.37
Target Price AUD 1.40
52 Week range AUD 0.99 - 1.62
Market Cap (m) AUDm 3,830
USDm 2,818
Company Profile
Alumina Limited (Alumina) is an alumina producer, with investments in bauxite mining, alumina refining and select aluminium smelting operations. The company holds a 40% stake in the Alcoa World Alumina and Chemicals (AWAC) joint venture, and Alcoa holds the remaining share. Approximately 90% of the alumina produced by AWAC is used as feed for smelters producing aluminium.
South32 will be a mid cap diversified miner. The company's asset portfolio includes Illawarra met coal, the Cannington silver/lead/zinc mine, the Cerro Matoso nickel mine, The Groote Eylandt manganese mine, Samancor manganese (Hotazel and Metalloys), the Worsley and Alumar alumina refineries, the Hillside, Mozal, Bayside and Alumar aluminium smelters and Energy coal South Africa. Operations are located in Australia (along with head office), South Africa, Mozambique, Brazil and Columbia.
Hydro is a fully integrated aluminium producer with power generating, alumina refining, aluminum smelting and aluminium processing operations. Its recent acquisition of the Brazilian aluminium, alumina and bauxite assets from Vale has shifted its balance from naturally short alumina (neutral when including long-term offtake agreements) to naturally long. With the transfer of the assets only just complete, the company is in the process of integrating them into its business. Once done, the bauxite and alumina assets offer significant growth options to Hydro. The company is in the process of commissioning its major greenfield smelter in Qatar.
Price Performance
20 24 28 32 36 40 44 48
Jun 13 Sep 13 Dec 13 Mar 14 Jun 14 Sep 14 Dec 14 Mar 15 Jun 15 Sep 15 Dec 15 Mar 16
Total shareholders' equity 75,264 79,941 79,330 85,923 94,187 104,135
Net debt -711 128 -5,138 -2,077 -6,067 -12,733
Key Company Metrics
Sales growth (%) 1.2 21.0 12.1 -1.7 12.4 5.4
DB EPS growth (%) 277.0 96.0 79.8 -42.3 24.3 108.6
EBITDA Margin (%) 9.3 13.2 15.0 15.6 14.8 16.8
EBIT Margin (%) 2.6 7.2 9.3 9.5 9.1 11.4
Payout ratio (%) nm 255.5 100.9 23.8 33.3 53.7
ROE (%) -1.3 1.1 2.7 8.4 6.8 8.0
Capex/sales (%) 4.1 4.2 5.9 9.3 4.3 3.6
Capex/depreciation (x) 0.6 0.7 1.0 1.5 0.8 0.7
Net debt/equity (%) -0.9 0.2 -6.5 -2.4 -6.4 -12.2
Net interest cover (x) 0.7 1.6 1.7 nm 17.5 22.9
Source: Company data, Deutsche Bank estimates
15 June 2016
M&M - Diversified Resources
Bauxite and Alumina
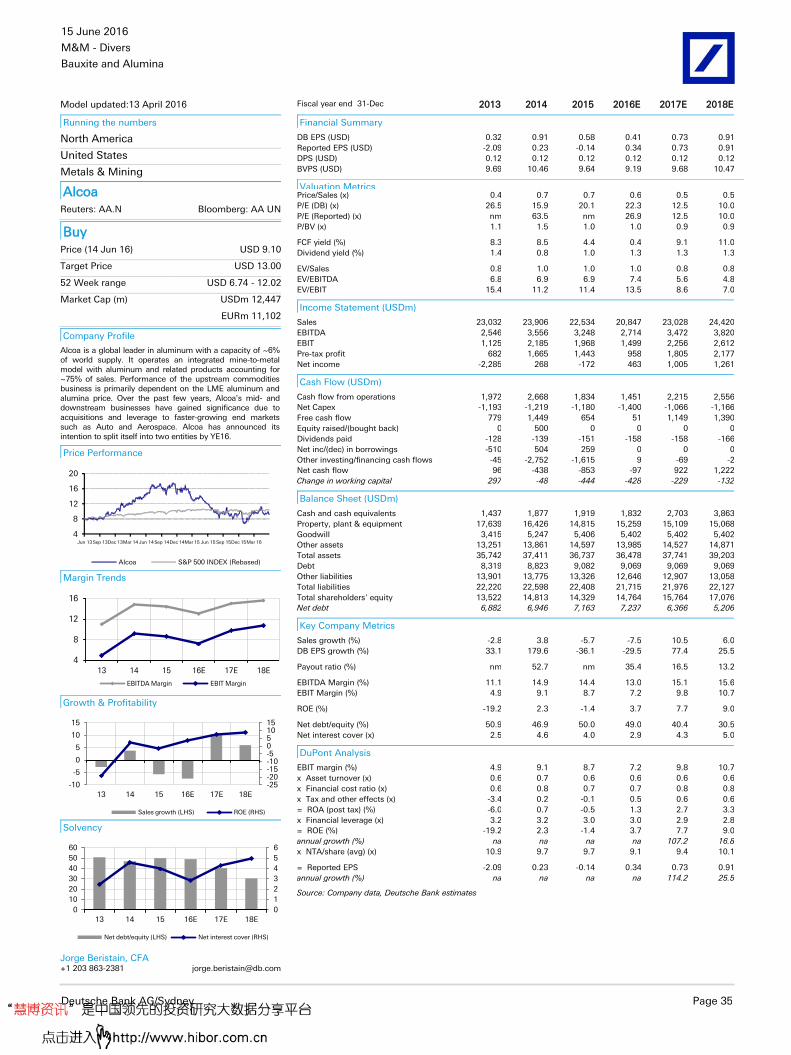
Deutsche Bank AG/Sydney Page 35
Model updated:13 April 2016
Running the numbers
North America
United States
Metals & Mining
Alcoa Reuters: AA.N Bloomberg: AA UN
Buy Price (14 Jun 16) USD 9.10
Target Price USD 13.00
52 Week range USD 6.74 - 12.02
Market Cap (m) USDm 12,447
EURm 11,102
Company Profile
Alcoa is a global leader in aluminum with a capacity of ~6% of world supply. It operates an integrated mine-to-metal model with aluminum and related products accounting for ~75% of sales. Performance of the upstream commodities business is primarily dependent on the LME aluminum and alumina price. Over the past few years, Alcoa's mid- and downstream businesses have gained significance due to acquisitions and leverage to faster-growing end markets such as Auto and Aerospace. Alcoa has announced its intention to split itself into two entities by YE16.
Price Performance
4
8
12
16
20
Jun 13 Sep 13Dec 13Mar 14 Jun 14Sep 14Dec 14Mar 15 Jun 15 Sep 15Dec 15Mar 16
Other assets 13,251 13,861 14,597 13,985 14,527 14,871
Total assets 35,742 37,411 36,737 36,478 37,741 39,203
Debt 8,319 8,823 9,082 9,069 9,069 9,069
Other liabilities 13,901 13,775 13,326 12,646 12,907 13,058
Total liabilities 22,220 22,598 22,408 21,715 21,976 22,127
Total shareholders' equity 13,522 14,813 14,329 14,764 15,764 17,076
Net debt 6,882 6,946 7,163 7,237 6,366 5,206
Key Company Metrics
Sales growth (%) -2.8 3.8 -5.7 -7.5 10.5 6.0
DB EPS growth (%) 33.1 179.6 -36.1 -29.5 77.4 25.5
Payout ratio (%) nm 52.7 nm 35.4 16.5 13.2
EBITDA Margin (%) 11.1 14.9 14.4 13.0 15.1 15.6
EBIT Margin (%) 4.9 9.1 8.7 7.2 9.8 10.7
ROE (%) -19.2 2.3 -1.4 3.7 7.7 9.0
Net debt/equity (%) 50.9 46.9 50.0 49.0 40.4 30.5
Net interest cover (x) 2.5 4.6 4.0 2.9 4.3 5.0
DuPont Analysis
EBIT margin (%) 4.9 9.1 8.7 7.2 9.8 10.7
x Asset turnover (x) 0.6 0.7 0.6 0.6 0.6 0.6
x Financial cost ratio (x) 0.6 0.8 0.7 0.7 0.8 0.8
x Tax and other effects (x) -3.4 0.2 -0.1 0.5 0.6 0.6
= ROA (post tax) (%) -6.0 0.7 -0.5 1.3 2.7 3.3
x Financial leverage (x) 3.2 3.2 3.0 3.0 2.9 2.8
= ROE (%) -19.2 2.3 -1.4 3.7 7.7 9.0
annual growth (%) na na na na 107.2 16.8
x NTA/share (avg) (x) 10.9 9.7 9.7 9.1 9.4 10.1
= Reported EPS -2.09 0.23 -0.14 0.34 0.73 0.91
annual growth (%) na na na na 114.2 25.5
Source: Company data, Deutsche Bank estimates
15 June 2016
M&M - Diversified Resources
Bauxite and Alumina
Page 36 Deutsche Bank AG/Sydney
Model updated:13 June 2016
Running the numbers
Asia
China
Metals & Mining
Chalco Reuters: 2600.HK Bloomberg: 2600 HK
Hold Price (14 Jun 16) HKD 2.36
Target Price HKD 2.80
52 Week range HKD 2.16 - 4.35
Market Cap (m) HKDm 31,918
USDm 4,113
Company Profile
Aluminum Corporation of China Limited is a producer of alumina and primary aluminum in China. The Company refines bauxite into alumina and smelts alumina to produce primary aluminum.
Total shareholders' equity 53,702 39,629 50,297 48,882 51,551
Net debt 107,217 102,004 85,661 86,821 85,694
Key Company Metrics
Sales growth (%) nm -16.3 -12.9 -1.4 4.4
DB EPS growth (%) na na na na na
EBITDA Margin (%) 7.5 -2.5 9.8 8.1 10.7
EBIT Margin (%) 3.2 -7.6 4.1 2.3 5.1
Payout ratio (%) 0.0 nm 0.0 nm 0.0
ROE (%) 2.2 -44.7 0.6 -3.3 6.2
Capex/sales (%) 5.3 6.0 7.2 7.4 3.9
Capex/depreciation (x) 1.3 1.2 1.2 1.3 0.7
Net debt/equity (%) 199.7 257.4 170.3 177.6 166.2
Net interest cover (x) 1.0 nm 1.0 0.6 1.5
Source: Company data, Deutsche Bank estimates
15 June 2016
M&M - Diversified Resources
Bauxite and Alumina
Deutsche Bank AG/Sydney Page 37
Model updated:28 April 2016
Running the numbers
Asia
China
Metals & Mining
China Hongqiao Group Ltd. Reuters: 1378.HK Bloomberg: 1378 HK
Buy Price (14 Jun 16) HKD 5.18
Target Price HKD 6.30
52 Week range HKD 3.15 - 7.58
Market Cap (m) HKDm 31,913
USDm 4,112
Company Profile
China Hongqiao, based in Shandong, China, is the world's largest primary aluminium producer. The company has six production bases with a designed aluminium capacity of 5mt+ by 2015, 60% self-sufficient ratio in alumina and 80%+ self-supplied power by 2015. China Hongqiao was listed in HKEX in March 2011.
Price Performance
3
5
6
8
9
Jun 14Sep 14Dec 14Mar 15Jun 15Sep 15Dec 15Mar 16
China Hongqiao Group Ltd.HANG SENG INDEX (Rebased)
Total shareholders' equity 26,883 32,434 36,237 40,696 48,787
Net debt 24,196 31,532 45,352 49,136 47,422
Key Company Metrics
Sales growth (%) nm 22.7 22.2 19.7 24.7
DB EPS growth (%) na -6.8 -33.6 27.9 68.0
EBITDA Margin (%) 36.0 33.8 30.3 31.3 32.8
EBIT Margin (%) 28.9 25.2 19.6 20.4 22.7
Payout ratio (%) 28.6 31.2 26.2 21.6 21.6
ROE (%) 22.8 18.0 10.6 14.2 20.5
Capex/sales (%) 47.6 25.7 38.8 27.9 17.3
Capex/depreciation (x) 6.7 2.9 3.6 2.6 1.7
Net debt/equity (%) 90.0 97.2 125.2 120.7 97.2
Net interest cover (x) 6.6 5.2 2.7 3.2 6.1
Source: Company data, Deutsche Bank estimates
15 June 2016
M&M - Diversified Resources
Bauxite and Alumina
Page 38 Deutsche Bank AG/Sydney
Model updated:05 April 2016
Running the numbers
Emerging Europe
Russia
Metals & Mining
United Company RUSAL Reuters: 0486.HK Bloomberg: 486 HK
Hold Price (14 Jun 16) HKD 2.32
Target Price HKD 2.45
52 Week range HKD 2.06 - 4.35
Market Cap (m) HKDm 35,248
USDm 4,542
Company Profile
United Company RUSAL Plc is one of the world's biggest producers of primary aluminum. It is a global vertically integrated industry leader with 8 bauxite mines, 12 alumina refineries and 16 aluminium smelters in 20 countries. UC Rusal also runs a downstream foil and packaging segment and owns substantial coal assets in Kazakhstan. During the year ended December 31, 2013, the company produced 4.2 million tons of aluminum and 7.0 million tons of alumina. Rusal owns a 27.8% equity stake in Norilsk Nickel.
Price Performance
1.0
2.0
3.0
4.0
5.06.0
7.0
Jun 13Sep 13Dec 13Mar 14 Jun 14Sep 14Dec 14Mar 15 Jun 15 Sep 15Dec 15Mar 16
Total shareholders' equity 6,650 5,767 331 1,041 1,956 2,768
Net debt 10,109 8,850 8,793 8,125 7,630 7,234
Key Company Metrics
Sales growth (%) -10.4 -4.1 -7.2 -8.9 1.7 5.8
DB EPS growth (%) -786.7 na 34.7 -32.3 28.7 -11.1
EBITDA Margin (%) 6.7 16.2 23.2 17.0 17.1 15.1
EBIT Margin (%) -18.5 10.1 16.2 11.8 11.8 10.0
Payout ratio (%) nm 0.0 0.0 0.0 0.0 0.0
ROE (%) -34.0 12.6 34.4 103.5 61.0 34.4
Capex/sales (%) 5.7 5.0 6.0 6.3 6.2 5.9
Capex/depreciation (x) 0.2 0.8 0.9 1.2 1.2 1.2
Net debt/equity (%) 152.0 153.5 nm 780.2 390.2 261.3
Net interest cover (x) nm 1.1 2.3 1.3 1.4 1.3
Source: Company data, Deutsche Bank estimates
15 June 2016
M&M - Diversified Resources
Bauxite and Alumina
Deutsche Bank AG/Sydney Page 39
Model updated:13 May 2016
Running the numbers
Europe
United Kingdom
Metals & Mining
Vedanta Resources Reuters: VED.L Bloomberg: VED LN
Hold Price (14 Jun 16) GBP 373.00
Target Price GBP 375.00
52 Week range GBP 205.80 - 603.50
Market Cap (m) GBPm 1,029
USDm 1,453
Company Profile
Vedanta Resources Ltd. mines and processes a variety of metals (copper, zinc and aluminium), with its core operations being domiciled in India. Since its listing in London in late 2003, the company has diversified its exposure by both metal and geography mostly via acquisition; Iron ore, power and oil in India, copper in Zambia and zinc in Southern Africa and Ireland.
Total shareholders' equity 18,861 17,975 12,257 6,852 9,014 9,204
Net debt 8,611 7,933 8,458 7,327 7,278 6,297
Key Company Metrics
Sales growth (%) 7.0 -13.6 -0.5 -16.6 1.7 16.2
DB EPS growth (%) -1.8 -89.7 na -830.6 23.6 -2.5
EBITDA Margin (%) 32.6 34.7 29.0 21.8 21.5 23.5
EBIT Margin (%) 17.1 17.7 13.5 8.2 7.4 9.0
Payout ratio (%) 93.9 nm nm nm nm nm
ROE (%) 3.7 -4.7 -64.1 -413.0 -156.5 -30.7
Capex/sales (%) 14.9 16.9 17.8 8.1 9.9 9.2
Capex/depreciation (x) 1.0 1.0 1.1 0.6 0.7 0.6
Net debt/equity (%) 45.7 44.1 69.0 106.9 80.7 68.4
Net interest cover (x) 3.2 3.0 3.1 1.5 2.8 3.9
Source: Company data, Deutsche Bank estimates
15 June 2016
M&M - Diversified Resources
Bauxite and Alumina
Page 40 Deutsche Bank AG/Sydney
Appendix 1
Important Disclosures
Additional information available upon request
Disclosure checklist
Company Ticker Recent price* Disclosure
United Company RUSAL 0486.HK 2.33 (HKD) 14 Jun 16 14 *Prices are current as of the end of the previous trading session unless otherwise indicated and are sourced from local exchanges via Reuters, Bloomberg and other vendors . Other information is sourced from Deutsche Bank, subject companies, and other sources. For disclosures pertaining to recommendations or estimates made on securities other than the primary subject of this research, please see the most recently published company report or visit our global disclosure look-up page on our website at http://gm.db.com/ger/disclosure/DisclosureDirectory.eqsr.
Important Disclosures Required by U.S. Regulators
Disclosures marked with an asterisk may also be required by at least one jurisdiction in addition to the United States. See Important Disclosures Required by Non-US Regulators and Explanatory Notes.
14. Deutsche Bank and/or its affiliate(s) has received non-investment banking related compensation from this company within the past year.
For disclosures pertaining to recommendations or estimates made on securities other than the primary subject of this research, please see the most recently published company report or visit our global disclosure look-up page on our website at http://gm.db.com/ger/disclosure/DisclosureDirectory.eqsr
Analyst Certification
The views expressed in this report accurately reflect the personal views of the undersigned lead analyst about the subject issuers and the securities of those issuers. In addition, the undersigned lead analyst has not and will not receive any compensation for providing a specific recommendation or view in this report. Paul Young/Anna Mulholland/Jorge Beristain/Sharon Ding/Grant Sporre/George Buzhenitsa/Rene Kleyweg
15 June 2016
M&M - Diversified Resources
Bauxite and Alumina
Deutsche Bank AG/Sydney Page 41
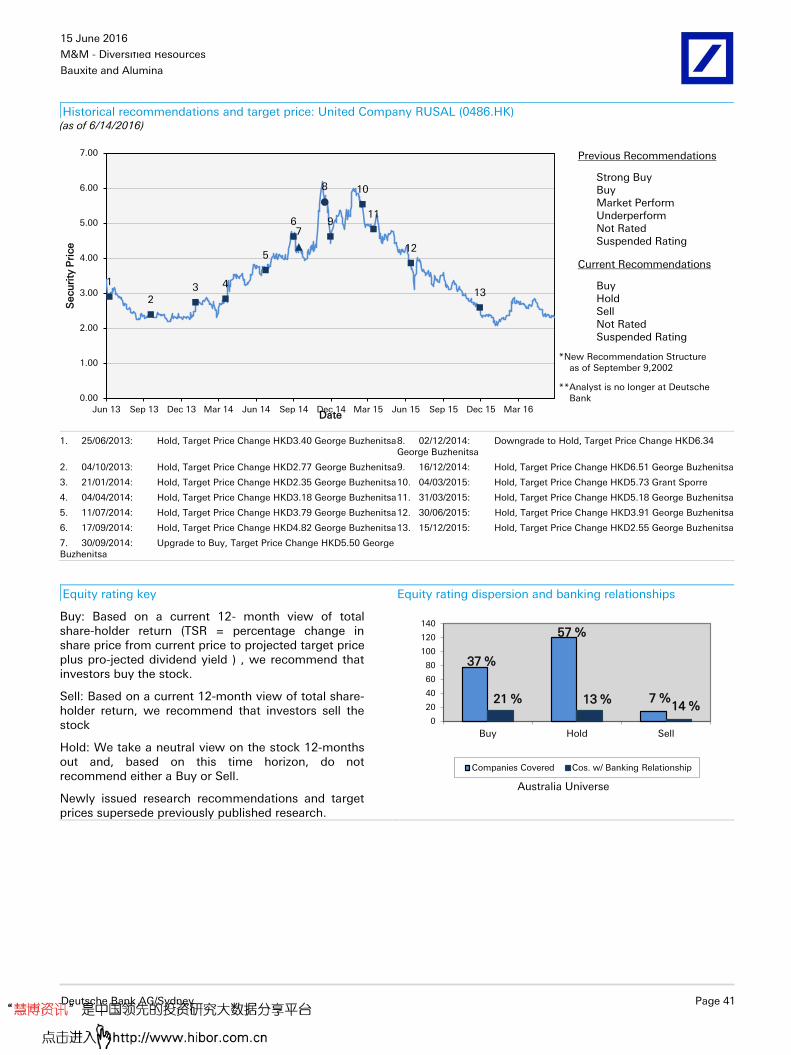
Historical recommendations and target price: United Company RUSAL (0486.HK) (as of 6/14/2016)
1
23 4
5
67
8
9
10
11
12
13
0.00
1.00
2.00
3.00
4.00
5.00
6.00
7.00
Jun 13 Sep 13 Dec 13 Mar 14 Jun 14 Sep 14 Dec 14 Mar 15 Jun 15 Sep 15 Dec 15 Mar 16
Secu
rity
Pri
ce
Date
Previous Recommendations
Strong Buy Buy Market Perform Underperform Not Rated Suspended Rating
Current Recommendations
Buy Hold Sell Not Rated Suspended Rating
*New Recommendation Structure as of September 9,2002
**Analyst is no longer at Deutsche Bank
1. 25/06/2013: Hold, Target Price Change HKD3.40 George Buzhenitsa 8. 02/12/2014: Downgrade to Hold, Target Price Change HKD6.34 George Buzhenitsa
2. 04/10/2013: Hold, Target Price Change HKD2.77 George Buzhenitsa 9. 16/12/2014: Hold, Target Price Change HKD6.51 George Buzhenitsa
3. 21/01/2014: Hold, Target Price Change HKD2.35 George Buzhenitsa 10. 04/03/2015: Hold, Target Price Change HKD5.73 Grant Sporre
4. 04/04/2014: Hold, Target Price Change HKD3.18 George Buzhenitsa 11. 31/03/2015: Hold, Target Price Change HKD5.18 George Buzhenitsa
5. 11/07/2014: Hold, Target Price Change HKD3.79 George Buzhenitsa 12. 30/06/2015: Hold, Target Price Change HKD3.91 George Buzhenitsa
6. 17/09/2014: Hold, Target Price Change HKD4.82 George Buzhenitsa 13. 15/12/2015: Hold, Target Price Change HKD2.55 George Buzhenitsa
7. 30/09/2014: Upgrade to Buy, Target Price Change HKD5.50 George Buzhenitsa
Equity rating key Equity rating dispersion and banking relationships
Buy: Based on a current 12- month view of total share-holder return (TSR = percentage change in share price from current price to projected target price plus pro-jected dividend yield ) , we recommend that investors buy the stock.
Sell: Based on a current 12-month view of total share-holder return, we recommend that investors sell the stock
Hold: We take a neutral view on the stock 12-months out and, based on this time horizon, do not recommend either a Buy or Sell.
Newly issued research recommendations and target prices supersede previously published research.
37 %
57 %
7 %21 % 13 %14 %
0
20
40
60
80
100
120
140
Buy Hold Sell
Australia Universe
Companies Covered Cos. w/ Banking Relationship
15 June 2016
M&M - Diversified Resources
Bauxite and Alumina
Page 42 Deutsche Bank AG/Sydney
Regulatory Disclosures
1.Important Additional Conflict Disclosures
Aside from within this report, important conflict disclosures can also be found at https://gm.db.com/equities under the
"Disclosures Lookup" and "Legal" tabs. Investors are strongly encouraged to review this information before investing.
2.Short-Term Trade Ideas
Deutsche Bank equity research analysts sometimes have shorter-term trade ideas (known as SOLAR ideas) that are
consistent or inconsistent with Deutsche Bank's existing longer term ratings. These trade ideas can be found at the
SOLAR link at http://gm.db.com.
15 June 2016
M&M - Diversified Resources
Bauxite and Alumina
Deutsche Bank AG/Sydney Page 43
Additional Information
The information and opinions in this report were prepared by Deutsche Bank AG or one of its affiliates (collectively
"Deutsche Bank"). Though the information herein is believed to be reliable and has been obtained from public sources
believed to be reliable, Deutsche Bank makes no representation as to its accuracy or completeness.
If you use the services of Deutsche Bank in connection with a purchase or sale of a security that is discussed in this
report, or is included or discussed in another communication (oral or written) from a Deutsche Bank analyst, Deutsche
Bank may act as principal for its own account or as agent for another person.
Deutsche Bank may consider this report in deciding to trade as principal. It may also engage in transactions, for its own
account or with customers, in a manner inconsistent with the views taken in this research report. Others within
Deutsche Bank, including strategists, sales staff and other analysts, may take views that are inconsistent with those
taken in this research report. Deutsche Bank issues a variety of research products, including fundamental analysis,
equity-linked analysis, quantitative analysis and trade ideas. Recommendations contained in one type of communication
may differ from recommendations contained in others, whether as a result of differing time horizons, methodologies or
otherwise. Deutsche Bank and/or its affiliates may also be holding debt securities of the issuers it writes on.
Analysts are paid in part based on the profitability of Deutsche Bank AG and its affiliates, which includes investment
banking revenues.
Opinions, estimates and projections constitute the current judgment of the author as of the date of this report. They do
not necessarily reflect the opinions of Deutsche Bank and are subject to change without notice. Deutsche Bank has no
obligation to update, modify or amend this report or to otherwise notify a recipient thereof if any opinion, forecast or
estimate contained herein changes or subsequently becomes inaccurate. This report is provided for informational
purposes only. It is not an offer or a solicitation of an offer to buy or sell any financial instruments or to participate in any
particular trading strategy. Target prices are inherently imprecise and a product of the analyst’s judgment. The financial
instruments discussed in this report may not be suitable for all investors and investors must make their own informed
investment decisions. Prices and availability of financial instruments are subject to change without notice and
investment transactions can lead to losses as a result of price fluctuations and other factors. If a financial instrument is
denominated in a currency other than an investor's currency, a change in exchange rates may adversely affect the
investment. Past performance is not necessarily indicative of future results. Unless otherwise indicated, prices are
current as of the end of the previous trading session, and are sourced from local exchanges via Reuters, Bloomberg and
other vendors. Data is sourced from Deutsche Bank, subject companies, and in some cases, other parties.
Macroeconomic fluctuations often account for most of the risks associated with exposures to instruments that promise
to pay fixed or variable interest rates. For an investor who is long fixed rate instruments (thus receiving these cash
flows), increases in interest rates naturally lift the discount factors applied to the expected cash flows and thus cause a
loss. The longer the maturity of a certain cash flow and the higher the move in the discount factor, the higher will be the
loss. Upside surprises in inflation, fiscal funding needs, and FX depreciation rates are among the most common adverse
macroeconomic shocks to receivers. But counterparty exposure, issuer creditworthiness, client segmentation, regulation
(including changes in assets holding limits for different types of investors), changes in tax policies, currency
convertibility (which may constrain currency conversion, repatriation of profits and/or the liquidation of positions), and
settlement issues related to local clearing houses are also important risk factors to be considered. The sensitivity of fixed
income instruments to macroeconomic shocks may be mitigated by indexing the contracted cash flows to inflation, to
FX depreciation, or to specified interest rates – these are common in emerging markets. It is important to note that the
index fixings may -- by construction -- lag or mis-measure the actual move in the underlying variables they are intended
to track. The choice of the proper fixing (or metric) is particularly important in swaps markets, where floating coupon
rates (i.e., coupons indexed to a typically short-dated interest rate reference index) are exchanged for fixed coupons. It is
also important to acknowledge that funding in a currency that differs from the currency in which coupons are
denominated carries FX risk. Naturally, options on swaps (swaptions) also bear the risks typical to options in addition to
the risks related to rates movements.
15 June 2016
M&M - Diversified Resources
Bauxite and Alumina
Page 44 Deutsche Bank AG/Sydney
Derivative transactions involve numerous risks including, among others, market, counterparty default and illiquidity risk.
The appropriateness or otherwise of these products for use by investors is dependent on the investors' own
circumstances including their tax position, their regulatory environment and the nature of their other assets and
liabilities, and as such, investors should take expert legal and financial advice before entering into any transaction similar
to or inspired by the contents of this publication. The risk of loss in futures trading and options, foreign or domestic, can
be substantial. As a result of the high degree of leverage obtainable in futures and options trading, losses may be
incurred that are greater than the amount of funds initially deposited. Trading in options involves risk and is not suitable
for all investors. Prior to buying or selling an option investors must review the "Characteristics and Risks of Standardized
Options”, at http://www.optionsclearing.com/about/publications/character-risks.jsp. If you are unable to access the
website please contact your Deutsche Bank representative for a copy of this important document.
Participants in foreign exchange transactions may incur risks arising from several factors, including the following: ( i)
exchange rates can be volatile and are subject to large fluctuations; ( ii) the value of currencies may be affected by
numerous market factors, including world and national economic, political and regulatory events, events in equity and
debt markets and changes in interest rates; and (iii) currencies may be subject to devaluation or government imposed
exchange controls which could affect the value of the currency. Investors in securities such as ADRs, whose values are
affected by the currency of an underlying security, effectively assume currency risk.
Unless governing law provides otherwise, all transactions should be executed through the Deutsche Bank entity in the
investor's home jurisdiction.
United States: Approved and/or distributed by Deutsche Bank Securities Incorporated, a member of FINRA, NFA and
SIPC. Analysts employed by non-US affiliates may not be associated persons of Deutsche Bank Securities Incorporated
and therefore not subject to FINRA regulations concerning communications with subject companies, public appearances
and securities held by analysts.
Germany: Approved and/or distributed by Deutsche Bank AG, a joint stock corporation with limited liability incorporated
in the Federal Republic of Germany with its principal office in Frankfurt am Main. Deutsche Bank AG is authorized under
German Banking Law and is subject to supervision by the European Central Bank and by BaFin, Germany’s Federal
Financial Supervisory Authority.
United Kingdom: Approved and/or distributed by Deutsche Bank AG acting through its London Branch at Winchester
House, 1 Great Winchester Street, London EC2N 2DB. Deutsche Bank AG in the United Kingdom is authorised by the
Prudential Regulation Authority and is subject to limited regulation by the Prudential Regulation Authority and Financial
Conduct Authority. Details about the extent of our authorisation and regulation are available on request.
Hong Kong: Distributed by Deutsche Bank AG, Hong Kong Branch.
India: Prepared by Deutsche Equities India Pvt Ltd, which is registered by the Securities and Exchange Board of India
(SEBI) as a stock broker. Research Analyst SEBI Registration Number is INH000001741. DEIPL may have received
administrative warnings from the SEBI for breaches of Indian regulations.
Japan: Approved and/or distributed by Deutsche Securities Inc.(DSI). Registration number - Registered as a financial
instruments dealer by the Head of the Kanto Local Finance Bureau (Kinsho) No. 117. Member of associations: JSDA,
Type II Financial Instruments Firms Association and The Financial Futures Association of Japan. Commissions and risks
involved in stock transactions - for stock transactions, we charge stock commissions and consumption tax by
multiplying the transaction amount by the commission rate agreed with each customer. Stock transactions can lead to
losses as a result of share price fluctuations and other factors. Transactions in foreign stocks can lead to additional
losses stemming from foreign exchange fluctuations. We may also charge commissions and fees for certain categories
of investment advice, products and services. Recommended investment strategies, products and services carry the risk
of losses to principal and other losses as a result of changes in market and/or economic trends, and/or fluctuations in
market value. Before deciding on the purchase of financial products and/or services, customers should carefully read the
relevant disclosures, prospectuses and other documentation. "Moody's", "Standard & Poor's", and "Fitch" mentioned in
this report are not registered credit rating agencies in Japan unless Japan or "Nippon" is specifically designated in the
name of the entity. Reports on Japanese listed companies not written by analysts of DSI are written by Deutsche Bank
15 June 2016
M&M - Diversified Resources
Bauxite and Alumina
Deutsche Bank AG/Sydney Page 45
Group's analysts with the coverage companies specified by DSI. Some of the foreign securities stated on this report are
not disclosed according to the Financial Instruments and Exchange Law of Japan.
Korea: Distributed by Deutsche Securities Korea Co.
South Africa: Deutsche Bank AG Johannesburg is incorporated in the Federal Republic of Germany (Branch Register
Number in South Africa: 1998/003298/10).
Singapore: by Deutsche Bank AG, Singapore Branch or Deutsche Securities Asia Limited, Singapore Branch (One Raffles
Quay #18-00 South Tower Singapore 048583, +65 6423 8001), which may be contacted in respect of any matters
arising from, or in connection with, this report. Where this report is issued or promulgated in Singapore to a person who
is not an accredited investor, expert investor or institutional investor (as defined in the applicable Singapore laws and
regulations), they accept legal responsibility to such person for its contents.
Taiwan: Information on securities/investments that trade in Taiwan is for your reference only. Readers should
independently evaluate investment risks and are solely responsible for their investment decisions. Deutsche Bank
research may not be distributed to the Taiwan public media or quoted or used by the Taiwan public media without
written consent. Information on securities/instruments that do not trade in Taiwan is for informational purposes only and
is not to be construed as a recommendation to trade in such securities/instruments. Deutsche Securities Asia Limited,
Taipei Branch may not execute transactions for clients in these securities/instruments.
Qatar: Deutsche Bank AG in the Qatar Financial Centre (registered no. 00032) is regulated by the Qatar Financial Centre
Regulatory Authority. Deutsche Bank AG - QFC Branch may only undertake the financial services activities that fall
within the scope of its existing QFCRA license. Principal place of business in the QFC: Qatar Financial Centre, Tower,
West Bay, Level 5, PO Box 14928, Doha, Qatar. This information has been distributed by Deutsche Bank AG. Related
financial products or services are only available to Business Customers, as defined by the Qatar Financial Centre
Regulatory Authority.
Russia: This information, interpretation and opinions submitted herein are not in the context of, and do not constitute,
any appraisal or evaluation activity requiring a license in the Russian Federation.
Kingdom of Saudi Arabia: Deutsche Securities Saudi Arabia LLC Company, (registered no. 07073-37) is regulated by the
Capital Market Authority. Deutsche Securities Saudi Arabia may only undertake the financial services activities that fall
within the scope of its existing CMA license. Principal place of business in Saudi Arabia: King Fahad Road, Al Olaya