Bayesian Functional Integral Method for Inferring Continuous Data from Discrete Measurements William J. Heuett, †‡6 * Bernard V. Miller III, §6 Susan B. Racette, { John O. Holloszy, k Carson C. Chow, ‡ and Vipul Periwal ‡ * † Mathematics Department, Marymount University, Arlington, Virginia; ‡ Laboratory of Biological Modeling and § Diabetes, Endocrinology and Obesity Branch, National Institute of Diabetes and Digestive and Kidney Diseases, National Institutes of Health, Bethesda, Maryland; and { Division of Endocrinology, Metabolism and Lipid Research and k Division of Geriatrics and Nutritional Sciences, Department of Medicine, Washington University School of Medicine, St. Louis, Missouri ABSTRACT Inference of the insulin secretion rate (ISR) from C-peptide measurements as a quantification of pancreatic b-cell function is clinically important in diseases related to reduced insulin sensitivity and insulin action. ISR derived from C-peptide concentration is an example of nonparametric Bayesian model selection where a proposed ISR time-course is considered to be a ‘‘model’’. An inferred value of inaccessible continuous variables from discrete observable data is often problematic in biology and medicine, because it is a priori unclear how robust the inference is to the deletion of data points, and a closely related ques- tion, how much smoothness or continuity the data actually support. Predictions weighted by the posterior distribution can be cast as functional integrals as used in statistical field theory. Functional integrals are generally difficult to evaluate, especially for nonanalytic constraints such as positivity of the estimated parameters. We propose a computationally tractable method that uses the exact solution of an associated likelihood function as a prior probability distribution for a Markov-chain Monte Carlo evaluation of the posterior for the full model. As a concrete application of our method, we calculate the ISR from actual clinical C-peptide measurements in human subjects with varying degrees of insulin sensitivity. Our method demonstrates the feasibility of functional integral Bayesian model selection as a practical method for such data-driven inference, allowing the data to deter- mine the smoothing timescale and the width of the prior probability distribution on the space of models. In particular, our model comparison method determines the discrete time-step for interpolation of the unobservable continuous variable that is supported by the data. Attempts to go to finer discrete time-steps lead to less likely models. INTRODUCTION The inference of continuous quantities from small numbers of measurements is ubiquitous in medicine and biology. Bayesian model comparison is ideally suited for such tasks because it automatically invokes Occam’s principle and balances goodness-of-fit against the complexity of the model (1–3). However, Bayesian methods are computation- ally intractable for high dimensional problems as they require integration over the parameter space. Hence, many theoretical advances in Bayesian inference (4) have not yet been fully exploited in applications. Here we show that such integrals become numerically tractable if a suitable approximation of the prior probability distribution can be explicitly calculated to provide an initial condition for a Markov-chain Monte Carlo (MCMC) evaluation of the model posterior probabilities (i.e., Bayes factors). MCMC will generally not converge to a meaningful result unless a good initial condition is specified. For concreteness, we present the application of this general methodology to a concrete example of clinical relevance with data from human subjects in this article. The accurate determination of pancreatic b-cell function as manifested in the insulin secretion rate (ISR) is clinically important in assessing the contribution of abnormal insulin secretion to diseases related to reduced insulin sensitivity and insulin action such as prediabetes and diabetes mellitus (5,6). The extraction of insulin secreted into the portal vein by the liver precludes the direct measurement of the ISR from peripherally sampled insulin concentration (7,8). C-peptide is cosecreted in an equimolar amount with insulin by pancreatic b-cells and the concentration is negligibly affected by first-pass hepatic metabolism (9). The ISR is then equivalent to the C-peptide secretion rate, which can be found from the plasma C-peptide time-course and the C-peptide clearance rate. The relationship between C-peptide and insulin can be quantified using a two- compartment model of plasma and extravascular C-peptide allowing for the inference of ISR by solving an inverse problem. C-peptide clearance by the kidneys is dependent on the ISR per se and changes in C-peptide clearance are not measurable in the urine (10). We concentrate on the two-compartment model, leaving refinements to account for kidney function for future work. Thus, for our purposes, the problem comes in attempting to infer the continuous secretion rate from incomplete discretized C-peptide measurements. The traditional method of solving this inverse problem is to either reduce the dimensionality by using a parametric Submitted August 19, 2011, and accepted for publication December 23, 2011. 6 William J. Heuett and Bernard V. Miller III contributed equally to this work. *Correspondence: [email protected]or [email protected]Editor: Richard Bertram. Ó 2012 by the Biophysical Society 0006-3495/12/02/0399/8 $2.00 doi: 10.1016/j.bpj.2011.12.046 Biophysical Journal Volume 102 February 2012 399–406 399
Transcript
Biophysical Journal Volume 102 February 2012 399–406 399
Bayesian Functional Integral Method for Inferring Continuous Datafrom Discrete Measurements
William J. Heuett,†‡6* Bernard V. Miller III,§6 Susan B. Racette,{ John O. Holloszy,k Carson C. Chow,‡
and Vipul Periwal‡*†Mathematics Department, Marymount University, Arlington, Virginia; ‡Laboratory of Biological Modeling and §Diabetes, Endocrinology andObesity Branch, National Institute of Diabetes and Digestive and Kidney Diseases, National Institutes of Health, Bethesda, Maryland; and{Division of Endocrinology, Metabolism and Lipid Research and kDivision of Geriatrics and Nutritional Sciences, Department of Medicine,Washington University School of Medicine, St. Louis, Missouri
ABSTRACT Inference of the insulin secretion rate (ISR) from C-peptide measurements as a quantification of pancreatic b-cellfunction is clinically important in diseases related to reduced insulin sensitivity and insulin action. ISR derived from C-peptideconcentration is an example of nonparametric Bayesian model selection where a proposed ISR time-course is considered tobe a ‘‘model’’. An inferred value of inaccessible continuous variables from discrete observable data is often problematic in biologyand medicine, because it is a priori unclear how robust the inference is to the deletion of data points, and a closely related ques-tion, how much smoothness or continuity the data actually support. Predictions weighted by the posterior distribution can be castas functional integrals as used in statistical field theory. Functional integrals are generally difficult to evaluate, especially fornonanalytic constraints such as positivity of the estimated parameters. We propose a computationally tractable method thatuses the exact solution of an associated likelihood function as a prior probability distribution for a Markov-chain Monte Carloevaluation of the posterior for the full model. As a concrete application of our method, we calculate the ISR from actual clinicalC-peptide measurements in human subjects with varying degrees of insulin sensitivity. Our method demonstrates the feasibilityof functional integral Bayesian model selection as a practical method for such data-driven inference, allowing the data to deter-mine the smoothing timescale and the width of the prior probability distribution on the space of models. In particular, our modelcomparison method determines the discrete time-step for interpolation of the unobservable continuous variable that is supportedby the data. Attempts to go to finer discrete time-steps lead to less likely models.
INTRODUCTION
The inference of continuous quantities from small numbersof measurements is ubiquitous in medicine and biology.Bayesian model comparison is ideally suited for such tasksbecause it automatically invokes Occam’s principle andbalances goodness-of-fit against the complexity of themodel (1–3). However, Bayesian methods are computation-ally intractable for high dimensional problems as theyrequire integration over the parameter space. Hence, manytheoretical advances in Bayesian inference (4) have notyet been fully exploited in applications. Here we showthat such integrals become numerically tractable if a suitableapproximation of the prior probability distribution can beexplicitly calculated to provide an initial condition fora Markov-chain Monte Carlo (MCMC) evaluation of themodel posterior probabilities (i.e., Bayes factors). MCMCwill generally not converge to a meaningful result unlessa good initial condition is specified. For concreteness, wepresent the application of this general methodology toa concrete example of clinical relevance with data fromhuman subjects in this article.
Submitted August 19, 2011, and accepted for publication December 23,
2011.6William J. Heuett and Bernard V. Miller III contributed equally to this
The accurate determination of pancreatic b-cell functionas manifested in the insulin secretion rate (ISR) is clinicallyimportant in assessing the contribution of abnormal insulinsecretion to diseases related to reduced insulin sensitivityand insulin action such as prediabetes and diabetes mellitus(5,6). The extraction of insulin secreted into the portal veinby the liver precludes the direct measurement of the ISRfrom peripherally sampled insulin concentration (7,8).C-peptide is cosecreted in an equimolar amount with insulinby pancreatic b-cells and the concentration is negligiblyaffected by first-pass hepatic metabolism (9). The ISR isthen equivalent to the C-peptide secretion rate, which canbe found from the plasma C-peptide time-course and theC-peptide clearance rate. The relationship betweenC-peptide and insulin can be quantified using a two-compartment model of plasma and extravascular C-peptideallowing for the inference of ISR by solving an inverseproblem. C-peptide clearance by the kidneys is dependenton the ISR per se and changes in C-peptide clearance arenot measurable in the urine (10). We concentrate on thetwo-compartment model, leaving refinements to accountfor kidney function for future work. Thus, for our purposes,the problem comes in attempting to infer the continuoussecretion rate from incomplete discretized C-peptidemeasurements.
The traditional method of solving this inverse problem isto either reduce the dimensionality by using a parametric
form for the ISR or use some interpolation method to inferthe missing data. A major problem with this approach isthat the formula for inferring the ISR from the discreteC-peptide measurements involves the numerical differenti-ation of an interpolated C-peptide time-course. As is wellknown, the numerical derivative of an interpolated functiondepends sensitively on the interpolation. Thus, thesemethods are ad hoc in the sense that the constraints areimposed extemporaneously to the data and it is unclearhow much smoothness or continuity the data actuallysupport. A more suitable situation is to let the data,combined with the minimal desideratum for the ISR(namely, continuity of the secretion profile), predict themissing data. Bayesian model comparison is a principledmeans of predicting data at unsampled time points becauseit balances the complexity of the model with goodness-of-fit to the experimental data. On the other hand, it alsorequires integration over high-dimensional spaces that isusually neither analytically nor numerically tractable. Wetake a two-step strategy where we consider a reducedproblem that can be analytically solved and then use thissolution as a starting point for a numerical MCMCintegration.
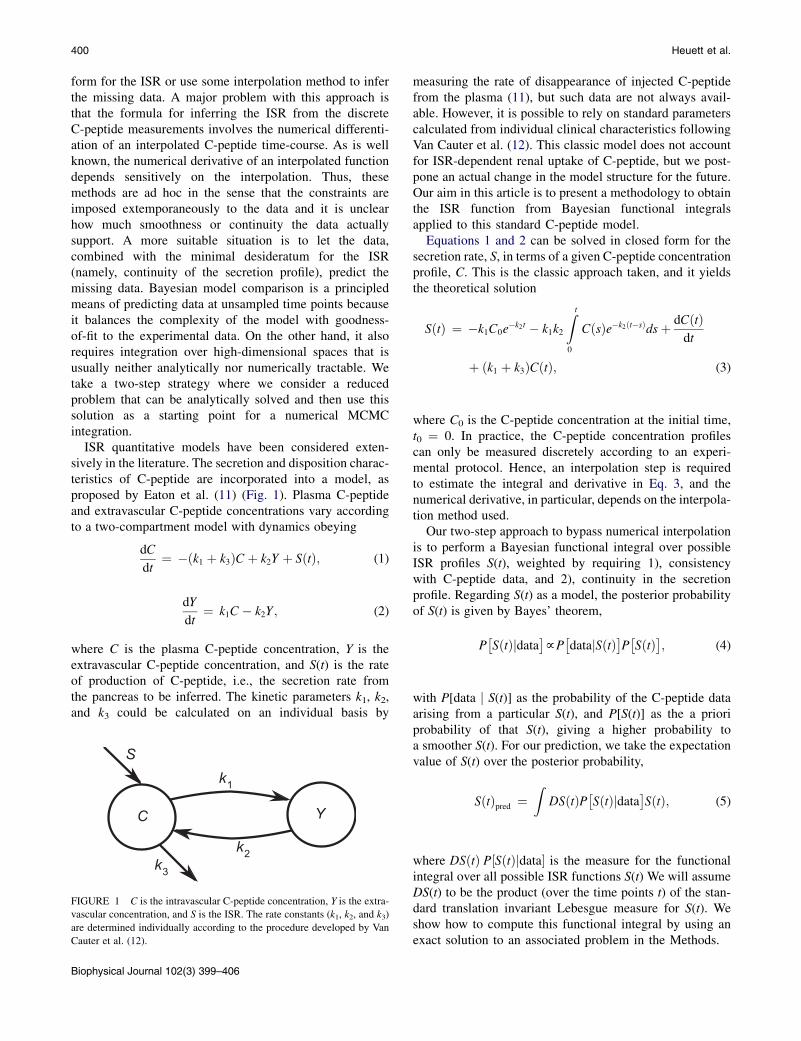
ISR quantitative models have been considered exten-sively in the literature. The secretion and disposition charac-teristics of C-peptide are incorporated into a model, asproposed by Eaton et al. (11) (Fig. 1). Plasma C-peptideand extravascular C-peptide concentrations vary accordingto a two-compartment model with dynamics obeying
dC
dt¼ �ðk1 þ k3ÞCþ k2Y þ SðtÞ; (1)
dY
dt¼ k1C� k2Y; (2)
where C is the plasma C-peptide concentration, Y is theextravascular C-peptide concentration, and S(t) is the rateof production of C-peptide, i.e., the secretion rate fromthe pancreas to be inferred. The kinetic parameters k1, k2,and k3 could be calculated on an individual basis by
FIGURE 1 C is the intravascular C-peptide concentration, Y is the extra-
vascular concentration, and S is the ISR. The rate constants (k1, k2, and k3)
are determined individually according to the procedure developed by Van
Cauter et al. (12).
Biophysical Journal 102(3) 399–406
measuring the rate of disappearance of injected C-peptidefrom the plasma (11), but such data are not always avail-able. However, it is possible to rely on standard parameterscalculated from individual clinical characteristics followingVan Cauter et al. (12). This classic model does not accountfor ISR-dependent renal uptake of C-peptide, but we post-pone an actual change in the model structure for the future.Our aim in this article is to present a methodology to obtainthe ISR function from Bayesian functional integralsapplied to this standard C-peptide model.
Equations 1 and 2 can be solved in closed form for thesecretion rate, S, in terms of a given C-peptide concentrationprofile, C. This is the classic approach taken, and it yieldsthe theoretical solution
SðtÞ ¼ �k1C0e�k2t � k1k2
Z t
0
CðsÞe�k2ðt�sÞdsþ dCðtÞdt
þ ðk1 þ k3ÞCðtÞ; (3)
where C0 is the C-peptide concentration at the initial time,t0 ¼ 0. In practice, the C-peptide concentration profilescan only be measured discretely according to an experi-mental protocol. Hence, an interpolation step is requiredto estimate the integral and derivative in Eq. 3, and thenumerical derivative, in particular, depends on the interpola-tion method used.
Our two-step approach to bypass numerical interpolationis to perform a Bayesian functional integral over possibleISR profiles S(t), weighted by requiring 1), consistencywith C-peptide data, and 2), continuity in the secretionprofile. Regarding S(t) as a model, the posterior probabilityof S(t) is given by Bayes’ theorem,
P�SðtÞjdata�fP
�datajSðtÞ�P�SðtÞ�; (4)
with P[data j S(t)] as the probability of the C-peptide dataarising from a particular S(t), and P[S(t)] as the a prioriprobability of that S(t), giving a higher probability toa smoother S(t). For our prediction, we take the expectationvalue of S(t) over the posterior probability,
SðtÞpred ¼Z
DSðtÞP�SðtÞjdata�SðtÞ; (5)
where DSðtÞ P½SðtÞjdata� is the measure for the functionalintegral over all possible ISR functions S(t) We will assumeDS(t) to be the product (over the time points t) of the stan-dard translation invariant Lebesgue measure for S(t). Weshow how to compute this functional integral by using anexact solution to an associated problem in the Methods.
Bayesian Functional Integral Method 401
METHODS
We implement the exact numerical problem as follows: Assuming the
C-peptide concentration is measured at discrete times t0, t1, ., tm, we
define the vector~c ¼ ðC1 � C0;C2 � C0;.;Cm � C0ÞT, where Ci denotes
the C-peptide measurement at time ti. Representing the differential system
in Eqs. 1 and 2 in matrix form, we solve for ~c ¼ MK0~s, where
~s ¼ ðS1 � S0; S2 � S0;.; Sn � S0ÞT is the nonbasal secretion rate at n
evenly spaced time points from tm/n to tm. K0 is an n � n lower-triangular
matrix with tm/2n along its main diagonal and with ith row, jth column
entries, K0ij, below the diagonal given by
K0ij ¼
tmnðv12v21�v11v22Þ
��v11v22el1tmði�jÞ=nþv12v21e
l2tmði�jÞ=n�;(6)
where l1 and l2 are the eigenvalues, with corresponding eigenvectors,
~v1 ¼ ðv11; v12ÞT and~v2 ¼ ðv21; v22ÞT, of the systemmatrix of the differential
system. Equation 6 employs the trapezoidal rule for numerical integration
(13). Thus, the integral is numerically evaluated as a sum of terms using
Zb
a
f ðxÞdx ¼ ðb� aÞ ðf ðaÞ þ f ðbÞÞ2
for each time step.M is an m � n matrix that is used to select the entries of
K0~s that coincide with the C-peptide measurements, i.e., the ith entry is
selected if tmi/n ˛ {t1, t2,., tm} because the experimental data we are using
only samples C-peptide values at specific time points.
In writing~c ¼ MK0~s, we assume the discrete times chosen for the secre-
tion rate include all times, ti, for which C-peptide measurements are made.
If that is not the case,~c is simply redefined to exclude those entries that are
omitted by the scheme. To simplify notation, we define the m � n matrix
K ¼ MK0. We define a matrix, F, to perform numerical differentiation.
We use a three-point formula for differentiation (13). Thus, the derivative
matrix F is computing f0(x)¼ (f(xþ h) – f(x – h))/2 h. This solution provides
the nonbasal secretion rate. The total secretion rate, ~S, is equal to k3C0 at
time t0, because the system is assumed to be in equilibrium at that time,
and si þ k3C0 at each later time point, ti, in the discretization scheme. As
this is all linear algebra to this point, nothing prevents the predicted secre-
tion rate from having nonpositive values.
The measure for the functional integral, Eq. 5, may be written in the form
DS(t) exp (�bE), with a cost function E given by (k$k is the ‘2 norm)
E ¼ g
2
k~c�K~sk2k~sck2
þ 1
2g
kF~sk2k~ssk2
þXn
i¼ 0
lnS8i
S8i þ d8: (7)
The first term in E is�ln(P[data j S(t)]), and the remaining two terms corre-
spond to �ln(P[S(t)]). We explain the meaning of each of these terms in
turn. K is the matrix representing the linear solution of Eqs. 1 and 2, giving
the C-peptide concentration as a function of~s. Thus, this term is a measure
of goodness of fit, measuring the deviation of the predicted C-peptide from
a given ISR model~s from the experimentally observed~c: The second term
measures continuity as F is a matrix representing the linear operation of
differentiation. Thus, this term is a constraint on the difference between
successive ~s values in a given ISR model, giving higher probability to ~s
values that are smoother. In particular, this term connects integrand vari-
ables in the product that measure DSðtÞ ¼ D~s; and implies that the values
in the ISR are not independent random variables. The last term enforces
the constraint that~s is nonnegative, according a vanishing probability to~s
with negative values at any time point. This is the term that renders an exact
Gaussian evaluation of the integral impossible, as it is not quadratic in~s.The exact functional form of the last term in Eq. 7 does not affect the
results. The normalizations of these terms are dictated by experimental
uncertainties: the intrinsic fluctuations of the experimental data, ~sc, and
the fluctuations in the secretion rate, ~ss, propagated through the model
from the magnitude of the fluctuations observed in the experimental data
(details below). The magnitude of d is 10�5, which is well below the uncer-
tainty in experimental measurements for the data presented in this article.
The number of time points at which we evaluate~s is also a model param-
eter. In particular, it is determined by the discretization, and in the
following, we show that the appropriate step size, h, of the discretization
scheme chosen for~s, is also picked out by the Bayesian model selection.
The weighting factor, g, in Eq. 7 is the final model parameter in the set
that distinguishes different models, Xh,g, in the model comparison.
The functional integral in Eq. 5 would be impossible due to the large
number of variables in the integration. For example, for a time step of
h ¼ 0.5 min, there are ~240 values in the ISR time-course. However, we
are able to find the maximum of the measure exactly by neglecting the non-
negativity constraint in a preliminary calculation. In this preliminary calcu-
lation, we suppose that we want to solve~c�K~s ¼ 0 exactly, because this is
just a matrix representation of the linear differential equations of the two-
compartment model (Eqs. 1 and 2). Because this is an underdetermined
system, we can also require that the solution minimizes kF~s2k, which is
exactly the second term in Eq. 7, favoring continuous secretion profiles.
This constrained linear algebra problem can be explicitly solved by
means of Lagrange multipliers, n, with an associated Hamiltonian function,
H ¼ 1
2ð~s;FTF~sÞ þ ð~n; ð~c�K~sÞÞ, which has minima where
vH
v~n¼ ~c�K~s ¼ ~0; (8)
vH T T T
v~s¼ ~s F F�~n K ¼ ~0: (9)
Now, it follows by multiplying the transpose of the second equation by
K(FTF)�1 that
K~s ¼ �K�FTF
��1KT
�~n; (10)
but then
~c ¼ �K�FTF
��1KT
�~n: (11)
Solving for~n;
~n ¼ �K�FTF
��1KT
��1~c; (12)
and, therefore, multiplying both sides by (FTF)�1 KT,
~s ¼ �FTF
��1KT
�K�FTF
��1KT
��1~c: (13)
Weminimize Eq. 7 and fit each model separately to data from each of the
subjects in our study. All the points of a secretion rate profile are varied
collectively in the optimization process using a Markov-chain Monte Carlo
method with parallel tempering (2). Optimizations are performed for each
model considered using 10 uniformly spaced values (100–1000) for the
tempering parameter, b, and the corresponding updating probability,
e�bE. Simulations begin with an initial~S calculated from Eq. 13 with any
negative values replaced by 2d. After equilibration, 105 iterations are per-
formed for each tempering parameter, and statistics, such as h~Sib and
hEib, are calculated.The probability distribution for the model conditional on the data, D, is
denoted as P(Xh,g j D). We calculate the log probability that the model
describes the data for each individual, i, as
Biophysical Journal 102(3) 399–406
402 Heuett et al.
ln PðXh;gjDiÞ ¼ � 1
10
Xb
1000hEib;
and across all individuals as
� � � X
ln P Xh;g
�Dall subjects ¼i
ln PðXh;gjDiÞ:
The model with the largest log-likelihood is chosen as the winning model
with optimal parameter values on a population basis. The advantage of
this method is that it balances goodness of fit, smoothness, and nonnegativ-
ity while fitting the models to the data from each individual separately, all
within the same numerical procedure. The method also removes the subjec-
tiveness of choosing how to interpolate the C-peptide profile and how to dis-
cretize the secretion rate.
We apply the improved model of the ISR to C-peptide data from hyper-
glycemic glucose clamp studies. Plasma concentrations were measured at
ing 25 g of corn oil (Lipomul; Upjohn, Kalamazoo, MI). C-peptide
measurements were used to calculate the secretion rates over the
0–120 min time interval. For each individual, the ith component of ~scwas calculated as Ci multiplied by the ratio of the standard deviation to
the mean of the �10, �5, and 0 min C-peptide measurements.
The model is implemented in MATLAB (The MathWorks, Natick, MA).
RESULTS
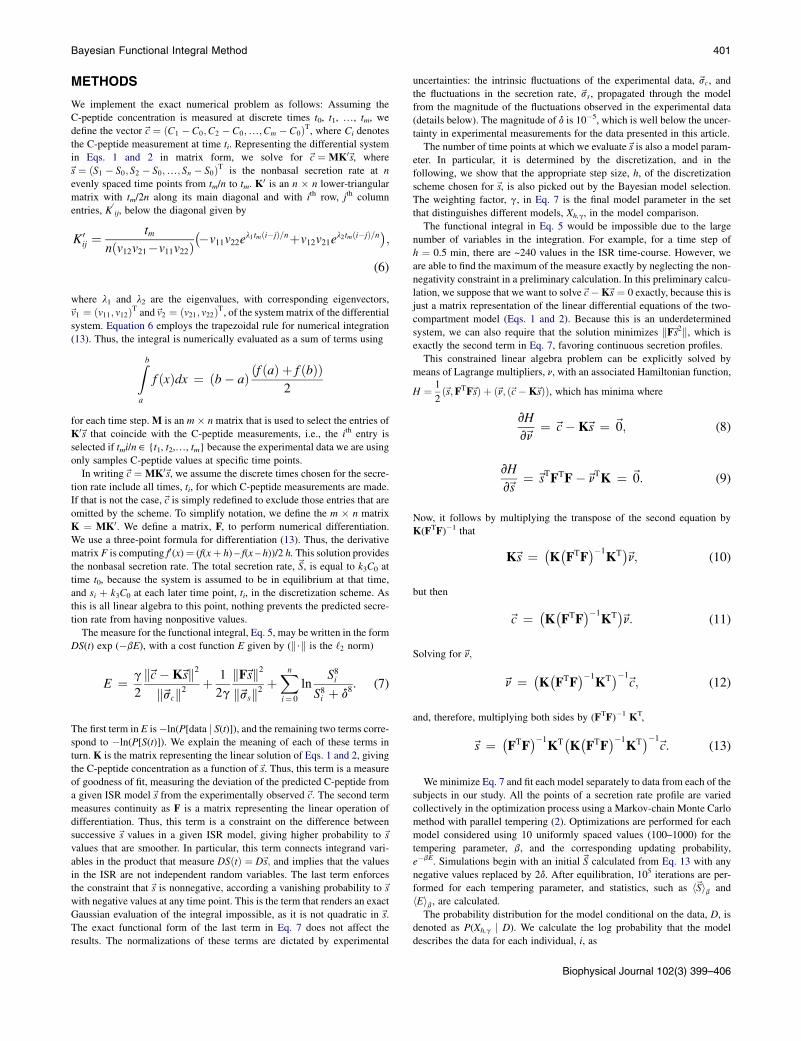
Fig. 2 shows the mean C-peptide profile of actual clinicaldata obtained from hyperglycemic clamp experiments on45 human subjects (14–16). The vertical bars at 45 min
0 20 40 60 80 100 1200
2
4
6
8
10
t [min]
C [n
M]
FIGURE 2 Average C-peptide profile from 45 subjects (14–16). Glucose
was infused during the entire trial. Arginine infusion began at 45 min. A
liquid fat drink was administered at 75 min. (Error bars) Mean 5 SE.
Biophysical Journal 102(3) 399–406
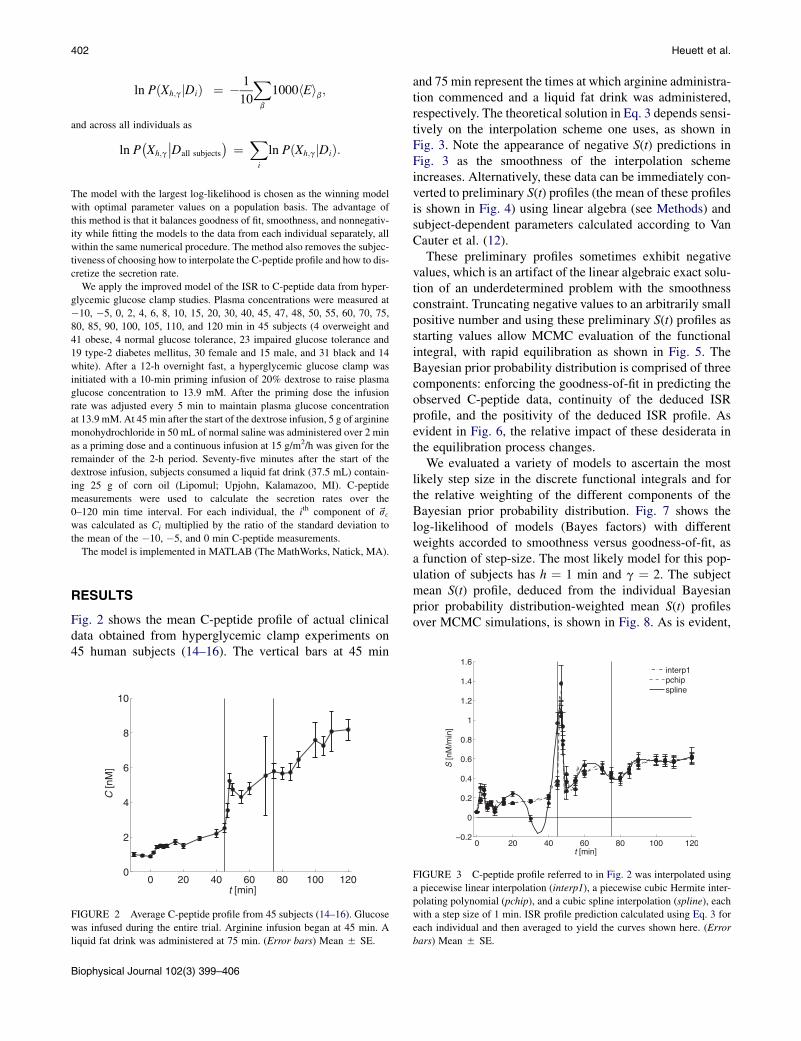
and 75 min represent the times at which arginine administra-tion commenced and a liquid fat drink was administered,respectively. The theoretical solution in Eq. 3 depends sensi-tively on the interpolation scheme one uses, as shown inFig. 3. Note the appearance of negative S(t) predictions inFig. 3 as the smoothness of the interpolation schemeincreases. Alternatively, these data can be immediately con-verted to preliminary S(t) profiles (the mean of these profilesis shown in Fig. 4) using linear algebra (see Methods) andsubject-dependent parameters calculated according to VanCauter et al. (12).
These preliminary profiles sometimes exhibit negativevalues, which is an artifact of the linear algebraic exact solu-tion of an underdetermined problem with the smoothnessconstraint. Truncating negative values to an arbitrarily smallpositive number and using these preliminary S(t) profiles asstarting values allow MCMC evaluation of the functionalintegral, with rapid equilibration as shown in Fig. 5. TheBayesian prior probability distribution is comprised of threecomponents: enforcing the goodness-of-fit in predicting theobserved C-peptide data, continuity of the deduced ISRprofile, and the positivity of the deduced ISR profile. Asevident in Fig. 6, the relative impact of these desiderata inthe equilibration process changes.
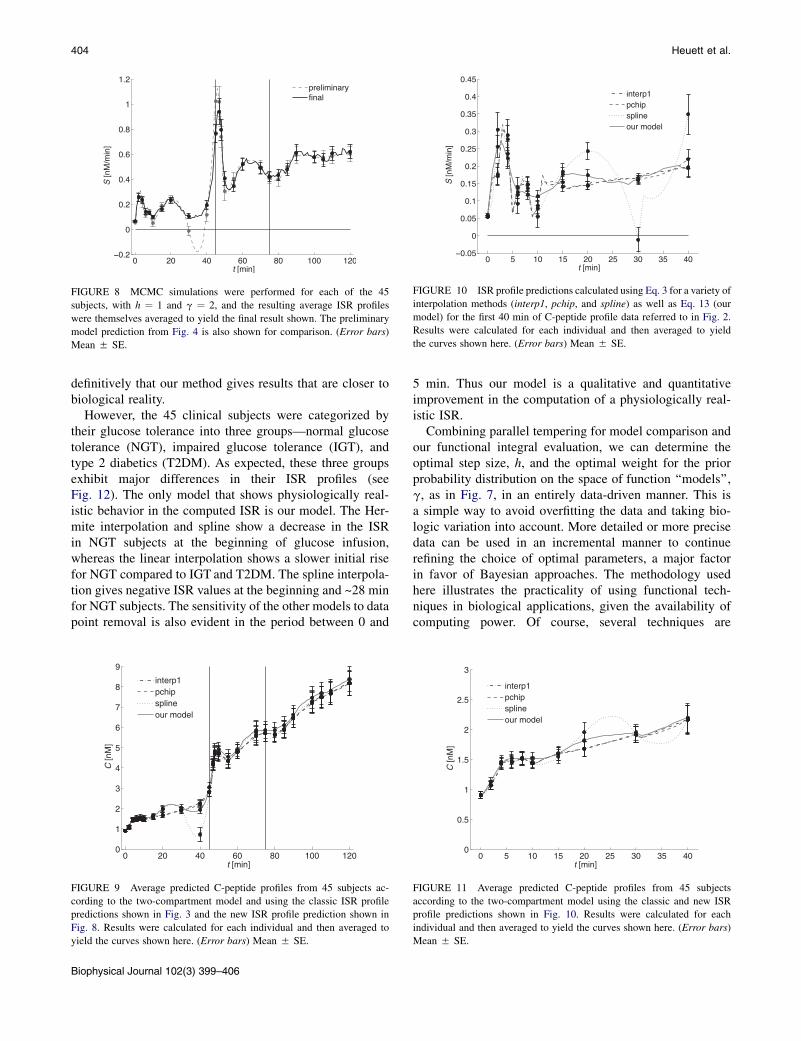
We evaluated a variety of models to ascertain the mostlikely step size in the discrete functional integrals and forthe relative weighting of the different components of theBayesian prior probability distribution. Fig. 7 shows thelog-likelihood of models (Bayes factors) with differentweights accorded to smoothness versus goodness-of-fit, asa function of step-size. The most likely model for this pop-ulation of subjects has h ¼ 1 min and g ¼ 2. The subjectmean S(t) profile, deduced from the individual Bayesianprior probability distribution-weighted mean S(t) profilesover MCMC simulations, is shown in Fig. 8. As is evident,
FIGURE 3 C-peptide profile referred to in Fig. 2 was interpolated using
a piecewise linear interpolation (interp1), a piecewise cubic Hermite inter-
polating polynomial (pchip), and a cubic spline interpolation (spline), each
with a step size of 1 min. ISR profile prediction calculated using Eq. 3 for
each individual and then averaged to yield the curves shown here. (Error
bars) Mean 5 SE.
FIGURE 4 ISR profile prediction calculated using Eq. 13 for the
C-peptide profile data referred to in Fig. 2. ISR profiles were calculated
for each individual and then averaged to yield the curve shown here. (Error
bars) Mean 5 SE.
0
0.04
nonn
eg
0
0.4
smoo
th
0 2 4 6 8 10
x 105
0
0.1
iteration
fit
FIGURE 6 Example of the individual cost components, i.e., cost associ-
ated with nonnegativity, smoothness, and goodness-of-fit, during an MCMC
simulation. The results shown are the components that sum together to yield
the total cost shown in Fig. 5.
Bayesian Functional Integral Method 403
the predicted S(t) is not as smooth as the exact solution, butis positive at all values. Fig. 9 illustrates the C-peptideprofiles that would be predicted from the S(t) profiles inFigs. 3 and 8 according to the two-compartment model.
We note the physiologically incorrect prescient increasein the S(t) profile before the 45-min mark in Fig. 8. Theincrease is a result of the smoothness constraint beingapplied across the physically discontinuous situationinvolving the externally infused arginine. To account forsuch experimental conditions, we must use all the infor-mation available about the experiment, and imposea discontinuity by considering the time intervals separatelyand calculating the S(t) profiles sequentially, using the finaltime point from one interval as the initial condition in thenext. Figs. 10 and 11 illustrate the S(t) profiles and corre-sponding C-peptide profile predictions, respectively, forthe first 40 min of the hyperglycemic glucose clamp data.
0 2 4 6 8 10
x 105
0
0.1
0.2
0.3
iteration
tota
l cos
t, E
FIGURE 5 Example of the total cost equilibrating during an MCMC
simulation. Total cost is calculated using Eq. 7, with h ¼ 1 and g ¼ 2,
and the initial ISR profile is calculated using Eq. 13. C-peptide data from
Subject 2 was used for this example.
DISCUSSION
It is well established that insulin secretion is a pulsatileprocess (17). When data points are sparse, methods thatuse interpolation and Eq. 3 to estimate secretion rates tendto flatten the secretion profile, or result in large valuechanges, evident in Fig. 3. In contrast, our method showsoscillatory behavior consistent with sparse data points, butno artificial flattening of the secretion profile (Fig. 8).Unfortunately, we have no data on the ‘‘ground’’ truth forthe insulin secretion rate. Such data would require a portalvein catheterization to directly compare insulin secretionwith the C-peptide based indirect measurement. This isa major invasive clinical procedure, and it would be uneth-ical to ask healthy humans to undergo such an invasiveprocedure without medical necessity. Thus we cannot state
FIGURE 7 A comparison of the log-likelihoods of the 12 models tested,
corresponding to all combinations of g ¼ 0.5, 1, 2, and h ¼ 0.5, 1, 2, 4.
From this it is determined that the model with h¼1 and g¼ 2 is the optimal
model on a population basis.
Biophysical Journal 102(3) 399–406
FIGURE 8 MCMC simulations were performed for each of the 45
subjects, with h ¼ 1 and g ¼ 2, and the resulting average ISR profiles
were themselves averaged to yield the final result shown. The preliminary
model prediction from Fig. 4 is also shown for comparison. (Error bars)
Mean 5 SE.
FIGURE 10 ISR profile predictions calculated using Eq. 3 for a variety of
interpolation methods (interp1, pchip, and spline) as well as Eq. 13 (our
model) for the first 40 min of C-peptide profile data referred to in Fig. 2.
Results were calculated for each individual and then averaged to yield
the curves shown here. (Error bars) Mean 5 SE.
404 Heuett et al.
definitively that our method gives results that are closer tobiological reality.
However, the 45 clinical subjects were categorized bytheir glucose tolerance into three groups—normal glucosetolerance (NGT), impaired glucose tolerance (IGT), andtype 2 diabetics (T2DM). As expected, these three groupsexhibit major differences in their ISR profiles (seeFig. 12). The only model that shows physiologically real-istic behavior in the computed ISR is our model. The Her-mite interpolation and spline show a decrease in the ISRin NGT subjects at the beginning of glucose infusion,whereas the linear interpolation shows a slower initial risefor NGT compared to IGT and T2DM. The spline interpola-tion gives negative ISR values at the beginning and ~28 minfor NGT subjects. The sensitivity of the other models to datapoint removal is also evident in the period between 0 and
0 20 40 60 80 100 1200
1
2
3
4
5
6
7
8
9
t [min]
C [n
M]
interp1pchipsplineour model
FIGURE 9 Average predicted C-peptide profiles from 45 subjects ac-
cording to the two-compartment model and using the classic ISR profile
predictions shown in Fig. 3 and the new ISR profile prediction shown in
Fig. 8. Results were calculated for each individual and then averaged to
yield the curves shown here. (Error bars) Mean 5 SE.
Biophysical Journal 102(3) 399–406
5 min. Thus our model is a qualitative and quantitativeimprovement in the computation of a physiologically real-istic ISR.
Combining parallel tempering for model comparison andour functional integral evaluation, we can determine theoptimal step size, h, and the optimal weight for the priorprobability distribution on the space of function ‘‘models’’,g, as in Fig. 7, in an entirely data-driven manner. This isa simple way to avoid overfitting the data and taking bio-logic variation into account. More detailed or more precisedata can be used in an incremental manner to continuerefining the choice of optimal parameters, a major factorin favor of Bayesian approaches. The methodology usedhere illustrates the practicality of using functional tech-niques in biological applications, given the availability ofcomputing power. Of course, several techniques are
0 5 10 15 20 25 30 35 400
0.5
1
1.5
2
2.5
3
t [min]
C [n
M]
interp1pchipsplineour model
FIGURE 11 Average predicted C-peptide profiles from 45 subjects
according to the two-compartment model using the classic and new ISR
profile predictions shown in Fig. 10. Results were calculated for each
individual and then averaged to yield the curves shown here. (Error bars)
Mean 5 SE.
FIGURE 12 Average predicted C-peptide profiles from 45 subjects separated into normal glucose tolerance (NGT, bold line), impaired glucose tolerance
(IGT, regular line), and type 2 diabetes (T2DM, dotted line) for the four models.
Bayesian Functional Integral Method 405
available for speeding up the numerical evaluation of theMCMC sampling, such as using a nontrivial Hastings factoror level-set representations. For our relatively small clinicalsample of subjects, this was not necessary. The biasesinherent in making choices to avoid underfitting or over-modeling can be partially avoided by being more inclusivein model evaluation, letting the available data set determinethe most likely model. Moreover, such detailed results mayshow biological variability, evident in Fig. 8, which is morerealistic than idealizations.
We initially attempted to address this problem by meansof Gaussian process models, with continuous function deter-mination without a discretization step. In our case, althoughthe linear algebra readily admits an h / 0 limit, the nextstep of evaluating the functional integral in the continuouscase with the positivity constraint in place is not tractable.We therefore presented here the discrete analog of Gaussianprocess models. As is standard in Gaussian process models,a length scale is determined by Bayesian model comparison.In our case, that length scale is the discretization scale h sup-ported by the data. From the clinical data uncertaintiesevident in the ISR computations, it is clear the discretizationin our approach is not the limiting factor in the accuracy ofthe ISR (see Fig. 12).
We have emphasized that our method gives us limits onhow well one can expect to infer the unobserved variable
from discrete constraints, because the optimal discretizationtime step h is also determined by Bayesian model selection.We use linear interpolation for values of the ISR betweenthese time steps, but the important point is that one coulduse any interpolation as long as one keeps in mind thatany such interpolation is not constrained by the data. Inother words, the observations only determine differencesin ISR values for time points that are farther apart than h.The ISR that we find is not smooth compared to splines orinterpolation. It is, however, taking into account biologicfluctuations in the data for each individual subject.Assuming that the ground truth secretion rate is smooth isnot justified by clinical experience for most hormones forwhich such a comparison is practical.
The applicability of this methodology is more generalthan the linear problem utilized in the example of the ISRexplicated here. Indeed, our method is applicable tononlinear problems with the following characteristics:Experimental data at discrete time points,C(ti) as a constrainton a continuous unobserved variable, S(t) that determines thedynamics of C(t) by a general functional F [C(t), S(t)] ¼ 0.Interpolating the experimental data to a function ~CðtÞ; wecan linearize the functional dependence as
Fh~CðtÞ þ dCðtÞ; ~SðtÞ þ dSðtÞ
i¼ 0: (14)
Biophysical Journal 102(3) 399–406
406 Heuett et al.
Expanding in powers of dC and dS after approximatelysolving for ~SðtÞ in terms of the given function ~CðtÞ; wearrive again at an underdetermined linear problem to whichthe methods of this article are applicable mutatis mutandis,
Fh~CðtÞ; ~SðtÞ
iþ dF
dCdCðtÞ þ dF
dSdSðtÞ ¼ 0; (15)
with the appearance of the inhomogeneous first term due tothe fact that we do not require an exact solution ofF½~CðtÞ; ~SðtÞ� ¼ 0: Because Eq. 15 is again a linear problem,a smoothness-maximizing solution to the underdeterminedproblem is easily found (see Methods). The smoothnessmaximization is applied to ~Sþ dS; of course, but the methodremains applicable with trivial algebraic changes. Iterationto improve choices of ~CðtÞ and ~SðtÞ used as starting pointsis also possible.
We thank Paul J. Arciero for his contributions.
This work was supported by the Intramural Research Program, National
Institute of Diabetes and Digestive and Kidney Diseases, National Institutes
of Health, Bethesda, Maryland.
REFERENCES
1. Gelman, A., J. B. Carlin, ., D. B. Rubin. 2004. Bayesian Data Anal-ysis. Chapman and Hall/CRC, Boca Raton, FL.
2. Gregory, P. C. 2005. Bayesian Logical Data Analysis for the PhysicalSciences: A Comparative Approach with Mathematical Support.Cambridge University Press, Cambridge, UK.
3. Jaynes, E. T. 2003. Probability Theory: The Logic of Science.Cambridge University Press, Cambridge, UK.
4. Bialek, W., C. G. Callan, and S. P. Strong. 1996. Field theories forlearning probability distributions. Phys. Rev. Lett. 77:4693–4697.
Biophysical Journal 102(3) 399–406
5. Turner, R. C., C. A. Cull, ., R. R. Holman. 1999. Glycemic controlwith diet, sulfonylurea, metformin, or insulin in patients with type 2diabetes mellitus: progressive requirement for multiple therapies(UKPDS 49). J. Am. Med. Assoc. 281:2005–2012.
6. Faerch, K., A. Vaag, ., K. Borch-Johnsen. 2009. Natural history ofinsulin sensitivity and insulin secretion in the progression from normalglucose tolerance to impaired fasting glycemia and impaired glucosetolerance: the Inter99 study. Diabetes Care. 32:439–444.
7. Field, J. B. 1973. Extraction of insulin by liver. Annu. Rev. Med.24:309–314.
8. Polonsky, K. S., and A. H. Rubenstein. 1984. C-peptide as a measure ofthe secretion and hepatic extraction of insulin. Pitfalls and limitations.Diabetes. 33:486–494.
9. Horwitz, D. L., J. I. Starr, ., A. H. Rubenstein. 1975. Proinsulin,insulin, and C-peptide concentrations in human portal and peripheralblood. J. Clin. Invest. 55:1278–1283.
10. Zavaroni, I., G. Deferrari, ., A. Gnudi. 1987. Renal metabolism ofC-peptide in man. J. Clin. Endocrinol. Metab. 65:494–498.
11. Eaton, R. P., R. C. Allen, ., J. Standefer. 1980. Prehepatic insulinproduction in man: kinetic analysis using peripheral connecting peptidebehavior. J. Clin. Endocrinol. Metab. 51:520–528.
12. Van Cauter, E., F. Mestrez, ., K. S. Polonsky. 1992. Estimation ofinsulin secretion rates from C-peptide levels. Comparison of individualand standard kinetic parameters for C-peptide clearance. Diabetes.41:368–377.
13. Burden, R. L., and J. D. Faires. 1997. Numerical Analysis, 6th Ed.Brooks/Cole, Pacific Grove, CA.
14. Arciero, P. J., M. D. Vukovich, ., W. M. Kohrt. 1999. Comparison ofshort-term diet and exercise on insulin action in individuals withabnormal glucose tolerance. J. Appl. Physiol. 86:1930–1935.
15. Racette, S. B., E. P. Weiss, ., J. O. Holloszy. 2001. Modest lifestyleintervention and glucose tolerance in obese African Americans.Obes. Res. 9:348–355.
16. Racette, S. B., E. P. Weiss,., J. O. Holloszy. 2005. Modest weight lossimproves insulin action in obese African Americans. Metabolism.54:960–965.
17. Song, S. H., S. S. McIntyre,., P. C. Butler. 2000. Direct measurementof pulsatile insulin secretion from the portal vein in human subjects.J. Clin. Endocrinol. Metab. 85:4491–4499.