20
Bayesian networks
| Date post: | 20-Dec-2015 |
| Category: |
Documents |
| View: | 221 times |
| Download: | 4 times |
Bayesian networks
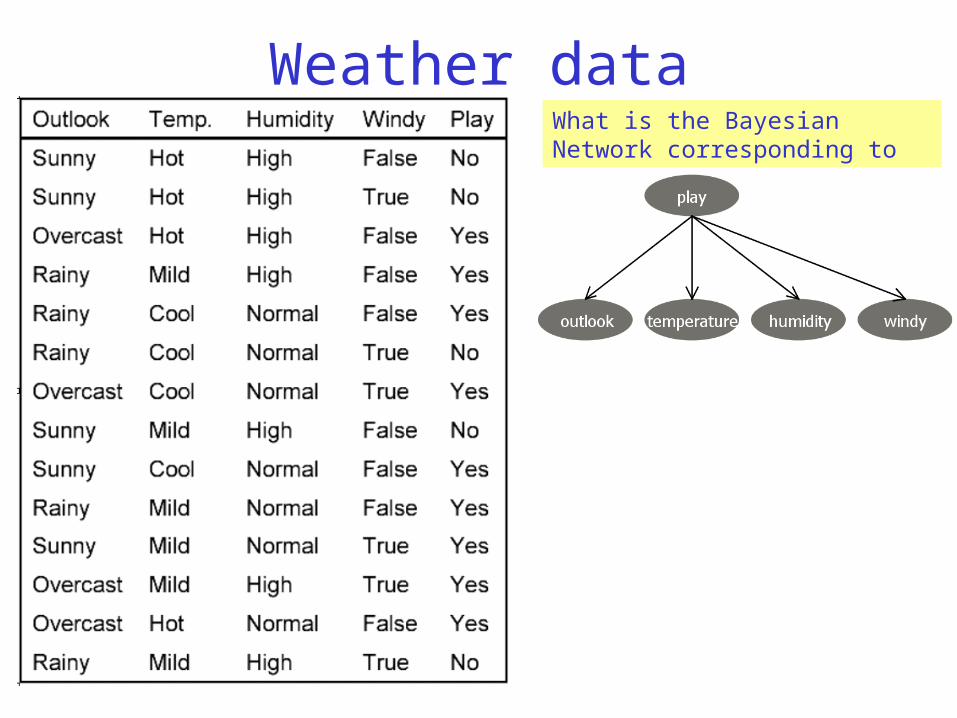
Weather dataWhat is the Bayesian Network corresponding to Naïve Bayes?
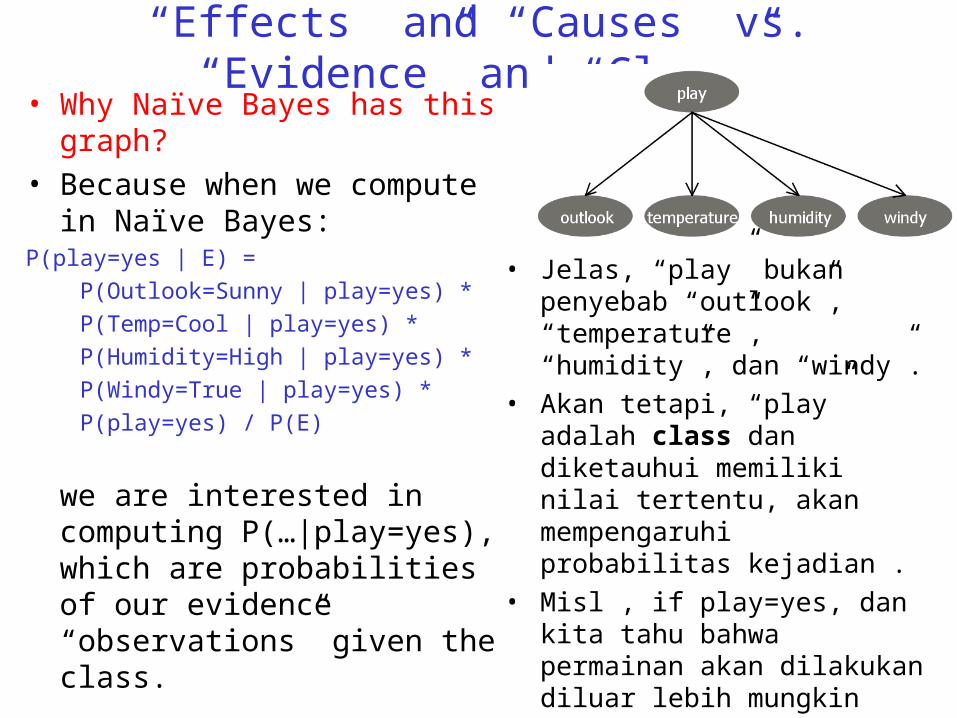
“Effects” and “Causes” vs. “Evidence” and “Class”• Why Naïve Bayes has this graph?
• Because when we compute in Naïve Bayes:
P(play=yes | E) =
P(Outlook=Sunny | play=yes) *
P(Temp=Cool | play=yes) *
P(Humidity=High | play=yes) *
P(Windy=True | play=yes) *
P(play=yes) / P(E)
we are interested in computing P(…|play=yes), which are probabilities of our evidence “observations” given the class.
• Jelas, “play” bukan penyebab “outlook”, “temperature”, “humidity”, dan “windy”.
• Akan tetapi, “play” adalah class dan diketauhui memiliki nilai tertentu, akan mempengaruhi probabilitas kejadian .
• Misl , if play=yes, dan kita tahu bahwa permainan akan dilakukan diluar lebih mungkin jika outlook the playing happens indoors, kemungkinan diluar outlook “rainy”
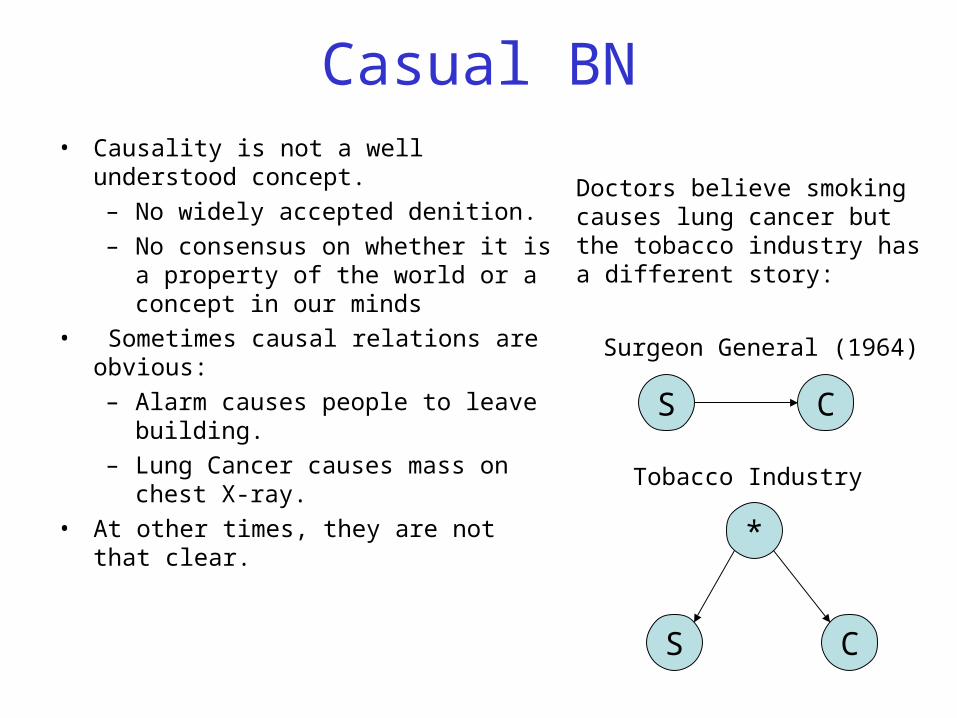
Casual BN• Causality is not a well understood concept.
– No widely accepted denition.
– No consensus on whether it is a property of the world or a concept in our minds
• Sometimes causal relations are obvious:
– Alarm causes people to leave building.
– Lung Cancer causes mass on chest X-ray.
• At other times, they are not that clear.
Doctors believe smoking causes lung cancer but the tobacco industry has a different story:
S C
Surgeon General (1964)
*
CS
Tobacco Industry
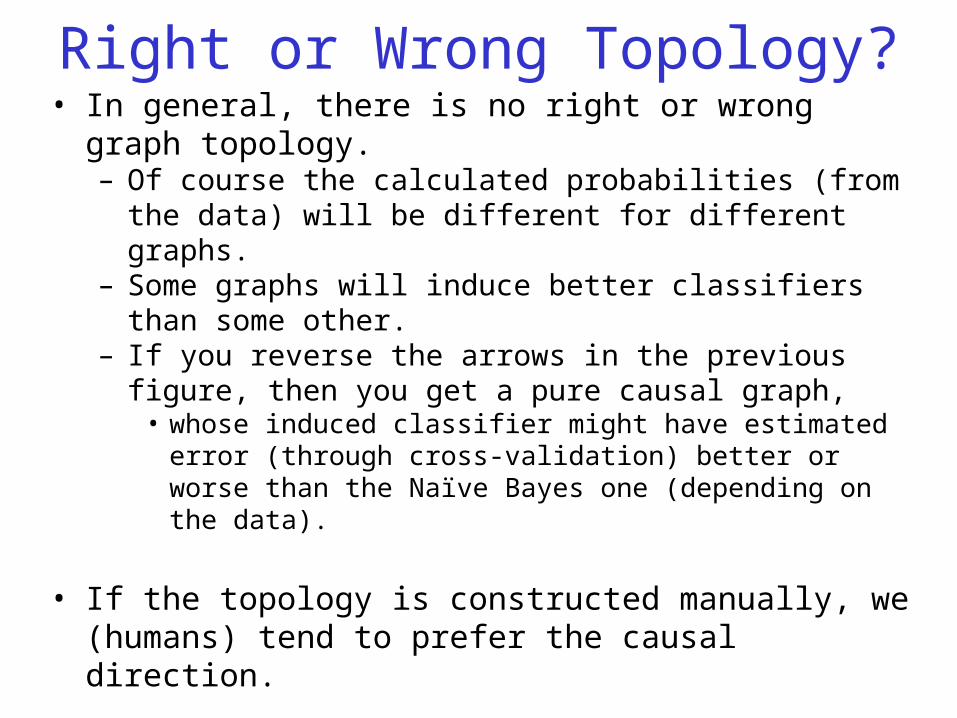
Right or Wrong Topology?• In general, there is no right or wrong graph topology.
– Of course the calculated probabilities (from the data) will be different for different graphs.
– Some graphs will induce better classifiers than some other. – If you reverse the arrows in the previous figure, then you get a
pure causal graph, • whose induced classifier might have estimated error (through cross-
validation) better or worse than the Naïve Bayes one (depending on the data).
• If the topology is constructed manually, we (humans) tend to prefer the causal direction.
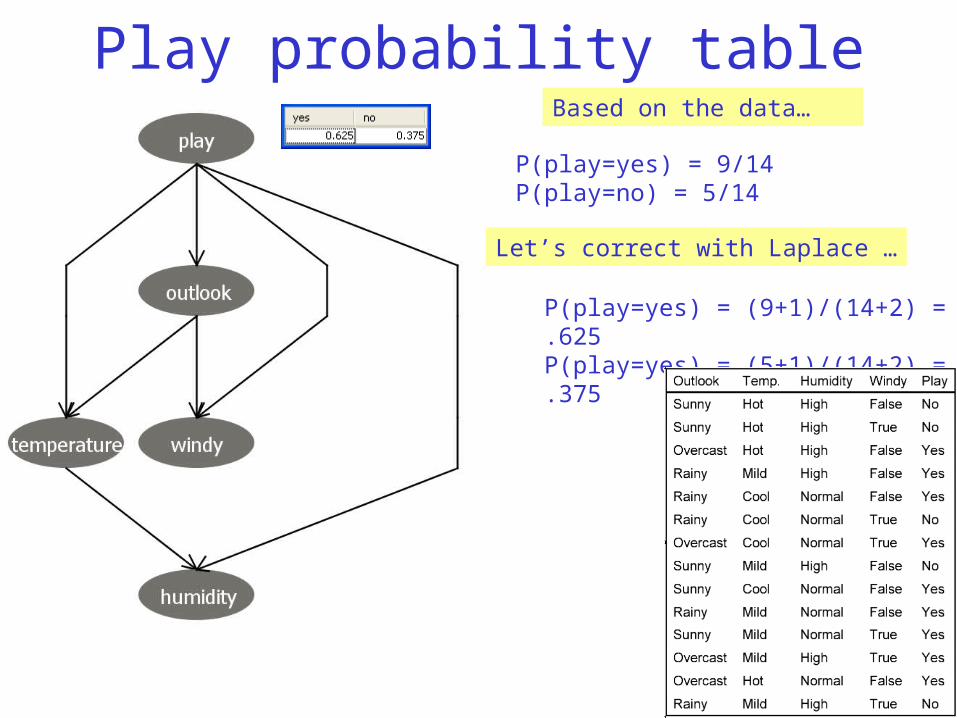
Play probability tableBased on the data…
P(play=yes) = 9/14P(play=no) = 5/14
P(play=yes) = (9+1)/(14+2) = .625P(play=yes) = (5+1)/(14+2) = .375
Let’s correct with Laplace …
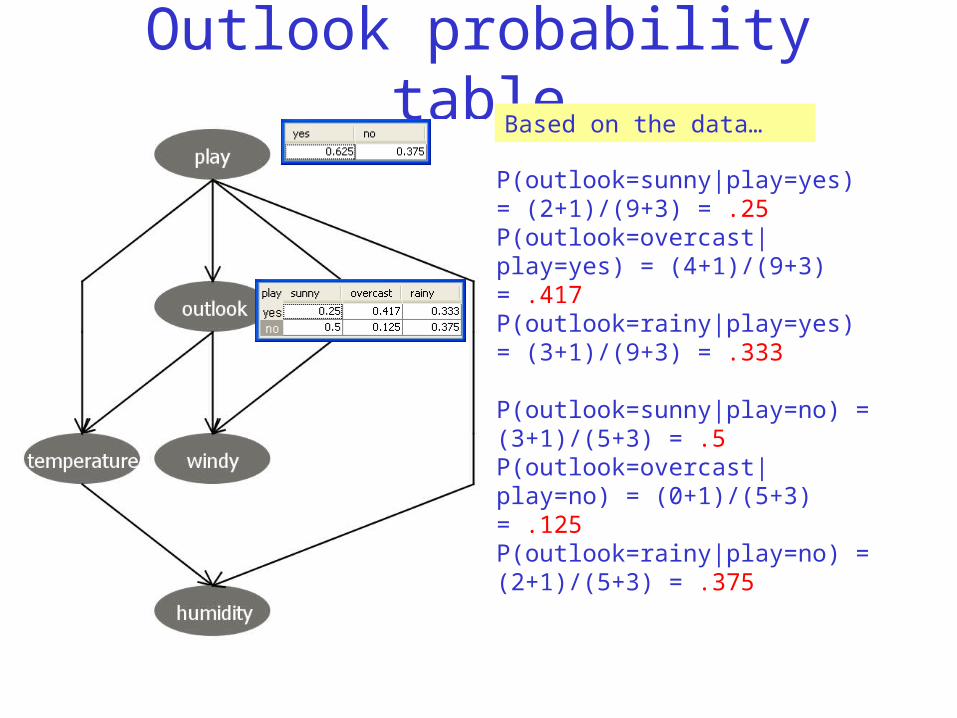
Outlook probability tableBased on the data…
P(outlook=sunny|play=yes) = (2+1)/(9+3) = .25P(outlook=overcast|play=yes) = (4+1)/(9+3) = .417P(outlook=rainy|play=yes) = (3+1)/(9+3) = .333
P(outlook=sunny|play=no) = (3+1)/(5+3) = .5P(outlook=overcast|play=no) = (0+1)/(5+3) = .125P(outlook=rainy|play=no) = (2+1)/(5+3) = .375
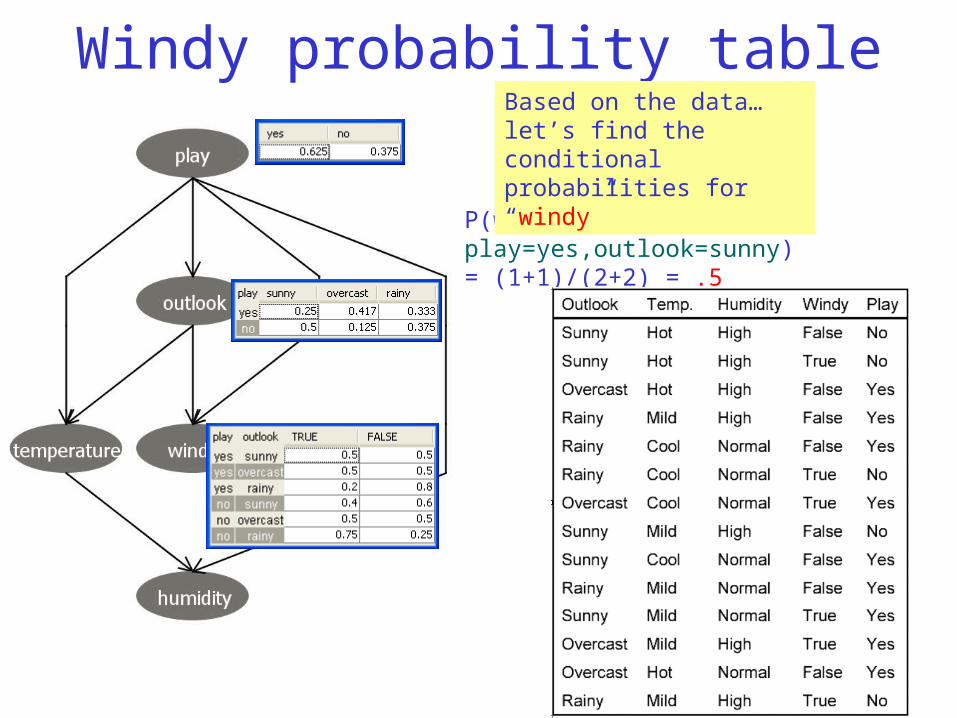
Windy probability table
P(windy=true|play=yes,outlook=sunny) = (1+1)/(2+2) = .5
Based on the data…let’s find the conditional probabilities for “windy”
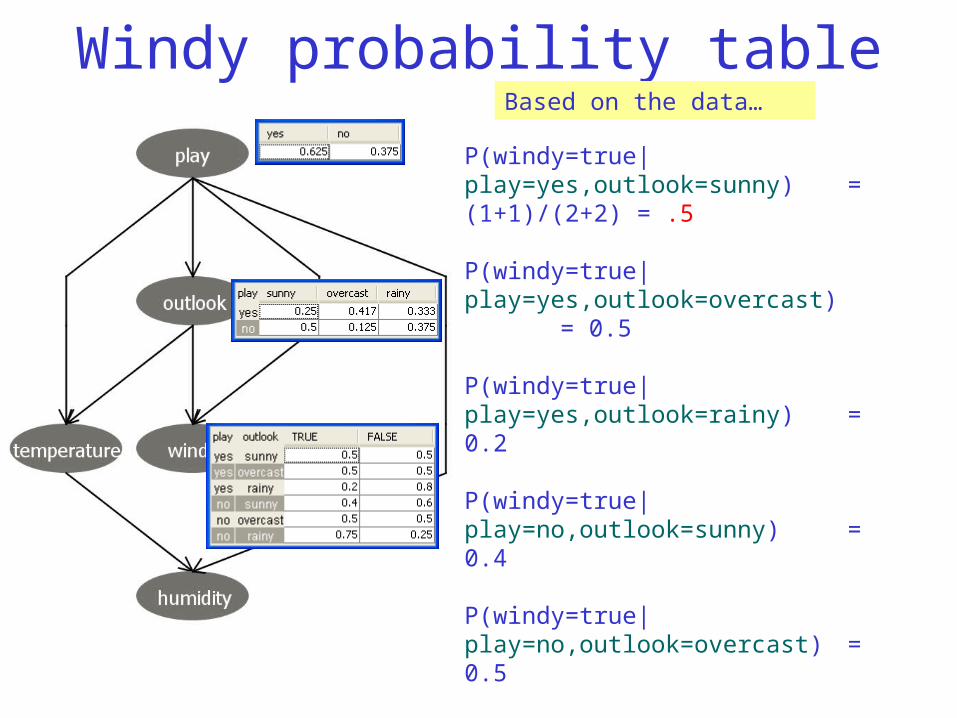
Windy probability table
P(windy=true|play=yes,outlook=sunny) = (1+1)/(2+2) = .5
P(windy=true|play=yes,outlook=overcast) = 0.5
P(windy=true|play=yes,outlook=rainy) = 0.2
P(windy=true|play=no,outlook=sunny) = 0.4
P(windy=true|play=no,outlook=overcast) = 0.5
P(windy=true|play=no,outlook=rainy) = 0.75
Based on the data…
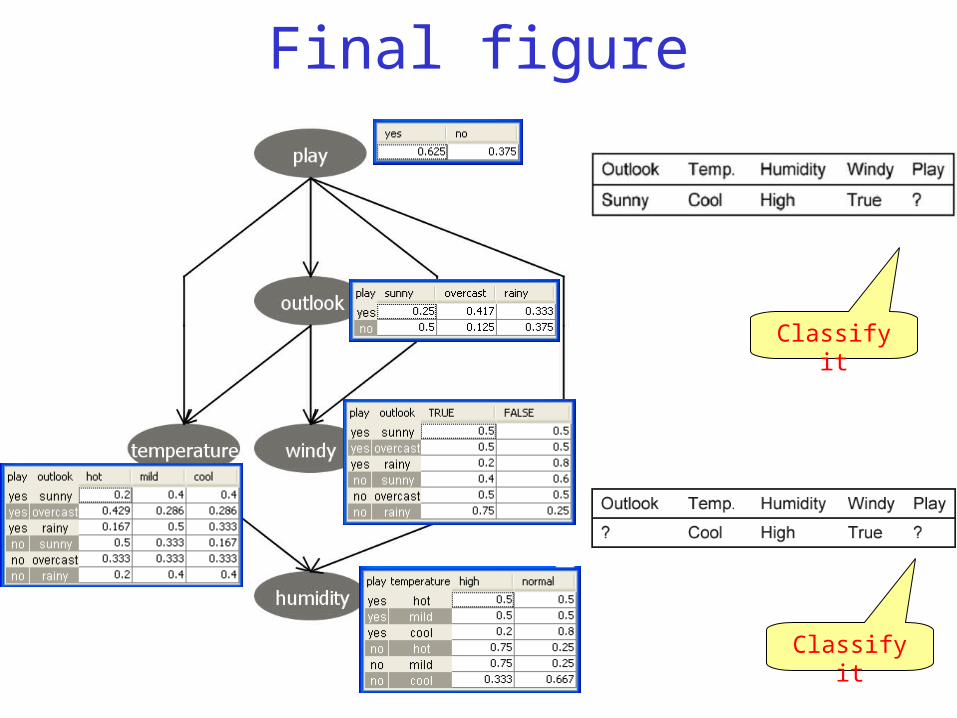
Final figure
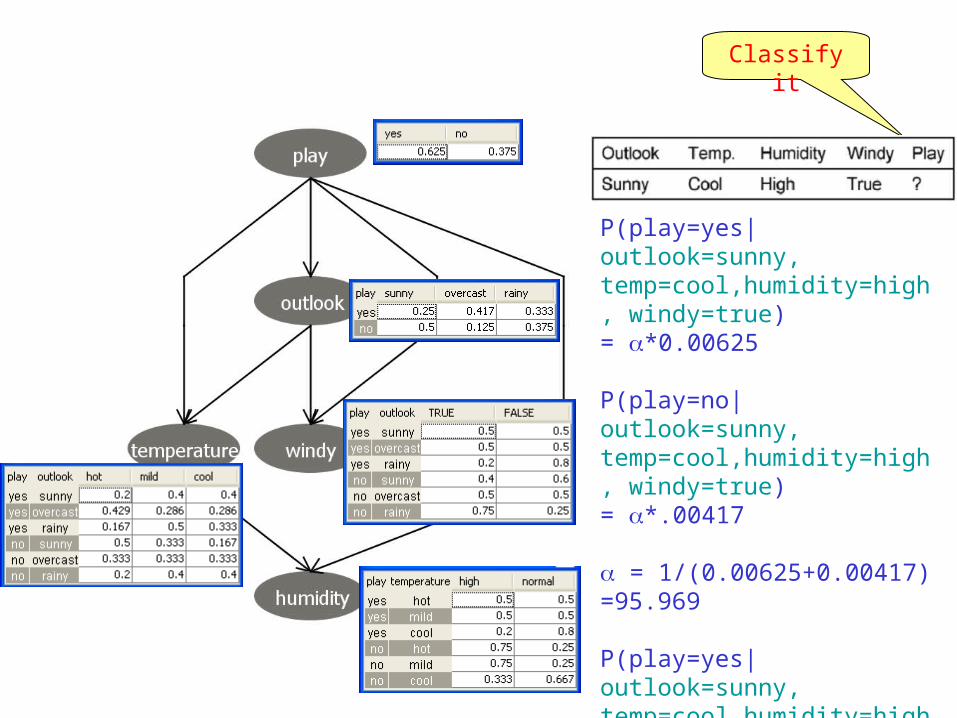
Classify it
Classify it
Classify it
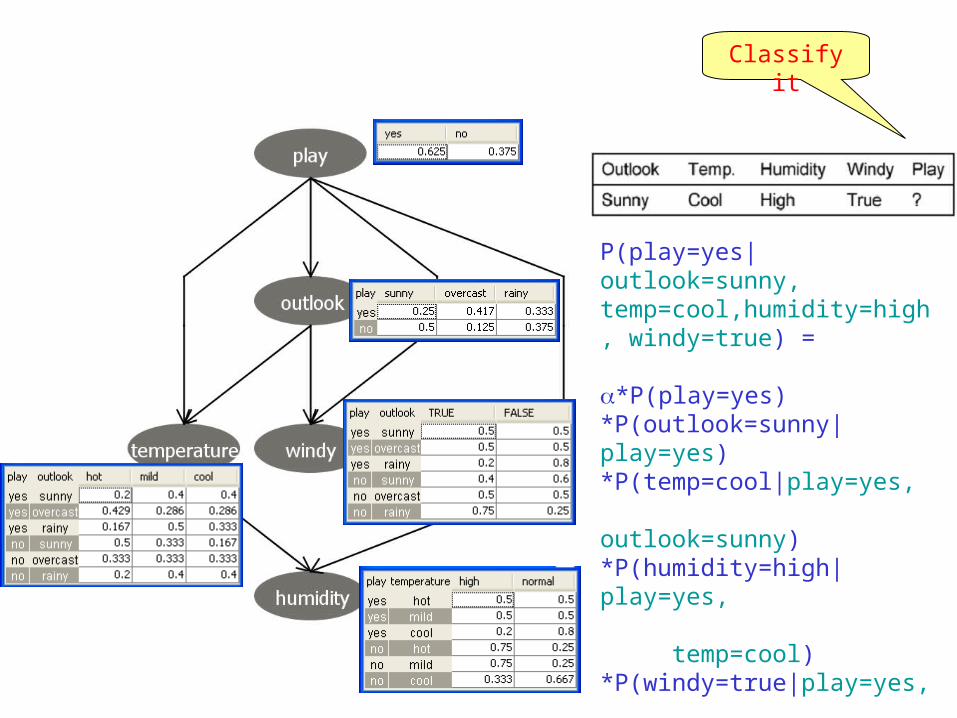
P(play=yes|outlook=sunny, temp=cool,humidity=high, windy=true) =
*P(play=yes)*P(outlook=sunny|play=yes)*P(temp=cool|play=yes, outlook=sunny)*P(humidity=high|play=yes, temp=cool)*P(windy=true|play=yes, outlook=sunny)
= *0.625*0.25*0.4*0.2*0.5= *0.00625
Classify it
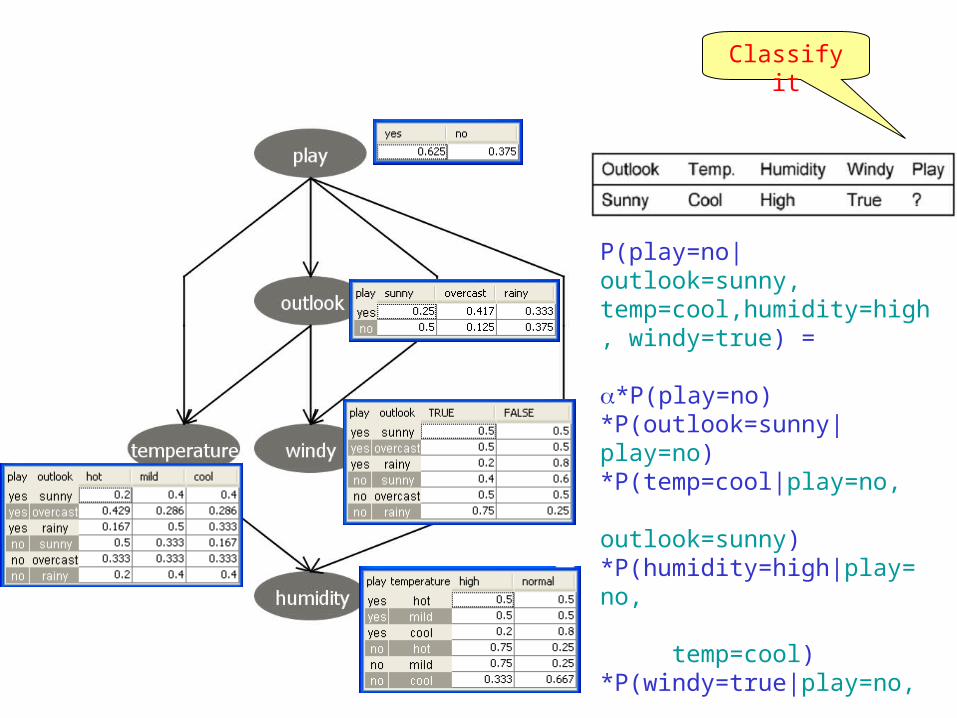
P(play=no|outlook=sunny, temp=cool,humidity=high, windy=true) =
*P(play=no)*P(outlook=sunny|play=no)*P(temp=cool|play=no, outlook=sunny)*P(humidity=high|play= no, temp=cool)*P(windy=true|play=no, outlook=sunny)
= *0.375*0.5*0.167*0.333*0.4= *0.00417
Classify it
P(play=yes|outlook=sunny, temp=cool,humidity=high, windy=true) = *0.00625
P(play=no|outlook=sunny, temp=cool,humidity=high, windy=true) = *.00417
= 1/(0.00625+0.00417) =95.969
P(play=yes|outlook=sunny, temp=cool,humidity=high, windy=true) = 95.969*0.00625 = 0.60
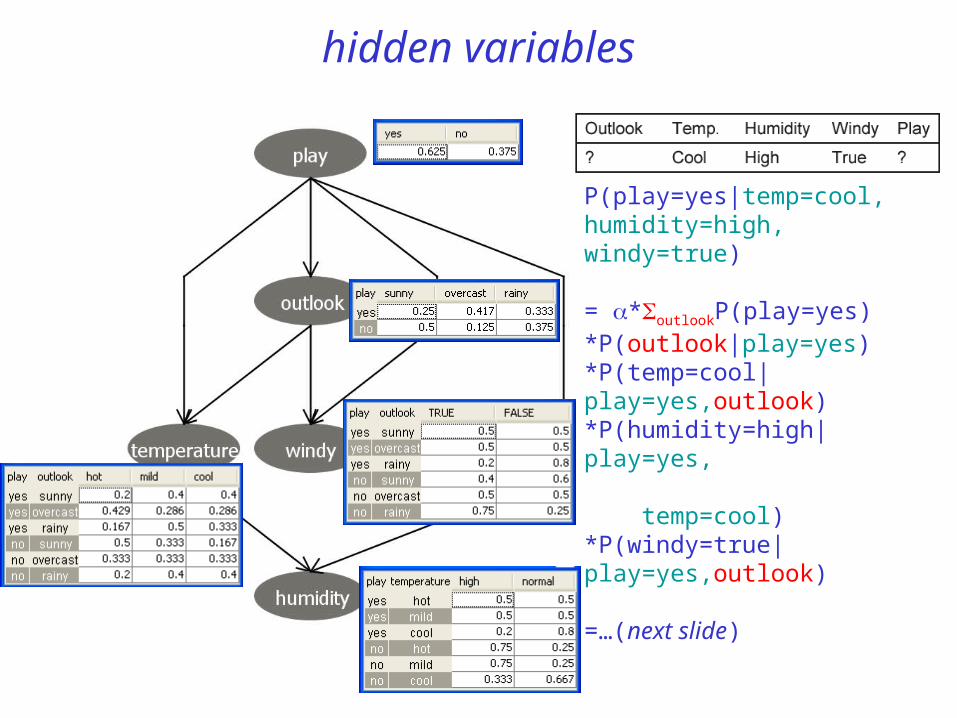
hidden variables
P(play=yes|temp=cool, humidity=high, windy=true)
= *outlookP(play=yes)*P(outlook|play=yes)*P(temp=cool|play=yes,outlook)*P(humidity=high|play=yes, temp=cool)*P(windy=true|play=yes,outlook)
=…(next slide)
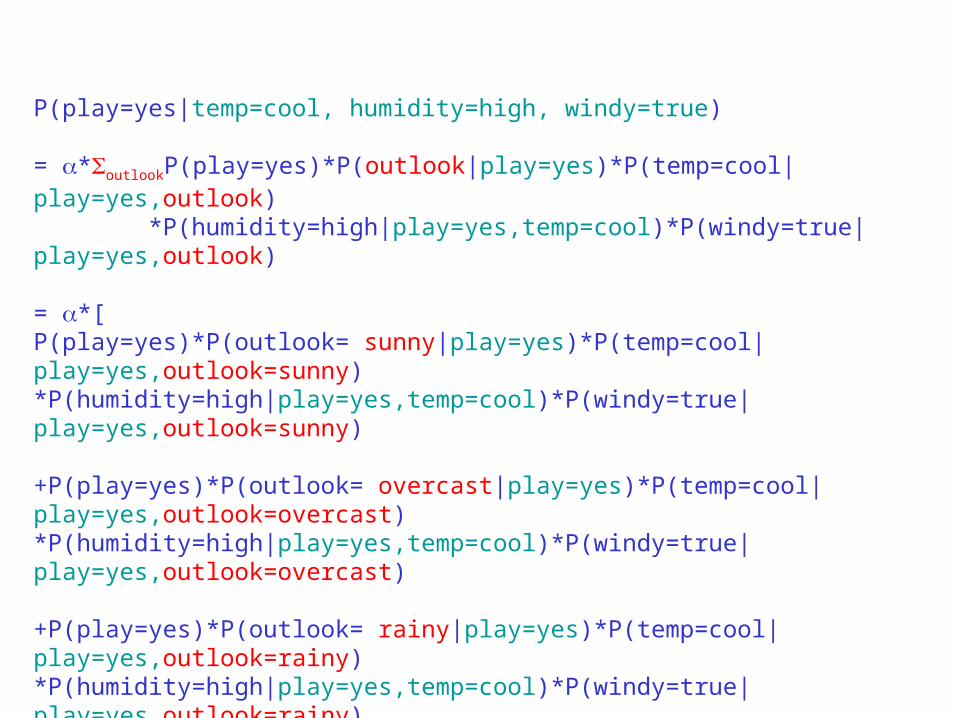
P(play=yes|temp=cool, humidity=high, windy=true)
= *outlookP(play=yes)*P(outlook|play=yes)*P(temp=cool|play=yes,outlook) *P(humidity=high|play=yes,temp=cool)*P(windy=true|play=yes,outlook)
= *[P(play=yes)*P(outlook= sunny|play=yes)*P(temp=cool|play=yes,outlook=sunny)*P(humidity=high|play=yes,temp=cool)*P(windy=true|play=yes,outlook=sunny)
+P(play=yes)*P(outlook= overcast|play=yes)*P(temp=cool|play=yes,outlook=overcast)*P(humidity=high|play=yes,temp=cool)*P(windy=true|play=yes,outlook=overcast)
+P(play=yes)*P(outlook= rainy|play=yes)*P(temp=cool|play=yes,outlook=rainy)*P(humidity=high|play=yes,temp=cool)*P(windy=true|play=yes,outlook=rainy)]
= *[ 0.625*0.25*0.4*0.2*0.5 + 0.625*0.417*0.286*0.2*0.5 + 0.625*0.33*0.333*0.2*0.2 ]=*0.01645
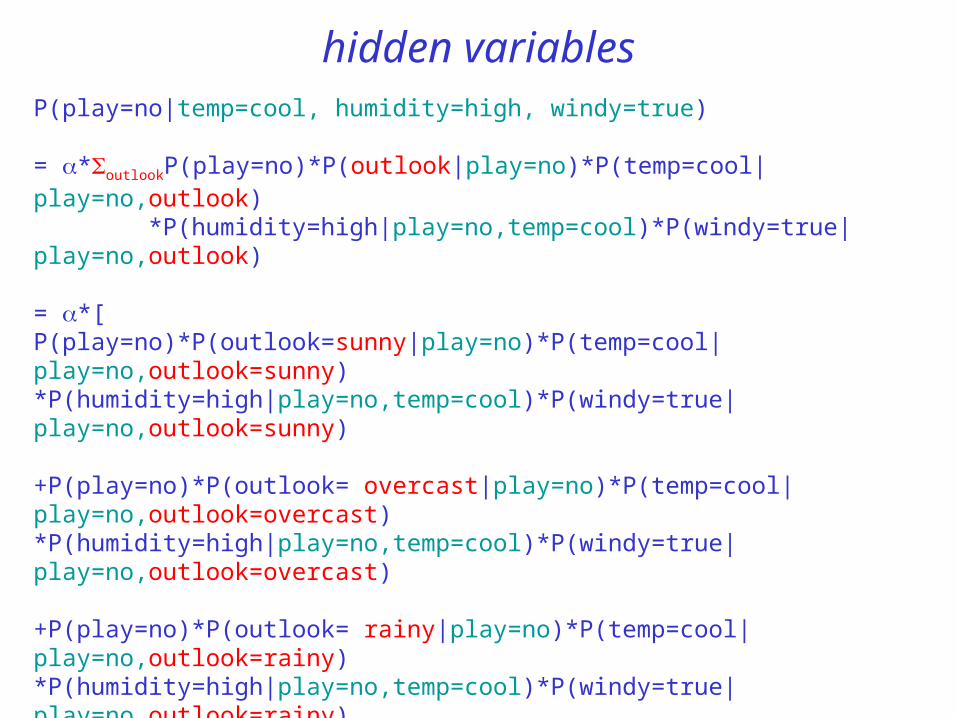
hidden variablesP(play=no|temp=cool, humidity=high, windy=true)
= *outlookP(play=no)*P(outlook|play=no)*P(temp=cool|play=no,outlook) *P(humidity=high|play=no,temp=cool)*P(windy=true|play=no,outlook)
= *[P(play=no)*P(outlook=sunny|play=no)*P(temp=cool|play=no,outlook=sunny)*P(humidity=high|play=no,temp=cool)*P(windy=true|play=no,outlook=sunny)
+P(play=no)*P(outlook= overcast|play=no)*P(temp=cool|play=no,outlook=overcast)*P(humidity=high|play=no,temp=cool)*P(windy=true|play=no,outlook=overcast)
+P(play=no)*P(outlook= rainy|play=no)*P(temp=cool|play=no,outlook=rainy)*P(humidity=high|play=no,temp=cool)*P(windy=true|play=no,outlook=rainy)]
= *[ 0.375*0.5*0.167*0.333*0.4 + 0.375*0.125*0.333*0.333*0.5 + 0.375*0.375*0.4*0.333*0.75 ]=*0.0208
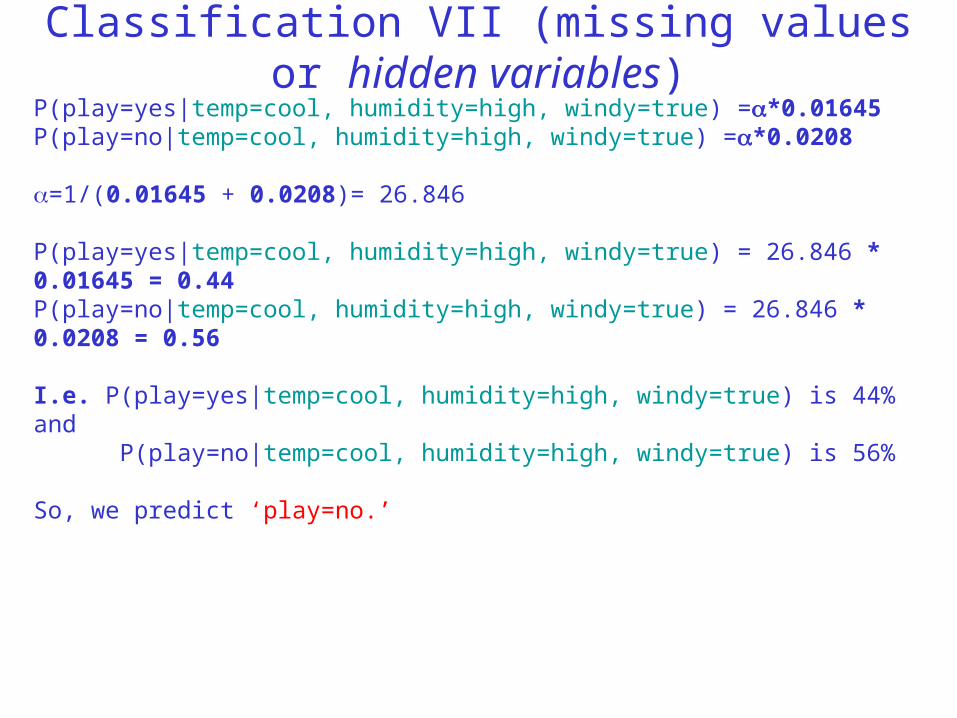
Classification VII (missing values or hidden variables)
P(play=yes|temp=cool, humidity=high, windy=true) =*0.01645P(play=no|temp=cool, humidity=high, windy=true) =*0.0208
=1/(0.01645 + 0.0208)= 26.846
P(play=yes|temp=cool, humidity=high, windy=true) = 26.846 * 0.01645 = 0.44P(play=no|temp=cool, humidity=high, windy=true) = 26.846 * 0.0208 = 0.56
I.e. P(play=yes|temp=cool, humidity=high, windy=true) is 44% and P(play=no|temp=cool, humidity=high, windy=true) is 56%
So, we predict ‘play=no.’
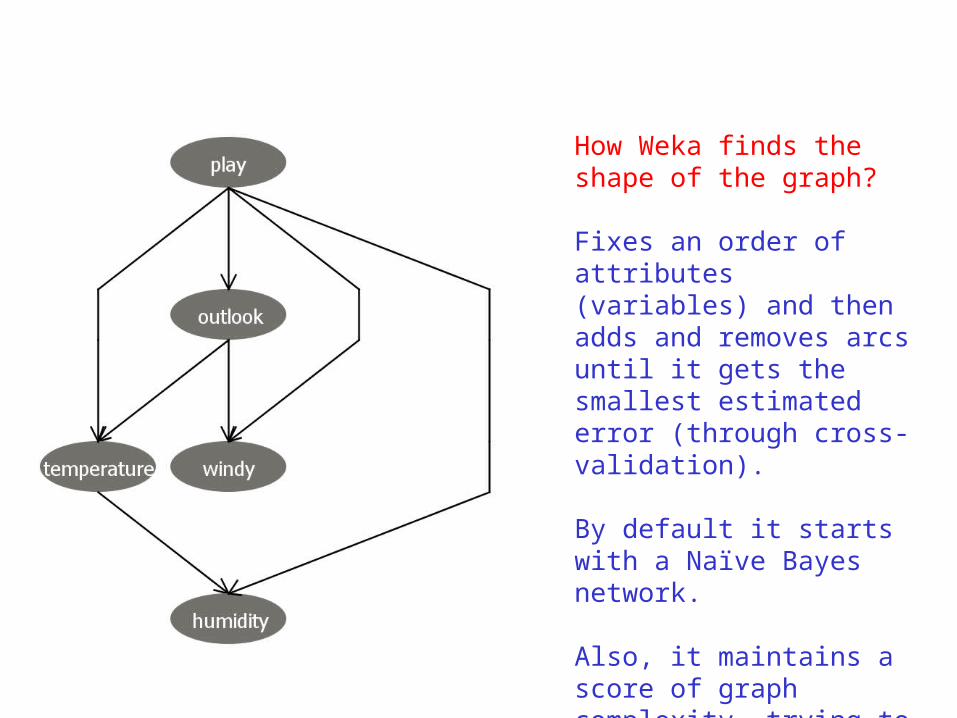
How Weka finds the shape of the graph?
Fixes an order of attributes (variables) and then adds and removes arcs until it gets the smallest estimated error (through cross-validation).
By default it starts with a Naïve Bayes network.
Also, it maintains a score of graph complexity, trying to keep the complexity low.
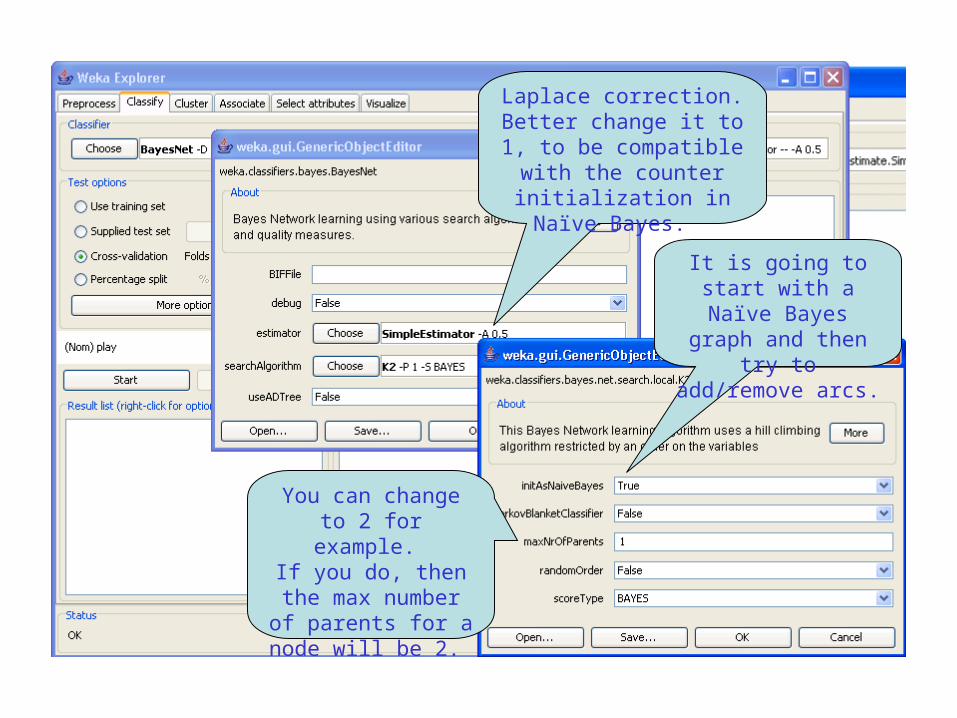
You can change to 2 for example.
If you do, then the max number of
parents for a node will be 2.
It is going to start with a Naïve Bayes graph
and then try to add/remove arcs.
Laplace correction. Better change it to 1, to be compatible with the counter initialization in
Naïve Bayes.


![Open Access proceedings Journal of Physics: … · Web viewIn order to represent knowledge based on Bayes theorem [11] proposed Bayesian networks or Naïve Bayes. A Bayesian network](https://static.documents.pub/doc/80x56/5ec4db229569087959046300/open-access-proceedings-journal-of-physics-web-view-in-order-to-represent-knowledge.jpg)

