36
1 C L E A R S I G N A L S . S O U N D I N V E S T M E N T S . BAYLIN TECHNOLOGIES INC. Q3 2017 Company Presentation A leading global provider of innovative antenna solutions.
| Date post: | 27-May-2018 |
| Category: |
Documents |
| Upload: | duongkhuong |
| View: | 214 times |
| Download: | 0 times |

1
C L E A R S I G N A L S . S O U N D I N V E S T M E N T S .
B A Y L I N T E C H N O L O G I E S I N C .
Q3 2017 C o m p a n y P re s e n t a t i o n A leading global provider of innovative antenna solutions.

2
C L E A R S I G N A L S . S O U N D I N V E S T M E N T S .
2
This presentation contains “forward-looking information”, which may include, but is not limited to, statements with respect to future events or thefuture financial and operating performance of Baylin Technologies Inc. (“Baylin”) and which reflect management’s expectations regarding Baylin’sgrowth, results of operations, performance, business prospects and opportunities and industry performance and trends. They reflect management’scurrent internal projections, expectations or beliefs and are based on certain assumptions and estimates made by management in light of informationcurrently available to management, the experience and perception of historical trends, current conditions, expected future developments includingprojected growth in the antenna and related industries, and other factors management believes to be appropriate and reasonable in the circumstances,but there can be no assurance that such assumptions and estimates will prove to be correct. Often, but not always, forward-looking statements can beidentified by the use of words such as “plans”, “expects”, “approximately”, “budget”, “estimates”, “forecasts”, “intends”, “anticipates”, or “believes” orvariations (including negative variations) of such words and phrases, or state that certain actions, events or results “may”, “could”, “would”, “might” or“will” be taken, occur or be achieved.
Forward-looking information involves statements about the future and is inherently uncertain. Forward-looking information is subject to a variety ofknown and unknown risks, uncertainties and other factors, many of which are beyond Baylin’s control, that could cause actual results to differ fromthose expressed or implied by the forward-looking statements. Such factors include, without limitation, general business, economic and competitiveuncertainties, risks relating to doing business overseas, the actual results of Baylin’s operations, actions of its competitors and those described under"Risk Factors" in Baylin’s Annual Information Form dated March 9, 2017, and any amendments thereto.
Given the risks, uncertainties and assumptions inherent in the forward-looking statements, prospective investors should not place undue reliance onthe forward-looking statements in this presentation. When relying on Baylin’s forward-looking information to make decisions, investors and othersshould carefully consider the foregoing factors and other uncertainties and potential events. Baylin does not assume any obligation to update anyforward-looking statements, whether as a result of new information or future events or otherwise, except to the extent required by applicable law.
FORWARD LOOKING STATEMENTS

3
C L E A R S I G N A L S . S O U N D I N V E S T M E N T S .
3
WHO WE ARE

4
C L E A R S I G N A L S . S O U N D I N V E S T M E N T S .
44
Commenced business in 1978 Completed IPO on TSX Nov. 2013 World leader in antenna design and
manufacture with over 100 engineers and over 100 patents.
1,000+ employees worldwide Baylin has three main business lines:
– Mobile products – Smartphones, laptops, Phablets, etc.
– Networking products – Set-top boxes, gateways, etc.
– Infrastructure – DAS, Small cell, Stadium, BSA, etc.
Customers include most leading carriers such as Verizon, AT&T, Bell, Rogers, Vodafone and Telstra.
End users include Samsung, Motorola, Arris, Greenwave, Nokia, Cisco, CGI, Technicolor and Linksys
Commercial focus is on fastest growing segments of the wireless industry.
Production capacity of 250 million/year across 3 sites: Korea, China and Vietnam
Produced over 1 billion antennas

5
C L E A R S I G N A L S . S O U N D I N V E S T M E N T S .
5
COMPANY HISTORY
Closed an Initial Public Offering for gross proceeds of C$43.50M
First significant contract win in “slide” phone
Commenced relationship with Linksys, collaborating on ~95% of consumer network routers
2006 / 20071978 2010-2012 2013-2014 2015 2016 2017
People
Technology & Operations
Financing & Corporate Dev.
Galtronics Vietnam granted High & New Technology Enterprise Status
Head office moved to Canada
Major OEM contract win
Company undergoes significant restructuring and re-engineering
C$5.75M follow-on offering to fund R&D of Base Station Antenna product developmentMajor OEM contract win
Randy Dewey appointed CEO
Mike Moon appointed President, Asia Pacific
Commenced operations with a concentration on public safety
New location opened in Ottawa and new facility completed in Tempe, Arizona
Approval from Tier One carrier into the carrier‘s nationwide system
Jerry Kirshman appointed COO
Dr. Minya Gavrilovic appointed EVP, Innovation & Product Strategy
Michael Wolfe appointed CFO
Randy Dewey appointed Vice-Chairman
Increased focus on wireless infrastructure sector following strategic review of business
Introduced the MIMO panel antenna, designed for use in high-capacity venues such as stadiums, arenas, speedways or campuses
Major North American Carrier contract win
Four new OEM customers added
Four positive adjusted EBITDA quarters
Completed the spin-off and divestiture of non-core business to focus on core competencies of mobile, broadband and wireless infrastructure
Completed hiring of Canadian staff, including 5 employees with PhDs

6
C L E A R S I G N A L S . S O U N D I N V E S T M E N T S .
6
Big Four global trends driving demand for communications infrastructure and more complex solutions Mobile Broadband Data
Mobile Data Consumer IP Traffic Business IP Traffic
Big DataSocial Media Cloud Service
Robust growth dependent on next-generation communications infrastructure
1,4802,582
4,337
6,981
10,788
15,838
2013 2014 2015 2016 2017 2018
Wireless Broadband
(PB per month, Global, Business and Consumer) (PB per month, Global)
10,26312,100
14,30016,899
20,01623,595
2013 2014 2015 2016 2017 2018
CloudService
(PB per month, Global)
ROBUST LONG-TERMGROWTH PROFILE

7
C L E A R S I G N A L S . S O U N D I N V E S T M E N T S .
7
DIVISIONAL STRUCTURE
Mobile
7
Network
Manufacturing Engineering
Small Cell,
DAS/BSA

8
C L E A R S I G N A L S . S O U N D I N V E S T M E N T S .
8
PRODUCT LINES

9
C L E A R S I G N A L S . S O U N D I N V E S T M E N T S .
9
Mobile
Motorola Brick-first cell antenna ever. In this space since cell phone inception.
12-year relationship with Tier-one antenna designer and supplier for smartphone platform.
In 2005-2009, Baylin was the only antenna designer and supplier, assisting in the development of one of the 1st smartphone platforms.
In 2010-2014, Baylin was one of many suppliers across hundreds of platforms.
In 2014, a large OEM narrowed the competitive landscape by relocating to Vietnam and only chose a few designers. Baylin was one of the few.
Jointly worked on dozens of projects per year, achieving an exceptionally high percentage of projects that reached high volume commercial production.
Reduced dependency on key customer as a result of new contract wins and new product lines.
History of Key Relationships
P r o d u c t l i n e s

10
C L E A R S I G N A L S . S O U N D I N V E S T M E N T S .
10
Total Addressable Antenna Market approximately
US$400 million, growing at 27% per year
Baylin's antennas improve wireless internet connectivity,
video distribution and mobile data capacity
As home networking devices become more
sophisticated, service providers demand more complex
solutions
Added three new hardware OEM's to the customer base
including large Fortune 500 OEM
P R O D U C T L I N E S
NetworkingC L E A R S I G N A L S . S O U N D I N V E S T M E N T S .

11
C L E A R S I G N A L S . S O U N D I N V E S T M E N T S .
11
P R O D U C T L I N E S
DAS and Small Cell
Total Addressable Antenna Market is approximately US$5.5 billion and growing
Baylin's products are integral to some of the most advanced Distributed Antenna Systems (DAS) in the world
Wireless service providers are coming under increasing pressure to improve coverage and bandwidth in a cost-effective manner as demand soars
LTE densification, new spectrum being released and the coming overlay of 5G are three powerful trends that favor this product line
Baylin has installed thousands of DAS and small-cell systems in major venues around the world

12
C L E A R S I G N A L S . S O U N D I N V E S T M E N T S .
12
Baylin has made significant inroads in this attractive and growing market
2015 – 2020E BTS Antenna Market (US$ Billions)
$3.5
$14.0
2015 2020
BASE STATION ANTENNAS
The total addressable Base Station Antenna (“BTS antenna”) market was approximately US$5.5 billion in 2016– Over 400,000 cell towers in North America with approximately
20 antennae per tower– Current antennae are not compatible with upcoming spectrum
upgrades (i.e. 600 & 700 MHz), FirstNet System, and the next generation 5G
In addition to the growth of the overall market, there has been a shift from single band panel antennas to multi-band antennas which provides a large opportunity– Shift is driven by mobile operators demanding better
performance Baylin is leveraging its status as an approved supplier to all major
carriers in North America to capture market share
Source: EJL Wireless Research - Dec 2015, Sep 2016
Mar 2017: Hired two Base Station Antenna veterans and opened Ottawa office to further this business plan
Dec 2016
Dec 2016: Closed a follow-on offering for proceeds of $5.75M to be used for R&D into the Base Station Antenna sector
Mar 2017
Commentary
Aug2017
Aug 2017: Invested a further $400K into R&D of Base Station Antenna product development in Q2
May2017
May 2017: Invested $400K into R&D of Base Station Antenna product development in Q1

13
C L E A R S I G N A L S . S O U N D I N V E S T M E N T S .
13

14
C L E A R S I G N A L S . S O U N D I N V E S T M E N T S .
14
OPERATIONS & ENGINEERING

15
C L E A R S I G N A L S . S O U N D I N V E S T M E N T S .
1515Million Antennas per Year
Facilities located in China, South Korea and Vietnam
Provides Baylin with competitive advantages of optimized design, cost-effective manufacturing and minimizes lead time to market
Facilities are among the most technologically advanced in the world
Ability to transition from design centres to manufacturing
250
MANUFACTURING

16
C L E A R S I G N A L S . S O U N D I N V E S T M E N T S .
R&D centers in Korea, USA and now Ottawa, Canada
State-of-the-Art facility officially opened in Tempe, Arizona in March 2017
Over 100 antenna engineers with nine PhDs in the field
Over 100 patents in our portfolio and intellectual property rights relating to antenna design and manufacturing
Average of 100 new projects every year, with over 40% moved into production
New Product Introduction lines in three countries to support quicker product launch
Custom designed over 2000 different antenna products
16
WORLD CLASS R&D

17
C L E A R S I G N A L S . S O U N D I N V E S T M E N T S .
17
DECADES OF INNOVATION
1st Mobile antenna
1st embedded antenna system in a router
1st In Building MIMO DAS antenna
1st MIMO antenna system in a smart phone
1st Omni Directional In Building SISO antenna under 1” profile
st
17

18
C L E A R S I G N A L S . S O U N D I N V E S T M E N T S .
18
HOW WE COMPETE& WHO WE SERVE

19
C L E A R S I G N A L S . S O U N D I N V E S T M E N T S .
HOW WE WIN CLIENTS
19
Some of our competitors
are really large, in fact too
large to compete on smaller
projects. Baylin is nimble
enough to act as an
extension of a customer’s
R&D department.
We understand
customer needs and
provide high quality
custom solutions from
concept to production.
With 3 R&D Centers all
specializing in mobile,
embedded/wifi and
cellular network
engineering we can
creatively solve
challenging projects.
NIMBLE & READY CONCEPT TO PRODUCTION SPECIALIZED R&D CENTRES

20
C L E A R S I G N A L S . S O U N D I N V E S T M E N T S .
COMPETITION
20
H I G H B A R R I E R S T O E N T R Y !
Carriers, service providers and OEM's have challenging qualification requirements.
RF technology and expertise required to design and develop antennas that meet sophisticated customer specifications.
Highly-specialized, technologically advanced manufacturing and test capabilities.
Only one competitor covers all of Baylin’s operating segments.
21
C L E A R S I G N A L S . S O U N D I N V E S T M E N T S .
21
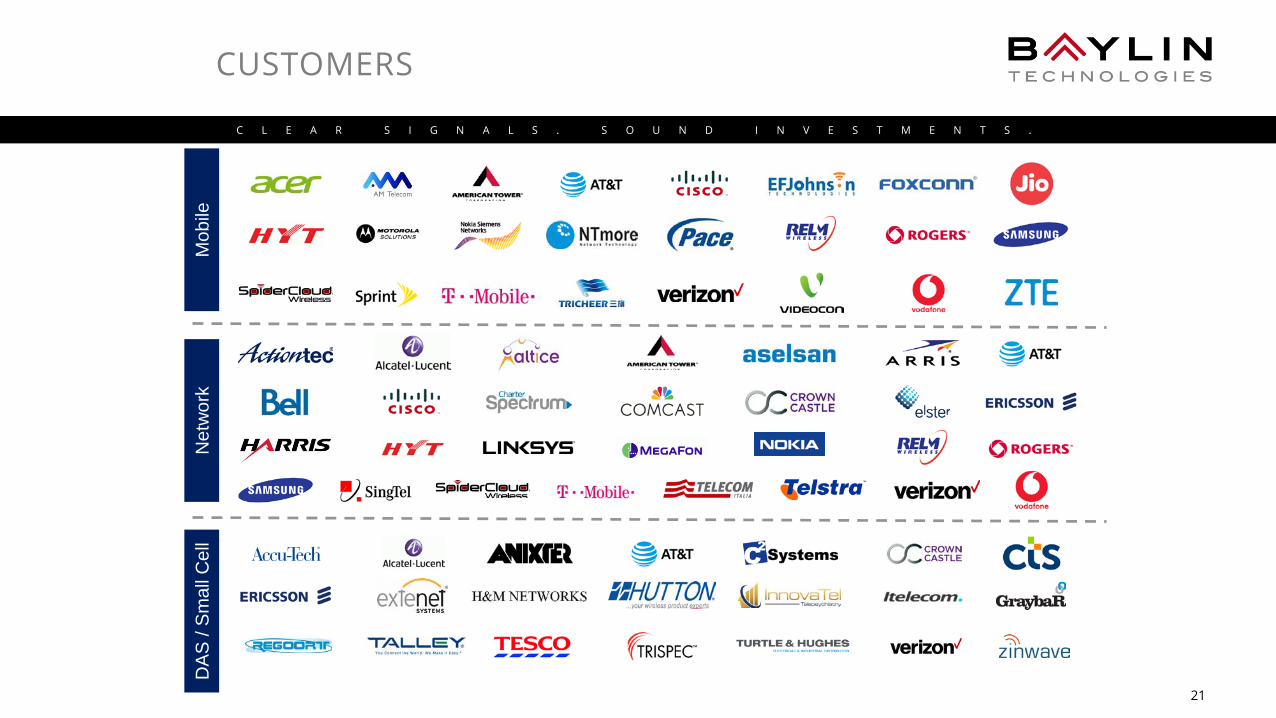
CUSTOMERS
Mob
ileN
etw
ork
DAS
/ Sm
all C
ell

22
C L E A R S I G N A L S . S O U N D I N V E S T M E N T S .
22
STRATEGIC DIRECTION

23
C L E A R S I G N A L S . S O U N D I N V E S T M E N T S .
23
STRATEGIC GROWTH PLAN ACCELERATING
Fixed costs rationalized.
US$7 million removed from annual fixed cost base while investing in US$1 million to accelerate new product development.
Positive adjusted EBITDA in the first three quarters of fiscal 2017 making it a full seven consecutive positive quarters.
Gross profit at the highest level in the past 15 quarters.
All three product lines had double digit growth in revenue in fiscal 2016 with a 4th product line under development that is expected to continue the double digit growth projections.
Preeminent position in R&D established with key engineering hires and new innovation centers in Phoenix and Ottawa.
Pivotal sales team hires are driving aggressive US growth plan. Recent GPA signed with additional carrier.
23
Ongoing active focus on inorganic acquisition opportunities.

24
C L E A R S I G N A L S . S O U N D I N V E S T M E N T S .
December 22, 2016- Baylin completed a prospectus offering of 3,108,450 common shares totaling gross proceeds of $5,750,633.00.- Net proceeds to fund R&D for Baylin’s entry into the Base Station Antenna sector.March 22, 2017- Hired new Chief Operating Officer as well as EVP of Innovation and Product Strategy both with decades of experience in the
Base Station Antenna business.- Announced the opening of Galtronics Ottawa R&D Centre and hired a BSA development team.June 2017
Announced closure of R&D efforts in Israel and relocated all design and engineering activities and assets to new OttawaR&D Centre
July 31, 2017Hired new full time Chief Financial Officer.
Recent Key Strategic Developments

25
C L E A R S I G N A L S . S O U N D I N V E S T M E N T S .
Organic• Focus on innovation in each of three
key segments• Expansion into more sophisticated
product lines• Focus on driving down
manufacturing costs• Leverage prime supplier status with
large customers• Optimize working capital and costs
further driving margins
GROWTH INITIATIVES
25
AcquisitionsPositioned to enhance growth by adding:• technological capabilities.• new geographical markets.• new OEM customers.• Actively seeking to expand our market
reach in Infrastructure products.

26
C L E A R S I G N A L S . S O U N D I N V E S T M E N T S .
GROWTH INITIATIVES
26
AcquisitionsPositioned to enhance growth by adding:• technological capabilities.• new geographical markets.• new OEM customers.
Mr. Randy Dewey is an experienced CEO with operations and management experience in technology, banking, automotive and industrial industries.
Mr. Stockwell Day is a strategic advisor and consultant with 25 years’ experience in provincial and federal governments and considerable board experience.
Mr. Douglas Jones has exceptional North American and European experience in the all facets of the telecommunications industry.
Mr. Barry Reiter is currently a senior partner at Bennett Jones LLP and is an experienced director having served on a multitude of boards with a specific interest in corporate governance.
Mr. Don Simmonds, known as a serial entrepreneur for starting 20 new ventures in the last 30 years, was one of the founding partners of the Lenbrook Group in 1977 that is best known for creating Clearnet, one of Canada’s wireless networks sold to Telus in 2001.
Mr. Harold Wolkin is an accomplished investment banker and financial analyst who, over the course of his career, has been responsible for the origination and successful marketing of a
large number of initial public offerings and
equity financings.
B O A R D O F
D I R E C T O R S
Mr. Jeffrey Royer, a private investor with interests in telecommunications, broadcasting, medical device manufacturing, hospitality and real estate and a General Partner of the Arizona Diamondback MLB team.

27
C L E A R S I G N A L S . S O U N D I N V E S T M E N T S .
27
FINANCIAL PERFORMANCE

28
C L E A R S I G N A L S . S O U N D I N V E S T M E N T S .
28
CAPITAL MARKETS AND FINANCIAL SNAPSHOT
BYL-TO November 2, 2017
Price C$2.14
Market Capitalization
C$47.0m
Issued Shares : Basic 21.9m
Fully Diluted 22.8m
Insider Ownership ~61%
Net Cash (Sept. 2017) C$8.7m
Book Value (June 2017) $1.69/share
B Y L .T O B a y l i n Te c h n o l o g i e s I n c . T S E
Baylin Technologies Inc.Exchange: TSX Exchange | November 2, 4:30 p.m.EDT

29
C L E A R S I G N A L S . S O U N D I N V E S T M E N T S .
2929
IMPROVING RESULTS ALL FIGURES IN CANADIAN DOLLARS
REVENUE ADJUSTED EBITDA

30
C L E A R S I G N A L S . S O U N D I N V E S T M E N T S .
3030
IMPROVING RESULTS ALL FIGURES IN CANADIAN DOLLARS
G R O S S P R O F I T/ M A R G I N T R A I L I N G T W E LV E M O N T H S

31
C L E A R S I G N A L S . S O U N D I N V E S T M E N T S .
31
3.7x
2.4x 2.3x
0.9x 0.7x
4.5x4.1x
3.0x2.7x
2.4x
0.3x
Amphenol TE Connectivity CommScope Laird Partron Co. Skyworks Semtech Qorvo u-blox Airgain Baylin
PEER BENCHMARKING - VALUATION METRICS
Baylin is significantly undervalued compared to its peers despite strong growth prospects and increasing profitability
EV / CY17E Revenue
EV / CY17E EBITDA
Antenna RF & Component Supplier
Median: 2.3x Median: 3.0x
Source: Capital IQ, Bloomberg consensus estimates as at January 27, 2017, and BYL estimates are the consensus from the Analysts at Raymond James and Paradigm Capital.
15.7x
11.0x9.3x
6.7x 5.8x
22.4x
14.5x12.8x
10.3x9.2x
6.5x
Amphenol TE Connectivity CommScope Laird Partron Co. Airgain Semtech u-blox Skyworks Qorvo Baylin
Antenna RF & Component Supplier
Median: 9.3x Median: 12.8x
32
C L E A R S I G N A L S . S O U N D I N V E S T M E N T S .
32
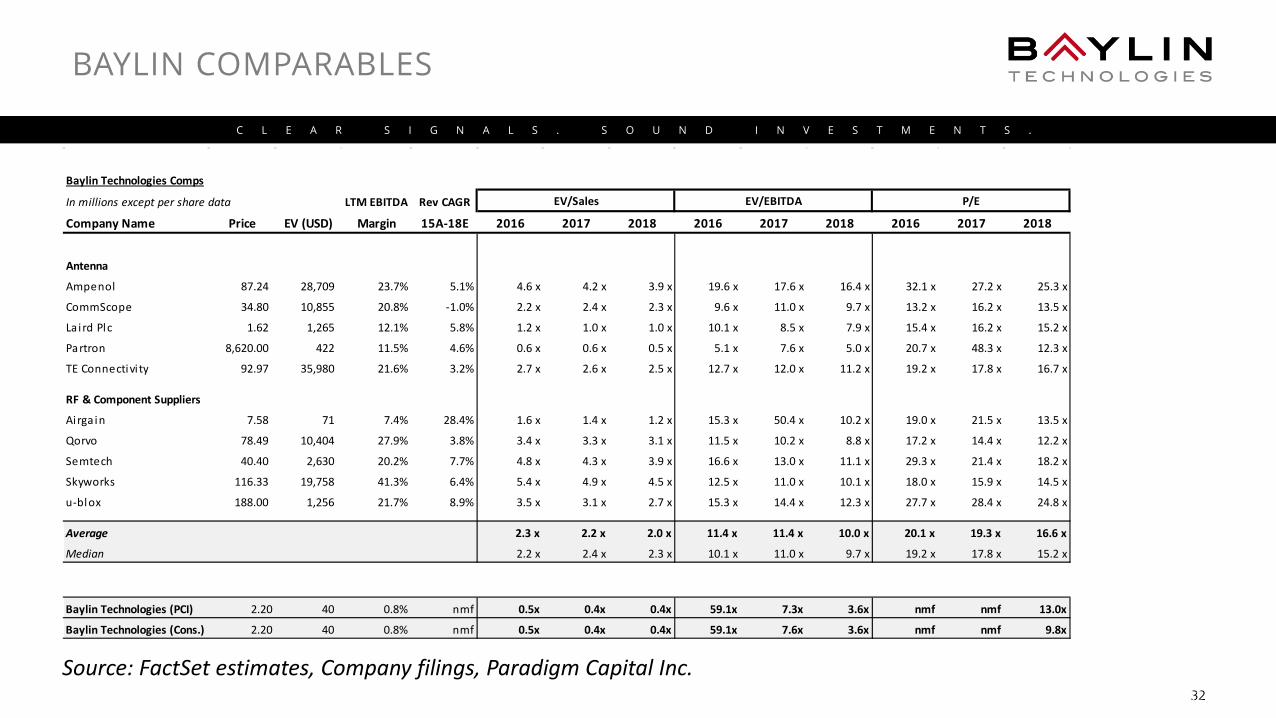
BAYLIN COMPARABLES
32
Baylin Technologies Comps
In millions except per share data LTM EBITDA Rev CAGR
Company Name Price EV (USD) Margin 15A-18E 2016 2017 2018 2016 2017 2018 2016 2017 2018
Antenna
Ampenol 87.24 28,709 23.7% 5.1% 4.6 x 4.2 x 3.9 x 19.6 x 17.6 x 16.4 x 32.1 x 27.2 x 25.3 x
CommScope 34.80 10,855 20.8% -1.0% 2.2 x 2.4 x 2.3 x 9.6 x 11.0 x 9.7 x 13.2 x 16.2 x 13.5 x
La i rd Plc 1.62 1,265 12.1% 5.8% 1.2 x 1.0 x 1.0 x 10.1 x 8.5 x 7.9 x 15.4 x 16.2 x 15.2 x
Partron 8,620.00 422 11.5% 4.6% 0.6 x 0.6 x 0.5 x 5.1 x 7.6 x 5.0 x 20.7 x 48.3 x 12.3 x
TE Connectivi ty 92.97 35,980 21.6% 3.2% 2.7 x 2.6 x 2.5 x 12.7 x 12.0 x 11.2 x 19.2 x 17.8 x 16.7 x
RF & Component Suppliers
Airga in 7.58 71 7.4% 28.4% 1.6 x 1.4 x 1.2 x 15.3 x 50.4 x 10.2 x 19.0 x 21.5 x 13.5 x
Qorvo 78.49 10,404 27.9% 3.8% 3.4 x 3.3 x 3.1 x 11.5 x 10.2 x 8.8 x 17.2 x 14.4 x 12.2 x
Semtech 40.40 2,630 20.2% 7.7% 4.8 x 4.3 x 3.9 x 16.6 x 13.0 x 11.1 x 29.3 x 21.4 x 18.2 x
Skyworks 116.33 19,758 41.3% 6.4% 5.4 x 4.9 x 4.5 x 12.5 x 11.0 x 10.1 x 18.0 x 15.9 x 14.5 x
u-blox 188.00 1,256 21.7% 8.9% 3.5 x 3.1 x 2.7 x 15.3 x 14.4 x 12.3 x 27.7 x 28.4 x 24.8 x
Average 2.3 x 2.2 x 2.0 x 11.4 x 11.4 x 10.0 x 20.1 x 19.3 x 16.6 x
Median 2.2 x 2.4 x 2.3 x 10.1 x 11.0 x 9.7 x 19.2 x 17.8 x 15.2 x
Baylin Technologies (PCI) 2.20 40 0.8% nmf 0.5x 0.4x 0.4x 59.1x 7.3x 3.6x nmf nmf 13.0x
Baylin Technologies (Cons.) 2.20 40 0.8% nmf 0.5x 0.4x 0.4x 59.1x 7.6x 3.6x nmf nmf 9.8x
P/EEV/Sales EV/EBITDA
Source: FactSet estimates, Company filings, Paradigm Capital Inc.

33
C L E A R S I G N A L S . S O U N D I N V E S T M E N T S .
SUMMARY
33T H E T I M E F O R B A Y L I N I S N O W .
Customer base diversified and growing steadily
Stronger North American footprint New product lines positioned to
capture exponential growth in the data delivery system
Poised for growth through acquisition
Recent leadership expansion with key professionals from Industry
Growth in revenues and profits yet to be recognized by the market
Company materially undervalued relative to peers

34
C L E A R S I G N A L S . S O U N D I N V E S T M E N T S .
34
OPERATIONS

35
C L E A R S I G N A L S . S O U N D I N V E S T M E N T S .
35
FINANCIAL PERFORMANCE (P&L SUMMARY)
All Figures in Canadian Dollars M 2014 2015 2016 2017
Q1 Q2 Q3 Q4 Q1 Q2 Q3 Q4 Q1 Q2 Q3 Q4 Q1 Q2 Q3
Sales 12.4 11.7 14.6 10.7 9.9 12.3 15.8 17.3 20.9 20.8 22.5 20.0 19.8 20.3 27.1
Gross Profit 2.8 2.2 3.5 1.4 1.3 2.7 3.6 4.2 5.6 5.8 6.3 5.8 5.9 6.8 8.4
Gross profit % 22% 19% 24% 13% 13% 22% 23% 24% 27% 28% 28% 29% 30% 33% 31%
R&D 2.0 1.9 2.2 2.5 2.0 1.9 2.1 2.3 2.5 2.4 2.8 2.6 2.9 3.2 2.4
Sales & Marketing 1.2 1.0 1.1 1.1 1.5 1.3 1.3 1.9 1.2 .9 1.0 1.1 1.2 1.4 1.4
G&A 2.3 2.8 2.5 2.6 3.2 2.8 3.1 3.7 2.9 2.9 3.1 3.8 3.0 4.4 3.1
EBITDA (1.9) (2.9) (1.5) (3.6) (4.4) (2.1) (2.0) (2.6) .2 .7 .5 (.7) (.2) (1.1) 2.7
Adjusted EBTIDA (1.9) (2.8) (1.5) (3.4) (3.6) (1.6) (1.6) (2.0) .4 .7 .7 .1 .2 .4 3.1

36
C L E A R S I G N A L S . S O U N D I N V E S T M E N T S .
36
FINANCIAL PERFORMANCE (BALANCE SHEET SUMMARY)
All Figures in Canadian Dollars M2015 2016 2017
Q1 Q2 Q3 Q4 Q1 Q2 Q3 Q4 Q1 Q2 Q3
Cash 22.4 20.4 16.4 15.8 8.7 10.5 12.4 18.5 15.6 15.0 13.2
Working Capital (Ex Cash) 7.3 6.4 8.5 6.8 8.7 9.2 7.6 5.9 9.0 8.5 10.7
Total Assets 74.2 69.9 69.7 68.6 62.2 61.5 64.0 65.0 61.8 61.9 64.2
Current Liabilities 22.2 22.4 23.4 25.5 21.8 22.0 24.5 22.1 20.3 22.9 25.6
Total Liabilities 24.0 23.6 24.6 26.9 23.6 23.7 25.9 23.6 22.0 24.5 27.2
Total Shareholders Equity 50.2 46.4 45.0 41.8 38.6 37.7 38.0 41.4 39.9 37.5 37.0


![Cause-Related Marketing: Ethical Practice or Exploitive ... · Cause-Related Marketing: Ethical Practice or Exploitive Procedure? GREGORY BAYLIN, PEGGY CUNNINGHAM and PAMELA CUSHING]](https://static.documents.pub/doc/80x56/5ead75503a7d1b6d89365800/cause-related-marketing-ethical-practice-or-exploitive-cause-related-marketing.jpg)


