54
Bayt.com Middle East CONSUMER CONFIDENCE INDEX March 2017

Bayt.com Middle EastCONSUMER CONFIDENCE INDEX
March 2017

PROJECT BACKGROUNDSection 1

Objectives
§ To understand perceptions and attitudes of consumers in the Middle East regarding the economy of
their countries, their personal financial and job situation, their likelihood to purchase and invest,
and the job market in general.

Project Background
§ Consumer confidence is a measure of the economic wellbeing of a country.
§ It is a reflection of consumer satisfaction levels and expectations based on various factors in the
economy, i.e. inflation, stock market performance, job opportunities, salary structures,
unemployment, investment avenues and returns, business growth, state economic policies,
infrastructure, cost of living, interest rates, exchange rates, etc.
§ Such consumer satisfaction levels and expectations will have an effect on economic variables.
§ For example, if consumers are positive about the economy and have disposable income levels
that are perceived as sufficient, they tend to spend more on consumer goods. This, in turn, will
drive business dependent on consumer spending and create further economic growth.
§ On the other hand, a pessimistic view of the economy would cause consumers to rein in their
spending, creating a spending recession which could effectively cause business losses and
economic downturn.

Project Background
§ Similarly, if employable adults are optimistic about job prospects, opportunities and job security;
have healthy salary expectations; and are hopeful about their career growth and development, it
will be reflected in their attitudes towards work and the economy as a whole, as well as their
spending behaviors.
§ Therefore, the following trends in consumer and employee expectations could help forecast
economic variables.
§ This information is useful for professionals, manufacturers/business people, recruitment
consultants/agencies, economists, and the general public.

RESEARCH METHODOLOGYSection 2

Sample Definition
Age and Gender:
Adult males and females
Aged 18+ years
Nationalities:
GCC Arabs, North Africans, Levant, Western Expats and Asians
Country of Residence
GCC: UAE, KSA, Kuwait, Oman, Qatar, Bahrain
Levant: Lebanon, Syria*, Jordan
North Africa: Egypt, Morocco, Algeria, Tunisia
*Small sample size- Syria is part of the total sample but not presented separately in the report
Data Collection
All data was collected online. Fieldwork was conducted between 10th January – 31st January, 2017. The total number of respondents achieved was 2750

RESEARCH FINDINGSSection 3

Average of Past Indices: April 2007 – October 2012
UAE Saudi Arabia Kuwait Qatar Lebanon Egypt Algeria
Consumer Expectancy Index (CEI) 88.5 89.4 90.7 91.9 103.7 98.2 92.0
Propensity to Consume (PCI) 86.7 83.0 81.4 81.6 109.3 81.0 81.2
Consumer Confidence Index (CCI) 85.0 85.8 86.9 86.9 107.1 89.3 89.6
Employee Confidence Index (ECI) 80.3 84.3 84.5 84.8 99.5 89.1 89.1

Base Period Values – March 2013
Total Saudi Arabia UAE Kuwait Qatar Bahrain Oman Lebanon Syria Jordan Egypt Morocco Algeria Tunisia
Base: 16379 2730 1976 457 509 120 220 506 252 1700 5484 1002 992 431
Current Economic Scenario 81.14 112.91 114.07 102.52 117.49 92.08 115.45 54.15 24.01 51.21 56.35 83.73 111.14 66.36
Expected Economic Scenario 89.19 103.71 112.90 104.74 116.11 101.11 111.36 67.33 43.39 66.41 77.27 93.31 98.49 88.55
Employee Outlook 115.50 131.06 128.61 122.90 140.93 122.96 140.61 101.43 69.21 97.40 102.88 113.26 123.41 111.53
Overall Consumer Confidence 285.83 347.69 355.58 330.16 374.52 316.15 367.43 222.90 136.60 215.02 236.50 290.31 333.04 266.44

Period Values – September 2013
Total Saudi Arabia UAE Kuwait Qatar Bahrain Oman Lebanon Syria Jordan Egypt Morocco Algeria Tunisia
Base: 6585 1097 717 151 183 78 141 210 145 669 1871 426 645 252
Current Economic Scenario 88.47 110.16 110.74 103.64 122.40 110.90 123.05 57.86 31.72 54.04 73.81 92.37 111.78 62.70
Expected Economic Scenario 141.50 149.92 157.51 153.20 159.38 138.46 156.97 116.67 97.24 120.78 141.71 142.41 142.79 126.46
Employee Outlook 117.90 126.96 128.49 127.50 142.29 116.80 144.55 96.10 65.12 97.50 113.03 119.04 123.03 113.07
Overall Consumer Confidence 347.87 387.04 396.74 384.34 424.08 366.16 424.57 270.63 194.08 272.31 328.54 353.82 377.60 302.22

Period Values – February 2014
Total Saudi Arabia UAE Kuwait Qatar Bahrain Oman Lebanon Syria Jordan Egypt Morocco Algeria Tunisia
Base: 6585 1097 717 151 183 78 141 210 145 669 1871 426 645 252
Current Economic Scenario 83.72 104.49 116.52 94.86 115.22 97.22 131.36 44.55 51.61 43.31 68.88 78.88 94.89 83.99
Expected Economic Scenario 137.21 147.12 158.60 147.03 153.62 135.19 161.52 112.32 103.94 114.55 133.39 134.22 135.31 140.38
Employee Outlook 113.02 124.65 138.54 129.00 139.35 107.50 139.29 89.27 63.02 89.22 99.96 107.49 117.09 118.17
Overall Consumer Confidence 333.95 376.27 413.66 370.89 408.19 339.91 432.16 246.14 218.58 247.09 302.23 320.59 347.29 342.54

Period Values – August 2014
Total Saudi Arabia UAE Kuwait Qatar Bahrain Oman Lebanon Syria Jordan Egypt Morocco Algeria Tunisia
Base: 5075 1090 847 187 230 69 65 158 63 377 1013 330 505 141
Current Economic Scenario 95.06 109.86 113.16 102.14 121.30 105.07 119.23 59.18 52.38 62.47 78.04 87.27 103.27 61.35
Expected Economic Scenario 142.26 147.92 152.89 147.06 156.23 135.27 153.33 111.18 113.76 124.31 140.80 135.45 140.92 130.50
Employee Outlook 120.16 129.41 133.87 120.61 140.94 119.64 131.73 101.33 75.60 100.96 104.57 106.40 119.34 103.17
Overall Consumer Confidence 357.49 387.19 399.93 369.81 418.47 359.98 404.29 271.69 241.73 287.74 323.40 329.12 363.53 295.01

Period Values – January 2015
Total Saudi Arabia UAE Kuwait Qatar Bahrain Oman Lebanon Syria Jordan Egypt Morocco Algeria Tunisia
Base: 4263 819 495 135 131 94 107 189 54 234 1061 298 501 145
Current Economic Scenario 88.63 103.11 109.80 86.67 114.50 97.34 108.41 61.38 25.93 64.96 84.21 98.15 71.26 62.76
Expected Economic Scenario 136.12 141.27 152.39 139.01 148.85 134.75 138.32 111.82 97.53 122.22 137.04 138.14 125.22 131.95
Employee Outlook 113.94 123.14 131.78 106.63 134.54 119.02 124.43 98.43 66.89 101.46 101.93 112.75 108.63 110.00
Overall Consumer Confidence 338.70 367.53 393.97 332.31 397.89 351.11 371.15 271.62 190.35 288.63 323.18 349.05 305.11 304.71

Period Values – July 2015
Total Saudi Arabia UAE Kuwait Qatar Bahrain Oman Lebanon Syria Jordan Egypt Morocco Algeria Tunisia
Base: 8882 1748 1011 264 255 114 144 231 63 703 2118 733 1135 363
Current Economic Scenario 93.01 111.04 114.94 102.84 114.71 99.12 118.75 46.75 34.13 69.35 90.30 91.68 80.22 54.68
Expected Economic Scenario 140.73 147.10 156.81 150.13 156.73 142.11 150.69 109.38 104.23 126.03 144.13 139.15 127.37 122.68
Employee Outlook 114.90 127.13 136.19 122.94 136.83 109.29 136.69 81.08 71.32 86.91 104.39 111.62 105.70 93.04
Overall Consumer Confidence 348.65 385.27 407.94 375.90 408.27 350.52 406.13 237.21 209.68 282.29 338.82 342.45 313.29 270.40

Last Period Values – January 2016
Total Saudi Arabia UAE Kuwait Qatar Bahrain Oman Lebanon Syria Jordan Egypt Morocco Algeria Tunisia
Base: 3,905 660 629 264 161 164 168 175 24 176 585 302 486 111
Current Economic Scenario 76.12 83.33 95.79 79.92 90.06 61.59 81.55 50.86 52.08 55.11 76.41 81.79 56.89 51.35
Expected Economic Scenario 130.03 139.39 137.78 129.92 137.68 120.73 131.55 108.38 100.00 119.32 131.28 136.42 116.39 124.32
Employee Outlook 100.52 107.08 115.23 95.98 111.90 93.75 101.95 84.65 63.19 78.65 95.44 98.67 87.45 96.31
Overall Consumer Confidence 306.67 329.81 348.80 305.83 339.64 276.07 315.04 243.88 215.28 253.08 303.13 316.88 260.73 271.98

Last Period Values – August 2016
Total Saudi Arabia UAE Kuwait Qatar Bahrain Oman Lebanon Syria Jordan Egypt Morocco Algeria Tunisia
Base: 2,893 490 279 119 183 40 108 95 23 165 587 245 419 140
Current Economic Scenario 72.05 81.33 100.90 82.35 100.00 80.00 87.04 69.47 34.78 58.18 47.70 87.55 62.89 49.64
Expected Economic Scenario 128.85 134.97 145.04 132.77 139.71 139.17 136.11 113.33 97.10 121.82 117.55 140.82 123.15 116.67
Employee Outlook 96.87 94.59 125.28 102.13 106.65 109.78 111.23 82.50 69.53 85.16 83.23 104.66 90.43 91.07
Overall Consumer Confidence 297.77 310.88 371.22 317.25 346.36 328.95 334.38 265.31 201.42 265.16 248.48 333.03 276.47 257.38

Current Period Values – January 2017
Total Saudi Arabia UAE Kuwait Qatar Bahrain Oman Lebanon Jordan Egypt Morocco Algeria Tunisia
Base: 2,750 611 280 104 147 54 64 64 146 573 226 391 71
Current Economic Scenario 74.96 79.46 106.25 104.33 116.33 108.33 90.63 72.66 51.03 42.93 87.61 67.26 64.79
Expected Economic Scenario 129.43 130.99 148.81 143.91 147.85 146.30 125.52 139.06 120.32 115.42 131.56 122.34 133.80
Employee Outlook 101.54 91.03 125.97 122.67 121.19 125.87 118.75 111.49 88.02 84.57 109.80 102.89 96.63
Overall Consumer Confidence 305.93 301.47 381.03 370.91 385.36 380.50 334.90 323.21 259.36 242.91 328.98 292.49 295.23

Overall Indices
Total Saudi Arabia UAE Kuwait Qatar Bahrain Oman Lebanon Jordan Egypt Morocco Algeria Tunisia
Current Economic Scenario (CES) 92.39 70.37 93.15 101.77 99.01 117.65 78.49 134.18 99.65 76.19 104.63 60.52 97.64
Expected Economic Scenario (EES) 145.12 126.30 131.80 137.40 127.33 144.69 112.71 206.55 181.17 149.36 140.99 124.21 151.10
Employee Outlook (ECI) 87.91 69.45 97.95 99.82 85.99 102.37 84.46 109.92 90.37 82.20 96.95 83.37 86.64
Overall Consumer Confidence (CCI) 107.03 86.71 107.16 112.34 102.89 120.35 91.15 145.00 120.62 102.71 113.32 87.82 110.80

PERSONAL ECONOMICSITUATION
Section 3a

Summary
• Overall, only 17% of respondents believe that their financial condition is better now than it was 6 months ago. A significantly higher proportion of GCC residents (23%) believe that their financial condition is better now as compared to respondents in Levant and North Africa (10% and 13%, respectively). This is mainly due to Kuwait (35%), Qatar (34%) and Bahrain (31%). 60% of Egyptian residents state that their financial condition is worse now as compared to 6 months ago, the highest amongst any country in the MENA region.
• Overall, close to two-fifths (38%) expect their financial condition to improve in the next 6 months. This belief is significantly higher in the GCC (47%) as compared to other MENA regions (Levant: 33%, North Africa: 30%). The GCC countries where this view is higher include Qatar (63%), the UAE and Kuwait (both at 56%). Residents of Egypt seem more pessimistic about their future financial position, with 36% expecting it to get worse. This is followed by Jordan (25%).
• Majority of respondents (72%) expect the cost of living to increase in the next 6 months. This is higher in the Levant (81%) and in North Africa (76%) as compared to the GCC (66%). This sentiment is especially high in Jordan (88%), Tunisia (83%), Egypt (81%) and Algeria (79%).

Summary
• More than half (55%) believe that their savings have decreased in comparison to last year, while only 15% believe the opposite. A lower proportion of CGG residents (48%) claim that, as compared to Levant and North Africa residents (62% and 61% respectively). A higher percentage of residents in Egypt (70%) and Jordan (62%) believe that their savings have decreased.
• Almost a third of respondents (31%) plan to buy at least one vehicle for personal use in the next 12 months. Amongst those planning to get a vehicle in the next 12 months, around half (48%) intend to get a new one, while 41% intend on purchasing a used one. GCC residents show a preference towards new cars, Levant residents towards used ones, while North Africa residents to both.
• Approximately a quarter of respondents (23%) plan to invest in property in the next 12 months. Respondents from GCC seem more likely to invest in property (28%) as compared to respondents from the Levant (15%) and from North Africa (20%). Qatar residents present the highest intention.

Personal Finance – Evaluation of Current ScenarioQ. Compared to 6 months ago, my or my family’s current financial position is:
Base: Total (2750), KSA (611), UAE (280), Kuwait (104), Qatar (147), Bahrain (54), Oman (64), Lebanon (64), Jordan (146), Egypt (573), Morocco (226), Algeria (391), Tunisia (71)
• Overall, only 17% believe that their financial condition is better now than it was 6 months ago.• A significantly higher proportion of GCC residents (23%) believe that their financial condition is better now as compared to
respondents in Levant and North Africa (10% and 13%, respectively).• This is mainly due to Kuwait (35%), Qatar (34%) and Bahrain (31%).• 60% of Egyptian residents state that their financial condition is worse now as compared to 6 months ago, the highest amongst any
country in the MENA region.

Personal Finance – Expectations for the Future
Q. In comparison to the current period, in the next 6 months I expect my or my family’s financial position to:
• Overall, close to two-fifths (38%) expect their financial condition to improve in the next 6 months.• This belief is significantly higher in the GCC (47%) as compared to other MENA regions (Levant: 33%, North Africa: 30%). The GCC
countries where this view is higher include Qatar (63%), the UAE and Kuwait (both at 56%). • Residents of Egypt seem more pessimistic about their future financial position, with 36% expecting it to get worse. This is followed
by Jordan (25%).
Base: Total (2750), KSA (611), UAE (280), Kuwait (104), Qatar (147), Bahrain (54), Oman (64), Lebanon (64), Jordan (146), Egypt (573), Morocco (226), Algeria (391), Tunisia (71)

Cost of LivingQ. In the next 6 months, I expect …
Total Saudi Arabia UAE Kuwait Qatar Bahrain Oman Lebanon Jordan Egypt Morocco Algeria Tunisia
Base: 2750 611 280 104 147 54 64 64 146 573 226 391 71
Cost of living to increase 72% 73% 61% 62% 56% 74% 45% 67% 88% 81% 58% 79% 83%
Cost of living to remain the same 14% 14% 20% 21% 27% 2% 30% 23% 6% 7% 21% 8% 11%
Cost of living to decrease 6% 7% 10% 5% 9% 4% 11% 3% 2% 6% 8% 6% -
Don’t know / can’t say 8% 7% 8% 13% 7% 20% 14% 6% 4% 6% 13% 7% 6%
• Majority of respondents (72%) expect the cost of living to increase in the next 6 months.• This is higher in the Levant (81%) and in North Africa (76%) as compared to the GCC (66%). • This sentiment is especially high in Jordan (88%), Tunisia (83%), Egypt (81%) and Algeria (79%).

Change in SavingsQ. In comparison to last year, my savings have:
Total Saudi Arabia UAE Kuwait Qatar Bahrain Oman Lebanon Jordan Egypt Morocco Algeria Tunisia
Base: 2750 611 280 104 147 54 64 64 146 573 226 391 71
Increased 15% 16% 20% 13% 22% 26% 20% 19% 8% 12% 12% 13% 11%
Remained the same 24% 23% 30% 34% 30% 24% 27% 22% 25% 16% 26% 27% 30%
Decreased 55% 53% 46% 40% 40% 46% 47% 58% 62% 70% 52% 54% 54%
Don’t know / Can’t say 6% 7% 5% 13% 8% 4% 6% 2% 5% 3% 9% 7% 6%
• More than half (55%) believe that their savings have decreased in comparison to last year, while only 15% believe the opposite. • A lower proportion of CGG residents (48%) claim that, as compared to Levant and North Africa residents (62% and 61% respectively). • A higher percentage of residents in Egypt (70%) and Jordan (62%) believe that their savings have decreased.

Investment in VehicleQ. Do you plan to buy at least one vehicle for personal use in the next 12 months? Q. Which of the following types of vehicle would it be?
Total Saudi Arabia UAE Kuwait Qatar Bahrain Oman Lebanon Jordan Egypt Morocco Algeria Tunisia
Base: 2750 611 280 104 147 54 64 64 146 573 226 391 71
Yes 31% 28% 40% 33% 44% 57% 44% 28% 32% 22% 30% 34% 17%
No 53% 55% 44% 51% 44% 26% 42% 56% 53% 62% 50% 50% 72%
Don’t know/Can’t Say 16% 16% 16% 16% 12% 17% 14% 16% 16% 16% 20% 16% 11%
Type of Vehicle
Base(Plan to buy): 849 174 112 34 65 31 28 18 46 127 68 132 12
New 48% 55% 56% 53% 60% 55% 36% 17% 35% 41% 43% 44% 33%
Used 41% 32% 38% 41% 37% 35% 50% 67% 50% 47% 46% 45% 42%
Combination of new and used - - - - - - - - - - - - -
Don't know/Can't say 11% 13% 6% 6% 3% 10% 14% 17% 15% 12% 12% 11% 25%
• Almost a third of respondents (31%) plan to buy at least one vehicle for personal use in the next 12 months. • Amongst those planning to get a vehicle in the next 12 months, around half (48%) intend to get a new one, while 41% intend on
purchasing a used one. • GCC residents show a preference towards new cars, Levant residents towards used ones, while North Africa residents to both.
(*)Small base

Investment in Property
All figures are %’s
Q. Do you plan to invest in property within the next 12 months?
Total Saudi Arabia UAE Kuwait Qatar Bahrain Oman Lebanon Jordan Egypt Morocco Algeria Tunisia
Base: 2750 611 280 104 147 54 64 64 146 573 226 391 71
Yes 23% 23% 29% 35% 40% 31% 28% 11% 17% 17% 23% 23% 11%
No 59% 62% 51% 43% 44% 50% 50% 69% 60% 65% 56% 58% 77%
Don’t know/Can’t Say 18% 15% 20% 22% 16% 19% 22% 20% 23% 17% 20% 19% 11%
• Approximately a quarter of respondents (23%) plan to invest in property in the next 12 months. • Respondents from GCC seem more likely to invest in property (28%) as compared to respondents from the Levant (15%) and from
North Africa (20%). • Qatar residents present the highest intention.

Investment in Property – Type of PropertyQ. What type of property are you planning to invest in?Q. Which of the following types of property would it be?
Total Saudi Arabia UAE Kuwait Qatar Bahrain
(*)Oman
(*)Lebanon
(*)Jordan
(*) Egypt Morocco Algeria Tunisia(*)
Kind of Property
Base (Plan to buy): 637 139 82 36 59 17 18 7 25 100 53 91 8
Apartment 47% 38% 50% 42% 44% 24% 39% 29% 48% 68% 55% 45% 25%
Villa/ townhouse/ bungalow 25% 28% 30% 33% 36% 47% 22% 14% 12% 18% 11% 27% -
Commercial property (office/ shop etc.) 25% 28% 22% 17% 17% 24% 28% 71% 36% 20% 40% 22% 63%
Other 11% 14% 10% 19% 8% 6% 22% - 16% 5% 4% 12% 13%
Status of Property
Base (Plan to buy): 637 139 82 36 59 17 18 7 25 100 53 91 8
New 55% 58% 56% 50% 69% 76% 67% 43% 52% 58% 49% 42% 38%
Pre-owned 27% 22% 32% 39% 25% 6% 22% 14% 32% 23% 32% 31% 25%
Combination of new and pre-owned - - - - - - - - - - - - -
Don't know/Can't say 18% 20% 12% 11% 5% 18% 11% 43% 16% 19% 19% 27% 38%
(*)Small base

Consumer GoodsQ. Lastly, could you please tell us which of the following are you planning to invest in within the next 6 months?(Please tick all that apply)
Total Saudi Arabia UAE Kuwait Qatar Bahrain Oman Lebanon Jordan Egypt Morocco Algeria Tunisia
Base 2750 611 280 104 147 54 64 64 146 573 226 391 71
Furniture 20% 21% 20% 16% 16% 26% 20% 13% 15% 15% 23% 27% 21%
Tablet or Smartphone 18% 16% 21% 14% 20% 9% 16% 17% 14% 15% 23% 24% 15%
Desktop or Laptop 18% 18% 25% 13% 23% 22% 8% 22% 14% 14% 21% 19% 13%
LCD or Plasma Television 11% 11% 10% 13% 17% 7% 11% 5% 5% 9% 14% 16% 10%
Air Conditioner 9% 12% 8% 8% 7% 13% 11% 8% 9% 9% 7% 11% 6%
Washing Machine 9% 9% 12% 8% 10% 9% 13% 8% 3% 7% 11% 11% 10%
Refrigerator 8% 10% 10% 3% 9% 4% 8% 5% 8% 7% 9% 10% 4%
Digital Camera 6% 5% 9% 7% 10% 15% 5% 2% 2% 3% 11% 7% 4%
Cooking Range 5% 7% 8% 4% 8% 4% 6% 5% 2% 3% 5% 5% 1%
Vacuum Cleaner 5% 6% 9% 5% 5% 6% 6% 2% 7% 3% 2% 3% 3%
Normal or Digital Camcorder 4% 3% 3% 3% 3% 6% 2% - - 4% 9% 6% 1%
Clothes Dryer 3% 5% 6% 4% 3% 6% 3% 6% 5% 2% 2% 3% -
Home Theatre System 3% 4% 8% 4% 9% 6% 2% 2% 1% 1% 3% 2% 1%
Normal Color Television 3% 3% 2% 1% 1% 2% 2% 3% 3% 2% 4% 6% 1%
DVD or VCD Recorder or Player 2% 3% 3% 2% 4% 6% - 2% 1% 1% 4% 2% -
Other 9% 8% 9% 5% 7% 2% 9% 9% 15% 10% 8% 8% -

COUNTRY’S ECONOMICSITUATION
Section 3b

Summary
• Almost 1 in 2 respondents (47%) believe that their country’s economy has gotten worse compared to 6 months earlier, while only 17% believe the opposite. Those from North Africa and the Levant are more negative about their country’s economy, with 59% and 57% respectively stating that it has receded (GCC: 33%). A significantly higher proportion of respondents from Egypt (75%) followed by Jordan residents (66%) believe that their country’s economy has gotten worse.
• Just over a third (35%) of respondents expect the economy in their country of residence to improve in the next 6 months, while 29% expect the opposite. Those living in the GCC and especially UAE residents are more optimistic about their country’s future economy (GCC: 44%, UAE:58%) as compared to those living in the Levant (24%) and in North Africa (27%).
• Only 7% believe that the present business conditions are very good, while 18% think that the business conditions are good. A significantly higher proportion of respondents from GCC are positive about the current business conditions (very good/ good: 35%) in comparison to respondents from the Levant (very good/ good: 16%) and North Africa (very good/ good: 13%). Residents in Egypt (bad/ very bad: 59%) and Jordan (bad/ very bad: 56%) seem more pessimistic.
• Overall, 46% of MENA residents expect the business conditions to get better within the next year. GCC residents and especially those living in the UAE (72%) and in Oman (65%), are more optimistic about the future business conditions in their country of residence (GCC: 54%, Levant 34% , North Africa: 36%).

Summary
• 38% believe that there are few jobs available across few industries, while 23% state that there are few jobs available across various industries.
• Generally, respondents seem somewhat negative about the future availability of jobs in their country with 32% of them expecting the number of jobs available in the next 6 months to decrease. This belief is higher amongst Levant and North Africa residents (38% and 36% respectively) in comparison to the GCC (28%).

Country’s Economy – Evaluation of Current ScenarioQ. Compared to 6 months earlier, my country’s economy has:
• Almost 1 in 2 respondents (47%) believe that their country’s economy has gotten worse compared to 6 months earlier, while only 17% believe the opposite.
• Those from North Africa and the Levant are more negative about their country’s economy, with 59% and 57% respectively stating that it has receded (GCC: 33%).
• A significantly higher proportion of respondents from Egypt (75%) followed by Jordan residents (66%) believe that their country’s economy has gotten worse.
Base: Total (2750), KSA (611), UAE (280), Kuwait (104), Qatar (147), Bahrain (54), Oman (64), Lebanon (64), Jordan (146), Egypt (573), Morocco (226), Algeria (391), Tunisia (71)

Country’s Economy – Expectations for the FutureQ. In comparison to the current period, in the next 6 months I expect my country’s economy to:
• Just over a third (35%) of respondents expect the economy in their country of residence to improve in the next 6 months, while 29% expect the opposite.
• Those living in the GCC and especially UAE residents are more optimistic about their country’s future economy (GCC: 44%, UAE:58%) as compared to those living in the Levant (24%) and in North Africa (27%).
Base: Total (2750), KSA (611), UAE (280), Kuwait (104), Qatar (147), Bahrain (54), Oman (64), Lebanon (64), Jordan (146), Egypt (573), Morocco (226), Algeria (391), Tunisia (71)

Present Business ConditionsQ. Overall, presently business conditions in my country of residence are…
• Only 7% believe that the present business conditions are very good, while 18% think that the business conditions are good. • A significantly higher proportion of respondents from GCC are positive about the current business conditions (very good/ good: 35%)
in comparison to respondents from the Levant (very good/ good: 16%) and North Africa (very good/ good: 13%).• Residents in Egypt (bad/ very bad: 59%) and Jordan (bad/ very bad: 56%) seem more pessimistic.
Base: Those employed (1677), KSA (404), UAE (218), Kuwait (86), Qatar (118), Bahrain (43), Oman (40), Lebanon (37), Jordan (97), Egypt (358), Morocco (51), Algeria (186), Tunisia (26)
(*)Small base

Expectations of Future Business Conditions
(*)Small base
Q. In a year’s time, I expect the business conditions to:
• Overall, 46% of MENA residents expect the business conditions to get better within the next year. • GCC residents and especially those living in the UAE (72%) and in Oman (65%), are more optimistic about the future business
conditions in their country of residence (GCC: 54%, Levant 34%, North Africa: 36%).
Base: Those employed (1677), KSA (404), UAE (218), Kuwait (86), Qatar (118), Bahrain (43), Oman (40), Lebanon (37), Jordan (97), Egypt (358), Morocco (51), Algeria (186), Tunisia (26)

Current Availability of JobsQ. Which of the following best describes your opinion on the current availability of jobs in your country of residence:
Total Saudi Arabia UAE Kuwait Qatar Bahrain Oman Lebanon Jordan Egypt Morocco Algeria Tunisia
Base 2750 611 280 104 147 54 64 64 146 573 226 391 71
There are few jobs available across few
industries38% 35% 28% 20% 24% 26% 38% 50% 46% 48% 40% 37% 51%
There are few jobs available across various
industries23% 24% 23% 27% 23% 20% 14% 16% 25% 21% 25% 26% 30%
There are plenty of jobs available but across a
few industries only13% 12% 20% 18% 24% 17% 17% 6% 10% 12% 9% 14% 6%
There are plenty of jobs available across various
industries10% 14% 15% 17% 15% 15% 16% 8% 5% 6% 10% 6% -
Don’t know/ Can’t say 15% 16% 14% 17% 14% 22% 16% 20% 14% 13% 16% 16% 14%
• 38% believe that there are few jobs available across few industries, while 23% state that there are few jobs available across various industries.

Future Availability of JobsQ. In the next 6 months, the number of jobs available in my country will….
Total Saudi Arabia UAE Kuwait Qatar Bahrain Oman Lebanon Jordan Egypt Morocco Algeria Tunisia
Base: 2750 611 280 104 147 54 64 64 146 573 226 391 71
Increase 24% 25% 40% 31% 36% 35% 20% 19% 10% 19% 30% 17% 7%
Remain the same 27% 24% 21% 31% 27% 20% 28% 38% 34% 28% 28% 28% 39%
Decrease 32% 37% 20% 14% 20% 17% 30% 31% 42% 36% 25% 40% 39%
Don’t know/Can’t say 16% 14% 19% 24% 18% 28% 22% 13% 15% 17% 16% 15% 14%
• Generally, respondents seem somewhat negative about the future availability of jobs in their country with 32% of them expecting the number of jobs available in the next 6 months to decrease.
• This belief is higher amongst Levant and North Africa residents (38% and 36% respectively, GCC: 28%).

CURRENT JOBSection 3c

Summary• 39% of respondents state that the number of employees in their company has decreased in
comparison to 6 months ago, while 24% believe that it has increased. A somewhat higher proportion of GCC residents (28%) claim that this number has increased as compared to Levant (21%) and North Africa (19%). This is mainly due to Kuwait (42%).
• 26% of respondents expect the number of employees in their company to decrease in the next 6 months, while about the same proportion (29%) expect the opposite. GCC residents are significantly more optimistic (34%) in comparison to Levant and North Africa residents (both at 24%). Those living in the UAE (47%) are the most positive, followed by Qatar residents (44%) and Kuwait residents (42%).
• 46% claim that they are satisfied with the career growth opportunities in their current job, while a third state the opposite. Lebanon residents seem the least satisfied in this aspect.
• 45% of employed respondents are dissatisfied with their current compensation. Dissatisfaction levels tend to be higher amongst residents of Levant and North Africa (54% and 53% respectively vs. 39% in GCC).

Summary
• 45% respondents are satisfied with the non-monetary benefits they receive at their current job, while 37% claim to be unsatisfied in this aspect. GCC residents present higher satisfaction levels (50% vs. 38% in Levant and 40% in North Africa). Egypt residents seem to be the least satisfied.
• 44% are satisfied with the job security in their current organization, while 37% claim to be unsatisfied.

Change in Number of EmployeesQ. In comparison to 6 months ago, the number of employees in the organization where I work has:
• 39% of respondents state that the number of employees in their company has decreased in comparison to 6 months ago, while 24% believe that it has increased.
• A somewhat higher proportion of GCC residents (28%) claim that this number has increased as compared to Levant (21%) and North Africa (19%).
• This is mainly due to Kuwait (42%).
Base: Those employed (1677), KSA (404), UAE (218), Kuwait (86), Qatar (118), Bahrain (43), Oman (40), Lebanon (37), Jordan (97), Egypt (358), Morocco (51), Algeria (186), Tunisia (26)
(*)Small base

Expected Change in Number of EmployeesQ. In the next 6 months, I expect the number of employees in my organization to:
• 26% of respondents expect the number of employees in their company to decrease in the next 6 months, while about the same proportion (29%) expect the opposite.
• GCC residents are significantly more optimistic (34%) in comparison to Levant and North Africa residents (both at 24%). • Those living in the UAE (47%) are the most positive, followed by Qatar residents (44%) and Kuwait residents (42%).
Base: Those employed (1677), KSA (404), UAE (218), Kuwait (86), Qatar (118), Bahrain (43), Oman (40), Lebanon (37), Jordan (97), Egypt (358), Morocco (51), Algeria (186), Tunisia (26)
(*)Small base

Satisfaction Levels: Career Growth Opportunities
Q. On an overall level, how satisfied are you with the following attributes related to your job?
• 46% claim that they are satisfied with the career growth opportunities in their current job, while a third state the opposite. • Lebanon residents seem the least satisfied in this aspect.
Base: Those employed (1677), KSA (404), UAE (218), Kuwait (86), Qatar (118), Bahrain (43), Oman (40), Lebanon (37), Jordan (97), Egypt (358), Morocco (51), Algeria (186), Tunisia (26)
(*)Small base

Satisfaction Levels: Current Compensation (Salary & Allowances)
Q. On an overall level, how satisfied are you with the following attributes related to your job?
• 45% of employed respondents are dissatisfied with their current compensation. • Dissatisfaction levels tend to be higher amongst residents of Levant and North Africa (54% and 53% respectively vs. 39% in GCC).
Base: Those employed (1677), KSA (404), UAE (218), Kuwait (86), Qatar (118), Bahrain (43), Oman (40), Lebanon (37), Jordan (97), Egypt (358), Morocco (51), Algeria (186), Tunisia (26)
(*)Small base

Satisfaction Levels: Non-monetary Benefits Q. On an overall level, how satisfied are you with the following attributes related to your job?
• 45% respondents are satisfied with the non-monetary benefits they receive at their current job, while 37% claim to be unsatisfied in this aspect.
• GCC residents present higher satisfaction levels (50% vs. 38% in Levant and 40% in North Africa). • Egypt residents seem to be the least satisfied.
Base: Those employed (1677), KSA (404), UAE (218), Kuwait (86), Qatar (118), Bahrain (43), Oman (40), Lebanon (37), Jordan (97), Egypt (358), Morocco (51), Algeria (186), Tunisia (26)
(*)Small base

Satisfaction Levels: Job SecurityQ. On an overall level, how satisfied are you with the following attributes related to your job?
• 44% are satisfied with the job security in their current organization, while 37% claim to be unsatisfied.
Base: Those employed (1677), KSA (404), UAE (218), Kuwait (86), Qatar (118), Bahrain (43), Oman (40), Lebanon (37), Jordan (97), Egypt (358), Morocco (51), Algeria (186), Tunisia (26)
(*)Small base

DEMOGRAPHICSSection 4

Respondent Profile 1/4 – Personal
Base: Total (2750) All in %
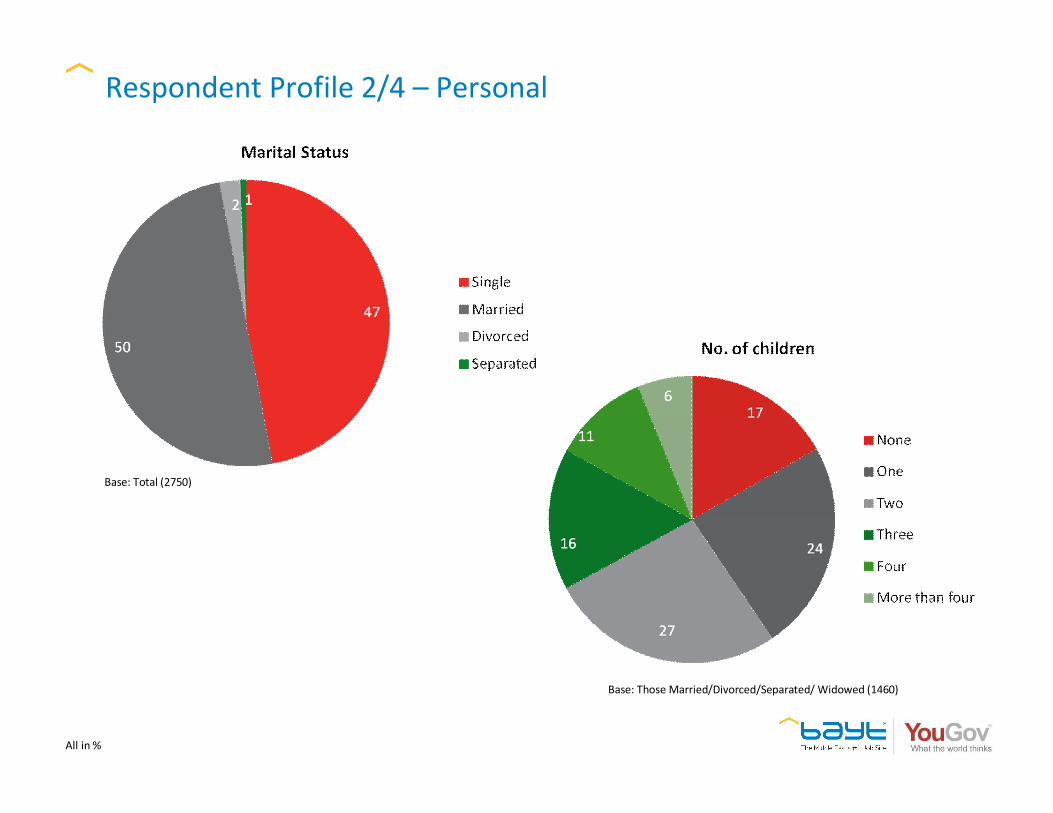
Respondent Profile 2/4 – Personal
Base: Those Married/Divorced/Separated/ Widowed (1460)
Base: Total (2750)
All in %

Respondent Profile 3/4 – Professional
Base: Total (2750)
Base: Those employed (1677)
All in %

Respondent Profile 4/4 – Professional
Base: Those employed (1677)
All in %

Thank You


