November 2, 2010 Initiation of Coverage Apparel, Footwear, & Specialty Retail Scott D. Krasik, CFA / (212) 822-8138 / [email protected]Kelly Halsor / (212) 822-8132 / [email protected]Fossil, Inc. (FOSL–$59.26) Buy (1) FOR REQUIRED DISCLOSURES, INCLUDING ANALYST CERTIFICATION, PLEASE REFER TO THE IMPORTANT DISCLOSURES SECTION THAT ENDS ON THE NEXT TO LAST PAGE OF THIS REPORT Company Statistics 12-month Price Target: $68 52-wk Range: $26.14-$60.11 Market Capitalization (M): $3,462 Shares Outstanding (M) fd: 67.1 Avg. Daily Vol. (000): 1,174 Dividend: NA Yield: NA Debt/Total cap: 47% Financials FYE Dec 2007A 2008A 2009A 2010E 2011E P/E Ratio: 30.2x 26.2x 25.6x 18.0x 14.7x EPS: Q1 $0.36 $0.43 $0.26 $0.53A $0.66 Q2 $0.21 $0.36 $0.25 $0.80A $0.74 Q3 $0.43 $0.54 $0.52 $0.76 $1.04 Q4 $0.76 $0.68 $1.03 $1.21 $1.58 Total $1.75 $2.02 $2.07 $3.30 $4.02 Company Description Fossil Inc., headquartered in Richardson, TX, designs, markets and distributes fashion accessories on a worldwide basis. It offers a line of watches under proprietary brands such as FOSSIL, RELIC and ZODIAC as well as licensed brands including ADIDAS, BURBERRY, DIESEL, DKNY, EMPORIO ARMANI, MARC BY MARC JACOBS AND MICHAEL Michael Kors. It also provides various fashion accessories for men and women, including handbags, belts, small leather goods, jewelry, and sunglasses under the FOSSIL, FIFTY-FOUR, MICHELE, DIESEL, DKNY, and RELIC brand names through company owned retail stores, department stores, and specialty retail stores, as well as over the Internet and through catalogs. As of June 30, Fossil operated 354 company-owned stores worldwide. FY'10 sales are projected to be approximately $1.9B. FOSL: INITIATING COVERAGE WITH A BUY (1) RATING AND $68 PRICE TARGET Key Points • We are initiating coverage of Fossil, Inc., with a Buy (1) rating and $68 price target, which implies approximately 15% upside potential from current levels. • Near-term earnings momentum. Fossil will report Q3’10 results on Tuesday, November 9. Business trends have likely remained strong since it reported double-digit sales growth and triple-digit EPS growth last quarter. We are looking for EPS of $0.76 (versus $0.52 last year and consensus of $0.72) but think there is upside to our estimates. We are modeling Q3 sales of $486.1M, up 27.5% yr/yr and compared to consensus of $481.1M. • Burgeoning watch cycle could drive multiyear growth. We believe Fossil is uniquely positioned to benefit from a fashion watch cycle. Product innovation based on new nontraditional natural and synthetic materials has revived an industry that appeared to be in secular decline. Historically watch cycles have lasted up to ten years. • Fossil’s brand penetration is just scratching the surface. We think the Fossil brand can reach $1B+ in sales in FY’11. Over the next three to five years, Fossil sales could more than double through retail expansion (only 354 stores worldwide at end of Q2) and further category growth both in the United States and internationally. • Established international infrastructure a competitive advantage. Early entry in the global market prompted Fossil to invest in its supply chain to meet the demand of a growing consumer base. We believe that Fossil has simplified the barriers to enter additional markets and has a unique advantage in growing its international presence without the need for additional substantial investments. • Strong balance sheet to create shareholder value. Fossil has $442.9M of cash and securities (~$6.50/sh) and just $7.9M of debt. In August, management announced a $750M share repurchase program expiring at the end of 2013 that will be funded through a combination of free cash flow and cash on hand Despite the magnitude of the buyback, it does not rule out possible acquisitions. • Attractive valuation offers upside potential. Fossil trades at 18.0x and 14.7x our FY’10 and FY’11 EPS estimates of $3.30 and $4.02, respectively. Our $68 price target is based on shares trading at 17.0x our FY’11 EPS estimate which is just above its historical average. Furthermore, our DCF analysis supports our thesis and suggests a share price between $63 and $68.
FOR REQUIRED DISCLOSURES, INCLUDING ANALYST CERTIFICATION, PLEASE REFER TO THE IMPORTANT DISCLOSURES SECTION THAT ENDS ON THE NEXT TO LAST PAGE OF THIS REPORT
Company Statistics 12-month Price Target: $68
52-wk Range: $26.14-$60.11
Market Capitalization (M): $3,462
Shares Outstanding (M) fd: 67.1
Avg. Daily Vol. (000): 1,174
Dividend: NA
Yield: NA
Debt/Total cap: 47%
Financials
FYE Dec 2007A 2008A 2009A 2010E 2011E
P/E Ratio: 30.2x 26.2x 25.6x 18.0x 14.7x
EPS: Q1 $0.36 $0.43 $0.26 $0.53A $0.66
Q2 $0.21 $0.36 $0.25 $0.80A $0.74
Q3 $0.43 $0.54 $0.52 $0.76 $1.04
Q4 $0.76 $0.68 $1.03 $1.21 $1.58
Total $1.75 $2.02 $2.07 $3.30 $4.02
Company Description
Fossil Inc., headquartered in Richardson, TX, designs, markets and distributes fashion accessories on a worldwide basis. It offers a line of watches under proprietary brands such as FOSSIL, RELIC and ZODIAC as well as licensed brands including ADIDAS, BURBERRY, DIESEL, DKNY, EMPORIO ARMANI, MARC BY MARC JACOBS AND MICHAEL Michael Kors. It also provides various fashion accessories for men and women, including handbags, belts, small leather goods, jewelry, and sunglasses under the FOSSIL, FIFTY-FOUR, MICHELE, DIESEL, DKNY, and RELIC brand names through company owned retail stores, department stores, and specialty retail stores, as well as over the Internet and through catalogs. As of June 30, Fossil operated 354 company-owned stores worldwide. FY'10 sales are projected to be approximately $1.9B.
FOSL: INITIATING COVERAGE WITH A BUY (1)
RATING AND $68 PRICE TARGET
Key Points
• We are initiating coverage of Fossil, Inc., with a Buy (1) rating and $68 price target, which implies approximately 15% upside potential from current levels.
• Near-term earnings momentum. Fossil will report Q3’10 results on
Tuesday, November 9. Business trends have likely remained strong since it reported double-digit sales growth and triple-digit EPS growth last quarter. We are looking for EPS of $0.76 (versus $0.52 last year and consensus of $0.72) but think there is upside to our estimates. We are modeling Q3 sales of $486.1M, up 27.5% yr/yr and compared to consensus of $481.1M.
• Burgeoning watch cycle could drive multiyear growth. We believe Fossil is uniquely positioned to benefit from a fashion watch cycle. Product innovation based on new nontraditional natural and synthetic materials has revived an industry that appeared to be in secular decline. Historically watch cycles have lasted up to ten years.
• Fossil’s brand penetration is just scratching the surface. We
think the Fossil brand can reach $1B+ in sales in FY’11. Over the next three to five years, Fossil sales could more than double through retail expansion (only 354 stores worldwide at end of Q2) and further category growth both in the United States and internationally.
• Established international infrastructure a competitive
advantage. Early entry in the global market prompted Fossil to invest in its supply chain to meet the demand of a growing consumer base. We believe that Fossil has simplified the barriers to enter additional markets and has a unique advantage in growing its international presence without the need for additional substantial investments.
• Strong balance sheet to create shareholder value. Fossil has $442.9M of cash and securities (~$6.50/sh) and just $7.9M of debt. In August, management announced a $750M share repurchase program expiring at the end of 2013 that will be funded through a combination of free cash flow and cash on hand Despite the magnitude of the buyback, it does not rule out possible acquisitions.
• Attractive valuation offers upside potential. Fossil trades at 18.0x and 14.7x our FY’10 and FY’11 EPS estimates of $3.30 and $4.02, respectively. Our $68 price target is based on shares trading at 17.0x our FY’11 EPS estimate which is just above its historical average. Furthermore, our DCF analysis supports our thesis and suggests a share price between $63 and $68.
2 of 22
KEY INVESTMENT CONSIDERATIONS
We are initiating coverage of Fossil with a Buy (1) rating and $68 price target, which implies approximately 15% upside potential from current levels. Fossil is one of the leading fashion accessories companies worldwide. Through proprietary and licensed brands, the company is both a supplier and retailer of watches, leather accessories, jewelry, footwear, and apparel. With a broad international footprint, and given its leading share in the watch category, we believe Fossil is uniquely positioned to benefit from strong watch and jewelry growth over the next few years. Beyond the potential impact from a strong fashion watch cycle, Fossil maintains growth opportunities from potentially more than doubling its store base to doubling or tripling its business in Asia and other international markets. At the same time, Fossil can use its large cash reserve and solid cash flow generation to increase shareholder value through stock repurchases and possible acquisitions.
Near-term Earnings Momentum
We believe that Fossil will report strong Q3’10 results that could beat consensus and our Street-high estimates. We are looking for EPS of $0.76 (versus $0.52 last year and consensus of $0.72). We are modeling Q3 sales of $486.1M, up 27.5% yr/yr and compared to consensus of $481.1M. Our confidence is rooted in the fact that sales trends only recently inflected positive (Q1’10 for North America and Q2’10 for Europe), which we believe would imply that we should see continued strong growth through H1’11 at least.
Figure 1: Segment Sales Growth Yr/Yr
(25.0%)
0.0%
25.0%
50.0%
75.0%
Q3'09 Q4'09 Q1'10 Q2'10 Q3'10E Q4'10E
North America Europe Asia Pacific/Other Direct to consumer
Source: Company filings and BB&TCM estimates
Retail same-store sales comparisons also appear to have upside when looking at two-year trends. On a two-year basis, we think trends could accelerate this quarter. Fossil will likely benefit from higher ASPs (watches) and, according to our checks, traffic remains positive as well. Separately, favorable mix (watches and retail are the fastest-growing categories) should benefit gross margin in the quarter. We are conservatively modeling only 20 bps of gross margin improvement yr/yr.
3 of 22
Lastly, while we are modeling accelerating SG&A on a dollar basis going forward (Q3E highest percentage growth in more than ten quarters), typical input costs (materials and freight) for Fossil are not exposed to the same inflationary pressures felt by apparel and footwear companies. This creates an advantage for watch and jewelry suppliers, which, in addition to controlled marketing investments, could limit pressure on Fossil’s operating margins over the next few quarters.
New Fashion Watch Cycle Favors Fossil
The last watch cycle began in the late 1980s with the proliferation of stainless steel watch bands and lasted ten years. After several years of flattish category growth earlier this decade, speculation centered on whether watches were in a secular tailspin due to Generation Y apathy and the emerging popularity of checking time on cell phones. The recent increases in watch sales are being driven by product innovation using new nontraditional natural and synthetic materials. It is a fashion cycle led by ceramics, silicone, plastics, nylon, and rubber. Leather bands have gotten new treatments with metal grommets and other details. Through its owned and licensed brands, Fossil is able to capitalize on each of these trends at good, better, and best price points at thousands of points of distribution. This may be best illustrated in ceramic watches.
Figure 2: Good-Better-Best Pricing Strategy
Michele: Tahitian Ceramic White Bezel MICHAEL Michael Kors: White Midsized Ceramic Watch Fossil: White Ceramic Multi-function Chrono Watch
$1,195.00 $450.00 $195.00
Source: Company websites
Unlike most fashion categories, watches are not subject to weather and other seasonal shifts and have less overall obsolescence risk due to longer cycles. This results in less promotional activity and minimal markdowns. Fossil’s consistent gross margins demonstrate that there is less inherent volatility in its accessories categories. Since FY’02, Fossil’s gross margin has stayed in a tight range from a low of 50.2% to a high of 54.6%, which includes the effect of unpredictable currency fluctuations. Pure merchandise margins are even less volatile (See Figure 3).
Even when the category has lagged due to stale product, consumers never built an expectation to purchase watches on a discounted basis—which, along with fashion misses, is one of the main drivers of margin pressure. Licensed Watch Brands: In addition to its own brands, Fossil can benefit from worldwide category growth through its licensed brand portfolio including its more established brands DKNY, Emporio Armani, and Diesel as well as newer licenses MICHAEL Michael Kors, Marc by Marc Jacobs, and Adidas. Emporio Armani and DKNY have historically been Fossil’s largest licensed brands but MICHAEL Michael Kors is its fastest-growing brand. We estimate that Kors’ sales could triple this year to ~$150M from ~$50M in FY’09. Furthermore, most of the growth has been achieved domestically with Kors’ international contribution de minimus at this point. Fossil just began distributing MICHAEL Michael Kors watches in Europe this fall and has yet to penetrate Asia despite the brand’s popularity in countries such as Korea and Japan.
Fossil Brand a $1B+ Opportunity
Since 2000, the Fossil brand has more than doubled from ~$400M in sales to almost $1B in sales this year. While sales mix remains heavily weighted to watches, Fossil has meaningful leather accessory and jewelry businesses both domestically and abroad. Management believes that long term, Fossil has the opportunity to become a $2B–$5B lifestyle brand. We think the three key initiatives it must pursue to achieve this goal are (1) retail growth, (2) further international penetration, and (3) jewelry expansion. Retail: At the end of Q2, Fossil operated 354 stores worldwide (195 in the United States and 159 internationally). It operates in several different formats (lifestyle, outlets, and multibrand), but its growth vehicle globally is its full-priced accessory stores (see Figure 4).
5 of 22
Figure 4: Store Growth by Concept
Source: Company filings and BB&TCM estimates
Fossil currently has just 95 accessory stores in the United States and 130 in international markets. These stores offer full assortments of Fossil’s watches, leather accessories, and jewelry. Its stores are almost always at full price and, based on excellent recent same-store sales results, generate strong double-digit operating margins.
Figure 5: Same-Store Sales by Quarter
5.1% 4.9%
6.4%
12.1%
19.2%
8.0%
15.5%
14.0%14.0%
11.0%
6.5%
14.6%
11.3%
1.8%
4.5%
2.0%
0.0%
5.0%
10.0%
15.0%
20.0%
Q1'09 Q2'09 Q3'09 Q4'09 Q1'10 Q2'10 Q3'10E Q4'10E
Global Accessory
Source: Company filings and BB&TCM estimates
Management has previously said that store capacity in the United States is 450–500, including more than 250 accessory stores. We believe that the international opportunity is similar and perhaps even larger. This would imply that Fossil is capable of almost tripling the number of stores from the current count on a global basis. International: Almost 55% of Fossil’s sales are generated outside the United States. Fossil has one of the largest global footprints of any company we track. We think there are additional major opportunities for growth in Europe, Asia, and elsewhere. In the United States, its most mature market, the Fossil brand is less than 60% penetrated within its possible wholesale distribution; in Europe it is only 40% and in Asia, Fossil is less than 20% penetrated.
73
78
32
15
113
80
33
18
191
82
3318
218
90
33 13
240
97
2810
265
99
12
13
2006 2007 2008 2009 2010E 2011E
Accessory Outlet Apparel Multi-brand
389
198
244
324 354
389 375
6 of 22
With an international infrastructure already in place, Fossil understood the value of owning its distribution. Through its subsidiaries, it can capture the full margin from operating efficiencies and at the same time control brand positioning and deal directly with its local retail partners. Over the last 20 years, Fossil has expanded its global presence to more than 100 countries mainly by acquiring key third-party distributors. In FY’05, Fossil took over local distributors in Taiwan and Sweden and in FY’07 transitioned Korea and India from distribution relationships to direct subsidiaries. At this point, other than Eastern Europe, parts of the Middle East and South America, Fossil has direct control over its businesses around the world.
Figure 6: Fossil Global Footprint
Source: Company filings
Asia represents less than 15% of Fossil’s sales. We expect strong double-digit growth from markets such as Korea, China, and Japan for the next several years. In addition to deeper watch penetration, Fossil will begin selling jewelry in Asia in FY’11. Its new Korean subsidiary should see hyper growth for the next few years from just $12M in FY’09 to expected $100M+ in FY’11. It will more than double the number of concessions it has in Korea from just 30 to more than 65 by mid FY’11. Jewelry: In FY’09, jewelry sales were ~$139M, representing 9% of Fossil’s total sales. Fossil introduced jewelry in Europe prior to offering it in the United States so it is still a relatively new category. Fossil has been able to leverage its watch assembly facilities for jewelry production, driving further efficiencies in its supply chain. In our view, innovation in the watch category based on new materials has ignited demand for product innovation in the jewelry category. Jewelry’s growth and popularity has been evident through recent department store’s monthly sales results. The category has been cited by both high-end (Nordstrom and Saks) and more moderate department stores (JCPenney and Bon-Ton) for the last few months as one of their best-performing categories. Moreover, we believe there is a shift in the jewelry industry favoring more branded product as this fashion watch cycle takes off since watches are such a brand-centric category. Industry sources have told us that consumers are increasingly searching for jewelry by brand. Since many fashion brands, at opening and moderate price points, do not currently produce jewelry, we believe Fossil has an opportunity to grow this category very quickly in both its own retail stores as well as wholesale distribution.
Fossil Direct
Third-Party Distributor
7 of 22
Established International Presence a Key Advantage
Fossil identified international expansion as a growth opportunity very early and has been investing in its global infrastructure since the 1980s, shortly after it was founded. We think that based on almost 30 years of investments, Fossil has simplified the barriers to entry for additional markets and owns a unique advantage in growing its international presence without the need for additional substantial investments. Fossil acquired its Asian sourcing partner in 1993 to directly control the supply chain process, which offers advantages both in production and distribution. Last year, more than 55% of non-Swiss made watches were manufactured through two majority-owned factories. These facilities are engineered to meet greater future demand while providing Fossil with operational control of the manufacturing process. Based on its long record and large scale, we believe Fossil benefits from a best-in-class reputation in negotiations with its suppliers. Additionally, while most companies are facing higher labor costs in Asia for FY’11 and beyond, wage rate increases likely will have a smaller impact on Fossil than others since it already pays above-average wages in the region. On the distribution side, Fossil owns a primary warehouse in Germany that services Europe and recently opened a regional warehouse in Hong Kong to better support distribution to its Asian subsidiaries. In each case, the facilities are scalable for future growth. It also leases office, manufacturing, and/or warehouse space in 20 other countries around the world.
Balance Sheet and Free Cash Flow to Create Shareholder Value
Fossil had $442.9M of cash and securities (~$6.50/sh) and just $7.9M of debt at the end of Q2. Historically, the company has been able to generate a significant amount of free cash flow while at the same time reinvesting appropriately in its business for growth. Since FY’06, Fossil has generated approximately $460M in free cash flow, and we expect it to generate an additional ~$120M in FY’10.
Figure 7: Annual Free Cash Flow
$97.7 $90.1
$45.0
$228.3
$122.6
$194.5
0
50
100
150
200
250
2006 2007 2008 2009 2010E 2011E
In $ Millions
Source: Company filings and BB&TCM estimates
In August, management announced a $750M share repurchase program that will expire in 2013. Although not comparable in size, Fossil has a record of completing its prior authorizations, and we believe it will be consistent buyers even at these levels. It will be paid for with a combination of cash flow and cash on hand. In Figure 8, we project accretion scenarios based on possible share repurchase activity for FY’11 using BB&TCM estimates.
8 of 22
Figure 8: Projected Annualized FY’11 Accretion from Share Repurchases
Share buyback (in $ millions)
$100 $200 $300 $400 $500 $600 $750
$45 $0.27 $0.42 $0.58 $0.76 $0.95 $1.15 $1.50
$50 $0.25 $0.39 $0.53 $0.69 $0.85 $1.03 $1.32
$55 $0.24 $0.36 $0.49 $0.63 $0.78 $0.93 $1.18
$60 $0.23 $0.34 $0.46 $0.58 $0.71 $0.85 $1.08
$65 $0.22 $0.33 $0.43 $0.54 $0.66 $0.79 $0.99
$70 $0.22 $0.31 $0.41 $0.51 $0.62 $0.73 $0.91
$75 $0.21 $0.30 $0.39 $0.48 $0.58 $0.69 $0.85
Average Price
Source: FactSet and BB&TCM estimates
Aggressive repurchases would not preclude Fossil from pursuing strategic acquisitions. Based on Fossil’s own projections, it will generate additional excess cash flow over the next three years (beyond what it allocates to share buybacks) to make deals if the opportunity presents itself. While near-term organic growth opportunities are robust, we believe Fossil will continue to evaluate potential brand additions through either acquisition or license.
COMPANY BACKGROUND AND DESCRIPTION
Fossil was founded in 1984 and completed an initial public offering in 1993. It is a global design, marketing, and distribution company specializing in fashion accessories including watches, jewelry, leather goods, footwear, and apparel under both owned and licensed brands. Its eponymous Fossil brand will likely grow to almost $1B in sales this year. Michele is Fossil’s second-largest proprietary brand with sales in excess of $50M. Other proprietary brands include Relic and Zodiac.
Figure 9: Proprietary Brand Portfolio
Proprietary Brands Price Point Distibution Channel
$55-$195
U.S. department stores (Macy’s,
Dillard’s, Belk and Nordstrom), U.S. specialty retailers (the Buckle), better
European department stores, better
European specialty stores, independently-
owned watch and jewelry stores worldwide, Fossil stores worldwide, and
www.fossil.com
$395-$2395
U.S. department stores (Neiman Marcus, Saks Fifth Avenue, and
www.michele.com
$45-$145U.S. department stores (JCPenney,
Kohl’s and Sears)
$150-$895
U.S. department stores (Nordstrom),
watch specialty stores, jewelry
stores worldwide and www.zodiacwatches.com
Source: Company filings
After Fossil, there are several large licensed brands (i.e., >$100M in sales), including Emporio Armani, DKNY, and MICHAEL Michael Kors. Beyond watches, Fossil also controls the jewelry license for DKNY (See Figure 10).
9 of 22
Figure 10: Licensed Brand Portfolio
Licensed Brands Price Point Expiration Distibution Channel
$30-$95 12/31/2012
Department stores, major sports stores, specialty retailers, jewelry stores
andAdidas stores worldwide
$295-$995 12/31/2012Department stores, specialty retailers,duty free stores worldwide and Burberry
boutiques worldwide
$85-$450 12/31/2010
Department stores, specialty retailers,Diesel boutiques worldwide and
Watches remain Fossil’s primary business, comprising 66% of total sales. Moreover, watches are Fossil’s highest-margin business. Leather goods (briefcases, large and small handbags, wallets, and belts) make up almost 20% of sales while jewelry represents 9% of sales.
Figure 11: FY’09 Category Sales
Jewelry 9%
Leather 19%
Other 6%
Watches 66%
Source: Company filings
Figure 12: FY’09 Segment Sales
Europe
29.7%
Asia
Pacific/Other
15.5%
Direct to
consumer
24.3%
North
America
30.4%
Most of the companies we track have aspirations to realize global diversification, which Fossil has already achieved. Almost 55% of Fossil’s total sales come from outside the United States. Fossil sells its products through direct subsidiaries in 23 countries and has a presence in more than 125 countries through local distributors. Fossil has a unique corporate culture. An important point of differentiation for Fossil from most other companies we follow is the level of control Fossil maintains over both its supply chain and the distribution process. In addition to establishing direct sourcing very early, as we discussed above, Fossil does all of its creative work in-house—from product and packaging to marketing materials and even photography for its website.
10 of 22
INDUSTRY OVERVIEW
Watches and jewelry, after experiencing solid growth for the last two years, have grown to a $135B+ global industry. Like other discretionary goods, there is a strong correlation between economic wealth and demand for watches and jewelry. Watch consumption is concentrated in Europe, Asia, and the United States, each accounting for roughly one-third of the global supply of watches. The watch category is dominated by national brands. Consumers carry a strong brand association with watches and seasonally tend to make their purchases around the holiday season. Watches are typically one of the most profitable categories for retailers. Predictable buying patterns and long product cycles simplify inventory planning and reduce the need for the promotional activity that is common in more fashion-dependent categories. Current trends inspired by newness and innovation are driving one of the strongest watch cycles in the last 20 years. New materials including ceramic, silicone, plastics, and alternative metals have replaced stainless steel and leather, sparking new consumer interest. The shift towards new materials has bred creativity and motivated many designers to license their own line of watches, which in turn has contributed to substantial growth and newness in the category. Jewelry is a highly fragmented industry. There are more than 23,000 specialty jewelers in the United States operating more than 27,000 stores, though they account for only 50% of total jewelry sales. Fashion jewelry is sensitive to both style and price. At opening and moderate price points, branded jewelry is significantly less important to the consumer than it is for other fashion-related products. This is likely due to the absence of well-known brands that operate at low to mid-level price points. Positive performance by brands in the watch category could potentially motivate those brands to enter the jewelry category in a more meaningful way going forward.
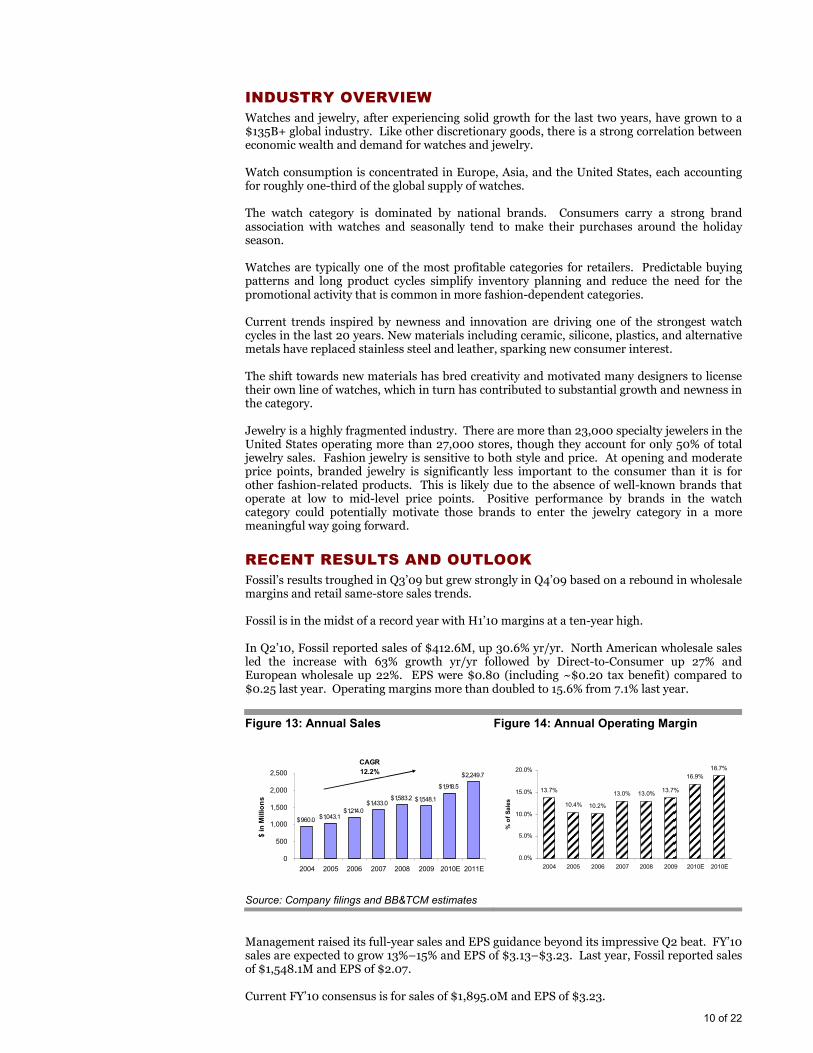
RECENT RESULTS AND OUTLOOK
Fossil’s results troughed in Q3’09 but grew strongly in Q4’09 based on a rebound in wholesale margins and retail same-store sales trends. Fossil is in the midst of a record year with H1’10 margins at a ten-year high. In Q2’10, Fossil reported sales of $412.6M, up 30.6% yr/yr. North American wholesale sales led the increase with 63% growth yr/yr followed by Direct-to-Consumer up 27% and European wholesale up 22%. EPS were $0.80 (including ~$0.20 tax benefit) compared to $0.25 last year. Operating margins more than doubled to 15.6% from 7.1% last year.
Figure 13: Annual Sales
Source: Company filings and BB&TCM estimates
Figure 14: Annual Operating Margin
13.7%
10.4% 10.2%
13.0% 13.0%13.7%
16.9%
18.7%
0.0%
5.0%
10.0%
15.0%
20.0%
2004 2005 2006 2007 2008 2009 2010E 2010E
% of Sales
Management raised its full-year sales and EPS guidance beyond its impressive Q2 beat. FY’10 sales are expected to grow 13%–15% and EPS of $3.13–$3.23. Last year, Fossil reported sales of $1,548.1M and EPS of $2.07. Current FY’10 consensus is for sales of $1,895.0M and EPS of $3.23.
$960.0$1,043.1
$1,214.0$1,433.0
$1,583.2 $1,548.1
$1,918.5
$2,249.7
0
500
1,000
1,500
2,000
2,500
2004 2005 2006 2007 2008 2009 2010E 2011E
$ in Millions
CAGR
12.2%
11 of 22
We are modeling sales of $1,918.5M on 13.3% retail comp growth and 25.1% wholesale growth; and EPS of $3.30. This implies a 17.0% operating margin, which would be Fossil’s highest since 18.6% in FY’00 and a prior peak of 20.9% in FY’99. For next year, we are looking for further margin expansion to 18.7% based on double-digit wholesale and retail sales growth, 90 bps of gross margin improvement, and 90 bps of SG&A leverage. Margins should benefit from a more favorable mix going forward as watches and retail increase as a percentage of total sales.
VALUATION
Fossil currently trades at 18.0x and 14.7x our FY’10 and FY’11 EPS estimates of $3.30 and $4.02, respectively, compared to its historical average of just over 16.0x and 14.0x. When we back out the $7.61 of projected year-end cash from the share price, Fossil trades at just 15.7x and 12.8x.
Source: FactSet and BB&TCM estimates; Prices as of Nov. 1.
The stock trades below its peers on both a P/E and EV/EBITDA (14.7x and 7.5x compared to 16.1x and 8.7x) basis on our FY’11 estimates, which we think may have an upward bias. Our $68 price target is based on shares trading at 17.0x our FY’11 EPS estimate, which is just above its historical average. Our discounted cash flow analysis supports our thesis for further upside potential to the shares as well. Assuming a five-year average free cash flow growth rate of 15%, a WACC of 13.1%, and what we consider a conservative terminal multiple of 7x–8x results in a share price between $63 and $69.
RISKS
In our opinion, there are several risks associated with an investment in Fossil, Inc., and to attaining our price target. As a globally diversified company, Fossil is exposed to political and economic concerns in countries on multiple continents. Furthermore, large fluctuations in the value of the dollar versus the Euro and/or British pound can impact Fossil’s profitability through currency translation adjustments. While the watch and jewelry categories are not as sensitive to fashion swings as apparel and footwear, there is ultimately some fashion or obsolescence risk related to Fossil’s products. Lastly, any meaningful slowdown in consumer spending trends would likely be harmful to results.
12 of 22
CONCLUSION
We are initiating coverage of Fossil, Inc., with a Buy (1) rating and $68 price target. Fossil is one of the leading fashion accessories companies worldwide. Through proprietary and licensed brands, it is both a supplier and retailer of watches, leather accessories, jewelry, footwear, and apparel. With a wide international footprint, and given its leading share in the watch category, we believe Fossil is uniquely positioned to benefit from strong watch and jewelry growth over the next few years.
13 of 22
Fossil Inc.
Income Statement
Dollars in millions, except per share dataYear Ended December 31
Net Sales $957.3 $1,043.1 $1,214.0 $1,433.0 $1,583.2 $1,548.1 $1,918.5 $2,262.3
Total Cost of Sales 454.7 508.0 605.0 691.0 732.1 703.2 834.0 964.6
BB&T Capital Markets' rating distribution by percentage (as of September 30, 2010):
All companies under coverage:
All companies under coverage to which it has provided investment banking services in the previous 12 months:
Buy (1) 57.3% Buy (1) 13.3% Hold (2) 42.0% Hold (2) 6.0% Underweight/Sell (3) 0.7% Underweight/Sell (3) 0.0% Not Rated (NR) 0.0% Not Rated (NR) 0.0% Suspended (SP) 0.0%
Suspended (SP) 0.0%
BB&T Capital Markets Ratings System:
The BB&T Capital Markets Equity Research Department Stock Rating System consists of three separate ratings. The appropriate rating is determined by a stock’s estimated 12-month total return potential, which consists of the percentage price change to the 12-month price target and the current yield on anticipated dividends. A 12-month price target is the analyst’s best estimate of the market price of the stock in 12 months. A 12-month price target is highly subjective and the result of numerous assumptions, including company, industry, and market fundamentals, both on an absolute and relative basis, as well as investor sentiment, which can be highly volatile. The definition of each rating is as follows: Buy (1): estimated total return potential greater than or equal to 10% Hold (2): estimated total return potential greater than or equal to 0% and less than 10% Underweight (3): estimated total return potential less than 0% NR: Not Rated NA: Not Applicable NM: Not Meaningful SP: Suspended Stocks rated Buy (1) are required to have a published 12-month price target, while it is not required on stocks rated Hold (2) and Underweight (3). BB&T Capital Markets Equity Research Disclosures as of November 2, 2010
Company Disclosure Fossil, Inc. (FOSL) 1, 6, 9
ADDITIONAL INFORMATION IS AVAILABLE UPON REQUEST BB&T Capital Markets Equity Research Disclosure Legend 1. BB&T Capital Markets makes a market in the securities of the subject company.
21 of 22
2. The analyst serves as an officer, director, or advisory board member of the subject company.
3. The analyst or a member of the analyst's household owns shares of the subject company.
4. BB&T Capital Markets has managed or co-managed a public offering of securities for the subject company in the last 12 months.
5. BB&T Capital Markets has received compensation for investment banking services from the subject company in the last 12 months.
6. BB&T Capital Markets expects to receive or intends to seek compensation for investment banking services from the subject company in the next three months.
7. BB&T Capital Markets or its affiliates beneficially own 1% or more of the common stock of the subject company as calculated in accordance with Section 13(d) of the Securities Exchange Act of 1934.
8. The subject company is, or during the past 12 months was, a client of BB&T Capital Markets, which provided non-investment banking, securities-related services to, and received compensation from, the subject company for such services. The analyst or employees of BB&T Capital Markets with the ability to influence the substance of this report knows the foregoing facts.
9. An affiliate of BB&T Capital Markets received compensation from the subject company for products or services other than investment banking services during the past 12 months. The analyst or employees of BB&T Capital Markets with the ability to influence the substance of this report know or have reason to know the foregoing facts.
For valuation methodology and related risk factors on Buy (1)–rated stocks, please refer to the body text of this report or to individual reports on any covered companies referenced in this report. The analyst(s) principally responsible for preparation of this report received compensation that is based upon many factors, including the firm’s overall investment banking revenue. Analyst Certification The analyst(s) principally responsible for the preparation of this research report certify that the views expressed in this research report accurately reflect his/her (their) personal views about the subject security(ies) or issuer(s) and that his/her (their) compensation was not, is not, or will not be directly or indirectly related to the specific recommendations or views contained in this research report.
OTHER DISCLOSURES The information and statistics in this report have been obtained from sources we believe are reliable but we do not warrant their accuracy or completeness. We do not undertake to advise the reader as to changes in figures or our views. This is not a solicitation of an order to buy or sell any securities. BB&T Capital Markets is a division of Scott & Stringfellow, LLC, member NYSE/FINRA/SIPC. Scott & Stringfellow is a wholly owned nonbank subsidiary of BB&T Corporation. NOT A DEPOSIT, NOT FDIC INSURED, NOT GUARANTEED BY THE BANK, NOT INSURED BY ANY FEDERAL GOVERNMENT AGENCY AND MAY GO DOWN IN VALUE. The opinions expressed are those of the analyst(s) and not those of BB&T Corporation or its executives. Important Information Regarding the Distribution of this Report in the United Kingdom This report has been produced by BB&T Capital Markets and is being distributed in the United Kingdom (UK) by Seymour Pierce Limited (SPL). SPL is authorized and regulated in the UK by the Financial Services Authority to carry out both corporate finance and investment services and is a member of the London Stock Exchange. Although BB&T Capital Markets is under separate ownership from SPL, BB&T Capital Markets has appointed SPL as its exclusive distributor of this research in the UK, and BB&T Capital Markets will be remunerated by SPL by way of a fee. This report has not been approved for purposes of section 21 of the UK's Financial Services and Markets Act 2000, and accordingly is only provided in the UK for the use of persons to whom communications can be made without being so approved, as detailed in the Financial Services and Markets Act 2000 (Financial Promotion) Order 2005.
EQUITY RESEARCH
Director of Research - Vernon C. Plack, CFA (804) 780-3257 Assistant Director of Research - James H. Weber, CFA (804) 782-8773
COMMERCIAL AND INDUSTRIAL
Building Materials/Specialty Construction & Facilities Services John F. Kasprzak Jr. (804) 782-8715 Adam R. Thalhimer, CFA (804) 344-8377 Paul Betz (804) 782-8746 Teresa T. Nguyen (804) 782-8745
Chemicals Frank J. Mitsch (212) 822-8145 Sabina Chatterjee (212) 822-8146 Maggie Cheung (212) 822-8147
Commercial Durables Matthew S. McCall, CFA (804) 780-3582 Jack C. Stimac, CFA (804) 782-8884
Industrial Equipment—Distribution & Components Holden Lewis (804) 782-8820 John C. Cooper (804) 787-8293
Industrial Equipment—Flow Control Kevin R. Maczka, CFA (804) 782-8811 Andrey V. Rudnitsky (804) 782-2006
Industrial Equipment—Machinery C. Schon Williams (804) 782-8769
CONSUMER
Agribusiness/Consumer Foods Heather L. Jones (804) 780-3280 Brett M. Hundley (804) 782-8753
Apparel, Footwear, & Specialty Retail Scott D. Krasik, CFA (212) 822-8138 Kelly L. Halsor (212) 822-8132
Automotive Aftermarket Anthony F. Cristello (804) 780-3269 Allen M. Hatzimanolis, CFA (804) 782-8732
Consumer Staples/Food & Drug Merchandising Andrew P. Wolf, CFA (804) 787-8224 H. Preston Wilkinson III (804) 782-8711
Specialty Hardlines Retailers Anthony C. Chukumba (212) 822-8143 Eric Cohen (212) 822-8140
FINANCIAL SERVICES
Banks/Thrifts Cary A. Morris (804) 782-8831 Nicole M. Peterson (804) 727-2604
Specialty Finance Vernon C. Plack, CFA (804) 780-3257 Charles E. Redding (804) 782-8853
ENERGY
Coal Mark A. Levin (804) 782-8856 Garrett S. Nelson (804) 787-8259
Energy Infrastructure Robert F. Norfleet, III (804) 787-8231 Bryce D. Humphrey (804) 782-8893
HEALTHCARE SERVICES
Home Health & Hospice/PBMs/Disease Management/Elder Care Services Eugene Goldenberg (212) 822-8149
TECHNOLOGY
Defense & Government Services Jeremy W. Devaney (703) 245-0902
TRANSPORTATION SERVICES
Airfreight & Logistics/Maritime Kevin W. Sterling, CFA (804) 782-8804 John R. Mims (804) 780-3246
Surface Transportation Thomas S. Albrecht, CFA (804) 787-8210 E. Neal Deaton (704) 367-3805 John R. Mims (804) 780-3246 A. Rhem Wood, Jr. (804) 782-8784
RESEARCH DEPARTMENT
Product Manager W. Moultrie Dotterer, CFA (804) 780-3279
Supervisory Analysts Kathleen R. Schneider (732) 567-8766 Denise Bossé Tyznar (804) 782-8880 James H. Weber, CFA (804) 782-8773
Editor Peggy Myers Walz (804) 782-8785
Publishing Coordinator Peter W. Councill (804) 782-8850
RESEARCH OFFICES
Richmond—Main Office 901 East Byrd St., Suite 310 (800) 552-7757 Richmond, Virginia 23219
New York—Research, Sales Trading, Sales 1133 Avenue of the Americas, 27th fl. (800) 896-9868 New York, New York 10036
Tysons Corner—Research 8200 Greensboro Drive, Suite 825 (703) 761-2800 McLean, VA 22102