Regenerating Places – Filling in the gaps Because we didn’t physically have enough time to cover the whole of the specification there were a few bullet points of the regenerating places spec that we didn’t do discreet lessons on. The content was covered in other lessons (mostly your Bath and Plymouth case studies and your fieldwork) but this document should help you feel more confident going in to the exam by covering these bullet points more explicitly. A lot of it is just things to be aware of, rather than lots of content to learn. InLesson 6 we saw that the need for regeneration can be measured/assessed in many ways using both quantitative data - statistics from sources such as the census that happens every 10 years (last one in 2011)- and qualitative data such as local people’s opinions and lived experience. The most common quantitative data for assessing the need for regeneration is deprivation data such as the Index of Multiple Deprivation (IMD) - Lesson 6. IMD data is collected and measured in lower super output areas (LSOAs) – small neighbourhoods used for measuring census data. It takes in to account a range of economic, social and environmental measures assess the need for regeneration in a place. There are 32,844 LSOAs in England. Twerton is ranked 2,881 (bad) whereas Widcombe is ranked 28,500 (good). Compare this to Plymouth where Devonport is ranked 346 out of 32,844. In lesson 6 we explored how the IMD works and then compared IMD maps for Bath and Plymouth. These showed that Bath has far fewer places ranked in deciles 1-5 (most deprived) compared to Plymouth. Of the 115 LSOAs in BANES, only 1 LSOA (Twerton) is ranked in decile 1 (among the most 10% deprived in the country) and only 4 are ranked in decile 2 (20% most deprived). In Plymouth 27 LSOAs are in Decile 1 and another 20 in decile 2. This is out of 161 LSOAs in Plymouth. These statistics once again indicate that there is much less of a need for regeneration in Bath than in Plymouth.
Transcript
Regenerating Places – Filling in the gaps
Because we didn’t physically have enough time to cover the whole of the specification there were a few bullet points of the regenerating places spec that we didn’t do discreet lessons on. The content was covered in other lessons (mostly your Bath and Plymouth case studies and your fieldwork) but this document should help you feel more confident going in to the exam by covering these bullet points more explicitly. A lot of it is just things to be aware of, rather than lots of content to learn.
InLesson 6 we saw that the need for regeneration can be measured/assessed in many ways using both quantitative data - statistics from sources such as the census that happens every 10 years (last one in 2011)- and qualitative data such as local people’s opinions and lived experience. The most common quantitative data for assessing the need for regeneration is deprivation data such as the Index of Multiple Deprivation (IMD) - Lesson 6. IMD data is collected and measured in lower super output areas (LSOAs) – small neighbourhoods used for measuring census data. It takes in to account a range of economic, social and environmental measures assess the need for regeneration in a place. There are 32,844 LSOAs in England. Twerton is ranked 2,881 (bad) whereas Widcombe is ranked 28,500 (good). Compare this to Plymouth where Devonport is ranked 346 out of 32,844.
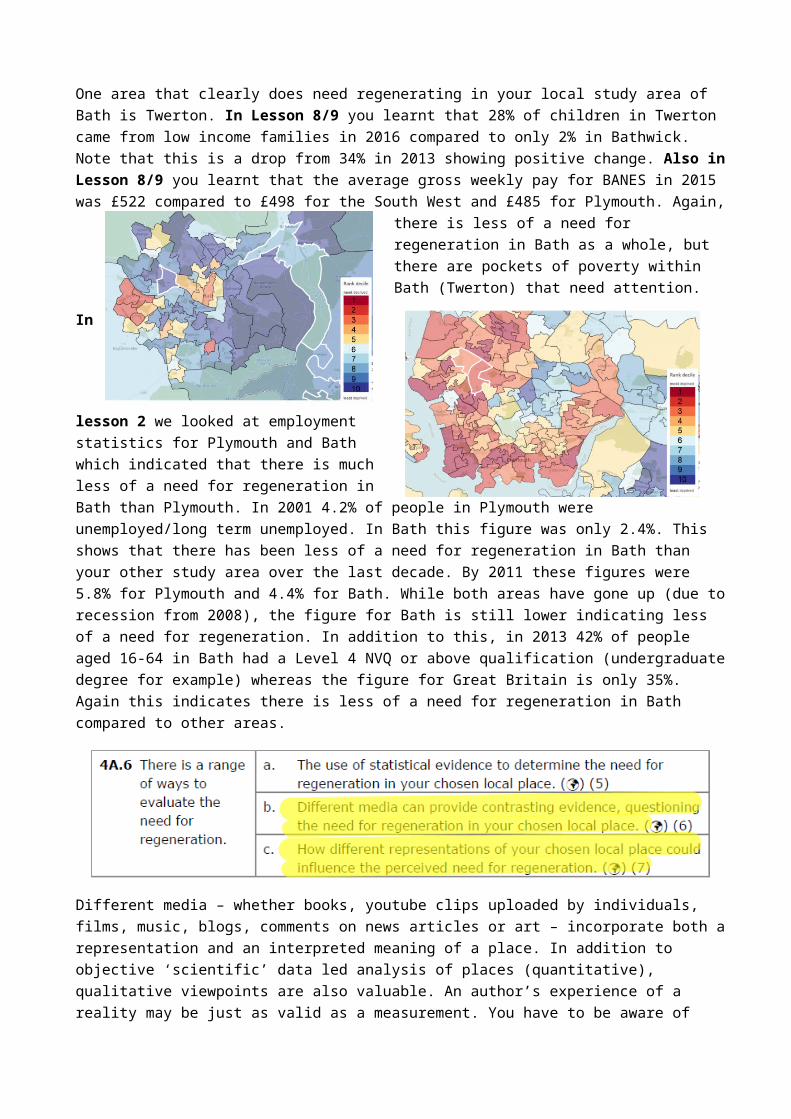
In lesson 6 we explored how the IMD works and then compared IMD maps for Bath and Plymouth. These showed that Bath has far fewer places ranked in deciles 1-5 (most deprived) compared to Plymouth. Of the 115 LSOAs in BANES, only 1 LSOA (Twerton) is ranked in decile 1 (among the most 10% deprived in the country) and only 4 are ranked in decile 2 (20% most deprived). In Plymouth 27 LSOAs are in Decile 1 and another 20 in decile 2. This is out of 161 LSOAs in Plymouth. These statistics once again indicate that there is much less of a need for regeneration in Bath than in Plymouth.
One area that clearly does need regenerating in your local study area of Bath is Twerton. In Lesson 8/9 you learnt that 28% of children in Twerton came from low income families in 2016 compared to only 2% in Bathwick. Note that this is a drop from 34% in 2013 showing positive change. Also in Lesson 8/9 you learnt that the average gross weekly pay for BANES in 2015 was £522 compared to £498 for the South West and £485 for Plymouth. Again, there is less of a need for regeneration in Bath as a whole, but there are pockets of poverty within Bath (Twerton) that need attention.
In
lesson 2 we looked at employment statistics for Plymouth and Bath which indicated that there is much less of a need for regeneration in Bath than Plymouth. In 2001 4.2% of people in Plymouth were
unemployed/long term unemployed. In Bath this figure was only 2.4%. This shows that there has been less of a need for regeneration in Bath than your other study area over the last decade. By 2011 these figures were 5.8% for Plymouth and 4.4% for Bath. While both areas have gone up (due to recession from 2008), the figure for Bath is still lower indicating less of a need for regeneration. In addition to this, in 2013 42% of people aged 16-64 in Bath had a Level 4 NVQ or above qualification (undergraduate degree for example) whereas the figure for Great Britain is only 35%. Again this indicates there is less of a need for regeneration in Bath compared to other areas.
Different media – whether books, youtube clips uploaded by individuals, films, music, blogs, comments on news articles or art – incorporate both a representation and an interpreted meaning of a place. In addition to objective ‘scientific’ data led analysis of places (quantitative), qualitative viewpoints are also valuable. An author’s experience of a reality may be just as valid as a measurement. You have to be aware of bias here. Local community internet forums and newspaper mcomments may be biased towards the dominant writers; the silent majority may not be represented. To evaluate the need for regeneration , decision makers must try and understand the perspective of the people who live there. Qualitative techniques such as in depth interviews could be used to find out how the impact different representations of Bath in the media impact the perceived need for regeneration different groups of people have.
Both these bullet points were actually touched on in Lessons 7,8,9 when we explored Bath. Promotional videos for the University of Bath and Bath Tourist Board presented Bath as a Unesco World Heritage City that is a vibrant place to live and work. Bath Chronicle news articles questioned this presenting the need for regeneration in certain areas of Bath (Twerton) as seen above. As did a music student’s youtube video.
In addition to the child poverty stats above you also saw that residents of BANES owed £4.3 million in unpaid council tax in 2016, an increase of 0.3 million from 2015. The article from the Bath Chronicle we looked at made the point there are people dependent on foodbanks to survive in Bath. This media representation increases the perceived need for regeneration and is in direct contrast to the promo videos we watched. Labour Councillor Joe Rayment made the point that “When you think of Bath you don’t get the whole picture. You don’t think of Snow Hill and Twerton”. The unpaid council tax bills are evidence of the debt problem people in Bath face that is not present in the popular perception of Bath as a wealthy spa town. It can also be missed when looking at IMB data for Bath as a whole which as we saw above creates the impression is it not that deprived. Just because it is not as deprived as Plymouth does not mean there are not areas that are in need of regeneration. 92% of people in Bathwick go to University. In Twerton the figure is 9%. We also saw evidence from the Bath Chronicle that drug abuse is an issue in Bath and the Genesis Trust website highlighted the homelessness problem that is skirted over in popular representations of Bath. They argue there are many more homeless people in Bath than the 22 given in official figures.
Newspaper comments about the new Southgate shopping centre and Bath Quays Waterside development (potentially costing Bath it’s world heritage status) provided contrasting evidence with some people questioning the need for these developments and criticising them and other people arguing in favour. The Guardian article by Jonathon Glancey was just one ‘representation’ of Bath and his views could have influenced people’s opinions on the perceived need for the regeneration schemes. The way Plymouth is
being sold as ‘Britain’s Ocean City’ can disguise the need the regeneration in areas such as North Prospect in the popular imagination. This is in contrast to news articles and IMD data.
These three bullet points were touched upon in Lesson 6 and then in all lessons about Bath, Plymouth and your fieldwork to Plymouth. They investigate how we can evaluate the success of attempts to regenerate an area. It should be noted here that regeneration indicates a long-running process rather than a quick fix to eco, soc and env problems, despite pol and eco pressures for speed. Some event such as the 2012 London Olympic Games, or the building of a new shopping Mall (Drake Circus) or leisure facility (Sutton Pool/The Barbican/Plymouth Hoe) are used as a catalyst to kick start a regeneration scheme. The idea is to use these to attract visitors and investment. However creating a legacy of success which tackles more systematic and longstanding issues of inequality and poor environment with roots in deindustrialisation may be more problematic and take a lot longer to successfully address. Often it may not be until a couple of generations later that success is seen. Many stakeholders in the interim may feel let down by the regeneration process.
Urban redevelopment strategies are not always successful. Some are made with particular political motives. Some benefit one group of people and not others. The regeneration of the London Docklands in the 1980s and 90s was heavily criticised for bypassing the needs of poor people that lived in the area with the regeneration being aimed at bringing in wealthier people from elsewhere. We have explored how Plymouth, being regenerated as ‘Britain’s Ocean City’ is catering more for the needs of tourists and attracting skilled workers to come and live in the area, rather than for the lower income groups that have suffered from cutbacks at the naval base. The need to rebuild major cities quickly after WW2 meant ‘comprehensive redevelopment planning’ using brutalist architecture such as concrete heavy, quick to build designs were put in place. In many cities these designs – which were probably not built with universal consent – quickly showed their age and are now often criticised as being dull and ‘harsh’. The Armada shopping Centre in Plymouth designed by Patrick Abercrombie in the 1950s is a perfect example. While hailed as a success at the time, there are now calls to tear it down and rebuild. This highlights that modern regeneration strategies take in to account a much broader range of public opinion than schemes in the past. Successful urban regeneration must now improve the urban environment. Because more public opinion is taken in to account – from a range of stakeholders - regeneration schemes are now much more contested than in the past.
In terms of 4A.10 a and b above, regeneration in Plymouth can not be deemed successful unless inequality is reduced between different parts of Plymouth. Despite the regeneration of the Barbican, Plymouth Hoe, Drake Circus and the University, there was still huge inequality in Plymouth where 90% of houses are in council tax bands C,B and A (lower bands) reflects low wages and aspiration. If regeneration was successful, and there had been city wide economic and social progress, then this figure should have lowered. Regeneration should increase wages, improve the quality of the urban environment and therefore the
desirability of a wider area of Plymouth to live (location, location, location) and therefore increase house prices so that the number of people moving in to council tax bands D and E goes up. If regeneration is not leading to areas being more ‘desirable’ then is it successful?
To address this imbalance, government funding from the New Deal for Communities is being used to rebuild the community of Devonport and North Prospect. Lessons have been learnt from previous developments to ensure working class residents have not been forced out of their homes and a range of housing types have been constructed (rent, part buy, buy). Because the new house prices have remained affordable (averaging £165,000), this regeneration has been much less contested than previous regeneration schemes and has been more popular among lower income groups.
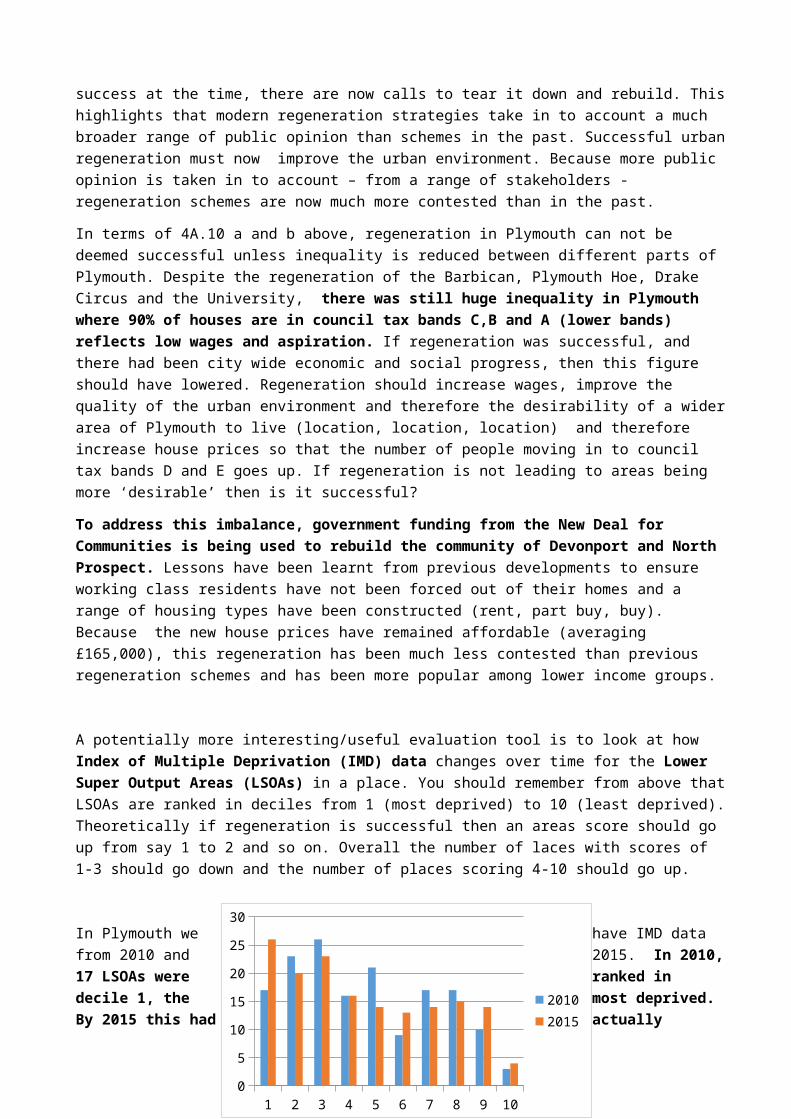
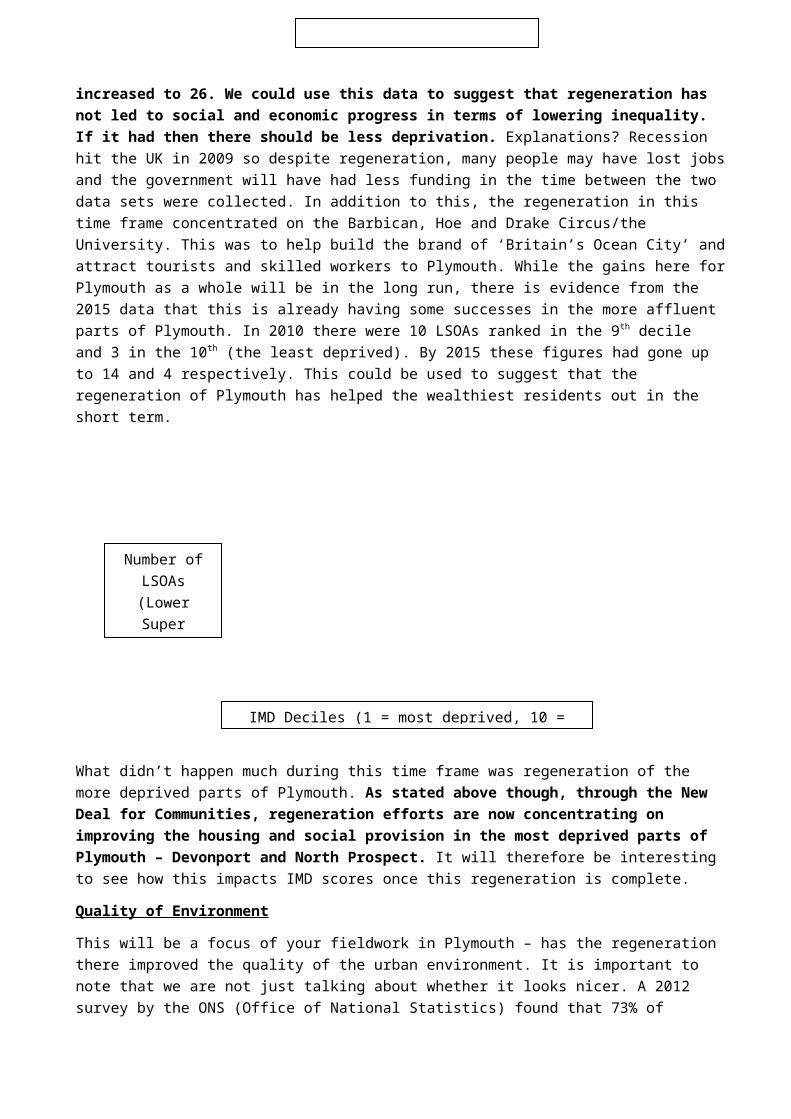
A potentially more interesting/useful evaluation tool is to look at how Index of Multiple Deprivation (IMD) data changes over time for the Lower Super Output Areas (LSOAs) in a place. You should remember from above that LSOAs are ranked in deciles from 1 (most deprived) to 10 (least deprived). Theoretically if regeneration is successful then an areas score should go up from say 1 to 2 and so on. Overall the number of laces with scores of 1-3 should go down and the number of places scoring 4-10 should go up.
In Plymouth we have IMD data from 2010 and 2015. In 2010, 17 LSOAs were ranked in decile 1, the most deprived. By 2015 this had actually increased to 26. We could use this data to suggest that regeneration has not led to social and economic progress in terms of lowering inequality. If it had then there should be less deprivation. Explanations? Recession hit the UK in 2009 so despite regeneration, many people may have lost jobs and the government will have had less funding in the time between the two data sets were collected. In addition to this, the regeneration in this time frame concentrated on the Barbican, Hoe and Drake Circus/the University. This was to help build the brand of ‘Britain’s Ocean City’ and attract tourists and skilled workers to Plymouth. While the gains here for Plymouth as a whole will be in the long run, there is evidence from the 2015 data that this is already having some successes in the more affluent parts of Plymouth. In 2010 there were 10 LSOAs ranked in the 9th decile and 3 in the 10th (the least deprived). By 2015 these figures had gone up to 14 and 4 respectively. This could be used to suggest that the regeneration of Plymouth has helped the wealthiest residents out in the short term.
What didn’t happen much during this time frame was regeneration of the more deprived parts of Plymouth. As stated above though, through the New Deal for Communities, regeneration efforts are now
1 2 3 4 5 6 7 8 9 100
5
10
15
20
25
30
20102015
IMD Change over time for Plymouth
Number of LSOAs (Lower Super Output
Areas)
IMD Deciles (1 = most deprived, 10 = least deprived)
concentrating on improving the housing and social provision in the most deprived parts of Plymouth – Devonport and North Prospect. It will therefore be interesting to see how this impacts IMD scores once this regeneration is complete.
Quality of Environment
This will be a focus of your fieldwork in Plymouth – has the regeneration there improved the quality of the urban environment. It is important to note that we are not just talking about whether it looks nicer. A 2012 survey by the ONS (Office of National Statistics) found that 73% of respondents mentioned the local and global environment as an important factor in well-being. Having access to open, green space within walking distance of home is as important as the quality of the local area to well being. In addition to this, air quality is another important factor in judging the success of regeneration. Regeneration that tackles these issues within the built environment, in addition to upgrading retail space and housing, will have positive impacts on health and draw people to live there.
In terms of reducing pollution levels, national environmental watchdogs and planners monitor levels so controls can be put in place. Dereliction is normally associated with deindustrialisation, just like you saw in Detroit. Dereliction is a problem because it puts off investors as it creates an negative perception of an area. Therefore an important part of regeneration is to transform derelict, brownfield sites in to other more attractive uses that appeal to people as a place to live and work (what they’re trying to do with Plymouth).
b.) Not all regeneration projects are the same. They are often paid for in different ways. Some investment comes solely from the private sector, some solely from the public sector, and some from partnerships between the two. Some regeneration strategies are local and others come from central government (national). Some are judged based on economic success, others on whether inequality is narrowed.
A good example of Private Sector investment is the Bath Southgate Centre which cost £360million and was funded by the SouthGate Ltd Partnership (Aviva Investors and Multi Corporation). Costs are recovered by leasing space in the centre to retail companies. Success is measured by economic gain. A good example of Public Sector Investment is London’s 2012 Olympic games. The games cost the government (tax payer) £9.3 billion to host and costs were recouped through ticketing, tv sponsorship and the post games sales of apartments and houses in the athletes village. Success here is measured both by economic gain buit also whether inequality in east London has been narrowed. The whole justification of the games was that it would regenerate deprived parts of East London. Good examples of a public-private partnership (a partnership between the government and property developers where the government put up land and financial grants and developers ensure that regeneration creates economic growth, jobs and housing) are the London
Docklands regeneration in the 1980s and 90s, and Cabot Circus in Bristol which opened in 2008. Note that since austerity measures came in in 2009 there is less money from the government to fund such large scale regeneration projects and the private sector is relied on more and more. In terms of judging the success of these schemes, sustainability is now key.
c.) The relative success of regeneration is viewed differently by different individuals and groups of stakeholders. Their views depend on a range of factors, particularly their own perceptions, attachments and motives. Local stakeholders’ views will depend on the meaning and lived experiences of the urban place and the impact of change on both the reality and image of that place. If they feel regeneration has benefitted them then they will deem it a success.. If they see it as just benefitting other people (usually richer people?) then they may not judge it a success.
Local and National Governments
Party politics may affect decisions and the longevity of any scheme. According to the conservative government in 2015, successful regeneration involved “achieving additional economic, social and environmental outcomes that would not otherwise have occurred.” It should represent ‘good value for money’. The national government has just a strategic and supporting role and has stopped monitoring spatial inequalities and setting targets. This now falls on local governments.
Plymouth Stakeholders
In lesson 12/13 you looked at a range of stakeholders in Plymouth and their views on the regeneration there. Some of these are included to the right but remember we also discussed Tudor Evans, Labour Leader of Plymouth Council. It is in his interest to ‘sell Plymouth’ as a place to visit, live and invest. Chris Robinson was a huge advocate of the regeneration and Plymouth’s future…but did he take in to account the impacts on regeneration on lower income groups (or lack of). Some people from lower income groups like Paul Mcarthy from North Prospect are in favour of Plymouth’s regeneration because he got a job as a construction worker working for Plymouth Community Homes. But what of North Prospect residents that have not benefitted from jobs and new houses yet? What will their opinion on Plymouth’s regeneration be?