Wilson HTM Equities Research – Beacon Lighting Group Limited Issued by Wilson HTM Ltd (Wilson HTM) ABN 68 010 529 665 - Australian Financial Services Licence No 238375, a participant of ASX Group and should be read in conjunction with the disclosures and disclaimer in this report. Important disclosures regarding companies that are subject of this report and an explanation of recommendations can be found at the end of this document. 07 October 2015 BEACON LIGHTING GROUP (BLX) Dim the lights and HOLD me We initiate coverage with a HOLD rating and $1.85/sh price target. Beacon Lighting (BLX), Australia’s largest specialty lighting retailer, has many of the key attributes we look for in a retailer, being vertically integrated, with a strong existing network (95 stores), robust gross profit margins (65%) and a solid store roll-out program (+6 store pa). However, Beacon’s growth profile does not come cheap, with the stock trading on an FY16 PE ratio of 19.3x, or a PEG ratio of 1.2x. Beacon has undoubtedly been a key beneficiary of growth in the household goods segment, a segment we believe to be correlated with house prices. Whilst we view Beacon as a high quality business, we initiate with a HOLD recommendation on valuation grounds - we would be a buyer of Beacon below $1.65/sh. Investment thesis Business overview: Beacon is Australia’s largest specialist retailer of light ing, ceiling fans and light globes with 80 owned stores, 11 franchised stores and 4 commercial sales offices. Many of the products offered are exclusive to Beacon and encompass both fashion and design elements pursuing the latest technology for energy efficiency. Growth strategy: Beacon estimates it can add approximately 6 stores per year to the existing store network of 95. Sales growth from the store roll-out will likely be further aided by the strong like-for-like sales being achieved by the group (+10.4% in FY15). The strength in like-for-like sales continues to be driven by a robust housing market and the transition to more power-efficient lighting. Forecasts: We forecast FY16 EPS of 9.7 cps, with EPS forecast to grow at 15.3% (CAGR) between FY15-19. The growth profile for Beacon is outstanding relative to comparable companies. That said, with the stock trading at 19.3x FY16 earnings and 13.0x FY19 earnings, the growth does not come cheap. Valuation: Our 12-month target of $1.85/sh is based on the average of EV/EBITDA (11.1x, $1.66/sh), PER (19.0x, $1.77/sh) and DCF (9.7% WACC, $2.09/sh) valuations. Risks and catalysts Risks include the falling AUD impacting margins, deterioration in the housing market impacting sales and the potential for currency led price inflation to result in volume reductions. Catalysts include new technological innovation driving product churn, improved consumer sentiment and the effective roll-out of additional stores. 12-mth target price (AUD) $1.85 Share price @ 06-Oct-15 (AUD) $1.80 Forecast 12-mth capital return 2.8% Forecast 12-mth dividend yield 2.6% 12-mth total shareholder return 5.4% Market cap $387m Enterprise value $395m Shares on issue 215m Sold short 0.0 ASX 300 weight n/a Median turnover/day $0.1m Liam Schofield, CFA [email protected]Tel. +61 2 8247 3173 12-mth share price performance 1-mth 6-mth 12-mth Abs return (%) 2.9 -3.0 62.2 Rel return (%) -3.0 1.9 61.0 Year-end June (AUD) FY14A FY15A FY16F FY17F FY18F NPAT rep ($m) 11.5 17.9 20.0 23.2 26.5 NPAT norm ($m) 11.8 16.9 20.0 23.2 26.5 Consensus NPAT ($m) 19.5 21.9 24.4 EPS norm ( cps) 7.9 9.7 11.0 12.4 EPS growth (%) 18.2 15.9 14.3 P/E norm (x) 22.9 19.3 16.7 14.6 EV/EBITDA (x) 19.8 14.5 12.0 10.4 9.1 FCF yield (%) 4.1 2.3 3.9 4.4 5.3 DPS ( cps) 4.2 5.4 6.1 6.8 Dividend yield (%) 0.8 2.3 2.6 2.9 3.2 Franking (%) 0 100 100 100 100 Source: Company data, WHTM estimates, S&P Capital IQ KEY CHANGES Before After Var % NPAT: FY16F 20.0 norm FY17F 23.2 ($m) FY18F 26.5 EPS: FY16F 9.3 norm FY17F 10.8 ( cps) FY18F 12.3 DPS: FY16F 4.8 ( cps) FY17F 5.3 FY18F 5.8 Price target: 1.85 Rating: HOLD 0.90 1.40 1.90 2.40 Sep-14 Jan-15 May-15 Sep-15 $ BLX XSI Rebased Initiating coverage
Transcript
Wilson HTM Equities Research – Beacon Lighting Group Limited
Issued by Wilson HTM Ltd (Wilson HTM) ABN 68 010 529 665 - Australian Financial Services Licence No 238375, a participant of ASX Group and should be read in conjunction with the disclosures and disclaimer in this report. Important disclosures regarding companies that are subject of this report and an explanation of recommendations can be found at the end of this document.
07 October 2015
BEACON LIGHTING GROUP (BLX)
Dim the lights and HOLD me
We initiate coverage with a HOLD rating and $1.85/sh price target. Beacon
Lighting (BLX), Australia’s largest specialty lighting retailer, has many of
the key attributes we look for in a retailer, being vertically integrated, with
Business overview ......................................................................... 26
Appendix A: Board, management and substantials ....................... 29
Disclosures and disclaimers .......................................................... 31
07 October 2015
Retailing
Beacon Lighting Group Limited
Wilson HTM Equities Research – Beacon Lighting Group Limited 4
Executive summary
Recommendation and share price target
We initiate coverage with a HOLD recommendation and a 12-month price target of $1.85/sh,
implying limited upside from the current share price.
Business overview
Beacon Lighting is Australia’s largest specialist retailer of lighting, ceiling fans and light globes
with 95 stores comprising 80 owned stores, 11 franchised stores and 4 commercial sales
offices. Many of the products offered are exclusive to Beacon and encompass both fashion
and design elements pursuing the latest technology for energy efficiency.
Key areas of risk
Demand for lighting products within residential dwellings appears correlated with the state
of the housing market. While it’s difficult to predict changes in the housing cycle, it
appears that Beacon at 19.3x FY16 earnings, is richly priced in a housing market which
has already benefited from low interest rates, but is yet to experience the impact of any
major supply response (ie settlement of dwellings under construction). That said, 70% of
Beacon’s business is from renovations, which may provide some earnings resilience.
The demand for residential lighting products is also influenced by general economic
conditions, including consumer confidence and growth in disposable income. Overall, we
see the real economy weakening and in the absence of continuing growth in asset prices,
retail sales are at risk.
Key areas of potential upside
There is no doubt that Beacon is a quality business, especially given its strong existing
store network. We like the fact that Beacon develops, designs, sources, imports,
distributes, merchandises and sells – this level of vertical integration is a key positive.
We see Beacon as capable of delivering EPS growth of approximately 15.3% pa through
the next five years – this compares favourably to the competitive set. We forecast
continued growth through strong like-for-like sales, plus the store roll-out program which
could see an additional six stores per year added to the current store network of 95 – we
forecast a peak store network of 137 by 2022.
Given the positive attributes of Beacon, there is little surprise the stock trades on a
relatively hefty multiple for a retailer – 19.3x FY16 earnings and 13.0x FY19 earnings.
Based on the Growth to PE XY plot below (Chart 1), Beacon appears relatively expensive
at its current price of $1.80/sh.
Chart 1: Growth at a reasonable price
While BLX has a strong growth profile, it appears the growth is more than built into the multiple
Source: Wilson HTM
BLX
ADH
FAN
HVN
JBH
NCK
PBG
SUL
5%
7%
9%
11%
13%
15%
17%
19%
10x 12x 14x 16x 18x 20x 22x 24x
EP
S G
row
th (
FY
15
-18 C
AG
R)
FY16 PER
07 October 2015
Retailing
Beacon Lighting Group Limited
Wilson HTM Equities Research – Beacon Lighting Group Limited 5
Sensitivity analysis
Sensitivity analysis
The primary drivers of value for Beacon are the assumptions for: a) like-for-like sales, and b)
the speed/efficacy of the store roll-out program. On this basis, we have undertaken a
sensitivity analysis looking at a range of potential outcomes based on a change in these two
assumptions:
Bear case – No store roll-out and like-for-like growth of 3.0% pa.
Base case – Like-for-like sales growth of 8.0% in FY16, then declining at 1.0% pa down
to a terminal growth rate of 3.0%. We have adopted EBIT margins of ~14%, which are
broadly consistent with historic margins, whilst acknowledging some slight improvement to
SG&A from economies of scale from the larger store network.
Bull case – Like-for-like sales growth of 10.0% over the next five years (then a linear
decline to 3.0%), with EBIT margins improving 150bps from 13.8% (FY16).
Chart 2: Scenario analysis
Source: Wilson HTM
$1.50/sh
$1.85/sh
$2.40/sh
$1.80/sh
0.00
0.50
1.00
1.50
2.00
2.50
3.00
Bear case Valuation Bull case
A$/sh
Share price
07 October 2015
Retailing
Beacon Lighting Group Limited
Wilson HTM Equities Research – Beacon Lighting Group Limited 6
Investing scorecard
Source: Wilson HTM
• Our view: This is a quality business with a strong growth profile to be delivered through like-for-like sales and a store roll-out program.
• We forecast EPS growth of 15.3% (CAGR) from FY15 to FY19. The EPS growth profile declines from 18.2% in FY16 down to 12.6% by FY19.
• We forecast 15.6% CAGR FCF growth over the next five years. The growth is driven by our forecast for a) like-for-like sales of ~8% pa decreasing to 3% (FY21) and a roll-out program of ~6 stores per year until FY22. Beyond the cashflow period we have adopted growth of ~3%.
• We believe that like-for-like growth is inextricably linked to housing prices - should this recent growth trend reverse then like-for-like sales could slow and also hamper the roll-out program.
Earnings growth
• Our view : The forecast EPS is top quartile across comparable companies. However, with the stock trading at 19.3x FY16 EPS, the growth does not come for free.
• Upside: Should the upswing in the housing cycle continue, then the business could continue to post like-for-like growth of 5-10% pa. Under our bull case (see Chart 2), we have a valuation of ~$2.40/sh.
• Downside: The downside is that the operating environment for Beacon is as good as it gets. Given the stock is trading at 19.3x FY16 earnings, any slowdown would likely be met with reduced like-for-like sales, a slower roll-out and potentially a multiple de-rate. Under our bear case (see Chart 2), we have derived a valuation of $1.50/sh.
Upside/Downside
• Our view: Retailing is generally described as having low barriers to entry. That said, Beacon is Australia's largest specialty lighting retailer and is able to develop, design, source, import, distribute, merchandise and sell. This integrated approach ticks the box in terms of the characteristics we look for in a retailer.
• Outside of Beacon, the competition is either small specialist lighting retailers or large hardware stores. Beacon's store network places their offer between the boutique and the mass-market offerings.
Industry structure
• Our view: This business is undoubtedly a beneficiary of a strong housing cycle. Were the cycle to fade, then we believe the business would be adversely impacted. That said, we see less volatility in the renovations segment of housing, which could provide some insulation from earnings volatility.
• The Australian property cycle upswing appears to be continuing. We believe a proportion of current retail spending particularly in the home segment is a direct impact of the wealth effects flowing from recent asset price inflation.
Thematic
• Our view: The Robinson family remain a significant influence on the Beacon business. That said, their majority ownership in the business provides a strong alignment of interest.
• The Executive Chairman is Ian Robinson, whose family holds a 55% shareholding. Under the listing, Ian committed the family’s shareholding to escrow for two years post-IPO - escrow release date Apr-16.
• Ian’s son Glen, with more than 10 years full time experience in the business, is Chief Executive Officer.
Management
• Environmental sustainability risks include impacts on the Group’s supply chain from suppliers through to stores.
• Social sustainability risks include workplace health and safety as well as personnel management and corporate conduct.
• Corporate conduct risks could impact regulatory, reputational and financial performance. It includes stock loss and theft.
ESG
07 October 2015
Retailing
Beacon Lighting Group Limited
Wilson HTM Equities Research – Beacon Lighting Group Limited 7
Business model analysis
Key partnerships Key activities Value proposition Customer relation Customer segments
The vast majority of exclusive
products are designed and
sourced internationally
through third party factories
using external buying agents
and co-ordinated with
Beacon’s buying team.
A small proportion of stock is
supplied through local
wholesalers in Australia.
A number of exclusive
national and international
distribution arrangements for
key products also exist.
A vertically integrated
specialty lighting retailer
which develops, designs,
sources, imports, distributes,
merchandises and sells
lighting, ceiling fans and light
globes.
Beacon is a specialty lighting
retailer.
The company offers
customers a wide range of
products with knowledge,
service and advice.
The products encompass
both fashion and design
elements as well as pursuing
the latest technology for
energy efficiency.
Multiple price points to create
a “good, better, best” product
offer.
The product range is
manufactured to comply with
Australian Standards.
Marketing activities are a key
sales driver and instrumental
in establishing strong brand
recall and awareness.
Beacon operates two
customer loyalty programs,
one focused on general retail
customers, and the other on
trade customers.
Middle to upper socio-
economic demographic.
Beacon targets the residential
lighting market, be it for new
dwellings or renovations (ie
retail or trade).
Key resources Channels
Store network.
In-house design team which
assists in delivering relevant
product to the Australian
market.
Integrated point of sale and
warehouse management
system which automates the
stock replenishment process.
The 80 company stores, 11
franchised stores and 4
commercial sales centres are
the key sales channel.
More than 90% of products
are self-sourced and
distributed through Beacon’s
supply chain.
The China warehouse is a
central storage facility for key
lines and the international
wholesale business.
Third party warehousing in
Brisbane, Sydney and Perth.
Cost structure Revenue streams
Currently, Beacon has 80 company-operated stores, 11 franchised stores and four
commercial sales offices (Melbourne, Brisbane, Sydney and Perth).
The company has a Hong Kong wholesale office, a third party China warehouse and
third party warehousing in Brisbane, Sydney and Perth.
6.0% of annual own store and franchise store retail sales are spent on marketing
initiatives.
Principal revenue is from the Beacon retail stores, where the majority of the company’s
product ranges are marketed under the well-established product brand, Lucci, which is
owned by the company.
The revenue can be split between the retail (70%) and trade customers (30%).
Beacon is also working to develop Beacon Solar and Beacon International, both of
which are in their infancy.
Source: Wilson HTM
07 October 2015
Retailing
Beacon Lighting Group Limited
Wilson HTM Equities Research – Beacon Lighting Group Limited 8
Earnings forecasts
Organic growth: We have adopted like-for-like growth of 8.0% in FY16, declining 1.0% pa
down to a terminal growth rate of 3.0% in FY21. We anticipate growth will come through:
Changing technology, be it new products or changing technology.
New products and ranges: With energy efficiency and technology driving change,
Beacon has scope to further improve the breadth and depth of the range.
Technology in lighting: The lighting industry is experiencing rapid change in technology.
A need for greater energy efficiency is driving development of LED (light emitting diodes)
technology. There is little data to indicate how progressed this trend is. However,
approximately 30% of Beacon’s range is LED and we expected this to increase to ~90%
over the medium term. Furthermore, the proportion of homes currently with LED remains
much lower than the proportion reflected by Beacon’s range.
New store roll-out: Beacon plans to open approximately six stores per year for the
foreseeable future depending on suitable site identification, negotiation and availability.
Online presence: These opportunities may include driving sales through third party websites
and dedicated category websites. Online currently represents 1.9% of revenue. Given the low
contribution from online and our belief that purchases will remain principally in store we factor
limited growth in this channel.
Emerging businesses: Beacon intends to continue supporting the emerging Beacon Solar
and Beacon International divisions. We have not modelled these business channels.
Acquisitions: Beacon may pursue business acquisitions, locally or internationally. This may
include other lighting stores including franchised stores, other retail formats or wholesale
operations. We have factored in the acquisition of two franchise stores in FY16, then one
Valuation premium to index multiple 40% 25% 17% 11%
07 October 2015
Retailing
Beacon Lighting Group Limited
Wilson HTM Equities Research – Beacon Lighting Group Limited 16
Relative value
Beacon is trading at the top of the range for comparable companies (based on our earnings forecasts). Based on the competitive set, the current FY16 PE of 19.3x appears elevated.
While we appreciate the growth within the Beacon business, it does not appear sufficient to justify current multiples.
Table 8: Comparable multiples
Source: Capital IQ, IRESS, Wilson HTM
ASX Company Name T/P Price Mkt Cap EPS Growth DPS Growth EV / EBITDA EV / EBIT PER Divid. Yield
Wilson HTM Equities Research – Beacon Lighting Group Limited 17
Relative value analysis
As we look through the above comparable company and index multiples, we observe
an FY16 S&P/ASX 300 Small Industrials index PE multiple of 14.7x and an S&P/ASX
300 Consumer Discretionary multiple of 15.9x.
The comparable company analysis reflects a FY16 PE range of 12.9x to 17.1x,
compared with Beacon’s current FY16 PE multiple of 19.3x.
Our valuation of $1.85/sh reflects an FY16 PE of 19.9x, a 25% premium to the
S&P/ASX 300 Consumer Discretionary (XSI) index.
We have also considered Beacon on the basis of PE ratio per unit of growth (PEG
ratio). Given the declining growth profile for most of the competitive set, we have used a three-year CAGR growth factor.
Beacon screens as being relatively inexpensive on a PEG basis. The company’s
current FY16 PER is 1.2x its three-year CAGR growth rate.
While we do not doubt the quality of the Beacon business, we believe the current
multiple is fair relative to: a) organic store growth, b) store roll-out growth, and c) the current trading environment (risks posed by a slowing housing market).
Chart 14: Price to earning ratio (FY16) Chart 15: PEG ratio (FY16)
Source: Capital IQ, IRESS, Wilson HTM Source: Capital IQ, IRESS, Wilson HTM
19.3x
17.1x
15.3x
15.0x 15.0x 14.7x 14.5x
12.9x
0x
5x
10x
15x
20x
25x
BLX ADH FAN PBG SUL HVN NCK JBH
(x)
PER - 2016
S&P/ASX SMALL INDUSTRIALS
S&P/ASX 300 Consumer Discretionary0.0
0.5
1.0
1.5
2.0
2.5
JBH PBG HVN ADH BLX SUL FAN NCK
(x)
PEG (3yr CAGR EPS growth)
07 October 2015
Retailing
Beacon Lighting Group Limited
Wilson HTM Equities Research – Beacon Lighting Group Limited 18
Historic trading multiples
Chart 16: FY15 EV:EBITDA Chart 17: FY16 EV:EBITDA
Source: Capital IQ, Wilson HTM Source: Capital IQ, Wilson HTM
Chart 18: FY15 PER Chart 19: FY16 PER
Source: Capital IQ, Wilson HTM Source: Capital IQ, Wilson HTM
Chart 20: Forward consensus EPS forecasts
Source: Capital IQ, Wilson HTM
0
5
10
15
20
25
Jun-14 Sep-14 Dec-14 Mar-15 Jun-15 Sep-15
(x)
EV/EBITDA FY15 Ave. EV/EBITDA FY15 (WHTMe)
0
2
4
6
8
10
12
14
16
18
20
Jun-14 Sep-14 Dec-14 Mar-15 Jun-15 Sep-15
(x)
EV/EBITDA FY16 Ave. EV/EBITDA FY16 (WHTMe)
0
5
10
15
20
25
30
35
40
45
50
Aug-14 Nov-14 Feb-15 May-15 Aug-15
(x)
PER FY15 Ave. PER FY15 (WHTMe)
0
5
10
15
20
25
30
35
Jun-14 Sep-14 Dec-14 Mar-15 Jun-15 Sep-15
(x)
PER FY16 Ave. PER FY16 (WHTMe)
0
2
4
6
8
10
12
Jun-14 Sep-14 Dec-14 Mar-15 Jun-15 Sep-15
cps
EPS FY15a EPS FY16e
EPS FY17e EPS FY16 (WHTMe)
EPS FY17 (WHTMe)
07 October 2015
Retailing
Beacon Lighting Group Limited
Wilson HTM Equities Research – Beacon Lighting Group Limited 19
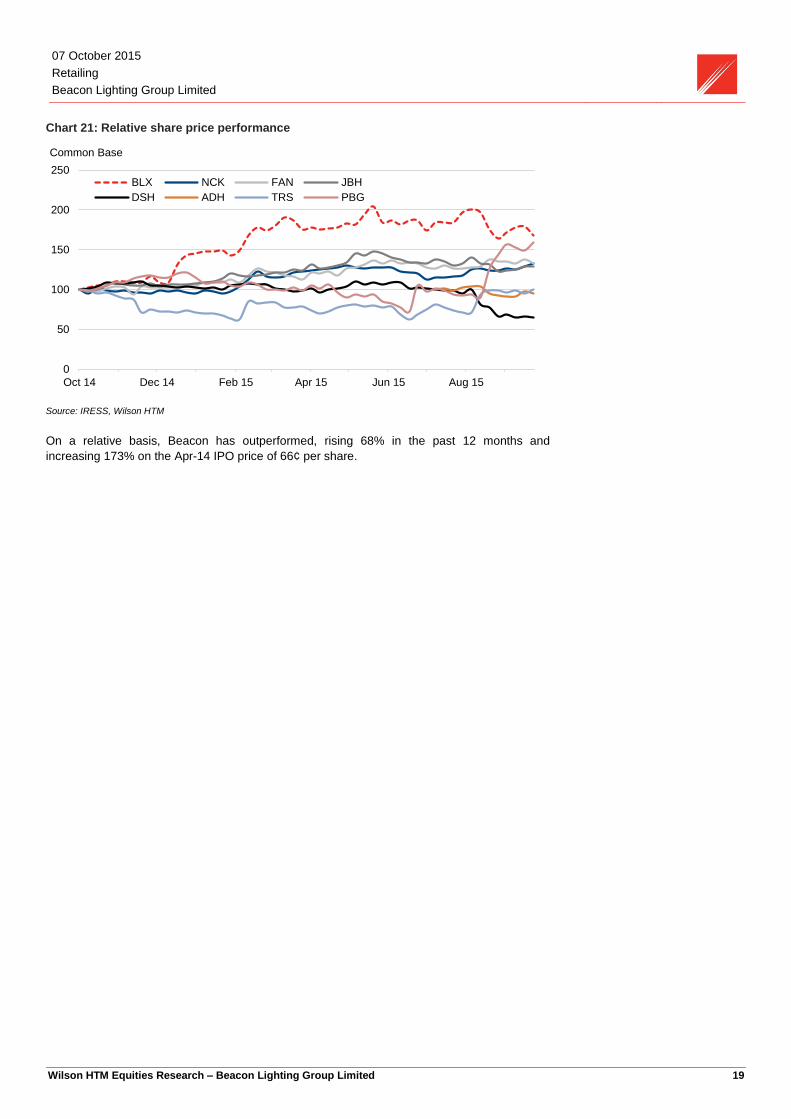
Chart 21: Relative share price performance
Source: IRESS, Wilson HTM
On a relative basis, Beacon has outperformed, rising 68% in the past 12 months and
increasing 173% on the Apr-14 IPO price of 66¢ per share.
0
50
100
150
200
250
Oct 14 Dec 14 Feb 15 Apr 15 Jun 15 Aug 15
Common Base
BLX NCK FAN JBH
DSH ADH TRS PBG
07 October 2015
Retailing
Beacon Lighting Group Limited
Wilson HTM Equities Research – Beacon Lighting Group Limited 20
How we compare with consensus
Source: Capital IQ, Wilson HTM
FY15 FY16 FY17 FY18
2015 2016 2017 2018
PL_OPERATING_REVENUE Wilson HTM (A$m) 179.4 212.5 248.3 283.8
Grow th (%)
CONSENSUS (A$m) 179.4 209.1 236.3 262.0
Delta (%) 1.6% 5.1% 8.3%
PL_EBITDA Wilson HTM (A$m) 27.3 32.9 38.0 43.3
Growth (%) 20.6% 15.5% 13.9%
Margin (%) 15.2% 15.5% 15.3% 15.3%
CONSENSUS (A$m) 27.4 31.7 35.4 39.2
Delta (%) 3.8% 7.3% 10.4%
PL_EBIT Wilson HTM (A$m) 25.0 29.7 34.3 39.0
Growth (%) 19.1% 15.3% 13.8%
Margin (%) 13.9% 14.0% 13.8% 13.8%
CONSENSUS (A$m) 25.0 29.1 32.6 36.1
Delta (%) 2.2% 5.3% 8.2%
PL_PROFIT_BEFORE_TAX Wilson HTM (A$m) 23.8 28.61 33.2 37.9
Growth (%) 20.0% 15.9% 14.3%
Margin (%) 13.3% 13.5% 13.4% 13.4%
CONSENSUS (A$m) 23.8 27.9 31.2 34.8
Delta (%) 2.7% 6.2% 9.0%
PL_NPAT_ADJ Wilson HTM (A$m) 16.9 20.0 23.2 26.5
Growth (%) 18.2% 15.9% 14.3%
Margin (%) 9.4% 9.4% 9.4% 9.4%
CONSENSUS (A$m) 16.9 19.5 21.9 24.4
Delta (%) 2.7% 6.2% 9.0%
EPS_NORM Wilson HTM (A$m) 7.9 9.3 10.8 12.3
Growth (%) 18.2% 15.9% 14.3%
Margin (%) 4.4% 4.4% 4.3% 4.3%
CONSENSUS (A$m) 7.9 9.1 10.2 11.3
Delta (%) 2.7% 6.1% 8.9%
EPS_REP Wilson HTM (cps) 8.3 9.3 10.8 12.3
Growth (%) 11.8% 15.9% 14.3%
CONSENSUS (cps) 7.9 9.1 10.2 11.3
Delta (%) 2.7% 6.2% 8.9%
DPS_TOTAL Wilson HTM (cps) 4.2 4.8 5.3 5.8
Growth (%) 13.1% 10.5% 9.5%
CONSENSUS (cps) 4.2 5.0 5.6 6.2
Delta (%) -4.8% -6.2% -7.7%
07 October 2015
Retailing
Beacon Lighting Group Limited
Wilson HTM Equities Research – Beacon Lighting Group Limited 21
Sector overview
The domestic lamp and lighting segment in Australia (excluding hardware) is estimated to
have generated revenue of $748m during CY14, and is forecast to grow at an annual rate of
0.7% for the five years ending FY20 (IBISWorld, Domestic Appliance Retailing in Australia,
May 2015).
This sector is primarily within the home furnishing sub-sector and includes those retailers
selling lighting fixtures (ie ceiling lights and chandeliers), in addition to light bulbs and globes.
More importantly, the sector excludes department stores and large format hardware stores,
both of which also sell a range of light fixtures.
Table 9: Barriers to entry
Barriers to entry Level
Competition High
Concentration Low
Life cycle stage Mature
Capital intensity Medium
Technology change Medium
Regulation and policy Heavy
Industry association Low
Source: IBIS World (May 2015)
Chart 22: Lamp and lighting store revenues ($m) Chart 23: Lamp and lighting store stores (qty)
Source: IBIS World Source: IBIS World
Expenditure on lamps and lighting is primarily driven by capital expenditure on private
dwellings, which is driven by, among other things, asset price inflation and consumer
sentiment (discretionary consumption).
The household goods sectors of electrical goods, furniture and hardware appear to be
experiencing halcyon days, having registered 8.5% growth for the year ended Jul-15.
We link the strength of the household good sector primarily to wealth effects arising from
asset price inflation (rising house prices). While the good times continue to roll on, a time will
inevitable come where discretionary consumption declines, which will adversely impact retail,
but particular these more discretionary areas.
-6%
-4%
-2%
0%
2%
4%
6%
620
640
660
680
700
720
740
760
780
800
CY
05a
CY
07a
CY
09a
CY
11a
CY
13a
CY
15f
CY
17f
CY
19f
YoY ChgA$m
Revenue % chg
-3%
-2%
-1%
0%
1%
2%
3%
4%
5%
1,500
1,600
1,700
1,800
1,900
2,000
2,100
CY
05a
CY
07a
CY
09a
CY
11a
CY
13a
CY
15f
CY
17f
CY
19f
YoY ChgQty
Establishments % chg
07 October 2015
Retailing
Beacon Lighting Group Limited
Wilson HTM Equities Research – Beacon Lighting Group Limited 22
Retail sales
The household goods sector achieved excellent growth through FY15. During the year
the electrical good segment increased 8.5%, while furniture, floor coverings and
housewares increased 8.6%. Both of the segments performed well above trend growth
and substantially above overall retail sales, which grew 4.8%.
The strength in retail sales growth remains in relative contrast to nominal GDP which has
grown at the benign rate of 2.2% over the past 12 months. It appears that domestic
consumption and investment continue to offset diminishing government expenditure,
business investments and net exports.
Chart 24: Electrical and electronic goods retailing value
Source: ABS, 8501.0 Retail Trade, Australia
Chart 25: Furniture, floor coverings and housewares
Source: ABS, 8501.0 Retail Trade, Australia
Over the past 12 months, house prices across Australian capital cities have increased
10.6%, with apartment values increasing 7.4%. With Sydney houses prices up 18.6%
during the period (apartments up 12.7%), we believe a proportion of current retail
spending, particularly in the home segment, is a direct impact of the wealth effects
flowing from recent asset price inflation.
-0.6%
0.7%
8.5%
-4.9%
-1.7%
0.8%
-15.0%
-10.0%
-5.0%
0%
5.0%
10.0%
15.0%
YoY Change % Jul-15: 8.8%
Jul-14: -1.1%
4.0%
4.3%
1.9%
-3.4%
4.8%
8.6%
-10.0%
-5.0%
0%
5.0%
10.0%
15.0%
YoY Change % Jul-15: 9.4%
Jul-14: 9.5%
07 October 2015
Retailing
Beacon Lighting Group Limited
Wilson HTM Equities Research – Beacon Lighting Group Limited 23
Macro drivers
Lamp and lighting sales in Australia are driven by the following macro themes:
Capital expenditure on private dwellings (renovations): Housing renovation spend is
forecast by the Housing Industry Association (HIA) to improve 4.6% in FY16. New South
Wales is set to be a key beneficiary, with forecast growth of 8.0%.
Renovations (ie retail) represents 70% of Beacons business and as such renovation
spending remains a critical factor in maintaining the strong like-for-like sales growth
Domestic dwelling construction (new homes): At a national level, residential housing
construction is forecast by the HIA to be flat through FY16. That said, the HIA expect
New South Wales to be the strongest state, where new dwelling construction growth for
FY16 is forecast to be +14.9%.
New dwelling construction (ie trade sales) represents approximately 30% of Beacon’s
business. Management have suggested that it can take five to six years for a store to
mature, with the slow maturity profile driven by the time it takes to build up a trade
business.
Bottom line: We see rising house prices as a primary driver of sales within the household
goods sector. Should the residential real estate market falter, this could leave these
Chart 29: Real household disposable income Chart 30: Consumer sentiment
Source: Reserve Bank of Australia (Gross Domestic Product and Income - H1) Source: ANZ Roy Morgan Survey (Sept-15)
Micro drivers
Technological innovation: The lighting industry is experiencing a change in
technology. A need for greater energy efficiency is driving development of LED (light
emitting diodes) technology. Still in the early stages of development, this represents a
significant opportunity for Beacon as more people switch to LED to save on power.
LED already represents a significant portion of Beacon’s sales, with the category
growing in excess of 100% in the year prior to the IPO.
Design trends: We believe that the increased focus on “design elements” within
dwelling renovations is a clear benefit for Beacon. In the Jun-15 prospectus of Adairs (ADH), a homewares retailer, it outlined the typical customer. In many respects this customer profile reflects the key trends which we believe will continue to assist Beacon.
“She increasingly regards her home decoration and design as a matter of social interest with her family and friends. She has often moved beyond shopping in the category for her functional needs (eg a towel for drying herself/her family) and has extended the criteria of her purchasing decisions to styling and design elements (eg a towel for drying and decoration purposes).”
Competitive landscape
Lighting and ceiling fan products can be purchased from a number of sales channels,
including specialty lighting stores, hardware stores, electrical wholesalers, furniture stores
and online. Each of these channels tends to focus on different market segments but with a
degree of crossover.
Hardware stores such as Bunnings, Masters and Mitre 10 offer lighting within their stores.
Beacon differentiates itself from these competitors by offering unique and exclusive lines,
expert service and advice and the latest lighting technology.
-3
0
3
6
9
12
15
0
50,000
100,000
150,000
200,000
250,000
300,000
Mar 00 Mar 02 Mar 04 Mar 06 Mar 08 Mar 10 Mar 12 Mar 14
% chgA$m
Real household disposable income Year-ended change
111.7
95.7
80
90
100
110
120
130
140
Jan 00 Jan 02 Jan 04 Jan 06 Jan 08 Jan 10 Jan 12 Jan 14
IndexANZ-Roy Morgan (qtr rolling ave.)Westpac-Melb. Institute (qtr rolling ave.)ANZ-Roy Morgan (ave.)Westpac-Melb. Institute (ave.)
07 October 2015
Retailing
Beacon Lighting Group Limited
Wilson HTM Equities Research – Beacon Lighting Group Limited 25
In Australia and New Zealand, lamps and lighting products are sold through various retailers
including:
Boutique lighting stores (location-specific) – see Chart 31
Department stores – Myer and David Jones
Hardware stores – Bunnings, Masters
Online pure-play retailers – Appliances Online, Amazon, eBay and Kogan
The industry is highly fragmented, with IBIS World estimating Beacon’s dominant market
share at 20%.
Chart 31: Competitors
Source: Company data (Prospectus Apr-14, updated for new BLX stores)
Primary Secondary Online
Lighting International (5)
Vouge Lighting (5)
Home of Lights (5)
Andrews Lights Up (4)
De Lights (4)
Lights For You (4)
Lightstyle (3)
The Light Factory (4)
Cosmo Lights (3)
Lighting Illusions (3)
Eurolight (3)
Australian Lighting (3)
Bunnings
Masters
Mitre 10
eBay
80
5 5 5 4 4 4 4 3 3 3 3 3
114
0
10
20
30
40
50
60
70
80
90
100
Be
aco
n L
igh
ting
Lig
htin
gIn
tern
atio
nal
Vo
uge
Lig
htin
g
Ho
me O
f Lig
hts
An
dre
ws L
ights
Up
De
Lig
hts
Lig
hts
For Y
ou
Th
e L
igh
t Fa
cto
ry
Co
sm
o L
ights
Lig
htin
g Illu
sio
ns
Eu
rolig
ht
Au
stra
lian L
ightin
g
Lig
hts
tyle
Stores
Commercial sales offices
Franchised beacon lighting retail stores
Company owned beacon lighting retail stores
07 October 2015
Retailing
Beacon Lighting Group Limited
Wilson HTM Equities Research – Beacon Lighting Group Limited 26
Business overview
Summary of business
Beacon is Australia’s largest specialist retailer of lighting, ceiling fans and light globes with 80
owned stores, 11 franchised stores and 4 commercial sales offices. Many of the products
offered are exclusive to Beacon and encompass both fashion and design elements pursuing
the latest technology for energy efficiency.
Business model
Beacon is a vertically integrated business which develops, designs, sources, imports,
distributes, merchandises and sells lighting, ceiling fans and light globes.
More than 90% of the products supplied to company stores are through the company’s
wholesale supply chain consisting of a central warehouse operation in Melbourne and third
party warehouse operations in Sydney, Brisbane, Perth and China. Approximately 80% are
exclusively branded.
Key attributes of the Beacon Lighting business model
Australia’s largest retail lighting specialist.
A strong financial position with minimal debt and solid cash flow.
A proven retail model capable of being rolled out further.
A vertically integrated business of importing, distribution and retail.
A well-recognised brand name which also appeals to landlords.
Exclusively designed and manufactured products.
A stable and experienced senior management team.
Multiple sales channels including retail stores, trade, wholesale and online.
Lines of business
Source: Company prospectus
07 October 2015
Retailing
Beacon Lighting Group Limited
Wilson HTM Equities Research – Beacon Lighting Group Limited 27
Figure 1: Light small pendant Figure 2: Fan and light Figure 3: Dome pendant
Source: Company photos Source: Company photos Source: Company photos
Store locations
Currently, Beacon has 84 company-operated stores and 11 franchised stores.
Beacon’s stores operate profitably under a variety of sizes currently ranging from approximately 300
sq m to 1,200sq m. The average store size is 738 sq m.
All stores are leased and located in high traffic homemaker centres or prominent free-standing sites
with complementary retailers nearby. Population base and geographic catchment area for each
store varies.
The commercial sales offices are located in Melbourne, Brisbane, Sydney and Perth. The store
network is supported with a store support centre based in Mulgrave (Victoria) and a warehouse and
office complex at Derrimut (Victoria).
Figure 4: Store network
Source: Company prospectus (Apr-14)
07 October 2015
Retailing
Beacon Lighting Group Limited
Wilson HTM Equities Research – Beacon Lighting Group Limited 28
Figure 5: Business chronology
Source: Company prospectus
Summary of the Apr-14 IPO process
Beacon was listed on the ASX in Apr-14. Under the IPO 45% of the total number of
shares (post-listing) were offered at $0.66/sh.
Based on the offer price ($0.66/sh), the stock was offered at a FY14 pro forma PE of
12.4x and an annualised dividend yield of 4.24%.
The proceeds of the IPO were used to buy out an existing investor who was selling their
45% share.
Share escrow
Under the terms of the prospectus, The Robinson family company Heystead with a 55%
holding agreed to a two year voluntary escrow.
The escrow arrangements do not preclude Heystead from participating in a takeover
where:
- the takeover bid is for all of the Shares;
- holders of at least half of the Shares that are not subject to restriction to which the
takeover bid relates have accepted; and
- if the takeover bid is conditional, Heystead agrees in writing that a holding lock will
be re-applied to each Share that is subject to the voluntary escrow arrangements
that is not unconditionally bought by the bidder under the takeover bid.
Additionally, these Shares may be transferred or cancelled in accordance with a merger
by way of scheme of arrangement under the Corporations Act.
The escrow release date is approximately April 2016.
07 October 2015
Retailing
Beacon Lighting Group Limited
Wilson HTM Equities Research – Beacon Lighting Group Limited 29
Appendix A: Board, management and substantials
Board
Ian Robinson (Executive Chairman)
(James) Eric Barr (Deputy Chairman, Non-Executive Director, Independent Director)
Glen Robinson (Chief Executive Officer)
Neil Osborne (Non-Executive Director, Independent Director)
Management
Ian Bunnett (Managing Director – Retail)
David Speirs (Chief Financial Officer)
Barry Martens (Chief Operating Officer)
Elizabeth Mikkelsen (Group Human Resources Manager)
Prue Robinson (Group Marketing Manager)
Michael (Mick) Tan (Chief Information Officer)
Rodney Brown (National Distribution Manager)
Tracey Hutchinson (Finance Manager and Company Secretary)
Table 10: Substantial holders
Shareholder % held
Heystead Nominees Pty Ltd (including Robinson Family members) 55.17%
Commonwealth Bank of Australia 5.08%
Source: Company accounts
07 October 2015
Retailing
Beacon Lighting Group Limited
Wilson HTM Equities Research – Beacon Lighting Group Limited 30
Beacon Lighting Group Limited (BLX)
BUSINESS DESCRIPTION
Beacon Lighting Group Limited (BLX) is Australia’s largest specialist retailer of lighting, ceiling fans and light globes with 80 owned stores, 11
franchised stores and 4 commercial sales offices. Many of the products offered are exclusive to Beacon and encompass both fashion and design
elements pursuing the latest technology for energy efficiency.
INVESTMENT THESIS
There is no doubt that Beacon is a quality business. We like the fact Beacon develops, designs, sources, imports, distributes, merchandises and
sells – this level of vertical integration is a key positive.
We see Beacon as capable to delivering EPS of more than 10% pa through the medium term and this compares favourably to the competitive set.
We see the growth coming through strong like-for-like sales, plus the store roll-out program which could see an additional six stores per year
added to the existing network of 95.
Despite the virtuous characteristics of Beacon, the stock appears fair value – hence our HOLD recommendation.
REVENUE DRIVERS BALANCE SHEET
New store roll-out: Beacon plans to open approximately six
stores per year for the foreseeable future.
New products and ranges: Beacon Lighting currently offers an
extensive range of products with fashion and energy efficiency
features. Energy efficiency and technology continue to drive
change, with Beacon having further scope to improve the
breadth and depth of the range.
Technology change: The lighting industry is experiencing rapid
change in technology. A need for greater energy efficiency is
driving development of LED (light emitting diodes) technology.
Acquisitions: Beacon intends to pursue business acquisitions,
locally or internationally that complements the core business
activities or leverage off existing business activities.
Cash: $15.2m
Assets: $103.6m
Borrowings: $19.4m
Net assets: $58.8m
Net debt: $4.2m
Metrics
Net debt/equity: 0.2x
Net debt/assets: 0.1x
Net debt/EBITDA: 0.3x
EBITDA/net interest: 22.3x
As at Jun-15
MARGIN DRIVERS BOARD
Product mix: The business sells a number of products,
including lighting, ceiling fans and light globes.
Private label mix: The majority of the company’s product ranges
are marketed under the well-established product brand, Lucci,
which is owned by the company and is a registered trademark.
Ian Robinson (Executive Chairman)
(James) Eric Barr (Deputy Chairman, Non-Executive Director,
Independent Director)
Glen Robinson (Chief Executive Officer)
Neil Osborne (Non-Executive Director, Independent Director)
KEY ISSUES/CATALYSTS MANAGEMENT
The forecast EPS is top quartile across comparable companies.
However, with the stock trading at 19.3x FY16 EPS, the growth
doesn’t come cheaply.
The current FY16 PE of 19.3x reflects a PEG ratio of 1.2x – this
is mid-range when compared with comparable companies.
While the growth profile for the business is strong, based on the
current share price and our earnings forecast, the stock would
still be trading at 13.0x FY19 EPS.
Ian Bunnett (Managing Director – Retail)
David Speirs (Chief Financial Officer)
Barry Martens (Chief Operating Officer)
Elizabeth Mikkelsen (Group Human Resources Manager)
Prue Robinson (Group Marketing Manager)
Michael (Mick) Tan (Chief Information Officer)
Rodney Brown (National Distribution Manager)
Tracey Hutchinson (Finance Manager and Company Secretary)
RISK TO VIEW CONTACT DETAILS
Beacon has been recording exceptionally strong like-for-like
sales growth, along with the broader homewares categories.
We believe a proportion of current retail spending, particularly in
the home segment, is a direct impact of the wealth effects
flowing from recent house price inflation. Were this trend to
unwind, then the business could be adversely impacted.
Address: 5 Bastow Place, Mulgrave, VIC 3170;
PO Box 108, Mount Waverley, VIC 3149
Phone: +61 3 8561 1555
Website: www.beaconlightinggroup.com.au
07 October 2015
Retailing
Beacon Lighting Group Limited
Wilson HTM Equities Research – Beacon Lighting Group Limited 31
Disclosures and disclaimers
Recommendation structure and other definitions
Definitions at http://www.wilsonhtm.com.au/Disclosures
Disclaimer
While Wilson HTM Ltd believes the information contained in this communication is based on reliable information, no warranty is given as to its
accuracy and persons relying on this information do so at their own risk. To the extent permitted by law Wilson HTM Ltd disclaims all liability to any
person relying on the information contained in this communication in respect of any loss or damage (including consequential loss or damage)
however caused, which may be suffered or arise directly or indirectly in respect of such information. Any projections contained in this
communication are estimates only. Such projections are subject to market influences and contingent upon matters outside the control of Wilson
HTM Ltd and therefore may not be realised in the future.
The advice contained in this document is general advice. It has been prepared without taking account of any person’s objectives, financial situation
or needs and because of that, any person should, before acting on the advice, consider the appropriateness of the advice, having regard to the
client’s objectives, financial situation and needs. Those acting upon such information without first consulting one of Wilson HTM Ltd investment
advisors do so entirely at their own risk. This report does not constitute an offer or invitation to purchase any securities and should not be relied
upon in connection with any contract or commitment whatsoever. If the advice relates to the acquisition, or possible acquisition, of a particular
financial product – the client should obtain a Product Disclosure Statement relating to the product and consider the Statement before making any
decision about whether to acquire the product. This communication is not to be disclosed in whole or part or used by any other party without Wilson
HTM Ltd’s prior written consent.
Disclosure of interest. Beacon Lighting Group Limited
The Directors of Wilson HTM Ltd advise that at the date of this report they and their associates have relevant interests in Beacon Lighting Group
Limited. They also advise that Wilson HTM Ltd and Wilson HTM Corporate Finance Ltd A.B.N. 65 057 547 323 and their associates have received
and may receive commissions or fees from Beacon Lighting Group Limited in relation to advice or dealings in securities. Some or all of Wilson HTM
Ltd authorised representatives may be remunerated wholly or partly by way of commission.
In producing research reports, members of Wilson HTM Ltd Research may attend site visits and other meetings hosted by the issuers the subject of
its research reports. In some instances the costs of such site visits or meetings may be met in part or in whole by the issuers concerned if Wilson
HTM Ltd considers it is appropriate and reasonable in the specific circumstances relating to the site visit or meeting.
Please see disclosures at http://www.wilsonhtm.com.au/Disclosures. Disclosures applicable to companies included in this report can be found in the
latest relevant published research.
Regulatory disclosures
This report was prepared solely by Wilson HTM. ASX did not prepare any part of the report and has not contributed in any way to its content. The
role of ASX in relation to the preparation of the research reports is limited to funding their preparation, by Wilson HTM, in accordance with the ASX
Equity Research Scheme. ASX does not provide financial product advice. The views expressed in this research report may not necessarily reflect
the views of ASX. To the maximum extent permitted by law, no representation, warranty or undertaking, express or implied, is made and no
responsibility or liability is accepted by ASX as to the adequacy, accuracy, completeness or reasonableness of the research reports.