170 BEAM DIAGNOSTICS SPECIAL PRODUCTS OEM DETECTORS THZ DETECTORS PHOTO DETECTORS HIGH POWER DETECTORS POWER DETECTORS ENERGY DETECTORS MONITORS BEAM DIAGNOSTICS PRESENTATION PRODUCTS M 2 MEASUREMENT The M 2 factor, which is unitless, can be considered as a quantitative indicator of beam quality or beam variation when compared to an ideal Gaussian beam of the same wavelength. The Beamage-M2 module is an innovative product that performs real-time monitoring of the M 2 factor of your laser beam. It has a compact assembly and a modular design that allow you to remove the Beamage-3.0 Beam Profiling Camera and to use it separately. Its calculations are ISO compliant. MAIN SPECIFICATIONS M 2 Measurement Real-time with no moving parts Wavelength Range 325 nm – 1100 nm Built-in attenuation OD4 (Fabry-Perot optics) Additional attenuation At the user’s choice (Up to OD9) Maximum Average Power 1W (CW) Minimum Lens Focal Length 110 mm BEAM PROFILING Profiling a laser beam is a convenient complement to the measurement of its power or energy because it provides very useful additional information, like spatial energy or intensity distribution, beam widths, centroid, ellipticity and orientation, that may help you determine if your laser-based systems are operating optimally. The Beamage-3.0 is the most cost-effective USB3.0 Beam Profiling Camera on the market. It comes with an intuitive and complete software that features an array of useful tools and functions. Its calculations are ISO compliant. MAIN SPECIFICATIONS Wavelength Range 350 nm - 1150 nm Maximum Average Power 1 W (CW) with ND4.0 filter Sensor Size 11.3 mm x 6.0 mm (2.2 MPixels) USB3.0 Up to 15 fps (half resolution, 1.1 MPixels) IF YOUR LASER SPECIFICATIONS EXCEED THE LIMITS IN TERMS OF WAVELENGTH LASER POWER BEAM SIZE YOU CAN MANAGE THEM WITH ACCESSORIES PRESENTED ON THE NEXT PAGE. See page 178 See page 172
Transcript
170
BEAM
DIA
GNOS
TICS
SPEC
IAL
PROD
UCTS
OEM
DET
ECTO
RSTH
Z DE
TECT
ORS
PHOT
O DE
TECT
ORS
HIGH
POW
ER D
ETEC
TORS
POW
ER D
ETEC
TORS
ENER
GY D
ETEC
TORS
MON
ITOR
SB E A M D I A G N O S T I C S
P R E S E N T A T I O NPRODUCTS
M2 MEASUREMENT
The M2 factor, which is unitless, can be considered as a quantitative indicator of beam quality or beam variation when compared to an ideal Gaussian beam of the same wavelength.
The Beamage-M2 module is an innovative product that performs real-time monitoring of the M2 factor of your laser beam. It has a compact assembly and a modular design that allow you to remove the Beamage-3.0 Beam Profiling Camera and to use it separately. Its calculations are ISO compliant.
MAIN SPECIFICATIONS
M2 Measurement Real-time with no moving partsWavelength Range 325 nm – 1100 nmBuilt-in attenuation OD4 (Fabry-Perot optics)
Additional attenuation At the user’s choice (Up to OD9)
Maximum Average Power 1W (CW)
Minimum Lens Focal Length 110 mm
BEAM PROFILING
Profiling a laser beam is a convenient complement to the measurement of its power or energy because it provides very useful additional information, like spatial energy or intensity distribution, beam widths, centroid, ellipticity and orientation, that may help you determine if your laser-based systems are operating optimally.
The Beamage-3.0 is the most cost-effective USB3.0 Beam Profiling Camera on the market. It comes with an intuitive and complete software that features an array of useful tools and functions. Its calculations are ISO compliant.
MAIN SPECIFICATIONS
Wavelength Range 350 nm - 1150 nmMaximum Average Power 1 W (CW) with ND4.0 filterSensor Size 11.3 mm x 6.0 mm (2.2 MPixels)
USB3.0 Up to 15 fps (half resolution, 1.1 MPixels)
IF YOUR LASER SPECIFICATIONS EXCEED THE LIMITS IN TERMS OF WAVELENGTH LASER POWER BEAM SIZE
YOU CAN MANAGE THEM WITH ACCESSORIES PRESENTED ON THE NEXT PAGE.
See page 178
See page 172
171Catalogue 2014_V2.0
BEAM DIAGN
OSTICSSPECIAL PRODUCTS
OEM DETECTORS
THZ DETECTORS
PHOTO DETECTORS
HIGH POWER DETECTORS
POWER DETECTORS
ENERGY DETECTORS
MON
ITORSP R E S E N T A T I O N
A simple solution is offered to those who need to profile beams that are larger than the CMOS sensor (> 11.3 mm x 6.0 mm). This solution is a beam reducing optical component called Camera Lens. It works by indirectly imaging the reflection or transmission of the beam after it has passed through a diffusing element.
CMOS sensors have low saturation levels as well as low damage thresholds. It is thus very important that you control your laser power to get the best measurement possible and avoid damaging the Beamage-3.0 camera.
Since CMOS sensors are not sensitive to every frequency of the electromagnetic spectrum, we offer several wavelength management solutions to enhance the capabilities of the Beamage-3.0 Beam Profiling Camera.
P R E S E N T A T I O NACCESSORIES
UV Visible IR
Beamage-3.0(no accessories needed)
Beamage-3.0+
UV Converter
Beamage-3.0+
IR Adaptoror
Beamage-3.0-IR
350 nmX-Rays (1495 nm - 1595 nm)
1150 nm
UP TO 1 WND, UV and IR
FiltersVariable
Attenuator
1 W TO 40 WBeam Splitter
CubeBeam Sampler
40 W TO 5000 W*High Power Attenuators
500 W AND 5000 W STACKABLE TO MAINTAIN POLARIZATION
MANAGE THE WAVELENGTH
MANAGE THE LASER POWER
MANAGE THE BEAM SIZE
See page 183
See page 184
See page 187
Laser
Diffuser
Image ofthe Beam
Beamage-3.0
Sensor Plane
Camera LensBeamage-3.0
SensorPlane
Image ofthe Beam
Camera LensLaser
Diffuser
* Available in april 2014
T 418.651.8003 1888 5GENTEC F 418.651.1174 www.gentec-eo.com [email protected]
15 fps @ 1.1 MPixels (2048 x 544)32 fps @ 0.066 MPixels (256 x 256)
RMS Noise 1000:1 (60 dB)ADC Level (User Setable) 12 bit (default) / 10 bit (option)M2 Measurement In Real-Time, no moving parts, with the Beamage-M2 Module (see page 178)
DAMAGE THRESHOLDS aMaximum Average Power 1 WSaturation Level (1064 nm) CW: 10 W/cm2 ; Pulsed: 300 μJ/cm2
SOFTWAREDisplays 2D, 3D, XY and Beam TrackingDisplay Features 2D: Print Screen, Reset View, Show/Hide Beam Diameter
3D: Print Screen, Reset View, Top ViewXY: Save Data, Zoom, Gaussian Fit, Semi-Log, Show/Hide Cursor, Show/Hide FWHM, Show/Hide 1/e2
Beam Tracking: Save Data, Print Screen, Reset View, Zoom
Beam Diameter Definitions D4σ (ISO compliant)1/e2 along crosshairs (13.5%)FWHM along crosshairs (50%)86% effective diameter (D86)
Buffer Controls Open File, Save Current Data, Save All Data, Previous/Next Image, Clear Buffer, Animate
Printing and Reports Full Report in Print Ready Format (2D, 3D, XY, Measures, Parameters)Print Screen in BMP format (2D and 3D)
PHYSICAL CHARACTERISTICSSensor Size 11.3 x 6.0 mmSensor Area 0.67 cm2
Dimensions (not including filter) 61H x 81.1W x 19.7D mmWeight (head only) 138 g
ORDERING INFORMATIONProduct Name Beamage-3.0 Beamage-3.0-IR Product Number 201939 202360
A C C E S S O R I E S
Pelican Carrying CaseUV Converters &IR Adaptors
Stand with Delrin Post(Model Number: 200428)
UV and IR Filters
BDA-A-VAR, BDA-S-10-UV/IRBeam Splitters and Attenuators
The 3D display shows the actual shape of the beam. It is possible to easily zoom, pan and rotate the image. The very useful Reset button allows to put the data back in its original configuration. This display also features a Print Screen button to save the latest image in BMP format.
2 D D I S P L A Y
The 2D display features the crosshairs (set to the major and minor axis or along specified angles) and the measured diameters of the beam. These diameters vary with the chosen definition (4-sigma, FWHM, 1/e2, etc.) and the display can be turned ON or OFF. The Print Screen button allows to save a picture of the current screen in BMP format.
BEAMAGE-3.0 BEAMAGE-3.0
X Y D I S P L A Y
The XY display plots cross-sectional graphs of the beam along the crosshairs. This display features many useful tools like zoom, cursor, and FWHM and 1/e2 level bars. It is also possible to display the graphs in semi-log format to enhance the details in the low intensity parts of the beam.
B E A M T R A C K I N G D I S P L A Y
The Beam Tracking Display allows the user to visualize the variation of the beam’s centroid position on the sensor. This display shows the latest calculated position as well as the previous ones, until the user resets the view. The display also shows the mean position of all computed values and gives information regarding position stability for both X and Y axes. This tool is great to monitor the beam pointing stability over time.
Show/HideDiameter
Top View
Print ScreenSelect Active Area
Print Screen
Print Screen
Reset View
Reset View
Reset View
Save Data
Save Data
Zoom
Zoom
Semi-Log Graph
Show/Hide Cursor
I N T U I T I V E S O F T W A R E I N T E R F A C E 3 D , 2 D A N D X Y D I S P L A Y S
Gaussian Fit
Show/HideFWHM
Show/Hide1/e2
Pick Origin Point
Capture Controls:Start/Stop,
Subtract Background
File Controls:Save and
Open DataBuffer Controls:
View Data OfflineData
ComputationSoftware
Info
Displays:3D, 2D, XY Graphs and Beam Tracking
Display Controls:Print, Refresh,
Zoom, etc.
Home and Setup Tabs:Set your capture parameters and get the resulting measures
M A I N C O N T R O L S
The upper part of the software includes all the main controls in a ribbon format. These controls are grouped by family: Capture Controls, File Controls, Buffer Controls, M2 Controls and Data Computations. The last includes very useful filters and a normalizing function.
D I S P L A Y S
The left-hand side of the software is the display panel. Four displays are available: 3D, 2D, XY (cross-sectional graphs along the crosshairs) and Beam Tracking. The desired display is selected by clicking on the corresponding icon at the bottom of the panel. Print screen controls are available for the 3D, 2D and Beam Tracking displays. They allow the user to save an image of the current view in BMP format.
H O M E A N D S E T U P T A B S
The right-hand side of the software contains the Home, Setup and Data Acquisition tabs. The Home tab allows the user to select the main controls for his measurements (Beam Diameter Definition, Crosshair Center and Orientation) and displays the resulting measurements below. The Setup tab allows the user to set the measurement parameters (Exposure Time, Image Orientation and Averaging, Active Area, etc.) and the Data Acquisition tab allows the user to save measurements or measurements and full images, to enter the Sampling Rates and a Total Duration for the Acquisition. More tabs with advanced controls are available when clicking on the Show/Hide Options button in the Computations panel.
Diameter
Crosshairs
B E A M P R O F I L I N G C A M E R A S
T 418.651.8003 1888 5GENTEC F 418.651.1174 www.gentec-eo.com [email protected]
A C T I V E A R E A ( R O I )Increase the data transfer rate by reducing the area of the sensor that is scanned. This tool is perfect for small beams that don’t need the full sensor area.
P I X E L A D D R E S S I N GIncrease the data tranfer rate by using larger pixels or by reducing the number of pixels. This is great for large beams that don’t need the full resolution.
F I L T E R S
Filter out the noise in your beam profile by using one of the filter functions. The Beamage-3.0 has both smoothing and despeckle filters. The Smoothing filter is a soft noise reduction method whereas the Despeckle filter is a much more aggressive spatial filter that is designed to remove speckles and noisy signals from very poor quality beam profiles. Instead of performing a 3x3 pixel smoothing filter with a relative weight of 20% for the central pixel and 10% for the others, the software performs a 9x9 pixels simple averaging, with all pixels having the same relative weight (1/81). The filter can be found in the Filters menu of the main controls.
BEAMAGE-3.0 BEAMAGE-3.0
OFF ON
Full Resolution
Average2x2
Decimate2x2
M A I N F U N C T I O N S M A I N F U N C T I O N S
S U B T R A C T B A C K G R O U N DThe background subtraction function is a necessary tool to have an accurate measurement and to abide by the ISO 11146-3:2004 standards. By taking 10 images and averaging them pixel by pixel to compute the average background map, contamination of all images can be avoided with the help of environment noise subtraction.
A N I M A T EGive life to your measures with the animate function. With as much as 32 images temporarily saved in the buffer, simply pressing the animation button will create a movie with any display (2D, 3D and XY). This allows to visualize the beam while working offline and to have a recalculation process if the beam diameter definition or crosshair parameters are changed.
M U L T I P L E C A M E R A SIt is possible to use multiple Beamage-3.0 cameras on one computer simultaneously. By running multiple PC-Beamage-3.0 instances and selecting the desired camera for each one, the user will be able to stream multiple cameras simultaneously, thus effectively monitoring all the beams and easily switching from one to another.
N O R M A L I Z EThe normalize function spreads the intensity over the full range (0% to 100%). This is especially useful with low level signals or to enhance the variations in the beam.
T R I G G E RFor the case of pulsed laser sources, the trigger function will be useful to synchronize the system’s capture rate with the source’s repetition rate, especially when this one is low (<16 Hz). To be achieved, a TTL (0-5 V) or other (1.1-24 V) trigger signal can be connected to the Beamage-3.0 camera via a BNC or SMA plug.
I M A G E A V E R A G I N GThe image averaging function uses a temporal filter that captures 2, 5 or as much as 10 images of the beam to create a single time-averaged image with them. This process will smooth the beam fluctuations that can occur over time when working with unstable laser sources.
Divergence (θ)
Focal Length (l)
CMOSSensor
Focus Lens
LaserSource
ON
OFF
D I V E R G E N C E
The Divergence of a beam is defined as the increase in beam radius with propagation from the optical aperture. For most applications, a lower-divergence beam is preferable. Using the new Divergence tab in the PC-Beamage-3.0 application, this parameter can now be computed for both mains axes (X, Y) according to the ISO 11146-1:2005 and 11146-2:2005 standards. A focal lens with a known focal lenght is required for the measurement of the divergence.
A C Q U I S I T I O N
In the Acquisition tab, the user can define a total duration for the acquisition and can specify a name and a path for his saved files. The user can either choose to save measurements only or both measurements and full images. It is possible to save the data shown in the measure tab in a *TXT file, which includes a header that displays the custom acquisition settings above the data. Each line corresponds to a single frame. This file can be opened in a spreadsheet software such as Microsoft Excel. It is also possible to save the images associated with the measurements from the *.TXT logging file. Each image will be individually saved in a native *.BMG file. For measurements, it is possible to choose a sampling rate for the saved data. Similarly, for the full images, one can manually set a temporal interval at which the software will save the data. With these tools, the user will be able to store only the information that is useful to his work.
R E L A T I V E P O S I T I O N
In the “Relative Position” tab, the “Setup” section allows the user to select the parameter that will be considered as the origin position (0,0). “Centroid” (center of energy) and “Peak” (highest measured value) are the options. The “User Define” option allows the user to manually enter origin position values for both axes. It is also possible to position the origin by simply clicking with the mouse in the display. Once the origin position is determined by the user, the software calculates the difference between the coordinates of this new position and the latest computed one. The results are displayed in the “Measures” section. It is possible to save the data in the acquisition file if desired.
177Catalogue 2014_V2.0
BEAM DIAGN
OSTICSSPECIAL PRODUCTS
OEM DETECTORS
THZ DETECTORS
PHOTO DETECTORS
HIGH POWER DETECTORS
POWER DETECTORS
ENERGY DETECTORS
MON
ITORS
A C T I V E A R E A ( R O I )Increase the data transfer rate by reducing the area of the sensor that is scanned. This tool is perfect for small beams that don’t need the full sensor area.
P I X E L A D D R E S S I N GIncrease the data tranfer rate by using larger pixels or by reducing the number of pixels. This is great for large beams that don’t need the full resolution.
F I L T E R S
Filter out the noise in your beam profile by using one of the filter functions. The Beamage-3.0 has both smoothing and despeckle filters. The Smoothing filter is a soft noise reduction method whereas the Despeckle filter is a much more aggressive spatial filter that is designed to remove speckles and noisy signals from very poor quality beam profiles. Instead of performing a 3x3 pixel smoothing filter with a relative weight of 20% for the central pixel and 10% for the others, the software performs a 9x9 pixels simple averaging, with all pixels having the same relative weight (1/81). The filter can be found in the Filters menu of the main controls.
BEAMAGE-3.0 BEAMAGE-3.0
OFF ON
Full Resolution
Average2x2
Decimate2x2
M A I N F U N C T I O N S M A I N F U N C T I O N S
S U B T R A C T B A C K G R O U N DThe background subtraction function is a necessary tool to have an accurate measurement and to abide by the ISO 11146-3:2004 standards. By taking 10 images and averaging them pixel by pixel to compute the average background map, contamination of all images can be avoided with the help of environment noise subtraction.
A N I M A T EGive life to your measures with the animate function. With as much as 32 images temporarily saved in the buffer, simply pressing the animation button will create a movie with any display (2D, 3D and XY). This allows to visualize the beam while working offline and to have a recalculation process if the beam diameter definition or crosshair parameters are changed.
M U L T I P L E C A M E R A SIt is possible to use multiple Beamage-3.0 cameras on one computer simultaneously. By running multiple PC-Beamage-3.0 instances and selecting the desired camera for each one, the user will be able to stream multiple cameras simultaneously, thus effectively monitoring all the beams and easily switching from one to another.
N O R M A L I Z EThe normalize function spreads the intensity over the full range (0% to 100%). This is especially useful with low level signals or to enhance the variations in the beam.
T R I G G E RFor the case of pulsed laser sources, the trigger function will be useful to synchronize the system’s capture rate with the source’s repetition rate, especially when this one is low (<16 Hz). To be achieved, a TTL (0-5 V) or other (1.1-24 V) trigger signal can be connected to the Beamage-3.0 camera via a BNC or SMA plug.
I M A G E A V E R A G I N GThe image averaging function uses a temporal filter that captures 2, 5 or as much as 10 images of the beam to create a single time-averaged image with them. This process will smooth the beam fluctuations that can occur over time when working with unstable laser sources.
Divergence (θ)
Focal Length (l)
CMOSSensor
Focus Lens
LaserSource
ON
OFF
D I V E R G E N C E
The Divergence of a beam is defined as the increase in beam radius with propagation from the optical aperture. For most applications, a lower-divergence beam is preferable. Using the new Divergence tab in the PC-Beamage-3.0 application, this parameter can now be computed for both mains axes (X, Y) according to the ISO 11146-1:2005 and 11146-2:2005 standards. A focal lens with a known focal lenght is required for the measurement of the divergence.
A C Q U I S I T I O N
In the Acquisition tab, the user can define a total duration for the acquisition and can specify a name and a path for his saved files. The user can either choose to save measurements only or both measurements and full images. It is possible to save the data shown in the measure tab in a *TXT file, which includes a header that displays the custom acquisition settings above the data. Each line corresponds to a single frame. This file can be opened in a spreadsheet software such as Microsoft Excel. It is also possible to save the images associated with the measurements from the *.TXT logging file. Each image will be individually saved in a native *.BMG file. For measurements, it is possible to choose a sampling rate for the saved data. Similarly, for the full images, one can manually set a temporal interval at which the software will save the data. With these tools, the user will be able to store only the information that is useful to his work.
R E L A T I V E P O S I T I O N
In the “Relative Position” tab, the “Setup” section allows the user to select the parameter that will be considered as the origin position (0,0). “Centroid” (center of energy) and “Peak” (highest measured value) are the options. The “User Define” option allows the user to manually enter origin position values for both axes. It is also possible to position the origin by simply clicking with the mouse in the display. Once the origin position is determined by the user, the software calculates the difference between the coordinates of this new position and the latest computed one. The results are displayed in the “Measures” section. It is possible to save the data in the acquisition file if desired.
B E A M P R O F I L I N G C A M E R A S
T 418.651.8003 1888 5GENTEC F 418.651.1174 www.gentec-eo.com [email protected]
Specifications are subject to change without notice
a. Limited by the spectral range of the camera.
BEAMAGE-M2
MEASUREMENTS Real-Time M2, Divergence and Waist
MEASUREMENT CAPABILITY 325 to 425 nm 400 to 750 nm 700 to 1100 nm 355, 532 & 1064 nm
M2 Measurement Real-Time ISO Compliant measurement with no moving partsRayleigh Range 50 μm - 6 mm (after lens)Setup & Alignment Easy setup and alignement
System can be calibrated and ready to go within minutes
SETUPWavelength Range 325 - 425 nm 400 - 750 nm 700 - 1100 nm 355, 532 and 1064 nmMinimum Focal Length 110 mmBuilt-In Attenuation (Included) Fabry-Perot optics: OD4Built-In Attenuation (Additional) Choice of OD0.5 to OD5.0
PHYSICAL CHARACTERISTICSDimensions (Module only) 64.1H x 77.3W x 97.6D mmDimensions (With Beamage-3.0) 64.1H x 81.1W x 113.6D mmWeight (Module only) 535 g
Operating Temperature Range 10°C - 30°C
Operating Relative Humidity 5% - 80%
ORDERING INFORMATION 325 to 425 nm 400 to 750 nm 700 to 1100 nm 355, 532 & 1064 nmProduct Name (M2 Module only) Beamage-M2-325/425 Beamage-M2-400/750 Beamage-M2-700/1100 Beamage-M2-355.532.1064Product Name (M2 Module and Camera) Beamage-M2-325/425-KIT Beamage-M2-400/750-KIT Beamage-M2-700/1100-KIT Beamage-M2-355.532.1064-KITProduct Name (Fabry-Perot optics only) FP-M2-325/425 FP-M2-400/750 FP-M2-700/1100 FP-M2-355.532.1064
BEAMAGE-M2
Stand with Steel Post(Model Number: 201102)
Beamage-M2(M2 Module)
K E Y F E A T U R E S1. INSTANT MEASUREMENT
The Fabry-Perot optics allow for M2 factor measurement in less than a second with no moving parts
2. ISO COMPLIANTAll the calculations are ISO 11146 and 13694 compliant
3. BUILT–IN ATTENUATIONOD4 attenuation provided by the Fabry-Perot optics itself and optional removable attenuators are available for attenuation up to OD9
4. PASSIVE DEVICENo external power source needed to operate the M2 Module
5. MODULARThe Beamage-3.0 camera profiler can be used separately from the M2 module for needs of spatial intensity or energy profiling
6. VERSATILEThe compact design makes it suitable for a wide range of scientific, medical and industrial applications
7. COMPLETE SOFTWAREEasy-to-use software with an array of useful functions and tools
8. COMPACT ASSEMBLYCan be inserted almost anywhere in optical systems for accurate troubleshooting
BEAMAGE-M2Real-Time M2 Module for Beamage-3.0
BDA-A-VAR, BDA-S-10-UV/IRBeam Splitters and Attenuators
S E E A L S OACCESSORIES FOR BEAM DIAGNOSTICS 182LIST OF REGULAR ACCESSORIES 190
APPLICATION NOTES CHOOSING YOUR BEAMAGE-M2 SYSTEM 202180
INSTANT M2 MEASUREMENTS WITH THE BEAMAGE-M2 202183
Specifications are subject to change without notice
a. Limited by the spectral range of the camera.
BEAMAGE-M2
MEASUREMENTS Real-Time M2, Divergence and Waist
MEASUREMENT CAPABILITY 325 to 425 nm 400 to 750 nm 700 to 1100 nm 355, 532 & 1064 nm
M2 Measurement Real-Time ISO Compliant measurement with no moving partsRayleigh Range 50 μm - 6 mm (after lens)Setup & Alignment Easy setup and alignement
System can be calibrated and ready to go within minutes
SETUPWavelength Range 325 - 425 nm 400 - 750 nm 700 - 1100 nm 355, 532 and 1064 nmMinimum Focal Length 110 mmBuilt-In Attenuation (Included) Fabry-Perot optics: OD4Built-In Attenuation (Additional) Choice of OD0.5 to OD5.0
PHYSICAL CHARACTERISTICSDimensions (Module only) 64.1H x 77.3W x 97.6D mmDimensions (With Beamage-3.0) 64.1H x 81.1W x 113.6D mmWeight (Module only) 535 g
Operating Temperature Range 10°C - 30°C
Operating Relative Humidity 5% - 80%
ORDERING INFORMATION 325 to 425 nm 400 to 750 nm 700 to 1100 nm 355, 532 & 1064 nmProduct Name (M2 Module only) Beamage-M2-325/425 Beamage-M2-400/750 Beamage-M2-700/1100 Beamage-M2-355.532.1064Product Name (M2 Module and Camera) Beamage-M2-325/425-KIT Beamage-M2-400/750-KIT Beamage-M2-700/1100-KIT Beamage-M2-355.532.1064-KITProduct Name (Fabry-Perot optics only) FP-M2-325/425 FP-M2-400/750 FP-M2-700/1100 FP-M2-355.532.1064
BEAMAGE-M2
Stand with Steel Post(Model Number: 201102)
Beamage-M2(M2 Module)
K E Y F E A T U R E S1. INSTANT MEASUREMENT
The Fabry-Perot optics allow for M2 factor measurement in less than a second with no moving parts
2. ISO COMPLIANTAll the calculations are ISO 11146 and 13694 compliant
3. BUILT–IN ATTENUATIONOD4 attenuation provided by the Fabry-Perot optics itself and optional removable attenuators are available for attenuation up to OD9
4. PASSIVE DEVICENo external power source needed to operate the M2 Module
5. MODULARThe Beamage-3.0 camera profiler can be used separately from the M2 module for needs of spatial intensity or energy profiling
6. VERSATILEThe compact design makes it suitable for a wide range of scientific, medical and industrial applications
7. COMPLETE SOFTWAREEasy-to-use software with an array of useful functions and tools
8. COMPACT ASSEMBLYCan be inserted almost anywhere in optical systems for accurate troubleshooting
BEAMAGE-M2Real-Time M2 Module for Beamage-3.0
BDA-A-VAR, BDA-S-10-UV/IRBeam Splitters and Attenuators
B E A M P R O F I L I N G C A M E R A S
T 418.651.8003 1888 5GENTEC F 418.651.1174 www.gentec-eo.com [email protected]
T H E F A B R Y - P E R O T I N T E R F E R O M E T E R
The strength of the Beamage-M2 system is in its completely static optical design. The main component inside the device is a pair of partially reflective glasses commonly known as a Fabry-Perot interferometer. When these glasses are positioned at a convenient angle, the focused laser beam oscillates and is split several times because of the multiple reflections and transmissions. Before it lands on the sensor, each beam covers a distance that is function of how many times it has bounced between the glasses (see diagram below). Each slice that lands on the CMOS sensor is therefore spatially delayed with the previous ones. After these cross sections along the beam waist have landed on the sensor, the PC-Beamage-3.0 software simultaneously tracks and analyzes them for unparalleled speed of M2 calculation.
Figure 1. Schematic of the Fabry-Perot optics with time-delayed slices of the beam
BEAMAGE-M2BEAMAGE-M2 W H A T I S M 2 ?
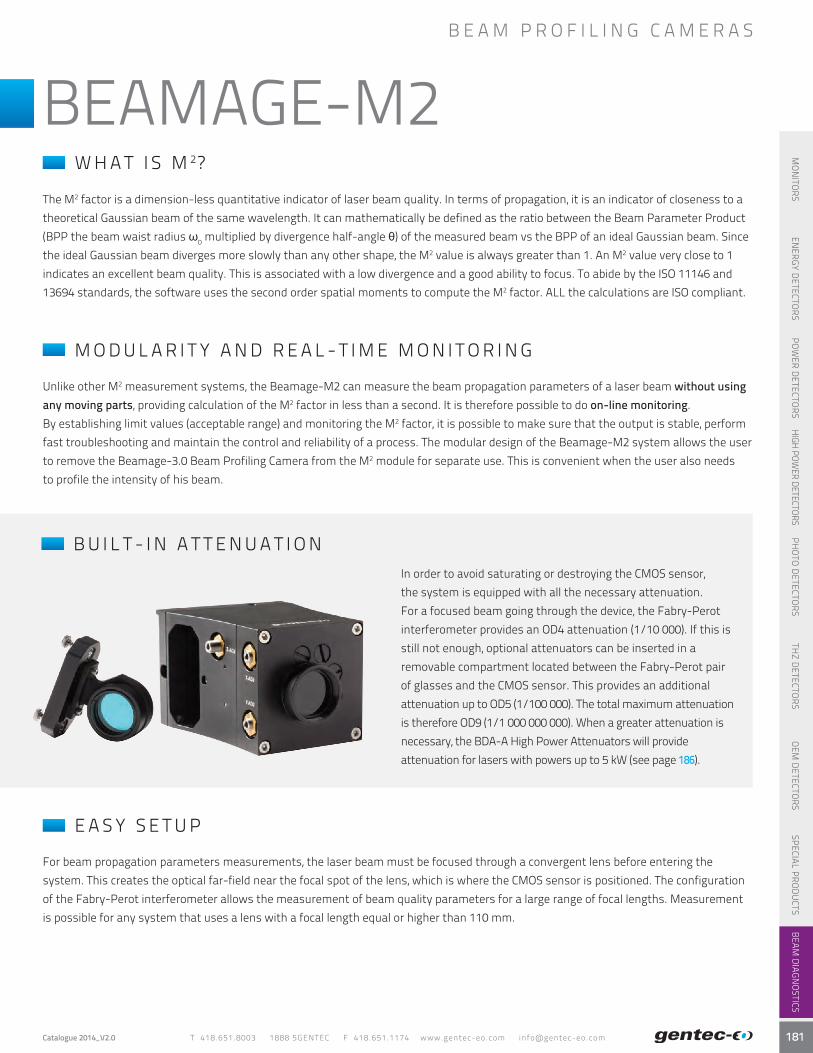
The M2 factor is a dimension-less quantitative indicator of laser beam quality. In terms of propagation, it is an indicator of closeness to a theoretical Gaussian beam of the same wavelength. It can mathematically be defined as the ratio between the Beam Parameter Product (BPP the beam waist radius ω0 multiplied by divergence half-angle θ) of the measured beam vs the BPP of an ideal Gaussian beam. Since the ideal Gaussian beam diverges more slowly than any other shape, the M2 value is always greater than 1. An M2 value very close to 1 indicates an excellent beam quality. This is associated with a low divergence and a good ability to focus. To abide by the ISO 11146 and 13694 standards, the software uses the second order spatial moments to compute the M2 factor. ALL the calculations are ISO compliant.
M O D U L A R I T Y A N D R E A L - T I M E M O N I T O R I N G
Unlike other M2 measurement systems, the Beamage-M2 can measure the beam propagation parameters of a laser beam without using any moving parts, providing calculation of the M2 factor in less than a second. It is therefore possible to do on-line monitoring. By establishing limit values (acceptable range) and monitoring the M2 factor, it is possible to make sure that the output is stable, perform fast troubleshooting and maintain the control and reliability of a process. The modular design of the Beamage-M2 system allows the user to remove the Beamage-3.0 Beam Profiling Camera from the M2 module for separate use. This is convenient when the user also needs to profile the intensity of his beam.
I N T U I T I V E S O F T W A R E
M2 measurements are displayed directly in the PC-Beamage-3.0 software. Beside the Computations panel, the M2 Mode button allows the user to select the desired calibration mode. For each mode, there is an easy to follow step-by-step calibration procedure. The system automatically detects the multiple slices of the beam and, once the calibration is done, you can take as many measurements as you want without modifying any parameter and without moving anything. ALL the calculations made by the software are ISO compliant. They give M2 values for both the X and Y axes. Thanks to the lightweight software and to the absence of moving parts, the system offers the fastest M2 measurements on the market.
B U I L T - I N A T T E N U A T I O NIn order to avoid saturating or destroying the CMOS sensor, the system is equipped with all the necessary attenuation. For a focused beam going through the device, the Fabry-Perot interferometer provides an OD4 attenuation (1/10 000). If this is still not enough, optional attenuators can be inserted in a removable compartment located between the Fabry-Perot pair of glasses and the CMOS sensor. This provides an additional attenuation up to OD5 (1/100 000). The total maximum attenuation is therefore OD9 (1/1 000 000 000). When a greater attenuation is necessary, the BDA-A High Power Attenuators will provide attenuation for lasers with powers up to 5 kW (see page 186).
Focusing Lens
Fabry-PerotEtalon Pair
LaserBeam
CMOSSensor
SpatialTime Slices
9th Spot8th Time Delay
1st SpotNo Time Delay
Time-Delayed Slices
E A S Y S E T U P
For beam propagation parameters measurements, the laser beam must be focused through a convergent lens before entering the system. This creates the optical far-field near the focal spot of the lens, which is where the CMOS sensor is positioned. The configuration of the Fabry-Perot interferometer allows the measurement of beam quality parameters for a large range of focal lengths. Measurement is possible for any system that uses a lens with a focal length equal or higher than 110 mm.
181Catalogue 2014_V2.0
BEAM DIAGN
OSTICSSPECIAL PRODUCTS
OEM DETECTORS
THZ DETECTORS
PHOTO DETECTORS
HIGH POWER DETECTORS
POWER DETECTORS
ENERGY DETECTORS
MON
ITORS
186
T H E F A B R Y - P E R O T I N T E R F E R O M E T E R
The strength of the Beamage-M2 system is in its completely static optical design. The main component inside the device is a pair of partially reflective glasses commonly known as a Fabry-Perot interferometer. When these glasses are positioned at a convenient angle, the focused laser beam oscillates and is split several times because of the multiple reflections and transmissions. Before it lands on the sensor, each beam covers a distance that is function of how many times it has bounced between the glasses (see diagram below). Each slice that lands on the CMOS sensor is therefore spatially delayed with the previous ones. After these cross sections along the beam waist have landed on the sensor, the PC-Beamage-3.0 software simultaneously tracks and analyzes them for unparalleled speed of M2 calculation.
Figure 1. Schematic of the Fabry-Perot optics with time-delayed slices of the beam
BEAMAGE-M2BEAMAGE-M2 W H A T I S M 2 ?
The M2 factor is a dimension-less quantitative indicator of laser beam quality. In terms of propagation, it is an indicator of closeness to a theoretical Gaussian beam of the same wavelength. It can mathematically be defined as the ratio between the Beam Parameter Product (BPP the beam waist radius ω0 multiplied by divergence half-angle θ) of the measured beam vs the BPP of an ideal Gaussian beam. Since the ideal Gaussian beam diverges more slowly than any other shape, the M2 value is always greater than 1. An M2 value very close to 1 indicates an excellent beam quality. This is associated with a low divergence and a good ability to focus. To abide by the ISO 11146 and 13694 standards, the software uses the second order spatial moments to compute the M2 factor. ALL the calculations are ISO compliant.
M O D U L A R I T Y A N D R E A L - T I M E M O N I T O R I N G
Unlike other M2 measurement systems, the Beamage-M2 can measure the beam propagation parameters of a laser beam without using any moving parts, providing calculation of the M2 factor in less than a second. It is therefore possible to do on-line monitoring. By establishing limit values (acceptable range) and monitoring the M2 factor, it is possible to make sure that the output is stable, perform fast troubleshooting and maintain the control and reliability of a process. The modular design of the Beamage-M2 system allows the user to remove the Beamage-3.0 Beam Profiling Camera from the M2 module for separate use. This is convenient when the user also needs to profile the intensity of his beam.
I N T U I T I V E S O F T W A R E
M2 measurements are displayed directly in the PC-Beamage-3.0 software. Beside the Computations panel, the M2 Mode button allows the user to select the desired calibration mode. For each mode, there is an easy to follow step-by-step calibration procedure. The system automatically detects the multiple slices of the beam and, once the calibration is done, you can take as many measurements as you want without modifying any parameter and without moving anything. ALL the calculations made by the software are ISO compliant. They give M2 values for both the X and Y axes. Thanks to the lightweight software and to the absence of moving parts, the system offers the fastest M2 measurements on the market.
B U I L T - I N A T T E N U A T I O NIn order to avoid saturating or destroying the CMOS sensor, the system is equipped with all the necessary attenuation. For a focused beam going through the device, the Fabry-Perot interferometer provides an OD4 attenuation (1/10 000). If this is still not enough, optional attenuators can be inserted in a removable compartment located between the Fabry-Perot pair of glasses and the CMOS sensor. This provides an additional attenuation up to OD5 (1/100 000). The total maximum attenuation is therefore OD9 (1/1 000 000 000). When a greater attenuation is necessary, the BDA-A High Power Attenuators will provide attenuation for lasers with powers up to 5 kW (see page 186).
Focusing Lens
Fabry-PerotEtalon Pair
LaserBeam
CMOSSensor
SpatialTime Slices
9th Spot8th Time Delay
1st SpotNo Time Delay
Time-Delayed Slices
E A S Y S E T U P
For beam propagation parameters measurements, the laser beam must be focused through a convergent lens before entering the system. This creates the optical far-field near the focal spot of the lens, which is where the CMOS sensor is positioned. The configuration of the Fabry-Perot interferometer allows the measurement of beam quality parameters for a large range of focal lengths. Measurement is possible for any system that uses a lens with a focal length equal or higher than 110 mm.
B E A M P R O F I L I N G C A M E R A S
T 418.651.8003 1888 5GENTEC F 418.651.1174 www.gentec-eo.com [email protected]
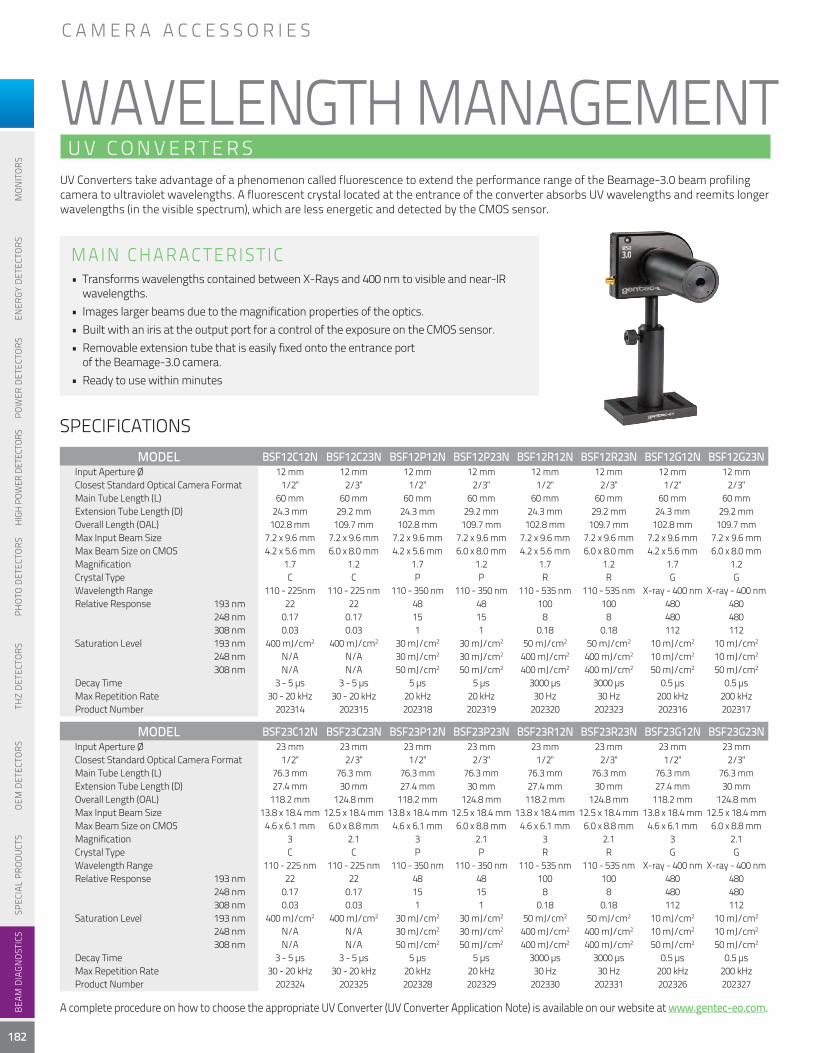
WAVELENGTH MANAGEMENT U V C O N V E R T E R SUV Converters take advantage of a phenomenon called fluorescence to extend the performance range of the Beamage-3.0 beam profiling camera to ultraviolet wavelengths. A fluorescent crystal located at the entrance of the converter absorbs UV wavelengths and reemits longer wavelengths (in the visible spectrum), which are less energetic and detected by the CMOS sensor.
Input Aperture Ø 12 mm 12 mm 12 mm 12 mm 12 mm 12 mm 12 mm 12 mmClosest Standard Optical Camera Format 1/2" 2/3" 1/2" 2/3" 1/2" 2/3" 1/2" 2/3"Main Tube Length (L) 60 mm 60 mm 60 mm 60 mm 60 mm 60 mm 60 mm 60 mmExtension Tube Length (D) 24.3 mm 29.2 mm 24.3 mm 29.2 mm 24.3 mm 29.2 mm 24.3 mm 29.2 mmOverall Length (OAL) 102.8 mm 109.7 mm 102.8 mm 109.7 mm 102.8 mm 109.7 mm 102.8 mm 109.7 mmMax Input Beam Size 7.2 x 9.6 mm 7.2 x 9.6 mm 7.2 x 9.6 mm 7.2 x 9.6 mm 7.2 x 9.6 mm 7.2 x 9.6 mm 7.2 x 9.6 mm 7.2 x 9.6 mmMax Beam Size on CMOS 4.2 x 5.6 mm 6.0 x 8.0 mm 4.2 x 5.6 mm 6.0 x 8.0 mm 4.2 x 5.6 mm 6.0 x 8.0 mm 4.2 x 5.6 mm 6.0 x 8.0 mmMagnification 1.7 1.2 1.7 1.2 1.7 1.2 1.7 1.2Crystal Type C C P P R R G GWavelength Range 110 - 225nm 110 - 225 nm 110 - 350 nm 110 - 350 nm 110 - 535 nm 110 - 535 nm X-ray - 400 nm X-ray - 400 nmRelative Response 193 nm 22 22 48 48 100 100 480 480
MODEL BSF23C12N BSF23C23N BSF23P12N BSF23P23N BSF23R12N BSF23R23N BSF23G12N BSF23G23NInput Aperture Ø 23 mm 23 mm 23 mm 23 mm 23 mm 23 mm 23 mm 23 mmClosest Standard Optical Camera Format 1/2" 2/3" 1/2" 2/3" 1/2" 2/3" 1/2" 2/3"Main Tube Length (L) 76.3 mm 76.3 mm 76.3 mm 76.3 mm 76.3 mm 76.3 mm 76.3 mm 76.3 mmExtension Tube Length (D) 27.4 mm 30 mm 27.4 mm 30 mm 27.4 mm 30 mm 27.4 mm 30 mmOverall Length (OAL) 118.2 mm 124.8 mm 118.2 mm 124.8 mm 118.2 mm 124.8 mm 118.2 mm 124.8 mmMax Input Beam Size 13.8 x 18.4 mm 12.5 x 18.4 mm 13.8 x 18.4 mm 12.5 x 18.4 mm 13.8 x 18.4 mm 12.5 x 18.4 mm 13.8 x 18.4 mm 12.5 x 18.4 mmMax Beam Size on CMOS 4.6 x 6.1 mm 6.0 x 8.8 mm 4.6 x 6.1 mm 6.0 x 8.8 mm 4.6 x 6.1 mm 6.0 x 8.8 mm 4.6 x 6.1 mm 6.0 x 8.8 mmMagnification 3 2.1 3 2.1 3 2.1 3 2.1Crystal Type C C P P R R G GWavelength Range 110 - 225 nm 110 - 225 nm 110 - 350 nm 110 - 350 nm 110 - 535 nm 110 - 535 nm X-ray - 400 nm X-ray - 400 nmRelative Response 193 nm 22 22 48 48 100 100 480 480
A complete procedure on how to choose the appropriate UV Converter (UV Converter Application Note) is available on our website at www.gentec-eo.com.
M A I N C H A R A C T E R I S T I C• Transforms wavelengths contained between X-Rays and 400 nm to visible and near-IR
wavelengths.• Images larger beams due to the magnification properties of the optics.• Built with an iris at the output port for a control of the exposure on the CMOS sensor.• Removable extension tube that is easily fixed onto the entrance port
of the Beamage-3.0 camera.• Ready to use within minutes
I R A D A P T O RTypically, a CMOS silicon sensor is operating at its full potential when imaging lasers with wavelengths between 350 nm and 1150 nm*. If you want to extend the performance range of your Beamage-3.0 beam profiling camera to the near-IR telecom wavelengths band, you can use the IR Adaptor. This ideal solution takes advantage of a multi-photon absorption process to extend the sensitivity range of the camera sensor to a portion of the near-IR spectrum (1495 nm – 1595 nm).
SPECIFICATIONSMODEL IR ADAPTOR
Active Area 27.5 mm ØIR Spectral Range 1495 nm – 1595 nmPeak IR Sensitivity 1510 nm and 1540 nmConverted Wavelengths 950 nm – 1075 nmPixel Multiplication Factor 3.29Minimum Beam Size 230 μmMaximum Beam Size 19 mmMaximum Resolution 12 lp/mm over active area 40 lp/mm at sensor focal planeDistortion -1.0% barrel distortion (inverted image)Linearity Non-Linear, IR converted output ∝ IR input intensity ^1.41Spectral Transmission 360 nm – 2000 nm @ F30.8Damage Threshold 1 W/cm2
Dimensions 46 mm Ø x 97 mm LOperating Temperature -10°C to +40°CWeight 210 gProduct Number 201061
SPECIFICATIONSMODEL UG11-UV
Spectral Range 250 nm – 370 nmDiameter 25 mm ØClear Aperture 80% of areaDimensional Tolerance +0.0/-0.2 mmThickness 2 mmThickness Tolerance +0.0/-0.2 mmParallelism < 3 arcminSurface Flatness < λ/4Maximum Power 1 WSurface Quality 40-20 Scratch-DigDamage Threshold 30 W/cm2 (typical)Product Number 202602
* Data specified at 633 nm
1500 1550 16000
1
2
3
4
5
6
7
Wavelength (nm)
Sign
al in
tens
ity (a
.u.)
WAVELENGTH MANAGEMENT
* The Beamage-3.0 is also offered with an optional phosphor coated CMOS sensor (Beamage-3.0-IR), which is sensitive to wavelengths between 1495 nm and 1595 nm. See page 172 for more details.
M A I N C H A R A C T E R I S T I C S• Converts wavelengths between 1495 nm and 1595 nm to shorter wavelengths
between 950 nm and 1075 nm.• Images larger beams due to the convergent properties of the optics (3.29X).•Built with a high quality coated anti-reflection input window that allows wavelength
conversion with low distortion and maximum image resolution.•Removable and easily C-mounted onto the entrance port of the camera.•Ready to use within minutes.
U V B A N D P A S S F I L T E R - U P T O 1 WWe also offer a color glass filter specially designed for the UV spectrum. Depending on the wavelength, the UG11-UV filter transmits 20% to 70% of the input beam power. It is particularly useful for applications with wavelengths contained between 250 nm and 370 nm. Other wavelengths are blocked by the filter. The UG11-UV is SM1 threaded and comes with a SM1 to C-mount adaptor.
200 300 400 500 600 700 800 900 1000 1100
UG11-UV
0,001%
0,010%
0,100%
1,000%
10,000%
100,000%
Tran
smiss
ion
Wavelength [nm]
T 418.651.8003 1888 5GENTEC F 418.651.1174 www.gentec-eo.com [email protected]
V A R I A B L E A T T E N U A T O R - U P T O 1 WThe BDA-A-VAR is an easy to use variable attenuator equipped with 4 wheels, each one containing 3 filters and 1 empty space at fixed positions. The filters have transmission factors ranging from 100% to 0.003%. With 256 possible configurations, this variable attenuator offers almost continuous attenuation from 0 db to 93 dB. The BDA-A-VAR has M6 holes on 3 sides for mounting versatility and has C-mount threads on both ends for connection with the Beamage-3.0 via a male to male C-Mount connecting tube (sold separately).
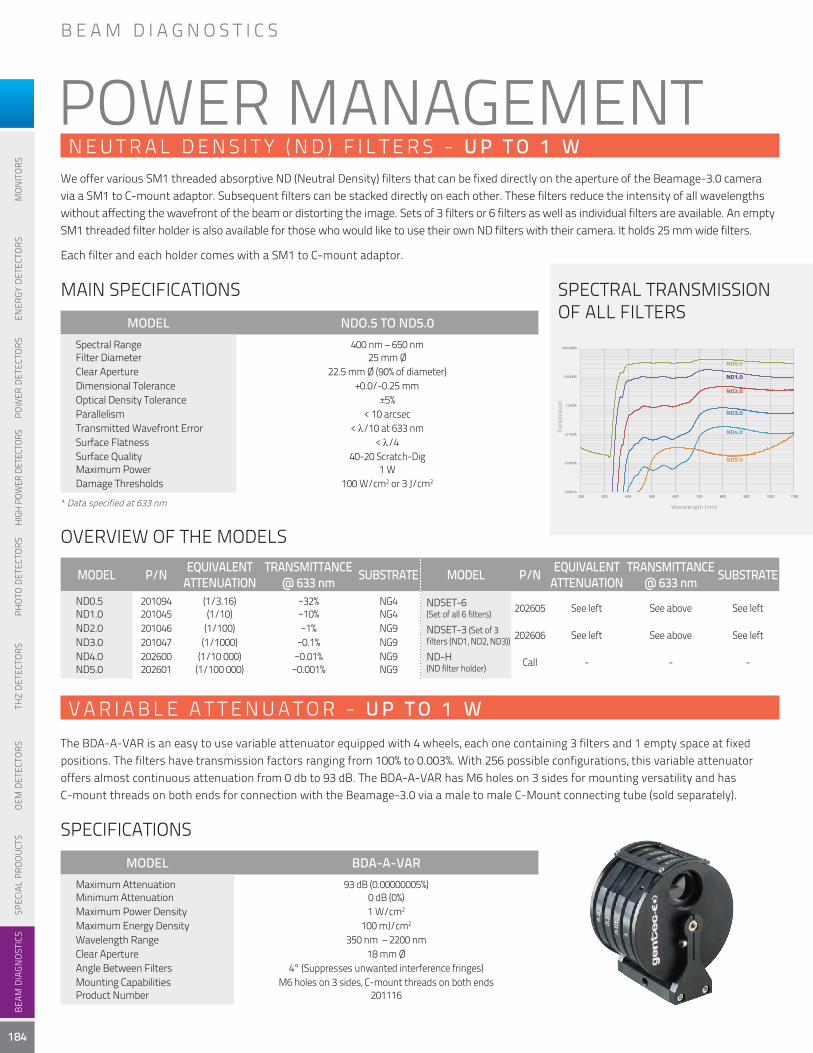
N E U T R A L D E N S I T Y ( N D ) F I L T E R S - U P T O 1 WWe offer various SM1 threaded absorptive ND (Neutral Density) filters that can be fixed directly on the aperture of the Beamage-3.0 camera via a SM1 to C-mount adaptor. Subsequent filters can be stacked directly on each other. These filters reduce the intensity of all wavelengths without affecting the wavefront of the beam or distorting the image. Sets of 3 filters or 6 filters as well as individual filters are available. An empty SM1 threaded filter holder is also available for those who would like to use their own ND filters with their camera. It holds 25 mm wide filters.
Each filter and each holder comes with a SM1 to C-mount adaptor.
MAIN SPECIFICATIONS
MODEL NDO.5 TO ND5.0Spectral Range 400 nm – 650 nmFilter Diameter 25 mm ØClear Aperture 22.5 mm Ø (90% of diameter)Dimensional Tolerance +0.0/-0.25 mmOptical Density Tolerance ±5%Parallelism < 10 arcsecTransmitted Wavefront Error < λ/10 at 633 nmSurface Flatness < λ/4Surface Quality 40-20 Scratch-DigMaximum Power 1 WDamage Thresholds 100 W/cm2 or 3 J/cm2
* Data specified at 633 nm
OVERVIEW OF THE MODELS
MODEL P/N EQUIVALENT ATTENUATION
TRANSMITTANCE @ 633 nm SUBSTRATE MODEL P/N EQUIVALENT
ATTENUATIONTRANSMITTANCE
@ 633 nm SUBSTRATE
ND0.5 201094 (1/3.16) ~32% NG4 NDSET-6 (Set of all 6 filters) 202605 See left See above See leftND1.0 201045 (1/10) ~10% NG4
ND2.0 201046 (1/100) ~1% NG9 NDSET-3 (Set of 3 filters (ND1, ND2, ND3)) 202606 See left See above See leftND3.0 201047 (1/1000) ~0.1% NG9
MODEL BDA-A-VARMaximum Attenuation 93 dB (0.00000005%)Minimum Attenuation 0 dB (0%)Maximum Power Density 1 W/cm2
Maximum Energy Density 100 mJ/cm2
Wavelength Range 350 nm – 2200 nmClear Aperture 18 mm ØAngle Between Filters 4° (Suppresses unwanted interference fringes) Mounting Capabilities M6 holes on 3 sides, C-mount threads on both endsProduct Number 201116
SPECTRAL TRANSMISSION OF ALL FILTERS
ND0.5
ND1.0
ND2.0
ND3.0
ND4.0
ND5.0
0.001%
0.010%
0.100%
1.000%
10.000%
100.000%
200 300 400 500 600 700 800 900 1000 1100
Tran
smiss
ion
Wavelength (nm)
185Catalogue 2014_V2.0
BEAM DIAGN
OSTICSSPECIAL PRODUCTS
OEM DETECTORS
THZ DETECTORS
PHOTO DETECTORS
HIGH POWER DETECTORS
POWER DETECTORS
ENERGY DETECTORS
MON
ITORSC A M E R A A C C E S S O R I E S
POWER MANAGEMENT B E A M S A M P L E R - U P T O 4 0 WThe BDA-S-1000-40W-VIS/IR beam sampler uses Fresnel reflection on two orthogonal wedges to pick off a small fraction of the input beam. Within the 400 nm – 2500 nm range, it provides a fixed 103 (30 db) attenuation that weakly depends on the wavelength. The incoming beam polarization state and irradiance are preserved. The wavefront distortion is negligible and the laser output power stability is not affected. This beam sampler has four ports: “Input”, “Sampled Beam”, “Residual Beam” and “Port 4”. It can be connected to the Beamage-3.0 via a male to male C-mount adaptor (sold with the Beam Sampler) and can be easily combined with the BDA-A-VAR variable attenuator via a male to male C-mount connecting tube (sold separately).
SPECIFICATIONS
MODEL BDA-S-1000-40W-VIS/IRSpectral Range 400 nm – 2500 nmAverage Attenuation 103 (30 db)Maximum Power Range 40 WAperture Diameter 17.5 mmMax Beam Diameter 15 mmOptical Wedges Material UV Fused SilicaRefractive Index (λ = 532 nm) 1.4607Refractive Index (λ = 1064 nm) 1.4496Sampled Beam Lateral Shift 15 mmSampled Beam Deviation 90°Residual Beam Deviation 5°Product Number 202345
B E A M S P L I T T E R C U B E - U P T O 4 0 W• The BDA-S-10-UV/IR beam splitter cube provides attenuation and beam sampling for high power laser diagnostics.
It uses the front surface of an uncoated mirror and reflects 3% to 10% of the input laser beam.
• There is no back reflection, no unwanted interference fringes, and the image of the beam is virtually undistorted.
• It can take power densities up to 2 GW/cm².
• It is C-mount threaded. It can be connected directly to the Beamage-3.0 or the BDA-A-VAR variable attenuator with compatible connecting tubes and can be mounted onto a post via its M6 holes.
SPECIFICATIONS
MODEL BDA-S-10-UV/IRReflection 3% to 10% (polarization dependent)Spectral Range 190 nm – 2200 nmClear Aperture 19 mmDamage Threshold (Power) 2 GW/cm2
Damage Threshold (Energy) 50 J/cm2
Wedge 30 arcminSurface Flatness λ/10Surface Quality 10-5 Scratch-DigProduct Number 202604
T 418.651.8003 1888 5GENTEC F 418.651.1174 www.gentec-eo.com [email protected]
POWER MANAGEMENT B E A M A T T E N U A T O R S - U P T O 5 0 0 0 W *The High Power Beam Attenuators provide attenuation for performing diagnostics on high power laser beams. The input beam is attenuated via a partial reflection on two parallel optical wedges.
To suit all requirements and laser specifications, 3 different models are available. In terms of input power, it is possible to choose between a model that can take up to 500 W and a model that can take up to 5000 W. In terms of spectral range sensitivity, it is possible to choose either a model that is sensitive to the 3 YAG harmonics (355, 532 and 1064 nm) and a model that is sensitive at 1064 nm.
Random OD 2.87 0.00135S Polarization OD 3.289 0.000415P Polarization OD 3.289 0.000415
* available in april 2014
187Catalogue 2014_V2.0
BEAM DIAGN
OSTICSSPECIAL PRODUCTS
OEM DETECTORS
THZ DETECTORS
PHOTO DETECTORS
HIGH POWER DETECTORS
POWER DETECTORS
ENERGY DETECTORS
MON
ITORS
IMAGING A TRANSMITTED BEAM IMAGING A REFLECTED BEAM
C A M E R A A C C E S S O R I E S
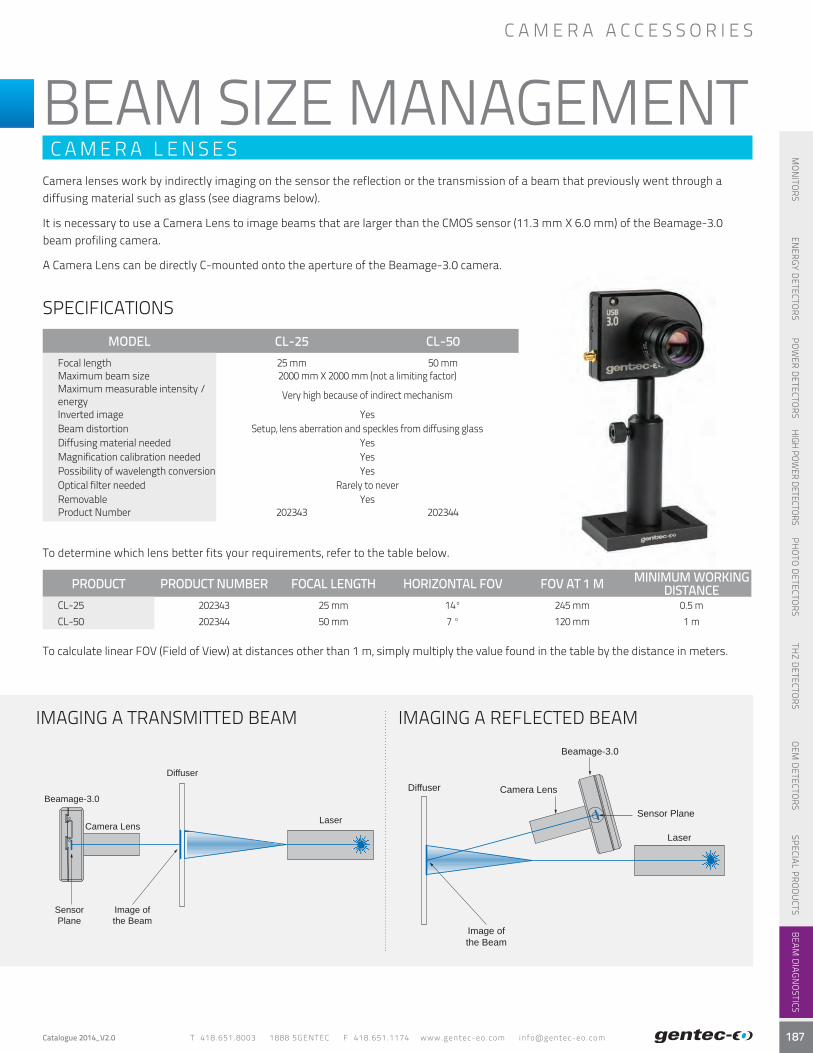
BEAM SIZE MANAGEMENT C A M E R A L E N S E SCamera lenses work by indirectly imaging on the sensor the reflection or the transmission of a beam that previously went through a diffusing material such as glass (see diagrams below).
It is necessary to use a Camera Lens to image beams that are larger than the CMOS sensor (11.3 mm X 6.0 mm) of the Beamage-3.0 beam profiling camera.
A Camera Lens can be directly C-mounted onto the aperture of the Beamage-3.0 camera.
SPECIFICATIONS
MODEL CL-25 CL-50Focal length 25 mm 50 mmMaximum beam size 2000 mm X 2000 mm (not a limiting factor)Maximum measurable intensity / energy Very high because of indirect mechanism
Inverted image YesBeam distortion Setup, lens aberration and speckles from diffusing glassDiffusing material needed YesMagnification calibration needed YesPossibility of wavelength conversion YesOptical filter needed Rarely to neverRemovable YesProduct Number 202343 202344
To determine which lens better fits your requirements, refer to the table below.
PRODUCT PRODUCT NUMBER FOCAL LENGTH HORIZONTAL FOV FOV AT 1 M MINIMUM WORKING DISTANCE
CL-25 202343 25 mm 14º 245 mm 0.5 mCL-50 202344 50 mm 7 º 120 mm 1 m
To calculate linear FOV (Field of View) at distances other than 1 m, simply multiply the value found in the table by the distance in meters.
Laser
Diffuser
Image ofthe Beam
Beamage-3.0
Sensor Plane
Camera LensBeamage-3.0
SensorPlane
Image ofthe Beam
Camera LensLaser
Diffuser
T 418.651.8003 1888 5GENTEC F 418.651.1174 www.gentec-eo.com [email protected]
Specifications are subject to change without notice
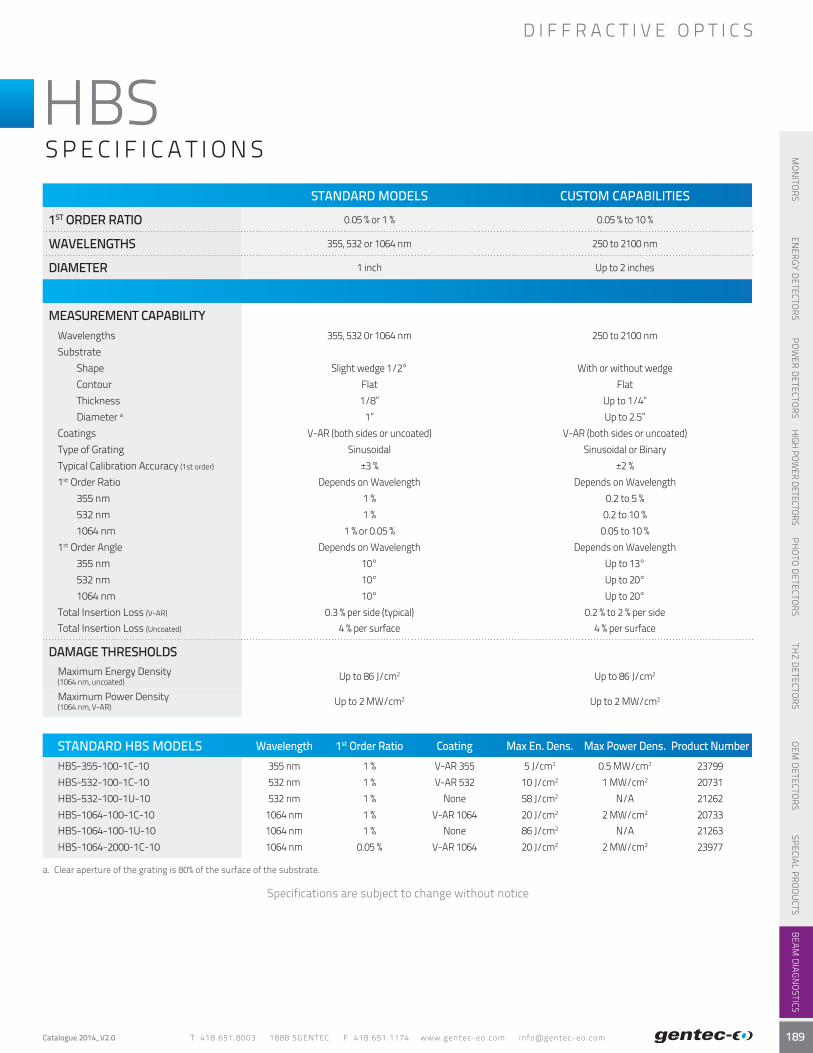
a. Clear aperture of the grating is 80% of the surface of the substrate.
STANDARD MODELS CUSTOM CAPABILITIES
1ST ORDER RATIO 0.05 % or 1 % 0.05 % to 10 %
WAVELENGTHS 355, 532 or 1064 nm 250 to 2100 nm
DIAMETER 1 inch Up to 2 inches
MEASUREMENT CAPABILITYWavelengths 355, 532 0r 1064 nm 250 to 2100 nmSubstrate Shape Slight wedge 1/2° With or without wedge Contour Flat Flat Thickness 1/8” Up to 1/4” Diameter a 1” Up to 2.5”Coatings V-AR (both sides or uncoated) V-AR (both sides or uncoated)Type of Grating Sinusoidal Sinusoidal or BinaryTypical Calibration Accuracy (1st order) ±3 % ±2 %1st Order Ratio Depends on Wavelength Depends on Wavelength 355 nm 1 % 0.2 to 5 % 532 nm 1 % 0.2 to 10 % 1064 nm 1 % or 0.05 % 0.05 to 10 %1st Order Angle Depends on Wavelength Depends on Wavelength 355 nm 10° Up to 13° 532 nm 10° Up to 20° 1064 nm 10° Up to 20°Total Insertion Loss (V-AR) 0.3 % per side (typical) 0.2 % to 2 % per sideTotal Insertion Loss (Uncoated) 4 % per surface 4 % per surface
DAMAGE THRESHOLDSMaximum Energy Density(1064 nm, uncoated) Up to 86 J/cm2 Up to 86 J/cm2
Maximum Power Density (1064 nm, V-AR) Up to 2 MW/cm2 Up to 2 MW/cm2
Do real-time sampling of your laser and measure your profile while working
2. SPATIAL PROFILE PRESERVEDThe HBS will not create artefacts in your measurements or in your main beam
3. ENVIRONMENT INSENSITIVEThe ONLY sampling component that is insensitive to ALL environmental variations, including polarization
4. VERY HIGH DAMAGE THRESHOLDCan be as high as fused silica itself
1 inch Mount(Model Number: 202371)
Stand with Steel Post(Model Number: 200160)
HBS-532-100-1C-10HBS-355-100-1C-10
HBS355 nm, 532 nm and 1064 nm, 1 % and 0.05 %
1064 nm0.05%
COATED
1064 nm1%
UNCOATED
1064 nm1%
COATED
532 nm1%
UNCOATED
532 nm1%
COATED
355 nm1%
COATED
θIncidentBeam
TransmittedBeam
ANGLESθA = θA'θB = θB' = 2θAA = Specified Diffraction Order* 50% discount available online and through Gentec-EO authorized vendors.
*
S E E A L S OLIST OF ALL ACCESSORIES 190
DIFFRACTIVE OPTICS HBS
189Catalogue 2014_V2.0
BEAM DIAGN
OSTICSSPECIAL PRODUCTS
OEM DETECTORS
THZ DETECTORS
PHOTO DETECTORS
HIGH POWER DETECTORS
POWER DETECTORS
ENERGY DETECTORS
MON
ITORS
S P E C I F I C A T I O N S
A C C E S S O R I E S
A V A I L A B L E M O D E L S
Pelican Carrying Case
Specifications are subject to change without notice
a. Clear aperture of the grating is 80% of the surface of the substrate.
STANDARD MODELS CUSTOM CAPABILITIES
1ST ORDER RATIO 0.05 % or 1 % 0.05 % to 10 %
WAVELENGTHS 355, 532 or 1064 nm 250 to 2100 nm
DIAMETER 1 inch Up to 2 inches
MEASUREMENT CAPABILITYWavelengths 355, 532 0r 1064 nm 250 to 2100 nmSubstrate Shape Slight wedge 1/2° With or without wedge Contour Flat Flat Thickness 1/8” Up to 1/4” Diameter a 1” Up to 2.5”Coatings V-AR (both sides or uncoated) V-AR (both sides or uncoated)Type of Grating Sinusoidal Sinusoidal or BinaryTypical Calibration Accuracy (1st order) ±3 % ±2 %1st Order Ratio Depends on Wavelength Depends on Wavelength 355 nm 1 % 0.2 to 5 % 532 nm 1 % 0.2 to 10 % 1064 nm 1 % or 0.05 % 0.05 to 10 %1st Order Angle Depends on Wavelength Depends on Wavelength 355 nm 10° Up to 13° 532 nm 10° Up to 20° 1064 nm 10° Up to 20°Total Insertion Loss (V-AR) 0.3 % per side (typical) 0.2 % to 2 % per sideTotal Insertion Loss (Uncoated) 4 % per surface 4 % per surface
DAMAGE THRESHOLDSMaximum Energy Density(1064 nm, uncoated) Up to 86 J/cm2 Up to 86 J/cm2
Maximum Power Density (1064 nm, V-AR) Up to 2 MW/cm2 Up to 2 MW/cm2