21
Bear Creek Reservoir, Treatment, and Transmission Facilities 2013 Annual Report Prepared for: The Upper Oconee Basin Water Authority Prepared by: Jacobs Field Services North America
| Date post: | 29-Sep-2018 |
| Category: |
Documents |
| Upload: | truongthuy |
| View: | 213 times |
| Download: | 0 times |
Bear Creek Reservoir, Treatment,
and Transmission Facilities
2013 Annual Report
Prepared for: The Upper Oconee Basin Water Authority
Prepared by: Jacobs Field Services North America

i
TABLE OF CONTENTS
Page
1. INTRODUCTION / HIGHLIGHTS ........................................................................................... 1
2. ABOUT THE TEAM ................................................................................................................... 2
3. PLANT OVERVIEW ................................................................................................................... 3
4. RESERVOIR MANAGEMENT PLAN ..................................................................................... 5
5. BEAR CREEK WATER TREATMENT PLANT ..................................................................... 5 5.1. Flows .................................................................................................................................... 5 5.2. Compliance .......................................................................................................................... 7 5.3. Staffing ................................................................................................................................. 7 5.4. Safety ................................................................................................................................... 8 5.5. Operational Highlights ....................................................................................................... 9 5.6. System Maintenance ........................................................................................................... 9 5.7. Financial Information ...................................................................................................... 10
APPENDICES
APPENDIX A 2013 MONTHLY FLOWS
APPENDIX B CONSUMER CONFIDENCE REPORT WATER DATA
APPENDIX C 2014 BUDGET

ii
TABLE OF CONTENTS (CONTINUED)
FIGURES
No. Title Page
1 Rainfall 2010 through 2013 ................................................................................................ 4 2 Bear Creek Reservoir 2013 Level ...................................................................................... 4 3 Bear Creek WTP 2013 Processed Flows ........................................................................... 6 4 Bear Creek WTP 2013 Distribution Flows ....................................................................... 6 5 Member Utility 2013 Flows ................................................................................................ 7 6 2013 Chemical Costs ......................................................................................................... 10 7 2013 Monthly Maintenance Expense ............................................................................... 11 8 2013 Monthly Electricity Costs ........................................................................................ 11
TABLES
No. Title Page
1 2013 Water Treatment Plant Staff ..................................................................................... 7 2 Chemical Bids for 2013 ..................................................................................................... 10

Bear Creek Reservoir, Treatment, and Transmission Facilities
The Upper Oconee Basin Water Authority
Jacobs Engineering Group, Inc. Issue Date: March 2014
1
2013 Annual Report
1. Introduction / Highlights
The Bear Creek Reservoir, located north of Bogart and west of Cleveland Road in Jackson County, services Athens‐Clarke County, Barrow, Jackson, and Oconee counties. The Upper Oconee Basin Water Authority (Authority) was formed by these counties to address long‐term water needs through regional approaches.
During 2013, the Bear Creek Water Treatment Plant (WTP) processed 2.66 billion gallons of treated water and recorded a peak finished hourly flow of 12.61 million gallons per day (MGD) and a peak raw water flow of 11.596 MGD.
Member utilities received water as follows:
Athens‐Clarke County pumped a total of 423.330 MG to the Beacham WTP
Barrow County 784.368 MG
Jackson County 782.720 MG
Oconee County 710.823 MG
The facility pumped 1.40 billion gallons of raw water from the Middle Oconee River in 2013 versus
2.93 billion gallons pumped in 2012.
Management and staff at the plant are committed to providing a consistently safe and reliable water supply. In addition to routine inspection and preventive maintenance practices, major projects during 2013 included the installation of rip‐rap in the downstream abutment area of the dam and planting grass in the upstream abutment area as specified by the Safe Dam Program. We replaced six obsolete filter effluent valve controllers at a cost of $30,615.
Downstream Abutment Area Replaced Six Filter Effluent Valves

Bear Creek Reservoir, Treatment, and Transmission Facilities
The Upper Oconee Basin Water Authority
Jacobs Engineering Group, Inc. Issue Date: March 2014
2
New VFD on Number Two River Pump
The River Pump Station allows the removal of water from the Middle Oconee River to the Bear Creek WTP. The River Pump Station is equipped with three, 20 million gallon per day (MGD) pumps. Drive Tech Inc. installed a Variable Frequency Drive on Number two river pump at a cost of $57,968; a considerable savings over the original estimate of over $100,000. Eight obsolete flow meters were replaced throughout the treatment facility. The Authority also purchased a new maintenance truck for the plant staff.
2. About the Team
The Authority has an exceptionally qualified and dedicated team supporting and executing the management of the Bear Creek WTP. This team includes the Authority’s Standing Committees (Operations, Finance, Recreation, and Engineering), the Northeast Georgia Regional Commission, and each individual member of the Authority.
Jacobs Engineering Group, Inc. (Jacobs) is proud to be a part of this excellent organization. Our operations and maintenance staff is committed to providing the best service possible, always keeping cost and compliance in mind. Several operators have worked at the plant since startup in 2001.
The Bear Creek WTP received the Platinum Award for Five Years of Operation with No Permit Violations.
Bear Creek Reservoir, Treatment, and Transmission Facilities
The Upper Oconee Basin Water Authority
Jacobs Engineering Group, Inc. Issue Date: March 2014
3
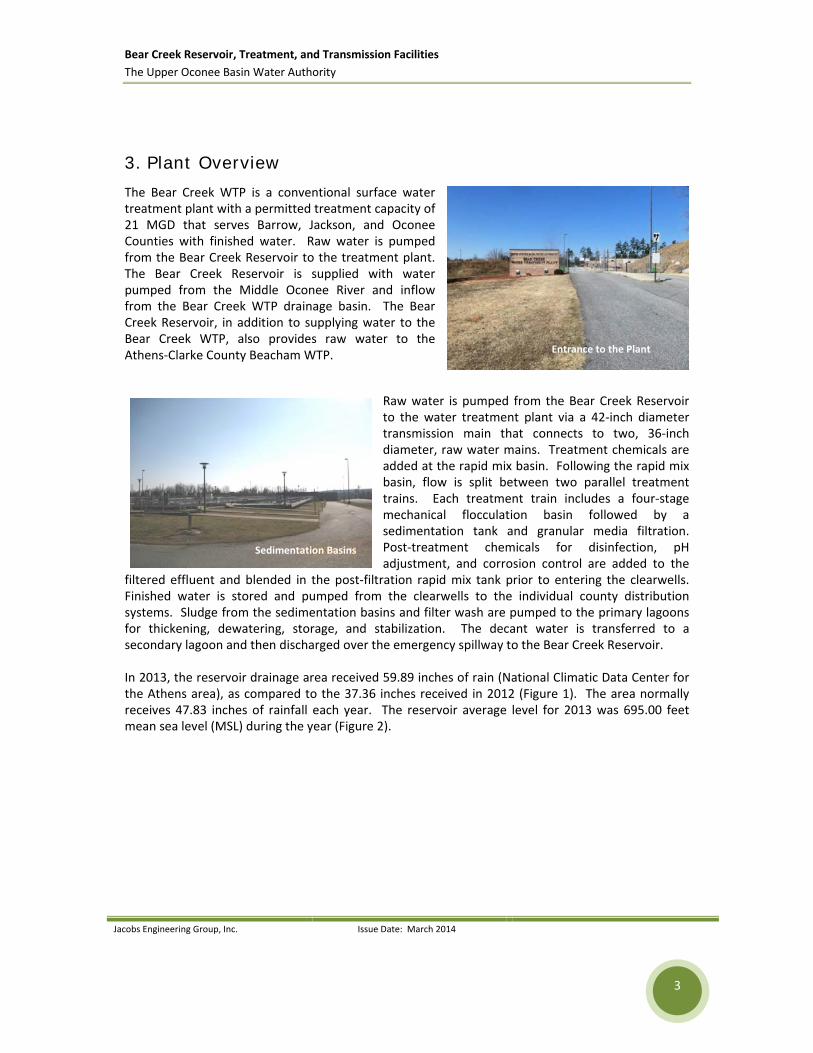
3. Plant Overview
The Bear Creek WTP is a conventional surface water treatment plant with a permitted treatment capacity of 21 MGD that serves Barrow, Jackson, and Oconee Counties with finished water. Raw water is pumped from the Bear Creek Reservoir to the treatment plant. The Bear Creek Reservoir is supplied with water pumped from the Middle Oconee River and inflow from the Bear Creek WTP drainage basin. The Bear Creek Reservoir, in addition to supplying water to the Bear Creek WTP, also provides raw water to the Athens‐Clarke County Beacham WTP.
Raw water is pumped from the Bear Creek Reservoir to the water treatment plant via a 42‐inch diameter transmission main that connects to two, 36‐inch diameter, raw water mains. Treatment chemicals are added at the rapid mix basin. Following the rapid mix basin, flow is split between two parallel treatment trains. Each treatment train includes a four‐stage mechanical flocculation basin followed by a sedimentation tank and granular media filtration. Post‐treatment chemicals for disinfection, pH adjustment, and corrosion control are added to the
filtered effluent and blended in the post‐filtration rapid mix tank prior to entering the clearwells. Finished water is stored and pumped from the clearwells to the individual county distribution systems. Sludge from the sedimentation basins and filter wash are pumped to the primary lagoons for thickening, dewatering, storage, and stabilization. The decant water is transferred to a secondary lagoon and then discharged over the emergency spillway to the Bear Creek Reservoir. In 2013, the reservoir drainage area received 59.89 inches of rain (National Climatic Data Center for the Athens area), as compared to the 37.36 inches received in 2012 (Figure 1). The area normally receives 47.83 inches of rainfall each year. The reservoir average level for 2013 was 695.00 feet mean sea level (MSL) during the year (Figure 2).
Sedimentation Basins
Entrance to the Plant

Bear Creek Reservoir, Treatment, and Transmission Facilities
The Upper Oconee Basin Water Authority
Jacobs Engineering Group, Inc. Issue Date: March 2014
4
Figure 1 – Rainfall 2010 through 2013
Figure 2 – Bear Creek Reservoir 2013 Level

Bear Creek Reservoir, Treatment, and Transmission Facilities
The Upper Oconee Basin Water Authority
Jacobs Engineering Group, Inc. Issue Date: March 2014
5
The water treatment plant experienced a lower demand than in the previous year, processing 2,657 million gallons of raw water in 2013 in comparison to 2,762 million gallons in 2012, a decrease of 105 million gallons for the year.
4. Reservoir Management Plan
The Authority recognizes that a safe and reliable source of water is essential to growth and for meeting the water needs of the four‐county region in periods of draught. The Authority set in place a Reservoir Management Plan comprised of rules and regulations governing lakeshore management and public use of the Bear Creek Reservoir. The primary purpose of these rules and regulations is to preserve and protect the quality of water in the Bear Creek Reservoir.
The following are some highlights of the Reservoir Management Plan:
Jackson County Public Development Department continues to enforce the rules and regulations of the Reservoir Management Plan.
The Bear Creek WTP website is updated on a regular basis and can be located at http://www.bearcreekwtp.com providing information about the Authority, Bear Creek WTP, and recreation on the reservoir.
The Algae Growth Control Program (periodic sampling and application of algaecide) is scheduled during the summer months as required.
5. Bear Creek Water Treatment Plant
5.1. Flows The facility processed a total flow of 2,657 million gallons of raw water for the January to December 2013 reporting period (Figure 3). For additional information, please see Appendix A – 2013 Monthly Flows.
The facility also pumped 2,316 million gallons of finished water to the distribution system (Figure 4).
Reservoir

Bear Creek Reservoir, Treatment, and Transmission Facilities
The Upper Oconee Basin Water Authority
Jacobs Engineering Group, Inc. Issue Date: March 2014
6
Figure 3 – Bear Creek WTP 2013 Processed Flows
Figure 4 – Bear Creek WTP 2013 Distribution Flows
Bear Creek Reservoir, Treatment, and Transmission Facilities
The Upper Oconee Basin Water Authority
Jacobs Engineering Group, Inc. Issue Date: March 2014
7
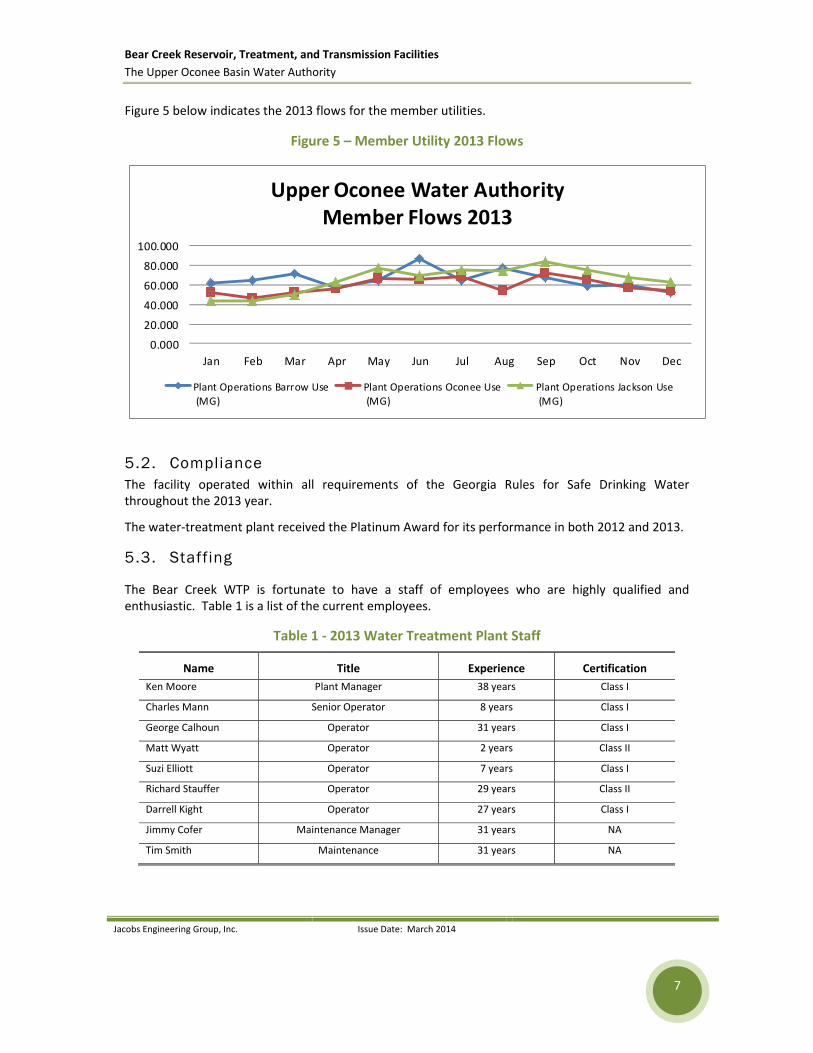
Figure 5 below indicates the 2013 flows for the member utilities.
Figure 5 – Member Utility 2013 Flows
0.000
20.000
40.000
60.000
80.000
100.000
Jan Feb Mar Apr May Jun Jul Aug Sep Oct Nov Dec
Upper Oconee Water AuthorityMember Flows 2013
Plant Operations Barrow Use (MG)
Plant Operations Oconee Use (MG)
Plant Operations Jackson Use (MG)
5.2. Compliance The facility operated within all requirements of the Georgia Rules for Safe Drinking Water throughout the 2013 year.
The water‐treatment plant received the Platinum Award for its performance in both 2012 and 2013.
5.3. Staffing
The Bear Creek WTP is fortunate to have a staff of employees who are highly qualified and enthusiastic. Table 1 is a list of the current employees.
Table 1 ‐ 2013 Water Treatment Plant Staff
Name Title Experience Certification
Ken Moore Plant Manager 38 years Class I
Charles Mann Senior Operator 8 years Class I
George Calhoun Operator 31 years Class I
Matt Wyatt Operator 2 years Class II
Suzi Elliott Operator 7 years Class I
Richard Stauffer Operator 29 years Class II
Darrell Kight Operator 27 years Class I
Jimmy Cofer Maintenance Manager 31 years NA
Tim Smith Maintenance 31 years NA
Bear Creek Reservoir, Treatment, and Transmission Facilities
The Upper Oconee Basin Water Authority
Jacobs Engineering Group, Inc. Issue Date: March 2014
8
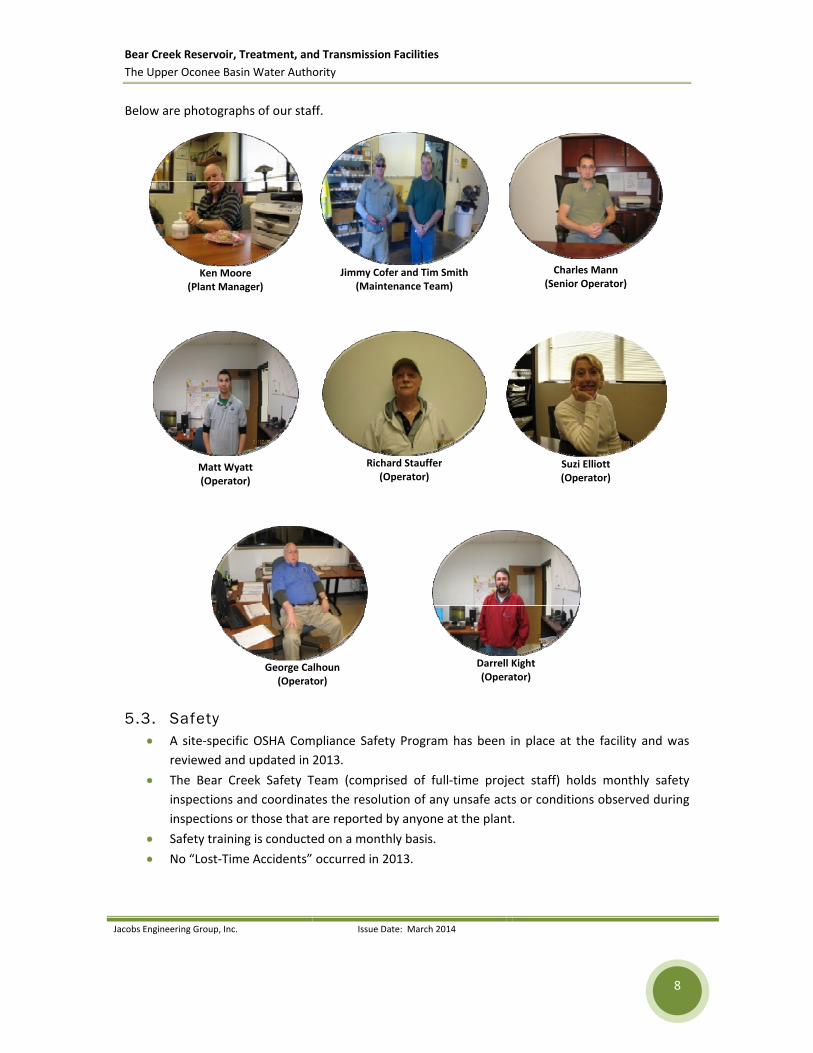
Below are photographs of our staff.
Ken Moore
(Plant Manager)
Jimmy Cofer and Tim Smith
(Maintenance Team)
Charles Mann
(Senior Operator)
Matt Wyatt (Operator)
Richard Stauffer
(Operator)
Suzi Elliott (Operator)
George Calhoun
(Operator)
Darrell Kight (Operator)
5.3. Safety A site‐specific OSHA Compliance Safety Program has been in place at the facility and was
reviewed and updated in 2013.
The Bear Creek Safety Team (comprised of full‐time project staff) holds monthly safety
inspections and coordinates the resolution of any unsafe acts or conditions observed during
inspections or those that are reported by anyone at the plant.
Safety training is conducted on a monthly basis.
No “Lost‐Time Accidents” occurred in 2013.
Bear Creek Reservoir, Treatment, and Transmission Facilities
The Upper Oconee Basin Water Authority
Jacobs Engineering Group, Inc. Issue Date: March 2014
9
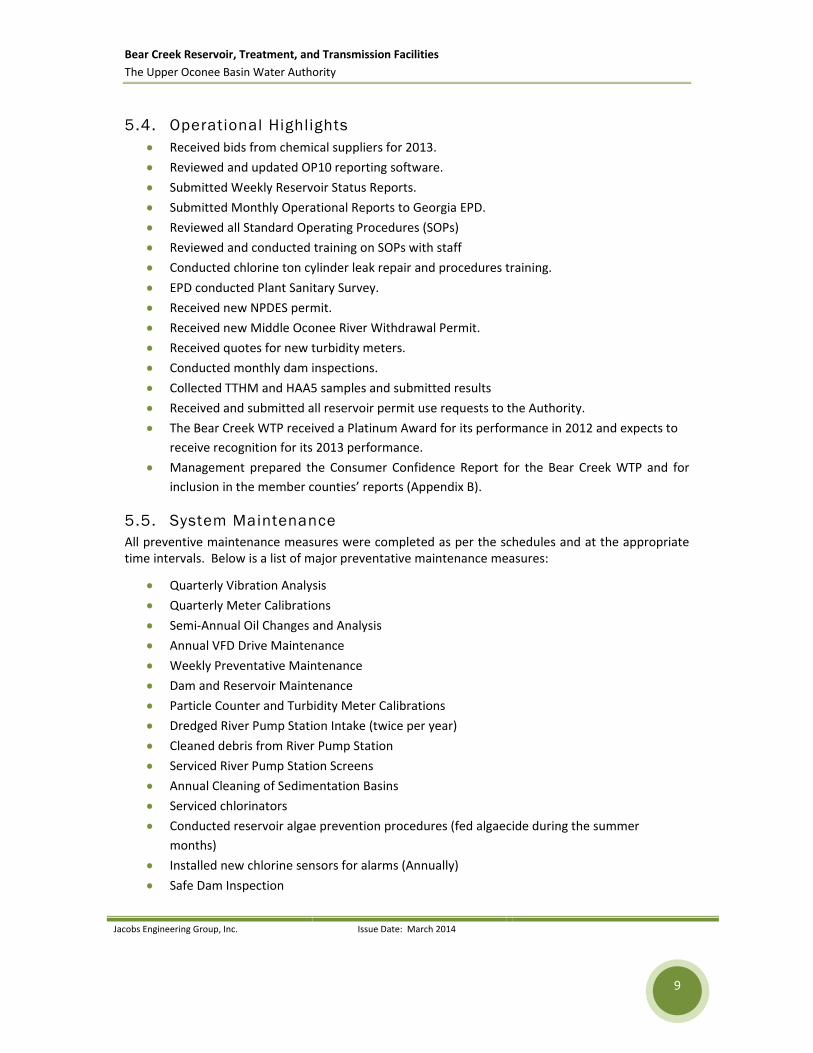
5.4. Operational Highlights Received bids from chemical suppliers for 2013.
Reviewed and updated OP10 reporting software.
Submitted Weekly Reservoir Status Reports.
Submitted Monthly Operational Reports to Georgia EPD.
Reviewed all Standard Operating Procedures (SOPs)
Reviewed and conducted training on SOPs with staff
Conducted chlorine ton cylinder leak repair and procedures training.
EPD conducted Plant Sanitary Survey.
Received new NPDES permit.
Received new Middle Oconee River Withdrawal Permit.
Received quotes for new turbidity meters.
Conducted monthly dam inspections.
Collected TTHM and HAA5 samples and submitted results
Received and submitted all reservoir permit use requests to the Authority.
The Bear Creek WTP received a Platinum Award for its performance in 2012 and expects to
receive recognition for its 2013 performance.
Management prepared the Consumer Confidence Report for the Bear Creek WTP and for
inclusion in the member counties’ reports (Appendix B).
5.5. System Maintenance All preventive maintenance measures were completed as per the schedules and at the appropriate time intervals. Below is a list of major preventative maintenance measures:
Quarterly Vibration Analysis
Quarterly Meter Calibrations
Semi‐Annual Oil Changes and Analysis
Annual VFD Drive Maintenance
Weekly Preventative Maintenance
Dam and Reservoir Maintenance
Particle Counter and Turbidity Meter Calibrations
Dredged River Pump Station Intake (twice per year)
Cleaned debris from River Pump Station
Serviced River Pump Station Screens
Annual Cleaning of Sedimentation Basins
Serviced chlorinators
Conducted reservoir algae prevention procedures (fed algaecide during the summer
months)
Installed new chlorine sensors for alarms (Annually)
Safe Dam Inspection
Bear Creek Reservoir, Treatment, and Transmission Facilities
The Upper Oconee Basin Water Authority
Jacobs Engineering Group, Inc. Issue Date: March 2014
10
Conducted Backflow Preventer Certification Testing
Dam maintenance, repaired washouts, cut trees, monitored dam for leakage, and quarterly
inspections
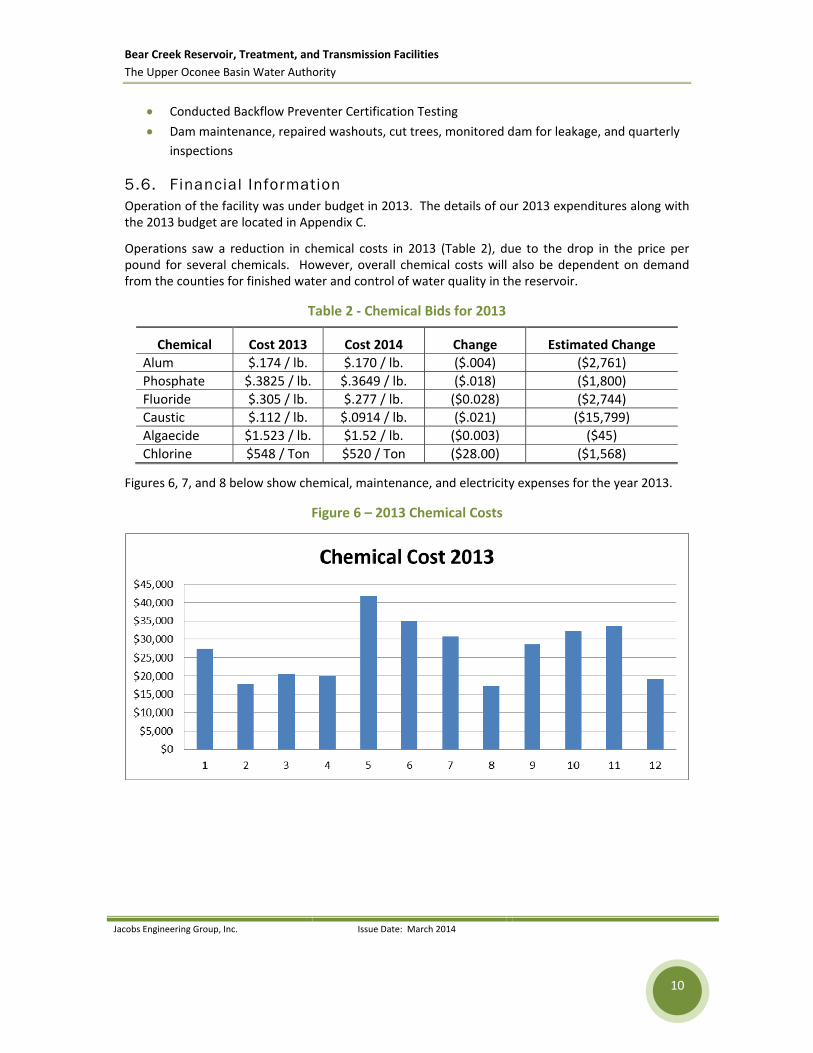
5.6. Financial Information Operation of the facility was under budget in 2013. The details of our 2013 expenditures along with the 2013 budget are located in Appendix C.
Operations saw a reduction in chemical costs in 2013 (Table 2), due to the drop in the price per pound for several chemicals. However, overall chemical costs will also be dependent on demand from the counties for finished water and control of water quality in the reservoir.
Table 2 ‐ Chemical Bids for 2013
Chemical Cost 2013 Cost 2014 Change Estimated Change
Alum $.174 / lb. $.170 / lb. ($.004) ($2,761)
Phosphate $.3825 / lb. $.3649 / lb. ($.018) ($1,800)
Fluoride $.305 / lb. $.277 / lb. ($0.028) ($2,744)
Caustic $.112 / lb. $.0914 / lb. ($.021) ($15,799)
Algaecide $1.523 / lb. $1.52 / lb. ($0.003) ($45)
Chlorine $548 / Ton $520 / Ton ($28.00) ($1,568)
Figures 6, 7, and 8 below show chemical, maintenance, and electricity expenses for the year 2013.
Figure 6 – 2013 Chemical Costs

Bear Creek Reservoir, Treatment, and Transmission Facilities
The Upper Oconee Basin Water Authority
Jacobs Engineering Group, Inc. Issue Date: March 2014
11
Figure 7 – 2013 Monthly Maintenance Expense
Figure 8 – 2013 Monthly Electrical Costs

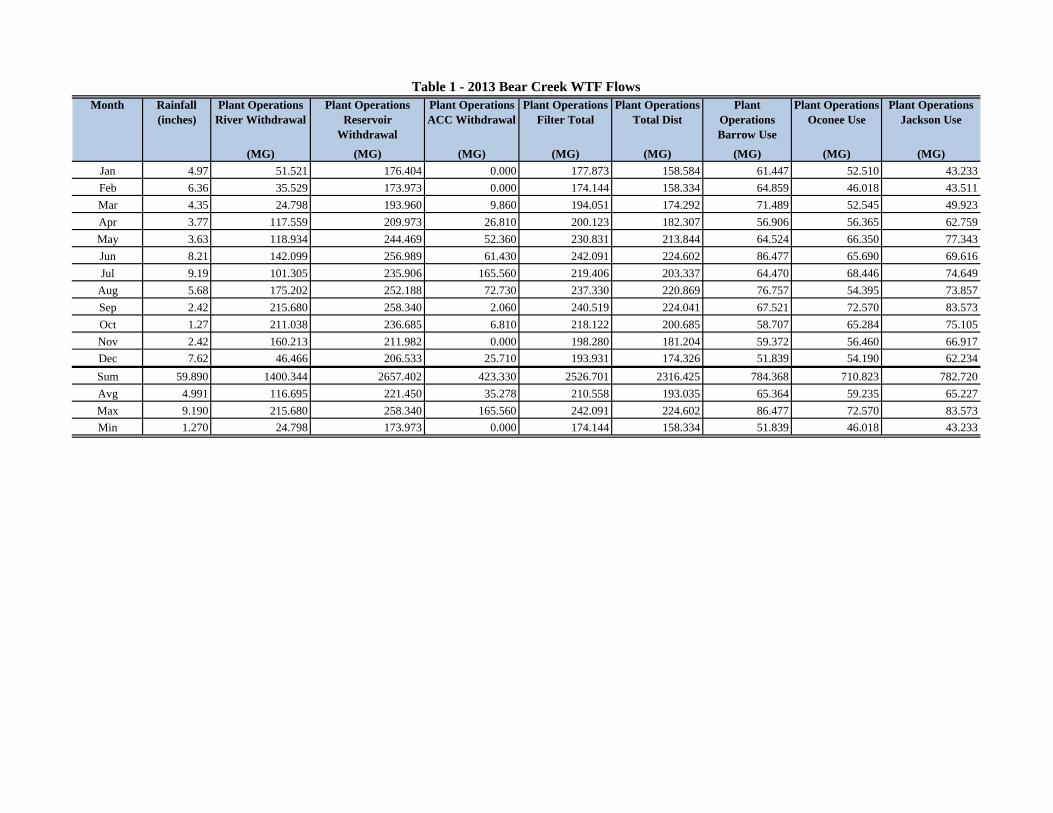
APPENDIX A 2013 MONTHLY FLOWS
Month Rainfall (inches)
Plant Operations River Withdrawal
Plant Operations Reservoir
Withdrawal
Plant Operations ACC Withdrawal
Plant Operations Filter Total
Plant Operations Total Dist
Plant Operations Barrow Use
Plant Operations Oconee Use
Plant Operations Jackson Use
(MG) (MG) (MG) (MG) (MG) (MG) (MG) (MG)
Jan 4.97 51.521 176.404 0.000 177.873 158.584 61.447 52.510 43.233
Feb 6.36 35.529 173.973 0.000 174.144 158.334 64.859 46.018 43.511
Mar 4.35 24.798 193.960 9.860 194.051 174.292 71.489 52.545 49.923
Apr 3.77 117.559 209.973 26.810 200.123 182.307 56.906 56.365 62.759
May 3.63 118.934 244.469 52.360 230.831 213.844 64.524 66.350 77.343
Jun 8.21 142.099 256.989 61.430 242.091 224.602 86.477 65.690 69.616
Jul 9.19 101.305 235.906 165.560 219.406 203.337 64.470 68.446 74.649
Aug 5.68 175.202 252.188 72.730 237.330 220.869 76.757 54.395 73.857
Sep 2.42 215.680 258.340 2.060 240.519 224.041 67.521 72.570 83.573
Oct 1.27 211.038 236.685 6.810 218.122 200.685 58.707 65.284 75.105
Nov 2.42 160.213 211.982 0.000 198.280 181.204 59.372 56.460 66.917
Dec 7.62 46.466 206.533 25.710 193.931 174.326 51.839 54.190 62.234
Sum 59.890 1400.344 2657.402 423.330 2526.701 2316.425 784.368 710.823 782.720
Avg 4.991 116.695 221.450 35.278 210.558 193.035 65.364 59.235 65.227
Max 9.190 215.680 258.340 165.560 242.091 224.602 86.477 72.570 83.573
Min 1.270 24.798 173.973 0.000 174.144 158.334 51.839 46.018 43.233
Table 1 - 2013 Bear Creek WTF Flows

APPENDIX B CONSUMER CONFIDENCE REPORT WATER DATA
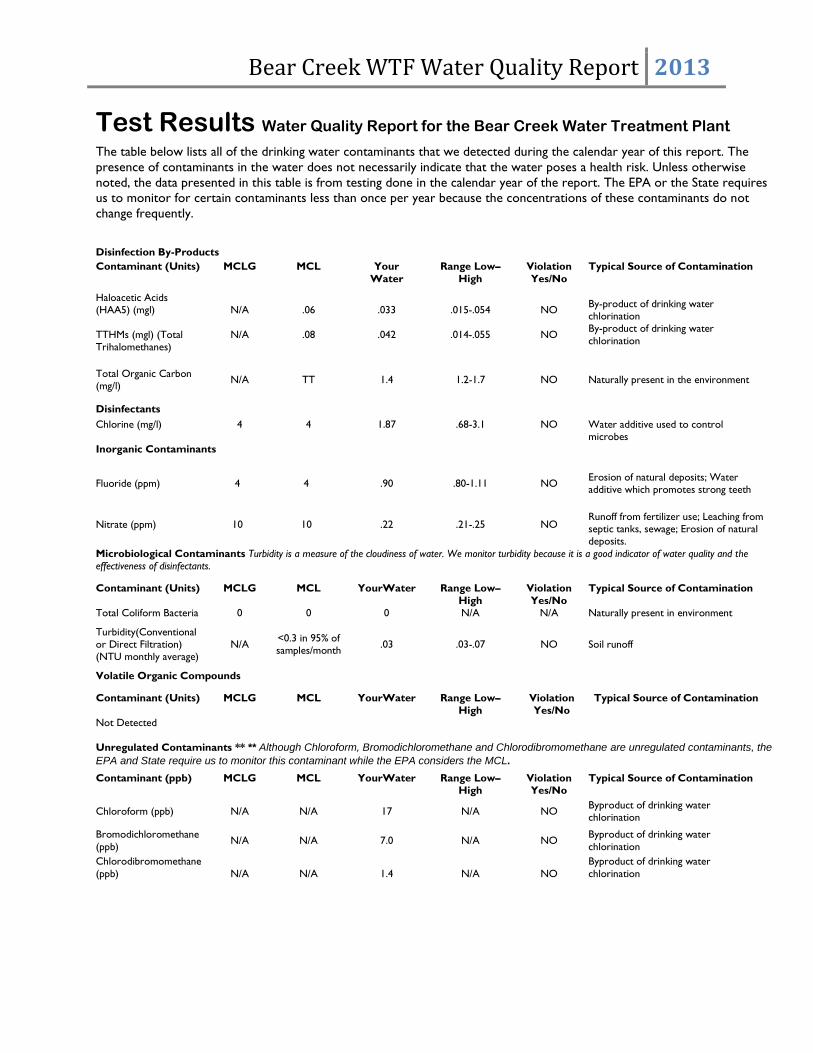
Bear Creek WTF Water Quality Report 2013
Test Results Water Quality Report for the Bear Creek Water Treatment Plant
The table below lists all of the drinking water contaminants that we detected during the calendar year of this report. The
presence of contaminants in the water does not necessarily indicate that the water poses a health risk. Unless otherwise
noted, the data presented in this table is from testing done in the calendar year of the report. The EPA or the State requires
us to monitor for certain contaminants less than once per year because the concentrations of these contaminants do not
change frequently.
Disinfection By-Products
Contaminant (Units) MCLG MCL Your
Water
Range Low–
High
Violation
Yes/No
Typical Source of Contamination
Haloacetic Acids (HAA5) (mgl)
TTHMs (mgl) (Total
Trihalomethanes)
N/A
N/A
.06
.08
.033
.042
.015-.054
.014-.055
NO
NO
By-product of drinking water chlorination By-product of drinking water
chlorination
Total Organic Carbon (mg/l)
N/A TT 1.4 1.2-1.7 NO Naturally present in the environment
Disinfectants
Chlorine (mg/l) 4 4 1.87 .68-3.1 NO Water additive used to control microbes
Inorganic Contaminants
Fluoride (ppm) 4 4 .90 .80-1.11 NO Erosion of natural deposits; Water additive which promotes strong teeth
Nitrate (ppm) 10 10 .22 .21-.25 NO Runoff from fertilizer use; Leaching from septic tanks, sewage; Erosion of naturaldeposits.
Microbiological Contaminants Turbidity is a measure of the cloudiness of water. We monitor turbidity because it is a good indicator of water quality and the effectiveness of disinfectants.
Contaminant (Units)
Total Coliform Bacteria
MCLG
0
MCL
0
YourWater
0
Range Low–
High N/A
Violation
Yes/No N/A
Typical Source of Contamination
Naturally present in environment
Turbidity(Conventional or Direct Filtration) (NTU monthly average)
N/A <0.3 in 95% of samples/month
.03 .03-.07 NO Soil runoff
Volatile Organic Compounds
Contaminant (Units)
Not Detected
MCLG MCL YourWater Range Low–
High
Violation
Yes/No
Typical Source of Contamination
Unregulated Contaminants ** ** Although Chloroform, Bromodichloromethane and Chlorodibromomethane are unregulated contaminants, the
EPA and State require us to monitor this contaminant while the EPA considers the MCL.
Contaminant (ppb) MCLG MCL YourWater Range Low–High
Violation Yes/No
Typical Source of Contamination
Chloroform (ppb) N/A N/A 17 N/A NO Byproduct of drinking water chlorination
Bromodichloromethane
(ppb) N/A N/A 7.0 N/A NO
Byproduct of drinking water
chlorination
Chlorodibromomethane
(ppb) N/A N/A 1.4 N/A NO
Byproduct of drinking water
chlorination

APPENDIX C 2014 BUDGET

JJ&G Services, Inc. Issue Date: March 2012
Jacobs Field Services North America 6801 Governors Lake Parkway, Bldg. 200
Norcross, Georgia 30071 t 770.455.8555 / f 770.455.7391
2013 Annual Report


