Lee, K. K. et al. (2013). Ge ´otechnique 63, No. 15, 1285–1297 [http://dx.doi.org/10.1680/geot.12.P.176] 1285 Bearing capacity on sand overlying clay soils: a simplified conceptual model K. K. LEE , M. F. RANDOLPH† and M. J. CASSIDY† The derivation of a new conceptual model for predicting the peak penetration resistance of circular footings installed vertically into sand overlying soft clay is presented in this paper. Based on visualisation experiments and finite-element analyses, a failure mechanism of a frustum of sand being forced into the underlying clay, with the outer angle reflecting the dilation in the sand, is assumed. The analytical basis of the new conceptual model follows the approach for silo analysis, and takes into account the stress level and dilatant response of the sand. A comprehensive analysis of the performance of the new model, and other existing analytical methods, in retrospectively predicting the peak resistance of a database of 49 geotechnical centrifuge tests is provided. Significant improvements over existing punching shear and load spread models are shown, as a result of incorporating the strength properties of the sand in a consistent manner. The new model has application to the offshore mobile ‘jack-up’ industry, where inaccurate predictions of peak capacity in layered soils continue to cause damaging punch-through failures. KEYWORDS: bearing capacity; footings/foundations; offshore engineering INTRODUCTION This paper describes the derivation of a new conceptual model for predicting the peak penetration resistance of circular foundations in stratified sediments with sand over- lying clay. The motivation for this comes principally from the offshore industry, where unexpected punch-through fail- ures occur relatively frequently during the installation of mobile jack-up platforms (Osborne & Paisley, 2002; Osborne et al., 2006, 2009). Such failures involve one of the spudcan footings of the jack-up platform uncontrollably punching locally stronger sand into underlying softer clay material. Accurate determination of the peak penetration resistance before this occurs is a critical component in predicting hazardous installation conditions. The model may also be applied more broadly to the capacity of shallow circular footings on layered sand over clay profiles. The traditional analytical methods used to calculate the peak penetration resistance on sand overlying clay are the punching shear method as shown in Fig. 1(a), which is based on Hanna & Meyerhof (1980), and the projected area method as shown in Fig. 1(b). Both methods have been proposed as the basis for predicting the peak penetration resistance, q peak , of spudcans in the jack-up industry guide- lines (SNAME, 2002). In the primary approach, q peak is calculated following the punching shear method, but with the recommendation that the product of the punching shear coefficient, K s , and tan ö9 is related to the shear strength, s u , of the underlying clay layer by K s tan ö9 ¼ 3 s u ª9 s D (1) where D is the equivalent spudcan diameter, and ª9 s is the Manuscript received 19 November 2012; revised manuscript accepted 29 May 2013. Published online ahead of print 18 July 2013. Discussion on this paper closes on 1 May 2014, for further details see p. ii. Advanced Geomechanics (former PhD student of the University of Western Australia). † Centre for Offshore Foundation Systems, The University of Western Australia, Perth, Australia. Q q D peak peak 2 ( /4) π q 0 H s D z ( ) tan q zsK 0 s s s γ φ Sand: , φ γ s Clay: s u C L sNs q c cu 0 (a) Q q D peak peak 2 ( /4) π q 0 H s D Sand: , φ γ s Clay: s u C L sNs q c cu 0 (b) α α Fig. 1. Prediction methods recommended in jack-up industry guidelines (SNAME, 2002): (a) punching shear method; (b) projected area method
Transcript
Lee, K. K. et al. (2013). Geotechnique 63, No. 15, 1285–1297 [http://dx.doi.org/10.1680/geot.12.P.176]
1285
Bearing capacity on sand overlying clay soils: a simplified conceptualmodel
K. K. LEE�, M. F. RANDOLPH† and M. J. CASSIDY†
The derivation of a new conceptual model for predicting the peak penetration resistance of circularfootings installed vertically into sand overlying soft clay is presented in this paper. Based onvisualisation experiments and finite-element analyses, a failure mechanism of a frustum of sand beingforced into the underlying clay, with the outer angle reflecting the dilation in the sand, is assumed.The analytical basis of the new conceptual model follows the approach for silo analysis, and takesinto account the stress level and dilatant response of the sand. A comprehensive analysis of theperformance of the new model, and other existing analytical methods, in retrospectively predicting thepeak resistance of a database of 49 geotechnical centrifuge tests is provided. Significant improvementsover existing punching shear and load spread models are shown, as a result of incorporating thestrength properties of the sand in a consistent manner. The new model has application to the offshoremobile ‘jack-up’ industry, where inaccurate predictions of peak capacity in layered soils continue tocause damaging punch-through failures.
INTRODUCTIONThis paper describes the derivation of a new conceptualmodel for predicting the peak penetration resistance ofcircular foundations in stratified sediments with sand over-lying clay. The motivation for this comes principally fromthe offshore industry, where unexpected punch-through fail-ures occur relatively frequently during the installation ofmobile jack-up platforms (Osborne & Paisley, 2002; Osborneet al., 2006, 2009). Such failures involve one of the spudcanfootings of the jack-up platform uncontrollably punchinglocally stronger sand into underlying softer clay material.Accurate determination of the peak penetration resistancebefore this occurs is a critical component in predictinghazardous installation conditions. The model may also beapplied more broadly to the capacity of shallow circularfootings on layered sand over clay profiles.
The traditional analytical methods used to calculate thepeak penetration resistance on sand overlying clay are thepunching shear method as shown in Fig. 1(a), which isbased on Hanna & Meyerhof (1980), and the projected areamethod as shown in Fig. 1(b). Both methods have beenproposed as the basis for predicting the peak penetrationresistance, qpeak, of spudcans in the jack-up industry guide-lines (SNAME, 2002). In the primary approach, qpeak iscalculated following the punching shear method, but withthe recommendation that the product of the punching shearcoefficient, Ks, and tan�9 is related to the shear strength, su,of the underlying clay layer by
Ks tan�9 ¼ 3su
ª9sD(1)
where D is the equivalent spudcan diameter, and ª9s is the
Manuscript received 19 November 2012; revised manuscript accepted29 May 2013. Published online ahead of print 18 July 2013.Discussion on this paper closes on 1 May 2014, for further detailssee p. ii.� Advanced Geomechanics (former PhD student of the University ofWestern Australia).† Centre for Offshore Foundation Systems, The University of WesternAustralia, Perth, Australia.
Q q Dpeak peak2( /4)� π
q0
Hs
D
z
( ) tanq z s K0 s s s� � �γ φ
Sand: ,φ γ� �s
Clay: su
CL
s N s qc c u 0�
(a)
Q q Dpeak peak2( /4)� π
q0
Hs
D Sand: ,φ γ� �s
Clay: su
CL
s N s qc c u 0�
(b)
α α
Fig. 1. Prediction methods recommended in jack-up industryguidelines (SNAME, 2002): (a) punching shear method;(b) projected area method
effective unit weight of the sand. An alternative designapproach is provided in the commentary to the SNAMEguidelines using the projected area method, in which theload is assumed to be projected through the upper sand layerto an imaginary footing of increased bearing area at thesand/clay boundary. There remains debate as to appropriatevalues of the assumed angle of spread, with the range 1:5 to1:3 (horizontal:vertical) recommended in SNAME. By ignor-ing the properties of the upper sand layer (since even in thepunching shear approach the frictional resistance through thesand is expressed in terms of the strength of the underlyingclay), both methods provide oversimplified approacheswhereby the ratio of qpeak to the bearing capacity of theunderlying clay increases as a simple quadratic function ofthe ratio of the upper sand thickness to the foundationdiameter, Hs/D.
Two alternative prediction methods have been developedmore recently by Okamura et al. (1998) and Teh (2007).Okamura et al. (1998) proposed a new limit equilibriummethod with a failure mechanism that combines the conceptof the projected area method and the punching shear method,as shown in Fig. 2. To incorporate the influence of stresslevel on friction angle, Okamura et al. (1998) proposedcalculating the friction angle �9 through an iterative proce-dure between �9 and the initial mean effective stress at themid-depth of the sand layer, with the assumption that thenormal stress at the slip surface is at a passive failure state.
Two empirical relationships in which �9 reduced with thelogarithm of mean effective stress were proposed to be usedin the iterative procedure, although these relationships weredeveloped for the sand used in their model tests. Using thismethod, however, the stress-level dependence of frictionangle is not totally accounted for. This is because �9 isrelated only to the initial stress level rather than the actualstress level at failure, which is also influenced by foundationsize and the strength of the underlying clay.
The method proposed by Teh (2007) is based on observa-tions of spudcan failure mechanisms from visualisation ex-periments (Teh et al., 2008), and was calibrated againstcentrifuge test results (Teh et al., 2010). A simplified dia-gram of the model is shown in Fig. 3; the peak penetrationresistance is calculated as the sum of regions of full andreduced bearing capacity in the underlying clay and frictionalresistance along a shear surface at angle ł to the vertical(noting that ł is not a dilation angle in this method, but ageometrical parameter used to represent the shear surfaceinclination). Teh (2007) provides semi-logarithmic designcharts to calculate ł and two other model parameters.
A series of 30 geotechnical centrifuge experiments on theinstallation of circular flat and spudcan foundations in sandoverlying clay was reported in Lee et al. (2013). Thisdatabase, obtained from tests conducted on two consistentsamples in a drum centrifuge, provides the most comprehen-sive set of ratios of sand height to diameter for conceptualmodel calibration. Retrospective simulation of this databaseusing finite-element analysis showed that larger values ofpeak resistance gave lower operational friction and dilationangles, which is consistent with the gradual suppression ofdilatancy under high confining stress. The finite-elementanalysis gave failure mechanisms during peak resistancesimilar to those observed in the centrifuge visualisationexperiments of Teh et al. (2008), where a frustum of sandwas forced into the underlying clay, with the outer anglecorresponding to the dilation angle of the sand (Lee et al.,2013).
This mechanism and the database of experimental resultsform the basis of the analytical model for bearing capacityof foundations on sand overlying clay described here. Themodel is based on silo analysis, applying force equilibriumto an idealised frustum of sand rupturing along a conicalsurface between the sand/clay interface and the periphery ofthe bottom of the footing (Lee et al., 2009). As the keymotivation for this research was to develop a simple mathe-matical model for use within the offshore jack-up industry,the model is relatively simple, is straightforward to imple-ment, and has well-defined input parameters that can bederived from standard offshore site investigation.
CONCEPTUAL MODELAssumed failure mechanism
The model is consistent with the kinematically admissiblefailure mechanism that was adopted by Vermeer & Sutjiadi(1985) for the uplift resistance of anchor plates in sand.They observed from finite-element computations and modeltests that the failure mechanism involved approximatelystraight (in any vertical plane) rupture surfaces, at aninclination corresponding to the dilation angle ł of the sand,from the edge of the anchor to the soil surface. For acircular anchor plate, the rupture surfaces formed an over-turned truncated-cone sand block above the anchor.
The conceptual model of this paper assumes a similarfailure mechanism, except that the truncated-cone sand blockis upside down, compared with the anchor problem, and thebase of the conceptual sand frustum is resisted by theunderlying clay. It is a consistent but slightly idealised
Q q Dpeak peak2( /4)� π
q0
z
Hs αc
Sand: ,φ γ� �s
Clay: suqclay
A
B
αc
τ
Footing
D
(a)
τ/suDirection ofslip line
1
0
�1
Pole forcircle A
φ�αc
A
B
σmc u/s
Pole forcircle B
σ/su
(b)
Fig. 2. Illustration of model of Okamura et al. (1998): (a) assumedfailure mechanism; (b) Mohr-circle of stress for soil elements Aand B (after Okamura et al., 1998)
1286 LEE, RANDOLPH AND CASSIDY
version of the failure mechanisms observed in centrifugetests using photogrammetry and particle image velocimetry(PIV) techniques (Teh et al., 2008). These showed shearsurfaces in homogeneous sand that were trumpet-shaped atpeak penetration resistance, reducing gradually to verticalshear surfaces during post-peak penetration on sand over-lying clay. This indicates that the dilation angle is notconstant, even in homogeneous sand, and continues toreduce with strain during the penetration process. The con-ceptual model described here simplifies this observed behav-iour by adopting a single operative dilation angle andfriction angle. This is considered acceptable, since theprimary focus is on conditions at peak penetration resistance,as required in the jack-up industry. The adopted operativefriction and dilation angles are consistent with a modifiedset of stress–dilatancy relationships from Bolton (1986),which was obtained from back-analyses through finite-ele-ment analyses using Mohr–Coulomb and Tresca models, asdiscussed in Lee et al. (2013).
Figure 4 shows the kinematically admissible axisymmetricfailure mechanism for the conceptual model, where qpeak isthe peak penetration resistance; q0 is the surcharge at thesand surface; qb is the bearing capacity of the underlyingclay; � and � 9n are the frictional resistance and normaleffective stress along the assumed slip surface; �9, ł and ª9sare the friction angle, dilation angle and effective unitweight of the upper sand layer respectively; su0 and r arethe undrained strength at the sand/clay interface and thestrength gradient of the underlying clay respectively; D isthe foundation diameter; and Hs is the sand thickness.
COMPONENTS OF THE MODELBearing capacity of the underlying clay
The resistance from the underlying clay is assumed to bethe full bearing capacity of the projected footing at the baseof the sand frustum. Classical bearing capacity theory isused, with the behaviour assumed to be undrained under thetypical spudcan loading rate. The bearing capacity of theunderlying clay, qb, is calculated as
qb ¼ N c0su0 þ q0 þ ª9sH s (2)
The bearing capacity factor, Nc0, is given as a function ofthe non-dimensional parameter k, defined as
k ¼ r Dþ 2H s tanłð Þsu0
(3)
The Nc0 values are adopted from Martin (2001) andHoulsby & Martin (2003), who provided bearing capacityfactors for flat-based rigid circular foundations on a weight-less isotropic Tresca soil with strength increasing linearlywith depth. Houlsby & Martin (2003) also proposed a linearcurve-fit for Nc0, expressed as
DH
diametersand thickness
��s
Sand
Assumed straight conicalslip surface for simplicity
Trumpet-shaped slipsurface observedfrom tests
Clay
R
rFullbearingcapacity( )qclay
Linearly reduced bearingcapacity (from to 0·5 )q qclay clay
φ2 γ�
CL
Q q Dpeak peak2( /4)� π
αa
ψ
d H0·12� s
h H0·88� s
Fig. 3. Schematic diagram of model of Teh (2007)
Q q Dpeak peak2( /4)� π
q0
rR D/2�
ψz
Hs CL
dz
R z tan� ψ
(Thin horizontal discs)
qbClay: ,su0 ρ
τ
σ�n
ψ
Sand: , ,φ ψ γ� �s
Fig. 4. Series of thin horizontal discs in the conceptual sandfrustum
BEARING CAPACITY ON SAND OVERLYING CLAY SOILS: A SIMPLIFIED CONCEPTUAL MODEL 1287
N c0 ¼ 6:34þ 0:56k (4)
This expression is accurate to within 5% of the tabulatedvalues in the range 0 , k , 10 (Houlsby & Martin, 2003),and is adopted here.
Resistance of the slip surfacesAnalytical treatment of equilibrium within the sand fol-
lows the method of ‘differential slices’, as used for predict-ing the forces on the walls of silos and hoppers (e.g.Walters, 1973). This approach was also used by Randolph etal. (1991) to analyse the soil plug capacity in open-endedpiles under various loading conditions.
In the punch-through problem of sand overlying clay, thesand frustum is treated as a series of thin horizontal discs,as shown in Fig. 4. Cylindrical coordinates are used, withthe origin at the centre base of the foundation, r the radialcoordinate, and z the vertical coordinate with positive direc-tion downwards.
Normal and shear stresses at the slip surfaces. Drescher &Detournay (1993) showed that for kinematic mechanismscomposed of rigid blocks and velocity discontinuities, the useof a reduced friction angle, ��, instead of �9 furnishesreasonable limit load estimates for materials with coaxialnon-associated flow rules. They suggested that �� be viewedas a reduced friction angle that accounts for the softening thatmay be induced under certain stress conditions by a non-associated flow rule.
Davis (1968) and Drescher & Detournay (1993) gave theequation for the reduced friction angle �� as
tan�� ¼ sin�9 cosł
1� sin�9 sinł(5)
noting that this restricts �� to sin�9 , tan�� , tan�9,depending on the dilatancy angle. The lower bound isobtained for a non-dilatant material (ł ¼ 0), and the upperbound corresponds to an associated flow rule where ł ¼ �9.Consequently, the shear stress at the slip surface for africtional material can be written as
� ¼ � 9n tan�� (6)
Equation (6) relates the normal and shear stresses alongthe slip surface. However, just as for analogous problemssuch as calculating shaft friction of piles, it is difficult toestimate the normal effective stress along the slip surface.The following section presents a simple method to overcomethis by relating � 9n along the slip surface to the averagevertical effective stress within the sand frustum through anempirical factor.
Vertical effective stress within the sand frustum. For a rigidfoundation on sand overlying clay, the vertical effectivestresses beneath the foundation vary with radial position(even at the same depth). This can be confirmed byinspecting a case of zero dilation in which the verticaleffective stress at the vertical slip surface is not a principalstress, whereas the vertical effective stress along the centre-line of the foundation is a principal stress from symmetry.
Evaluation of the distribution function of vertical effectivestress at a particular depth beneath the foundation is extre-mely difficult. For convenience, a mean vertical effectivestress, ��� 9z, is defined as
��� 9z ¼1
� Rþ z tanłð Þ2ð� 9zdA (7)
where R is the radius and A is the area of the infinitesimaldisc element at depth z. The mean vertical stress, ��� 9z, is theaverage vertical effective stress acting on the horizontalsurface of the disc element at that depth.
The normal effective stress at the slip surface, � 9n, canthen be determined by introducing a distribution factor, DF,defined as the ratio of � 9n to the mean vertical effectivestress
DF ¼� 9n
��� 9z(8)
Using the distribution factor DF, the normal stress � 9n andshear stress � acting along the slip surfaces can be written interms of the mean vertical effective stress, ��� 9z, in the sandfrustum. Hence equation (6) can be rewritten as
� ¼ � 9n tan��
¼ DF ��� 9z tan��(9)
Vertical force equilibrium on an infinitesimal element. Figure5 shows the stresses on one of the infinitesimal disc elementswithin the conceptual sand frustum, where each element isacted on by mean vertical stresses ��� 9z at the top, ��� 9z þ d��� 9z atthe bottom, and normal and shear stresses � 9n and � at theside, which is inclined at the operative dilation angle. Theeffective unit weight of the horizontal disc element is ª9s:
The vertical force equilibrium equation on the infinitesi-mal element is
� Rþ z tanłð Þ2 ��� 9z þ � Rþ z tanłð Þ2dz � ª9s
¼ � Rþ zþ dzð Þ tanł� �2
��� 9zð Þ þ � Rþ z tanłð Þ½ �2 d��� 9zð Þ
þ 2� Rþ z tanłð Þ � cosł� � 9n sinłð Þ dz
cosł
(10)
Substituting for the normal stress � 9n and shear stress �,this can be simplified to the differential equation
d��� 9z
dzþ 2 tanłþ DF tan�� � tanłð Þ½ ���� 9z
Rþ z tanł� ª9s ¼ 0 (11)
σ �z
ds
σ �n
ψ
τ
ψ
dz γ�s
σ �z � dσ �z
Fig. 5. Stresses on an infinitesimal disc element within theconceptual sand frustum
1288 LEE, RANDOLPH AND CASSIDY
A new parameter E, defined below, is introduced, allowingthis differential equation to be simplified to
d��� 9z
dzþ E tanł � ��� 9z
Rþ z tanł� ª9s ¼ 0 (12)
where
E ¼ 2 1þ DF
tan��
tanł� 1
� �� �
Integration of vertical force equilibrium. In reality, thedistribution factor DF is likely to vary with depth, but itwould be difficult to derive an accurate function for DF fordifferent combinations of relative soil strengths and ratios ofsand thickness over foundation diameter, Hs/D. Therefore, inorder to integrate equation (12) and obtain a simple equationfor practical design, it is assumed that DF is constant. Sincethere is no rigorous theoretical treatment to determine DF, itsvalues have been derived by calibrating the final equationwith the experimental results detailed in Lee et al. (2013), asdescribed later.
Assuming DF is constant with depth, equation (12) can beintegrated to give
Rþ z tanłð ÞE ��� 9z ¼ª9s Rþ z tanłð ÞEþ1
E þ 1ð Þ tanłþ A (13)
where A is a constant to be determined from the boundarycondition.
Referring to Fig. 4, when z equals the sand thickness Hs,the mean vertical effective stress ��� 9z equals the bearingcapacity of the clay (qb ¼ N c0su0 þ q0 þ ª9sH s), and hence Acan be evaluated as
A ¼ Rþ H s tanłð ÞE
3 N c0su0 þ q0 þ ª9sH sð Þ � ª9s Rþ H s tanłð ÞE þ 1ð Þ tanł
� � (14)
By re-substituting A into equation (13), the final equationfor the mean vertical effective stress becomes
��� 9z ¼ª9s Rþ z tanłð Þ
E þ 1ð Þ tanł
þ Rþ H s tanłð ÞE
Rþ z tanłð ÞE
3 N c0su0 þ q0 þ ª9sH sð Þ � ª9s Rþ H s tanłð ÞE þ 1ð Þ tanł
� �(15)
The centrifuge test results of Lee et al. (2013)showed that the peak penetration resistance occurredvery near the sand surface, at penetrations less than aprototype depth of 1 m (for prototype foundation dia-meters ranging from 6 to 16 m). This slight indentationof the foundation into the sand has an insignificant effecton the calculated peak resistance. Therefore the peakpenetration resistance, qpeak, can be obtained by settingz ¼ 0. Replacing the radius, R, by D/2, qpeak may beexpressed as
qpeak ¼ N c0su0 þ q0ð Þ 1þ 2H s
Dtanł
� �E
þ ª9sD
2 E þ 1ð Þ tanł
3 1� 1� 2H s
DE tanł
� �1þ 2H s
Dtanł
� �E" #
< qsand
(16)
where
E ¼ 2 1þ DF
tan��
tanł� 1
� �� �
The first term for qpeak consists of the contribution fromboth the bearing capacity of the underlying clay and thefrictional resistance along the slip surfaces. The second termis due to the effective weight of the sand frustum. Theinequality is to ensure that the value of qpeak does notexceed the bearing capacity of the circular foundation in thesand alone, qsand: Methods for calculating the bearing cap-acity of circular footings in a pure sand layer are describedin, among others, Brinch Hansen (1970), Cassidy & Houlsby(1999, 2002), Randolph et al. (2004) and Lee (2009).
Design equation for zero dilation angle. Because the param-eter E in equation (16) becomes infinite when the dilationangle equals zero, a separate expression is required for thiscase. This is obtained either by taking the limit of equation(16) as ł tends to zero, or by integrating equation (11), againwith tanł ¼ 0 (Lee, 2009). Both approaches lead to
qpeak ¼ N c0su0 þ q0ð ÞeE0 þ ª9sH s eE0 1� 1
E0
� �þ 1
E0
� �
< qsand
(17)
where
E0 ¼ 4DF sin�cv
H s
D
The first term above indicates that, for zero dilation, qpeak
increases exponentially with the sand thickness Hs (or theratio Hs/D).
PARAMETER VALUES IN THE CONCEPTUAL MODELInput parameters
Table 1 summarises all input parameters for the newmodel, and some remarks on the methods of determiningthem. The input parameters are familiar quantities, and canbe determined from a proper site investigation scheme. Theconceptual model essentially involves one equation (equation(16)) and requires only input of the necessary geometry andsoil strength parameters to calculate the peak penetrationresistance, qpeak, of a foundation on sand overlying clay.
Strength parameters of sandAlthough part of equation (16), the friction and dilation
angles cannot be used directly as input parameters tocalculate qpeak: This is because they depend on the stresslevel, which will vary for different combinations of sandthickness and foundation diameter, as well as the strengthproperties of the sand and clay. However, the stress-leveldependence of the friction angle can be incorporated easily
BEARING CAPACITY ON SAND OVERLYING CLAY SOILS: A SIMPLIFIED CONCEPTUAL MODEL 1289
through an iterative procedure. It was shown in the finite-element results of Lee et al. (2013) that �9 and ł arerelated to qpeak through a modified set of strength–dilatancyrelationships from Bolton (1986), expressed as
IR ¼ ID Q� ln qpeak
� � 1, 0 , IR , 4 (18)
�9 ¼ �cv þ 2:65IR (19)
0:8ł ¼ �9� �cv, ł > 0 (20)
Starting from the in situ relative density ID, the criticalstate friction angle �cv and quantity Q (natural logarithm ofthe grain-crushing strength expressed in kPa, with defaultvalue 10), an iterative calculation procedure can be per-formed to determine qpeak: Convergence is rapid, startingwith an assumed value for ł, such as 18, evaluating �9 fromequation (20), then applying equations (16), (18), (19) and(20) in sequence to find new estimates of �9 and ł untilsatisfactory convergence is achieved.
With this approach, the appropriate operative frictionangle and dilation angle (and also the peak penetrationresistance, qpeak) can be determined using the fundamentalparameters of the sand. This iterative procedure is important,because it allows the stress level and dilatant response of thesand to be taken into account when calculating the value ofqpeak: In practice, a curved ‘trumpet’ shape may be antici-pated for the frustum, with the outer angle (in a verticalplane) increasing through the sand layer because of theeffects of: (a) slight strain-softening at shallow depths asthe rupture advances from the foundation base; and (b) thegradual decrease in stress level with depth. The deducedfriction and dilation angles, taking the outer angle of thefrustum as constant, therefore represent average conditions,allowing the silo calculation model described above to beapplied simply.
Determination of distribution factor DF
Values of DF were determined from back-calculation ofthe 25 flat circular and five spudcan centrifuge test resultspresented in Lee et al. (2013), noting that this is the onlyparameter in the new conceptual model to be determinedfrom experimental results. The DF values required to matchqpeak are shown in Fig. 6 with the empirical relationships of
DF ¼ 0:726� 0:219H s
D, H s=D , 1:12 (21)
for flat circular footings and
DF ¼ 1:333� 0:889H s
D, H s=D , 0:9 (22)
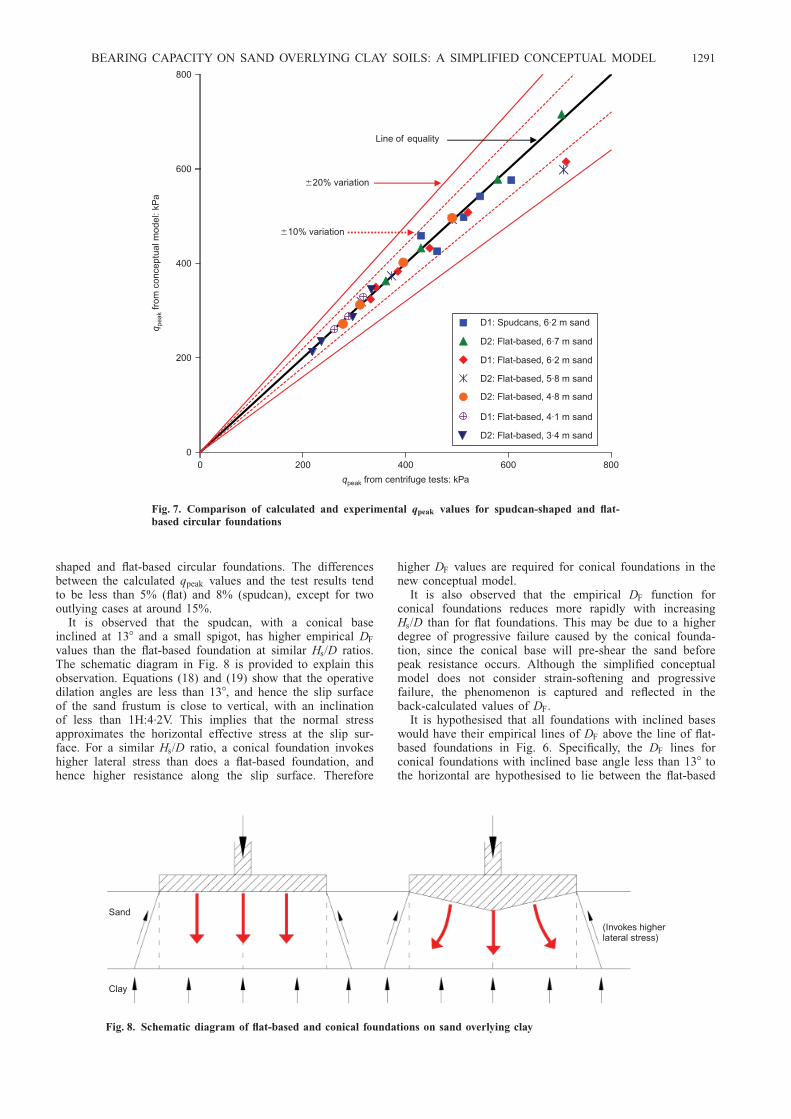
for spudcan-shaped footings. By adopting the distributionfactor DF from equations (21) and (22), an excellent matchbetween the calculated qpeak values and the experimentalresults is obtained. This is shown in Fig. 7 for the spudcan-
Table 1. Parameters for the new conceptual model equation
Category Symbol Parameter Method of determining parameter
Geometry D Footing diameter Known parameterHs Sand thickness Measured from in situ tests
Sand ID and ª9s Relative density and effective unit weight Measured from in situ or laboratory tests�cv Critical state friction angle Measured from laboratory tests, or estimated based on mineralogy
(Randolph et al., 2004)Q Parameter in Bolton (1986) equation Measured from laboratory tests, or estimated based on mineralogy
(Randolph et al., 2004)IR Relative dilatancy index Obtained from iterative calculation between equation (16) (or
equation (17) for ł ¼ 0) and equations (18)–(20)�9 and ł Friction angle and dilation angle Obtained from equations (19) and (20): �9� �cv ¼ 2:65IR and
0:8ł ¼ �9� �cv (�9, �cv and ł in degrees) (Lee et al., 2013)�� Reduced friction angle due to non-associated
N c0 � 6:34þ 0:56k (Martin, 2001, and Houlsby & Martin, 2003)
Empiricalfactor
DF Distribution factorDefined as ratio of normal effective stress atslip surface to mean vertical effective stresswithin sand layer
For flat-based circular footing, use equation (21)
DF ¼ 0:726� 0:219H s
D, Hs/D , 1.12
For spudcans with conical base inclined at 138 to horizontal, useequation (22)
DF ¼ 1:333� 0:889H s
D, Hs/D , 0.9
0
0·2
0·4
0·6
0·8
1·0
1·2
0 0·2 0·4 0·6 0·8 1·0 1·2
Dis
trib
utio
n fa
ctor
,DF
H Ds/
13°
Spudcan
Flat foundation
D H DH D
F s
s
1·333 0·889 / ,/ 0·9� �
�
D H D H DF s s0·726 0·219 / , / 1·12� � �
Fig. 6. Back-calculated distribution factors for spudcan and flatfoundations
1290 LEE, RANDOLPH AND CASSIDY
shaped and flat-based circular foundations. The differencesbetween the calculated qpeak values and the test results tendto be less than 5% (flat) and 8% (spudcan), except for twooutlying cases at around 15%.
It is observed that the spudcan, with a conical baseinclined at 138 and a small spigot, has higher empirical DF
values than the flat-based foundation at similar Hs/D ratios.The schematic diagram in Fig. 8 is provided to explain thisobservation. Equations (18) and (19) show that the operativedilation angles are less than 138, and hence the slip surfaceof the sand frustum is close to vertical, with an inclinationof less than 1H:4.2V. This implies that the normal stressapproximates the horizontal effective stress at the slip sur-face. For a similar Hs/D ratio, a conical foundation invokeshigher lateral stress than does a flat-based foundation, andhence higher resistance along the slip surface. Therefore
higher DF values are required for conical foundations in thenew conceptual model.
It is also observed that the empirical DF function forconical foundations reduces more rapidly with increasingHs/D than for flat foundations. This may be due to a higherdegree of progressive failure caused by the conical founda-tion, since the conical base will pre-shear the sand beforepeak resistance occurs. Although the simplified conceptualmodel does not consider strain-softening and progressivefailure, the phenomenon is captured and reflected in theback-calculated values of DF:
It is hypothesised that all foundations with inclined baseswould have their empirical lines of DF above the line of flat-based foundations in Fig. 6. Specifically, the DF lines forconical foundations with inclined base angle less than 138 tothe horizontal are hypothesised to lie between the flat-based
q pea
kfr
om c
once
ptua
l mod
el: k
Pa
8006004002000
200
400
600
800
0
qpeak from centrifuge tests: kPa
D1: Spudcans, 6·2 m sand
D2: Flat-based, 6·7 m sand
D1: Flat-based, 6·2 m sand
D2: Flat-based, 5·8 m sand
D2: Flat-based, 4·8 m sand
D1: Flat-based, 4·1 m sand
D2: Flat-based, 3·4 m sand
Line of equality
�20% variation
�10% variation
Fig. 7. Comparison of calculated and experimental qpeak values for spudcan-shaped and flat-based circular foundations
Sand
Clay
(Invokes higherlateral stress)
Fig. 8. Schematic diagram of flat-based and conical foundations on sand overlying clay
BEARING CAPACITY ON SAND OVERLYING CLAY SOILS: A SIMPLIFIED CONCEPTUAL MODEL 1291
equation (21) and the spudcan equation (22), whereas thosewith inclined base more than 138 to the horizontal wouldhave higher and steeper DF lines than equation (22).
The values of DF are less than unity, which indicates thatthe normal effective stress at the slip surface, � 9n, is lowerthan the mean vertical effective stress, ��� 9z: There is nophysical restriction that DF must stay below unity. Assumingextrapolation of the experimental results is valid, the empiri-cal DF functions in Fig. 6 suggest that DF may have valueslarger than unity for conical foundations on sand overlyingclay with very low Hs/D ratios. This could be possible, aslarge lateral stresses could be incurred while the degree ofprogressive failure is small.
The relationships of equations (21) and (22) are notion-ally valid within the range of Hs/D tested experimentallyand from which DF was back-calculated, with the flatfoundations verified for 0.21 < Hs/D < 1.12 and the spud-can shape for 0.39 < Hs/D < 0.78 (Lee et al., 2013).However, it is considered appropriate to extrapolate theempirical DF lines of equations (21) and (22) to cover allvalues of Hs/D < 1.12. Further, as both empirical linesintersect at Hs/D ¼ 0.9, equation (22) for a spudcan isdeemed valid for 0 , Hs/D < 0.9. In the range 0.9 ,Hs/D < 1.12, it is suggested that equation (21) for a flat-based foundation may be taken as the most appropriatefor a spudcan.
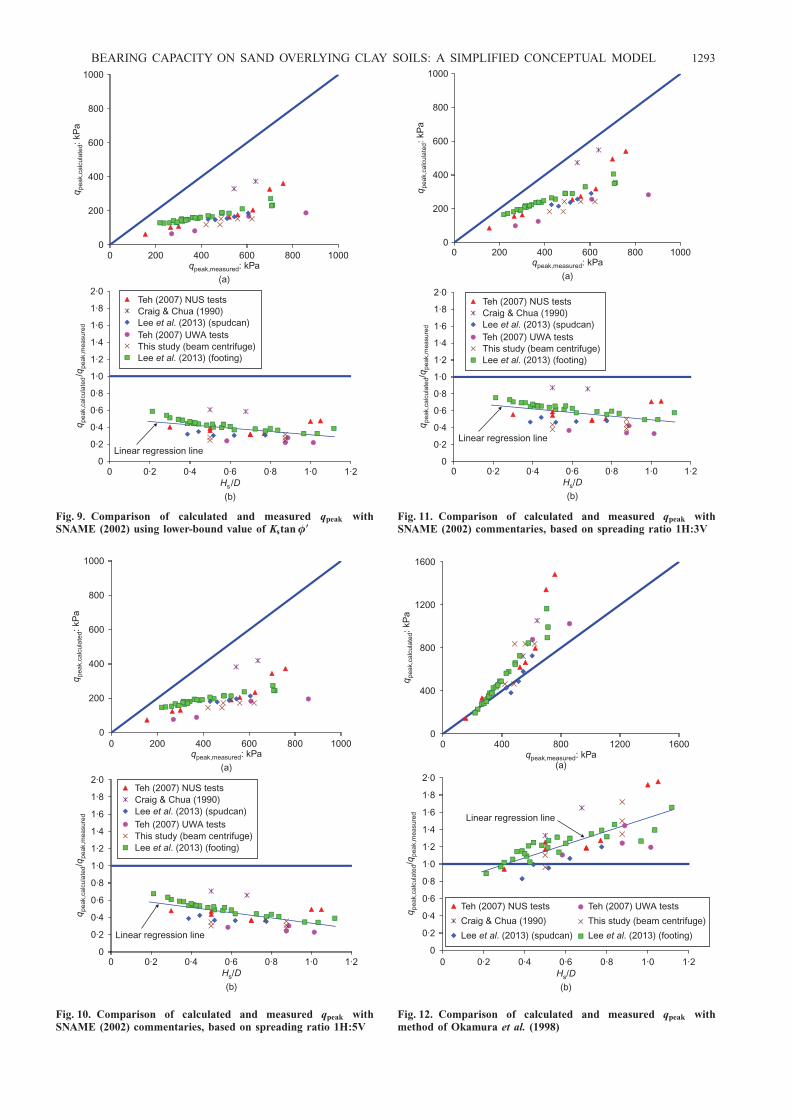
NUMERICAL PREDICTION OF CENTRIFUGE RESULTSThe accuracy of the qpeak values calculated from the new
method, as well as those of SNAME (2002), Teh (2007) andOkamura et al. (1998), has been evaluated throughretrospective simulation of centrifuge experiments withHs/D < 1.12. Centrifuge results additional to those used inthe model calibration were included in this comparativestudy. These consisted of five model spudcan penetrationtests carried out by the first author using the beam centri-
fuges at the University of Western Australia, two centrifugemodel tests from Craig & Chua (1990), and 12 from Teh(2007). The experimental details of these additional tests, asinterpreted by the authors, are provided in Table 2. Includingthe 30 tests described in Lee et al. (2013), a total of 49centrifuge tests are used.
The comparisons are shown in Figs 9–14, where they arecategorised as the industry methods of SNAME (three alter-native approaches) and the recent methods of Okamura etal., Teh and this model respectively. Figs 9(a)–14(a) plot theqpeak values calculated from each method against the experi-mental values, where the diagonal line is the line of equality.Additionally, Figs 9(b)–14(b) present the ratios of calculatedto measured qpeak values against the Hs/D ratio. A linearregression line for the data points is also shown in each ofthese graphs to highlight whether the average ratio ofcalculated to measured qpeak values exhibits any trend withHs/D.
Some common attributes of the datasets are observed. Ingeneral, all analytical methods consistently provide higherpredicted qpeak values for the tests carried out by Craig &Chua (1990) than for the other test data. Figs 9(b)–13(b)show that the ratios of calculated to measured qpeak values(qpeak,calculated/qpeak,measured) for both datasets from Teh (2007),namely the NUS test series and the UWA test series, aregenerally below the linear regression line. Two tests fromthe NUS series are exceptions. The tests at Hs/D ¼ 1 and1.05 of the NUS series show particularly high predictedvalues. In comparison, the new conceptual model shown inFig. 14(b) gives good average predictions for both sets oftests.
The large testing area of the drum centrifuge allowed fivepairs of tests to be conducted on the same sample and underthe same conditions (Lee et al., 2013). Each pair compriseda circular flat-based and a spudcan-shaped foundation of thesame diameter. None of the other published methods candistinguish between these tests, as highlighted by consis-
Table 2. Experimental details of additional tests used in comparative study
Authors Footing Name of test� Geometryy Sand Clay Resultsqpeak:
� NUS implies tests performed in the beam centrifuge at the National University of Singapore, whereas UWA are tests performed in thecentrifuge facilities at the University of Western Australia.y Prototype scale.{ Undrained shear strength of clay at the sand/clay interface.
1292 LEE, RANDOLPH AND CASSIDY
Teh (2007) NUS testsCraig & Chua (1990)Lee . (2013) (spudcan)et alTeh (2007) UWA testsThis study (beam centrifuge)Lee . (2013) (footing)et al
1000800600400200
1·21·00·80·60·40·2
0
200
400
600
800
1000
0
q pea
k,ca
lcul
ate
d: k
Pa
qpeak,measured: kPa
(a)
0
0·2
0·4
0·6
0·8
1·0
1·2
1·4
1·6
1·8
2·0
0
qq
peak
,cal
cula
ted/
peak
,mea
sure
d
H Ds/
(b)
Linear regression line
Fig. 9. Comparison of calculated and measured qpeak withSNAME (2002) using lower-bound value of Kstan�9
Teh (2007) NUS testsCraig & Chua (1990)Lee . (2013) (spudcan)et alTeh (2007) UWA testsThis study (beam centrifuge)Lee . (2013) (footing)et al
0
200
400
600
800
1000
0 200 400 600 800 1000
q pea
k,ca
lcul
ate
d: k
Pa
qpeak,measured: kPa
(a)
0
0·2
0·4
0·6
0·8
1·0
1·2
1·4
1·6
1·8
2·0
0 0·2 0·4 0·6 0·8 1·0 1·2
qq
peak
,cal
cula
ted
peak
,mea
sure
d/
H Ds/
(b)
Linear regression line
Fig. 10. Comparison of calculated and measured qpeak withSNAME (2002) commentaries, based on spreading ratio 1H:5V
Teh (2007) NUS testsCraig & Chua (1990)Lee . (2013) (spudcan)et alTeh (2007) UWA testsThis study (beam centrifuge)Lee . (2013) (footing)et al
0
200
400
600
800
1000
0 200 400 600 800 1000
q pea
k,ca
lcul
ate
d: k
Pa
qpeak,measured: kPa
(a)
0
0·2
0·4
0·6
0·8
1·0
1·2
1·4
1·6
1·8
2·0
0 0·2 0·4 0·6 0·8 1·0 1·2
qq
peak
,cal
cula
ted
peak
,mea
sure
d/
H Ds/
(b)
Linear regression line
Fig. 11. Comparison of calculated and measured qpeak withSNAME (2002) commentaries, based on spreading ratio 1H:3V
0
400
800
1200
1600
0 400 800 1200 1600
q pea
k,ca
lcul
ate
d: k
Pa
qpeak,measured: kPa(a)
0
0·2
0·4
0·6
0·8
1·0
1·2
1·4
1·6
1·8
2·0
0 0·2 0·4 0·6 0·8 1·0 1·2
qq
peak
,cal
cula
ted
peak
,mea
sure
d/
H Ds/
(b)
Teh (2007) NUS tests Teh (2007) UWA tests
Craig & Chua (1990) This study (beam centrifuge)
Lee . (2013) (spudcan)et al Lee . (2013) (footing)et al
Linear regression line
Fig. 12. Comparison of calculated and measured qpeak withmethod of Okamura et al. (1998)
BEARING CAPACITY ON SAND OVERLYING CLAY SOILS: A SIMPLIFIED CONCEPTUAL MODEL 1293
tently lower predictions of qpeak for the spudcan-shapeddataset than for the flat foundations. The new approach canso distinguish, as shown in Fig. 14, as a result of varyingthe distribution factor DF with footing shape.
Following these observations on general trends of the testdata, the specific performance of each analytical method willnow be discussed. To assist this evaluation, the performanceof the various methods in predicting the qpeak values issummarised in Table 3, with statistical parameters for themean and standard deviation (�) provided. In addition, a‘skew angle’ of the linear regression line, Ł, is also providedto represent the skewness of the linear regression lineof qpeak,calculated/qpeak,measured to the horizontal axis of Hs/D,taking Ł as the arctangent of the gradient of the linearregression line.
Numerical predictions using the SNAME-recommendedpractice
As stated in SNAME (2002), the methods given in theguidelines and commentary provide a conservative predictionof qpeak: This is evident in the comparison graphs of Figs9–11, where the experimental values are significantly under-estimated. Some of the predicted qpeak values are only abouta third of the test results using the lower-bound value ofKstan�9 in the primary method from SNAME (2002), orwith the conservative load spreading of 1H:5V suggested inthe SNAME (2002) commentary. Even with the slightlylarger spreading ratio of 1H:3V, the calculated values areonly about half the experimental values. These results high-light the oversimplified nature of these models, which do notaccount explicitly for the strength of the sand.
Numerical predictions using the method of Okamura et al.(1998)
The method of Okamura et al. (1998) generally over-estimates the qpeak values, as shown in Fig. 12. The methodrelies on an angle, Æc, projected from the base edge of thefooting to the clay surface. For the retrospective predictionsthis has been calculated to be between 158 and 188, valuescausing too large a projected area at the sand/clay interface.This causes additional bearing capacity of the clay to becalculated, and therefore overestimation of qpeak: The over-estimation becomes more apparent for larger Hs/D ratios.This reinforces the consequence of excessive projectionangles being calculated using this method, because the errorof mobilising additional bearing capacity of the clay isexacerbated in thicker sand layers.
The Okamura method was developed based on centrifugetests with prototype foundation diameters of 0.8–3 m(Okamura et al., 1997), and with relatively thin sand layers.As the projected area is a function of the square of founda-tion diameter and sand thickness, the error due to excessiveprojection angle is less significant for the relatively smallfoundation diameters and sand thicknesses tested by Oka-mura et al. This method may prove suitable for onshorefootings, which generally have much smaller dimensions.
Numerical predictions using the method of Teh (2007)Figure 13 indicates that the method of Teh (2007) gives a
relatively good average prediction of the peak penetrationresistance, although Fig. 13(b) and Table 3 indicate that thegeneral trend of calculated to measured qpeak ratios isskewed.
The method involves three empirical parameters that needto be determined from separate, semi-logarithmic graphs.Although the schematic diagram of the model is presented
0
200
400
600
800
1000
1200
0 200 400 600 800 1000 1200
q pea
k,ca
lcul
ate
d: k
Pa
qpeak,measured: kPa
(a)
0
0·2
0·4
0·6
0·8
1·0
1·2
1·4
1·6
1·8
2·0
0 0·2 0·4 0·6 0·8 1·0 1·2
qq
peak
,cal
cula
ted
peak
,mea
sure
d/
H Ds/
(b)
Teh (2007) NUS tests Teh (2007) UWA testsCraig & Chua (1990) This study (beam centrifuge)Lee . (2013) (spudcan)et al Lee . (2013) (footing)et al
Linear regression line
Fig. 13. Comparison of calculated and measured qpeak withmethod of Teh (2007)
0
200
400
600
800
1000
0 200 400 600 800 1000
q pea
k,ca
lcul
ate
d: k
Pa
qpeak,measured: kPa
(a)
0
0·2
0·4
0·6
0·8
1·0
1·2
1·4
1·6
1·8
2·0
0 0·2 0·4 0·6 0·8 1·0 1·2
qq
peak
,cal
cula
ted
peak
,mea
sure
d/
H Ds/
(b)
Teh (2007) NUS tests Teh (2007) UWA testsCraig & Chua (1990) This study (beam centrifuge)Lee . (2013) (spudcan)et al Lee . (2013) (footing)et al
Linear regression line
Fig. 14. Comparison of calculated and measured qpeak with thenew conceptual model (this study)
1294 LEE, RANDOLPH AND CASSIDY
in Fig. 3, reference to Teh (2007) is required for full detailsof the method. However, in brief, the inclination of the slipsurface is determined by parameter ł, whereas the extent ofthe mobilisation of the underlying clay bearing capacity isdetermined by parameter Æa: The values of the calculatedfriction angle, �2, and the empirical parameters ł and Æa
obtained from this method are provided in Table 4.Although it is difficult to evaluate the influence of each
parameter in predicting the value of qpeak, as all threeempirical parameters are related to the ratios of Hs/D andqclay/qsand, a brief discussion of the calculated model param-eters and assumptions is provided here.
(a) The values of ł are generally much lower than the valuesof Æa, producing a geometrical inconsistency between thefailure mechanisms in the sand layer and those in theunderlying clay.
(b) The operative friction angle �2 is taken as the average ofthe critical state friction angle �cv and the friction anglecalculated through an iterative procedure using Bolton’s(1986) empirical relationships, with the assumptions thatthe horizontal stress is at a passive failure state, and theinitial mean effective stress at the mid-depth of the sandlayer is taken as the representative stress. With thisapproach, the effects of foundation size and undrainedshear strength are excluded when incorporating the effectof stress level on friction angle.
(c) Table 4 shows that the values of �2 are higher for densersand layers, and this is as expected. It is generallyrecognised that denser sand with a higher friction angle ismore dilative, and will cause larger dispersion angle ofthe slip surface (e.g. Vermeer & Sutjiadi, 1985). How-ever, the values of ł shown in Table 4 suggest acontradictory trend. The lower limit of ł ¼ 28 for verydense sand samples, with relative density of0.88 , ID , 0.99 and calculated friction angle of378 , �2 , 398, is lower than the values ł ¼ 128 and68 for tests NUS_F8 and NUS_F9, which had a loosersand layer, with ID of around 0.6 and a calculated frictionangle between 358 and 368.
(d ) Furthermore, the friction angles for tests on very densesand are in a relatively small range of 37–398, but thedispersion angles of the slip surface cover a much larger
range of 28 , ł , 268. This suggests that the inclinationof the slip surface is independent of the friction angle.This contradicts the results of the numerical analysisdescribed in Lee et al. (2013), which indicates that theslip surface inclination equals the dilation angle, which isdirectly related to the operative friction angle.
In summary, it appears that the individual parameters arenot consistent with each other. However, compensatingeffects among the empirical parameters have worked collec-tively to produce reasonable estimated qpeak values, albeitwith a significant bias with Hs/D.
Numerical predictions using the conceptual model of thispaper
Figure 14 shows that the new method gives a generallygood prediction of the experimental values of qpeak:Although it shows a slight bias with Hs/D ratio, the linearregression line in Fig. 14(b) falls close to unity.
The calculated values of friction angle �9 and dilationangle ł are listed in Table 5, noting that the projectionangle of the conceptual sand frustum is equal to thedilation angle (Fig. 4). The friction angles for the verydense sand samples are in the range 37–428, and thedilation angles are between 68 and 128, following therelationship proposed in equations (18)–(20). Lower valuesof �9 and ł are obtained for the looser sand tests NUS_F8and NUS_F9 accordingly. This shows that the calculatedvalues of �9 and ł are consistent with the relative densityof the sand, and fall in a reasonable range.
EXAMPLE PARAMETRIC STUDYOne of the advantages of the proposed conceptual model
is the ease of calculation. To illustrate how the method maybe used to create parametric design charts, an example of aflat circular footing penetrating into sand overlying clay soilsis shown here. The sand layer is assumed to have properties�cv ¼ 318 and ª9s ¼ 8 kN/m3: The diameter of the footing istaken as 15 m. The values of qpeak were then calculated forvarious sand thicknesses and relative densities, for twodifferent normally consolidated shear strength profiles, of
Table 3. Summary of comparisons from various analytical methods
Method Value of qpeak,calculated/qpeak,measured
Minimum Maximum Mean � Ł: degrees
SNAME (2002): punching shear method with lower-bound value ofKstan�9
0.22 0.61 0.38 0.10 �11
Commentaries to SNAME (2002): projected area method with ratio1H:5V
0.23 0.71 0.45 0.12 �17
Commentaries to SNAME (2002): projected area method with ratio1H:3V
0.33 0.87 0.57 0.13 �12
Okamura et al. (1998) 0.83 1.95 1.24 0.24 38Teh (2007) 0.62 1.40 0.92 0.16 24New conceptual model of this paper 0.67 1.33 0.99 0.12 �2
Table 4. Values of �2, ł and Æa from method of Teh (2007)
Test name ID Calculated �2: degrees Empirical ł: degrees Empirical Æa: degrees
47 tests with very dense sand layer 0.88–0.99 36.8–39.1 2.0–26.4 19.6–24.8NUS_F8 0.61 35.8 12.2 23.8NUS_F9 0.58 35.3 5.7 22.4
BEARING CAPACITY ON SAND OVERLYING CLAY SOILS: A SIMPLIFIED CONCEPTUAL MODEL 1295
increasing strength with depth of 1.5 kPa/m and 2.5 kPa/m,for the underlying clay. The results are summarised in Fig.15. Both graphs present the normalised peak resistance,qpeak/Nc0su0, as a function of relative sand thickness, Hs/D,for five different relative densities, from ID ¼ 0.2 to ID ¼ 1.
The graphs show that when the sand thickness becomeszero (Hs ¼ 0; clay-only profile), the values of qpeak convergeto the bearing capacity of the underlying clay. As Hs/Dincreases, the bearing capacity of the underlying clay isenhanced significantly, up to a factor of about 3.3–5.5relative to the bearing capacity of the underlying clay at Hs/D ¼ 1, depending on the relative density of the sand layerand the absolute strength of the clay.
Figure 15 also reflects the effects of incorporating thestress level and dilatant response of sand in the model. Theenhancement of bearing capacity for the lower increasingstrength with depth ratio is greater. This is because strongerclay in the latter case invokes higher stresses in the sandlayer (and higher qpeak values). This leads to greater suppres-sion of dilation, and a lower operative friction angle at peakresistance. The stress level will also be affected in a similarmanner by the absolute value of footing diameter. Thisshows how the new model is an improvement over themodels adopted in the design guidelines of SNAME (2002),which do not consider the strength properties of the sand.
CONCLUSIONSThe development of a new conceptual model and deriva-
tion of an equation to calculate the peak penetration resis-tance of circular foundations on sand overlying clay werepresented in this paper. Only a homogeneous sand layer isconsidered, whereas the undrained shear strength of the claymay increase linearly with depth. In contrast to othermethods that relate the friction angle to an initial stress
within the sand layer, the operative friction angle in the newmodel is related directly to the peak penetration resistanceusing a modified strength–dilatancy equation. The methodinvolves an iterative approach to determine the stress-level-dependent friction and dilation angles based on the peakpenetration resistance. This can be implemented numericallyusing a simple spreadsheet approach. The iterative calcula-tion process ensures that the stress-level-dependent frictionangle is correctly linked to the stress level mobilised at peakpenetration resistance. The influence of foundation size andundrained shear strength of the underlying clay on theconfining stress in the sand is thereby incorporated.
The approach relies on an empirically determined distribu-tion factor (DF) relating the normal stress on the slip surfaceto the average vertical stress beneath the foundation at thatdepth. The peak penetration resistance calculated using thededuced linear variation of DF with Hs/D was shown toprovide excellent agreement not only with the 30 centrifugetests of Lee et al. (2013) used to calibrate DF (an expectedresult), but also with another 19 geotechnical centrifuge testsnot used in the calibration.
The new conceptual model has been verified only forratios of sand thickness to footing diameter less than 1.12.This covers the range of practical interest for the offshorejack-up industry, where calculation of potential punch-through capacities is critical. Further calibration of themodel for loose sand layers overlying soft clay, and fordifferent footing shapes and conical angles, is recommended.Furthermore, verification with full-scale penetration eventswould be highly beneficial.
ACKNOWLEDGEMENTSThe research presented here was supported by the Austra-
lian Research Council through the ARC Linkage grant
1
2
3
4
5
6
0 0·2 0·4 0·6 0·8 1·0
Cal
cula
ted
/q
Npe
akc0
su0
H Ds/
(a)
For both graphs:15 m
31°
8 kN/m
D �
�
� �
φγ
cv
s3
1
2
3
4
5
6
0 0·2 0·4 0·6 0·8 1·0H Ds/
(b)
su: kPa
Dep
th: m
Hs
1
12·5 (RHS graph)
1·5 (LHS graph)
ID 1·0�
ID 0·8�
ID 0·6�
ID 0·4�ID 0·2�
Fig. 15. Normalised peak resistance as a function of relative sand thickness at various relative densities for(a) su ¼ 1.5 kPa/m and (b) su ¼ 2.5 kPa/m, from surface
Table 5. Values of �9 and ł calculated using the new conceptual model for database of 49centrifuge tests with Hs/D < 1.12
Test name ID Calculated �9:degrees
Calculated ł:degrees
47 tests with very dense sand layer 0.88–0.99 36.7–41.7 6.3–12.2NUS_F8 0.61 36.3 5.3NUS_F9 0.58 35.3 4.1
1296 LEE, RANDOLPH AND CASSIDY
scheme (Project LP0561838), and by industry partner KeppelOffshore and Maritime Limited. This work forms part of theactivities of the Centre for Offshore Foundation Systems andthe Australian Research Council Centre of Excellence forGeotechnical Science and Engineering at UWA. The authorsacknowledge extensive support through the ARC’s Federa-tion and Future Fellowships, Discovery and Linkage pro-grammes. The third author holds the Chair of OffshoreFoundations from the Lloyd’s Register Foundation. Thissupport is gratefully acknowledged.
NOTATIONA area of infinitesimal disc elementD foundation diameter
DF distribution factorE model parameter
E0 model parameter when dilation angle is zeroHs sand thicknessID in situ relative densityIR relative dilatancy indexKs punching shear coefficient
Nc0 bearing capacity factorQ natural logarithm of grain-crushing strengthqb bearing capacity of underlying clay
qpeak peak penetration resistanceqsand bearing capacity in sand
q0 surcharge at sand surfaceR radius of infinitesimal disc elementr radial coordinate
su shear strengthsu0 undrained strength at sand/clay interface
z vertical coordinateÆa geometrical parameterª9s effective unit weight of sandŁ arctangent of gradient of linear regression linek non-dimensional parameterr strength gradient of underlying clay� standard deviation
� 9n normal effective stress��� 9z mean vertical effective stress� frictional resistance
Brinch Hansen, J. (1970). A revised and extended formula forbearing capacity. Bull. Danish Geotech. Inst. No. 28, 5–11.
Cassidy, M. J. & Houlsby, G. T. (1999). On the modelling offoundations for jack-up units on sand. Proceedings of the 31stoffshore technology conference, Houston, TX, USA, paper OTC10995.
Cassidy, M. J. & Houlsby, G. T. (2002). Vertical bearing capacityfactors for conical footings on sand. Geotechnique 52, No. 9,687–692, http://dx.doi.org/10.1680/geot.2002.52.9.687.
Craig, W. H. & Chua, K. (1990). Deep penetration of spud-canfoundations on sand and clay. Geotechnique 40, No. 4, 541–556, http://dx.doi.org/10.1680/geot.1990.40.4.541.
Davis, E. H. (1968). Theories of plasticity and the failure of soilmasses. In Soil mechanics: Selected topics (ed. I. K. Lee), pp.341–380. London, UK: Butterworth.
Drescher, A. & Detournay, E. (1993). Limit load in translationalfailure mechanisms for associative and non-associative materials.
Hanna, A. M. & Meyerhof, G. G. (1980). Design charts forultimate bearing capacity of foundations on sand overlying softclay. Can. Geotech. J. 17, No. 2, 300–303.
Houlsby, G. T. & Martin, C. M. (2003). Undrained bearing capacityfactors for conical footings on clay. Geotechnique 53, No. 5,513–520, http://dx.doi.org/10.1680/geot.2003.53.5.513.
Lee, K. K. (2009). Investigation of potential spudcan punch-throughfailure on sand overlying clay soils. PhD thesis, University ofWestern Australia, Perth, Australia.
Lee, K. K., Cassidy, M. J. & Randolph, M. F. (2013). Bearingcapacity on sand overlying clay soils: experimental and finite-element investigation of potential punch-through failure. Geo-technique, http://dx.doi.org/10.1680/geot.12.P.175.
Lee, K. K., Randolph, M. F. & Cassidy, M. J. (2009). Newsimplified conceptual model for spudcan foundations on sandoverlying clay soils. Proceedings of the 41st offshore technologyconference, Houston, TX, USA, paper OTC-20012.
Martin, C. M. (2001). Vertical bearing capacity of skirted circularfoundations on Tresca soil. Istanbul. Proceedings of the 15thinternational conference on soil mechanics and geotechnicalengineering, Istanbul, Turkey, vol. 1, pp. 743–746.
Okamura, M., Takemura, J. & Kimura, T. (1997). Centrifuge modeltests on bearing capacity and deformation of sand layer over-lying clay. Soils Found. 37, No. 1, 73–88.
Okamura, M., Takemura, J. & Kimura, T. (1998). Bearing capacitypredictions of sand overlying clay based on limit equilibriummethods. Soils Found. 38, No. 1, 181–194.
Osborne, J. J. & Paisley, J. M. (2002). SE Asia jack-up punch-throughs: the way forward. Proceedings of the internationalconference on offshore site investigation and geotechnics –sustainability and diversity, London, UK, pp. 301–306.
Osborne, J. J., Pelley, D., Nelson, C. & Hunt, R. (2006). Unpre-dicted jack-up foundation performance. Proceedings of the 1stjack-up Asia conference and exhibition, Singapore, vol. 1.
Osborne, J. J., Houlsby, G. T., Teh, K. L., Bienen, B., Cassidy,M. J., Randolph, M. F. & Leung, C. F. (2009). Improved guide-lines for the prediction of geotechnical performance of spudcanfoundations during installation and removal of jack-up units.Proceedings of the 41st offshore technology conference,Houston, TX, USA, paper OTC-20291.
Randolph, M. F., Leong, E. C. & Houlsby, G. T. (1991). One-dimensional analysis of soil plugs in pipe piles. Geotechnique41, No. 4, 587–598, http://dx.doi.org/10.1680/geot.1991.41.4.587.
Randolph, M. F., Jamiolkowski, M. B. & Zdravkovic, L. (2004).Load carrying capacity of foundations. Proceedings of theSkempton Memorial Conference, vol. 1, pp. 207–240. London,UK: Thomas Telford.
SNAME (2002). Guidelines for site specific assessment of mobilejackup units, Technical and Research Bulletin 5-5A. Jersey, City,NJ, USA: The Society of Naval Architects & Marine Engineers.
Teh, K. L. (2007). Punch-through of spudcan foundation in sandoverlying clay. PhD thesis, National University of Singapore.
Teh, K. L., Cassidy, M. J., Leung, C. F., Chow, Y. K., Randolph,M. F. & Quah, C. K. (2008). Revealing the bearing failuremechanisms of a penetrating spudcan through sand overlyingclay. Geotechnique 58, No. 10, 793–804, http://dx.doi.org/10.1680/geot.2008.58.10.793.
Teh, K. L., Leung, C. F., Chow, Y. K. & Cassidy, M. J. (2010).Centrifuge model study of spudcan penetration in sand overlyingclay. Geotechnique 60, No. 11, 825–842, http://dx.doi.org/10.1680/geot.8.P.077.
Vermeer, P. A. & Sutjiadi, W. (1985). The uplift resistance ofshallow embedded anchors. Proceedings of the 11th interna-tional conference on soil mechanics and foundation engineering,San Francisco, CA, USA, vol. 3, pp. 12–16.
Walters, J. K. (1973). A theoretical analysis of stresses in axiallysymmetric hoppers and bunkers. Chem. Engng Sci. 28, No. 3,779–789.
BEARING CAPACITY ON SAND OVERLYING CLAY SOILS: A SIMPLIFIED CONCEPTUAL MODEL 1297