Page 1
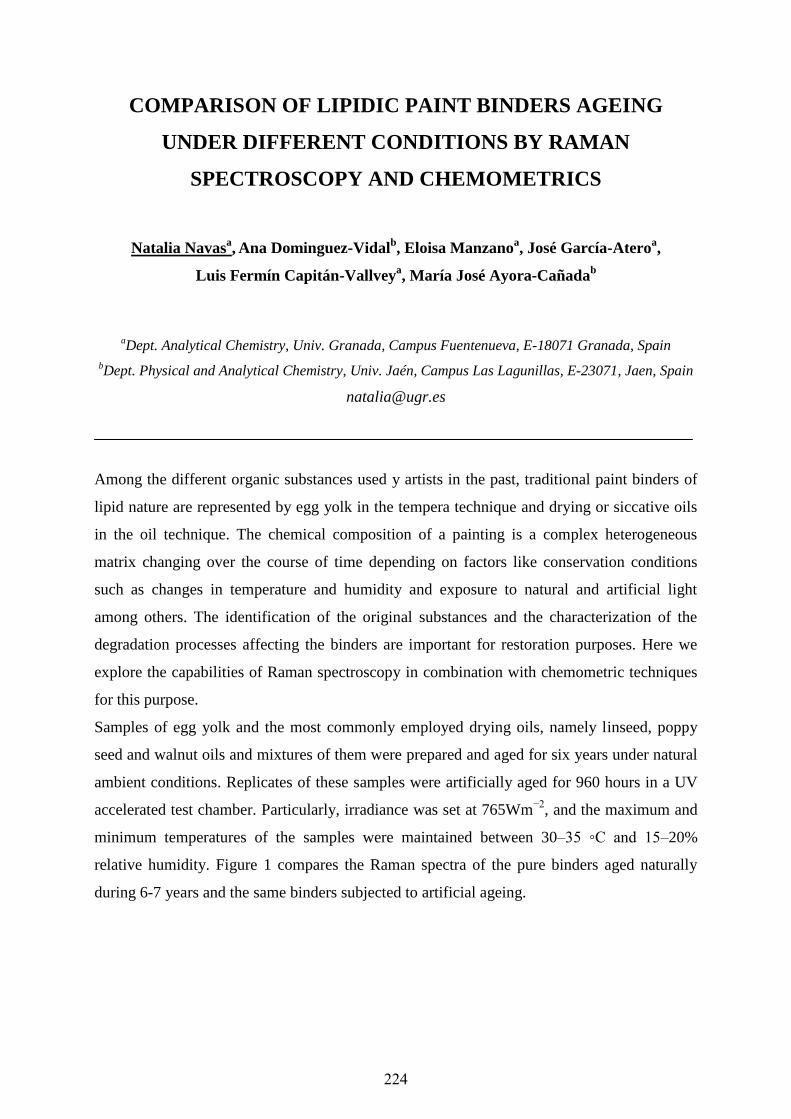
u n i ve r s i t y o f co pe n h ag e n
Københavns Universitet
Can lame cows be detected with automatic milking systems data?
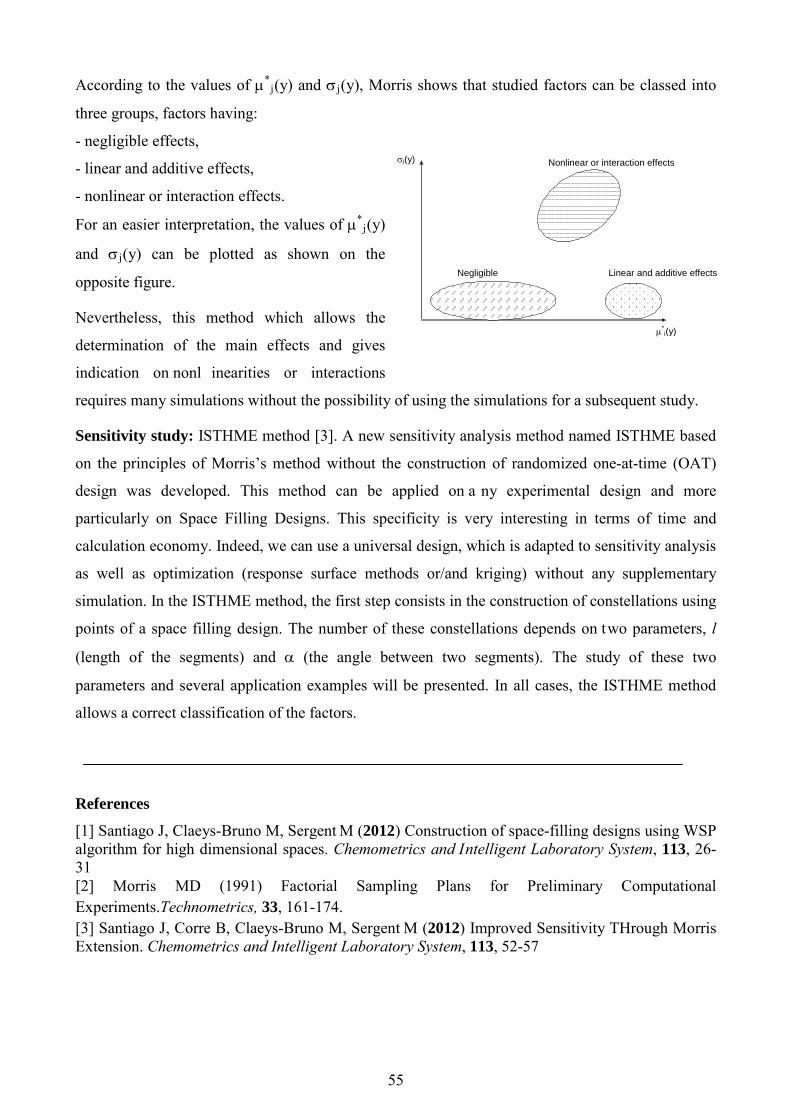
Garcia, Emanuel; Klaas, Ilka Christine; Amigo Rubio, Jose Manuel
Publication date:2013
Document versionEarly version, also known as pre-print
Citation for published version (APA):Garcia, E., Klaas, I. C., & Amigo Rubio, J. M. (2013). Can lame cows be detected with automatic milkingsystems data?. Abstract from VIII Colloquium Chemometricum Mediterraneum, Bevagna, Italy.
Download date: 14. Mar. 2020
Page 2
OPENING LECTUREMemories of a resting Professor
Prof.Michele Forina
KEYNOTE LECTURESData fusion in food authentication
Prof. Ricard Boqué (University of Tarragona)
Improvingspatialresolution of hyperspectralimages: the super-resolution concept
Prof. Ludovic Duponchel (University of Lille)
Analysis of chemical data from a compositional point of viewProf. Peter Filzmoser (Technical University of Vienna)
Spectroscopy coupled to chemometricsfor vineyards and grapes quality intensive mapping
Dr. João Almeida Lopes (University of Porto)
Applications of chemometrics in drug designDr. Orazio Nicolotti (University of Bari)
Data transformation methodsProf. Beata Walczak (University of Silesia)
TOPICSPattern Recognition and Calibration
Experimental Design (DOE) and System OptimizationQualimetricsand Chemical Metrology
QSAR/QSPRImage Analysis
Process Analytical Technology (PAT)Applications of Chemometrics
SPOSORED BY:
ORGANIZED BY:
June 30th - July 4th, 2013 Bevagna, Italy
VIII Colloquium Chemometricum Mediterraneum
Page 4
PL
Plenary Lectures
Page 5
PLENARY
COMMUNICATIONS
INDEX PL00 Michele Forina MEMORIES OF A RESTING PROFESSOR PL01 Beata Walczak DATA TRANSFORMATION METHODS PL02 Orazio Nicolotti, Domenico Alberga, Angelo Carotti, Domenico Gadaleta, Andrea Gissi, Gianluca Lattanzi, Giuseppe Felice Mangiatordi APPLICATIONS OF CHEMOMETRICS IN DRUG DESIGN PL03 Peter Filzmoser ANALYSIS OF CHEMICAL DATA FROM A COMPOSITIONAL POINT OF VIEW PL04 Ricard Boqué, Aysegul Yalcin, Joan Ferré DATA FUSION IN FOOD AUTHENTICATION PL05 L. Duponchel, M. Offroy, S. Piqueras, A. de Juan IMPROVING SPATIAL RESOLUTION OF HYPERSPECTRAL IMAGES: THE SUPER-RESOLUTION CONCEPT
4
Page 6
PL06 João A. Lopes SPECTROSCOPY COUPLED TO CHEMOMETRICS FOR VINEYARDS AND GRAPES QUALITY INTENSIVE MAPPING
5
Page 7
DATA TRANSFORMATION METHODS
Beata Walczak
Institute of Chemistry, The University of Silesia, Katowice, Poland
Preprocessing of instrumental signals is a crucial step of data analysis. Until now, it is,
however, its main bottleneck also. The preprocessing step usually involves preprocessing of
individual signals (signals enhancement via signals de-nosing and background elimination), as
well as preprocessing of the signal set (signal transformations, signals alignment, etc.). There
are no strict rules concerning data preprocessing, because the choice of the methods is data
dependent. Problems associated with data preprocessing will be demonstrated, based on the
SIMS signals from biological material. What is typical of the SIMS signals, it is their huge
dynamic range and a fact that the raw SIMS data follows the Poisson counting statistics.
Different types of signal transformations can be used at different stages of data preprocessing
to deal with data specificity. The influence of different data transformations on t he data
correlation structure and on the biomarkers identification is going to be demonstrated for the
simulated data sets as well. The main accent will be laid on the data normalization methods,
applied for the removal of the so-called size effect. Additionally, a comparison of data
analysis based on the peak table with that based on t he entire fingerprints, taking into the
account final identification of significant features, will be made (the term ‘features’ is used
for both, peaks and the original variables). A comparison of these two approaches is
performed for simulated data, because only in this case, all necessary details about sample
components and significant features are known.
6
Page 8
APPLICATIONS OF CHEMOMETRICS IN DRUG DESIGN
Orazio Nicolotti, Domenico Alberga, Angelo Carotti, Domenico Gadaleta, Andrea Gissi,
Gianluca Lattanzi, Giuseppe Felice Mangiatordi
Università degli Studi di Bari ‘Aldo Moro’, Dipartimento di Farmacia - Scienze del Farmaco,
Via Orabona 4, 74011, BARI, Italy
E-mail [email protected]
In the past, drug design has been considered as an inventive process mostly relying on trial-
and-error and serendipity paradigma. However, the accumulated evidence of the flop in
preclinical or clinical trials of promising candidate drugs and the need to minimize the cost-
to-market prompted the advent of chemometrics-based strategies enhancing the potential of
rational drug design by accelerating the drug pipeline progression. In this respect, the authors
will emphasize why and how chemometrics comes into play and in particular will focus on
the role of non-deterministic and multi-objective optimization techniques as strategies with a
real-life impact on the derivation of QSAR as well as ligand- and structure-based models.
References
Flachner B, Lörincz Z, Carotti A, Nicolotti O, Kuchipudi P, Remez N, Sanz F, Tóvári J, Szabó MJ, Bertók B, Cseh S, Mestres J, Dormán G (2012) A chemocentric approach to the identification of cancer targets. Plos One, 4, e35582. Nicolotti O, Giangreco I, Introcaso A, Leonetti F, Stefanachi A, Carotti A (2011) Strategies of multi-objective optimization in drug discovery and development. Expert Opinion on D rug Discovery, 6, 871-884. Nicolotti O, Giangreco I, Miscioscia TF, Carotti A (2009) Improving quantitative structure-activity relationships through multiobjective optimization. Journal of Chemical Information and Modeling 49, 2290-2302. Nicolotti O, Miscioscia TF, Carotti A, Leonetti F, Carotti A (2008) An integrated approach to ligand- and structure-based drug design: Development and application to a series of serine protease inhibitors. Journal of Chemical Information and Modeling 48, 1211-1226. Nicolotti O, Carotti A. (2006) QSAR and QSPR studies of a highly structured physicochemical domain. Journal of Chemical Information and Modeling 46, 264-276. Nicolotti O, Gillet VJ, Fleming PJ, Green DVS (2002) Multiobjective optimization in quantitative structure-activity relationships: Deriving accurate and interpretable QSARs Journal of Medicinal Chemistry. 45, 5069-5080.
7
Page 9
ANALYSIS OF CHEMICAL DATA FROM A
COMPOSITIONAL POINT OF VIEW
Peter Filzmoser
Department of Statistics and Probability Theory, Technical University of Vienna,
Wiedner Hauptstrasse 8-10, A-1040 Vienna, AUSTRIA
[email protected]
Many practical data sets in chemistry and chemometrics are in fact compositional data
because only the ratios between the variables are informative. An example are concentrations
of chemical elements, measured e.g. in mg/kg: an increase of the concentration in one
component has an effect on the other components, since the overall sum is constrained.
Compositional data are represented in the Aitchison geometry on t he simplex, and for
applying statistical methods designed for the Euclidean geometry they need to be transformed
first. The isometric logratio (ilr) transformation has the best geometrical properties, but
usually the results are difficult to interpret because the ilr coordinates are formed by non-
linear combinations of the original variables. We show for different multivariate statistical
methods how the ilr transformation can be sucessfully used for interpretation.
Based on real data examples we compare results from a standard approach and from a
compositional data approach.
8
Page 10
DATA FUSION IN FOOD AUTHENTICATION
Ricard Boqué, Aysegul Yalcin, Joan Ferré
Universitat Rovira i Virgili. Dept. of Analytical Chemistry and Organic Chemistry.
C/ Marcel.lí Domingo, s/n (Campus Sescelades), 43007 Tarragona (Catalonia), SPAIN.
[email protected]
The safety and quality of food commodities are of major concern for consumers, who
increasingly demand reliable and high-quality products. This increasing interest for quality
has driven the attention towards the techniques used for authentication of food and beverage
products. In recent years, rapid and reliable sensory, spectroscopic and chromatographic
techniques have been developed which, together with chemometric analysis, have improved
the quality control process by reducing the time of analysis and providing higher quality
results. In this progression of more and better information, the next step is to combine the
outputs of different multivariate instrumental techniques to increase the reliability of a
classification or prediction regarding a single analytical technique. From the literature review,
the combination (fusion) of data from several techniques with the help of chemometrics
appears to be promising for the authentication of food and beverage products. However, data
fusion is not exempt from problems and limitations, which in turn pose a challenge for
chemometricians. The objective of this presentation is to provide a general overview of the
different data fusion techniques and strategies, focusing on the critical points. Issues such as
data preprocessing, scaling, normalization, variable selection and outlier detection will be
covered and applications from the field of food and beverage authentication will be critically
discussed.
9
Page 11
IMPROVING SPATIAL RESOLUTION OF HYPERSPECTRAL
IMAGES: THE SUPER-RESOLUTION CONCEPT.
L. Duponchela, M. Offroya, S. Piquerasb,c, A. de Juanb
aLaboratoire de Spectrochimie Infrarouge et Raman, LASIR, CNRS UMR 8516, University of
Lille, Bât. C5, 59655 Villeneuve d'Ascq Cedex (France). bChemometrics group. Dept. Analytical Chemistry. Universitat de Barcelona. Diagonal, 645.
08028 Barcelona (Spain). cIDAEA-CSIC. Jordi Girona, 18. 08028 Barcelona (Spain).
Email : [email protected]
Hyperspectral imaging has become a major tool for the characterization of complex samples.
Although molecular characterization at micron level is achieved for many applications, it
usually fails producing chemical images of micron size samples as expected in chemical,
environmental and biological analysis.
The main objective of the presented work is to introduce the potential of the super-resolution
concept in vibrational spectroscopic imaging [1]. This original chemometrics approach uses
several low resolution images of the same sample (observed from different point of views) in
order to generate a higher resolution chemical image. It is thus possible to overcome in a
certain way some physical and instrumentals limitations.
We will illustrate the concept with different results in Raman, Near-Infrared and Mid-infrared
imaging [2-5].
References
[1] S. Farsiu, M.D. Robinson, M. Elad, P. Milanfar (2004) Fast and robust multiframe super
resolution. IEEE Transactions on image processing, 13(10), 1327-1344.
[2] L. Duponchel, P. Milanfar, C. Ruckebusch, J.-P. Huvenne (2008). Super-resolution and
Raman chemical imaging: From multiple low resolution images to a high resolution image,
Analytica Chimica Acta, 607 (2), 168-175.
10
Page 12
[3] M. Offroy, Y. Roggo, P. Milanfar, L. Duponchel (2010). Infrared chemical imaging:
Spatial resolution evaluation and super-resolution concept, Analytica Chimica Acta, 674 (2),
220-226.
[4] M. Offroy, Y. Roggo, L. Duponchel (2012). Increasing the spatial resolution of near
infrared chemical images (NIR-CI): The super-resolution paradigm applied to pharmaceutical
products, Chemometrics and Intelligent Laboratory Systems, 117, 183-188.
[5] S. Piqueras, L. Duponchel, M. Offroy, F. Jamme, R. Tauler, A. de Juan (2013).
Chemometric strategies to unmix information and increase the spatial description of
hyperspectral images: a single cell case study, Analytical chemistry (submitted).
11
Page 13
SPECTROSCOPY COUPLED TO CHEMOMETRICS FOR VINEYARDS AND GRAPES QUALITY INTENSIVE
MAPPING
João A. Lopes
REQUIMTE, Departamento de Química Aplicada, Faculdade de Farmácia, Universidade do Porto, Rua de Jorge Viterbo Ferreira, 228, 4050-313 Porto, Portugal
([email protected] )
Production of high quality wines requires a permanent monitoring of the entire
winemaking process. Grapes composition is the result of the “terroir”, which is utmostly
influenced by the soil composition and climatic conditions [1]. Soil impact on grapes
quality and ripening processes is well known. However. Current strategy for analyzing
soils (pedology) is based on w et chemistry methods, which are often laborious,
expensive, time-consuming and of limited use during harvesting campaigns. But, is it
possible to use efficiently an high-throughput analytical method for estimating the
impact of soil quality, tillage and thinning on the grapes quality? Near infrared
spectroscopy (NIRS) proved to be the most efficient tool for direct in-situ analysis of
soils, leaves and grapes [2,3]. In this context, multivariate or chemometric analysis of
the near-infrared signal is of upmost importance and multiple approaches are required
depending on the specific target [4]. This communication presents results obtained from
directly monitoring vineyards in four Portuguese locations (wine appellation regions
“Alentejo”, “Dão”, “Douro” and “Vinhos Verdes”) using a FieldSpec 4 portable near-
infrared spectrometer (ASD, Boulder, CO). Soil characterized vineyards were
monitored according to designed sampling grids accounting for the specifities of soils
and varieties. Measurements of soils (at different dephts), plant leaves and berries were
performed on different stages of the ripening period. Spectral analysis was performed
with chemometric methods, essentially data-mining and regression (classification)
methods. Strategies to ensure models robustness and statistical significance were
particularly accounted. This monitoring approach revealed to be an excellent tool to
support the process of vineyards micro-zoning [5,6]. It is also excellent as a q uick
methodology to calibrate hyperspectral satellite images increasing substantially their
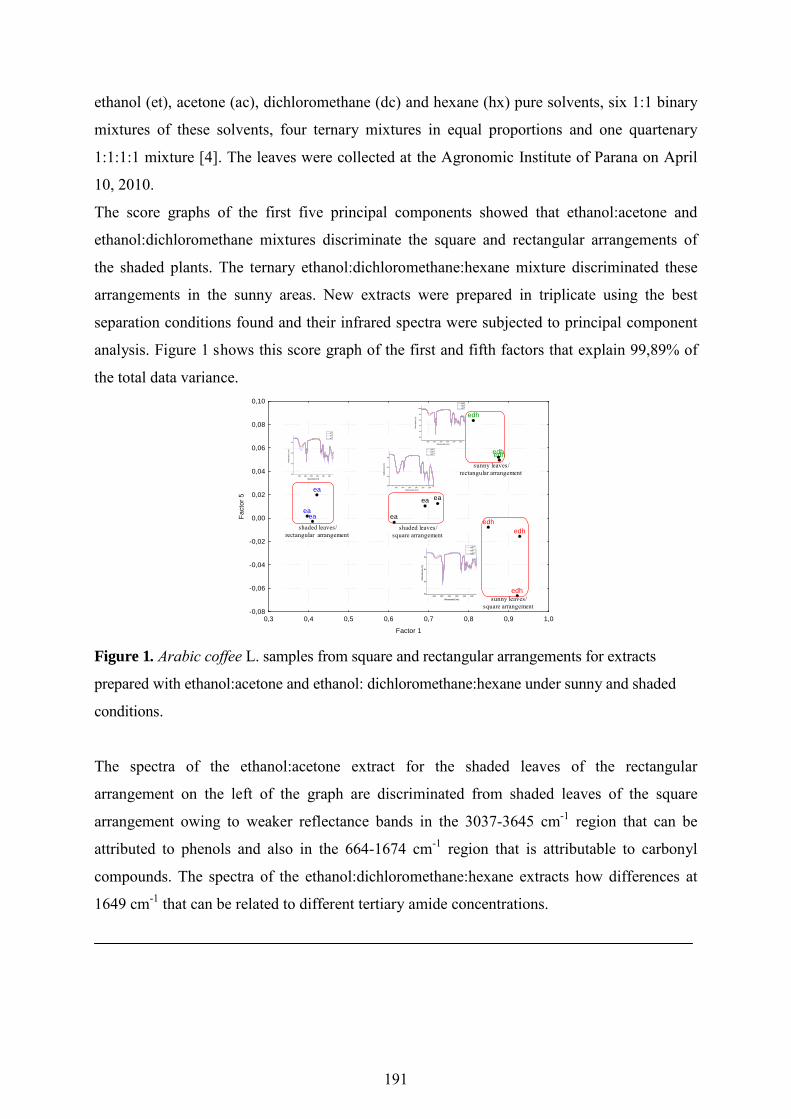
usefulness. Globally, the major and ultimate deliverable of this approach is a cost-
effective NIRS based technology for winemakers in order to add product value, by
12
Page 14
increasing the efficiency of vineyards mapping, not only in terms of soil
characterization, but also on soil/climate impact on grapes quality and ripening
processes.
Acknowledgments
SOGRAPE Vinhos is greatly acknowledged for partially funding this research project
through grant no. PP-IJUP2011-SOGRAPE-347. This work has been also supported by
Fundação para a Ciência e a Tecnologia (FCT-MCTES) through grant no. P Est-
C/EQB/LA0006/2011.
References
[1] Ubalde J, Sort X, Zayas A, Poch R (2010) Effects of soil and climatic conditions on
grape ripening and wine quality of caberet sauvignon, Journal of Wine Research, 21, 1-
17
[2] Cozzolino D, Dambergs RG, Janik L, Cynkar WU, Gishen M (2006) Analysis of
grapes and wine by near infrared spectroscopy, Journal of Near Infrared Spectroscopy,
14(5), 279-289.
[3] Bellon-Maurel V, Fernandez-Ahumada E, Palagos B, Roger JM, Mcbratney A
(2010) Critical review of chemometric indicators commonly used for assessing the
quality of the prediction of soil attributes by NIR spectroscopy, Trac-Trends in
Analytical Chemistry, 29(9), 1073-1081
[4] Lopes JA, Costa PF, Alves TP, Menezes JC (2004) Chemometrics in bioprocess
engineering: process analytical technologies (PAT) applications, Chemom. Intell. Lab
Syst., 74, 269-275
[5] Carvalho M, Certal SG, Páscoa RNMJ, Cunha S, Graça A, Lopes JA, “High-
throughput near-infrared spectroscopy based technology for qualifying grapes based on
soil and climate conditions”, 6th meeting of young researchers of University of Porto-
IJUP’2013, 13-15 November 2013, Porto, Portugal, p.318
[6] Páscoa RNMJ, Braga M, Lopes JA, “Evaluation of vineyards heterogeneity by near-
infrared spectroscopy intensive monitoring”, XVIII Encontro Luso-Galego de Química,
28-30 November 2012, Vila Real, Portugal, p. 60.
13
Page 16
O
Oral Communications
Page 17
ORAL
COMMUNICATIONS
INDEX O01
J. Engel, J. Gerretzen, L.M.C. Buydens
RECONSIDERING THE PRE-PROCESSING PROCESS
O02
Eva Borràs, José Manuel Amigo, Frans van den Berg, Ricard Boqué, Olga Busto
APPLICATION OF NEAR INFRARED AND PLS-DA TO CLASSIFY ALMONDS WITH
RESPECT TO THEIR BITTERNESS
O03
M. Isabel López, M. Pilar Callao, Itziar Ruisánchez
UNTARGETED VERSUS TARGETED MODELING IN A FOOD ADULTERATION
PROBLEM
O04
Riccardo Nescatelli, Rossana Bonanni, Remo Bucci, Andrea Magrì, Antonio Magrì, Federico Marini
GEOGRAPHICAL TRACEABILITY AND AUTHENTICITY OF EXTRA VIRGIN OLIVE OIL
BY CHEMOMETRIC TECHNIQUES AND CHROMATOGRAPHIC FINGERPRINT
O05
Miguel Lopo, Ricardo N.M.J. Páscoa, João A. Lopes,
NIR SPECTROSCOPY AS A TOOL FOR VINEYARDS SOIL CHARACTERIZATION
16
Page 18
O06
N. Dordevic, F. Camin, G. J. Postma, L. M. C. Buydens, R. Wehrens,
STATISTICAL METHODS FOR IMPROVING AUTHENTICATION OF WINES BASED ON
STABLE ISOTOPE RATIOS
O07
Joao Aires-de-Sousa, Xiaohui Qu, Diogo A. R. S. Latino, Rui P. Fartaria,
Florbela Pereira,Qingyou Zhang, Tanfeng Zhao
A QSPR APPROACH FOR ULTRA-FAST ESTIMATION OF DFT-CALCULATED
MOLECULAR PROPERTIES
O08
Kamel Mansouri, Davide Ballabio, Viviana Consonni, Roberto Todeschini
INVESTIGATING SAR LANDSCAPES
O09
Andrea Ferraris, Giovanni Valbusa, Alessandro Maiocchi
RECEPTOR-BASED 3D-QSAR UNDER THE MULTIPLE-INSTANCE PARADIGM
O10
Marta Bevilacqua, Lorenzo Rigoni, Sara Venti, Remo Bucci, Andrea D. Magrì, Antonio L. Magrì,
Federico Marini
QUANTIFICATION OF API ENANTIOMERIC EXCESS IN DRUGS BY NIR SPECTROSCOPY
AND CHEMOMETRICS
O11
A. S. Luna, I. C. A. Lima,W. F. Rocha, J. R. Araujo, O. Kuznetsov, E. H. Ferreira, R. Boqué, J. Ferré
BRAZILIAN SOIL CLASSIFICATION USING RAMAN SPECTROSCOPY WITH VARIABLE
SELECTION AND CHEMOMETRIC TOOLS
O12
B. Dejaegher, C. Ruckebusch, O. Devos, Y. Vander Heyden
ALTERNATIVE METHODS FOR MULTI-OBJECTIVE OPTIMIZATION OF RADIAL BASIS
FUNCTION – SUPPORT VECTOR MACHINES FOR CLASSIFICATION (RBF-SVM-C)
17
Page 19
O13
Noslen Hernández, Rolando J. Biscay, Nathalie Villa-Vialaneix, Isneri Talavera
FUNCTIONAL DENSITY BASED INVERSE REGRESSION FOR CALIBRATION
O14
M. Stocchero, E.S.F. Demetrio, G. Ciocci, M. Marchetti
CHEMOMETRICS AND DIFFERENTIAL SCANNING CALORIMETRY FOR THE
CHARACTERIZATION OF THE POLYMORPHIC BEHAVIOR OF PRULIFLOXACIN
O15
M. Sergent
CONSTRUCTION OF SPACE FILLING DESIGNS USING WSP ALGORITHM:
CONSTRUCTION AND APPLICATION
O16
Johan Hultman, Martin Berntsson
ADDRESSING, INCORPORATING AND VISUALIZATION OF RISK IN QBD
O17
Mª de la Cruz Ortiz, Luis A. Sarabia, Mª Sagrario Sánchez
SELECTION OF NEARLY ORTHOGONAL BLOCKS IN AN ‘AD-HOC’ EXPERIMENTAL
DESIGN
O18
Magalie Claeys-Bruno, Michelle Sergent
SENSITIVITY ANALYSIS WITH SPACE FILLING DESIGN: ISTHME (IMPROVED
SENSITIVITY THROUGH MORRIS EXTENSION) METHOD
O19
Marco Calderisi, Alessandro Ulrici, Renato Seeber
FEATURE SELECTION STRATE,Y ON EXPERIMENTAL DESIGN SIMULATION OF
GASEOUS MIXTURE SPECTRA
18
Page 20
O20
Consuelo Pizarro, Sofía Rodríguez-Tecedor, Isabel Esteban-Díez, Alfonso Sáenz-Mateo, José
María González-Sáiz
MULTI-STEP SENSORY-BASED APPROACH FOR THE MONITORING OF RED WINE
ALTENATIVE AGING PROCESSES
O21
Sílvia Mas, Catarina Miguel, Maria João Melo, João A. Lopes, Anna de Juan
STUDY OF THE CHARACTERIZATION AND QUANTITATION OF PROTEINACEOUS
BINDERS IN RED MEDIEVAL PAINTS BASED ON FOURIER TRANSFORM INFRARED
SEPCTROSCOPY AND CORRELATION CONSTRAINED MULTIVARIATE CURVE
RESOLUTION ALTERNATING LEAST SQUARES METHOD
O22
M.C. Ortiz, L. Sarabia, A. Herrero, M.S. Sánchez, C. Reguera,
S. Sanllorente, R. Morales, M.L. Oca, L. Rubio
COELUTING COMPOUNDS WITH SHARED IONS: A CHALLENGE FOR ANALYTICAL
CHEMISTRY SOLVED BY MEANS OF THREE-WAY TECHNIQUES
O23
Romà Tauler, Amrita Malik, Marta Alier
EXTENDED MULTIVARIATE CURVE RESOLUTION FOR QUADRILINEAR AND FOR
INCOMPLETE DATA SETS
O24
B. Debus, M. Sliwa, C. Ruckebusch
DEALING WITH NON-LINEARITIES IN ULTRAFAST SPECTROSCOPY: MCR-ALS
ALTERNATIVES
O25
Anna de Juan, Romà Tauler
MULTIVARIATE CURVE RESOLUTION (MCR) IN PERSPECTIVE
19
Page 21
O26
Elisa Salvatore, Marina Cocchi, Federico Marini, Anna de Juan
MULTISET CLASSIFICATION BY MCR-ALS DISCRIMINATION APPLIED TO WINE
AUTHENTICATION
O27
A. Herrero, C. Reguera, M.C. Ortiz, L.A. Sarabia
DETERMINATION OF DICHLOBENIL AND ITS MAJOR METABOLITE (BAM) IN ONIONS
BY PTV−GC−MS AIDED BY PARAFAC2 DECOMPOSITION AND EXPERIMENTAL
DESIGN METHODOLOGY
O28
M. Cocchi, J. M. Prats Montalban, M. Li Vigni, A. Ferrer
A WAVELET-BASED MULTIVARIATE IMAGE ANALYSIS APPROACH TO DETECT
DEFECTS IN ORANGES
O29
Sara Piqueras , Romà Tauler, Anna de Juan
MULTISET ANALYSIS OF MULTITECHNIQUE RAMAN AND IR HYPERSPECTRAL
IMAGES
O30
Carlotta Ferrari, Giorgia Foca, Alessandro Ulrici
HANDLING LARGE DATASETS OF HYPERSPECTRAL IMAGES
O31
P. Oliveri, V. Pirro, L. S. Eberlin, R.G. Cooks
A CLASS-MODELLING APPROACH FOR DETECTING NEOPLASY IN HUMAN BLADDER
TISSUE ANALYSED BY DESI-MS HYPERSPECTRAL IMAGING
O32
Isneri Talavera, Isis Madrazo, Noslen Hernández
SOIL CLASSIFICATION FOR FORENSIC PURPOSE BY USING SCANNING ELECTRON
MICROSCOPY WITH X-RAY ANALYZER, COLOR ANALYSIS AND CHEMOMETRIC
TOOLS
20
Page 22
O33
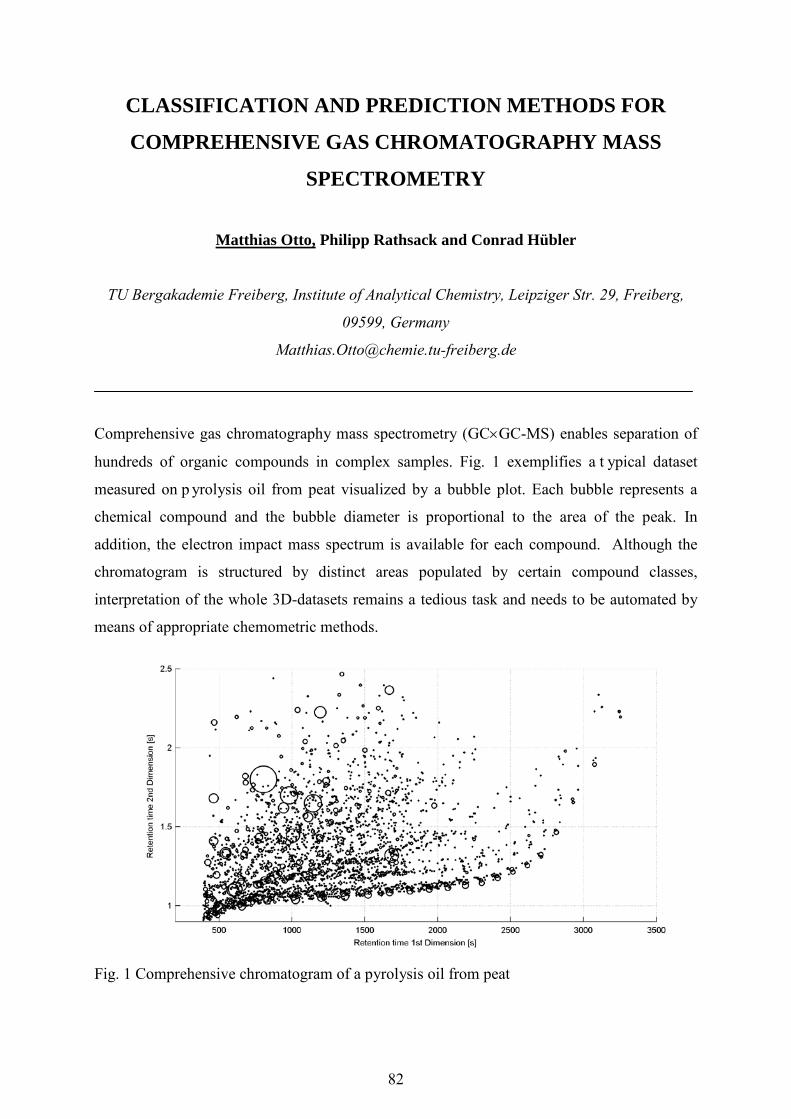
Matthias Otto, Philipp Rathsack and Conrad Hübler
CLASSIFICATION AND PREDICTION METHODS FOR COMPREHENSIVE GAS
CHROMATOGRAPHY MASS SPECTROMETRY
O34
Martin Berntsson, Johan Hultman
MOVING TOWARDS CONTINUOUS MANUFACTURING: SUCCESSFUL REAL -TIME
MONITORING AND EARLY FAULT DETECTION
O35
Pierantonio Facco, Emanuele Tomba, Natascia Meneghetti, Tereza Zelenková,
Antonello A. Barresi, Daniele L. Marchisio, Fabrizio Bezzo, Massimiliano Barolo
TRANSFERRING THE MANUFACTURING OF A PHARMACEUTICAL NANOPARTICLE
PRODUCT BETWEEN DIFFERENT PLANTS
O36
E. Mantovani, A. Ferrando, F. Bonacini, A. La Piccirella, M.Cocchi
MULTIVARIATE DATA ANALYSIS OF A BATCH POLYMERIZATION REACTION WITH
STABILITY PROBLEMS
O37
C. A. Teixeira dos Santos, Ricardo N.M.J. Páscoa, João A. Lopes
A REVIEW ON THE APPLICATIONS OF PORTABLE NEAR INFRARED SPECTROMETERS
IN THE AGRO-FOOD INDUSTRY
O38
Emanuel Garcia, Ilka Klaas, José M. Amigo
CAN LAME COWS BE DETECTED WITH AUTOMATIC MILKING SYSTEM DATA?
21
Page 23
RECONSIDERING THE PRE-PROCESSING PROCESS
J. Engel, J. Gerretzen, L.M.C. Buydens
Radboud University Nijmegen, IMM, Analytical Chemistry
Many research areas are confronted with an ever increasing amount of measurement data,
often originating from multiple advanced analytical technologies. Data analysis is therefore
crucial to many different fields. Pre-processing – removal of data artifacts and making the
data suitable for (multivariate) data analysis – is recognized as a pivotal step in the full data
analysis chain by chemometricians. Choosing the right pre-processing technique for a
particular problem is currently based on t rial and error, visual inspection or by data quality
parameters. We will shake these pre-processing fundamentals by showing that all three
approaches easily lead to wrong choices.
65 70 75 80 85 900
5
10
15
20
25
30
35
40
45
Classification accuracy (%)
Com
plex
ity o
f the
mod
el
Classification result: two-class FT-IR data
Pre-processing methodRaw data
As an example, consider the figure on t he right, that shows the effect of different pre-
processing techniques on FT-IR data for a two-class problem. Classifying the raw data (i.e. no
pre-processing) already leads to 86% correct classification – see the black dot. Many pre-
processing methods clearly worsen the classification accuracy (by up to 20%) or increase the
complexity of the model. The choice of a pre-processing technique thus has a very large
influence on the outcome of the data analysis. In this case, it might even be advisable to not
pre-process at all, which is completely contradictory to current practices. All current
approaches on selecting the optimal pre-processing technique for a particular problem have
major difficulties in doing so, as we will extensively show in this lecture
22
Page 24
APPLICATION OF NEAR INFRARED AND PLS-DA TO
CLASSIFY ALMONDS WITH RESPECT TO THEIR
BITTERNESS
Eva Borràsa, José Manuel Amigob, Frans van den Bergb, Ricard Boquéa, Olga Bustoa
aiSens Research Group. Department of Analytical Chemistry and Organic Chemistry,
Universitat Rovira i Virgili. Campus Sescelades, 43007 Tarragona, Spain bDepartment of Food, Quality and Technology, Faculty of Sciences, University of
Copenhagen, Rolighedsvej 30, DK-1958 Frederiksberg C, Denmark Corresponding author e-mail: [email protected]
The almond (Prunus amygdalus) is a member of the family Rosaceae and the fruit is
classified as a drupe. There are two different species as function of the kernel bitterness: the
bitter and the non-bitter/sweet almonds. The bitterness of the almond is a consequence of the
presence of cyanogenic glucosides, such as amygdalin and prunasin, concentrated in the
kernel. When the seed tissue is damaged an enzymatic hydrolysis occurs that produces
benzaldehyde (that confers the bitter flavor), sugars and hydrogen cyanide (HCN), which is
potentially toxic. Since amygdalin is not found in sweet almonds its detection might be a
specific indicator of bitterness in the almonds. This work shows a simple, fast, non-
destructive and robust methodology to discriminate bitter and sweet almonds by the in situ
measurement of the Near Infrared (NIR) spectra of the kernel surface without any sample
pretreatment. NIR spectra are formed by broad absorption bands and, therefore, can be
difficult to interpret directly. For this reason their analysis is inherently linked to the use of
multivariate data analysis methods. In this case principal component analysis (PCA) and
partial least-squares discriminant analysis (PLS-DA) models have been performed to develop
a reliable method to separate bitter from sweet kernels. Different sets of both sweet and bitter
almonds were measured in different days. After pre-processing of the spectra (standard
normal variate scaling and mean centering), the calibration model was developed using the
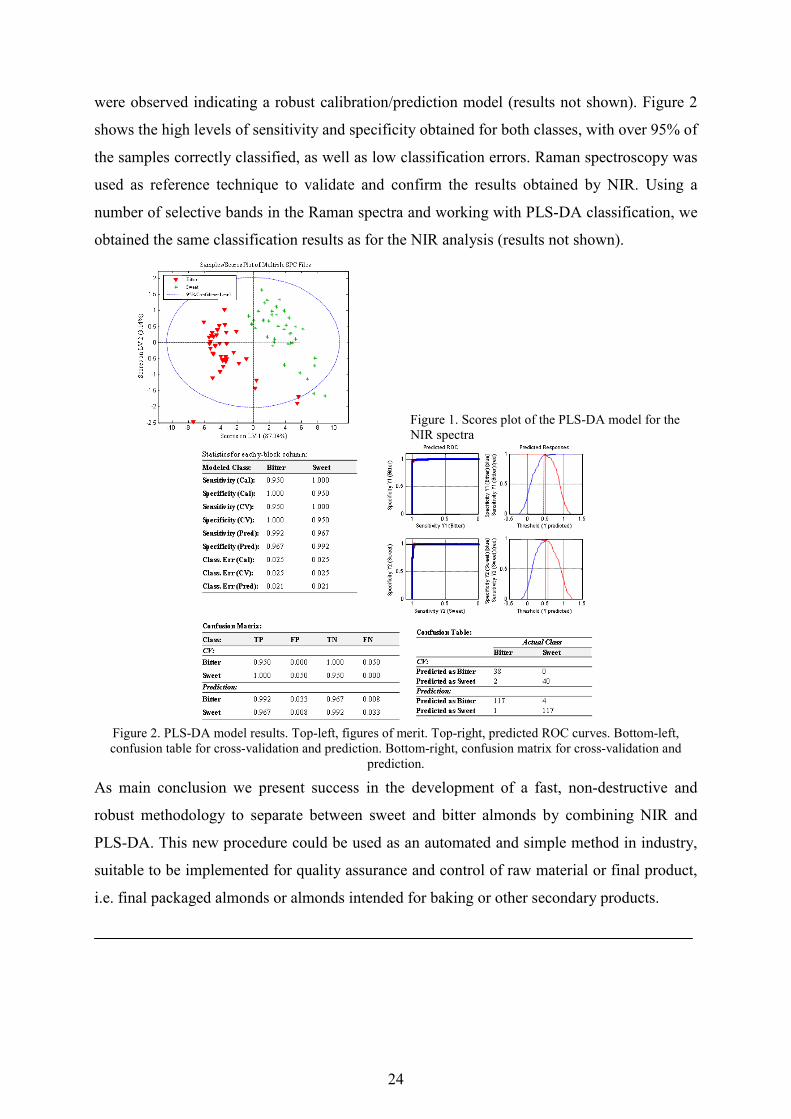
almonds measured on the first day by leave-one-out cross validation with good results (Fig.1).
Using this calibration model, the other measurement sets (hence, almonds measured on
different days) were used as external prediction set. No significant differences between days
23
Page 25
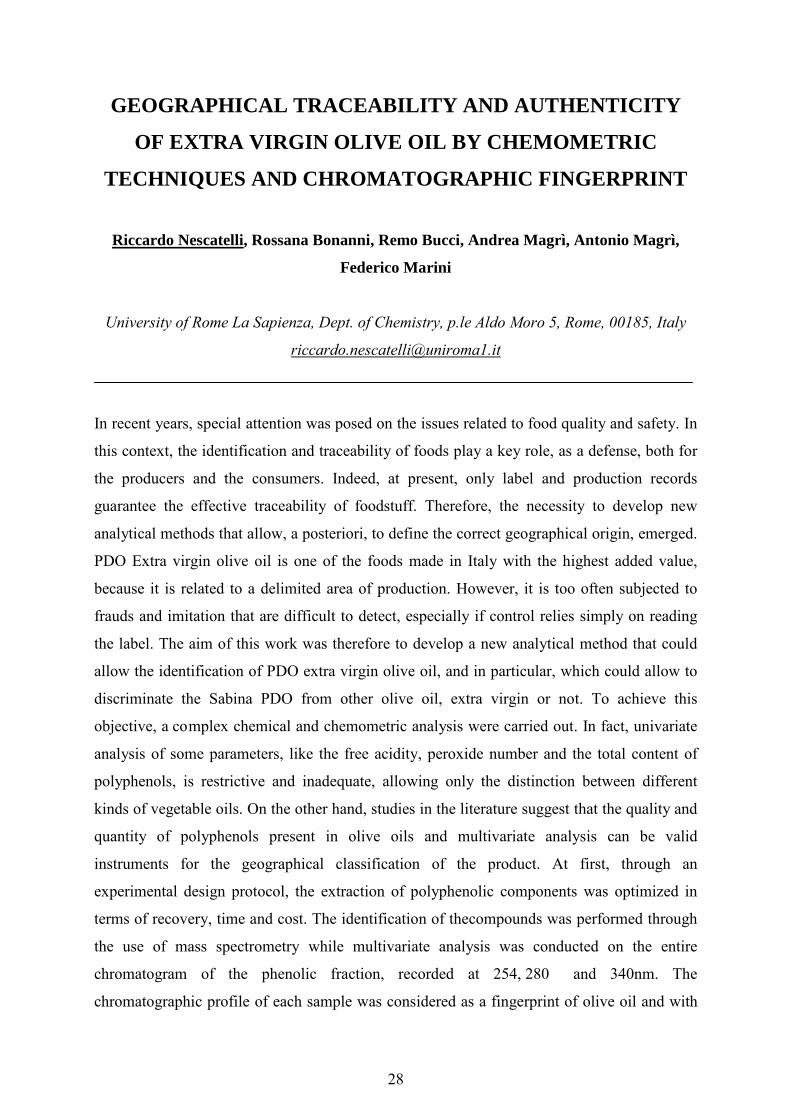
were observed indicating a robust calibration/prediction model (results not shown). Figure 2
shows the high levels of sensitivity and specificity obtained for both classes, with over 95% of
the samples correctly classified, as well as low classification errors. Raman spectroscopy was
used as reference technique to validate and confirm the results obtained by NIR. Using a
number of selective bands in the Raman spectra and working with PLS-DA classification, we
obtained the same classification results as for the NIR analysis (results not shown).
Figure 1. Scores plot of the PLS-DA model for the NIR spectra
Figure 2. PLS-DA model results. Top-left, figures of merit. Top-right, predicted ROC curves. Bottom-left, confusion table for cross-validation and prediction. Bottom-right, confusion matrix for cross-validation and
prediction.
As main conclusion we present success in the development of a fast, non-destructive and
robust methodology to separate between sweet and bitter almonds by combining NIR and
PLS-DA. This new procedure could be used as an automated and simple method in industry,
suitable to be implemented for quality assurance and control of raw material or final product,
i.e. final packaged almonds or almonds intended for baking or other secondary products.
24
Page 26
References
Barceloux DG.(2009) Cyanogenic foods (cassava, fruit kernels, and cycad seeds). Disease-a-
Month, 55(6):336-352
Gradziel T. (2009) Almond (prunus dulcis) breeding. In: Springer New York; 1-31.
http://dx.doi.org/10.1007/978-0-387-71203-1_1. 10.1007/978-0-387-71203-1_1
Thygesen L.G.; Lokke M.M.; Micklander E.; Engelsen S.B.. (2003), Vibrational
microspectroscopy of food. raman vs. FT-IR. Trends in Food Science and Technology;
14(1):50-57
25
Page 27
UNTARGETED VERSUS TARGETED MODELING IN A
FOOD ADULTERATION PROBLEM
M. Isabel López, M. Pilar Callao, Itziar Ruisánchez
Rovira i Virgili University, Chemometrics, Qualimetric and Nanosensors Grup, Department
of Analytical and Organic Chemistry, Marcel·lí Domingo s/n, Tarragona, 43007, Spain
[email protected]
Spectroscopic techniques together with chemometrics have turned into a powerful tool for
food authenticity, quality and adulteration studies [1, 2]. In the recent past, food fraud has
become more sophisticated due to the use of unconventional or synthetic adulterants. So, the
every-increasing range of analytes which may be used in fraud together with the impossibility
of cover them all makes difficult to model all possible adulterants.
The most common classifiers are based on discriminant or modeling ability. At least two or
more classes must be defined in the first group whereas the second group can be used in
problems where there is only one class of interest [3]. Despite the potential of class-modeling
techniques, their use is not extended for one-class modeling approach.
The aim of this study is to investigate the feasibility of NIR spectroscopy coupled with class
modeling to determine adulteration considering, as a case study, hazelnut pastes adulteration.
In this work, we have taken into account two different adulterants; (1) a similar product such
as almond paste and (2) an unexpected one as chickpea flour.
We have developed and compared two approaches, summarized in Fig. 1. The first one was
based on modeling only the unadulterated class. When the adulterated samples were predicted
in that model 3.6% of samples was wrongly classified in the unadulterated class whereas the
rest was considered as ‘not in the model’.
The second approach considered the modeling of the adulterant class as well as the
unadulterated one. The samples used to build the model were the ones adulterated with
almond paste whereas the rest of samples adulterated with chickpea flour were used in
predictions. The results show that the modeled adulterated samples were mainly classified in
their own class (90.9%). On the other hand, samples with chickpea were mainly predicted in
the adulterated class or in ‘not in any model’, 67.3% and 30.9%, respectively.
26
Page 28
Fig. 1 Schematic summary of the two approaches used in this study.
References
[1] Karoui R, De Baerdemaeker J (2007) A review of the analytical methods coupled with
chemometric tools for the determination of the quality and identity of dairy products. Food
Chem., 102, 621-640.
[2] Di Anibal CV, Odena M, Ruisánchez I, Callao MP (2009) Determining the adulteration of
spices with Sudan I-II-II-IV dyes by UV-visible spectroscopy and multivariate classification
techniques. Talanta, 79, 887-892.
[3] Oliveri P, Downey G (2012) Multivariate class modeling for the verification of food-
authenticity claims. TrAC Trends Anal. Chem., 35, 74-86.
27
Page 29
GEOGRAPHICAL TRACEABILITY AND AUTHENTICITY
OF EXTRA VIRGIN OLIVE OIL BY CHEMOMETRIC
TECHNIQUES AND CHROMATOGRAPHIC FINGERPRINT
Riccardo Nescatelli, Rossana Bonanni, Remo Bucci, Andrea Magrì, Antonio Magrì,
Federico Marini
University of Rome La Sapienza, Dept. of Chemistry, p.le Aldo Moro 5, Rome, 00185, Italy
[email protected]
In recent years, special attention was posed on the issues related to food quality and safety. In
this context, the identification and traceability of foods play a key role, as a defense, both for
the producers and the consumers. Indeed, at present, only label and production records
guarantee the effective traceability of foodstuff. Therefore, the necessity to develop new
analytical methods that allow, a posteriori, to define the correct geographical origin, emerged.
PDO Extra virgin olive oil is one of the foods made in Italy with the highest added value,
because it is related to a delimited area of production. However, it is too often subjected to
frauds and imitation that are difficult to detect, especially if control relies simply on reading
the label. The aim of this work was therefore to develop a new analytical method that could
allow the identification of PDO extra virgin olive oil, and in particular, which could allow to
discriminate the Sabina PDO from other olive oil, extra virgin or not. To achieve this
objective, a complex chemical and chemometric analysis were carried out. In fact, univariate
analysis of some parameters, like the free acidity, peroxide number and the total content of
polyphenols, is restrictive and inadequate, allowing only the distinction between different
kinds of vegetable oils. On the other hand, studies in the literature suggest that the quality and
quantity of polyphenols present in olive oils and multivariate analysis can be valid
instruments for the geographical classification of the product. At first, through an
experimental design protocol, the extraction of polyphenolic components was optimized in
terms of recovery, time and cost. The identification of thecompounds was performed through
the use of mass spectrometry while multivariate analysis was conducted on the entire
chromatogram of the phenolic fraction, recorded at 254, 280 and 340nm. The
chromatographic profile of each sample was considered as a fingerprint of olive oil and with
28
Page 30
the application of chemometric methods, it w as possible to extract useful chemical
information for the classification and determination of the geographical origin.
Before applying classification methods, it was necessary to pretreat the chromatographic data
to eliminate the variability due to variations of the baseline and the shift of the retention times
of the analytes. For the correction of the baseline, the algorithm "Penalyzed Asymmetric
Least Squares"[1] was used. After correcting the baseline, it was necessary to pretreat further
chromatographic signals to ensure that the peaks of the analytes were aligned. Operatively,
the alignment of the chromatograms was performed using iCoshift algorithm, which divides
the chromatograms into sever parts and for each part identifies the best alignment [2]. The
chromatographic profiles of extra virgin olive oils extracts (27 Sabina PDO and 50 ot her
origins) after being "pretreated", have been used as data for the construction of the
classification model. Specifically, the method applied for discriminant classification was
Partial Least Squares Discriminant Analysis (PLS-DA) [3]. The predictive capability of a
multivariate classification model can be affected by the presence of a large number of
variables, in our case, not all the points that constitute the chromatographic profile carry
discriminant information, and a selection of portion of the chromatogram was necessary. For
this purpose, the technique Backwards Interval PLS (Bi-PLS) coupled to a procedure based
on Genetic Algorithms (GA) [4] was used. Once calibrated, the classification model (PLS-DA
after Bi-PLS-GA) has been validated, and tested for its predictive capacity on external extra
virgin olive oil samples and 90% of these were correctly classified. Of 27 samples of extra
virgin olive oil (Sabina PDO and not) 24 were classified in the appropriate class of perfectly.
In conclusion, the analytical-method developed, being based on the chemometric processing
of the results of chemical analysis on the finished product, doesn’t rely on label and can allow
detecting imitations and falsifications of Sabina PDO. Furthermore, it was demonstrated that
the chromatographic fingerprint of the phenolic fraction of extra virgin olive oil may be a
possible indicator of product traceability. In the future,models of traceability, similar to this,
can be built for other extra virgin olive oil with the appellation of origin to revealing fraud.
References
[1] Eilers PHC. Anal. Chem., 2004, 76, 404-411
[2] Tomasi G, Savorani F, Engelsen SB. J. Chromatogr. A, 2011, 1218, 7832-7840
[3] Barker M, Rayens W. J. Chemometr., 2003, 17, 166-73
[4] Leardi R, Norgaard L. J. Chemometr., 2004, 18, 486-497
29
Page 31
NIR SPECTROSCOPY AS A TOOL FOR VINEYARDS SOIL
CHARACTERIZATION
Miguel Lopo, Ricardo N.M.J. Páscoa, João A. Lopes
REQUIMTE/ Faculdade de Farmácia, Universidade do Porto, Departamento de Ciências
Químicas, Rua de Jorge Viterbo Ferreira n.º 228, 4050-313 Porto, Portugal
[email protected]
The wine industry has always been particularly interested in the influence of the terroir
characteristics on the features of a wine, but over the past few years a growing interest has spurred
on the mechanisms by which a particular soil influences: growth of the vineyard, grape variety
characteristics and ultimately wine quality [1]. Near-infrared Spectroscopy (NIRS) is a rapid, non-
destructive, inexpensive and accurate analysis technique and its use in soil evaluation as a fast
method for discriminating different types of soil and also for determining different soil constituents
is rapidly increasing [2]. In this work, a total of 14 sampling points with different soil compositions,
previously characterised by geological reference methods, were chosen from a vineyard in the Dão
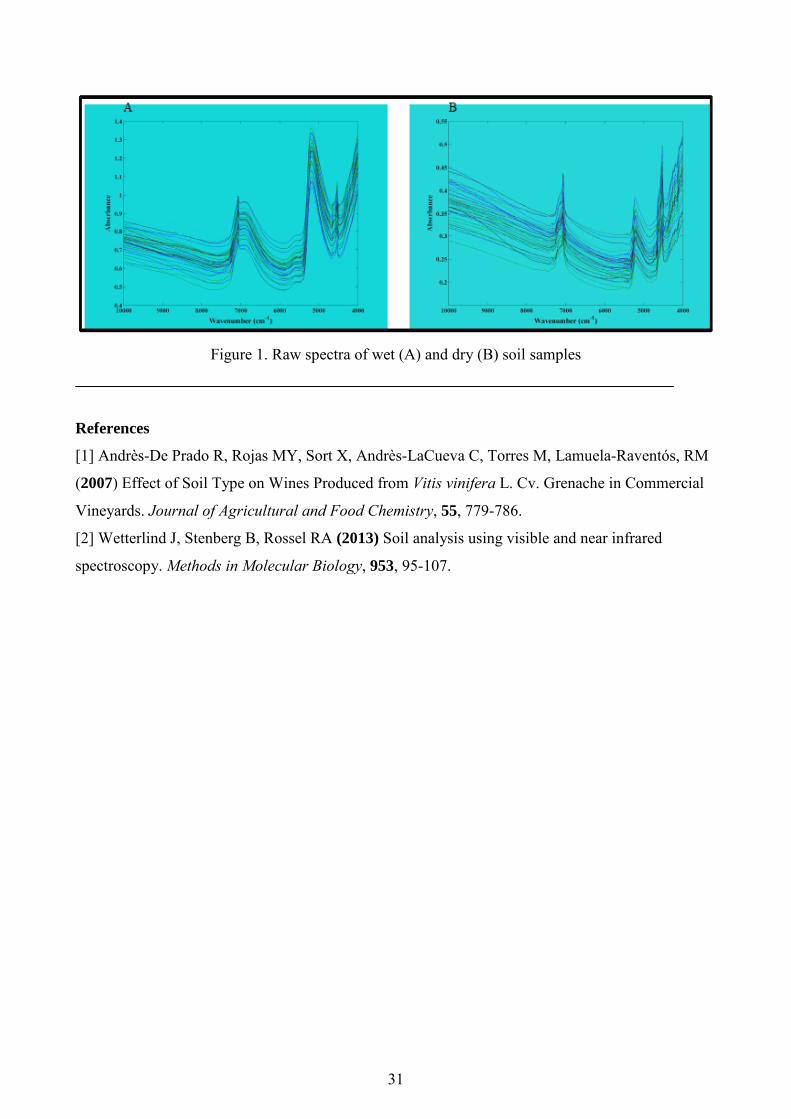
Delimited Region, centre of Portugal. Wet and dried (Fig. 1) samples were scanned on a Fourier
Transform Near-infrared Spectrometer (FTLA 2000, ABB, Québec, Canada) in diffuse reflectance
mode. The spectra were further processed through chemometric tools, namely Principal Component
Analysis (PCA) and Partial Least Squares Discriminant Analysis (PLS-DA). Preliminary results,
through PLS-DA, indicate that this method is able to discriminate between the different soil types
collected with an accuracy of 85% and 90% for wet and dry samples respectively. The objective of
this work is to realise if NIRS technology is suitable to correlate, complement and eventually
replace costly, time-consuming geological reference methods.
30
Page 32
Figure 1. Raw spectra of wet (A) and dry (B) soil samples
References
[1] Andrès-De Prado R, Rojas MY, Sort X, Andrès-LaCueva C, Torres M, Lamuela-Raventós, RM
(2007) Effect of Soil Type on Wines Produced from Vitis vinifera L. Cv. Grenache in Commercial
Vineyards. Journal of Agricultural and Food Chemistry, 55, 779-786.
[2] Wetterlind J, Stenberg B, Rossel RA (2013) Soil analysis using visible and near infrared
spectroscopy. Methods in Molecular Biology, 953, 95-107.
31
Page 33
STATISTICAL METHODS FOR IMPROVING
AUTHENTICATION OF WINES BASED ON STABLE
ISOTOPE RATIOS
N. Dordevica, F. Camina, G. J. Postmab, L. M. C. Buydensb, R. Wehrensa aFondazione Edmund Mach, Research and Innovation Centre, via Mach 1, 38010 San
Michele all’Adige (TN), Italy bRadboud University Nijmegen, Institute for Molecules and Materials, Analytical Chemistry,
P.O. Box 9010, 6500 GL Nijmegen, The Netherlands
E-mail ([email protected] )
Wine derives its economic value partly from its geographical origin and production
technologies. Authenticity evaluation involves a check of several features like declaration of
origin, year of vintage, and also the evaluation of any addition of unpermitted substances
during the production process like water and sugar.
In Italy, at least 400 reference samples (collecting a particular number of samples from every
region) every year are used to build the isotope ratio databank ((D/H)1, (D/H)2, R, δ18O,
δ13C).
In this work, we evaluate several methods based on this unique data repository for checking
authenticity claims (wine origin, detection of unpermitted sugar and water addition). The
results show that using multivariate methods false claims of origin as well as unpermitted
sugar and water addition can be discovered much easier [1].
References
[1] Dordevic N, Wehrens R, Postma GJ, Buydens LMC and Camin F (2012) Statistical
methods for improving verification of claims of origin for Italian wines based on stable
isotope ratios. Analytica Chimica Acta 757, 19-25.
32
Page 34
A QSPR APPROACH FOR ULTRA-FAST ESTIMATION OF
DFT-CALCULATED MOLECULAR PROPERTIES
Joao Aires-de-Sousa,a Xiaohui Qu,a Diogo A. R. S. Latino,a Rui P. Fartaria,a
Florbela Pereira,a Qingyou Zhang,b Tanfeng Zhaob
aCQFB and REQUIMTE, Departamento de Química, Faculdade de Ciências e Tecnologia,
Universidade Nova de Lisboa, 2829-516 Caparica, Portugal; bInstitute of
Environmental and Analytical Sciences, College of Chemistry and Chemical
Engineering, Henan University, Kaifeng, 475004, PR China
[email protected]
The rapid access to intrinsic physicochemical properties of molecules is required to derive
interpretable molecular descriptors, and process thousands or millions of structures in data
mining explorations. Quantum chemistry calculations provide estimations of several
properties with increasing accuracy, e.g. by Density Functional Theory (DFT), but are still too
computationally expensive for large-scale uses. This work explores the possibility of pre-
calculating molecular properties by DFT for thousands of structures, and make machine
learning (ML) algorithms extract knowledge from the data with QSPR approaches. Once
trained, the ML models can be applied to new structures and yield fully-automated ultra-fast
estimations of DFT calculations.
Here we present the first implementations of this concept in our lab, for the estimation of
bond dissociation energies (BDE), partial atomic charges, molecular orbital energies and
electrophilicity index [1] Collections with thousands of molecular structures were retrieved
from the ZINC database, [2] and atomic/bond/molecular properties were calculated by DFT
methods with the GAMESS program. [3] For the QSPR protocol, atomic and bond descriptors
were designed to encode atoms and bonds in molecules, while molecular descriptors were
used from the CDK open-source package. [4]
An example is detailed for the prediction of bond energies. Homolytic bond di ssociation
energies were calculated by B3LYP/6-311++G(d,p)//DFTB for >12,000 non-ring bonds in a
highly diverse set of compounds with elements C, H, O, N, or S. Bonds were represented by
33
Page 35
topological bond d escriptors designed to encode atom types and connectivity in the 2D
topological environment of the bonds. Machine learning methods, such as random forests and
neural networks, were trained with the goal of predicting BDEs from the bond descriptors.
The best model, a neural network ensemble based on 85 bond descriptors, was able to predict
the (DFT-calculated) BDE of 887 bonds in an independent test set (covering a range of 17.67
- 202.30 kcal/mol) with RMSD of 5.29 kcal/mol, mean absolute deviation of 3.35 kcal/mol,
and R2=0.953. The predictions were compared with semi-empirical PM6 calculations, and
were found to be superior for all types of bonds, except for O-H, N-H, and N-N bonds. An
experimental web service and the database of the calculated BDEs are available at
http://joao.airesdesousa.com/bde.
References
[1] Parr RG, Szentpaly LV, Liu S (1999) Electrophilicity index. J. Am. Chem. Soc., 121,
1922–1924.
[2] Irwin JJ, Sterling T, Mysinger MM, Bolstad ES, Coleman RG (2012) ZINC: a free tool to
discover chemistry for biology. J. Chem. Inf. Model., 52, 1757–1768.
[3] GAMESS Version 11 Aug 2011 (R1). Schmidt MW, Baldridge KK, Boatz JA, Elbert ST,
Gordon MS, Jensen JH, Koseki S, Matsunaga N, Nguyen KA, Su S, Windus TL, Dupuis M,
Montgomery JA (1993) General atomic and molecular electronic structure system. J. Comput.
Chem., 14, 1347–1363.
[4] Steinbeck C, Hoppe C, Kuhn S, Floris M, Guha R, Willighagen EL (2006). Recent
developments of the Chemistry Development Kit (CDK) - an open-source Java library for
chemo- and bioinformatics. Curr. Pharm. Des., 12, 2111–2120.
Acknowledgements: This work was funded by Portuguese national funds via FCT –
Fundação para a Ciência e a T ecnologia (Lisboa, Portugal) – under project PEst-
C/EQB/LA0006/2011. DARSL acknowledges FCT for the postdoctoral research grant
SFRH/BPD/63192/2009.
34
Page 36
INVESTIGATING SAR LANDSCAPES
Kamel Mansouri, Davide Ballabio, Viviana Consonni, Roberto Todeschini
Milano Chemometrics and QSAR Research Group, Department of Environmental Sciences,
University of Milano-Bicocca, P.zza della Scienza 1, 20126 Milano, Italy.
E-mail ([email protected] )
According to the congenericity principle, structurally similar compounds are assumed to be
associated with similar activities. However, the activity landscape of QSAR datasets is not
always as smooth as it is expected to be. Similar molecules may have very different activities
leading to discontinuous SAR landscapes or activity cliffs. It is defined by the ratio of the
difference in activity of two compounds to their “distance” of separation in the chemical
space.[1]
Activity cliffs ratio was first described in terms of the Structure-Activity Landscape Index
(SALI) by Guha and Van Drie.[2] Later different studies have been published about activity
cliffs and ways of calculating it.
This work is aiming to make a comparison study between the different approaches from the
literature and to introduce a new approach based on “multi-centered” Mahalanobis distance to
assess SAR landscapes. In addition to activity cliffs, this approach has the advantage to
equally consider structural cliffs that, correspondingly are the result of dissimilar compounds
with similar activity. These two properties are extracted from a s pecific distance matrix
designed for the purpose. Unlike the Euclidean distance matrix, it is dissymmetric and
obtained from distances between a couple of data points calculated centering the covariance
matrix on each one of them.
This approach was tested and compared with the published ones available in the literature.
The analysis was conducted on three datasets; a simulated one that consisted of 49 d ata-
points, a dataset of 82 polycyclic aromatic hydrocarbons [3], and the Selwood dataset
consisting of 53 compounds [4]. The proposed approach showed promising results in terms of
visualization of SAR landscapes to better detection of continuous/ discontinuous SAR regions
and thus the corresponding compounds to each region.
35
Page 37
References
[1] Maggiora, G. M. On Outliers and Activity CliffsWhy QSAR Often Disappoints. J. Chem.
Inf. Model. 2006, 46, 1535–1535.
[2] Guha, R.; Van Drie, J. H. Structure-activity landscape index: identifying and quantifying
activity cliffs. Journal of chemical information and modeling 2008, 48, 646–658.
[3] Todeschini, R.; Gramatica, P.; Provenzani, R.; Marengo, E. Weighted holistic invariant
molecular descriptors. Part 2. Theory development and applications on m odeling
physicochemical properties of polyaromatic hydrocarbons. Chemometrics and I ntelligent
Laboratory Systems 1995, 27, 221–229.
[4] Selwood, D. L.; Livingstone, D. J.; Comley, J. C. W.; O’Dowd, A. B.; Hudson, A. T.;
Jackson, P.; Jandu, K. S.; Rose, V. S.; Stables, J. N. Structure-activity relationships of
antifilarial antimycin analogues: A multivariate pattern recognition study. Journal of
Medicinal Chemistry 1990, 33, 136–142.
36
Page 38
RECEPTOR-BASED 3D-QSAR UNDER THE MULTIPLE-
INSTANCE PARADIGM
Andrea Ferraris,a Giovanni Valbusa,b Alessandro Maiocchia
a Bracco Imaging SpA, via Ribes 5, I-10010 Colleretto Giacosa (TO),Italy,
b Ephoran Multi Imaging Solutions - via Ribes 5, I-10010 Colleretto Giacosa (TO), Italy
E-mail: [email protected]
Modern medicinal chemistry relies heavily on 3D structural information about therapeutic
target; whenever such information is available, it is used to understand target mechanisms and
experimental ligand binding data to guide the search of new ligands, being in many cases the
key for successful drug design [1, 2]. Among the structure-based design methodologies,
docking techniques are based on computational description of the binding site and provide for
each investigated ligand (generally a relatively small molecule) a pool of structural solutions
(called poses), due to the degree of both conformational and roto-translational freedom within
the binding site of the receptor. Under the assumption that only a pose is involved in the
receptor’s recognition, one of the most critical issue is the selection of that single solution
(frequently indicated as the bioactive conformation) representative of the main stereo-
electronic features of the ligand responsible for the intermolecular interaction. This solution
should provide the basic information on which three-dimensional descriptors, used in the
further development of a statistical quantitative structure-activity relationships (QSAR)
model, are calculated. It follows that the results of this studies can be strongly biased by the
selection’s criteria used for the reference conformation for each ligand. Moreover the
calculation of the interaction forces among the ligands and the receptors are approximate in
nature and the maximum interaction energy principle should not be used routinely.
In this work we suggest a new method to address the issues related to the pose selection,
under a supervised multiple-instance learning framework [3]; according to this paradigm and
related semantics, each ligand represents an object described by multiple instances of the
object itself, i.e. the conformations. Each instance is described in our case by a real-valued
features vector of 3-D descriptors. All instances of an object constitute a bag, which is in turn
real-value labelled with the binding affinity data. After that suitable flexible-ligand docking
37
Page 39
calculations are performed and a pool of conformations is selected for each ligand, the task is
to find the best 3D-QSAR model. In our approach, the quantitative model is built using the
Multiple Linear Regression (MLR) method, in combination with an iterative sequence of
steps as follows: i) select a n-dimensional descriptor space in which the instances of each bag
are projected, ii) define the list of the primary instances extracting the “centrotype”
conformation for each bag and iii) calculate the MLR model which correlate the primary
instances’ features with the bags’ labels. This procedure is done iteratively under the
supervision of a f eature selection genetic algorithm optimizing the robustness and the
predictive ability of the model using a Leave-More-Out cross-validation protocol.
Furthermore the cross-validation procedure is extended to the centrotype selection method in
order assess the sensitivity of the model robustness to the distribution of the available
instances in each bag. The proposed procedure for deriving 3D-QSAR models was applied to
several case studies: a) using a data set of ligands for the Acetylcholinesterase receptor
adopting the WHIM molecular descriptors and b) using two datasets of Matrix
Metalloproteases inhibitors where energy-based descriptors derived from the ligand-receptor
interactions of each pose were used. The validation of the proposed procedure was also
assessed comparing the selected conformations entering in the best models with the available
crystallographic data of the corresponding ligand-receptor complexes.
Figure 1: multiple instances dataset and docking solutions relationship in the multiple-instance framework.
References
[1] Babine, R.E., Bender, S.L. (1997). Molecular recognition of protein-ligand complexes:
applications to drug design. Chem. Rev., 97, 1359-1472.
[2] Kubinyi, H. (1999). Change favors the prepared mind-from serendipity to rational drug
design J. Recept. Signal Transduction Res., 19, 15-31.
[3] Dietterich, T.G., Lathrop, R.H., Lozano-Perez, T. (1997). Solving the multiple-instance
problem with axis-parallel rectangles. Artificial Intelligence, 89, 31-71.
38
Page 40
QUANTIFICATION OF API ENANTIOMERIC EXCESS IN
DRUGS BY NIR SPECTROSCOPY AND CHEMOMETRICS
Marta Bevilacqua, Lorenzo Rigoni, Sara Venti, Remo Bucci, Andrea D. Magrì, Antonio
L. Magrì, Federico Marini
Dept. of Chemistry, Univ. of Rome “La Sapienza”, P.le Aldo Moro 5, Rome, I-00185, Italy
E-mail: [email protected]
Individual enantiomers often differ considerably in their pharmacological activity (something
one being even toxic whereas the other is active and having desired properties): accordingly,
in 1992 FDA issued a directive requiring drug manufacturers to evaluate the effects of
individual enantiomers and then check the purity of chiral molecules produced. In this
framework, our study focuses on the possibility of rapidly and non-invasively determining the
enantiomeric excess of two commonly marketed APIs, ibuprofen and epinephrine, by using of
NIR spectroscopy and chemometrics.
Solid mixtures at different enantiomeric compositions of ibuprofen and epinephrine were
prepared by adding the active enantiomer and the racemate in opportune proportions. Matrix
matched standard were also prepared by adding the APIs at different enantiomeric excess with
commonly used excipients. The NIR spectra (between 1000-2500 nm) for each prepared
sample was acquired and the calibration models relating the spectral profiles to the
enantiomeric excess of the APIs were built on the entire spectral range at first, while
successively both interval-PLS and genetic algorithm were used, to have more easily
interpretable results and higher predictive accuracy in cases where the interference of
excipients could be more marked. In all cases, to reduce the impact of undesired variability on
the signals, different spectral preprocessing were tested.
In the case of ibuprofen, the best model on full spectrum was obtained after pretreatment with
SNV and 2nd derivative, and resulted in very good performances on t he external test set
(almost no bias, and RMSEP=1.71). However, when the optimized model was used to predict
the enantiomeric excess in commercial drugs, it was not possible to reach the same accuracy
39
Page 41
due to the presence of excipients. In this respect, the use of variable selection techniques,
allowed to increase the predictive accuracy on real samples and to obtain more robust and
easily interpretable models.
On the other hand, the best spectral pretreatment for epinephrine resulted to be SNV followed
by detrending, which lead to almost no bias in the prediction of validation samples and a
RMSEP of 1.91. In this case, since commercial epinephrine is sold only in solution and the
control on s olid epinephrine is carried out only during the production stage, where no
excipients are added yet, further modeling steps were not needed.
40
Page 42
BRAZILIAN SOIL CLASSIFICATION USING RAMAN
SPECTROSCOPY WITH VARIABLE SELECTION AND
CHEMOMETRIC TOOLS
Luna, A. S.a; Lima, I. C. A.a; Rocha, W. F.b; Araujo, J. R.b; Kuznetsov, O.b; Ferreira,
E. H.b; Boqué, R.c; Ferré, J.c aUniversidade do Estado do Rio de Janeiro, Rio de Janeiro, Brazil.
bInstituto Nacional de Metrologia, Qualidade e Tecnologia, Duque de Caxias, Brazil. cUniversitat Rovira i Virgilli, Tarragona, Spain.
E-mail: [email protected]
The classification allows adequate soil preparation for cultivation, important for a country that
exports various agricultural commodities. In Brazil, the system adopted is the Brazilian
System of Soil Classification, which uses chemical parameters, physical and morphological
changes; however, some analyzes are time-consuming, mainly because of the stage of sample
preparation [1]. The aim of this study was to use Raman spectroscopy coupled with
chemometric techniques of pattern recognition, as a tool for classification of Brazilian soils.
124 samples of the five Brazilian soils were provided, without identification, pulverized and
sieved in airtight bags, Embrapa Solos SA (Rio de Janeiro, Brazil). The samples were
analyzed as received. After being analyzed by a Raman spectrophotometer, samples were
divided into two sets of calibration and validation, using the algorithm Kennard-Stone. The
calibration and validation sets were built with 75 and 49 samples, respectively.
Several chemometric tools were used to classify the soils samples using Raman spectra data
like as SIMCA, HCA, PLS-DA, DA-SVM and iPLS-DA. The tested methods produced
unsatisfactory results with larger classification errors in calibration and validation sets,
however, when the genetic algorithm or intervals were used as variable selection with PLS-
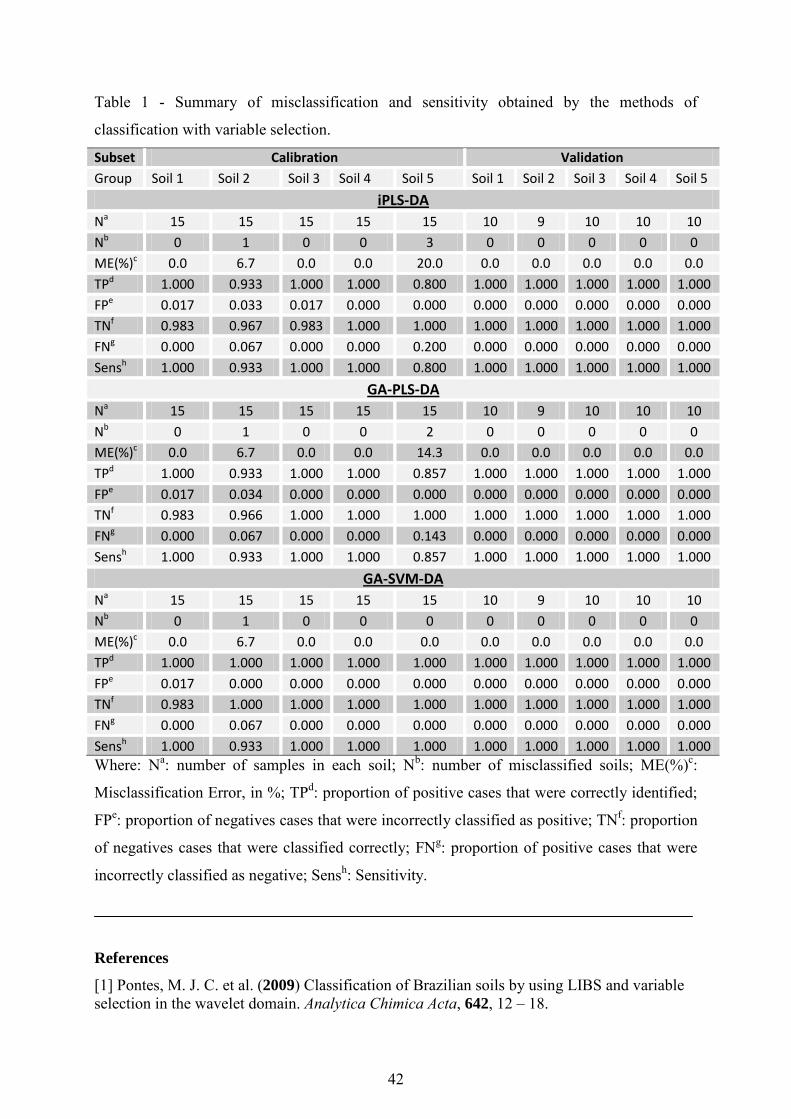
DA or SVM-DA; the soil samples were correctly classified. Table 1 shows a s ummarized
results with figures of merit.
Therefore, the variable selection coupled with chemometric techniques is a powerful tool to
classify soil samples using Raman spectra data.
41
Page 43
Table 1 - Summary of misclassification and sensitivity obtained by the methods of
classification with variable selection.
Subset Calibration Validation Group Soil 1 Soil 2 Soil 3 Soil 4 Soil 5 Soil 1 Soil 2 Soil 3 Soil 4 Soil 5
iPLS-DA Na 15 15 15 15 15 10 9 10 10 10 Nb 0 1 0 0 3 0 0 0 0 0 ME(%)c 0.0 6.7 0.0 0.0 20.0 0.0 0.0 0.0 0.0 0.0 TPd 1.000 0.933 1.000 1.000 0.800 1.000 1.000 1.000 1.000 1.000 FPe 0.017 0.033 0.017 0.000 0.000 0.000 0.000 0.000 0.000 0.000 TNf 0.983 0.967 0.983 1.000 1.000 1.000 1.000 1.000 1.000 1.000 FNg 0.000 0.067 0.000 0.000 0.200 0.000 0.000 0.000 0.000 0.000 Sensh 1.000 0.933 1.000 1.000 0.800 1.000 1.000 1.000 1.000 1.000
GA-PLS-DA Na 15 15 15 15 15 10 9 10 10 10 Nb 0 1 0 0 2 0 0 0 0 0 ME(%)c 0.0 6.7 0.0 0.0 14.3 0.0 0.0 0.0 0.0 0.0 TPd 1.000 0.933 1.000 1.000 0.857 1.000 1.000 1.000 1.000 1.000 FPe 0.017 0.034 0.000 0.000 0.000 0.000 0.000 0.000 0.000 0.000 TNf 0.983 0.966 1.000 1.000 1.000 1.000 1.000 1.000 1.000 1.000 FNg 0.000 0.067 0.000 0.000 0.143 0.000 0.000 0.000 0.000 0.000 Sensh 1.000 0.933 1.000 1.000 0.857 1.000 1.000 1.000 1.000 1.000
GA-SVM-DA Na 15 15 15 15 15 10 9 10 10 10 Nb 0 1 0 0 0 0 0 0 0 0 ME(%)c 0.0 6.7 0.0 0.0 0.0 0.0 0.0 0.0 0.0 0.0 TPd 1.000 1.000 1.000 1.000 1.000 1.000 1.000 1.000 1.000 1.000 FPe 0.017 0.000 0.000 0.000 0.000 0.000 0.000 0.000 0.000 0.000 TNf 0.983 1.000 1.000 1.000 1.000 1.000 1.000 1.000 1.000 1.000 FNg 0.000 0.067 0.000 0.000 0.000 0.000 0.000 0.000 0.000 0.000 Sensh 1.000 0.933 1.000 1.000 1.000 1.000 1.000 1.000 1.000 1.000 Where: Na: number of samples in each soil; Nb: number of misclassified soils; ME(%)c:
Misclassification Error, in %; TPd: proportion of positive cases that were correctly identified;
FPe: proportion of negatives cases that were incorrectly classified as positive; TNf: proportion
of negatives cases that were classified correctly; FNg: proportion of positive cases that were
incorrectly classified as negative; Sensh: Sensitivity.
References
[1] Pontes, M. J. C. et al. (2009) Classification of Brazilian soils by using LIBS and variable selection in the wavelet domain. Analytica Chimica Acta, 642, 12 – 18.
42
Page 44
ALTERNATIVE METHODS FOR MULTI-OBJECTIVE
OPTIMIZATION OF RADIAL BASIS FUNCTION – SUPPORT
VECTOR MACHINES FOR CLASSIFICATION (RBF-SVM-C)
B. Dejaeghera,b, C. Ruckebuschb, O. Devosb, Y. Vander Heydena
aDept. Analytical Chemistry and Pharmaceutical Technology (FABI), Center for
Pharmaceutical Research (CePhaR), Pharmaceutical Institute, Vrije Universiteit Brussel
(VUB), Laarbeeklaan 103, 1090 Brussels, Belgium bLASIR CNRS Université Lille – Nord de France, Sciences et Technologies, bât C5, cité
scientifique, 59655 Villeneuve d’Ascq cedex, France
[email protected]
In discrimination, one tries to find a relation between an m x n data matrix X, consisting, for
example, of m spectra or chromatograms containing each n variables, and an m x 1 response
vector y, which is categorical, i.e. containing the class labels of the m samples. Various
discrimination techniques have been developed. One technique, called Support Vector
Machines for classification (SVM-C), can model complex non-linear boundaries between
classes through the use of adapted kernel functions, such as the often applied Radial Basis
Function (RBF) kernel [1,2]. Using this kernel function, two parameters should be optimized,
i.e. the regularization parameter C and the RBF kernel parameter γ.
For their optimization, different approaches were compared [3], i.e. a grid search with
logarithmic steps, a grid search with equal steps, an experimental design optimization [4], and
a variable-size simplex optimization [5]. For a g iven data set, in all approaches, the same
ranges for the parameters were examined, i.e. 1 till 106 for C, and 10-4 till 1 for γ. The
responses considered to determine the optimum parameter settings were the percentage of
correct classification rate (%CCR) for the calibration set with five-fold cross-validation (CV)
(%CCR_cal_cv), and the total number of Support Vectors (nSVTOT). For all approaches,
Derringer’s desirability functions [6] were used to optimize both responses simultaneously.
Three different data sets were used. All data sets contain NIR spectra of manufactured textiles
of various compositions. The classification problem consists in the determination of the level
of a p hysical property that can take two or three discrete values for data sets 1 and 2/3,
43
Page 45
respectively. Data set 1 contains spectra with 480 NIR wavelengths and was divided in 192
training and 96 test set samples. Data sets 2 and 3 contain 13 va riables or 2800 N IR
wavelengths, respectively, and were divided in 132 training and 91 test set samples. Both data
sets were preprocessed using Standard Normal Variate and column centering.
For NIR data set 1, similar %CCR_cv_cal, %CCR_cal, %CCR_test, % specificity for each
class, and % sensitivity for each class were obtained for all approaches. Also similar nSVTOT
and SV’s were selected. For NIR data set 2, adequate and more or less similar %CCR_cv_cal,
%CCR_cal, %CCR_test, % specificity for each class, and % sensitivity for each class were
obtained for all approaches. Also rather similar nSVTOT and SV’s were selected. For NIR data
set 3, except the variable simplex method, all approaches allowed optimizing the RBF-SVM-
C parameters γ and C and obtaining adequate models. The simplex approach failed as it got
stuck in a local optimum. When comparing the time needed for the optimization, the
experimental design approach was found to be the fastest for all considered data sets,
followed by both grid search methods and the variable simplex approach.
References
[1] Burges CJC (1998) A tutorial on support vector machines for pattern recognition. Data
Min. Knowl. Discov., 2, 121-167.
[2] Cristianini N, Shawe-Taylor J (2000) An Introduction to Support Vector Machines.
Cambridge University Press, Cambridge.
[3] Devos O, Ruckebusch C, Dejaegher B. Alternative methods for multi-objective
optimization of Radial Basis Function – Support Vector Machines for Classification (RBF-
SVM-C). Submitted for publication.
[4] Dejaegher B, Durand A, Vander Heyden Y (2010) Experimental design in method
optimization and robustness testing. In G. Hanrahan and F.A. Gomez (Eds): Chemometric
Methods in Capillary Electrophoresis. Chapter 2, John Wiley & Sons, New Jersey, pp. 11-74.
[5] Dejaegher B, Vander Heyden Y (2009) Sequential optimization methods. In: S. Brown, R.
Tauler and B. Walczak (Eds): Comprehensive Chemometrics. Volume 1, C hapter 17,
Elsevier, Oxford, pp. 547-575.
[6] Derringer G, Suich R (1980) Simultaneous optimization of several response variables. J.
Qual. Technol., 12, 214-219.
44
Page 46
FUNCTIONAL DENSITY BASED INVERSE REGRESSION
FOR CALIBRATION
Noslen Hernández, Rolando J. Biscay, Nathalie Villa-Vialaneix, Isneri Talavera
Advanced Technologies Application Center (CENATAV)
7ma A #21406 e/ 214 y 216, Siboney, Playa, C.P.12200, La Habana, Cuba.
[email protected]
Statistical calibration plays a crucial role in many areas of technology such as pharmacology,
neuroscience and chemometrics. The calibration problem can be described as follows. An
observable random variable X is related to a variable of interest Y according to a s tatistical
model specified by a conditional probability density f(X/Y). The density of Y may be imposed
by the researcher (controlled experiments) or given by nature (natural experiments). A sample
D of independent observations (x1,y1),...,(xn,yn) of (X,Y) is available. Given a new (future)
observation x0 of X that corresponds to an unknown value y0 of Y, the problem is to make
statistical inferences about y0 on the basis of the given statistical model, the data D and x0.
The practical motivation that leads us to study the above problem comes from chemometrics,
specifically from spectroscopy, where some chemical variable Y (e.g., concentration of a
substance) needs to be predicted from a digitized function X (e.g., an absorbance spectrum).
In this setting, such conditional density f(X/Y) (“inverse model”) represents the physical data
generation mechanism in which the output spectrum X is determined by the input chemical
concentration Y, plus some random perturbation mainly due to the measurement procedure.
Then, given an observed spectrum x0, that corresponds to a new substance, it is desired to
obtain an estimate of its concentration y0, based on (past) observations of pairs of spectra and
concentrations (xi,yi), i = 1,...,n.
Hereafter, we restrict ourselves to cases where the variable of interest Y takes real values (e.g.,
only the concentration of one substance is considered). In this framework, different
calibration setups arise, depending on a) the space in which the random variable X takes
values (univariate, multivariate or functional calibration), and b) the kind of design: fixed
design (the Y values are not random but set by the researcher) or random design (Y is a
45
Page 47
random variable as well as X). A review of the literature on this subject, for both univariate
and multivariate calibration, can be found in (Osborne 1991).
This paper is concerned with the setting of functional calibration, and specifically, the focus is
put on the case of random design (we refer the reader to (Cuevas et. al. 2002) for an approach
on functional calibration under fixed design). A widely used criteria for calibration in case of
random design is the mean squared error, which is minimized by the regression function
E(Y/X = x0). This can be estimated by means of functional regression methods in which the
response Y is a real random variable and the explanatory variable X has functional nature. A
number of such methods have been proposed (Ramsay 2005, Ferraty 2006).
However, none of these approaches for predicting Y makes use of the specific structure of
density f(X/Y) (“inverse” regression model X vs Y), which plays a major role in the calibration
context. On the contrary, their probabilistic assumptions are made about the densities f(Y/X)
and f(X). Note that in the calibration setting, the model f(X/Y) represents the data generation
mechanism, and so it is natural that the probabilistic assumptions refer to this model. In this
generating mechanism, the response variable actually is X, and Y is the explanatory variable.
Hence, contrary to standard prediction in regression problems, the variable to be predicted, Y,
is not the response variable of the generating statistical model, f(X/Y), but its explanatory
variable.
In this paper, a new functional calibration approach, named Functional Density-Based Inverse
Regression (DBIR), is introduced. This method makes it possible to incorporate knowledge
on the (“inverse”) regression model f(X/Y) for the prediction of a scalar variable Y on the basis
of a f unctional data X, so taking into consideration the just mentioned specificities of the
prediction problem in the calibration setting.
The performance of the functional DBIR approach has been corroborated through a
simulation study. DBIR was also test on a r eal-world benchmark data set named Tecator
showing promising results.
References Osborne C (1991) Statistical calibration: A review. International Statistical Review, 59, 309–336.
Cuevas A, Febrero M, Fraiman R (2002) Linear functional regression: the case of fixed design and
functional response. The Canadian Journal of Statistics 30, 285–300.
Ramsay J, Silverman B (2005) Functional data analysis. Springer, New York.
Ferraty F, Vieu P (2006) Nonparametric functional data analysis: Theory and practice. Springer-
Verlag, New York.
46
Page 48
CHEMOMETRICS AND DIFFERENTIAL SCANNING
CALORIMETRY FOR THE CHARACTERIZATION OF THE
POLYMORPHIC BEHAVIOR OF PRULIFLOXACIN
M. Stoccheroa, E.S.F. Demetriob, G. Ciocci2b, M. Marchettib
aS-IN Soluzioni Informatiche S.r.l., via G. Ferrari 14, Vicenza, 36100, Italy
bA.C.R.A.F. S.p.A. – Angelini Research Center, S. Palomba – Pomezia, 00040, Rome, Italy
[email protected] (corresponding author)
Chemometrics was successfully applied in combination with spectroscopic techniques (FTIR
and XRPD) for the characterization of the solid state of pharmaceuticals [1,2]. Differential
Scanning Calorimetry (DSC) is a very sensitive technique for investigating the polymorphic
behavior and stability of pharmaceutical active ingredients. Moreover, information can be
obtained on the thermodynamic relationships between different polymorphs and also on the
transformation rates if traces of other crystalline forms, not detectable with spectroscopic
techniques, are present [3]. Polymorphic impurity in fact could adversely compromise both
the stability and the performance of the final products.
In our study we describe an interesting and useful approach where DSC and hyper-DSC are
combined with statistical projection methods for characterizing the polymorphic behaviour of
prulifloxacin, an active pharmaceutical ingredient (API) having a high level of polymorphism.
A fine DSC-based classification of API is proposed to predict potential, unexpected
crystalline form transformations that may occur due to trace levels of other polymorphs.
Ninety production batches of prulifloxacin drug substance characterized by a high crystalline
purity (> 95% by XRPD) and well defined particle size were collected and analyzed.
Differences observed on the basis of the DSC thermogram profiling of the collected lots were
investigated after a suitable data pre-treatment by Principal Component Analysis, O2PLS and
Hierarchical Cluster Analysis [4,5]. Three main types of DSC profile were identified (type A,
B and C). A further thermal stress study (70°C for 40 days, in the dark) was performed in
order to evaluate if the type of profile could be related to a different behavior of the lot under
thermal stress. As result, 21% of the lots having one of the three main profiles (profile A)
showed modification in their DSC profile while for the other lots the DSC profile was
47
Page 49
unchanged. The analysis of the hyper-DSC profiles after thermal stress highlighted that most
of the lots having DSC profile similar to that showing modifications exhibited a characteristic
hyper-DSC profile. Then, a predictive O2PLS-DA/Naïve Bayes classifier was built with the
aim to suggest in advance potential instability. The classifier was successfully used to
elucidate the anomalous behavior of some lots of prulifloxacin employed in the development
of the drug product production process.
References
[1] Jørgensen AC, Miroshnyk I, Karjalainen M, Jouppila K, Siiriä S, Antikainen O, Rantanen
J (2006) Multivariate data analysis as a fast tool in evaluation of solid state phenomena.
Journal of Pharmaceutical Sciences, 95 (4), 906-16
[2] Rajalahti T, Kvalheim OM (2011) Multivariate data analysis in pharmaceutics: a tutorial
review. International Journal of Pharmaceutics, 417 (1-2), 280-90
[3] Tong HHY, Shekunov BY, Chan JP, Mok CKF, Hung HCM, Chow AHL (2005) An
improved thermoanalytical approach to quantifying trace levels of polymorphic impurity in
drug powders. International Journal of Pharmaceutics, 295 (1-2), 191-99
[4] Jackson. JE (1991) A Users Guide to Principal Components. New York, John Wiley
[5] Trygg J, Wold S (2003) O2-PLS, a two-block (X-Y) latent variable regression (LVR)
method with an integral OSC filter. Journal of Chemometrics, 17, 53–64.
48
Page 50
CONSTRUCTION OF SPACE FILLING DESIGNS USING WSP
ALGORITHM: CONSTRUCTION AND APPLICATION
Michelle Sergent
Aix Marseille Université, Faculté des Sciences
Laboratoire d’Instrumentation et de Sciences Analytiques, EA 4672,
Avenue Escadrille Normandie Niémen, 13397 Marseille Cedex 20, France
Corresponding author: [email protected]
1. Introduction
Experimental designs help the research scientist to establish optimal experimental strategies with
regard to the expected targets and the available tools. For most of the classical designs, as factorial
design or Doehlert design or D-optimal design for example, the selected experiments are suited to
the underlying mathematical model and are generally positioned on t he boundaries of the
experimental domain. When there is no prior model or when the experimental domain is very large,
as in numerical experiments, these designs are no more appropriate and we need specific designs
that aim at “filling” or “covering” the numerical space.
2. Space Filling designs
Space-filling designs (SFD) that spread the points at which the response is observed evenly
throughout the domain, are more suitable and are increasingly used in computer experiments. The
most known space-filling designs are Latin Hypercubes (random, orthogonal, optimized) and low
discrepancy sequences. But, simulation codes becoming more and more complex, high dimensional
optimal designs are needed to study a high number of parameters (more than 20 parameters) and the
construction proves difficult. We propose to explore a construction method of new space-filling
designs for high dimensional spaces. After a short presentation of the criteria considered to quantify
the intrinsic quality of the uniform designs, the generation of these designs using WSP algorithm is
presented [1]. As the first step consists in generating a set of candidate points, the influence of the
initial set of points is investigated and the final designs are compared to classical space-filling
designs. Then, designs are proposed in dimension 20, 30, 40 a nd 50 and the study of the intrinsic
quality of these new space-filling designs highlights the robustness of this generation method in
high dimensional spaces.
49
Page 51
3. Applications
We present several application cases, in function of the objectives. Indeed, these designs built from
WSP algorithm can be used for different situations:
- Sensitivity analysis : when the number of factors is very high, it is essential to determine
the most important factors to include in a metamodel simpler but realistic, but the
classical screening methods are not adapted when the domain of variation is very large.
- Modelling : when phenomena are complex, specific modeling algorithms as Support
Vector Machines regression or krigging are often used in order to approximate very
complex and chaotic responses surfaces with irregularities, and well-spread experiments
are needed in order to fit the phenomena (training step).
- Quantitative Structure-Activity Relationship: the presented algorithm proposes a
selection of a representative subset of compounds among a set of candidate points in the
descriptors space.
4. Conclusion
The new space filling designs based on WSP algorithm propose a set of points uniformly spread in
the experimental space. These designs are easy to built even in high dimensional space and are very
useful in different application domains.
References
[1] Santiago J, Claeys-Bruno M, Sergent M (2012) Construction of space-filling designs using WSP
algorithm for high dimensional spaces. Chemometrics and Intelligent Laboratory System, 113, 26-
31
50
Page 52
ADDRESSING, INCORPORATING AND VISUALIZATION OF RISK IN QBD
Johan Hultman, Martin Berntsson
Addresses: Umetrics AB, Stortorget 21, 21134 Malmö, Sweden
E-mail: [email protected]
The principles of Quality by Design (QbD) and Design Space are gaining increasing attention
in the DOE community. Despite the need for incorporating the ability to assess and visualize
risk, associated with experiments used to support and confirm development in applications
with complex processes such as pharmaceutical development and production, this is rarely
done, in part because it has been difficult to accomplish a risk estimate with conventional
DOE tools and software. The presentation will address this weakness by enabling an easy
visualization and estimation of risk. With advanced optimization tools in combination with
Monte Carlo Simulations, graphs that can be interpreted as spaces or regions of factor settings
where all result specifications are fulfilled and with low risk of failure. Design Space tools as
the Probability Contour Plot present the operational region that meets the specifications
according to a risk analysis, which will guide engineers in determining how likely it is that
their experiments truly identify the safest operating region. These principles underline that the
engineer must incorporate a risk estimate in the interpretation of the results from designed
experiments.
• Extended tools for Design Space estimation — Probability Contour Plot
• The effect of uncertainties in factor settings can be studied
• Risk analysis based on the user specification
Tools that will be discussed and interpreted:
Contour Plot: Problems and interpretations for QbD.
Sweet Spot: An overlay Contour Plot with multiple responses on top of each other.
Probability Contour Plot: The low risk region is significantly smaller than the
corresponding classical sweet spot or contour plot region.
References L. Eriksson, E. Johansson, N. Kettaneh-Wold, C. Wikström, and S. Wold Design of Experiments: Principles and Applications
51
Page 53
SELECTION OF NEARLY ORTHOGONAL BLOCKS IN AN
‘AD-HOC’ EXPERIMENTAL DESIGN
Mª de la Cruz Ortiza, Luis A. Sarabiab, Mª Sagrario Sánchezb
University of Burgos, Department of aChemistry; bMathematics and Computation, Faculty of
Sciences, Pza. Misael Bañuelos s/n, 09001 Burgos, Spain
[email protected]
In the most usual context, optimization refers to the searching of experimental conditions to
optimize several analytical responses of interest. In general, this has to be approached from an
experimental perspective. Consequently, whether these responses are individually or jointly
optimized, the reliability of the optimal solutions is dependent on a proper experimental
design.
For some experimental procedures, above all when there are several experimental factors, the
number of experiments in a standard design may be unaffordable. From this perspective,
optimization refers to the selection of the experimental design itself, based on its best
characteristics for the given problem. However, there are several criteria to measure the
quality of an experimental design [1] (for example, variance inflation factors for the
coefficients, values of the variance function for the prediction, and related to them the so-
called alphabetic criteria), so that the search of a reduced design that maintains the required
quality is theoretically inside the multicriteria optimization. The approach to deal with this
multicriteria setting is to compute the Pareto-optimal front, POF, that is, the set of different
experimental designs that are optimal in at least one of the criteria being handled, while losing
the least possible in the others. This approach has proven useful [2] for simultaneously
minimizing the VIFs, the volume of the joint confidence region for the coefficients (D-
criterion) or the prediction variance in the whole experimental domain (G- criterion), and both
in the context of factorial or response surface designs –discrete or continuous domains.
In this work, we deal with the problem of arranging experimental designs into blocks, i.e,
blocking experimental designs. Sometimes it is not possible to conduct all the experiments at
once (in a single session, or maintaining the experimental conditions). In such cases, the
possible effect of these modifications must be ‘separated’ from the effect of the factors on the
52
Page 54
responses. One alternative to do i t is to add a dummy variable in the proposed model that
accounts for shifts in the responses, the so-called block variable whose significance would be
related to a significant bias between the responses in the two blocks. In order to correctly
interpret the significance of the block, the estimate of the coefficient of the blocking variable
should be independent of the other coefficients.
To measure the ‘degree’ of independence between the coefficient of the blocking variable and
the remaining ones, we use directly the corresponding covariance factors. That means that
there are as many values as coefficients in the model (minus two), that should be, all of them,
as near to zero as possible. Nevertheless, the blocking of the design may change the variance
and covariance of the estimates of the remaining coefficients (the ‘treatment’ coefficients) -
this is measured somehow in [3] in the form of a weighted average of the efficiency index of
all the coefficients. To take into account this effect we add the D-criterion to the covariance
factors in the definition of the multicriteria problem and compute the Pareto-optimal front
with the aim of describing the trade-offs among criteria and helping in the decision about the
design to choose.
Some comparison with more standards designs are made as well as comparison to other
criteria for blocking designs reported in the literature [e.g. 3].
Acknowledgements: Financial support through projects MECC (CTQ2011-26022) and JCyL
(BU108A11-2) is acknowledged.
References
[1] L. A. Sarabia and M. C. Ortiz (2009) Response Surface Methodology. In: Brown S, Tauler
R, Walczak R (eds.) Comprehensive Chemometrics, volume 1, pp. 345-390 Oxford: Elsevier.
[2] Sánchez MS, Sarabia LA, Ortiz MC (2012) On the construction of experimental designs
for a given task by jointly optimizing several quality criteria: Pareto-optimal experimental
designs. Analytica Chimica Acta, 754, 39-46.
[3] Trinca LA, Gilmour SG (2000) An algorithm for arranging response surface designs in
small blocks. Computational Statistics & Data Analysis, 33, 25-43.
53
Page 55
SENSITIVITY ANALYSIS WITH SPACE FILLING DESIGN:
ISTHME (IMPROVED SENSITIVITY THROUGH MORRIS
EXTENSION) METHOD
Magalie Claeys-Bruno, Michelle Sergent
Aix Marseille Université, Faculté des Sciences
Laboratoire d’Instrumentation et de Sciences Analytiques, EA 4672,
Avenue Escadrille Normandie Niémen, 13397 Marseille Cedex 20, France
Corresponding author: [email protected]
In the last decade, industrial phenomena (oil industry, nuclear,...) are often studied using numerical
simulation. These simulation models are increasingly complex with a large number of input
parameters and consequently a long time of calculation. Therefore, it becomes essential to
determine the most important factors to include in a metamodel, simpler but realistic, by using
screening or sensitivity analysis. The classical screening methods as Plackett and Burman designs,
supersaturated designs or sequential bifurcation are not adapted when the variation domains are
very large since the points are mainly located on the periphery of the domain.
Space filling design The purpose of these designs is to spread the points evenly throughout the
variable’s space. These designs are called Space-Filling Designs (SFD) and the most known are
Latin Hypercubes (random, orthogonal, optimized) and low discrepancy sequences or designs based
on algorithms as WSP [1]. These designs are well-adapted for sensitivity analysis when the
relationship between the response and the inputs is unknown and allow global analysis in order to
detect the irregularities of the phenomenon.
Sensitivity study: Morris’s method. The method proposed by Morris [2] provides a global
sensitivity measure to identify factors effects. For that, a design composed of individual randomized
One-At-a-Time (OAT) designs is built in order to determine, for each factor Xj, the elementary
effects dj(y). Considering L different trajectories, a statistical analysis of these elementary effects
provides the mean µ*j(y) which assesses the global influence of the factor Xj and the standard
deviation σj(y) which indicates the presence of higher order effects and measures the non-linearities
or the interactions of the jth factor with others factors.
54
Page 56
According to the values of µ*j(y) and σj(y), Morris shows that studied factors can be classed into
three groups, factors having:
- negligible effects,
- linear and additive effects,
- nonlinear or interaction effects.
For an easier interpretation, the values of µ*j(y)
and σj(y) can be plotted as shown on the
opposite figure.
Nevertheless, this method which allows the
determination of the main effects and gives
indication on nonl inearities or interactions
requires many simulations without the possibility of using the simulations for a subsequent study.
Sensitivity study: ISTHME method [3]. A new sensitivity analysis method named ISTHME based
on the principles of Morris’s method without the construction of randomized one-at-time (OAT)
design was developed. This method can be applied on a ny experimental design and more
particularly on Space Filling Designs. This specificity is very interesting in terms of time and
calculation economy. Indeed, we can use a universal design, which is adapted to sensitivity analysis
as well as optimization (response surface methods or/and kriging) without any supplementary
simulation. In the ISTHME method, the first step consists in the construction of constellations using
points of a space filling design. The number of these constellations depends on two parameters, l
(length of the segments) and α (the angle between two segments). The study of these two
parameters and several application examples will be presented. In all cases, the ISTHME method
allows a correct classification of the factors.
References
[1] Santiago J, Claeys-Bruno M, Sergent M (2012) Construction of space-filling designs using WSP algorithm for high dimensional spaces. Chemometrics and Intelligent Laboratory System, 113, 26-31 [2] Morris MD (1991) Factorial Sampling Plans for Preliminary Computational Experiments.Technometrics, 33, 161-174. [3] Santiago J, Corre B, Claeys-Bruno M, Sergent M (2012) Improved Sensitivity THrough Morris Extension. Chemometrics and Intelligent Laboratory System, 113, 52-57
Negligible
µ*j(y)
Nonlinear or interaction effects
Linear and additive effects
σj(y)
55
Page 57
FEATURE SELECTION STRATEGY ON EXPERIMENTAL
DESIGN SIMULATION OF GASEOUS MIXTURE SPECTRA
Marco Calderisi a,b, Alessandro Ulrici a,b, Renato Seeber b,c
aDipartimento di Scienze della Vita, Università di Modena e Reggio Emilia, Padiglione Besta,
Via Amendola 2, 42122 Reggio Emilia;
b Consorzio INSTM, Via G. Giusti 9, 50121 Firenze, Italy;
c Dipartimento di Scienze Chimiche e Geologiche, Università di Modena e Reggio Emilia,
Via G.Campi 183, 41125 Modena
E-mail ([email protected] )
The development of new miniaturized, low cost sensing systems for the detection of
substances difficult to handle implies the need to perform preliminary data analysis on
simulated spectra. This challenging task can be solved following different strategies. In this
work, since there was the need to consider a high number of substances (33 different gases
including 4 target molecules, 20 interfering species and 9 air components), we developed an
approach [1,2] that starts from literature databases spectra. They are used as “building blocks”
in order to simulate the spectral profile that would be measured using an External Cavity-
Quantum Cascade Laser Photo Acoustic Sensor (EC-QCLPAS) [3] sensing system, planned
to cover a 200 cm-1 range within the 1000-2500 cm-1 spectral range. Firstly, literature spectra
imported from different literature databases were standardized, in order to obtain unit
concentration spectra over the desired spectral range, at the desired resolution. Then, each
single spectrum was denoised using a Fast Wavelet Transform (FWT) [4,5] based algorithm.
Three concentration matrices, for target molecules, interfering species and air components,
respectively, were built separately by means of Experimental Design techniques, along with a
randomization strategy. Subsequently, the three matrices were merged into a single
concentration matrix. This w as then multiplied by the denoised spectra to give the
corresponding mixtures spectra. To this aim, since the simple matrix multiplication gives
unrealistic results, due to the presence of the background, a sigmoidal transfer function has
been developed and optimized ad-hoc, in order to preserve the correct signal shape. The final
matrix of simulated spectra was obtained by adding to the denoised mixture spectra the noise
56
Page 58
structure characteristic of the EC-QCLPAS spectra. This was estimated by means of FWT and
of robust regression models, using sample spectra measured with a prototypal version of the
EC-QCLPAS. To select the optimal 200 cm-1 wavenumber range and the single wavenumbers
therein contained, a thoughtful pre-selection (SMARTGRID, in-house developed procedure)
was carried out on the whole range, in order to cancel out the regions containing sharp and
intense absorption peaks. This allowed us to avoid problems related to the hypothesized final
instrument precision in repositioning, which is rather low when compared to the extremely
narrow bandwidth. The optimal 200 c m-1 wavenumber range was then selected by
maximizing the Classification Efficiency values calculated with PLS-DA for each position of
a moving window with 200 cm-1 size , covering the whole spectral range of the laser. Finally,
the optimal wavenumber values were identified within the selected range using Genetic
Algorithms (GA) [6] and resampling, performing a series of random subsamplings from a
training set, and applying GA to each subsample for the classification of each target molecule
considered separately. The global frequency of selection in correspondence to each
wavenumber was calculated, and the spectral variables were then ranked accordingly. Finally,
starting from the most frequently selected wavenumber and adding each time a f urther
variable, a series of PLS-DA models was calculated using all the samples of the simulated
spectral database (3000 spectra in the training set and 2000 i n the test set).The optimal
number of single wavenumbers to be kept was defined on the basis of the maximum value of
the overall Classification Efficiency estimated in cross-validation.
References
[1] M. Calderisi, A. Ulrici, L. Pigani, A. Secchi, R. Seeber, Proc. SPIE 8545, 85450B (2012).
[2] A. Ulrici, R. Seeber, M Calderisi, G Foca, J. Uotila, M. Carras, A.M. Fiorello, Proc. SPIE
8545, 85450K (2012).
[3] Secchi, A., Fiorello, A. M., D'Auria, S., Varriale, A., Ulrici, A., Seeber, R., Uotila, J.,
Venditto, V., Estensoro, P., Colao, F., Proc. SPIE 8545, 85450G (2012).
[4] Walczak, B. (ed.), Wavelets in Chemistry, Elsevier, Amsterdam (2000).
[5] Cocchi, M., Seeber, R., Ulrici, A., "Multivariate calibration of analytical signals by
WILMA (Wavelet Interface to Linear Modelling Analysis)", J. Chemometrics 17 (8-9), 512-
527 (2003).
[6] Leardi, R., Nature inspired methods in chemometrics: genetic algorithms and artificial
neural networks, Elsevier, Amsterdam, 169-196 (2003).
57
Page 59
MULTI-STEP SENSORY-BASED APPROACH FOR THE
MONITORING OF RED WINE ALTENATIVE AGING
PROCESSES
Consuelo Pizarro, Sofía Rodríguez-Tecedor, Isabel Esteban-Díez, Alfonso Sáenz-
Mateo, José María González-Sáiz
University of La Rioja, Department of Chemistry, C/Madre de Dios 51, Logroño, 26006
Spain
[email protected]
Maturation of red wines in oak barrels is an ancient art steeped in tradition aimed at
improving wine quality and contributing to the enhancement of its sensory
characteristics. However, the traditional aging system not only requires long time
periods but it is also very costly as oak barrels are highly demanding in terms of space
requirements, labor and maintenance. For this reason, simpler and more affordable
aging practices such as the use of pieces of oak wood in combination with the
application of a controlled micro-oxygenation (MO) have gained increased significance
in the wine industry in the last decade.
Taking into account that the purpose of alternative aging systems is to mimic the
positive effects of traditional aging on wine sensory quality but shortening the time and
costs, the development of a methodology for monitoring changes in sensory properties
during accelerated aging processes could provide a very useful tool for process
supervision, control and optimisation to ensure that the final products meet the desired
quality standards.
In this work, a multi-step sensory-based approach was proposed for monitoring the
impact of accelerated aging treatments on sensory quality development. Two young red
wines from D.O. Navarra (Spain) were separately subjected to accelerated aging in
tanks with oak chips added and micro-oxygenation. Wine samples were collected
during each process and were analyzed by a sensory panel according to 17 descriptors.
The comprehensive stepwise strategy applied attempted to lump together two important
58
Page 60
needs in sensory analysis: the quality control of sensory panels, and the analysis of
individual sensory profile data to handle differences between assessors and to derive on
their basis a compromise solution. Panel performance analysis was carried out both at a
global and at an individual level thanks to the joint application of several methods
(including mixed model ANOVA, Tucker-1 and Manhattan plots, and one-way
ANOVA based F and MSE plots). The STATIS (Structuration des Tableaux À Trois
Indices de la Statistique) method was subsequently applied to find an optimal
compromise solution for the significant attributes describing each process.
Significant product effects were found for 7 a nd 6 a ttributes in the first and second
aging series, respectively. Although panel performance was acceptable in both cases,
moderate differences between assessors were detected, stressing the need for adopting a
consensus approach to properly handle them. The STATIS compromise provided a
reliable estimation of the sensory profiles of wine samples through the aging period
studied for each maturation process. The assignment of individual weights was
consistent with previous findings on assessors’ agreement The first principal component
of the compromise matrix, which accounted for 86.5% and 90.9% of the variance in
each trial data, revealed a sample trend directly related to the time-course evolution of
each process, and contrasted the attributes fruit and herbaceous with the descriptors
related to the wood–wine interaction.
References
Cejudo-Bastante MJ, Hermosín-Gutiérrez I, Pérez-Coello MS (2011) Micro-
oxygenation and oak chip treatments of red wines: Effects on colour-related phenolics,
volatile composition and sensory characteristics. Part II: Merlot wines, Food Chemistry,
124,738–748.
Dahl T, Tomic O, Wold JP, Næs T (2008) Some new tools for visualising multi-way
sensory data. Food Quality and Preference, 19, 103–113.
Gómez-Plaza E, Cano-López M (2011) A review on micro-oxygenation of red wines:
Claims, benefits and the underlying chemistry Food Chemistry, 125, 1131–1140.
Westerhuis, T. Kourti, J.F. MacGregor (1998) Analysis of multiblock and hierarchical
PCA and PLS models. Journal of Chemometrics, 12, 301–321.
59
Page 61
STUDY OF THE CHARACTERIZATION AND
QUANTITATION OF PROTEINACEOUS BINDERS IN RED
MEDIEVAL PAINTS BASED ON FOURIER TRANSFORM
INFRARED SEPCTROSCOPY AND CORRELATION
CONSTRAINED MULTIVARIATE CURVE RESOLUTION
ALTERNATING LEAST SQUARES METHOD.
Sílvia Masa, Catarina Miguelb, Maria João Melob, João A. Lopesc, Anna de Juana
aChemometrics Group. Department of Analytical Chemistry. Universitat de Barcelona. Av.
Diagonal, 647. 08028 Barcelona, Catalonia, Spain. bREQUIMTE, CQFB and Department of Conservation and Restoration, Faculdade de
Ciências e Tecnologia, Universidade Nova de Lisboa, Campus da Caparica, 2829-516
Caparica, Portugal cREQUIMTE, Laboratório de Química Aplicada, Departamento de Ciências Químicas,
Faculdade de Farmácia, Universidade do Porto, Rua de Jorge Viterbo Ferreira, 228,4050-
313 Porto, Portugal
E-mail : [email protected]
For a better conservation of the cultural heritage, detailed information about the artwork
materials used, such as the pigments and the binding media, which were used to carry the
pigment, is needed. Previous studies of the materials of Portuguese medieval paints revealed
that proteinaceous binders such as parchment glue, egg white and egg yolk or mixtures of
them might have been consistently used [1-2]. This work aims at characterizing and
quantifying the binding media formulation used to produce red medieval paints based on the
combined use of Fourier transform infrared (µ-FTIR) spectroscopy and correlation
constrained multivariate curve resolution alternating least squares (correlation constrained
MCR-ALS). The proposed correlation constrained MCR-ALS is a modification of the
classical MCR-ALS that introduces a new constraint to establish internal calibration models
for quantitative analysis [3-5].
First, correlation constrained MCR-ALS has been applied to synthetic binder mixtures of bs
in order to check for the possibility to design an appropriate calibration model to obtain good
60
Page 62
quantitative estimations of the three binders (parchment glue, egg white and egg yolk). This
first exploratory step is relevant given the high similarity among the spectra of some of these
binders. Best calibration models have been finally obtained calibrating simultaneously all
binders in the same MCR-ALS analysis and using either SNV or MSC with Savitzky–Golay
(SG) filter with 1st derivative as FTIR spectra pretreatment. In these models, RMSEC values
around 0.025-0.115 and correlation coefficients above 0.92 ha ve been obtained. The major
difficulty has always been distinguishing between parchment glue and egg white, since these
are the binders with the largest spectral similarity. Finally, classical MCR-ALS has been first
applied in the set of historical samples to check for the presence/absence of these binders. In
this first analysis, parchment glue and egg white have been often found separately or in
mixtures of different proportions, whereas the binder egg yolk seems to be generally absent in
all samples (or in very minor amount in few of them). Correlation constrained MCR-ALS has
been used in multisets combining the binder mixtures (used for calibration) and the historical
samples to provide quantitative values about the binding media formulation used to produce
red medieval paints. The quantitative values in historical samples, however, should be
considered carefully since there is no clear information about the possible ageing processes of
the binders.
References
[1] Miguel C, Lopes J.A, Clarke M, Melo M.J (2012). Combining infrared spectroscopy with
chemometric analysis for the characterization of proteinaceous binders in medieval paints.
Chemometrics and Intelligent Laboratory Systems, 119, 32–38.
[2] Melo M.J, Claro A (2010). Bright Light: Microspectrofluorimetry for the Characterization
of Lake Pigments and Dyes in Works of Art. Accounts of Chemical Research, 43, 857–866
[3] Goicoechea H.C, Olivieri A.C, Tauler R (2010). Application of the correlation constrained
multivariate curve resolution alternating least-squares method for analyte quantitation in the
presence of unexpected interferences using first-order instrumental data. Analyst, 135, 636-42
[4] Antunes M. C, Simão J. E. J, Duarte A. C, Tauler (2002). Multivariate curve resolution of
overlapping voltammetric peaks: quantitative analysis of binary and quaternary metal
mixtures Analyst, 127, 809-817.
[5] Azzouz T, Tauler R (2008). Application of multivariate curve resolution alternating least
squares (MCR-ALS) to the quantitative analysis of pharmaceutical and agricultural samples.
Talanta, 74, 1201-1210.
61
Page 63
COELUTING COMPOUNDS WITH SHARED IONS: A
CHALLENGE FOR ANALYTICAL CHEMISTRY SOLVED BY
MEANS OF THREE-WAY TECHNIQUES
M.C. Ortiza, L. Sarabiab, A. Herreroa, M.S. Sánchezb, C. Regueraa, S. Sanllorentea,
R. Moralesa, M.L. Ocaa, L. Rubioa
University of Burgos, Faculty of Sciences, Department of Chemistrya and Mathematics and
Computationb, Plaza Misael Bañuelos s/n, Burgos, 09001, Spain
E-mail ([email protected] )
Several compulsory regulations on the control of pesticides [1], migrants [2] and veterinary
residues in food [3,4] demand that the analytical procedures aimed at the identification and
quantification of these substances must fulfil some strict requirements, also considered in the
technical document about anti-doping [5] and the ISO Standard 22892 [6]. These guidelines
propose the use of chromatographic techniques coupled to multivariate detectors (usually
MS), so identification will be performed according to both the relative retention time (RRT)
and the mass spectrum recorded in full scan or SIM mode. The RRT must not exceed a pre-
established limit, while particular requirements for mass spectrometry identification are
generally given. The maximum permitted tolerances for the relative peak intensities of
selective ions (m/z) are the more common ones, although they are not fully agreed in different
documents. They are expressed as percentages of the base peak intensity (relative abundance)
depending on the relative intensities. Furthermore, the number of mass peaks taken into
account during identification depends on which MS technique is used and on t he type of
compounds (either forbidden or with a permitted limit). The relationship between the
effective number of ions (identification points, IP), and the technique type is considered (1 IP
per ion in MS1 or per precursor ion in MSn and 1.5 IP per product ion in MSn). The concept of
IP came into being not long ago [3]. When data come from chromatographic techniques and
various characteristic ions are acquired for every analyte in several samples at different
elution times, a three-way tensor, X, is obtained. If X fulfils the second-order property,
PARAFAC (or PARAFAC2) will prove to be adequate for the identification of the unique
factor related to every analyte [7]. This work displays several cases of coeluting compounds
62
Page 64
with shared ions solved using the second-order property of PARAFAC. Case 1: For the
determination of primary aromatic amines, regulated by [2], by means of HS-SPME-GC-MS,
a previous derivatization reaction via treatment with iodine after diazotization is necessary. In
spite of the removal of the by-products and the excess of the reagents, an unidentified
compound coelutes and shares some ions with iodobenzene (derivative of aniline). Case 2:
For the determination of bisphenol A (BPA) by PTV-GC/MS, its deuterated compound, BPA-
d16, is used as IS, so they elute close. When analysing samples from the migration test of BPA
from polycarbonate tableware, several interferents coelute. Case 3: Unequivocal identification
of several acetyl-chlorophenols and chloroanisoles determined by means of HS-SPME-
GC/MS. Trichloro-anisole (TCA) and its deuterated TCA-d5 coelute and share the base peak
of the latter, so it is critical to distribute correctly the fraction of the two ions that corresponds
to each analyte. Case 4:.In the determination of pesticides by PTV-GC/MS, a co eluent
appears with 3,5-dichlorobenzonitrile (IS of dichlobenil) both sharing an ion. Nevertheless,
another compound coelutes with this IS when spiked onion samples are considered; this new
interferent and 3,5-dichlorobenzonitrile share four ions, among others, the base peak of the
latter.
Acknowledgements The authors thank the financial support through projects MECC
(CTQ2011-26022) and JCyL (BU108A11-2). R.Morales thanks to MECD for her FPU grant
AP2010-5506. M.L.Oca and L.Rubio are grateful to University of Burgos for their FPI grants.
References [1] Document N° SANCO/12495/2011. Method validation and quality control procedures for pesticide residues analysis in food and feed. Implemented by 01/01/2012. [2] Guidelines for performance criteria and validation procedures of analytical methods used in controls of food contact materials, EUR 24105 EN – first ed. 2009. [3] Commission Decision 2002/657/EC of 12 August 2002 implementing Council Directive 96/23/EC concerning the performance of analytical methods and interpretation of results. [4] FDA Center for Veterinary Medicine Guidance for Industry (2003) Mass spectrometry for confirmation of the identity of animal drug residues. [5] WADA.Technical Document TD2003IDCR (2003) Identification criteria for qualitative assays incorporating chromatographic and mass spectrometry. [6] ISO Standard 22892 (2006) Soil quality – Guidelines for the identification of target compounds by gas chromatography and mass spectrometry. [7] M.C. Ortiz, L. Sarabia, (2007) Quantitative determination in chromatographic analysis based on n-way calibration strategies, Journal of Chromatography A, 1158, 94–110.
63
Page 65
EXTENDED MULTIVARIATE CURVE RESOLUTION FOR
QUADRILINEAR AND FOR INCOMPLETE DATA SETS
Romà Tauler, Amrita Malik, Marta Alier
Addresses: IDAEA-CSIC, Department of Environmental Chemistry, Jordi Girona 18-26,
Barcelona, 08034, Spain
E-mail ([email protected] )
MCR-ALS has been shown to be adapted easily to diferente posible multiset data structures,
including multiway data sets (1,2), and to higher complexity models, including multilinear
models and mixed multilinear models. We have shown recently two extensions of MCR-ALS,
one to four way data sets fulfilling quadrilinear models (3) and another one, to incomplete
data multisets (4) fulfilling also mixed bilinear and multilinear models.
In the first case, the algorithm used is similar to the one developed for the analysis of three-
way data fulfilling a trilinear model with results similar to those obtained by other multiway
methods like PARAFAC or TLD. The extension of MCR-ALS to four-way data fuldilling a
quadrilinear model (3) allows for the analysis of mixed models ranging from bilinear, trilinear
and quadrilinear data structures and also independently for every resolved componente (this
feature is not presented in other methods). An application of this new cosntraint is shown for
environmetal data acquired to monitor river water quality parameters, at differnent locations,
and sampling periods at different months and years (four data ways or modes in total).
The extension of MCR-ALS to incomplete multiset data stuctures (4), allows extending the
use of this method to situations where information acquired in the diferente modes could not
be complete for diferente reasons. MCR-ALS algorithm has been adapted to cover this type of
situations which can also be present when different types of data are fused sharing some
common modes. An example is shown for environmental monitoring data where ozone and
nitrogen oxide concentrations were acquired hourly, daily and yearly, although in some
circunstance some of the full year data subsets were lacking
64
Page 66
References
[1] Tauler R., Maeder M., de Juan, A., (2009) Multiset data analysis. Extended Multivariate
Curve Resolution., Comprehensive Chemometrics, Elsevier, Vol.2, Chapter 2.24
[2] de Juan A. and Tauler R. (2001) Comparison of three-way resolution methods for non-
trilinear data sets, Journal of Chemometrics, 15, 749-771
[3] Malik A., Sahub A. K., Tauler R, (2013) Extension and application of Multivariate Curve
Resolution- Alternating Least Squares to four-way quadrilinear data-obtained in the
investigation of pollution patterns on Yamuna river, India, Submitted
[4] Alier M. and Tauler R. (2013) Multivariate Curve Resolution of incomplete data multisets,
Submitted
65
Page 67
DEALING WITH NON-LINEARITIES IN ULTRAFAST
SPECTROSCOPY: MCR-ALS ALTERNATIVES
B. Debus, M. Sliwa, C. Ruckebusch
LASIR CNRS Université Lille Nord de France
[email protected]
Multivariate curve resolution by alternating least squares (MCR-ALS) is a powerful method
to infer information about short-lived chemical intermediate states created during ultrafast
chemical reaction from a series of time-resolved spectra. However, the application of MCR
relates to the fulfilment of a low-rank bilinear model for the decomposition of the
experimental data. In ultrafast time-resolved spectroscopy, due to the presence of vibrational
relaxation, continuous spectral evolution and band broadening/narrowing are observed on top
of spectral variations associated to transitions between excited states. The basic assumption
mentioned above may thus sometimes be questioned.
In this presentation, a methodology based on partially constrained MCR-ALS where classical
constraints such as non-negativity are relaxed for some components is extended to hard- and
soft-MCR. These alternative models enable to describe deviations from ideal data bilinearity.
Combined with the input of additional information available from the photophysics, both for
hard-modeling constraint on the concentration profiles (kinetic rates constant for transitions)
and for soft-modeling constraints (selective time domain for vibrational relaxation), this
approach is of particular relevance for the investigation of ultrafast photoinduced processes.
We demonstrate this on time-resolved UV-vis and infrared spectroscopy data for the
characterization of the photodynamics of innovative photochromic compounds.
66
Page 68
MULTIVARIATE CURVE RESOLUTION (MCR) IN PERSPECTIVE
Anna de Juana, Romà Taulerb
aChemometrics group. Universitat de Barcelona. Diagonal, 645. 08028 Barcelona.
bIDAEA-CSIC. Jordi Girona, 18. 08034 Barcelona
E-mail: [email protected]
Multivariate Curve Resolution designs a family of methods devoted to decompose a data set
into a simple bilinear model of chemically meaningful contributions. Born in the 70’s with
Lawton and Sylvestre’s works, it has been continuously evolving until now and there are still
clear directions for improvement.
Relevant milestones in MCR history were the discovery of the relevance of local rank into the
feasibility to get unique and true solutions or the advent of the multiset extension of the
method, which opened a wealth of new scenarios to be solved and largely decreased the
uncertainty linked to MCR solutions.
The simple basic bilinear scaffold of the method, which allowed improvements in the nature
of information accommodated and in the flexible implementation of constraints (by profile or
by set), has made that MCR has surpassed the original definition of factor analysis method.
As a result, the recent hybrid variants of the method interface clearly with other families of
chemometric methodologies, such as hard-modelling, multi-way analysis, calibration or
discrimination methods.
Reconsidering the definition of MCR contribution and profiting from the advantages above,
MCR has entered in new challenging application domains, such as environmental data
analysis, hyperspectral image analysis or –omic sciences.
New challenges may go in the direction of extending the kind of data structures to be
analyzed, the fact of using domain-specific knowledge for the design of new constraints
(based on spatial or morphological information in image analysis or in the inclusion of
ontological and database information in –omic sciences) or the use of the MCR profiles,
which are noise-filtered meaningful compressed representations of original (often massive)
raw data as starting information for further data analysis or postprocessing procedures.
67
Page 69
MULTISET CLASSIFICATION BY MCR-ALS
DISCRIMINATION APPLIED TO WINE AUTHENTICATION
Elisa Salvatorea, Marina Cocchia, Federico Marinib, Anna de Juanc
aUniversity of Modena & Reggio Emilia, Dpt. Chemical and Geological Sciences, V. Campi
183, 41100 Modena, Italy; bUniversity of Roma ‘Sapienza’, Dpt. Chemistry, P.le A. Moro 5, 00185 Rome, Italy; cUniversity of Barcelona, Dpt. Analytical Chemistry, Martí i Franquès, 1-11, 08028
Barcelona, Spain
[email protected]
Recently Multivariate Curve Resolution (MCR) methodology has been extended to regression
tasks by implementation of the so-called correlation constraint [1], which performs an internal
regression model that allows the prediction of analyte concentrations or other properties of
interest. So far, this constraint has been applied for quantitative analysis [2,3]. This constraint,
as any other one, is applied to some or all the profiles in the concentration matrix C,
performing univariate calibration models per each compound, and to all or to some sets in a
multiset structure. The present work is the first attempt to adapt the correlation constraint for
discrimination purposes. It is important to note that, in this context, the typical MCR model,
D = CST has to be reinterpreted. Thus, D rows contain the samples information that may
allow distinction of classes, i.e., spectra, chromatographic fingerprints,…; C is the matrix of
class membership profiles, which will contain class membership information in some profiles
and variance unexplained by class-related information in the rest of profiles and ST contains
the related qualitative class profiles, i.e., response profiles representative of the samples
within a particular class, and some profiles with instrumental response variation unassigned to
a specific class. For the application of the correlation constraint the reference values in the
regression model hold class membership information. The method performs a regression
model during the ALS iterations. Class membership is coded as 1/ 0 for the calibration
samples and applies to the suitable profile in the C matrix in the MCR model. Univariate
classification models are performed on the selected profiles in C between the C- values
calculated at each ALS iteration and the reference class membership information. The model
68
Page 70
is then used to predict class membership for test samples, which are included in the same C
matrix. Number of components in the MCR models can be assessed in this case looking at the
variation in classification rate (also in CV) and the lack of fit.
Two frameworks are considered to test the performance of the method in the case that more
than two classes have to be modeled: the use of separate MCR analysis with one model per
each class or the use of a single MCR analysis with a single multiclass model, in analogy with
the PLS1-DA/ PLS2-DA contexts.
The proposed methodology is useful to extract class information from multiset data, such as
chromatography with a multi-wavelength or mass spectrometry detection. In this case,
classical multiset MCR yields the resolution of the chromatographic peaks as a preliminary
step to provide a reduced dataset represented by the matrix containing area values of the
resolved peaks. This reduced matrix of peak areas is used as starting information for the
discriminant MCR.
The potential of this method is tested on a problem of authentication of Lambrusco wines, i.e.
different geographical production or different PDO denominations. The results provide class
membership profiles and, equally important, chromatographic fingerprints associated with
each one of the classes. The results obtained are compared with those coming from SIMCA
and PLS-DA analysis.
References
[1] De Juan A, Tauler R, Multivariate curve resolution (MCR) from 2000: Progress in
concepts and applications (2006) Critical Reviews in Analytical Chemistry, 36, 163-176.
[2] Azzouz, T., Tauler, R, Application of multivariate curve resolution alternating least
squares (MCR-ALS) to the quantitative analysis of pharmaceutical and agricultural samples,
(2008) Talanta, 74, 1201-1210.
[3] Lyndgaard, L.B., van den Berg, F. and de Juan, A. Quantification of paracetamol through
tablet blister packages by Raman spectroscopy and multivariate curve resolution alternating
least squares. (2013) Chemometrics and Intelligent Laboratory Systems, in press.
69
Page 71
DETERMINATION OF DICHLOBENIL AND ITS MAJOR
METABOLITE (BAM) IN ONIONS BY PTV−GC−MS AIDED
BY PARAFAC2 DECOMPOSITION AND EXPERIMENTAL
DESIGN METHODOLOGY
A. Herreroa, C. Regueraa, M.C. Ortiza, L.A. Sarabiab
University of Burgos, aDep. of Chemistry, bDep. of Mathematics and Computation,
Fac. Sciences, Pza. Misael Bañuelos s/n, Burgos, 09001, Spain
[email protected] (corresponding author)
Many papers have been published about determination of the herbicide dichlobenil and its
main metabolite 2,6-dichlorobenzamide (BAM) using GC analysis in water [1]. Analysis of
dichlobenil in food commodities have also been reported (in fish, shellfish, cabbage…), but
applications are hardly found where both pesticide and metabolite are simultaneously
determined in complex matrices by GC. For example, Pang et al. [2] determined both
compounds in animal tissues together with many other pesticides by GC−MS, and reported
LOQs for dichlobenil and BAM of 5 and 50 µg kg-1 respectively. Like most transformation
products of pesticides, BAM is more polar and less volatile than dichlobenil, so it m ight
require a previous derivatization step to increase sensitivity. But the derivatization reagent
(trialkiylsilyl) can form unexpected derivatives as silylation artifacts resulting from reactions
with itself, organic solvents, etc. [3] which not always can be avoided. These artifacts lead to
unexpected components and to confusion about the unequivocal identification of the analytes.
Three-way techniques of analysis have been shown to be very useful in determining target
compounds in food commodities [4] by solving problems with co-eluting interferents and
with little shifts in the retention time. In this work, parallel factor analysis 2 (PARAFAC2)
decomposition is used in the simultaneous determination of dichlobenil and BAM in onions
by programmed temperature vaporization (PTV)−GC−MS. Target compound are extracted
from onions with a QuEChERS modified procedure which involves a dispersive solid phase
extraction (dSPE) step. Subsequently, extracts are derivatized with BSTFA
(N,O−bis(trimethylsilyl)trifluoroacetamide) and injected into the chromatographic system.
70
Page 72
Optimization of some experimental parameters is performed using the experimental design
methodology. A central composite design and two D-optimal designs coupled to PARAFAC2
are used to select the best conditions of the derivatization (time, reagent volume and
temperature), extraction (mixing and centrifugation times, rpm…) and PTV injection (inlet
pressure, vent flow and time, PTV conditions, injection speed…) steps. The use of a
PARAFAC2 decomposition allows unequivocal identification according to document
SANCO/12495/2011 (in all cases, relative retention time and at least 3 relative ion
abundances are within the corresponding tolerance intervals). The EU established a maximum
residue level (MRL) of 50 µg kg-1 of dichlobenil in bulb vegetables as onion in Reg. (EC) No
149/2008. This Regulation shall continue to apply to products which were lawfully produced
before 26 April 2013 when it will be amended by Reg. (EU) No 899/2012, which establishes
a new MRL of 20 µg kg-1. The detection limits (CCα) found are below the latter MRL.
Acknowledgements The authors thank the financial support through projects Ministerio de
Economía y Competitividad (CTQ2011-26022) and Junta de Castilla y León (BU108A11-2).
References
[1] Björklund E, Anskjær GG, Hansen M, Styrishave B, Halling-Sørensen B (2011) Analysis
and environmental concentrations of the herbicide dichlobenil and its main metabolite 2,6-
dichlorobenzamide (BAM): A review. Science of the Total Environment, 409, 2343–2356.
[2] Pang GF, Cao YZ, Zhang JJ, Fan ChL, Liu YM, Li XM, Jia GQ, Li ZY, Shi YQ, Wu YP,
Guo TT (2006) Validation study on 660 pe sticide residues in animal tissues by GPC
cleanup/GC–MS and LC–MS/MS. Journal of Chromatography A, 1125, 1–30 .
[3] Little JL (1999) Artifacts in trimethylsilyl derivatization reactions and ways to avoid them.
Journal of Chromatography A, 844, 1–22.
[4] Herrero A, Ortiz MC, Sarabia LA (2013) D-optimal experimental design coupled with
parallel factor analysis 2 de composition a useful tool in the determination of triazines in
oranges by programmed temperature vaporization–GC–MS when using dispersive-solid phase
extraction. Journal of Chromatography A, http://dx.doi.org/10.1016/j.chroma.2013.02.088.
71
Page 73
A WAVELET-BASED MULTIVARIATE IMAGE ANALYSIS
APPROACH TO DETECT DEFECTS IN ORANGES
M. Cocchia, J. M. Prats Montalbanb, M. Li Vignia, A. Ferrerb
aDepartment of Chemical and Geological Sciences, University of Modena and Reggio Emilia,
Via Campi 183, Modena / Italy bMultivariate Statistical Engineering Group, Departamento de Estadística e IO Aplicadas y
Calidad, Universidad Politécnica de Valencia, Valencia /Spain
[email protected]
The use of image analysis represents a fast and non-invasive low-cost methods to be applied
on products and processes, thus presenting a growing appeal for on-line monitoring of food
products, for a fast defects detection. Multivariate Image Analysis has its bases on the
Multivariate Statistical Process Control paradigm: Normal Operating Conditions images are
used to build a reference PCA model, then multivariate control charts are used for fault
detection, with the possibility of locating the faulty pixels in the original image. This is
particularly useful, as in this application, when different kinds of defects are present, and
localization helps in the task of building reference models for each of them. In this
presentation, the following procedures are considered: i) pixels-wise unfolded wavelet
transformed images at different resolution are used to obtain multivariate control charts, thus
maintaining defects localization; ii) a WT decomposition block at a given level which
highlights some defects is used as an input image to which apply traditional MIA.
The basics of the WT-MIA approach are as follows: i) given a wavelet filter, the image is
decomposed to a given level, L, by using the 2D-DWT, applied separately to each color
channels; ii) each decomposition block is reconstructed to the original image domain,
obtaining a reconstructed image for each block and level: a total of 4 (Approximation,
Horizontal, Vertical and Diagonal coefficients) times L (number of decomposition levels)
times N (color channels) images are obtained; iii) MIA is applied to the images, unfolded and
united so that a data matrix of dimensions: pixels × (4×L×N) is obtained; iv) multivariate
control charts for Hotelling-T2 and residual sum of squares on the basis of one or few normal
operating images (NOC) are built and defects are detected in faulty ones. This procedure
72
Page 74
represents a strong reduction of data matrix dimensions when compared to the Bharati and
MacGregor’s approach [1]. In the latter, data dimensionality depends on the number of
neighbouring pixels to be considered, in general: N (channels) × (2w+1)2, where w stands for
the considered window/lag. [2]. Thus, a window of size 2 yields 25 va riables per channel,
which roughly corresponds to a 2D-WT decomposition at level 7 (28 variables per channel), a
case in which a high resolution is achieved.
In the application, a preliminary step is performed to determine the best wavelet family to
characterize the surface expression of an orange disease. To this aim, reference images
representative of each kind of defect were selected to assess the best wavelet filter and
decomposition scheme (DWT or SWT). The WT decomposition (in the example, a haar
wavelet was used) and its PCA analysis gives an insight on which components are more
related to the phenomenon of interest (score images) and which bands and decomposition
images contribute to it (loadings). The extraction of the PCs of interest to obtain T2 or residual
images helps in the detection of the defects and of the area affected by the disease, as shown
for instance in Figure 1, where the T2 image is compared to the original one. The model can
then be used to assess test images to highlight the defective areas.
Figure 1: Original image and T2 image based on the PC’s of interest.
References
[1] M.H. Bharati, J.F. MacGregor: Texture analysis of images using Principal Component
Analysis. SPIE/Photonics Conference on P rocess Imaging for Automatic Control, Boston
(2000) 27-37.
[2] J.M. Prats Montalaban, A. De Juan, A. Ferrer Multivariate Image Analysis: a review with
applications. Chemometrics and Intelligent Laboratory Systems 107 (2011) 1-23.
73
Page 75
MULTISET ANALYSIS OF MULTITECHNIQUE RAMAN
AND IR HYPERSPECTRAL IMAGES
Sara Piquerasa , Romà Taulerb, Anna de Juana.
aChemometrics group. Dept. Analytical Chemistry. Universitat de Barcelona. Diagonal, 645. 08028 Barcelona.
bEnvironmental Chemometrics Group. IDAEA-CSIC. Barcelona.
Hyperspectral imaging is an active area of research that has grown quickly during the
last decade. Hyperspectral imaging techniques based on R aman, infrared and
fluorescence spectroscopy are useful methods in different areas, such as polymer
research, materials science, biomedical diagnostic, pharmaceutical industry, analytical
chemistry, process control and environmental analysis.
Multiset type of analysis has been extensively used in process analysis of different
experiments monitored with the same technique (column-wise augmented matrices) or
of a single experiment monitored with several techniques (row-wise augmented data
matrix) [1]. In the context of hyperspectral images, there already exist examples where
the simultaneous analysis of several images with the same acquisition system is
performed, e.g., 3D multilayer images of multiple processes or in quantitative analysis
In contrast, multiset analysis has been still seldom used for the analysis of multiple
images obtained from the same sample, using different techniques (e.g.
Raman/Infrared). Possible reasons for this are the difficulty to acquire joint data sets on
the same spatial section (translation, /rotation differences among images) and the
differences of spatial resolution (pixel size and definition) among different techniques.
From a data analysis point of view, multivariate resolution techniques are very suited
for the simultaneous analysis of several images. The aim of hyperspectral image
resolution methods is to provide distribution maps and pure spectra related to the image
constituents of a sample from the information originally contained in the measured raw
image. Multivariate Curve Resolution-Alternating Least Squares (MCR-ALS) is an
iterative resolution method oriented to recover the underlying spectroscopic bilinear
model, i.e., concentration profiles (folded back into distribution maps) and pure spectra,
by applying constraints related to chemical or mathematical properties of the profiles to
74
Page 76
be resolved [2,3]. Single image analysis by MCR is often used, but it ma y be easily
extended to the analysis of multiset structures formed by several images [2,4].
As mentioned above, few studies have been reported yet, the joint use of different
spectroscopic imaging techniques to analyze the same sample. To apply this strategy,
identification of preprocessing procedures envisioned at matching image contours and
balancing the different spatial resolution (pixel size) of the coupled techniques are
needed. To explore this multiset problem, images of pharmaceutical mixtures of the
same sample acquired with different imaging systems (Raman and IR), are submitted to
multiset image resolution to enhance the structural description of the image
constituents. In doing this, the complementary spectral information obtained can help to
differentiate more clearly between possible pharmaceutical polymorphs, e.g., with the
Raman information, or to improve the modelling of less crystalline components, e.g.,
with the IR information, both problems more difficult to be solved when an image from
a single acquisition system is used.
References
[1] R. Tauler, Tauler, R.; Maeder, M.; de Juan, A. Multiset data analysis: extended
Multivariate Curve Resolution. Comprehensive Chemometrics (S. Brown, R. Tauler, B.
Walczak, eds.) Elsevier B.V. (2009) 473-506.
[2]A.de Juan, M. Maeder, T. Hancewicz, L. Duponchel, R.Tauler, in: R.Salzer and
H.W.Siesler (Eds.), Chemometric Tools for Image Analysis in Infrared and Raman
Spectroscopic Imaging, Wiley-VCH, 2009,pp. 65-106.
[3] S. Piqueras, L. Duponchel, R. Tauler and A. de Juan. Anal. Chim. Acta, 705 (2011)
182.
[4] S. Piqueras, J. Burger, R. Tauler and A. de Juan. Chemom. Intell. Lab. Sys. 117
(2012) 169.
75
Page 77
HANDLING LARGE DATASETS OF HYPERSPECTRAL
IMAGES
Carlotta Ferrari, Giorgia Foca, Alessandro Ulrici
Dipartimento di Scienze della Vita, Università di Modena e Reggio Emilia, Padiglione Besta,
Via Amendola 2, 42122 Reggio Emilia, Italy
[email protected]
In the context of HyperSpectral Imaging (HSI) techniques, the large file size of each acquired
hyperspectral image represents the main issue in handling datasets composed by a wide
number of samples. The size of each hypercube, which is a three-dimensional array consisting
in more than one hundred of congruent images composed by tens of thousands of pixels, is
generally greater than 50 MB. The compression of the useful information contained in each
hyperspectral image into an optimized set of few parameter values is therefore essential for
analysing datasets formed by a l arge number of images, as well as for enabling on-line
monitoring. In order to solve this problem, a chemometric strategy is proposed to reduce
significantly the dataset size, allowing to analyse at the same time from tens up to hundreds of
hyperspectral images. This procedure is derived from the colourgrams approach, already
developed for the elaboration of RGB images [1-3], and essentially consists in compressing
the useful information contained in each hypercube into a one-dimensional signal, named
hyperspectrogram, which can then be used as a compact set of descriptors for further blind
analysis techniques. More in detail, hyperspectrograms are created by merging in sequence
the frequency distribution curves of the scores, Q residuals and of the Hotelling T2 vectors
obtained from a PCA model calculated separately for each HSI. By adding at the end of the
signal the PC loading vectors, the hyperspectrogram preserves also the most relevant spectral
features of the hypercube data. Since the new hyperspectrogram dataset still conveys all the
variability of the original hypercube dataset, it can be subjected to explorative analysis,
enabling a complete overview of each dataset and allowing to easily identify possible outlier
samples. In addition, this approach can also be applied for the calculation of robust calibration
and classification models based on l arge number of samples. In this context, a further
improvement both of data compression and of calibration/classification performances can be
76
Page 78
obtained by applying a proper variable selection method to the hyperspectrograms dataset. A
visual evaluation of the correctness of the choices made by the feature selection algorithm can
be achieved by representing the selected spatial features back into the original image domain.
Likewise, the interpretation of the chemical information underlying the selected regions of the
hyperspectrograms related to the loadings is enabled by projecting them in the original
spectral domain. Examples of applications of the hyperspectrogram-based approach to face
calibration and defect identification issues using hyperspectral images of food samples
demonstrate the effectiveness of the proposed procedure. Further applications of the
hyperspectrogram approach, which cover the possibility to monitor the instrumental stability
over time as well as to investigate dynamic processes, are also presented.
References
[1] Antonelli A., Cocchi M., Fava P., Foca G., Franchini G.C., Manzini D., Ulrici A. (2004)
Automated evaluation of food colour by means of multivariate image analysis coupled to a
wavelet-based classification algorithm. Analytica Chimica Acta, 515, 3-13.
[2] Foca G., Masino F., Antonelli A., Ulrici A. (2011) Prediction of compositional and
sensory characteristics using RGB digital images and multivariate calibration techniques.
Analytica Chimica Acta, 706, 238-245.
[3] Ulrici A., Foca G., Ielo M.C., Volpelli L.A., Lo Fiego D.P. (2012) Automated
identification and visualization of food defects using RGB imaging: Application to the
detection of red skin defect of raw hams. Innovative Food Science and E merging
Technologies, 16, 417-426.
77
Page 79
MULTIVARIATE DATA ANALYSIS OF A BATCH
POLYMERIZATION REACTION WITH STABILITY
PROBLEMS
E. Mantovania,b, A. Ferrandoa, F. Bonacinia, A. La Piccirellaa, M.Cocchib
aDepartment of Analytical Chemistry, Basic Chemical & Plastics Research Centre,
versalis s.p.a., Via Taliercio 14, Mantua, Italy. bUniversity of Modena and Reggio Emilia Department of Chemical and Geological Sciences,
Via Campi 183, 41125 Modena
e-mail: [email protected]
Batch process is nowadays widely diffuse in various fields such as pharmaceutical, alimentary
and petrochemical industry. In versalis, the eni group chemical company, as an example
batch process is used for production of Expandable Poly Styrene (EPS); EPS is a key material
for building insulation. Styrene monomer conversion occurs in water suspension and critical
stability is maintained by stabilizer (e.g. TCP, PES, PVA). A crucial aspect of EPS production
is the collapse of small styrene particles dispersed in water that must be avoid. The decision to
investigate both process data and water quality data with multivariate data analysis consented
a better understanding of trouble occurred in EPS plant, not clearly explained by traditional
approach. The study began in 2010, first step was collection of historical data, since 2005, and
then starting with real time data, in the following months. The aim of the present case study
was to establish a cause of trouble in a plant apparently in the same condition since ever.
Also water data, collected each day from treatment water plant, was analyzed. The overall
data were analyzed by MVDA, the results obtained pointed a change of the water properties
since 2005 as correlated with batch problems. These results were taken into account to project
new treatment technology for the water feed to the EPS plant.
78
Page 80
Results show the suitability of such a supervised strategy to identify human tumour tissue in,
which can be used as a valuable tool in cancer diagnosis, complementary to traditional
histopathological tissue examination.
References
[1] Pirro V, Eberlin LS, Oliveri P, Cooks RG (2012) Interactive hyperspectral approach for
exploring and interpreting DESI-MS images of cancerous and normal tissue sections. Analyst,
137, 2374-2380.
79
Page 81
SOIL CLASSIFICATION FOR FORENSIC PURPOSE BY
USING SCANNING ELECTRON MICROSCOPY WITH X-
RAY ANALYZER, COLOR ANALYSIS
AND CHEMOMETRIC TOOLS
Isneri Talavera, Isis Madrazo, Noslen Hernández
Advanced Technologies Application Center (CENATAV)
7ma A #21406 e/ 214 y 216, Siboney, Playa, C.P.12200, La Habana, Cuba.
[email protected]
Soil forensic evidence samples are very difficult to process, due to the great number of
general and individual characteristics present at the same time, and the low discriminative
information that the surface layer has, which is the one that is collected in crime scene or in
shoes and other objects belonging to a suspects.
The purpose of this paper is to demonstrate the feasibility and benefits of the Scanning
Electron Microscopy with X-ray Analyzer coupled (SEM-EDS) for the analysis and chemical
characterization of soil samples of one municipality of Havana City, and the construction of
an automatic classification model for soil samples discrimination, in correlation with the
present-day genetic classification existing of this place, in order to predict the origin and soil
type in unknown samples related with a case, using Chemometrics tools for the multivariate
processing of the data.
Data from the SEM-EDS analysis was submitted to an exploratory analysis using Principal
Component Analysis (PCA) and Hierarchical Clusters Analysis (HCA), demonstrating the
feasibility and differentiation of 6 types of soils of the 9 presents, when the color parameter is
introduced. The elements Mg, Si, K, Ca, Ti, Fe and Al were the most significant elements in
the discrimination. From these results a model for the automatic classification for 6 types of
soil samples was constructed using a Support Vector Machines (SVM) classifier. The model
was validated with external samples not present in the training set with 97 % of accuracy.
Another model was built from the data obtained with SEM-EDS, the analysis of color with
the Munsell charts, and the color parameters of the Image Editor of Windows Adobe
80
Page 82
Photoshop 7.0 (R, G, B, C, M, And, K, H, S, B1, L, a, b), achieving a differentiation in 9
types of ground by means of PCA and HCA, with the construction of an automatic
classification model of the 9 classes obtained, having as best classifier the SVM. The model
was validated with external samples with 100 % of accuracy.
81
Page 83
CLASSIFICATION AND PREDICTION METHODS FOR
COMPREHENSIVE GAS CHROMATOGRAPHY MASS
SPECTROMETRY
Matthias Otto, Philipp Rathsack and Conrad Hübler
TU Bergakademie Freiberg, Institute of Analytical Chemistry, Leipziger Str. 29, Freiberg,
09599, Germany
[email protected]
Comprehensive gas chromatography mass spectrometry (GC×GC-MS) enables separation of
hundreds of organic compounds in complex samples. Fig. 1 exemplifies a t ypical dataset
measured on p yrolysis oil from peat visualized by a bubble plot. Each bubble represents a
chemical compound and the bubble diameter is proportional to the area of the peak. In
addition, the electron impact mass spectrum is available for each compound. Although the
chromatogram is structured by distinct areas populated by certain compound classes,
interpretation of the whole 3D-datasets remains a tedious task and needs to be automated by
means of appropriate chemometric methods.
Fig. 1 Comprehensive chromatogram of a pyrolysis oil from peat
82
Page 84
To model the appearance of structurally related compounds in the separation plane polygons
have been proposed [1]. Their use, however, is limited if compound classes overlap as is to be
expected in complexly composed samples. In this work we exploit the similarity of mass
spectra within a given compound class in order to model and classify the individual
compounds. The classification model is based on 69 r eference compounds of different
chemical structures. The peak lists of chromatograms of the reference compounds with their
retention times, peak areas and mass spectra are imported into Matlab. Then, the mass spectra
are transformed into different features, such as, modulo-14 summation [2]. The resulting
matrix is decomposed into principal components and the scores from PCA are modeled on the
compound classes by linear discriminant analysis. Prediction of unknown compounds is
feasible after pretreatment of the peak and mass spectral information in the same way as for
the reference compounds. The likelihood of class assignments is calculated from Bayesian
statistics as the posterior probability [3]. The classification results will be discussed in
dependence on the posterior probability threshold as well as the number and area of peaks that
can be classified in relation to the total number of peaks and their area, respectively.
In order to predict separation areas for new compound classes, quantitative structure property
relationships (QSPR) were developed. The chemical compounds are coded by molecular
descriptors calculated by the software Dragon 6 [4] and regressed on retention times in the
two GC-dimensions. Algorithms for selection of features from the almost 5000 descriptors are
discussed together with the results of predicting the retention behavior of new compound
classes.
References
[1] Marsman JH, Wildschut J, Evers P, de Koning S, Heeres HJ, Marsman J (2008) et al.
Identication and classication of components in ash pyrolysis oil and hydrodeoxygenated oils
by two-dimensional gas chromatography and time-of-flight mass spectrometry. Journal of
Chromatography A, 1188(1), 17-25.
[2] Varmuza K, Filzmoser P. (2009) Introduction to multivariate statistical analysis in
chemometrics, Boca Raton: Taylor & Francis.
[3] Otto, M (2007) Chemometrics – Statistics and Computer Applications in Analytical
Chemistry, 2nd Ed., Weinheim: Wiley-VCH.
[4] Talete srl, DRAGON (Software for Molecular Descriptor Calculation) Version 6.0 - 2012
- http://www.talete.mi.it/
83
Page 85
MOVING TOWARDS CONTINUOUS MANUFACTURING:
SUCCESSFUL REAL -TIME MONITORING AND EARLY
FAULT DETECTION.
Martin Berntsson, Johan Hultman
Umetrics AB, Stortorget 21, 21134 Malmö, Sweden.
E-mail: [email protected]
Multivariate (MV) analysis methods are powerful tools for characterizing process
performance and linking the connection between raw material quality, the manufacturing
environment and the resulting product quality. This presentation discusses the application of
multivariate analysis methods on continuous unit operations with case studies to identify and
resolve production issues in real-time. The multivariate model of the process may be used to
represent a design space for identification of abnormal operation. Optimization methods are
applied to the multivariate models to identify target values for key process variables and mid-
course correction of continuous process in real-time.
The map of the process from initiation to completion can be summarized into a multivariate
signature, or fingerprint. Comparison with this historical fingerprint provides quality
assurance and indicates the state of the process. These MVA models may be executed in real-
time using online monitoring and for identifying the root-cause of problems as they occur in a
continuous process.
Multivariate tools can assist in continuous process monitoring and final quality control by
i) Analyzing Variation
The final product quality depends on process conditions as well as on the variation of initial
conditions such as raw materials due to vendor differences. Multivariate data analysis can
visually summarize these variations and relate them to process and product quality more
effectively than the traditional univariate acceptance criteria in use today.
ii) Identifying and Monitoring of Critical Quality Attributes
For processes of a continuous nature, identification of out-of-control (OOC) operation is
performed at discrete snapshots in time. Even for large volumes of complex data, multivariate
analysis tools can, in real time, identify key quality attributes.
84
Page 86
iii) Real-time Process Monitoring with early Fault Detection
Traditionally you must wait until the end of a quality test to ascertain its quality. The final
product quality (release testing) is determined in the QC lab. If a below spec result is detected,
it is very difficult to discover the root cause and it is too late to correct the problem.
The four actionable takeaways from our presentation will be:
1. Prevent Product Loss:
2. Design & Control Space Monitoring
3.Final QC Prediction
4.Process Control
85
Page 87
TRANSFERRING THE MANUFACTURING OF A
PHARMACEUTICAL NANOPARTICLE PRODUCT BETWEEN
DIFFERENT PLANTS
Pierantonio Faccoa, Emanuele Tombaa, Natascia Meneghettia, Tereza Zelenkováb, Antonello
A. Barresib, Daniele L. Marchisiob, Fabrizio Bezzoa and Massimiliano Baroloa
aCAPE-Lab – Computer-Aided Process Engineering Laboratory, Department of Industrial
Engineering, University of Padova, via Marzolo 9, 35131 Padova (Italy) bMultiphase Systems and Reactors Group, Department of Applied Science and Technology, Institute
of Chemical Engineering, Politecnico di Torino, Corso Duca degli Abruzzi 24, 10129 Torino (Italy)
E-mail: [email protected]
In this work, the problem of transferring a product between different devices is considered for the
manufacturing of pharmaceutical nanoparticles. The problem under investigation is the estimation
of the operating conditions in a target device which ensure a product of assigned properties that has
already been manufactured in a source device of different geometry.
Despite a limited historical database is available for the target device, a large historical database is
available for the source device and can be exploited to support the transfer. One of the major issues
in the transfer is that the difference in device geometries causes a co mpletely different mixing
behavior and performance in the devices. Furthermore, the product transfer problem is complicated
by the fact that the target plant could only be run under a setup that is different from that under
which the available historical dataset had been obtained.
A joint-Y projection to latent structures (JY-PLS) model inversion approach [1] is used to transfer
the nanoparticle product from the source device to the target device. In particular, two specific
problems are studied. In the first one, JY-PLS inversion is used to estimate the conditions in a target
device with the new experimental setup to manufacture nanoparticles with an assigned mean size.
In the second problem, JY-PLS inversion is used to design the experiments in order to obtain
nanoparticles with mean size below an assigned threshold. The experiments confirmed the
effectiveness of the proposed procedure in designing the target device operating conditions in such
a way as to obtain nanoparticles of assigned size range.
86
Page 88
Finally, since the inversion of the JY-PLS model generates an infinite number of solutions that all
lie in the so-called null space [2], experiments are carried out to provide for the first time an
experimental validation of the null space.
References [1] García-Muñoz S, MacGregor JF, Kourti T(2005). Product transfer between sites using Joint-Y
PLS. Chemom. Intell. Lab. Syst., 79, 101-114.
[2] Jaeckle CM, MacGregor JF (1998). Product design through multivariate statistical analysis of
process data. AIChE J., 44, 1105-1118.
87
Page 89
MULTIVARIATE DATA ANALYSIS OF A BATCH
POLYMERIZATION REACTION WITH STABILITY
PROBLEMS
E. Mantovania,b, A. Ferrandoa, F. Bonacinia, A. La Piccirellaa, M.Cocchib
aDepartment of Analytical Chemistry, Basic Chemical & Plastics Research Centre,
versalis s.p.a., Via Taliercio 14, Mantua, Italy. bUniversity of Modena and Reggio Emilia Department of Chemical and Geological Sciences,
Via Campi 183, 41125 Modena
e-mail: [email protected]
Batch process is nowadays widely diffuse in various fields such as pharmaceutical, alimentary
and petrochemical industry. In versalis, the eni group chemical company, as an example
batch process is used for production of Expandable Poly Styrene (EPS); EPS is a key material
for building insulation. Styrene monomer conversion occurs in water suspension and critical
stability is maintained by stabilizer (e.g. TCP, PES, PVA). A crucial aspect of EPS production
is the collapse of small styrene particles dispersed in water that must be avoid. The decision to
investigate both process data and water quality data with multivariate data analysis consented
a better understanding of trouble occurred in EPS plant, not clearly explained by traditional
approach. The study began in 2010, first step was collection of historical data, since 2005, and
then starting with real time data, in the following months. The aim of the present case study
was to establish a cause of trouble in a plant apparently in the same condition since ever.
Also water data, collected each day from treatment water plant, was analyzed. The overall
data were analyzed by MVDA, the results obtained pointed a change of the water properties
since 2005 as correlated with batch problems. These results were taken into account to project
new treatment technology for the water feed to the EPS plant.
88
Page 90
A REVIEW ON THE APPLICATIONS OF PORTABLE NEAR
INFRARED SPECTROMETERS IN THE AGRO-FOOD
INDUSTRY
C. A. Teixeira dos Santos, Ricardo N.M.J. Páscoa, João A. Lopes
REQUIMTE - Faculdade de Farmácia da Universidade do Porto,
Rua de Jorge Viterbo Ferreira nº 228, Porto, 4050-313, Portugal
E-mail ([email protected] )
Industrial purposes created the need for a cost-effective and non-destructive quality control
analysis system [1]. This requirement increased the interest for NIR spectroscopy leading to
the development and marketing of handheld devices, enabling new applications to be
implemented in-situ at an industrial level [2]. Handheld NIR spectrometers are powerful
instruments offering several advantages for non-destructive, on-line or in-situ analysis: small
size; low cost; robustness; ease of analysis; sample user interface; portability and even
ergonomic design. Several studies were made using NIR applications on-site: quality of meat;
types of coffee and its content; octane; quality of olive oil; rice and milk protein and fat
content; sugars and acidity of wine grapes; and soil analysis.
Chemometrics is an essential part of NIR spectroscopy, whose spectra may be complicated by
wavelength dependent scattering effects; instrumental noise; ambient effects and other
sources of variability. As a consequence it is difficult to assign specific absorption bands to
specific functional groups. To achieve useful and meaningful results, multivariate statistical
techniques (involving essentially regression techniques coupled with spectral preprocessing)
are, therefore, required to extract the information hidden in the NIR spectrum. The NIR data
calibration and spectra interpretation depend on chemometric methods, and this dependence
has resulted in the co-evolution of the two fields.
The aim of this work is to review the evolution of portable NIR spectrometers with special
emphasis on the application in the agro-food industry.
89
Page 91
References
[1] K. Norris, J. Hart, Direct spectrophotometric determination of moisture content of grain
and seeds in: A. Wrexler (Editor), International Symposium on H umidity and Moisture in
Liquids and Solids, Reinhold Publishing Corp., New York, USA, (1963), 19-25.
[2] R. Crocombe, MEMS technology moves process spectroscopy into a new dimension,
Spectroscopy Europe 16 (2004) 16-19.
90
Page 92
CAN LAME COWS BE DETECTED WITH AUTOMATIC
MILKING SYSTEM DATA?
Emanuel Garciaa, Ilka Klaasa, José M. Amigob
aUniversity of Copenhagen, HERD - Centre for Herd-oriented Education, Research and
Development, Dept. of Large Animal Sciences, Grønnegaardsvej 2, DK-1870, Frederiksberg
C, Denmark bUniversity of Copenhagen, Department of FOOD, Quality and Technology, Rolighedsvej 30,
DK-1958, Frederiksberg C, Denmark
[email protected] (corresponding author)
Lameness is a major production threat in dairy herds and may be of special interest in herds
with automatic milking systems (AMS) due to decreased attendance to the milking robot.
Undetected and thus untreated lame cows constitute a source of production losses – up to 570
Kg of milk/ cow/ lactation [1] – and can experience poor animal welfare due to chronic pain.
The objective of the present study was to explore multivariate data collected in the AMS
during milking process and build a classification model that could discriminate lame and not
lame cows.
A Danish dairy farm with around 150 milking cows and two DeLaval VMS robotic milking
units participated in the study. Gait scores of all milking cows were done at weekly intervals
during 5 weeks in autumn 2012, inside the free-stall area by encouraging each cow gently to
walk and in a random order. Non-milking and fresh cows (day 0 a nd 1) were excluded.
Lameness was assessed using a 4-point scale adapted from DairyCo® scoring system [2]:
score 1 - even, long and fluid strides (not lame); score 2 - uneven steps but the limbs favoured
were not obvious (not lame); score 3 - one or more favoured limbs obviously detected (lame);
score 4 - very reluctant to put weight on one or more limbs (lame). The variables obtained
from the AMS were summarized week-wise. The mean or sum of 7 days was calculated for
each variable and associated with the respective cow’s lameness score at the end of each
week. The variables included in the model were: average of days in milk, average of milking
duration, average of milking interval, sum of milk yield, average of milk produced per hour,
sum of kicks during milking, average of average flow and of peak flow (both variables on
91
Page 93
quarter level). Neither lactation number nor parity groups were included in the model. The
classification models were developed by using Partial Least Squares-Discriminant Analysis
method, including only the extreme lame scores 1 a nd 4 i n the model in order to identify
which variables could be more meaningful. All data was autoscaled prior analysis. Cross-
validation was done by estimating the class of the available weekly scores of each cow at a
time. The analysis was done by using the PLS-Toolbox v.7.0.2 (Eigenvector Research, WA,
USA) working under MATLAB® v.7.14 (The Mathworks A.S, MA, USA) environment.
A PLS-DA model with 6 Latent Variables was selected which explained 84% of the variation.
The variables associated with lame cows were milking duration, days in milk and milking
interval in the first latent variable, while in the second latent variable were average flow and
peak flow variables but also milking interval and milking duration. Opposite to this, not lame
cows were associated with peak flow and average flow variables, weekly milk yield, milk
produced per hour and number of kicks in the first latent variable; whereas in the second
latent variable only the last three were associated with the not lame class. The sensitivity and
specificity of the calibration model were 0.66 and 0.83, respectively; while the cross-validated
sensitivity and specificity were 0.55 and 0.76, respectively. The cross-validated classification
error was then 0.35.
In conclusion, milking related data seemed to retain information associated with lameness
conditions and could be useful to automatically detect lame animals. A clear future challenge
will be the inclusion of not only more cows and farms but also more information in the
models about each individual cow, such as reproduction, production or activity parameters.
This could help to improve the current results, namely achieving a farmer-friendly (higher)
specificity which can minimize the number of false positives.
References
[1] Green, L. 2009. Lameness in dairy cows: piecing together the evidence base and looking
forward. Proceedings of the cattle lameness conference 2009, University of Bristol, Sutton
Bonington, UK.
[2] Reader, J., Green, M., Kaler, J., Mason, S. and Green, L. 2011. Effect of mobility score on
milk yield and activity in dairy cattle, Journal of Dairy Science 94, 5045-5052.
92
Page 95
P
Poster Communications
Page 96
POSTER INDEX P01
L. Rubio, S. Sanllorente, M.C. Ortiz, L. Sarabia
D-OPTIMAL DESIGN AND PARALLEL FACTOR ANALYSIS: USEFUL TOOLS IN THE
IDENTIFICATION AND DETERMINATION OF PRIMARY AROMATIC AMINES BY
MEANS OF SPME-HS-GC/MS
P02
D. Copelli, A. Bodria, I. Magnani, G. Militerno, M. Ponticelli, F. Usberti, R. Leardi
ACTUATOR PERFORMANCE COMPARISON BY DOE AND PCA
P03
Aurélie Béal, Magalie Claeys-Bruno, Michelle Sergent
APPLICATION OF CURVILINEAR COMPONENT ANALYSIS FOR CLUSTER
VISUALIZATION IN HIGH-DIMENSIONAL EXPERIMENTAL DESIGNS
P04
Walter N. L. dos Santos, Dannuza D. Cavalcante, Paula D. N. Gomes,
Daniele C. M. B Santos, Luciana B. Oliveira, Gerffeson S. Santos
MULTIVARIATE OPTIMIZATION OF HYDRIDE GENERATION FOR DETERMINATION
OF SELENIUM IN EGG SAMPLES BY HG-AFS
P05
Walter N. L. dos Santos, Eduardo Arnoldo X. Rebouças, Gerffeson S. dos Santos,
Paula D. N. M. Gomes, Maria Celeste da S. Sauthier, Daniele C. M. B. dos Santos
FACTORIAL DESIGN AND DOEHLERT MATRIX FOR OPTIMIZATION OF METHOD FOR
DETERMINATION OF AS SPECIES IN CANNED FOODS BY HG AFS
P06
Walter Nei L. dos Santos, Luciana B. Oliveira (PG), Daniele C. M. B. Santos (PQ),
Cléber dos Anjos Santana (PG), Dannuza D. Cavalcante (PG), Marta A. V. S. de Andrade (PQ).
PLANNING OF MIXTURES FOR DETERMINATION OF PESTICIDES IN SEDIMENT
SAMPLES USING HPLC-DAD
95
Page 97
P07
R. Cela, R. Sorribas
QUALITY BY DESIGN APPROACH FOR THE COMPUTER ASSISTED METHODS
DEVELOPMENT IN REVERSED PHASE LIQUID CHROMATOGRAPHY
P08
Tijana Rakić, Biljana Jančić Stojanović, Marko Jovanović
D – OPTIMAL DESIGN FOR SIMULTANEOUS METHOD DEVELOPMENT ON SILICA,
CYANO AND DIOL COLUMN IN HYDROPHILIC INTERACTION LIQUID
CHROMATOGRAPHY
P09
Tijana Rakić, Zorica Stanimirović, Aleksandar Đenić, Miroslav Marić, Marko Jovanović,
Biljana Jančić Stojanović
MODELING OF CHROMATOGRAPHIC RESPONSES BY INTERPOLATION POLYNOMIAL
WITH DIVIDED DIFFERENCES
P10
Geovani C. Brandão, José T. P. Barbosa, Geraldo D. Matos, Sérgio L. C. Ferreira
MULTIVARIATE OPTIMIZATION OF METHOD BASED ON THE CHEMICAL
GENERATION OF NO FOR THE DETERMINATION OF AMMONIUM BY HR-CS MAS
P11
Débora C. dos Santos, Gabriele O. dos Santos, Robson M. de Jesus, Mauricio A. Muñoz,
Leonardo S. G. Teixeira, Cristina Quintella, Sérgio L. C. Ferreira
MULTIVARIATE OPTIMIZATION AND VALIDATION OF AN ANALYTICAL METHOD
FOR DETERMINATION OF MN IN ETHANOL FUEL SAMPLES USING GF AAS
P12
Sergio L.C. Ferreira, Adriana C. Oliveira, Vitor S. dos Santos, Debora C. dos Santos
DETERMINATION OF THE MINERAL COMPOSITION OF CAIGUA (Cyclanthera pedata)
AND EVALUATION USING MULTIVARIATE ANALYSIS
96
Page 98
P13
Mário S. Piantavini, Astrid Wiens, Maria L. A. Pedroso, Cassyano J. Correr,
Lucia Regina Rocha Martins, Roberto Pontarolo
EVIDENCING THE AGGREGATION/ASSOCIATION PROCESSES OF INSULIN BY MEANS
OF MCR-ALS ANALYSIS
P14
M. Soledad Larrechi, I. Martí-Aluja
EVIDENCING THE AGGREGATION/ASSOCIATION PROCESSES OF INSULIN BY MEANS
OF MCR-ALS ANALYSIS
P15
B. Debus, M. Sliwa, C. Ruckebusch, R. Vitale
TEMPTATIVE DECONVOLUTION OF SCATTERING AND ABSORPTION
SPECTROSCOPIC CONTRIBUTIONS USING MCR-ALS
P16
Xin Zhang, Anna de Juan, Romà Tauler
RAMAN MICRO-SPECTROSCOPY IMAGING COMBINES WITH MCR-ALS FOR
CHOCOLATE ANALYSIS
P17
Marta Alier, Romà Tauler
MULTIVARIATE CURVE RESOLUTION OF INCOMPLETE DATA MULTISETS
P18
M.P. Godoy-Caballero, M.J. Culzoni, M.I. Acedo-Valenzuela, T. Galeano-Díaz
DLLME AND MCR-ALS FOR THE RESOLUTION AND DETERMINATION OF PHENOLIC
ACIDS IN VOO BY RRLC-DAD
P19
Flávia de Souza Lins Borba, Ricardo Saldanha Honorato, Ana de Juan
CHEMOMETRIC TOOLS EMPLOYED TO DISTINGUISH RAMAN SPECTRA OF BLUE
BALLPOINT PEN INKS
97
Page 99
P20
Stefania Favilla, Marina Cocchi
SELECTIVITY RATIO (SR) EXTENSION TO N-WAY ARRAY
P21
E. D. Pauli, R. Tauler, I. S. Scarminio
EXPLORATORY ANALYSIS OF SECONDARY METABOLITES EXTRACTED FROM
GREEN TEA USING HPLC-DAD AND CHEMOMETRICS METHODS
P22
M. Farrés, B. Piña, R. Tauler
CHEMOMETRIC EVALUATION OF Saccharomyces cerevisiae METABOLIC PROFILES
USING LC-MS
P23
Pablo Santa Cruz, Alejandro García-Reiriz
APPLICATION OF THIRD ORDER ALGORITHMS TO DETERMINATION OF CARBARYL,
NAPHTOL AND PROPOXUR BY KINETIC SPECTROSCOPIC MEASURES
P24
Alejandro G. García-Reiriz, Alejandro C. Olivieri, Graciela M. Escandar, Elisabeth Teixidó,
Antoni Ginebreda, Romà Tauler
CHEMOMETRIC MODELING OF ORGANIC CONTAMINANT SOURCES IN SURFACE
WATERS OF A MEDITERRANEAN RIVER BASIN (CATALONIA) DISTRICT
P25
L. Rubio, M.C. Ortiz, L. Sarabia
DEVELOPMENT OF A MULTIWAY ANALYTICAL METHOD TO HANDLE THE
QUENCHING EFFECT IN THE DETERMINATION OF CARBAMATE PESTICIDES IN LIME
FLOWER TEA BY MEANS OF EXCITATION-EMISSION MOLECULAR FLUORESCENCE
P26
Maider Vidal, Miren Ostra, Carlos Ubide, Naroa Imaz, Eva García-Lecina
CORROSION EVALUTION OF CHROME ELECTROPLATED SHEETS BY IMAGE
ANALYSIS
98
Page 100
P27
Francisco Silva, Dania Porro, Noslen Hernández, Isneri Talavera
IMAGE PROCESSING METHODS FOR AUTOMATIC IDENTIFICATION OF DRUGS BY
THIN LAYER CHROMATOGRAPHY
P28
L. Bagnasco, E. Sanguineti, M. Zotti, P. Oliveri, S. Lanteri
HYPERSPECTRAL IMAGING COMBINED WITH PRINCIPAL COMPONENT ANALYSIS TO
DETECT EDIBLE MUSHROOMS INFECTED BY MYCOPHILIC FUNGI
P29
S. Morandi, M. Brasca, P. Lavermicocca, C. Ferrari, G. Foca, A. Ulrici, G. Sciutto, S. Prati,
S. Lanteri, P. Oliveri
INVESTIGATING THE POTENTIAL OF SPECTRAL AND HYPERSPECTRAL-IMAGING
TECHNIQUES FOR DETECTING LACTIC ACID BACTERIA AS FOOD CONTAMINANTS
P30
M. Buscema, D. Ballabio, V. Consonni, G. Massini, M. Breda, M. Fabrizi, A. Mauri, R. Todeschini
K-CONTRACTIVE MAP (K-CM) FOR CLASSIFICATION
P31
V. Consonni, D. Ballabio, F. Sahigara, A. Mauri, M. Cassotti, F. Grisoni, and R. Todeschini
A COMPARATIVE STUDY ON DIFFERENT METHODS FOR APPLICABILITY DOMAIN
ASSESSMENT
P32
Francesca Grisoni, Matteo Cassotti, Roberto Todeschini
RESHAPED SEQUENTIAL REPLACEMENT ALGORITHM (RSR) FOR VARIABLE
SELECTION
P33
Sanae Benabou, Anna Sadurní, Ramon Eritja, Raimundo Gargallo
CHEMOMETRICS APPLIED TO THE ANALYTICAL STUDY OF THE CONFORMATIONAL
EQUILIBRIA OF CYTOSINE-RICH DNA SEQUENCES
99
Page 101
P34
Marcus T. Scotti, Marcelo Sobral da Silva, Ivan da R. Pitta, Luciana Scotti
FAST VIRTUAL SCREENING OF ALKALOIDS FROM APOCYNACEAE WITH POTENTIAL
ANTITRYPANOSOMAL ACTIVITY
P35
Saoussen Zeror, Manhel Bennamane Louisa. Aribi- Zouioueche Jacqueline Collin
EVALUATION OF LIGANDS FOR KETONE REDUCTION BY ASYMMETRIC HYDRIDE
TRANSFER IN WATER BY ULTI-SUBSTRATE SCREENING
P36
Dalila Fedaoui,Yacine Bouhadja, Patrick Rosa
CRYSTALLOGRAPHIC ELUCIDATION OF PURELY STRUCTURAL, THERMAL AND
LIGHT-INDUCED SPIN TRANSITIONS IN AN IRON(II) BINUCLEAR COMPLEX
P37
Martin Berntsson, Johan Hultman
IMPROVED VISUALIZATION USING OPLS WITH SENSORY AND QUALITY DATA
P38
Cristina Ruiz-Samblás, Alba Tres, Saskia van Ruth, Antonio González-Casado,
Luis Cuadros-Rodríguez
PLS-DA OF GAS AND LIQUID CHROMATOGRAPHIC FINGERPRINTING FOR
AUTHENTICATION OF PALM OIL
P39
Lucia Bertacchini, Carlo Baschieri, Alex Berni, Marina Cocchi, Caterina Durante, Daniela Fontana,
Claudia Grillenzoni, Mario Li Vigni, Andrea Marchetti, Maurizio Mazzucchelli, Michele Silvestri
and Simona Sighinolfi
HANDLING TRACEABILITY ISSUES IN FOOD: A CHEMOMETRICS APPROACH FOR
ENOLOGICAL PRODUCTS
100
Page 102
P40
Marta Bevilacqua, Stefano Materazzi, Remo Bucci, Federico Marini
FOOD QUALITY CONTROL: APPLICATION OF NEAR INFRARED SPECTROSCOPY FOR
DRIED EGG-PASTA CHARACTERIZATION
P41
E. Pérez-Castaño, M.G. Bagur González, D. Gázquez-Evangelista, M. Sánchez-Viñas
USING THE LC-FINGERPRINT OF STEROLS FRACTION TO DISCRIMINATE OLIVE OIL
FROM OTHERS EDIBLE OILS
P42
Ieda Spacino Scarminio, Fernanda Delaroza, Miroslava Rakocevic, Roy Edward Bruns, Galileu
Bernades Malta, Carlos Alberto Rossi Salamanca Neto
FT-IR-PCA STUDY OF COMPOSITIONAL DIFFERENCES IN EXTRACTS OF SUNNY AND
SHADED ARABIC COFFEE LEAVES PLANTED IN RECTANGULAR AND SQUARE
ARRANGEMENTS
P43
Paolo Conti, Mario Berrettoni, Fabio Bruzzechesse, Mirko Marangoni, Fabio Paparoni,
Demetrio Ruffini, Silvia Zamponi
INVESTIGATION ON THE POSSIBILITY OF CHARACTERIZING THREE
MONOVARIETAL EXTRAVIRGIN OLIVE OIL FROM MARCHE BY SPECTROSCOPIC AND
CHEMOMETRIC METHOD
P44
Nathália Cristina Torres Mariani, Rosangela Câmara da Costa, Kássio Michell Gomes de Lima,
Viviani Nardini, Luís Carlos Cunha Júnior, Gustavo Henrique de Almeida Teixeira
PREDICTING SOLUBLE SOLID CONTENT IN INTACT JABOTICABA [MYRCIARIA
JABOTICABA (VELL.) O. BERG] FRUIT USING NEAR-INFRARED SPECTROSCOPY AND
CHEMOMETRICS
P45
Pierantonio Facco, Matteo Ottavian, Luca Fasolato, Massimiliano Barolo
TOWARD SPECIES-INDEPENDENT FOODSTUFF AUTHENTICATION FROM SPECTRAL
DATA: THE CASE OF FRESH AND FROZEN-THAWED FISH
101
Page 103
P46
Remo Simonetti, Maria Chiara Casolino, Monica Casale, Paolo Oliveri, Lucia Bagnasco,
Luca Medini, Silvia Lanteri
NIR APPLICATION TO UNMASKING ADULTERATION OF TAGGIASCA OLIVES IN
BRINE
P47
Santiago Maspoch, Jordi Coello, Juan Cacho, Vicente Ferreira, M. Jesus Ibarz
PRELIMINARY STUDY OF THE EFFECT OF CLIMATE VARIABLES ON THE
RELATIONSHIP BETWEEN AMINOACIDS IN GRAPE MUST AND AROMAS IN RED WINE
OF THE TEMPRANILLO VARIETY
P48
Jordi Coello, Santiago Maspoch, Juan Cacho, Vicente Ferreira
EFFECT OF CLIMATE CHANGE ON WINE AROMA PRECURSORS COMPOSITION OF Vitis
vinifera L. cv. TEMPRANILLO GRAPES
P49
C. Pizarro, N. Pérez del Notario, I. Arenzana, Laura Hernáiz-López, P. Orio, J.M. González-Sáiz
EFFECT OF MICRO-OXYGENATION AND OAK CHIP TREATMENTS ON SENSORY
PROPERTIES OF RED WINES
P50
Ana M.P. dos Santos, Ivanice F. dos Santos, Uenderson A. Barbosa, Jeane S. Lima,
Geraldo D. Matos
CHARACTERIZATION OF RAW AND COOKED OKRA (Abelmoschus esculentus L.)
ACCORDING TO THEIR MINERAL NUTRIENT COMPOSITION
P51
Mário Sérgio Piantavini, Cleverson Antonio Ferreira Martins, Lucia Regina Rocha Martins,
Roberto Pontarolo
MID-IR REFLECTANCE (DRIFTS) FOR IDENTIFICATION OF PLANTS KNOWN AS
“MALVA” IN BRAZIL
102
Page 104
P52
M. Silvestri, E. Salvatore, A. Elia, C. Durante, A. Marchetti, G. Papotti, D. Bertelli , M. Cocchi
DATA FUSION APPROACH FOR THE VARIETAL CLASSIFICATION OF LAMBRUSCO
P.D.O. WINES
P53
Aysegul Yalcin, Ricard Boqué, Joan Ferré, Monica Casale, Nicoletta Sinelli
LOW AND MID-LEVEL FUSION STRATEGIES FOR THE DISCRIMINATION OF OLIVE
OILS FROM DIFFERENT ORIGINS
P54
Mariana da S. Godinho, Francisco F. Gambarra Neto, Luciano Morais Lião, Marcelo M. de Sena,
Anselmo E. de Oliveira, Romà Tauler
PLS DETERMINATION OF PHYSICOCHEMICAL PARAMETERS IN INSULATING OIL
USING NIR, FLUORESCENCE AND NMR SPECTROSCOPIC FUSED DATA
P55
Federico Marini, Marta Bevilacqua
LOCAL CLASSIFICATION: LOCALLY WEIGHTED – PLS-DA
P56
V. Cárdenas, M. Cordobés, M. Alcalà, M. Blanco
MULTIVARIATE NIR CALIBRATION STRATEGIES USEFUL FOR QUALITY CONTROL
OF PHARMACEUTICAL FORMULATIONS
P57
Natalia Navas, Ana Dominguez-Vidal, Eloisa Manzano, José García-Atero, Luis Fermín Capitán-
Vallvey, María José Ayora-Cañada
COMPARISON OF LIPIDIC PAINT BINDERS AGEING UNDER DIFFERENT CONDITIONS
BY RAMAN SPECTROSCOPY AND CHEMOMETRICS
103
Page 105
P58
Natalia Navas, Pablo Villacorta, Antonio Salmerón-García, David Pelta,
Antonio Lario, José Cabeza-Barrera
AD-HOC MASS CLUSTERING TO STUDY TEMPORAL EVOLUTION OF MALDI-TOF-MS
MAPPEPTIDE FINGERPRINTING OF MONOCLONAL ANTIBODY
P59
Francesco Savorani, Søren B. Engelsen
HIGH-THROUGHPUT DETERMINATION OF CHYLOMICRON TRIGLYCERIDES
CONTENT IN HUMAN BLOOD BY NMR METABOLOMICS
P60
Tamás L. Pap
FOURIER TRANSFORMATION – A PERFORMANCE TOOL FOR THE
CHROMATOGRAPHIC SIGNAL PROCESSING
P61
A.S. Luna, Jéssica S.A.Pinho
DETERMINATION OF PARACETAMOL AND IBUPROFEN IN TABLETS AND URINE
USING SPECTROMETRIC DETERMINATION COUPLED WITH CHEMOMETRICS
P62
A. S. Luna, I. C. A. Lima, R. L. Alves, W. F. Rocha, J. Ferré, R. Martí
SIMULTANEOUS DETERMINATION OF AFLATOXINS B2 AND G2 IN PEANUTS USING
SPECTROFLUORIMETRY AND MULTIVARIATE CALIBRATION.
P63
Werickson F.C. Rocha, Claudia Cipriano Ribeiro, Cristiane Rodrigues Augusto, Andreia de Lima
Fioravante, Valnei Smarçaro da Cunha , Mariana Coutinho Brum
THE USE OF PROFICIENCY TESTING TO DETERMINE REPEATABILITY AND
REPRODUCIBILITY OF NATURAL GAS COMPOSITION BY CHROMATOGRAPHY
104
Page 106
P64
João Aires-de-Sousa, Pedro A. S. Salgueiro, Diogo A. R. S. Latino, Rui P. Fartaria,
Ricardo J. N. B. Silva, Carlos M. F. S. Borges
MACHINE LEARNING CLASSIFICATION OF NEAT AND BURNT IGNITABLE LIQUIDS
FOR ARSON DETECTION
P65
Alessandro Ulrici, Marco Calderisi, Renato Seeber
A WAVELET-BASED PROCEDURE TO DETECT SHARP PEAKS IN LASER
PHOTOACOUSTIC SPECTRA OF GAS MIXTURES
105
Page 107
D-OPTIMAL DESIGN AND PARALLEL FACTOR ANALYSIS:
USEFUL TOOLS IN THE IDENTIFICATION AND
DETERMINATION OF PRIMARY AROMATIC AMINES BY
MEANS OF SPME-HS-GC/MS
L. Rubioa, S. Sanllorentea, M.C. Ortiza, L. Sarabiab
University of Burgos, Faculty of Sciences, Department of Chemistra and Mathematics and
Computationb, Plaza Misael Bañuelos s/n, Burgos, 09001, Spain
e-mail ([email protected] )
Primary Aromatic Amines (PAAs) are widespread chemicals in several industries. They are
used in the manufacture of rubber chemicals, pesticides, dyes, pharmaceuticals and
photographic chemicals. Their major use, however, is in the production of rigid polyurethanes
and polyamide kitchenware. Several PAAs have been classified as ″possibly carcinogenic to
humans″ by the International Agency for Research on Cancer (IARC). Hence, their presence
in foodstuffs should be avoided. According to the present European Legislation, plastic
materials and articles shall not release PAAs in a detectable quantity into food or food
stimulant. This detectable quantity level is 0.01 mg of substance per kg of food or food
simulant. This detection limit applies to the sum of primary aromatic amines released as it is
specified in the COMMISSION REGULATION (EU) No 10/2011 of 14 January 2011 [1] on
plastic materials and articles intended to come into contact with food.
A headspace solid-phase microextraction and gas chromatography coupled with mass
spectrometry (HS-SPME-GC/MS) method for trace determination of primary aromatic
amines was developed. The following analytes were investigated: aniline (A), 4,4’-
methylenedianiline (4,4’-MDA) and 2,4-toluenediamine (2,4-TDA) using 3-chloro-4-
fluoroaniline and 2-amimobiphenyl as internals standards. Prior to extraction the analytes
were derivatized in the aqueous solution by diazotation and subsequent iodination [2]. The
derivatives were extracted by SPME using a PDMS/DVB fiber.
106
Page 108
A D-optimal design was used to study the parameters affecting the HS-SPME process and the
derivatization step. Two experimental factors at two levels and one factor at three levels were
considered: (i) reaction time, (ii) extraction temperature, and (iii) extraction time in the
headspace.. The loadings in the sample mode estimated by a PARAFAC (PARAFAC2)
decomposition for each analyte were the response used in the design because they are
proportional to the amount of analyte extracted.
A calibration based in a PARAFAC decomposition provided the following values of CCα:
1.66, 1.74, and 2.36 µgL-1 for A, 2,4-TDA 4,4’-MDA respectively for a probability of false
positive set at 5%. Also, the accuracy (trueness and precision) of the procedure is assessed.
PARAFAC decomposition made it possible to identify unequivocally (according to the
maximum permitted tolerances for relative ion abundances) and quantify each analyte. This
identification, based on m ass spectra and retention times guaranteed the specificity of the
procedure.
Acknowledgements The authors thank the financial support through projects Ministerio de
Economía y Competitividad (CTQ2011-26022) and Junta de Castilla y León (BU108A11-2).
L. Rubio is particularly grateful to Universidad de Burgos for her FPI grant.
References
[1] COMMISSION REGULATION (EU) No 10/2011 of 14 January 2011
[2] Zimmermann T., Ensinger W.J. and Schmidt T.C. (2004), In situ derivatization/solid-
phase microextraction: Determination of polar aromatic amines, Anal. Chem., 76, 1028-1038.
107
Page 109
ACTUATOR PERFORMANCE COMPARISON
BY DOE AND PCA
D. Copellia, A. Bodriaa, I. Magnania, G. Militernoa, M. Ponticellia, F. Usbertia, R. Leardib
aChiesi Farmaceutici, Largo Belloli 11/A - 43122 - Parma – Italy bDepartment of Pharmacy - University of Genova, Via Brigata Salerno (Ponte),
I-16147 Genova, Italy
E-mail: [email protected]
Goal of the study: The medication contained in a Pressurized Metered Dose Inhaler (pMDI)
is delivered to the patient through an actuator that provides the spray atomization. The
evaluation of the pMDI efficiency in the atomization process is carried out by performance
tests. These tests allow to quantify the amount of the medication reaching the small peripheral
airways of the lungs. Geometrical actuator parameters, such as orifice diameter (OD) and
sump volume (SV), could strongly affect the atomization process. OD is the diameter of the
exit orifice where the atomization takes place while the sump is a small expansion chamber
before OD. The goal of this work was to determine the effect of OD and SV on the different
responses obtained by the performance tests.
Experimental: The variables were set according to the Face Centered Design (FCD)
summarized in Table 1. The nine experiments were carried out
in triplicate, in random order. The chosen performance tests
were the Delivered/Metered Dose tests evaluated by Unit Spray
Collection Apparatus (USCA) at 28.3 L/min and Aerosol
Particle Distribution evaluated by Next Generation Impactor
(NGI) at 60 L/min. Both tests were evaluated by validated
HPLC/UV methods, on a pMDI under development, leading to
15 responses. On the resulting data set (27 rows by 15 columns) a Principal Component
Analysis (PCA) has been performed.
Table 1: FCD matrix
108
Page 110
Discussion and conclusions: The collected NGI responses were: FPM (Fine Particle Mass,
1), that is the amount of particles with aerodynamic diameter ≤5µm, FPF (Fine Particle
Fraction, 2) that is the percentage of FPM on the amount of drug delivered to the patient, the
depositions on the impactor stages such as Actuator (3),
Induction Port (4), Cup 1 to Filter (from 5 t o 12) and
MMAD (13) that represents the calculated mass median
aerodynamic diameter. The USCA responses were
Actuator deposition (14) and Delivered Dose (15).
Figure 1 shows the loading plot. The first two
components explain about 76% of the total variance. It is
possible to highlight a group of responses with high
positive loading on the first component (group A,
namely 1, 2, 7 -12), opposite to response 4 (group C).
This confirms that the greater the Induction Port deposition (response 4) the lower the
responses of group A. Moreover, this shows that the measurement of the deposition at each
single cup is redundant, because all these responses are strictly correlated. The second
component highlights a correlation among
responses 5, 6 and 13 (group B), opposed to
response 3 (group D). Responses 14 and 15
have lower loadings on both components,
this meaning that they give a very poor
contribution to the system description.
Since they are the two responses obtained
by the USCA analysis, this test can be
considered useless to differentiate the
performance of the actuators. In the score
plot shown in Figure 2 the experiments are
coded according to the levels reported in Table 1. It can be seen that the first variable (OD)
has a clear linear effect on the first component, since its increase corresponds to lower scores
on it (and therefore higher values of response 4 and lower values of the responses of group
A). It also has a quadratic effect on the second component, with the experiments with an
intermediate OD having the highest scores, this meaning higher values of responses 5, 6 and
13 and lower values of response 3. The second variable (SV) has no effect on t he first
component, whereas the experiments with larger SV have lower scores on the second
Figure 2: Variable loadings on eigenvectors 1-2 (76% of total variance)
109
Page 111
component, this corresponding to lower values of responses 5, 6 and 13 and larger values of
response 3. In other words, the reduction of SV did not affect significantly the actuators
performances that are, on the contrary, largely affected by the OD size.
110
Page 112
APPLICATION OF CURVILINEAR COMPONENT ANALYSIS FOR
CLUSTER VISUALIZATION IN HIGH-DIMENSIONAL
EXPERIMENTAL DESIGNS
Aurélie Béal, Magalie Claeys-Bruno, Michelle Sergent
Aix Marseille Université, Faculté des Sciences
Laboratoire d’Instrumentation et de Sciences Analytiques, EA 4672, Avenue Escadrille Normandie Niémen, 13397 Marseille Cedex 20, France
Corresponding author: [email protected] ; [email protected]
1. Introduction
In domains such as oil industry, astronomy, optics, etc... experiments are expensive and time
consuming. Therefore, phenomena are often studied using numerical simulations, but the time
of calculation can be very long because the models are increasingly complex, involving a
large number of coefficients. In this case, designs of experiments could be useful to select the
simulations to run but we need specific experimental designs that explore the whole domain
in a reasonable number of simulations. The Space-Filling Designs (SFD) propose a uniform
distribution of the points in the space and are well adapted to numerical simulations. However
it is known that all space-filling designs are not equivalent in terms of quality criteria (as
mindist, coverage ...) which characterize the uniformity of the points distribution. Moreover,
in high dimension, some designs can present clusters or holes which could be penalizing for
the modelling step.
2. Curvilinear Component Analysis
Thus, we need methods in order to visualize data by reducing dimensionality while
keeping the maximum of information. Classically, this reduction could be obtained from a
linear method such as Principal Component Analysis (PCA)[1] but this method doesn’t
consider dependence between variables. Therefore we suggest using a non l inear method
called Curvilinear Component Analysis (CCA)[2, 3] based on t he Kohonen Self-Organizing
Maps (SOM)[4]. This method brings improvements: the output space isn’t a grid fixed a priori
but a continuous space able to take the best adapted shape to the data. The objective is to
reproduce initial space in a low dimensional mapping through a neural network. The theory is
111
Page 113
based on r espect of local topology where short-range output distances are respected, that
allows the detection of two close points and therefore the localisation of clusters.
The principle is to minimize a criterion characterizing topology differences between initial
space and projection space.
where, dij
n (respectively dijp) is Euclidean distance between xi and xj vectors in original space
in n dimensions (respectively p dimensions).
Generally[4], F is chosen as a monotonic positive decreasing function, in order to favor local
topology conservation. The most widely used is:
For example, data are a set of points describing three spirals in the plane (x, z) spaced on the
third axis y. Blue and red spirals are respectively on y = 0 and y = 0.2 planes whereas black
spiral is on y = 1.
X
Z
Y
1
1
1
0.25
2
5
5
0
5
1.5 2 2.5 3 3.5 4-2.5
-2
-1.5
-1
-0.5
0
0.5
1
CCA
By using CCA, the closest spirals are mixed whereas the farthest spiral is isolated. By this
example, we show that CCA allows the unfolding of this set of points by remaining low
distances, and therefore close points.
3. Study case: comparison of Space Filling Designs in 20 dimensional space
A new criterion calculated from results obtained after CCA allows the comparison of
high-dimensional experimental designs quality, in terms of uniform distribution. An example
in 20 dimensions will be presented and several designs as random distribution, WSP design
and low discrepancy sequences as Sobol’ and Faure will be studied by detecting and locating
the clusters.
112
Page 114
4. References
[1] Benzecri J.P. (1973), L'analyse de données, Tome 1 et 2 Paris : Dunod Edition [2] Demartines P. (1992), Analyse de données par réseaux de neurones auto-organisés, PhD thesis, Institut National Polytechnique de Grenoble. [3] Demartines P., Hérault J. (1997), Curvilinear component analysis: a self-organizing neural network for nonlinear mapping of data sets, IEEE Transactions on Neural Networks, 8, 148-154. [4] Kohonen T. (1990), The Self-Organizing Map, Proceedings of IEEE, 78, 1464-1480.
113
Page 115
MULTIVARIATE OPTIMIZATION OF HYDRIDE
GENERATION FOR DETERMINATION OF SELENIUM IN
EGG SAMPLES BY HG-AFS
Walter N. L. dos Santos a,b*, Dannuza D. Cavalcante a,b, Paula D. N. Gomesa, Daniele C.
M. B Santosa , Luciana B. Oliveira a,b, Gerffeson S. Santosa
aUniversidade do Estado da Bahia, Departamento de Ciências Exatas e da Terra, 41195-011,
Salvador - BA, Brazil bUniversidade Federal da Bahia, Instituto de Química, 40170-290, Salvador - BA, Brazil E-
mail ([email protected] )
In the optimization of an analytical procedure, there is a n eed to adjust the variables in
establishing the best conditions to perform the analyzes. [1]. The experimental design is an
important statistical tool, and because of its simplicity, is being increasingly used by
analytical chemists for different samples and purposes that may confer or not the hypotheses
of the research [2]. The response surface methodology (RSM) is an optimization technique for
complete procedure, which is a multivariate technique that fits, mathematically, the
experimental domain studied in the theoretical design by use of a response function. In the
most current research, there are several second-order designs that can be employed for this
purpose, such as the Central Composite Design (CCD), Box–Behnken Design (BBD) or
Doehlert matrix [2]. They have been used to determine the real function established among
analytical response and the factors chosen for experimental evaluation.
In this paper, the factorial and Doehlert designs were applied to optimise the process pre-
reduction and hydride generation to determine overall selenium in in samples of eggs by HG-
AFS. The factorial and Doehlert designs were applied to optimise the process variables, pre-
reduction time, pre-reducing volume, concentration of hydrochloric acid and concentration of
sodium tetrahydroborate (Figure 1 and 2).
Using this method, was determined that the optimal experimental conditions were: 20 m in.
pre-reduction time, 1 m L de pre-reducing, 5.3 mol L-1 hidrochloric acid and 2.6 % (w v-1)
sodium tetrahydroborate. The samples were decomposed using a system acid digestion with
block digestor and cold finger.
114
Page 116
For pre-reduction of Se (VI) to Se (IV), were added to 3.0 ml sample, 3.0 ml of 5.3 mol L-1
hydrochloric acid, 1.0 mL pre-reducing 10% (w v-1) potassium bromide and 20 m in pre-
reduction.
The accuracy of the proposed methodology was verified by analyzing a certified reference
material (NIST 1566b), testing the addition of analyte and recovery range was 96 to 109%
and comparing the data obtained by ICP-MS analysis. The values are agreement at 95%
confident level. The LOD and LOQ values obtained were 0.2 and 0.7 ng L-1, respectively, and
relative standard deviations were in general lower than 4.7%. The proposed method was
applied to samples of chicken eggs, red and white, quail and duck. The results were from 0.35
± 0.01 to 0.88 ± 0.03 µg g-1. The selenium content was higher in the yolks of eggs in most
samples analyzed.
Figure 1: Pareto chart
-0,009
0,11
0,16
- 0,24
0,40
0,84
1,03
1,16
- 1,12
3,01
p = 0,05
estimated effects
(4) KBr
1by4
(1) TR
(3) [NaBH4]
3by4
1by3
1by2
(2) [HCl]
2by4
2by3
Figure 2: Response surface
References
[1] Montgomery DC (1996) Design and analysis of experiments 4th ed. New York: Willey.
115
Page 117
[2] Tarley CRT, Silveira G, dos Santos WNL, Matos GD, da Silva EGP. Bezerra MA. Miró
M, Ferreira SLC (2009), Chemometric tools in electroanalytical chemistry: Methods for
optimization based on f actorial design and response surface methodology, Microchem.
Journal, 92, 58–67.
116
Page 118
FACTORIAL DESIGN AND DOEHLERT MATRIX FOR
OPTIMIZATION OF METHOD FOR DETERMINATION OF
AS SPECIES IN CANNED FOODS BY HG AFS
Walter N. L. dos Santosa,b*, Eduardo Arnoldo X. Rebouçasa, Gerffeson S. dos Santosa,
Paula D. N. M. Gomesa, Maria Celeste da S. Sauthierb, Daniele C. M. B. dos Santosa
aUniversidade do Estado da Bahia, Departamento de Ciências Exatas, 41195-001, Salvador,
Bahia, Brasil. bUniversidade Federal da Bahia, Instituto de Química, 40170-280, Salvador – Bahia – Brasil.
E-mail: [email protected]
The arsenic is considered toxic because it has no essential and beneficial characteristics for
humans, produces disastrous effects even in trace amounts. This work is based on t he
determination of arsenic by atomic fluorescence spectrometry with hydride generation (HG
AFS) in canned foods (corn and olives). The samples of corn and olives were ground in a
knife mill. Then the corn samples were sieved at 500 m esh and olive taken directly for
digestion. The procedure for acid decomposition, block digester consists in weighing 0.2 g of
the sample followed by addition of 2.0 mL of concentrated HNO3, 1.5 ml of H2O2 30% v.v-1
and 1.0 mL of HCl 6.0 mol L-1. The mixture was heated at 120 °C for 3 hours. The conditions
for the pre-reduction of As (V) to As (III) and formation of arsine were optimized using full
factorial design at two levels (24). The variables and their respective optimum levels were:
pre-reduction time (10-30 min) HCl concentration (2 - 4 mol L-1), concentration of sodium
borohydride (1 to 3% w v-1) and volume of the pre-reducing potassium iodide (0.5 to 1.5 mL).
By analyzing the Pareto chart generated by factorial design, we found that two variables were
significant: concentration of HCl and sodium borohydride. For the significant variables
applied design Doehlert and response surface methodology in order to obtain optimum values.
In accordance with the generated surface, the optimal values were obtained: [HCl] = 4.7 mol
L -1 and [NaBH4] = 3 % w v-1. The statistically significant effects of the variables were
studied, and interactions among them were evaluated by applying analysis of variance
117
Page 119
(ANOVA) using Statistica 7.0 software. All experiments were performed in a random
sequence. The Table 1 below shows the concentration of arsenic (ng mL-1) in some samples.
Table 1. Concentration of total arsenic and arsenic (III), in ng mL-1.
Packing Samples Total As As (III) Olives - Direct Analysis of Net Conserva
glass AVRV 14.08 ± 0.27 13.44 ± 0.12 plastic AVDS 7.44 ± 0.18 6.82 ± 0.03
Olives - Digestion of Food glass AVRV 0.14 ± 0.01 0.03 ± 0.01
plastic ALVS 0.17 ± 0.01 0.10 ± 0.01 Corn - Digestion of Food
tin MGVL 0.15 ± 0.03 0.07 ± 0.04 tetra pak box MQUC < LOQ < LOQ
glass MQUV < LOQ < LOQ
Multivariate optimisation was shown to be an appropriate tool for the optimisation for
procedure of pre-reduction and hydride generation; thus it is a suitable method for the
determination of arsenic in samples of corn and olives.
References
Barros Neto, Benício de. Spacino Scarminio, Ieda. Edward Bruns, Roy - Como fazer experimentos – 4. Ed – Porto Alegre: Bookman, 2010. Acknowledgements: PRONEX, FAPESB, CNPq, CAPES.
118
Page 120
PLANNING OF MIXTURES FOR DETERMINATION OF
PESTICIDES IN SEDIMENT SAMPLES USING HPLC-DAD
Walter Nei L. dos Santosa,b, Luciana B. Oliveira b (PG), Daniele C. M. B. Santos a(PQ),
Cléber dos Anjos Santana a(PG), Dannuza D. Cavalcante b(PG),
Marta A. V. S. de Andrade a(PQ).
aUniversidade do Estado da Bahia, Departamento de Ciências Exatas, 41195-001, Salvador,
Bahia, Brasil. bUniversidade Federal da Bahia, Instituto de Química, 40170-280, Salvador – Bahia – Brasil.
E-mail: [email protected]
The pesticides include a wide variety of chemicals with different functional groups, modes of
action, biotransformation and elimination. Due to intensive and sometimes inappropriate,
these pesticides have become very persistent pollutants and contaminants in environmental
compartments such as water, air and soil. In the rural area of the Todos os Santos Bay, Bahia,
are developed agricultural activities near rivers that bathe this region, where applications are
made of various pesticides. Therefore, this paper proposes the use of planning of mixture for
three components in the development of analytical procedure for determination of pesticides
carbendazim, carbaryl, carbofuran and carbosulfan in sediment samples from rivers Jaguaripe,
Mataripe, Paraguaçu and Subaé, of the Todos os Santos Bay, using HPLC-DAD. A planning
mixtures of three components (Figure 1) was used to optimize the proportions of the
extraction phase of the sediments of suspensions of pesticides in order to determine by
HPLA-DAD. The optimized conditions were: sample weight 0.5 g; extraction mixture
consisting of methyl alcohol PA (methanol) and hydrochloric acid 0.1 mol L-1 (1:1);
sonication time of 20 minutes, and time and speed centrifugation 10 minutes and 4000 rpm,
respectively. The method was applied to samples of sediments of the Todos os Santos Bay
and the results are shown in Table 1.
119
Page 121
Figure 1. Composition of mixtures.
Table 1 - Concentration of pesticides (ppm) determined in sediment samples from Todos os
Santos Bay, HPLC-DAD.
Sediment (river) Analytes
(ppm) Jaguaripe Mataripe Paraguaçu Subaé
Carbaryl 26,76±1,35 27,28±1,85 27,99±0,85 24,73±1,03 Carbendazim 31,01±3,18 21,88±1,61 25,96±3,21 29,50±1,33 Carbofuran ND ND ND ND Carbosulfan ND ND ND ND
The use of planning of mixtures allowed to select the best extractor in the optimization of an
analytical procedure for the determination of pesticides in sediment samples from Todos os
Santos Bay.
References
Chanbasha B.; Anass A. A.; B.S. Madhava R.; Hian K. L. Journal of Chromatography A, 1216 (2009) 211–216. Barros Neto, Benício de. Spacino Scarminio, Ieda. Edward Bruns, Roy - Como fazer experimentos – 4. Ed – Porto Alegre: Bookman, 2010.
120
Page 122
QUALITY BY DESIGN APPROACH FOR THE COMPUTER
ASSISTED METHODS DEVELOPMENT IN REVERSED
PHASE LIQUID CHROMATOGRAPHY
R. Cela, R. Sorribas
University of Santiago de Compostela, Research institute of Food Analysis, Campus Vida,
15782, Santiago de Compostela, Spain
E-mail ([email protected] )
Computer assisted methods development in liquid chromatography has been evolving along
the last four decades to a mature state by providing chromatographers with computer tools
helping the development of better separation procedures both in terms of resolution and
runtime. The basic mechanism in all these tools is to have a mathematical model of the
retention for peaks and the use this model to predict (simulate) chromatograms under a variety
of conditions. These chromatograms can be judged in terms of separation quality either by the
chromatographer or by any appropriate algorithm thus enabling the selection of optimal
conditions for the given separation.
The computer-aided optimized chromatogram should of course be tested experimentally to
verify that separation effectively performs as expected and to demonstrate that separation
expectancies are really fulfilled. Now the validation of the separation procedure start and the
robustness of the procedure is a critical piece of that validation procedure. More recently, the
idea of using the concepts of quality by design (QbD) in the development of chromatographic
separations have gained importance and actually is accepted in the pharmaceutical and other
industries subject to strict performance and operation rules.
Here a computer-assisted methods development tool for reversed-phase liquid
chromatography based on QbD principles will be shown with applications to separations
developed at high temperatures, transfer processes of developed procedures between
chromatographic systems and design space determination.
121
Page 123
D – OPTIMAL DESIGN FOR SIMULTANEOUS METHOD
DEVELOPMENT ON SILICA, CYANO AND DIOL COLUMN
IN HYDROPHILIC INTERACTION LIQUID
CHROMATOGRAPHY
Tijana Rakić, Biljana Jančić Stojanović, Marko Jovanović
University or Belgrade, Faculty of Pharmacy, Department of Drug Analysis, Vojvode Stepe
450, Belgrade, Serbia
[email protected]
The retention behaviour of substances in hydrophilic interaction liquid chromatography
(HILIC) is extremely complex and poorly studied since it includes various mechanisms such
as partition, adsorption and ion exchange depending on the analytes, choice of stationary and
mobile phase. The aim of this study was simultaneous development of methods for the
analysis of the model mixture of six antidepressants on three different columns by changing
the percentage of acetonitrile in the mobile phase, pH of the water phase and the buffer type
(formic and acetate). The experimental plan created by D – optimal design included the
examination of the influence of the chosen factors through 12 experiments and 3 replications.
Using the experimental design methodology, the chromatographic behaviour of the analysed
mixture was presented with second order polynomials describing its dependence on t he
percentage of acetonitrile and pH value for all three columns and each of the buffers.
Complexed criteria of separation which simultaneously estimates all of the selectivity factors
between adjacent peaks, as well as the overall time of the analysis were followed as the
system responses. The model was optimized graphically. The adequate separation was shown
to be impossible on c yano column, while optimal conditions were established on s ilica and
diol columns, which was proven by the experimantal verification. D – optimal design enabled
the resolution of the defined chromatographic problem through only 12 experiments which
represents a huge improvement compared to the full factorial design where 54 experiments
were necessary. It has been shown that D – optimal design provides reliable development of
the complexed chromatography methods in a very efficient way.
122
Page 124
References
De Aguiar PF, Bourguignon B, Khots MS, Massart DL, Phan-Than-Luu R (1995) D-optimal
designs. Chemometrics and Intelligent Laboratory Systems, 30. 199–210.
Leardi R (2009) Experimental design in chemistry: A tutorial. Analytica Chimica Acta, 652,
161–172.
123
Page 125
MODELING OF CHROMATOGRAPHIC RESPONSES BY
INTERPOLATION POLYNOMIAL WITH DIVIDED
DIFFERENCES
Tijana Rakića, Zorica Stanimirovićb, Aleksandar Đenićc, Miroslav Marićc,
Marko Jovanovića, Biljana Jančić Stojanovića aUniversity or Belgrade, Faculty of Pharmacy, Department of Drug Analysis, Vojvode Stepe
450, Belgrade, Serbia bUniversity of Belgrade – Faculty of Mathematics, Department for Numerical Mathematics
and Optimization, Studentski trg 16/IV, 11 000 Belgrade, Serbia cUniversity of Belgrade – Faculty of Mathematics, Department for Computer Science and
Informatics, Studentski trg 16/IV, 11 000 Belgrade, Serbia
[email protected]
A novel approach to mathematical modeling of chromatographic responses based on
interpolation polynomial with divided differences for a function of multiple variables is
presented. The proposed technique significantly decreases the modeling error especially when
indirect modeling of complex chromatographic responses is performed. It allows accurate
description of factors-responses relation in situations where commonly used linear or
quadratic models are not applicable: when the nature of dependence is more complex or the
investigated factors intervals are broad. The novel technique is incorporated in Design of
Experiments methodology for systematical development and optimization of hydrophilic
interaction liquid chromatographic method for the analysis of model mixture of five
antidepressants. The retention factors of investigated substances are modeled directly by
interpolation polynomial with divided differences and the obtained correlation coefficients
were equal 1.00 in all cases. Further on, the overall quality of chromatograms was estimated
by calculation of composite objective function which enables simultaneous estimation of
separation quality and total analysis duration. Finally, grid point search was applied for the
optimum location. High agreement between theoretically and experimentally obtained
chromatograms in the identified optimal point is proven. The advantages of novel modeling
technique are highlighted comparing to the results obtained by traditionally applied modeling
124
Page 126
by quadratic function and least squares method. This technique provided lower coefficients of
correlation for individual retention factors modeling so the errors of these individual models
accumulated in objective function and located extremely suboptimal results. It is shown that
interpolation polynomial with divided differences can be significant alternative in the
modeling of chromatographic responses.
References
Rao GS (2006) Numerical Analysis (3rd edn), New Age International (P) Ltd., Publishers,
116–125.
Jančić–Stojanović B, Rakić T, Kostić N, Vemić A, Malenović A, Ivanović D, Medenica M
(2011) Advancement in optimization tactic achieved by newly developed chromatographic
response function: application to LC separation of raloxifene and its impurities. Talanta; 85,
1453–1460.
Rakić T, Jančić–Stojanović B, Malenović A, Ivanović D, Medenica M (2012) Improved
chromatographic response function in HILIC analysis: application to mixture of
antidepressants. Talanta, 98, 54–61
125
Page 127
MULTIVARIATE OPTIMIZATION OF METHOD BASED ON
THE CHEMICAL GENERATION OF NO FOR THE
DETERMINATION OF AMMONIUM BY HR-CS MAS
Geovani C. Brandão, José T. P. Barbosa, Geraldo D. Matos, Sérgio L. C. Ferreira
Universidade Federal da Bahia, Instituto de Química, Salvador, Bahia, 40170-115 Brazil
[email protected]
In this work was developed a new method based on the chemical generation of NO for the
determination of ammonium by high-resolution source continuum molecular absorption
spectrometry (HR-CS MAS). Initially, ammonium ion is oxidized to nitrite by hypochorite in
basic media in the presence of bromide as catalyst. Afterwards, the nitrite formed is reduced
to nitric oxide (NO) by ascorbic acid in acidic media. The NO gas generated is then
transported by a stream of argon carrier gas to a quartz cell positioned in the light path of the
instrument. The measurement of molecular absorption of NO was performed at 214.803 nm.
Two-level full factorial design was applied for evaluates the factors involved in the oxidation
reaction of ammonium to nitrite: concentration of NaClO, concentration of NaOH and
concentration of KBr. The curvature effect was significant in the experimental domain
studied. This way, the conditions of the central point were established for the reaction: 0.0015
mol L-1 NaClO, 0.02 m ol L-1 NaOH and 0.06% (m/v) KBr. A second two-level factorial
design was applied for evaluates the factors involved in the chemical generation of NO:
concentration of ascorbic acid, concentration of HCl and volume of reducing solution. Only
the volume of reducing solution was significant for this process in the experimental domain
studied being then further studied by univariate methodology. The experimental conditions
established were: 1.5% (m/v) ascorbic acid, 1.0 mol L-1 HCl and 3.0 mL of reducing solution.
References
Brandao GC, Lima DC, Ferreira SLC (2012) The chemical generation of NO for the
determination of nitrite by high-resolution continuum source molecular absorption
spectrometry. Talanta, 98, 231-235.
126
Page 128
MULTIVARIATE OPTIMIZATION AND VALIDATION OF
AN ANALYTICAL METHOD FOR DETERMINATION OF MN
IN ETHANOL FUEL SAMPLES USING GF AAS Débora C. dos Santos, Gabriele O. dos Santos, Robson M. de Jesus, Mauricio A. Muñoz,
Leonardo S. G. Teixeira, Cristina Quintella, Sérgio L. C. Ferreira
Universidade Federal da Bahia, Instituto de Química, Núcleo de Excelência em Química
Analítica da Bahia, Campus Universitário de Ondina, 40170-115 Salvador-BA-Brasil
E-mail ([email protected] )
The determination of metallic species in ethanol fuel is one of the parameters to assess the
quality of automotive fuels. The fuel contamination with metals can occur in the
manufacturing process itself as well as in transport and storage tanks [1]. The presence of
these species can affect the quality of fuel, besides causing environmental impact with the
vehicle emissions [2]. This work aimed to employ multivariate optimization in association
with graphite furnace atomic absorption spectrometry (GF AAS) for direct determination of
Mn in ethanol fuel samples. The effects of the following variables were studied
simultaneously through a full two-level factorial design 23: atomization temperature, pyrolysis
temperature and pyrolysis time. The factors studied and their respective value ranges are
shown in Table 1. The minimum and maximum values for each of the investigated factors
were chosen in accordance with previously reported data or experiments. All of these
experiments were performed in a random order.
The matrix of the factorial design and the responses of the analytical signal (integrated
absorbance peak area for Mn) are shown in Table 1.
Table 1: Matrix of the full two-level factorial design 23.
Experiment Pyrolysis Temperature
(ºC)
Pyrolysis time ( s)
Atomization Temperature
(oC)
Integrated absorbance
(s) 1 -1 (800) -1 (10) -1 (1800) 0.00951
2 1 (1400) -1 (10) -1 (1800) 0.00847
3 -1 (800) 1 (30) -1 (1800) 0.00656
4 1 (1400) 1 (30) -1 (1800) 0.00884
5 -1 (800) -1 (10) 1 (2400) 0.10450
6 1 (1400) -1 (10) 1 (2400) 0.12210
7 -1 (800) 1 (30) 1 (2400) 0.11000
8 1 (1400) 1 (30) 1 (2400) 0.10570
9 0 (1100) 0 (20) 0 (2100) 0.10030
10 0 (1100) 0 (20) 0 (2100) 0.11670
11 0 (1100) 0 (20) 0 (2100) 0.12090
127
Page 129
Data are consistent with results obtained by conventional method (univariate) using 5 mg of
modifier (Pd + Mg) and 30 s of pyrolysis time .
The significance of each parameter was evaluated by analysis of variance (ANOVA) using P-
value significance levels. The results were used to generate the Pareto charts of interactions
and effects (Fig. 1). Figure 1 demonstrates that only the temperature of atomization was
significant for Mn determination in ethanol fuel. An increase in the values of the temperature
of atomization from the lowest (-1) to the highest (+1) level leads to an increase in the
analytical signal. This result indicates that the temperature of atomization has a positive effect
on the analytical signal; the signal increases with an increase in the temperature of
atomization.
Figure 1. Pareto chart for the two-level factorial design
The proposed method was applied to Mn determination in hydrated ethanol fuel samples
collected from different gas stations in Salvador, Brazil. The results indicated that the
technique of factorial design describes adequately the relationships between the variables
involved and the answers, being efficient in optimizing the GF AAS method.
References
[1] Teixeira LSG, Santos ES, Nunes LS (2012) Determination of copper, iron, nickel and zinc
in ethanol fuel by energy dispersive X-ray fluorescence after pre-concentration on
chromatography paper, Analytica Chimica Acta, 722, 29– 33.
[2] Brandão GP, Campos RC, Castro EVR, Jesus HC (2008) Determination of manganese in
diesel, gasoline and naphtha by graphite furnace atomic absorption spectrometry using
128
Page 130
microemulsion medium for sample stabilization, Spectrochimica Acta Part B: Atomic
Spectroscopy, 63, 880–884.
129
Page 131
DETERMINATION OF THE MINERAL COMPOSITION OF
CAIGUA (Cyclanthera pedata) AND EVALUATION USING
MULTIVARIATE ANALYSIS
Sergio L.C. Ferreira, Adriana C. Oliveira, Vitor S. dos Santos, Debora C. dos Santos
Universidade Federal da Bahia, Instituto de Química, Grupo de Pesquisa em Química e
Quimiometria, Campus de Ondina, Salvador, 40170-290, Brasil
E-mail ([email protected] )
Caigua (in Brazil “maxixe do reino”) is a fruit that is generally consumed either cooked or
even raw as salad. This fruit has been used as a food and also in folk medicine. In this work,
the mineral composition of Caigua was determined for the first time. Twenty-nine samples
from five farms located in the southwestern region of Bahia, Brazil were acquired and
analyzed using inductively coupled plasma optical emission spectrometry. The elements
determined in this fruit included calcium, magnesium, sodium, potassium, phosphorus,
manganese, iron, zinc, copper and vanadium. Principal component analysis (PCA) and
hierarchical cluster analysis (HCA) were applied to evaluate the obtained results. The
dominant variables for the first principal component (PC1) are phosphorus and the
micronutrients copper, iron, sodium, zinc and manganese because these variables represent
46.13% of the total variance. All these six elements contribute to the major variability shown
in the samples, and they are positively correlated. The second principal component (PC2)
accounts for 21% of the total variance, with calcium and magnesium as the dominant
variables. The HCA results correlate well with other results from PCA.
The average concentrations of the determined elements (expressed as mg kg-1) were as
follows: 9.09 for sodium, 1519 for potassium, 194 for phosphorus, 119 for calcium, 84 for
magnesium, 0.74 f or manganese, 2.11 for iron, 0.13 for copper, 1.27 for zinc and 0.15 f or
vanadium.
.
130
Page 132
VALIDATION OF A QUALITY OF LIFE QUESTIONNAIRE
FOR CHRONIC HEPATITIS B
Mário S. Piantavinia, Astrid Wiensa, Maria L. A. Pedroso b, Cassyano J. Correra,
Lucia Regina Rocha Martinsc, Roberto Pontaroloa
aUniversidade Federal do Paraná, Departamento de Farmácia, Av. Pref. Lothário Meissner,
632, 80210-170. Curitiba, PR, Brazil bAmbulatório de Hepatologia do Hospital de Clínicas da Universidade Federal do Paraná.
cUniversidade Tecnológica Federal do Paraná, Departamento de Química e Biologia, Rua
Deputado Heitor de Alencar Furtado, 4900, 81280-340. Curitiba, PR, Brazil
[email protected]
Nowadays, about two billion people have been infected by hepatitis B virus (HBV) and about
350 million remain infected. Annually more than 500.000 people die due to diseases related to
HBV infection. Individuals with Chronic Hepatitis B (CHB) are at increased risk of
developing liver cirrhosis and hepatocellular carcinoma (fifth most common cancer
worldwide, killing approximately 400.000 people per year), significantly affecting the quality
of life of patients with the disease. CHB is a chronic debilitating condition that can lead to
progressive impairment of physical and mental health as the disease progresses.
The World Health Organization (WHO) states that ‘health is a state of complete physical,
mental and social well-being’ (subjective perception of an individual’s state of living, which
has a similar concept as quality of life). In the context of health services, the focus is on health
related quality of life (HRQOL) in an attempt to quantify the net consequence of a disease and
its treatment on the patient’s perception of his/her ability to live a useful and fulfilling life.
HRQOL can provide additional information on the effectiveness, quality of care and should
be considered an important outcome measure for assessing the impact of CHB and the
effectiveness of treatment.
The goal of healthcare is to maintain, restore and improve health of patients and, in particular,
to evaluate health related quality of life in CHB patients the Hepatitis B Quality of Life
Instrument, version 1.0 (HBQOL v1.0) can be used. Furthermore, the effect of an intervention
on HBQOL has become a very important topic for both consumers and providers of health
131
Page 133
services. Understanding the impact of illness on quality of life can make health care more
responsive to patients’ needs.
The identification and definition of symptom clusters in patients with cancer or chronic
disease has the potential to impact on their treatment and pharmacotherapy. Although it is a
very effective tool in assessing the overall quality of life in patients with various diseases,
there is the need of additional statistical mechanisms to assess evaluate the different aspects of
HBQOL and not only a single summary score for each patient.
Thus, techniques such as multivariate statistics are necessary in order to identify the most
important parameters in the evaluation; in other words, in this case which are the more
relevant questions to define and separate the individuals with high or low quality of life.
So, the role of the pharmacist researcher may be more effective as it is possible to make a
more direct intervention on e ach patient in order to have a more effective response in
maintaining a good quality of life, or to improve more rapidly those who are in the low
quality of life group.
The aim of this study was to validate and culturally adapt the HBQOL, version 1.0 in Chronic
Hepatitis B patients. Furthermore, using multivariate exploratory data analytical methods, e.g.
Principal Component Analysis, it could be possible to extract additional information about
what are the most important needs among patients with similarly defined clinical severity to
prioritize them – information that cannot be easily found by traditional clinical outcomes.
The study protocol, conformed to the ethical guidelines, was approved by UFPR - Human
Research Ethics Committees. Patients with Chronic Hepatitis B were recruited from Clinical
Hospital – UFPR, informed about the study by a researcher and invited to participate. Those
who consented were visited at hospital by an interviewer.
Data were analyzed with the Statistical Package for Social Sciences (SPSS 17.0) software and
MATLAB software, version 7.13 (The Math-Works, Natick, USA) - PLS Toolbox, version
6.5 (Eigenvector Technologies, Manson, USA).
132
Page 134
EVIDENCING THE AGGREGATION/ASSOCIATION
PROCESSES OF INSULIN BY MEANS OF MCR-ALS
ANALYSIS
M. Soledad Larrechi, I. Martí-Aluja
Analytical and Organic Chemistry Department, Universitat Rovira i Virgili, Marcel·lí
Domingo s/n, Campus Sescelades, Tarragona, 43007, Spain.
[email protected]
Insulin is a protein that has a natural propensity to self-assemble, resulting in the association
and/or aggregation processes. Medium conditions play a key role in this process, because they
can favour the occurrence of one process over the other [1-2]. The present work presents a
chemometrics approach based on e xperimental design techniques and multivariate curve
resolution-alternating least squares (MCR-ALS) to simultaneously assess the effect of acidity,
temperature and ionic strength in the processes. A factorial design 23 was employed using the
aggregation time (Table 1), detected by the PCA of the infrared spectra monitored at each
experimental condition, as the studied response (Figure 1).
Table 1. Experimental plan for a 23 design
Experiment number
T (ºC) pH I
(mM) time (min)
1 35 3 0.3 67 2 45 3 0.3 35 3 35 7 0.3 43 4 45 7 0.3 14 5 35 3 1.5 35 6 45 3 1.5 33 7 35 7 1.5 48 8 45 7 1.5 28
133
Page 135
Figure 1. (a) The initial (solid line) and final (dotted line) spectra of experiment 3 and 5. (b) Scores plot for the first principal component of experiment 3.
The influence of medium conditions on the aggregation/association pathway was determined
by means of multivariate curve resolution alternating least squares (MCR-ALS). Three or four
forms were detected by singular value decomposition, based on the pH value: three at neutral
pH whereas four forms at acid pH. The spectral and concentration profiles of the forms
involved in each set of experiments were recovered by multivariate curve resolution-
alternating least squares (MCR-ALS) (Figure 2). Depending on the pH of the medium, two
different processes were detected. The association occurred at high pH, while aggregation
took place at acidic pH. A more accurate interpretation of the results was provided by
applying MCR-BANDS method in the recovered results. The uncertainty of the solutions was
detected in the first stage of the processes and therefore this ambiguity does not affect to the
final conclusions for either processes.
Figure 2 Experiment 3: (a) spectral profiles, (b) concentration profiles and (c) feasible bands for the concentration profiles. Experiment 5: (d) spectral profiles, (e) concentration profiles and (f) feasible bands for
the concentration profiles (solid line: first forms, dashed line: second forms, dotted line: third forms and dashed/dotted line: fourth forms)
References
134
Page 136
[1] Brange J, Andersen L, Laursen ED, Meyn G, Rasmussen E (1997) Toward understanding
insulin fibrillation. Journal of Pharmaceutical Sciences, 86, 517-525.
[2] Hua Q, Weiss MA (2004) Mechanism of insulin fibrillation. The Journal of Biological
Chemistry, 279, 21449-21460.
135
Page 137
TEMPTATIVE DECONVOLUTION OF SCATTERING AND
ABSORPTION SPECTROSCOPIC CONTRIBUTIONS USING
MCR-ALS
B. Debusa, M. Sliwaa, C. Ruckebuscha, R. Vitaleb
aLASIR CNRS Université Lille Nord de France 59655 Villeneuve d'Ascq, France
bUniversidad Politécnica de Valencia, Dpto. Estadística e I.O. Aplicadas y Calidad, Spain
E-mail: [email protected]
Spectroscopy on suspensions or opaque media is particularly complicated, especially due to
the huge differences in the light scattering phenomenon which can be observed even for
chemically identical samples. These variations sometimes represent the major part of the total
variance described by the data and can show themselves as baseline shifts or other so-called
nonlinearities. In general, the scattering properties of the analyzed samples are too complex to
be interpreted and this is the main reason why spectral preprocessing algorithms are often
required to remove scatter contributions from pure absorbance spectra. On the contrary, very
few works [1] have been devoted to attempt to separate these two different kinds of
information and use the first one to study, for instance, the morphology of a substrate.
Multivariate Curve Resolution-Alternating Least Squares (MCR-ALS) has been used for
qualitative and quantitative analysis of multicomponent spectroscopic datasets. It constitutes a
basic chemometric tool to extract spectral and concentration profiles of individual
components involved in unknown spectroscopic mixtures. So, since the measured signal for a
turbid sample can be considered primarily as a co mbination of the scattering and the
absorption contributions, the main aim of this work is to check the feasibility of a
chemometric MCR-based approach to deconvolve them from a multi-experiment dataset
made up of UV-Vis spectra collected at different time during the synthesis of organic
photochromic nanoparticles performed by laser ablation. As the particle size decreases and the
number of absorbing molecules rises during the process, the scattering and the absorption
contributions can be assumed to evolve together with respect to time, which makes the dataset
suitable for data resolution by MCR-ALS.
136
Page 138
References
[1] W. Kessler, D. Oelkrug, R. Kessler, Using scattering and absorption spectra as MCR-hard
model constraints for diffuse reflectance measurements of tablets, Anal. Chim. Acta 642
(2009) 127.
137
Page 139
RAMAN MICRO-SPECTROSCOPY IMAGING COMBINES
WITH MCR-ALS FOR CHOCOLATE ANALYSIS
Xin Zhanga, Anna de Juanb, Romà Taulera
aIDAEA-CSIC, Jordi Girona 18-26, Barcelona 08034, Spain.
bChemometrics group, Department of Analytical Chemistry, University of Barcelona,
Barcelona 08034, Spain
Raman investigations of constituents and final food products have been carried out by
obtaining spectra at individual points[1]. Recently, Raman mapping (imaging) was proposed
for food analysis too. Raman mapping can give a wealth of information about the spatial
distribution, amount and identity of constituents within a complex sample[2]. Due to the huge
size of mapping data, chemometric methods are a good choice to extract the information
included in the measured images. In this work, MCR-ALS was assessed to an alyze the
constituents in white chocolate[3] using Raman micro-spectroscopic imaging.
Multivariate Curve Resolution (MCR) methods have been shown to be very powerful
methods for spectral resolution[4]. These methods allow solving the mixture analysis problem
in general and at a p ixel level in the analysis of spectroscopic images. The potential of
hyperspectral imaging systems coupled with Multivariate Curve Resolution Alternating Least
Squares (MCR-ALS) was applied for the resolution of hyperspectral images [5, 6].
In this work, MCR-ALS was used to extract the contribution and distribution of the different
constituents in samples of white chocolate. Constituents of white chocolate were partially
resolved, indicating that sucrose was mixed with fat in the constituent particles. Pure spectra
of sucrose and fat constituents of white chocolate were obtained and compared with reference
profiles. Pure spectra of whey and lactose were obtained too, but more work is needed to
improve the accuracy of these profiles. Milk and black chocolate samples were analyzed too
but, in these cases, it was more difficult to obtain good chemical images because of the strong
fluorescence interference from cocoa solids in them.
138
Page 140
References
[1] Herrero, A. M., Raman spectroscopy a promising technique for quality assessment of meat
and fish: A review. Food Chemistry 2008, 107, (4), 1642-1651.
[2] Gowen, A. A.; O'Donnell, C. P.; Cullen, P. J.; Downey, G.; Frias, J. M., Hyperspectral
imaging – an emerging process analytical tool for food quality and safety control. Trends in
Food Science & Technology 2007, 18, (12), 590-598.
[3] Jaumot, J.; Gargallo, R.; de Juan, A.; Tauler, R., A graphical user-friendly interface for
MCR-ALS: a new tool for multivariate curve resolution in MATLAB. Chemometrics and
Intelligent Laboratory Systems 2005, 76, (1), 101-110.
[4] Tauler, R.; Kowalski, B.; Fleming, S., Multivariate curve resolution applied to spectral
data from multiple runs of an industrial process. Analytical Chemistry 1993, 65, (15), 2040-
2047.
[5] Piqueras, S.; Duponchel, L.; Tauler, R.; De Juan, A., Resolution and segmentation of
hyperspectral biomedical images by Multivariate Curve Resolution-Alternating Least
Squares. Analytica chimica acta 2011, 705, (1-2), 182-192.
[6] Zhang, X.; Tauler, R., Application of Multivariate Curve Resolution Alternating Least
Squares (MCR-ALS) to remote sensing hyperspectral imaging. Analytica Chimica Acta 2013,
762, (0), 25-38.
139
Page 141
MULTIVARIATE CURVE RESOLUTION OF INCOMPLETE
DATA MULTISETS
Marta Alier, Romà Tauler
Department of Environmental Chemistry, IDAEA-CSIC, C/Jordi Girona, 18-26, 08034,
Barcelona, Spain
[email protected]
Multivariate Curve Resolution Alternating Least Squares method (MCR-ALS) has been
applied to incomplete data multisets. The problem of incomplete data sets is ubiquitous in
many application areas like network traffic analysis, bibliometrics, social network analysis,
chemometrics, computer vision, etc. Imputation of missing values can be useful as long as the
amount of missing data is small, however performance degrades for large amounts of missing
data or when this is systematically produced. The problem of incomplete data can be very
tricky for chemometric analysis, and here we have developed a new Multivariate Curve
Resolution method to analyse incomplete data multisets where some of the data subsets (full
data matrices) are missing. The MCR method presented in this work allows analyzing
incomplete data multisets fulfilling or not, or partly, multilinear models.
The experimental incomplete data multiset studied in this work is taken from a previous
multiannual atmospheric monitoring study of the changes of ozone and nitrogen oxide
concentrations in an air quality sampling station located in the city of Barcelona, in which
some of the individual data subsets were missing. Based on the preliminary results obtained in
this study, new data multisets, complete and incomplete, with different levels of noise were
simulated and analyzed by a n ew variant of the MCR-ALS method which optimizes a
combined error function including all possible complete data subsets derived from the original
incomplete data multiset. Conclusions are drawn about the effects of data completeness on the
obtained results for different noise levels and for the application or not of trilinear models.
140
Page 142
DLLME AND MCR-ALS FOR THE RESOLUTION AND
DETERMINATION OF PHENOLIC ACIDS IN VOO BY RRLC-
DAD
M.P. Godoy-Caballeroa, M.J. Culzonib, M.I. Acedo-Valenzuelaa, T. Galeano-Díaza
aUniversity of Extremadura, Analytical Chemistry Department, Avda. Elvas s/n, Badajoz,
06006, Spain bUniversity of Litoral, Analytical Chemistry Department, Ciudad Universitaria, Paraje El
Pozo, CC242, S3000, Santa Fe, Argentine
[email protected]
Phenolic compounds are part of the minor fraction of compounds in virgin olive oil (VOO)
which constitutes approximately 2 % by weight of total. The interest in the study and analysis
of them is related to the fact that they act as natural antioxidants and may contribute to the
prevention of human disease. In addition, they also contribute to the sensory properties of
VOO as well as to its stability [1]. This work presents the development of a rapid resolution
liquid chromatography method coupled to UV-visible detection (RRLC-DAD) combined with
multivariate curve resolution-alternative least-squares (MCR-ALS) approach to carry out the
resolution and quantification of a mixture of five phenolic acids in VOO samples, employing
a reversed phase dispersive liquid–liquid microextraction (RP-DLLME). The modeling
strategy involves the building of a single MCR-ALS model composed of matrices augmented
in the temporal mode, namely spectra remain invariant while time profiles may change from
sample to sample. 4-Hydroxybenzoic (4HB), gentisic (GEN), vanillic (VAN), caffeic (CAF)
and syringic (SY) acids have been chosen as a representative group of phenolic compounds.
All of them present different absorption spectra and overlapped time profiles with the olive oil
matrix interferences and between them. So MCR-ALS is used to cope the coeluting
interferences on account the second order advantage inherent to this algorithm. Initially, a set
of 9 calibration samples were randomly prepared, in a concentration range from 0.5 t o 5
μg·mL-1 for all phenolic acids. The validation was firstly carried out using standard mixtures
of these acids in ethanol:water (60:40, v/v) and, secondly, in real VOO samples getting good
results in both cases.
141
Page 143
References
[1] Carrasco-Pancorbo A, Cerretani L, Bendini A, Segura-Carretero A, Gallina-Toschi T,
Fernández-Gutiérrez A (2005) “Analytical determination of polyphenols in olive oils”
Journal of Separation Science, 28, 837-858.
142
Page 144
CHEMOMETRIC TOOLS EMPLOYED TO DISTINGUISH
RAMAN SPECTRA OF BLUE BALLPOINT PEN INKS.
Flávia de Souza Lins Borbaa, Ricardo Saldanha Honoratob, Ana de Juana
aUniversitat de Barcelona, Dept. Analytical Chemistry, Diagonal, 647, 08028 Barcelona,
Spain, bPolícia Federal, Superintendência Regional em Pernambuco, Av. Cais do Apolo, 321,
50030-230, Recife-PE, Brazil
[email protected]
The development of methods able to differentiate pen inks is of great importance in the field
of forensic science because it can help to solve crimes that involve questioned document.
Ballpoint pen inks are composed of a wide variety of chemical compounds, for example dyes,
pigments, solvents, resins, biocide, lubricant, viscosity adjusters, antioxidants and surfactants
[1]. Because of this complex mixture, the analysis of such sample is difficult. Another factor
that further complicates the analysis of pen inks is that the questioned documents should
preferably be analyzed by non-destructive methods because the physical integrity of the crime
evidences should not be compromised during analysis. In this context, Raman spectroscopy
has been used in this work because it is noninvasive and does not require sample treatment.
Commercial blue ballpoint pens of different brands and free pen samples from different origin
were used in this study. Whenever possible, several pens of the same brand were acquired to
obtain a more representative data set and to check for the within-brand variability. Replicate
ink lines from the same pen were written on A4 sulfite and on recycled paper to study the
effect of the type of paper on the distinction of ink samples. All the ink lines and papers used
were analyzed by Raman spectroscopy using a Horiba Jobin Yvon LabRam instrument.
Punctual Raman spectra will be first corrected to suppress fluorescence contributions and
further analyzed by Principal Component Analysis to assess whether this technique can
distinguish different ink types and to find relevant spectral features useful for ink
differentiation.
143
Page 145
Preliminary studies on Raman hyperspectral images of different inks on paper will also be
analyzed by Multivariate Curve Resolution to see whether the simultaneous presence of
different inks in the same sample can be detected and spectrally and spatially modeled [2].
References
[1] R. L. Brunelle, K. R. Crawford, Advances in the Forensic Analysis an Dating of Writing
Ink, Charles C Thomas, Springfield, (2003) pg 14.
[2] A.de Juan, M. Maeder, T. Hancewicz, L. Duponchel, R.Tauler, in: R.Salzer and
H.W.Siesler (Eds.), Chemometric Tools for Image Analysis in Infrared and Raman
Spectroscopic Imaging, Wiley-VCH, 2009,pp. 65-106
144
Page 146
SELECTIVITY RATIO (SR) EXTENSION TO N-WAY ARRAY
Stefania Favillaa, Marina Cocchib
aUniversity of Modena and Reggio Emilia, Department of Biomedical Sciences, Metabolic
and Neuroscience Modena, 41121, Italy; bUniversity of Modena and Reggio Emilia, Department of Chemical and Geological Science,
Modena, 41125, Italy
[email protected]
Variable selection techniques are increasingly used in Multi-way analysis because the
identification of the most “important” variable in prediction, simply based on the examination
of regression coefficients, is not so straightforward often due to the unreadable complex
patterns associated [1], as in the case of spectral data.
We propose here an extension of the original formulation of Selectivity Ratio (SR) parameter
[2] to multi-way arrays, close to SR definition for bilinear data, in order to highlight the most
relevant features to predict the studied dependent properties either for interpretative purposes
or to orient feature selection.
As in the original code the SR index is calculated by using the ratio of explained variance by
the target component to the residual variance of each x-variable. A high value means that the
variable is relevantly correlated with the Y.
In the n-way implementation of SR the target component is obtained by a one component
PARAFAC model of X calculated as a projection on m ode 1 of Y through the normalized
regression coefficient bNPLS. The SR is defined for all the variables/conditions modes of the X
array.
Here we present application of the method described to three different datasets, considering
regression (NPLS) as well as discrimination framework (NPLS-DA). The data sets are related
to optimization of food processing and authentication issue for products with protected
denomination of origin. Moreover, the relevance of variables resulting form SR analysis is
compared with VIP scores for n-way models, recently implemented by us [3].
145
Page 147
References
[1] A.J. Burnham, J.F. MacGregor, R. Viveros, Interpretation of regression coefficients under
a latent variable regression model. J. Chemom., 15 (2001), 265–284.
[2] T. Rajalahti, R. Arneberg, F. S. Berven, K.M. Myhr, R. J. Ulvik, O. M. Kvalheim,
Biomarker discovery in mass spectral profiles by means of selectivity ratio plot, Chemom.
Intell. Lab. Syst. 95 (2009) 35–48.
[3] S. Favilla, C. Durante, M. Li Vigni, M. Cocchi, Assessing features relevance in NPLS
models by VIP, submitted.
146
Page 148
EXPLORATORY ANALYSIS OF SECONDARY
METABOLITES EXTRACTED FROM GREEN TEA USING
HPLC-DAD AND CHEMOMETRICS METHODS
E. D. Paulia, R. Taulerb, I. S. Scarminioa
aDepartment of Chemistry, State University of Londrina, R/ Celso Garcia Cid Km 380,
86057970, Londrina, Brazil bDepartment of Environmental Chemistry, IDAEA-SCIC, C/ Jordi Girona, 18-26, 08034,
Barcelona, Spain
Tea plant of Camellia sinensis is the most widely consumed beverage in the world after the
water. Based on pr ocessing or harvested leaf development, tea varieties are black, green,
oolong and white. Many beneficial effects of green tea on health have been reported,
including prevention of cancer and cardiovascular diseases, and anti-inflammatory, among
others.
In this work a simplex centroid mixture design was used to investigate varying proportions
of binary, ternary and quaternary mixtures of ethanol (e), ethyl acetate (a), dichloromethane
(d) and chloroform (c) for the extraction of secondary metabolites of samples of green tea
from a first and second harvest. These extracts were submitted to high performance liquid
chromatography analysis with a diode array detector (HPLC) using a Hilic Kinetex column
appropriate for the separation of the more polar metabolites. Due to the size of the matrix
generated and to the large amount of samples, Principal Components Analysis (PCA) and
Multivariate Curve Resolution-Alternating Least Squares (MCR-ALS) were used to identify
possible differences between extractions of first and second harvest and to identify what
metabolites could be responsible for this differentiation.
According to components 1 and 3, in Figure 1a, sample 2d from second harvest extracted
with dichloromethane pure was well separated from the rest of samples. In Figure 1b the
corresponding loading 1 and 3 are shown.
147
Page 149
-400 -200 0 200 400 600 800-150
-100
-50
0
50
100
150
200
Scores on PC 1 (76.32%)
Sco
res
on P
C 3
(5.
95%
)
1e
2e
1a
2a
1d
2d
1c
2c
1ea
2ea
1ed
2ed 1ec
2ec
1ad
2ad 1ac
2ac
1dc 2dc
1ead
2ead
1eac
2eac
1edc
2edc
1adc
2adc
1eadc
2eadc
Samples/Scores Plot
50 100 150 200 250-0.1
0
0.1
0.2
0.3
Variable
Lo
ad
ing
s
Loading 1Loading 3
a) b)
Figure 1 – a) score graph of factors 1and 3. b) loading graph of factors 1 and 3
The green peak region in Figure 1b, was selected from the chromatograma of all samples
and a new data matrix was obtained and analyzed by MCR-ALS. Figures 2a and b show the
MCR-LS resolved augmented concentration profiles of the coeluted components (for all the
simultaneously analyzed samples) under the selected chromatographic peak and the
corresponding resolved UV-vis (pure) spectral profiles, respectively, with a data lack of fit (%
LOF) of only 0.45%.
Figure 2 – Simultaneous MCR-ALS resolution to peaks chromatographic isolated a) concentration profiles. b)
related pure spectra
Results obtained by MCR-ALS showed that the sample extracted from the second harvest of
pure dichloromethane (2d) again outstands from the rest of samples due to the relative
concentrations of its coeluted components, and specially in the relative contribution of one of
them (blue line) which corresponds to the component with pure spectrum with its maximum
at 271 nm. For the other samples, the component with higher concentration refers to the one
(red line) with a spectrum maximum at 275 nm, as resolved by MCR-ALS. These are
preliminary results and a deeper investigation of them is being performed at present.
220 222 224 226 228 230 232 234 236 238 240 242 244 246 248 250 252 254 256 258 260 262 264 266 268 270 272 274 276 278 280 282 284 286 288 290 292 294 296 298 3000
0.05
0.1
0.15
0.2
0.25
2e
1a 2a
1d
2d
1c 2c1ea
2ea
1ed
2ed
1ec2ec
1ad
2ad
1ac2ac 1dc
2dc 1ead
2ead
1eac2eac
1edc2edc
2adc1adc
2eadc1eadc
1e
a
b
148
Page 150
References
Wang L, et al. (2013) Column-Chromatographic extraction and separation of polyphenols,
caffeine and theanine from green tea. Food Chemistry, 131, 1539–1545.
Sereshti H et al. (2013) Determination of volatile components of green, black, oolong and
white tea by optimized ultrasound-assisted extraction-dispersive liquid-liquid microextraction
coupled with gas chromatography. Journal of Chromatography A, 1280, 1-8.
Misaka S, et al. (2013) Development of rapid and simultaneous quantitative method for green
tea catechins on the bioanalytical study using UPLC/ESI-MS. Biomedical Chromatography,
27, 1-6.
149
Page 151
CHEMOMETRIC EVALUATION OF Saccharomyces cerevisiae METABOLIC PROFILES USING LC-MS
M. Farrés, B. Piña, R. Tauler
Environmental Chemistry, Institute of Environmental Assessment and Water Research
(IDAEA), Spanish Council for Scientific Research (CSIC), c/ Jordi Girona 18-26, 08034 Barcelona, Spain [email protected]
Under stress conditions, the organism cells try to maintain the homeostasis and the metabolic
control by varying the biological fluids composition. This involves adjusting the
concentration of hundreds or thousands of metabolites to maintain cells characteristics. These
metabolic balances are expressed by the metabolic profiles; and the profiles can be used for
the study of dynamic effects. High pressure liquid chromatography coupled to electrospray
mass spectrometry (HPLC-ESI-MS) has emerged as a powerful tool for the acquisition of the
metabolic fingerprints, it enables the separation and detections of thousands of ions in biofluid
samples [A Roux et al., 2011]. The complex data generated in the HPLC-ESI-MS profiling
experiment is analysed by multivariate statistical tools [J v d Greef and A K Smilde, 2005; J
Trygg and T Lundstedt, 2007].
Saccharomyces cerevisiae is proposed as an eukaryotic model [J I Castrillo and S G Oliver,
2006] for evaluating the metabolic profiles under stress conditions using chemometric
techniques. The influence of culture temperature (30 and 42 ºC) on a population is studied. An
appropriate number of samples of the investigated system are taken at each culture
temperature. The extraction procedure of intracellular metabolites is optimized considering
their nature and polarity [B Gonzalez et al., 1997]; and the extracts are analysed through
HPLC-ESI-MS.
The LC-MS profiling data is exported to Matlab for preprocessing (interpolation, noise
filtering, alignment and scaling) and statistical analysis. Principal Component Analysis
(PCA) is used for the total ion current (TIC) chromatograms exploration. Then, Multivariate
Curve Resolution-Alternating Least Squares (MCR-ALS) [R Tauler, 1995] is applied to the
three-way data sets using column wise augmented matrices. The profiles as a function of the
temperature are estimated for the metabolites present in the cultures. A comparative study
using profiles estimations showed that some of the metabolites follow different behaviour for
150
Page 152
the different cultures. The corresponding pure spectra estimations are used for metabolite
identification. The Yeast Metabolome Database (YMBD) [T Jewison et al., 2012] and the
MassBank database [H Horai et al., 2010] are used for the search and the identification of the
compounds.
References
Castrillo, J. I., and S. G. Oliver (2006), Metabolomics and Systems Biology in Saccharomyces cerevisiae, in Fungal Genomics, edited by A. Brown, pp. 3 -18, Springer Berlin Heidelberg. Gonzalez, B., J. François, and M. Renaud (1997), A rapid and reliable method for metabolite extraction in yeast using boiling buffered ethanol, Yeast, 13(14), 1347-1355. Greef, J. v. d., and A. K. Smilde (2005), Symbiosis of chemometrics and metabolomics: past, present, and future, Journal of Chemometrics, 19(5-7), 376-386. Horai, H., et al. (2010), MassBank: a public repository for sharing mass spectral data for life sciences, Journal of Mass Spectrometry, 45(7), 703-714. Jewison, T., et al. (2012), YMDB: the Yeast Metabolome Database, Nucleic Acids Research, 40(D1), D815-D820. Roux, A., D. Lison, C. Junot, and J.-F. Heilier (2011), Applications of liquid chromatography coupled to mass spectrometry-based metabolomics in clinical chemistry and toxicology: A review, Clinical Biochemistry, 44(1), 119-135. Tauler, R. (1995), Multivariate curve resolution applied to second order data, Chemometrics and Intelligent Laboratory Systems, 30(1), 133-146. Trygg, J., and T. Lundstedt (2007), Chapter 6 - Chemometrics Techniques for Metabonomics, in The Handbook of Metabonomics and Metabolomics, edited by C. L. John, K. N. Jeremy, J. K. N. Elaine HolmesA2 - John C. Lindon and H. Elaine, pp. 171-199, Elsevier Science B.V., Amsterdam.
Acknowledgement: Mireia Farrés acknowledges a P hD grant FI-AGAUR from Generalitat
de Catalunya. Funding is acknowledged from Ministerio de Ciencia e Inovación, Spain.
CTQ2009-11572 Project.
151
Page 153
APPLICATION OF THIRD ORDER ALGORITHMS TO
DETERMINATION OF CARBARYL, NAPHTOL AND
PROPOXUR BY KINETIC SPECTROSCOPIC MEASURES.
Pablo Santa Cruz, Alejandro García-Reiriz
Instituto de Química Rosario (IQUIR), Consejo Nacional de Investigaciones Científicas y
Técnicas (CONICET), Suipacha 531, Rosario S2002LRK, Argentina
[email protected]
In the present work is presented a new application of third order algorithms to quantify
carbaryl, naphtol and propoxur using kinetic spectroscopic data.
It was measured time evolution of fluorescence data matrix to follow the alkaline hydrolysis
of pesticides mentioned above [1]. The data was analyzed by three different methods, Parallel
Factor Analysis (PARAFAC), Unfolded Partial Least Squares (U-PLS) and Non-Unfolded
Partial Least Squares (N-PLS) [2-5], theses last two method was assisted with Residual
Trilinearization (RTL) [6] to model the presence of inspected signals no included in the
calibration step. This experimental system has the additional complexity that one of the
analites is the product of reaction of other analite, this present problems of linear dependency
between concentrations.
The ability of different algorithms to predict concentrations was checked with validation
samples. Also was prepared samples with unexpected components, tiabendazole and
carbendazim, and additional water samples of a creek was extracted to addition with the three
analites for check the recovery concentrations.
The better results were obtained by U-PLS/RTL and N-PLS/RTL because these two method
are more flexible than PARAFAC. In Figure 1 is showed a representation of data flow, there
are the structures of all analites and the data of a typical sample with carbaryl.
152
Page 154
Figure 1
References
[1] Maggio R, Damiani P, Olivieri A (2010) Four-way kinetic-excitation-emission
fluorescence data processed by multi-way algorithms. Determination of carbaril and 1-naphtol
in water samples in the presence of fluorescent interferents. Analytical Chemistry, 677, 97–
107.
[2] Bro R (2006) Review on multiway analysis in chemistry 2000–2005. Crit. Rev.
Analytical Chemistry, 36, 279–293.
[3] Escandar G, Faber N, Goicoechea H, Muñoz de la Peña A, Olivieri A, Poppi R (2007)
Trends. Second- and third-order multivariate calibration: data, algorithms and applications.
Analytical Chemistry, 26, 752–765.
[4] Bro R (2003) Multivariate calibration. What is in chemometrics for the analytical
chemist?. Analytica Chimica Acta, 500,185–194.
[5] Bro R (1997) PARAFAC. Tutorial and applications. Chemometrics and I ntelligent
Laboratory Systems, 38, 149–171.
[6] Olivieri A, Arancibia J, Muñoz de la Peña A, Durán-Merás I, Espinosa Mansilla A (2004)
Second-order advantage achieved with four-way fluorescence excitation-emission-kinetic data
153
Page 155
processed by parallel factor analysis and trilinear least-squares. Determination of
methotrexate and leucovorin in human urine. Analytical Chemistry, 76, 5657–5666.
154
Page 156
CHEMOMETRIC MODELING OF ORGANIC
CONTAMINANT SOURCES IN SURFACE WATERS OF A
MEDITERRANEAN RIVER BASIN (CATALONIA) DISTRICT
Alejandro G. García-Reiriza, Alejandro C. Olivieria, Graciela M. Escandara,
Elisabeth Teixidób, Antoni Ginebredac, Romà Taulerc
aDepartment of Analytical Chemistry, Faculty of Biochemistry and Pharmaceutical Sciences,
National University of Rosario, Rosario Institute of Chemistry (IQUIR-CONICET), Suipacha
531, Rosario, S2002LRK, Argentina. bAgència Catalana de l'Aigua, Provença 204-208, 08036 Barcelona, Spain.
cDepartment of Environmental Chemistry, IDAEA-CSIC, Jordi Girona 18-26, 08034
Barcelona, Catalonia, Spain.
[email protected]
Chemometric methods are applied to the analysis and interpretation of large multivariate data
sets obtained in environmental monitoring studies [1-3]. The concentrations of multiple
organic compounds were measured in river samples taken from several sampling sites, at
various geographical locations, during a number of campaigns and/or sampling time periods.
Samples were collected and analyzed as part of an extensive multi-annual monitoring
program. The water samples were taken from a mediterreanea river basin (in Catalonia, at the
northeast of Spain), while historical data were available from the Water Catalan Agency. The
identification of the main contamination sources and the description of their temporal and
spatial distributions were achieved using both chemometric and geostatistical methods. Due to
the great amount of data in these databases and to their complexity, chemometric modeling
[principal components analysis (PCA) [4] and multivariate curve resolution with alternating
least-squares (MCR-ALS) [5]] coupled to appropriate mapping representations is proposed to
155
Page 157
evaluate the environmental quality of the studied rivers. The results achieved in this study are
intended to be a contribution to quality assessment and evaluation of the global situation of
the contamination of surface waters in Catalonia, and to support public policies of
environmental control and protection in the region under study.
References
[1] Terrado M, Barceló D, Tauler R (2009) Quality assessment of the multivariate curve
resolution alternating least squares (MCR-ALS) method for the investigation of
environmental pollution patterns. Environmental Science and Technology, 43, 5321–5326.
[2] Tauler R, Lacorte S, Guillamon M, Cespedes R, Viana P, Barceló D (2004) Chemometric
modeling of main contamination sources in surface waters of Portugal. Environmental
Toxicology and Chemistry, 23, 565–575.
[3] Teixidó E, Olivilla L, Figueras M, Ginebreda A, Tauler R (2001) Multivariate exploratory
data analysis of the organic micropollutants found in the Llobregat River (Catalonia, Spain).
International Journal of Environmental Analytical Chemistry, 81, 295–313.
[4] Wold S, Esbensen K, Geladi P (1987) Principal component analysis. Chemometrics and
Intelligent Laboratory Systems, 2, 37–52.
[5] Tauler R (1995) Multivariate curve resolution applied to second order data. Chemometrics
Intelligent Laboratory Systems, 30, 133–146.
156
Page 158
DEVELOPMENT OF A MULTIWAY ANALYTICAL METHOD
TO HANDLE THE QUENCHING EFFECT IN THE
DETERMINATION OF CARBAMATE PESTICIDES IN LIME
FLOWER TEA BY MEANS OF EXCITATION-EMISSION
MOLECULAR FLUORESCENCE
L. Rubioa, M.C. Ortiza, L. Sarabiab
University of Burgos, Faculty of Sciences, Department of Chemistrya and Mathematics and
Computationb, Plaza Misael Bañuelos s/n, Burgos, 09001, Spain
E-mail ([email protected] )
Nowadays, it is of great importance to provide simple and inexpensive methods for the
determination of toxic residues and pollutants in fields under legislation.
In fluorescence measurements, the magnitude of the signal and the highly overlapping spectra
have a marked influence on the detection capability, so that worst results are obtained for
highly overlapped and slightly fluorescent analytes. Moreover, this could make their
identification difficult.
In this work, the determination of two carbamate pesticides (carbaryl and carbendazim) and
the degradation product of carbaryl (1-naphthol) was carried out using molecular fluorescence
spectroscopy (with excitation-emission data) and Parallel Factor Analysis (PARAFAC). This
analysis was performed in synthetic samples, using pure methanol as solvent, and in a vegetal
product such as lime flower tea. In lime flower tea samples, after the extraction with ethyl
acetate and subsequent reconstitution in methanol, a matrix with a complex fluorescent signal
that shows quenching effect was obtained. To be able to quantify ternary mixtures of the three
analytes, an experimental strategy in two stages has been followed: 1) Determine the adequate
dilution of the lime flower tea extract to minimize the quenching effect and to obtain the
characteristic excitation-emission profiles of the lime flower tea extract, 2) Use the standard
addition method to prepare a calibration based on a D-optimal design. From the total of the
mixtures used, 5 pure standards of increasing concentrations for each analyte, selected as
157
Page 159
protected points of the design (13 samples), and 12 ternary mixtures formed the 25 calibration
standards (three test samples and five spiked samples were also measured for validation).
Once the background (matrix fluorescent components) was subtracted from the previous
signals, the PARAFAC decomposition of the new tensor (with dimensions 33 × 206 × 11,
where 33 corresponds to the sample mode, 206 to the emission mode and 11 to the excitation
mode) showed a CORCONDIA index equal to 100.
Carbendazim was very little fluorescent compared to the other analytes studied in this work
and it was totally overlapped with them and with the matrix. This made difficult its
determination and the results were worse for this analyte than for the rest. Better decision
limit values (CCα), in x0 = 0 with probabilities of false positive and false negative fixed at
0.05, were obtained for the calibration done in pure solvent: 2.97 μg L-1 for 1-naphthol, 3.74
μg L-1 for carbaryl and 23.25 μg L-1 for carbendazim; while these values in matrix were 3.38,
12.5 y 37.58 μg L-1 respectively. The trueness was established by the regressions “predicted
concentration versus true concentration” in all cases. Furthermore, the three analytes were
unequivocally identified by the correlation between the pure spectra and the PARAFAC
spectral loadings. In all cases, the correlation coefficients were greater than 0.97 for the
emission and excitation profiles.
Acknowledgements
The authors thank the financial support through projects Ministerio de Economía y Competitividad (CTQ2011-26022) and Junta de Castilla y León (BU108A11-2). L. Rubio is particularly grateful to Universidad de Burgos for her FPI grant.
158
Page 160
CORROSION EVALUTION OF CHROME ELECTROPLATED
SHEETS BY IMAGE ANALYSIS
Maider Vidala, Miren Ostraa, Carlos Ubidea, Naroa Imazb, Eva García-Lecinab
aUPV-EHU, Departamento de Química Aplicada, Paseo Manuel Lardiazabal 3, San
Sebastián, 20018 , Spain bCIDETEC, Pº Miramón 196, Parque Tecnológico Miramón, San Sebastián, 20009, Spain
E-mail ([email protected] )
In general, a good quality chrome electrodeposit has a high corrosion resistance. Nowadays,
the most common technique to evaluate corrosion on metal electroplated surfaces is through
electrochemical techniques and the electrochemical impedance module obtained at a concrete
frequency. The higher this module value is, the higher the corrosion resistance.
In the present communication image analysis techniques are proposed in order to evaluate
surface corrosion on chrome electrodeposit. Several microscopic images have been obtained
in a co nfocal microscope after keeping the chrome deposits in a NaCl media at room
temperature along time in intervals of 30 and 60 minutes and 3, 6, 9 and 24 hours. The MIA
(Multivariate Image Analysis) strategy by shifting and stacking each R,G,B channel of a
multivariate image [1-2] has been applied in order to quantify the surface affected by
corrosion. This method allows simultaneous spectral and textural information of an image.
Unlike the common used electrochemical techniques, information about the distribution of the
corrosion over the surface can be obtained. The percentage of the surface affected by
corrosion over the whole electroplated surface can be also quantified by pixel computation.
The Figure 1 shows the area of a chrome deposit affected by corrosion and the percentage
over the whole surface after 3 (top) and 24 hours (bottom). In order to speed up the algorithm
computation images resolution has been reduced.
159
Page 161
100 200 300
50
100
150
200
250
300
3500
50
100
150
200
250
( )
100 200 300
50
100
150
200
250
300
3500
50
100
150
200
250
200 400 600
200
400
600
200 400 600
200
400
600
Figure 1. Original images (a, c) of chrome electrodeposits and extracted information (b,d)
after corrosion procedures. 3-hours period (a,b); 24-hours period (c,d).
References
[1] Bharati M.H., Liu J.J., MacGregor J.F. (2004) Image texture analysis: methods and
comparisons. Chemometrics and Intelligent Laboratory Systems, 72, 57-71.
[2] Prats-Montalbán J.M., Ferrer A. (2007) Integration of colour and textural information in
multivariate image analysis: defect detection and classification issues. Journal of
Chemometrics, 21, 10-23.
defect (%) = 16.9417
defect (%) = 32.741
(a) (b)
(c) (d)
160
Page 162
IMAGE PROCESSING METHODS FOR AUTOMATIC
IDENTIFICATION OF DRUGS BY THIN LAYER
CHROMATOGRAPHY
Francisco Silva, Dania Porro, Noslen Hernández, Isneri Talavera
Advanced Technologies Application Center (CENATAV)
7ma A #21406 e/ 214 y 216, Siboney, Playa, C.P. 12200, La Habana, Cuba
[email protected]
The use of computational methods combined with the thin layer chromatography (TLC), for
the identification of drugs of abuse brings significant improvements in the speed and accuracy
of the identification results. The computational processing is performed on i mages of the
resulting plates, specifically analyzing the position, shape and color of the spots
corresponding to each substance.
The identification of the drug of abuse through the TLC technic leads to qualitative and
quantitative analysis of the traces of each substance resulting from the chromatographic
separation process. This evaluation process which is normally done manually by the analyst is
now carried out fully automatically through a proposed sequence of image processing
algorithms. Those algorithms include the detection, cropping and straightening of the plate.
Besides, it includes the detection of the lanes and base line, the location and segmentation of
the spots, and the measurement of their characteristics, through the measuring of its Rf value,
its shape, and its color. Finally the identification of the substance sample is performed by
calculating a similarity value respect to previously stored patterns. The similarity value
combine properly different distances related with the color, the shape [Flusser, Suk, et.al
(2009)] and the Rf value with an adequate weight.
In order to obtain successfully results was necessary to use methods capable of dealing with
the mistakes of the physical-chemical process. It was applied different filters in order to
reduce or eliminate the noise, to normalize geometrically and photometrically the images and
to judge which degree of confidence we should work with in accordance with the overall
quality of the process. Overlooking to this latter purpose it has been introduced an evaluation
161
Page 163
step for evaluating the quality. This evaluation is based on the statistical values of kurtosis
and skewness [Spiegel, Schiller, et.al (1970)] of the image histogram combined with a
supervised learning approach.
The used algorithms based on m orphological operations [González and Woods (2001)] are
capable of discriminating between spots when they are overlapped if the percent of
overlapping does not reach a certain threshold, which facilitates the identification of
substances whose spots have very close Rf values.
To achieve detection of spots whose contrasts are very small in relation to the background it
has been incorporated an adaptive thresholding algorithm.
An internal standard for each plate has been introduced as a reference for the determination of
the relative value of Rf [Sajewicz, Piętka, et al. (2005)]. This avoids its possible variation due to
the particular conditions of the chemical process of TLC, such that a secure identification of
drugs is achieved. The fact of the indirect participation of analysts in the measurement and
evaluation of the parameters of each spot, avoids any variations inherent to manual
processing.
The process consumes only a few milliseconds and gives as response the percentage value of
similarity with respect to the stored patterns and the name of the identified drugs. The
experiments were performed with 42 dr ugs of abuse, where was achieved a 99 % of
identification rate, which shows the validity of the solution.
References
Gonzalez R, Woods R (2001) Digital Image Processing. Second Edition, Prentice Hall, Upper
Saddle River, New Jersey 07458.
Sajewicz M, Pietka R, Pienak A, Kowalska T (2005) Application of Thin-Layer
Chromatography to Investigate Oscillatory Instability of the Selected Profen Enantiomers in
Dichloromethane. Journal of Chromatographic Science, 43, 542-548.
Spiegel M, Schiller J, Srinivasa R (1970) Teoría y problemas de estadística. México,
McGraw-Hill.
Flusser J, Suk T, Zitová B (2009) Moments and Moment Invariants in Pattern Recognition,
John Wiley & Sons Ltd.
162
Page 164
HYPERSPECTRAL IMAGING COMBINED WITH
PRINCIPAL COMPONENT ANALYSIS TO DETECT EDIBLE
MUSHROOMS INFECTED BY MYCOPHILIC FUNGI
L. Bagnascoa, E. Sanguinetib, M. Zottic, P. Oliveria, S. Lanteria
aDepartment of Pharmacy, University of Genova, Via Brigata Salerno 13, 16147 Genova,
Italy. bDepartment of Chemistry and Industrial Chemistry, University of Genova, Via Dodecaneso
31, 16146 Genova, Italy. cMicology Laboratory, Department of Earth, Enviroment and Life, Polo Botanico "Hanbury",
University of Genova, Corso Dogali 1M, 16136 Genova, Italy.
[email protected]
Mycophilic fungi of anamorphic genus Sepedonium (telomorphs in Hypomyces, Hypocreales,
Ascomycota) infect and parasitize the fruit bodies (or sporomata) of boleticolous species,
forming conidia in the final stage of the infection process [1-3]. The preferred hosts are
genera within Boletales, such as Boletus, which include the most and expensive edible wild-
grown mushrooms, Boletus edulis and relative group. Infections lead to total necrosis and the
formation of large quantities of yellow aleurioconidia.
Up to date, Sepedonium infections have been evaluated only through macroscopic and
microscopic analysis by experts mycologists, but this method can be too expensive, in terms
of time, as a routine methodology for industrial purposes. Up to now, no analytical technique
has been proposed for the detection of Sepedonium, while different applications of
hyperspectral imaging (HSI) and chemometrics for monitoring different aspects of mushroom
quality have been reported [4-5].
In this study, the potential application of HSI and principal component analysis (PCA) for
detection of Sepedonium infection on Boletus edulis and relative group was investigated.
Hyperspectral images were obtained using a pushbroom line-scanning HSI instrument,
operating in the wavelength range be tween 400–1000 nm with 5 nm resolution. PCA was
applied on a training dataset composed by 14 average spectra of normal samples and 14
163
Page 165
average spectra of contaminated samples, which were obtained by selecting regions of
mushrooms corresponding to the two typologies, respectively, at different points on t he
mushroom surfaces. To reduce the spectral variability caused by factors unrelated to
Sepedonium infection such as scattering effects and differences in sample height, different
spectral pre-treatments were applied. A supervised rule was then developed to assign spectra
recorded on new test samples to each of the two classes, based on the PC scores. This allowed
to visualize directly – within false-color images of test samples – which points of the samples
were contaminated.
The results achieved might lead to the development of a non-destructive monitoring system
for a rapid on-line screening of contaminated mushrooms.
Acknowledgement: DV-Optic Tecnologie d’Avanguardia (Padova, Italy) is gratefully
acknowledged for having provided instrumentation use.
References
[1] Gams W, Diederich P, Pöldmaa K (2004) Fungicolus Fungi. In: Mueller G, Bills GF,
Foste MS (eds) Measuring and monitoring biological diversity: standard methods for fungi,
Smithsonian Institution Press., Washington, p. 343.
[2] Neuhof T, Berg A, Besl H, Schwecke T, Dieckmann R, Döhren H (2007) Peptaibol
production by Sepedonium strains parasitizing Boletales. Chemistry & Biodiversity, 4, 1103.
[3] Sanguineti E, Cosulich ME, Salis A, Damonte G, Mariotti MG, Zotti M (2012) A
hemolytic peptide from the mycophilic fungus Sepedonium chrysospermum (Bull.) Fr.
Applied Microbiology and Biotechnology, 94, 987.
[4] Gowen AA, O’Donnell CP, Taghizadeh M, Cullen PJ, Frias JM, Downey G (2008)
Hyperspectral imaging combined with principal component analysis for bruise damage
detection on white mushrooms (Agaricus bisporus). Journal of Chemometrics, 22, 259.
[5] Gowen AA, Taghizadeh M, O’Donnell CP (2009) Identification of mushrooms subjected
to freeze damage using hyperspectral imaging. Journal of Food Engineering, 93, 7.
164
Page 166
INVESTIGATING THE POTENTIAL OF SPECTRAL AND HYPERSPECTRAL-IMAGING TECHNIQUES FOR DETECTING
LACTIC ACID BACTERIA AS FOOD CONTAMINANTS
S. Morandia, M. Brascaa, P. Lavermicoccab, C. Ferraric, G. Focac, A. Ulricic, G. Sciuttod, S. Pratid, S. Lanterie, P. Oliverie
aNational Research Council, Institute of Sciences of Food Production (CNR-ISPA), Via
Celoria 2, Milano, 20133, Italy. bNational Research Council, Institute of Sciences of Food Production (CNR-ISPA), Via
Amendola, 122/O, Bari, 70126, Italy. cUniversity of Modena and Reggio Emilia, Department of Life Sciences, Via Amendola 2,
Reggio Emilia, 42100, Italy. dUniversity of Bologna, Ravenna Campus, Microchemistry and Microscopy Art Diagnostic
Laboratory (M2ADL), Via Guaccimanni 42, Ravenna, 48100, Italy. eUniversity of Genoa, Department of Pharmacy, Via Brigata Salerno 13, Genoa, 16147, Italy.
[email protected]
Spoilage of meat products – in particular, packaged sliced ham – is generally accompanied by
souring, slimy meat juice exudates and swelling of the pack due to gas production.
Such a spoilage usually results in sensory quality defects such as sour off-flavour,
discolouration, gas production, and ropy slime formation and is usually caused by lactic acid
bacteria (LAB). The most frequently isolated organisms from spoiled cooked meats are
Lactobacillus sakei, Lactobacillus curvatus and Leuconostoc mesenteroides [1].
Non-destructive, rapid and sensitive analytical techniques are therefore required for early
detection of LAB spoilage in products destined to markets, in order to guarantee the consumer
a higher quality and safety level.
In the present study, we investigated the potential of a m acroscopic hyperspectral scanner
operating in the NIR (955-1700 nm) region and of a FTIR microscopy operating in the region
4000-675 cm-1 for providing information useful for detecting LAB spoilage.
In more detail, cultures of Lactobacillus sakei and Lactobacillus curvatus on agar medium
were submitted to spectral and hyperspectral analysis. Application of suitable multivariate
exploratory methods (such as principal component analysis – PCA and multivariate curve
resolution – MCR), supervised methods (such as PLS-DA), and techniques for data reduction
(such as hyperspectrograms) proved that information embodied in spectral and hyperspectral
165
Page 167
data was functional to characterise and identify the LAB species investigated responsible for
ham spoilage.
Moreover, preliminary outcomes of analyses on sliced ham samples artificially spoiled with
LAB indicate the possibility of detecting contamination directly on the food matrix.
References
[1] Hu P, Zhou G, Xu X., Li C, Han Y, (2009). Characterization of the predominant spoilage
bacteria in sliced vacuum-packed cooked ham based on 16 S rDNA-DGGE. Food Control, 20,
99-104.
166
Page 168
K-CONTRACTIVE MAP (K-CM) FOR CLASSIFICATION
M. Buscemaa,b, D. Ballabioc, V. Consonnic, G. Massinic, M. Bredaa, M. Fabrizia,
A. Mauric, R. Todeschinic
aSemeion, Research Centre of Sciences of Communication, Via Sersale 117, 00128 Rome,
Italy bDepartment of Mathematical and Statistical Sciences, CCMB, University of Colorado
Denver, Denver, CO 80204, USA cMilano Chemometrics and QSAR Research Group, Department of Earth and Environmental
Sciences, University of Milano-Bicocca, P.za della Scienza 1 – 20126 Milano, Italy
Supervised pattern recognition methods for classification are increasingly applied in several
fields, such as food chemistry, analytical chemistry, metabonomics, process monitoring,
medical sciences, pharmaceutical chemistry, chemical modelling, as well as social and
economic sciences. Classification is one of the fundamental methodologies in multivariate
analysis and consists basically in finding mathematical models able of recognizing the
membership of samples to their proper class.
Among traditional classifiers, Artificial Neural Networks (ANNs) are increasing applications
and nowadays can be considered as one of the most important emerging tools in multivariate
analysis. One of the reasons of their success can be related to their ability of solving both
supervised and unsupervised issues, such as clustering and modeling of both qualitative and
quantitative responses.
In this work, we propose the application of a new ANN, K-Contractive Map (K-CM), which
is able to handle non-linear classification issues. The classification performances of K-CM
have been evaluated on ten benchmark datasets with different characteristics (number of
samples, variables and classes). These different datasets were considered in order to
significantly evaluate the classification performance of the considered algorithms in different
scenarios. The classification performances were compared with those of traditional classifiers,
such as K-Nearest Neighbor (KNN), Linear Discriminant Analysis (LDA), Partial Least
Square Discriminant Analysis (PLS-DA) and Tree-based classification models (CART).
For each dataset, classification models were validated and classification performances of the
classification methods were compared. K-CM showed the best classification performances in
validation and, on average, over performed the other classification methods.
167
Page 169
A COMPARATIVE STUDY ON DIFFERENT METHODS
FOR APPLICABILITY DOMAIN ASSESSMENT
V. Consonni, D. Ballabio, F. Sahigara, A. Mauri, M. Cassotti, F. Grisoni, and R. Todeschini
Milano Chemometrics and QSAR Research Group, Department of Earth and Environmental
Sciences, University of Milano-Bicocca, P.za della Scienza 1 – 20126 Milano, Italy
[email protected]
With the growing popularity of using QSAR predictions towards regulatory purposes, such
predictive models are now required to be strictly validated, an essential feature of which is to have
the model’s Applicability Domain (AD) defined clearly. Although in recent years several different
approaches have been proposed to address this goal, no optimal approach to define the model’s AD
has yet been recognized.
In this study, an extended comparison among different AD methods is performed on several data
sets with an aim to quantitatively evaluate their performance and similarities in characterizing the
interpolation space of the model.
All the AD methods relevant to this study were also implemented into a MATLAB toolbox, which
will be freely available for download in the near future.
168
Page 170
RESHAPED SEQUENTIAL REPLACEMENT
ALGORITHM (RSR) FOR VARIABLE SELECTION
Francesca Grisoni, Matteo Cassotti, Roberto Todeschini
Università degli Studi di Milano - Bicocca, Dept. of Earth and Environmental Sciences
P.zza della Scienza 1, 20126 Milano, Italy
E-mail: [email protected]
Variable selection (VS) is a key step in multivariate analysis for modelling purposes. It
consists in the selection of optimal subsets of variables, in order to obtain parsimonious
models and maximize their predictive power, also increasing interpretability. VS plays a
crucial role in scientific fields which deal with a large number of variables, such as QSAR.
Here we propose a VS method, named Reshaped Sequential Replacement (RSR), which takes
inspiration from the Sequential Replacement (SR) method of Miller1. In the SR method,
starting from a randomly generated population of models, each variable is replaced at a time
with all the remainders, searching if a better model is found. The new model is chosen after
all variables have been replaced and the obtained models have been compared. The extensive
exploration of possible combinations of variables is computationally very demanding,
especially when dealing with high dimensional problems. The RSR algorithm shares the
simplicity of SR method, being based on the same replacement procedure, but aims at
reducing the computational time needed and increasing the probability of convergence upon
optimal models. The principal functions able to "reshape" the SR method are: 1) Tabu list,
which consists in the preliminary exclusion of variables not correlated with the response that
can be re-included during a later replacement procedure if they provide a relevant
improvement in the quality of the model; 2) Roulette Wheel for the initialization of the
population, in which each variable is given a probability of entering the initial models
proportional to a pre-defined fitness function; 3) QUIK rule2, a statistical test used in
regression during the replacement procedure, in order to reject a-priori models affected by
high predictor collinearity.
169
Page 171
Table 1. Real datasets used: n = number of objects of training and test sets; p = number of variables.
Table 2. Simulated datasets: n = number of objects; p = number of variables; p' = number of variables used to generate the response.
The aim of the study was to: 1) understand how each of the new functions influences the
performance; 2) compare the performances of SR and RSR algorithms; 3) compare the
replacement methods with other VS methods. To this end, SR and RSR have been applied to
2 datasets for regression (using OLS) and 3 datasets for classification (using KNN) (Table 1).
Models available in the scientific literature
for each dataset and obtained by other VS
methods were used as benchmark for the
comparison. 2 of the 3 da tasets for
classification had a small number of
variables and therefore some random
variables were added, obtaining a total of
50 variables. Benchmark models were
then found using Genetic Algorithms. Furthermore, 6 simulated datasets with different
number of objects and different levels of noise
were tested in regression (Table 2). A DoE was
made for all the 11 datasets in order to understand
the influence of the new functions on the
performance. All models obtained were then
evaluated and compared using several statistical
tests and functions, such as Y-scrambling and R-function2 based rules.
Results highlighted the capability of the replacement methods to converge upon opt imal
solutions even with a small initial population of models. For RSR, the principal function able
to decrease the computational time with respect to SR is the Tabu list (up to about 10 times
faster). Roulette Wheel allows a quicker convergence upon opt imal solutions, reducing the
total number of models generated to reach the best solution. The effect of QUIK rule is
strongly dependent on the characteristics of the dataset. In the majority of cases, RSR
outperformed SR or the performances were comparable, with the advantage of the first of
being faster. Performance of RSR on real datasets is in most cases comparable with other VS
methods, such as Genetic Algorithms and Random Forest. In about 50% of the cases RSR
was able to reproduce the benchmark model.
Dataset Type n train n test p
LC503 Reg 408 57 899
Melting Point4 Reg 10000 2634 150
IRIS5 Class 150 - 50
ItalOils6 Class 572 - 50
Biodegradability7 Class 837 218 776
n p p' Noise %
500 500 5 0, 10, 15
100 500 5 0, 10, 15
170
Page 172
References
[1] Miller, A. J. Selection of Subsets of Regression Variables. Journal of the Royal Statistical
Society. Series A (General) 147, pp. 389–425 (1984).
[2] Todeschini, R., Consonni, V., Mauri, A. & Pavan, M. Detecting ‘bad’ regression models:
multicriteria fitness functions in regression analysis. Analytica Chimica Acta 515, 199–208
(2004).
[3] Pavan, M., Netzeva, T. I. & Worth, A. P. Validation of a QSAR model for acute toxicity.
SAR and QSAR in Environmental Research 17, 147–171 (2006).
[4] Lang, A. ONS CHALLENGE, Melting Point: Model001.
[5] Fisher, R. A. The Use of Multiple Measurements in Taxonomic Problems. Annals of
Eugenics 7, 179–188 (1936).
[6] Forina, M., Armanino, C., Lanteri, S. & Tiscornia, E. Classification of olive oils from
their fatty acid composition. Food Research and Data Analysis 189–214 (1983).
[7] Mansouri, K., Ringsted, T., Ballabio, D., Todeschini, R. & Consonni, V. QSAR models
for ready biodegradability of chemicals. J. Chem. Inf. Model. (2013). doi:10.1021/ci4000213.
171
Page 173
CHEMOMETRICS APPLIED TO THE ANALYTICAL STUDY
OF THE CONFORMATIONAL EQUILIBRIA OF CYTOSINE-RICH
DNA SEQUENCES
Sanae Benaboua, Anna Sadurnía, Ramon Eritjab, Raimundo Gargalloa
aDepartment of Analytical Chemistry, University of Barcelona, E-08028 Barcelona, Spain,
[email protected] bInstitute for Advanced Chemistry of Catalonia (IQAC-CSIC), CIBER-BBN Networking
Centre on Bioengineering, Biomaterials and Nanomedicine, Jordi Girona 18-26, E-08034
Barcelona, Spain
Cytosine-rich regions of DNA are capable of forming complex structures known as i-motif
(see left pannel). The formation of such structures in vitro has been demonstrated in DNA
sequences corresponding to the end of telomeres [1] and to the promoter regions of several
oncogenes, such as c-kit, c-myc or bcl-2 [2]. The existence of these structures in vivo is still a
matter of discussion because the stability of i-motifs is strongly dependent on pH , being
maximal at pH values near the pKa of the cytosine base (~4.5, right pannel).
Left: intramolecular i-motif structure. Right: C+•C, the constituent block of i-motif
In the present study, we have focused our attention on the influence of bases, such as thymine,
cytosine, adenine or guanine, located in the loops on t he overall stability of the i-motif
structures.
172
Page 174
Circular dichroism and molecular absorption spectroscopies have been used to monitor the
experiments (acid-base titrations and meltings) carried out. Multivariate data analysis based
on soft- and hard-modeling methods has been used to recover qualitative and quantitative
information about the species and conformations present in all experiments. The results show
that the application of a multivariate approach allows the succesful resolution of systems
involving i-motif structures.
References:
[1] S. Fernandez, R. Eritja, A. Aviñó, J. Jaumot, R. Gargallo. Influence of pH, temperature
and the cationic porphyrin TMPyP4 on the stability of the i-motif formed by the 5’-
(C3TA2)4-3’ sequence of the human telomere. Int. J. Biol. Macromol., Vol. 49, 729-736
(2011)
[2] P. Bucek; J. Jaumot; A. Aviñó; R. Eritja; R. Gargallo. pH-modulated Watson-Crick
duplex-quadruplex equilibria of guanine-rich and cytosine-rich DNA sequences 140 bp
upstream of the c-kit transcription initiation site. Chemistry-A European Journal, Vol. 15,
12663-12671 (2009).
173
Page 175
FAST VIRTUAL SCREENING OF ALKALOIDS FROM
APOCYNACEAE WITH POTENTIAL
ANTITRYPANOSOMAL ACTIVITY.
Marcus T. Scottia, Marcelo Sobral da Silvab, Ivan da R. Pittac, Luciana Scottia
aDepartamento de Engenharia e Meio Ambiente, Universidade Federal da Paraíba, Campus
IV, 58297-000, Rio Tinto, PB, Brazil. bLaboratório de Tecnologia Farmacêutica, Universidade Federal da Paraíba, Campus I,
50740-540, João Pessoa, PB, Brazil cDepartamento de Antibióticos, Universidade Federal de Pernambuco, 50670-910, Recife,
PE, Brazil
[email protected]
Chagas' disease is a human tropical parasitic disease, caused by Trypanosoma cruzi, which
occurs particularly in South America. The big social problem caused by this infection, the
restricted number of drugs available, their serious side effects and, the emergence of new drug
resistant forms, support the research for new antiprotozoal drugs. Secondary metabolites play
an important role to propose new promising active lead structures, and several studies
highlights antiprotozoal activities of alkaloids. In view of this, we performed a virtual
screening in an in-house databank (SISTEMATX) of 469 indole alkaloids of Apocynaceae,
corresponding to 861 b otanical occurrences (number of times that a compound appears in
different species) using fragment descriptors and Support Vector Machines (SVM). We select
from CHEMBL database a diversity set of 550 agrochemicals, 2-aryl-5-aminomethyloxazoles
and N-substituted pyridylamidoximes derivatives (document references CHEMBL1862790
and CHEMBL1857833), which were screened in vitro in a whole cell parasite assay against a
T. cruzi strain (Tulahuen, Clone 4 – CHEMBL assay 5693). T he SMILES code and
respective values of activity were downloaded and compounds were classified using values of
-logIC50 (mol/L) = pIC50, being 385 actives (>7) and 165 inactive (<6). SMILES were used
as input data in DRAGON program v. 6.0.30 to generate descriptors from Ring descriptors,
Functional group-counts and Atom-centred fragments blocks. Descriptors with constant
values, near constant values, standard deviation less than 0.0001, and at least one missing
174
Page 176
value were excluded, as well descriptors with pair correlation larger than or equal to 0.90.
Knime 2.7.1 software was used to perform all analysis process described hereinafter. The 146
remaining descriptors and class variable were exported and data were divided in train and test
set. Finally, 18 variables were selected by backward feature elimination method and all
models were generated using the WEKA nodes which perform SVM using Sequential
Minimal Optimization algorithm to classify the compounds, using fragment descriptors.
Table 1 summarizes the performed of the match rates of SVM model for the training, cross-
validation (12 stratified groups according activity class variable). Receiver Operating
Characteristics (ROC) plot was generated for test set with 0.895 area value under the curve.
Table 1. Summary of training and test and respective match results using SVM.
Train Validation Test
Samples Match %Match Match %Match Samples Match %Match
Active 308 305 99.0 303 98.4 77 77 100
Inactive 132 107 81.1 107 81.1 33 27 81.8
Overall 440 412 93.6 410 93.2 110 104 94.5
The SVM model selected only 5 similar alkaloids, as actives, from 2 s pecies of
Aspidosperma genus (excelsum and marcgravianum). The values of MLogP of these
structures are between 3.6 to 5.3 and, two alkaloids, isolated form A. excelsum passed to the
filter of Lipinski alert index and with values > 0.7 of Drug Like Score consensus. These
structures can be an interesting start point of antitrypanossal studies of alkaloids from
Apocynaceae. The methodology, adopted in this work, which was performed as part of the
activities of ResNetNPND (http://www.uni-muenster.de/ResNetNPND/), showed to be rapid
and can help to the process of virtual screening of larger natural products databases.
N CH3
N
HN
CH3OO
CH3N
CH3
O
O
OH
N CH3
N
HN
CH3OO
CH3N
H
OH
Figure 1. Selected structures with potential activity against T. cruzi
References
Schmidt J, Khalid AS, Romanha AJ, de Almeida Alves TM, Biavatti MW, Brun R, da Costa
FB, Lisboa de Castro S, Ferreira VF, de Lacerda MVG, Lago JHG, Leon L, Lopes NP, das
175
Page 177
Neves Amorim RC, Niehues M, Ogungbe IV, Pohlit AM, Scotti MT, Setzer WN, Soeiro
MNC, Steindel M, Tempone AG (2012) The Potential of Secondary Metabolites from Plants
as Drugs or Leads Against Protozoan Neglected Diseases - Part I and Part II. Current
Medicinal Chemistry, 19, 2128-2175 and 2176-2228.
176
Page 178
EVALUATION OF LIGANDS FOR KETONE REDUCTION BY
ASYMMETRIC HYDRIDE TRANSFER IN WATER BY
ULTI-SUBSTRATE SCREENING
Saoussen Zerora, Manhel Bennamanea Louisa. Aribi- Zouiouechea Jacqueline Collinb,
aLaboratoire de Catalyse Asymétrique Ecocompatible. LCAE., Université Badji Mokhtar,
23000 Annaba, Algérie,
bLaboratoire de Catalyse Moléculaire UMR 8182, ICMMO, Université Paris XI, 91405,
[email protected]
Nowadays a major concern for chemists is the design of new, low-cost and highly sustainable
methodologies following green chemistry principles. [1].The use of water as solvent allows
one to fulfill most of these requirements and catalysis in water represents a major area [2].
Asymmetric transfer hydrogenation in water is an alternative method to perform reactions
under mild conditions with high enantioselectivities and have been widely employed for the
preparation of chiral alcohols. In this area we have studied catalysts for ATH reduction of
ketones in water and reported on ruthenium-based catalysts which are reusable both with the
same substrate or changing the ketone for each reduction without a loss of enantioselectivity
[3].Various ligands for the ruthenium-catalyzed enantioselective reduction of ketones in water
have been investigated. Multi-substrate reactions have been carried out for the comparison of
various proline amides and aminoalcohol ligands. Two sets of six aromatic ketones have been
selected in order to evaluate the enantiomeric excesses of all the resulting alcohols by a single
chromatographic analysis. The proline amide derivative prepared from (1R, 2S)-cis-
aminoindanol revealed as the best ligand for most of the ketones used in the multi-substrate
reductions. This ligand has been employed for the enantioselective reduction of a variety of
other aromatic ketones and in all cases the enantiomeric excesses were improved compared to
those obtained with phenylprolineamide used in our previous work.
177
Page 179
Ar
O
Ar
OH2.5% [RuCl2(p-cymene)]2, 5% L
H2O, HCOONa, 30°C
Ar : Ph, m-C6H4, o-MeOC6H4, p-ClC6H4, 2-ClC6H5, C10H7
NH
O
NH
HO
Lee: 84-94%
4a, 4c, 4e-h 5a, 5c,5e-h
Analyse du mélange des énantiomères des alcools 5a, 5c, 5e-h par colonne chirale GC
Keywords: asymmetric catalysis; hydride transfer; multi-substrate screening; reduction;
ruthenium
References
[1] B. M. Trost, Science 1991, 1471 – 1477; b.) B. M. Trost Angew. Chem. Int. Ed. 1995, 107,
285 – 307; [2] S. Kobayashi, S. C. Ogawa, Chem. Eur. J. 2006, 12, 5954 – 5960;
[2] Zeror, S.; Collin, J.; Fiaud, J.-C.; Aribi-Zouioueche, L. J. Mol. Catal. A 2006, 256, 85–89.
5a 5g
5c
5h
5e5f
178
Page 180
CRYSTALLOGRAPHIC ELUCIDATION OF PURELY
STRUCTURAL, THERMAL AND LIGHT-INDUCED
SPIN TRANSITIONS IN AN IRON(II) BINUCLEAR
COMPLEX
Dalila Fedaouia,b,Yacine Bouhadjab, Patrick Rosaa
aInstitut de Chimie de la Matière Condensée de Bordeaux ICMCB-CNRS Université Bordeaux
I, 87, Av. Dr A.Schweitzer, 33608 PESSAC Cedex (France).
bBadji Mokhtar University Sidi Bp 12 - 23000 Annaba, Algérie.
[email protected]
The dinuclear complex [{Fe(bpp)(NCS)2}2(4,4’-bipy)]2MeOH (where bpp=2,6-bis(pyrazol-
3-yl) pyridine and 4,4’-bipy=4,4’-bipyridine) undergoes an incomplete (50%) spin crossover
below 120 K, as shown in Fig. 1, as well as photo-induced spin crossover at low temperatures
Such an incomplete transition may be viewed as the first step in a potentially 2-step spin
crossover material, in which the lower temperature step may not be observed at ambient
pressure The structural symmetry breaking is the result of torsion in the
central 4,4’-bipyridine unit, going from a conformation in which the two rings are
approximately planar at room temperature (the rings related to each other by an inversion
centre) to one in which they are twisted around the C–C bridging bond below 161 K. Using
evidence from DFT studies of 4,4’-bipy bridged systems it was argued that this twisting of the
bipyridine rings to some extent ‘‘switches off’’ communication between metal centres,
resulting in only the first step of a possible two-step spin crossover. No evidence was found of
any relaxation of the 1 : 1 HS : LS state towards a full low spin state. The effect of pressure
on the SCO phenomenon has been studied using a variety of techniques including
Mossbauer, infra-red, Raman optical and X-ray spectroscopies, RPE spectroscopy,
reflectivity, magnetometry and X-ray diffraction. Such investigations have enhanced
179
Page 181
understanding of how pressure influences SCO and led to the development of various
theoretical models15 to describe the pressure-driven process.
Figure 1
Keywords: dinuclear, iron (II), Mossbauer and magnetism, spin crossover.
180
Page 182
IMPROVED VISUALIZATION USING OPLS WITH SENSORY
AND QUALITY DATA.
Martin Berntsson, Johan Hultman,
Umetrics AB, Stortorget 21, 21134 Malmö, Sweden.
[email protected]
The intent with the presentation is to describe an alternative to PLS that is called OPLS.
OPLS has certain model interpretation properties rendering the method more tractable than
PLS; these properties will be highlighted. In so doing, we shall discuss OPLS from theoretical
as well as practical perspectives. We will also clearly distinguish between single-Y and multi-
Y OPLS models. Much like the standard applications using PLS, the current presentation will
provide a walk-through of the OPLS method, containing examples of which parameters are
available for model interpretation. Although the beam of light is directed onto OPLS, we will
provide a comparison with PLS, so that the interpretational advantages of OPLS become
clear. As example application sensory data from the food industry will be used.
Multivariate tools can assist in monitoring and quality by
i) Making the loadings more useful
In a multi component (A>1) PLS model interpretation is always difficult. This due to the fact
that all component correlate to Y. The situation in very different for single-Y OPLS, where
only the 1st component correlate to Y and later components are orthogonal to Y. This makes
visualization and interpretation of the model clearer.
ii) Deciding the direction of your projection
We often use PCA as a projection tool for deeper data understanding. One property of the
PCA model is that it r otates the model for maximum description. OPLS allows us to
determine the horizontal direction. This linear direction is retained for both scores and
loadings, and makes understanding of data easier.
iii) Discriminant analysis using OPLS (OPLS-DA)
181
Page 183
Again, the group separation is on the first component (horizontal axis). This is the same for
the loadings, where the discriminating variables are easily identified. Just as for PLS, but
“rotated”. The second component describes the common within group variation, orthogonal to
the first, with its corresponding loadings. Excellent for both identifying similarities and
differences
References
Multi- and Megavariate Data Analysis Part I, Basic Principles and Applications, Second
revised and enlarged edition, L. Eriksson, E. Johansson, N. Kettaneh-Wold, J.Trygg, C.
Wikström, and S. Wold
Design of Experiments: Principles and Applications, L. Eriksson, E. Johansson, N. Kettaneh-
Wold, C. Wikström, and S. Wold
182
Page 184
PLS-DA OF GAS AND LIQUID CHROMATOGRAPHIC
FINGERPRINTING FOR AUTHENTICATION OF PALM OIL
Cristina Ruiz-Samblás a, Alba Tres b, Saskia van Ruth b, Antonio González-Casado a, Luis Cuadros-Rodríguez a
a University of Granada, Department of Analytical Chemistry, c/Fuentenueva, s.n, Granada
E-18071, Spain, [email protected] b RIKILT Wageningen University and Research Centre, Akkermaalsbos 2, Wageningen, 6708
WB, The Netherlands
Partial least squares-discriminant analysis (PLS-DA) is an appropriate class-modeling and
prediction technique. It was applied to discriminate the geographical origin of palm oils from
south eastern Asia, Africa and South America. The authentication was based on liquid and gas
chromatographic fingerprints of triacylglycerols (TAGs), without either identification or
quantification of the chromatographic peaks before building the chemometric models. The
geographical origin of palm oils with the use of the raw chromatograms and chemometrics
tools had not been studied yet in bibliography. However, it has been previously reported by
the fatty acid (FA) and volatile organic compound (VOC) fingerprints [1].
The results show that it is possible to perform classification models for palm oil samples from
either liquid or gas chromatographic raw data based on their TAG profile since they present
different elution features The proposed method provides a rapid methodology for palm oil
classification according to geographical origin and could serve as a traceability analytical tool
to verify the labeling compliance of the oil. The rates of successful in prediction of the
geographical origin of the 85 samples varied between 90 and 100%. The results for both kinds
of data are compared.
References
[1] Tres A, Ruiz-Samblas C, van der Veer G, van Ruth SM (2013) Geographical provenance of palm oil by fatty acid and volatile compound fingerprinting techniques. Food Chemistry, 137, 142–150.
183
Page 185
HANDLING TRACEABILITY ISSUES IN FOOD: A
CHEMOMETRICS APPROACH FOR ENOLOGICAL
PRODUCTS
Lucia Bertacchini, Carlo Baschieri, Alex Berni, Marina Cocchi, Caterina Durante,
Daniela Fontana, Claudia Grillenzoni, Mario Li Vigni, Andrea Marchetti, Maurizio
Mazzucchelli, Michele Silvestri and Simona Sighinolfi
Università di Modena e Reggio Emilia, Dipartimento di Scienze Chimiche e Geologiche, via
Campi 183, Modena, 41125, Italy
[email protected]
The interest toward the geographical origin of food has increased over the last years, mainly
as a consequence of the globalization of food market. The link between the product and the
territory of origin has been recognized by the European Union as a quality attribute, through
the introduction of protected marks, such as the Protected Designation of Origin (PDO) and
Protected Geographical Indication (PGI). In this context, the possibility to identify objective
criteria for the geographical traceability of food represents a challenging target, useful for the
valorization of food products.
The main research project, which this work belongs to, is focused on the development of
geographical traceability models concerning Italian PDO wines, such as Lambrusco of
Modena and Trentodoc. In particular, the following aspects are taken into consideration: 1)
identification of the suitable traceability indicators, 2) optimization of the analytical
methodologies for their determination, 3) planning of a representative sampling (for both soils
and food) and 4) study of the indicator’s behavior with respect to soil variability, plant uptake
and winemaking chain influence.
A synergistic approach between analytical methods and multivariate data analysis is here
presented to investigate some of the abovementioned aspects, in order to obtain information
about the analyzed system. Given the extension of the investigated geographical areas, a pilot
study was conducted on four farms, representative of the Lambrusco production areas and
characterized by a complete enological chain. In particular, to obtain more detailed
information on the soil sampling procedure, in terms of inter and intra site variability,
184
Page 186
sampling depth and seasonal variability, a fast screening approach of the soil samples was
carried out by means of X-ray diffraction of powder and chemometrics analysis of the
obtained signals. As processing step, noise reduction and background correction were
achieved in wavelet domain; then the diffractograms were aligned and a block-scaling
procedure was applied. Finally, Principal Component Analysis (PCA) and PARAFAC
analyses were used as explorative data analysis tools [1].
On the basis of the obtained results, it was possible to reduce the number of soils to be
sampled and further analyzed, while maintaining an exhaustive description of the investigated
production areas. The 87Sr/86Sr isotope ratio was used as geographical tracer [2, 3] and thus
measured in several matrices of the considered oenological chains, namely soil – branch –
grape juice. PCA was used as exploratory analysis in order to investigate the potentiality of
the investigated parameter. The results highlight a good match between the isotopic values
monitored in the soil fractions mimicking the bio-available part and their respective grape
juices for almost all the investigated geographical areas. The correlation with food matrices
satisfyingly improves when the isotopic values of vine branches are considered.
References
[1] Bertacchini L, Durante C, Marchetti A, Sighinolfi S, Silvestri M, Cocchi M (2012) Use of
X-ray diffraction technique and chemometrics to aids oil sampling strategies in traceability
studies. Talanta, 98, 178–184.
[2] Horn P, Schaaf P, Holbach B, Hölzl S, Eschnauer H (1993) 87Sr/86Sr from rock and soil
into vine and wine. Z Lebensm Unters Forsch, 196, 407–409.
[3] Di Paola-Naranjo R, et al. (2011) Fingerprints for main varieties of Argentinean wines:
terroir differentiation by inorganic, organic, and stable isotopic analyses coupled to
chemometrics. J Agric Food Chem, 59, 7854–7865.
185
Page 187
FOOD QUALITY CONTROL: APPLICATION OF NEAR
INFRARED SPECTROSCOPY FOR DRIED EGG-PASTA
CHARACTERIZATION
Marta Bevilacqua, Stefano Materazzi, Remo Bucci, Federico Marini
Dept. Chemistry, University of Rome “La Sapienza”, P.le Aldo Moro 5, I-00185, Rome, Italy
E-mail: [email protected]
Food quality control is not an optional extra in food processing; neither is it something done
only by large manufacturers. It is an essential component of any food processing business.
Quality control need not be time consuming or expensive, and the results of quality control
tests should help save money in the long run. In general, quality control procedures should be
as simple as possible and only give the required amount of information. Quality control is
used to predict the quality of the processed food and then control the process so that the
expected quality is achieved for every batch. This means that quality specifications must be
written and agreed with suppliers or sellers, and control points must be identified in the
process. Today pasta has become a d ietary staple all over the world. Dried egg-pasta is
important in the market, since the range of about 50 different dried egg pasta shapes reflect
traditional regional Italian cuisine. The success is due to the unique characteristic that dried
egg-pasta looks and tastes like home made and is available in many unusual shapes and sizes.
When considering dried egg-pasta, three are the main parameters which can affect the quality
of the final product, drying time and temperature, and the amount of eggs used. Indeed, on
one hand, thermal processes, have an influence on the quality of pasta on a macromolecular
level due to reciprocal interactions between proteins and starch. In particular, changes in dried
and in cooked pasta structure were determined regarding protein solubility, thermal properties
and digestibility of starch, microscopic and rheological measurements. On the other hand, the
color, taste, flavor, texture and cooking properties of different dry pasta products are
determined primarily, besides the quality of ingredients used, by the quantity of eggs added.
Based on t hese considerations, in this study the possibility of using NIR spectroscopy as a
rapid and non de structive tool to assess dried egg pasta quality was investigated, by
determining the influence of the three main parameters (egg percent amount, drying
186
Page 188
temperature and drying time) on the spectroscopic fingerprint of the final product. Reference
pasta samples were prepared with different egg percent concentration (20%, 22%, 25%, 27%,
30% and 33%), and different drying temperatures and times were tested. The results show that
all of the three parameters have a relevant impact on the shape of the spectroscopic signal.
Therefore, NIR spectroscopy appears a very promising tool to be applied at-line in pasta
industry since it is able to monitor the modifications induced by the change of each
considered parameter. A similar approach has never been reported in the literature, where
only one study can be found and it is simply voted to the egg percent determination of few
commercial samples.
References
M. Fodor, A. Woller, S. Turza and T. Szigedi. (2011) Development of a rapid, nondestructive
method for egg content determination in dry pasta using FT-NIR technique. Journal of food
engineering, 107, 195–199.
M. Bevilacqua, S. Materazzi, R. Bucci, F. Marini (2012) Application of near infrared (NIR)
spectroscopy coupled to chemometrics for dried egg-pasta characterization and egg content
quantification. Food Chemistry, in press. doi: 10.1016/j.foodchem.2012.11.018.
187
Page 189
USING THE LC-FINGERPRINT OF STEROLS FRACTION TO
DISCRIMINATE OLIVE OIL FROM OTHERS EDIBLE OILS.
E. Pérez-Castaño, M.G. Bagur González, D. Gázquez-Evangelista, M. Sánchez-Viñas.
University of Granada, Department of Analytical Chemistry, Faculty of Sciences,
Avda. Fuentenueva, s/n, Granada, E-18071, Spain
[email protected]
The main objective of this work is the discrimination of the olive oil from other vegetable oils
(soybean, sunflower, rapeseed, canola, corn and pomace) through the fingerprint of the sterol
fraction, obtained by Liquid Chromatography with Ultraviolet-Visible detection (HPLC-UV).
Figure 1 shows, as an example, the chromatogram obtained after injecting 20 µ L of the
unsaponifiable extract of an oil sample analyzed using the operation conditions indicated. In
the chemometric study, from the whole chromatograms obtained for 51 samples of different
oils (6916 variables per chromatogram) a raw data matrix (51x2001) corresponding to the
sterols fraction (obtained in a windows time of 7.5 t o 9.5 minutes), has been selected as
chromatographic fingerprint.
Previously to the development of
any model, the raw data has been
preprocessed using next steps: (i)
correction of the baseline (in
order to remove baseline
contributions to the data); (ii)
smoothing of the variables using
a polynomial of second degree
(Savitsky-Golay method); and
(iii) data set mean centered.
In order to observe the natural
grouping of the sterols LC-
Figure 1. Procedure for obtaining the sterols fraction LC-fingerprint
of a vegetable oil sample.
188
Page 190
fingerprints, principal components (PCA) and hierarchical cluster (HCA) analysis have been
used as unsupervised pattern recognition techniques, in both cases, the olive oil
chromatographic fingerprint differs from the rest of vegetable oils (Figure 2). In the case of
PCA, 4 PCs have been needed in order to explain a 78% of the total variance and five groups
have been observed: Group I: extra-virgin olive; Group II: rapeseed/canola; Group III:
sunflower; Group IV: pomace and corn, and Group V: Soybean. For HCA, the Euclidean
distance of the scores obtained from PCA and Ward method have been used, using a Dlinkage =
0.66 Dmax two natural groupings have been observed, one for olive oil and one for the rest of
edible oils analyzed.
(a)
(b)
Figure 2. Natural groupings obtained from (a) PCA and (b) HCA.
Finally, in order to discriminate among the edible oils, a partial least squares discriminant
analysis (PLS-DA) as supervised pattern recognition technique has been used. According to
HCA two classes were defined: Class I: Olive oil and Class II: Rest of the edible oils. The
validation of the model has been made in two ways: (i) with a cross-validation using venetian
blinds (with 7 splits), and (ii) externally using the 25% of the samples studied. In spite of
natural grouping observed in PCA, and accordingly with HCA, the 5 LVs selected (explaining
83.04% of Block X and 95.31 % of Block Y variances of the classification set) permit to
discriminate between two classes: olive oil and the rest of oils analyzed (soybean, sunflower,
rapeseed, canola, corn and pomace).
189
Page 191
FT-IR-PCA STUDY OF COMPOSITIONAL DIFFERENCES IN
EXTRACTS OF SUNNY AND SHADED ARABIC COFFEE
LEAVES PLANTED IN RECTANGULAR AND SQUARE
ARRANGEMENTS
Ieda Spacino Scarminio, Fernanda Delaroza, Miroslava Rakocevic, Roy Edward Bruns,
Galileu Bernades Malta, Carlos Alberto Rossi Salamanca Neto.
Universidade Estadual de Londrina, Departament of Chemistry, Rodovia Celso Garcia Cid
km 380, 86051-980, Londrina, Paraná, Brasil.
Coffee is one of the most popular and consumed drinks in the world. Owing to its economic
importance hundreds of scientific papers can be encountered in the literature focusing on
species discrimination or compositional differences of raw and roasted coffee beans [1].
However no article has been found relating plant architecture and chemical digital fingerprints
for Arabic coffee leaves. Plant architecture is directly or indirectly related to multiple plant
functions, like light interception, photosynthesis and transpiration [2]. In plants, especially in
medicinal and alimentary ones, the environmental conditions induce some physiological
reactions [3] closely related to the biochemical changes observed in their metabolism that
may be important for bean quality. The Agronomic Institute of Paraná (IAPAR), located in
Londrina, Brazil contains a collection of 144 accessions of C. arabica collected in Ethiopia,
region of the species' origin. This collection has been used as the basis for genetic
improvements at IAPAR. Considering these facts the main objective of this work is to
investigate compositional variations of different extracts of Arabic coffee leaves in order to
discriminate vegetable architecture by Fourier Transform Infrared Spectroscopy (FTIR).
The coffee trees were planted in a rectangular arrangement of 3.0m x 0.41m with a space of
1.25 m2 for each plant ( 8,000 plants ha-1) and a square arrangement of 0.84 x 0.84 m2 with a
space of 0.71 m2 for each plant (14,000 plants ha-1). The leaves were collected from the
vertical plant strata (shaded and sunny ones). To perform extractions, 2.50 g of dried arabica
coffee leaves were weighed and macerated ultrasonically for 120 min in 60 mL of solvent
extractor. Solvent mixtures followed a statistical simplex-centroid design consisting of
190
Page 192
ethanol (et), acetone (ac), dichloromethane (dc) and hexane (hx) pure solvents, six 1:1 binary
mixtures of these solvents, four ternary mixtures in equal proportions and one quartenary
1:1:1:1 mixture [4]. The leaves were collected at the Agronomic Institute of Parana on April
10, 2010.
The score graphs of the first five principal components showed that ethanol:acetone and
ethanol:dichloromethane mixtures discriminate the square and rectangular arrangements of
the shaded plants. The ternary ethanol:dichloromethane:hexane mixture discriminated these
arrangements in the sunny areas. New extracts were prepared in triplicate using the best
separation conditions found and their infrared spectra were subjected to principal component
analysis. Figure 1 shows this score graph of the first and fifth factors that explain 99,89% of
the total data variance.
ea ea
ea
ea
eaea
edh
edhedh
edh
edhedh
0,3 0,4 0,5 0,6 0,7 0,8 0,9 1,0
Factor 1
-0,08
-0,06
-0,04
-0,02
0,00
0,02
0,04
0,06
0,08
0,10
Fact
or 5
3500 3000 2500 2000 1500 100090
93
96
99
Reflectâ
ncia
(%
)
Wavenumber (nm)
ea(1)
ea(2)
ea(3)
3500 3000 2500 2000 1500 100090
93
96
99
Ref
lect
ânci
a (%
)
Wavenumber (nm)
(ea)(1) (ea)(2)
(ea)(3)
3500 3000 2500 2000 1500 100090
93
96
99
Refle
ctânci
a (%
)
Wavenumber (nm)
edh(1)
edh(2)
edh(3)
shaded leaves/rectangular arrangement
sunny leaves/square arrangement
shaded leaves/square arrangement
sunny leaves/rectangular arrangement
3500 3000 2500 2000 1500 1000
90
92
94
96
98
100
Ref
lect
ânci
a (%
)
Wavenumber (nm)
edh(1)
edh(2)
edh(3)
Figure 1. Arabic coffee L. samples from square and rectangular arrangements for extracts
prepared with ethanol:acetone and ethanol: dichloromethane:hexane under sunny and shaded
conditions.
The spectra of the ethanol:acetone extract for the shaded leaves of the rectangular
arrangement on the left of the graph are discriminated from shaded leaves of the square
arrangement owing to weaker reflectance bands in the 3037-3645 cm-1 region that can be
attributed to phenols and also in the 664-1674 cm-1 region that is attributable to carbonyl
compounds. The spectra of the ethanol:dichloromethane:hexane extracts how differences at
1649 cm-1 that can be related to different tertiary amide concentrations.
191
Page 193
References
[1] Kitzberger C S G, Scholz M B, Silva J B G D da, Benassi M de.(2010). Braz. J. Food
Techn, 6, 39–48.
[2] Sinoquet H, Stephan J, Sonohat G, Lauri P E, Monney P, (2001) Plant, Cell and
Environment,. 24, 395-406.
[3] Rakocevic M, Medrado M J S, Lucambio F e, Valduga A T. (2006), In 4th.South -
American Congress of Yerba-Mate, 31-36.
[4] Risso W, Scarminio I S, Moreira E G. (2010), Indian Journal of Experimental Biology,
48, 811-816.
192
Page 194
INVESTIGATION ON THE POSSIBILITY OF
CHARACTERIZING THREE MONOVARIETAL
EXTRAVIRGIN OLIVE OIL FROM MARCHE BY
SPECTROSCOPIC AND CHEMOMETRIC METHOD.
Paolo Contia, Mario Berrettonib, Fabio Bruzzechessec, Mirko Marangonic,
Fabio Paparonic, Demetrio Ruffinid, Silvia Zamponia
aScuola di Scienze e Tecnologie - sezione Chimica, Università di Camerino, Via S. Agostino 1
– 62032 Camerino ITALY bDipartimento di Chimica Fisica ed Inorganica, Università di Bologna e Unità di Ricerca
INSTM di Bologna, Viale del Risorgimento 4, 40136 Bologna, ITALY cAnalisi Control S.r.l. - Via San Claudio, 5 - 62014 Corridonia (MC), ITALY
dStudio Agronomico Demetrio Ruffini Via Piano, 9, Colmurano, Macerata, 62020 Italy
E-mail [email protected]
There is a g rowing wealthy niche market for some extra virgin olive oil of special
organoleptic characteristics related to the traditional cultivars and cultivation methods[1]. It is
of special importance to develop analytical methods to recognize and protect these valuable
oils.
Several authors studied the possibility to characterize olive oil by means of aspecific
measurements with respect to the orchard location or the vegetal variety. NIR and MIR
signals were analysed by LDA to assess the botanical variety of Italian monovarietal olive oil
[2]. Ligurian oils were classified combining head-space mass spectrometry (electronic nose),
UV–visible and NIR spectroscopy [3]. Forina and coworkers [4] investigated the possibility
to compute QDA and SIMCA models from UV-Vis spectroscopy to classify the West Liguria
PDO “Riviera Ligure-Riviera dei fiori” extra virgin olive oil.
In the present work we investigate the possibility to recognize the geographical and/or varietal
origin of extra virgin olive oil (EVOO), obtained from three olive variety of Marche in central
Italy, through instrumental methods and chemometric data treatments. Sampling were
conducted in restricted areas typical for each olive variety, in particular we got oil of Mignola
193
Page 195
in the landscape near Cingoli, Piantone di Mogliano around Mogliano and Coroncina near
Caldarola; all samples were provided by the farmers that guarantee the authenticity.
Spectroscopic measurements were performed: UV-Vis spectra were acquired with a UV-vis
Varian Cary 50 Scan spectrophotometer the IR spectra were obtained with a P erkin Elmer
spectrum 100 F T-IR with ATR and the X-ray fluorescence was measured by a E D-XRF
Shimadzu 800HS2 with a 10 mm collimator.
Some analyzing methods as PLS-DA, LDA, SIMCA and UNEQ were applied to the data to
compare their performance. The considered spectroscopies were suitable to classify the
samples, as shown in the figure, but they have different prediction ability. UV-Vis
spectroscopy coupled to LDA or PLS-DA data treatment permitted both a good classification
and prediction ability.
Figure 1: Prediction of all the samples using PLS-DA models with 11 latent variables
computed on SNV plus autoscaled data UV-Vis measurements. Box A show prediction with
respect to the model of Coroncina, box B versus model of Mignola and box C versus the
model of Mogliano.
References
[1] ASSAM Marche and CNR-IBIMET. http://www.olimonovarietali.it/database
[2] Casale Monica, Sinelli Nicoletta, Oliveri Paolo, Di Egidio Valentina, Lanteri Silvia (2010)
Chemometrical strategies for feature selection and data compression applied to NIR and MIR
spectra of extra virgin olive oils for cultivar identification. Talanta, 80, 1832–1837.
[3] Casale Monica, Casolino Chiara, Oliveri Paolo, Forina Michele (2010) The potential of
coupling information using three analytical techniques for identifying the geographical origin
of Liguria extra virgin olive oil. Food Chemistry, 118, 163–170.
[4] Forina Michele, Boggia Raffaella, Casale Monica (2007) The information content of
visible spectra of extra virgin olive oil in the characterization of its origin. Annali di Chimica,
97, 615-633.
-1.0
-0.5
0.0
0.5
1.0
1.5
-0.5
0.0
0.5
1.0
1.5
-0.5
0.0
0.5
1.0
1.5
Experimental category: Carboncella Ccoroncina Frantoio Mignola MoglianoModel of category: Coroncina, Mignola, Mogliano
A
B
C
194
Page 196
PREDICTING SOLUBLE SOLID CONTENT IN INTACT
JABOTICABA [MYRCIARIA JABOTICABA (VELL.) O.
BERG] FRUIT USING NEAR-INFRARED SPECTROSCOPY
AND CHEMOMETRICS
Nathália Cristina Torres Mariania, Rosangela Câmara da Costab, Kássio Michell Gomes
de Limab, Viviani Nardinia, Luís Carlos Cunha Júniora, Gustavo Henrique de Almeida
Teixeiraa
aUniversidade de São Paulo (USP), Faculdade de Ciências Farmacêuticas de Ribeirão Preto,
Departamento de Análises Clínicas, Toxicológicas e Bromatológicas. Av. do Café, s/n.
Campus Universitário da USP, Ribeirão Preto, CEP 14040-903, São Paulo, Brazil
bUniversidade Federal do Rio Grande do Norte, Programa de Pós-Graduação em Química,
Grupo de Pesquisa em Quimiometria Aplicada, CEP 59072-970, Natal, RN, Brazil
[email protected]
The aim of this study was to evaluate the potential of near-infrared reflectance spectroscopy
(NIR) as a rapid and non-destructive method to determine soluble solid content (SSC) in
intact jaboticaba [Myrciaria jaboticaba (Vell.) O. Berg] fruit. Samples of jaboticaba with a
SSC ranging from 12.1 to 23.5 °Brix were collected from Casa Branca – São Paulo State,
Brazil. The NIR spectra were acquired in the 1000–2500 nm range. Multivariate calibration
techniques were compared with pre-processed data and variable selection algorithms, such as
partial least squares (PLS), interval partial least squares (iPLS), a genetic algorithm (GA), a
successive projections algorithm (SPA) and nonlinear techniques (BP-ANN, back propagation
of artificial neural networks; LS-SVM, least squares support vector machine) were applied to
building the calibration models. The PLS model produced prediction accuracy (R2=0.71,
RMSEP=1.33 °Brix, and RPD=1.65) while the BP-ANN model (R²=0.68, RMSEM= 1.20 oBrix, and RPD=1.83) and LS-SVM models achieved lower performance metrics (R2=0.44,
RMSEP=1.89 oBrix, and RPD=1.16). These results suggest that the PLS model is a promising
method for optimizing the efficiency of NIR spectral calibration models to predict SSC in
jaboticaba fruit.
195
Page 197
References
[1] Maria RCI, Kássio MGL, Valquiria GL, José DCP, Gustavo HAT (2013). Total
anthocyanin content determination in intact açaí (Euterpe oleracea Mart.) and palmitero-
juçara (Euterpe edulis Mart.) fruit using near infrared spectroscopy (NIR) and multivariate
calibration. Food Chemistry, 136, 1160-1164.
196
Page 198
TOWARD SPECIES-INDEPENDENT FOODSTUFF
AUTHENTICATION FROM SPECTRAL DATA: THE CASE OF
FRESH AND FROZEN-THAWED FISH
Pierantonio Faccoa, Matteo Ottaviana, Luca Fasolatob, Massimiliano Baroloa
aCAPE-Lab, Computer-Aided Process Engineering Laboratory,
Department of Industrial Engineering, University of Padova,
via Marzolo 9, 35131 Padova (Italy)
bDepartment of Biomedicine and Food science, University of Padova,
viale dell'Università 16, 35020 Legnaro PD (Italy)
E-mail: [email protected]
The substitution of fresh fish with frozen-thawed fish is a t ypical fraud that damages consumers
from an economic point of view and causes health and safety issues (Pavlov, 2007). Several
methodologies have been proposed for fresh fish authentication (Duflos et al., 2002; Bozzetta et al.,
2012). However, the classification ability of the majority of them is strongly affected by the species
under investigation, the integrity of the product, or by its shelf life.
In this work, three different strategies based on latent variable modeling techniques and nearinfrared
spectroscopy are explored to develop a multi-species classifier in order to discriminate between
fresh and frozen-thawed fish.
The first strategy is based on a Partial Least Squares Discriminant Analysis (PLSDA; Barker and
Rayens, 2003) model built on spectra from samples of different species. The second strategy is a
two-level PLSDA model: the first-level PLSDA splits the samples according to their species, and
the second-level PLS-DA, tailored on each species, classifies the samples status (i.e., fresh or
frozen-thawed). The third strategy uses Orthogonal Partial Least Squares Discriminant Analysis
(OPLSDA; Trygg and Wold, 2002) to jointly remove the variability in the data that is not related to
the fresh/frozen-thawed status and species-independently classify the samples.
The three strategies are tested on a database of spectra collected with two NIR instruments from
more than 1200 samples of fish, using also samples of species not included in the calibration data.
This study demonstrates the effectiveness of NIR spectroscopy as a screening method for
fresh/frozen-thawed fish authentication, and the possibility of working on a multi-species database
197
Page 199
(considering also species not included in the calibration data) without the need of tailoring the
classification model on a specific species.
References
Barker M, Rayens W (2003). Partial least-squares for discrimination. J. Chemom., 17, 166-
173.
Bozzetta E, Pezzolato M, Cencetti E, Varello K, Abramo F, Mutinelli F, Ingravalle F,
Teneggi E (2012). Hystology as a valid and reliable tool to differentiate fresh from frozenthawed
fish. J. Food Protect., 75, 1536-1541
Duflos G, Le Fur B, Mulak V, Becel P, Malle P (2002). Comparison of methods of
differentiating between fresh and frozen-thawed fish or fillets. J. Sci. Food Agric., 82, 1341-
1345.
Pavlov A (2007). Changes in the meat from aquaculture species during storage at low
temperature and attempts for differentiation between thawed-frozen and fresh chilled meat. A
review. Bulg. J. Vet. Med., 10, 67–75.
Trygg J, Wold S (2002). Orthogonal projections to latent structures (O-PLS). J. Chemom.,
16,119-128.
198
Page 200
NIR APPLICATION TO UNMASKING ADULTERATION OF
TAGGIASCA OLIVES IN BRINE
Remo Simonettia, Maria Chiara Casolinoa, Monica Casalea, Paolo Oliveria, Lucia Bagnascoa,
Luca Medinib, Silvia Lanteria
aDepartment of Pharmacy, University of Genoa, I-16147, Genoa, Italy
bSpecial Company for Professional Training and Technological and Commercial Promotion of the
Chamber of Commerce of Savona, I-17031 Albenga (SV), Italy
[email protected]
Due to their appreciated sensory features associated with a low annual yield, commercial olives in
brine of cultivar Taggiasca, a traditional product of Liguria, an Italian region, are potentially subject
to falsifications, in particular by cultivars Leccino and Coquillo, morphologically very similar to
Taggiasca olives but less expensive [1][2]. The objective of this study was to determine the amount
of olive of different cultivar added in Taggiasca samples based on NIR spectra information.
Olive in brine samples provided by certified producers and representative of the production of
Taggiasca olives were collected, together with a balanced number of samples of cultivars Leccino
and Coquillo. They were washed with water, dried and stoned, then the pulp was ground and used
for spectroscopic analysis. NIR measurements were performed in reflectance mode using a FT-NIR
Buchi (NIRFlex N-500). After recording the spectra of all the pure olive samples, Taggiasca olives
were blended with Leccino and Coquillo samples; the blending degree were between 5 and 50
w/t%.
Principal Component Analysis (PCA) was applied for visualising pure samples after data pre-
treatment (SNV and first derivative). Partial least squares regression (PLS) was employed to build
the models aimed at predicting the amounts of Leccino or Coquillo in Taggiasca samples. The
optimal complexity – i.e., the number of latent variables to be used for building the models – was
estimated by a cross-validation procedure. The prediction ability of PLS models, either on the full
spectra or after variable selection, was evaluated on two independent external test sets. The
predictive ability of the models after variable selection was similar to that of PLS applied on the
whole spectral range. However, variable selection helped to determine the spectral regions most
useful to identify the adulteration of Taggiasca olives with Leccino and Coquillo cultivars. All the
models showed a satisfactory predictive ability.
199
Page 201
The potential of NIR and multivariate analysis to detect the adulteration of Taggiasca olives
products was demonstrated. NIR spectroscopy can be a promising procedure to be considered in
future applications to detect and quantify different adulterants in Taggiasca olives products. Sample
collection and analysis should be performed through a number of years, in order to account for
variability factors closely related to the harvest and to obtain models characterized by a global
applicability.
References
[1] Casale, M., Zunin, P., Cosulich, M.E., Pistarino, E., Perego, P., Lanteri, S. (2010).
Characterisation of table olive cultivar by NIR spectroscopy. Food Chemistry, 122, 1261-1265.
[2] Christy, A.A., Kasemsumran, S., Du, Y., Ozaki, Y. (2004). The detection and quantification of
adulteration in olive oil by near-infrared spectroscopy and chemometrics. Analytical Science, 20,
935-940.
200
Page 202
PRELIMINARY STUDY OF THE EFFECT OF CLIMATE
VARIABLES ON THE RELATIONSHIP BETWEEN
AMINOACIDS IN GRAPE MUST AND AROMAS IN RED
WINE OF THE TEMPRANILLO VARIETY
Santiago Maspocha, Jordi Coelloa, Juan Cachob, Vicente Ferreirab, Mª Jesus Ibarzc
aDepartamento Química, Facultas Ciencias, Universidad Autónoma de Barcelona, Bellaterra
08193, España; bDepartamento de Química Analítica, Facultad de Química, Universidad de Zaragoza,
Zaragoza, 50009, España; c) Servicio Análisis Químico, Universidad Autónoma de
Barcelona, Bellaterra, 08193, España
[email protected]
The amino acids present in the grape must are the primary source of nitrogen for the yeast in
the fermentation process to obtain the wine. Moreover, it is well known that the amino acid
metabolic pathways lead to the formation of the majority of wine aromas. While it has been
possible to establish well-defined routes for the formation of some specific aromas, it can be
said that this is an intrinsically complex process where the final profile of aromas in wine is
related to initial amino acid profile of the grape juice in a not well defined multivariate way.
Previous studies clearly demonstrate the impact of the amino acid profile on the characteristic
flavors of some wine varieties; it has also been studied the effect of the controlled addition of
some amino acids in the grape must and how this addition is reflected in the increase/decrease
of concentration of aromas. However, a systematic study linking the amino acid profile of
grapes with the wine aroma profile in relation to climatic variables is still missing.
In the context of a project to systematically study the effect of climate variables on grape and
wine, in this communication we present the relationship of amino acids and major aromas in a
Spanish grape: tempranillo. Data from two different vintages (both grapes and produced
wines) and two areas of Spain, with a very distinct climatology (continental and
mediterranean) are analyzed. As essential climate variables we have chosen the Growing
Degree Day (GDD) and water supply (rain and irrigation). Preliminary results on the
201
Page 203
relationship between amino acids, aromas and climatology obtained from the analysis of
PCA, PLS and canonical correlation are reported.
202
Page 204
EFFECT OF CLIMATE CHANGE ON WINE AROMA
PRECURSORS COMPOSITION OF Vitis vinifera L. cv.
TEMPRANILLO GRAPES
Jordi Coelloa, Santiago Maspocha, Juan Cachob, Vicente Ferreirab
aDepartamento Química, Facultas Ciencias, Universidad Autónoma de BarcelonaBellaterra
08193, España; bDepartamento de Química Analítica, Facultad de Química, Universidad de Zaragoza,
Zaragoza, 50009, España
[email protected]
One of the best known effects of global warming associated with climate change is the
increasing gap between the alcoholic and aromatic maturity. In the framework of a project
aimed to study the influence of warming on different variables of both grape and wine, in this
paper we show the evolution of the precursors of aroma, present at a very low concentration
(µg/L grape juice), in grapes of the Tempranillo variety from a Spanish region characterized
by a continental climate regime.
The experimental design consisted in sampling grapes at three levels of saccharimetric
maturity (Brix degrees) from six plots (three irrigated and three non-irrigated, during three
years (2009, 2010, 2011) also measuring a set of climate variables for each zone (rainfall,
temperature, solar radiation, etc.). To facilitate interpretation, the 42 individual precursors
detected in the three years have been grouped by families: terpenes, norisoprenoids, vainilles,
volatile phenols, benzenes and miscellaneous.
The principal component analysis (PCA) of these data has allowed identifying the changes in
the development of precursors of aromas with the maturity and irrigation. It has also allowed
correlate these changes with the Growing Day Degree (GDD), which has proved to be the
most significant climate variable in this study.
A very different behavior of terpenes by one hand and volatile phenols, benzenes vainilles by
the other has been detected in relation to GDD and grape ripening.
203
Page 205
EFFECT OF MICRO-OXYGENATION AND OAK CHIP
TREATMENTS ON SENSORY PROPERTIES OF RED WINES
C. Pizarroa, N. Pérez del Notarioa, I. Arenzanaa, Laura Hernáiz-López, P. Oriob, J.M.
González-Sáiza
aUniversity of La Rioja, C/ Madre de Dios 51, 26006, Logroño, La Rioja, Spain
bBodegas Riojanas S.A., Carretera de la Estación 1-21, 26350, Cenicero, La Rioja, Spain
[email protected]
Oak barrels have been traditionally used in aging wine to improve wine quality and contribute
to its organoleptic characteristics. However, the use of this type of aging is an expensive
practice since implies the use of high cost tanks. In addition, when the barrel is used for a long
time, it might be infected with microorganisms, such as Brettanomyces, that can cause off-
flavors that degrade the wine quality. Therefore, there is growing interest in developing
alternative methods to simplify the ageing process, while ensuring that the wood-related
volatile compounds are released into the wine and the colour is stabilised by a slow uptake of
oxygen, without decreasing the quality of the wine produced. These possible alternative
techniques that can be applied to ageing the wines are the micro-oxygenation and the addition
of wood pieces, commonly name “oak chips”. The characteristics of the final wines depend
on the peculiarity of the wood used (geographical origin, toasting degree), the contact time
between wood and wine, the amount of wood added and the dose of oxygen applied.
Therefore, the objective of the present work was to present a multivariate attempt at
evaluating the influential parameters of alternative ageing (based on the simultaneous
application of micro-oxygenation and chips maceration) and their effect on s ensory
characteristics of the wines. The multivariate optimisation strategy used including
experimental design and response surface methodology allowed a very interesting study that
was not previously attempted.
To evaluate all possible influential factors and their effects on the sensory characteristics of
the wines a hybrid design was applied. Once experimentation was performed, was possible to
conclude that, best valued wines were those elaborated with chip doses next to 6 g/l combined
with medium-high toasting degrees, with a blend of American and French chips, and oxygen
204
Page 206
doses of 6 m l/l/month and 2 m l/l/month, for 21 a nd 42 da ys of maceration, respectively.
Moreover, thanks to the results obtained is possible to elaborate wines with specific sensory
attributes according to consumer/tasters preferences. To our knowledge, this is the first time
that experimental design methodology has been used as a tool to evaluate the sensorial effects
that alternative ageing has in wines.
References
Arapitsas P, Antonopoulos A, Stefanou E, Dourtoglou VG (2004) Artificial aging of wines
using oak chips. Food Chemistry, 86, 563-570.
Gómez-Plaza E, Cano-López M (2011) A review on micro-oxygenation of red wines: Claims,
benefits and the underlying chemistry. Food Chemistry, 125, 1131-1140.
Lewis GA, Mathieu D, Phan-Tan-Luu R (1999) Pharmaceutical Experimental Design. New
York: Marcel Dekkler.
Mathieu D, Nony J, Phan-Tan-Luu R. (2000) NEMROD-W 2001. LPRAI, Marseille, France.
205
Page 207
CHARACTERIZATION OF RAW AND COOKED OKRA
( Abelmoschus esculentus L.) ACCORDING TO THEIR
MINERAL NUTRIENT COMPOSITION
Ana M.P. dos Santos, Ivanice F. dos Santos, Uenderson A. Barbosa, Jeane S. Lima,
Geraldo D. Matos
Instituto de Química, Campus Universitário de Ondina, Universidade Federal da Bahia,
Salvador, Bahia, Brazil. CEP: 41.195-001
E-mail ([email protected] )
Okra (Abelmoschus esculentus L.) is a plant native to Africa (Jarret et al 2011). It was
introduced in Brazil with the slave trade and became grown in all regions, including in the
state of Bahia, northeastern Brazil. In this paper, the mineral composition of cooked and raw
okra of conventional and organic cultives marketed in the state of Bahia was determined and
the results were evaluated using multivariate analysis. The samples were digested in heating
block using nitric acid and hydrogen peroxide and they were analyzed using inductively
coupled plasma optical emission spectrometry (ICP OES). The accuracy of the method was
confirmed by analysis of a s tandard reference material tomato leaves - NIST 1573a. The
results expressed as milligrams of element per 100 g of sample demonstrated that the average
concentration for raw and cooked okra varied, respectively, from 366 and 325, for Ca; from
0.102 and 0.052, for Cu; from 267 and 97.7 for K; from 45.3 and 18.3, for Mg; from 18.3 and
7.00, for Na; from 44.5 and 25.8, for P; from 0.233 and 0.094, for Zn.
206
Page 208
MD1MD2
MD3
2MD12MD22MD3
3MD13MD23MD3
BS1BS2BS3
2BS12BS22BS3
3BS13BS23BS3
JC1JC2JC3
2JC1
2JC2
2JC3
3JC13JC2
3JC3
EC1EC2EC3
2EC1
2EC22EC3
3EC13EC2
3EC3
SA1SA2SA3
2SA1
2SA22SA33SA1
3SA23SA3
CMD1CMD2CMD3
C2MD1C2MD2
C2MD3
C3MD1C3MD2C3MD3
CBS1CBS2CBS3C2BS1C2BS2C2BS3C3BS1C3BS2C3BS3CJC1
CJC2CJC3
C2JC1C2JC2C2JC3
C3JC1C3JC2
C3JC3
CEC1CEC2CEC3
C2EC1C2EC2
C2EC3
C3EC1C3EC2C3EC3
CSA1CSA2
C2SA1 C2SA2C2SA3C3SA1C3SA2
3CSA3CSSA9
-10 -8 -6 -4 -2 0 2 4 6 8
PC 1: 65,09%
-5
-4
-3
-2
-1
0
1
2
3
4
PC 2
: 14,
62%
MD1MD2
MD3
2MD12MD22MD3
3MD13MD23MD3
BS1BS2BS3
2BS12BS22BS3
3BS13BS23BS3
JC1JC2JC3
2JC1
2JC2
2JC3
3JC13JC2
3JC3
EC1EC2EC3
2EC1
2EC22EC3
3EC13EC2
3EC3
SA1SA2SA3
2SA1
2SA22SA3
3SA13SA2
3SA3
CMD1CMD2CMD3
C2MD1C2MD2
C2MD3
C3MD1C3MD2C3MD3
CBS1CBS2CBS3C2BS1C2BS2C2BS3C3BS1C3BS2C3BS3CJC1
CJC2CJC3
C2JC1C2JC2C2JC3
C3JC1C3JC2
C3JC3
CEC1CEC2CEC3
C2EC1C2EC2
C2EC3
C3EC1C3EC2C3EC3
CSA1CSA2
C2SA1 C2SA2C2SA3C3SA1C3SA2
3CSA3CSSA9
Fig. 1 Plot of the first principal component (PC1) versus the second principal component (PC2);, Legend: raw
samples / cooked samples.
Comparing raw and cooked samples, it was noticed a tendency of separation in the principal
component analysis (PCA) and hierarchical cluster analysis (HCA). The raw samples had the
highest concentrations for the all elements analyzed. The raw samples had the highest
concentrations for the all elements analyzed, indicating the loss of nutrients during the
cooking process, possibly leached for the cooking water. The elements K, P, Mg, Cu, Na and
Zn contribute to the major variability between raw and cooked samples and with minor
contributions to Ca. Tree Diagram for 90 Cases
Ward`s methodEuclidean distances
C2S
A1C
SA2
CSA
1C
3SA1
C3E
C3
C3E
C2
C3J
C3
C3J
C2
C3J
C1
C3B
S1C
3BS3
C3B
S2C
2BS3
CSS
A9
3CSA
3C
2BS2
C3S
A2C
2BS1
C3E
C1
C2S
A3C
3MD
2C
2SA2
C3M
D3
C3M
D1
C2J
C2
C2J
C3
C2J
C1
CJC
1C
2EC
2C
BS3
C2E
C3
CJC
3C
BS2
CBS
1C
2MD
2C
2MD
1C
2EC
1C
EC3
CJC
2C
EC1
CM
D3
CEC
2C
MD
2C
2MD
3C
MD
13B
S3
3JC
33B
S2
3BS
13J
C2
3JC
12B
S3
2BS
22S
A3
2SA
2SA
12B
S1
2SA
1BS
3BS
2BS
13S
A3
3SA
23S
A1
SA2
SA3
3EC
23E
C1
3MD
33M
D2
3EC
33M
D1
2JC
32J
C1
2JC
2JC
3JC
2JC
12E
C3
2EC
2EC
3EC
2EC
12E
C1
2MD
3M
D3
2MD
12M
D2
MD
2M
D1
0
1000
2000
3000
4000
5000
Link
age
Dis
tanc
e
Figure. 2 Dendrogram for okra samples showing Ward’s method with Euclidean distances. Legend: raw
samples/cooked samples.
207
Page 209
Acknowledgements
Fundação de Amparo à Pesquisa do Estado da Bahia (FAPESB), the Conselho Nacional de
Desenvolvimento Científico e Tecnológico (CNPq), and the Coordenação de
Aperfeiçoamento de Pessoal de Nível Superior (CAPES) for providing grants, fellowships,
and other financial support.
References
Jarret RL, Wang ML, Levy IJ (2011) Seed oil and fatty acid content in okra (Abelmoschus
esculentus) and related species. J.Agric.Food Chem., 59, 4019–4024.
208
Page 210
MID-IR REFLECTANCE (DRIFTS) FOR IDENTIFICATION
OF PLANTS KNOWN AS “MALVA” IN BRAZIL
Mário Sérgio Piantavinia, Cleverson Antonio Ferreira Martinsa,
Lucia Regina Rocha Martinsb, Roberto Pontaroloa
aUniversidade Federal do Paraná, Departamento de Farmácia, Av. Pref. Lothário Meissner,
632, 80210-170. Curitiba, PR, Brazil bUniversidade Tecnológica Federal do Paraná, Departamento de Química e Biologia, Rua
Deputado Heitor de Alencar Furtado, 4900, 81280-340. Curitiba, PR, Brazil
[email protected]
Among the medicinal plants commonly used to treat inflammatory disorders, Malva sylvestris
L. (Malvaceae) has been used throughout the world since 3000 B.C. This species is effective
against mouth and throat diseases and can relieve swelling and toothaches, thrush, gum
inflammation and periodontitis [1]. In Brazil, the use of M. sylvestris (known as “malva”) has
been stimulated by government policies. Although the species M. sylvestris is described in the
Brazilian Pharmacopoeia [2], 21 other plants are also known as “malva” in Brazil according
to the local name, such as Sida cordifolia (“malva-branca”) and Pelargonium graveolens
(“malva-cheirosa”). This fact causes inaccuracy in medicinal use of the species, and thus it is
necessary an adequate identification method to prevent that different species are provided as
M. sylvestris, since the therapeutic effects are quite diverse [3,4].
Reflectance FT-IR spectroscopy coupled with chemometric analysis can be a useful method
for the recognition of species, given that it is solvent-free and simpler and faster than the
morpho-anatomical studies. Aim of the present study is to use this approach to characterize
commercial samples of “malva” and to distinguish M. sylvestris from others species using
PCA.
Commercial samples (dried leaves) of “malva” (n=49) were purchased from different regions
of Brazil and were originally labeled as: M. sylvestris or “malva” (n=39), S. cordifolia or
“malva-branca” (n=7) and P. graveolens or “malva-cheirosa” (n=3). The samples were milled
and sieved through a 1190-microm sieve, homogenized and immediately analyzed in the FT-
IR DRIFTS (Bruker Optik GmbH). The spectral data were recorded in three independent
209
Page 211
replicates, with an accumulation of 64 scans in 4000–375cm−1 range with a resolution of 4
cm−1 under controlled temperature (20.0±0.2ºC) and humidity (45-55%), done using software
OPUS (version 6.0) for Windows. Chemometric analysis was done using PLS Toolbox,
version 6.5 (Eigenvector Technologies, Manson) under MATLAB environment, version 7.13
(The Math-Works, Natick, MA).
The spectra showed no significant differences visually between samples (Figure 1-A).
However, PCA analysis (Figure 1-B) on spectral data after first derivative and mean centering
allowed identifying three clusters. The identity of samples of M. sylvestris cluster was
confirmed by morpho-anatomical analysis, comparing the samples with standards properly
identified. For the other two groups is considered the possibility of belonging to the genus
Pelargonium and Sida, due to the macroscopic characteristics of the material. Among the 39
samples labeled as M. sylvestris, only 36% (n=14) are indeed M. sylvestris. The results show
inadequate identification and commercialization of these species in commercial samples. This
fact can lead to therapeutic failures, since the plant delivered to the patient may not have the
expected pharmacological effects. Overall, this work demonstrates that application of FT-IR
and chemometrics analysis can be used to differentiate species of "malva" and identify
unconformity in commercial samples.
(A) (B)
Figure 1. Raw MIR spectra of powder samples (A) and scores of the first two principal components (B).
References
[1] Henry AG, Piperno DR. Using plant microfossils from dental calculus to recover human
diet: a case study from Tell al-Raqa’i, Syria. J Archaeol Sci 2008; 35: 1943–1950.
[2] Brazilian Pharmacopoeia, 4nd ed. São Paulo: Atheneu, 2005.
210
Page 212
[3] Franzotti, EM; Santos CVF; Rodrigues HMSL. Anti-inflammatory, analgesic activity and
acute toxicity of Sida cordifolia L. (Malva-branca). J Ethnopharmacol 2000; 72: 273–278
[4] Cavar S; Maksimovic M. Antioxidant activity of essential oil and aqueous extract of
Pelargonium graveolens L’Her. Food Control 2012; 23: 263-267
211
Page 213
DATA FUSION APPROACH FOR THE VARIETAL
CLASSIFICATION OF LAMBRUSCO P.D.O. WINES
M. Silvestria, E. Salvatorea, A. Eliaa, C. Durantea, A. Marchettia ,G. Papottib, D. Bertellib ,
M. Cocchia
aUniversity of Modena and Reggio Emilia, Via Campi 183, Modena (Italy) Department of Chemical
and Geological Sciences bUniversity of Modena and Reggio Emilia, Via Campi 183, Modena (Italy) Department of Life
Sciences
[email protected]
Nowadays the necessity to reveal the hidden information from complex data sets is increasing due
to the development of high-throughput instrumentation. The possibility to jointly analyze data sets
arising from different sources (e.g. different analytical determinations/platforms) allows capturing
the latent information that would not be extracted by the individual analysis of each block of data.
Several approaches are proposed in the literature and are generally referred to as data fusion
approaches. In this work a hierarchical data fusion is proposed [1,2] for the characterization of three
varieties (Salamino di Santa Croce, Grasparossa di Castelvetro, Sorbara) of Lambrusco Wine, a
typical P.D.O. wine of the District of Modena (Italy). 60 w ine samples of the three different
varieties were analyzed by means of HPLC-DAD of the phenolic compounds, Emission-Excitation
Fluorescence Spectroscopy and 1H-NMR.
Since the analytical outputs are characterized by different dimensionality (matrix and tensor),
several multivariate analysis were applied (PCA, PARAFAC, MCR-ALS) in order to extract and
merge, in a hierarchical way, the information present in each data set.
The results showed that this approach was able to well characterize Lambrusco samples giving also
the possibility to understand the correlation between the source of information arising from the
three analytical techniques.
References:
212
Page 214
[1] Silvestri M., Bertacchini L., Durante C., Marchetti A., Salvatore E., Cocchi M, “Application of
data fusion techniques to direct geographical traceability indicators”, Analytica Chimica Acta, 769
(2013), 1-9.
[2] J. Forshed, H. Idborg, S.P. Jacobsson, “Evaluation of different techniques for data fusion of
LC/MS and 1H-NMR”, Chemometrics and Intelligent Laboratory Systems 85 (2007), 102–109
213
Page 215
LOW AND MID-LEVEL FUSION STRATEGIES FOR THE
DISCRIMINATION OF OLIVE OILS FROM DIFFERENT
ORIGINS
Aysegul Yalcina, Ricard Boquéa, Joan Ferréa, Monica Casaleb, Nicoletta Sinellic
aUniversitat Rovira i Virgili, C/ Marcel.lí Domingo, s/n (Campus Sescelades), 43007
Tarragona, Catalonia, Spain bUniversità degli Studi di Genova, Dipartimento di Farmacia, Via B.Salerno 13, 16147,
Genova, Italy cUniversità degli Studi di Milano, Dipartimento di Scienze per gli Alimenti, la
Nutrizione e l’Ambiente, Via Celoria 2, 20133, Milano, Italy
[email protected]
Multivariate classification has widespread use in the discrimination of olive oil origins.
These methods are commonly based on single-instrument data and show different
sensitivities and specificities depending on the type of raw data being used. It is
interesting to test whether the combination of different data sources can improve the
sensitivity and specificity, as well as offer better outlier detection capabilities and more
confident classifications. Data are said to be combined (fused) at low level, mid
(intermediate or feature)-level and high level (or decision level) depending on t he
processing the data have suffered before they are combined (1).
This study tests low level and mid level of data fusion of NIR and MIR data with
partial-least squares discriminant analysis (PLSDA) for discrimination of olive oil
samples from different olive cultivars.
Olive oil data were supplied by Casale et.al. (2), who studied the identification of 82
monovarietal extra virgin olive oil samples, from three different cultivars: Leccino,
Frantoio and Casaliva (27 from Casaliva, 28 f rom Leccino, 27 f rom Frantoio). All
samples were measured by both NIR and MIR. Data were preprocessed by SNV and 1st
derivative. Data were then first fused at low level and modeled by PLSDA. For mid
level fusion, PCA were applied to both datasets and then the scores were fused. Low
214
Page 216
and mid level fusion strategies improved the percentage of correct classification for
Leccino samples in the training set. In general both training and test set percentages of
correct classifications changed after fusion. Especially for Frantoio test samples, both
fusion techniques improved the correct classification from 70.0% to 88.9% for low level
fusion and to 75% for mid level fusion. For Casaliva and Leccino test samples, the
percentage of correct classification was increased when the data was fused at mid level
when compared to the individual models. Individual models resulted in 66.7% for NIR
and 84.6% for MIR, for Casaliva and Leccino test samples, respectively. For mid level
fusion, those rates were improved to 92.3 % for Casaliva class and 90.0 % for Leccino
class.
Mid level fusion gave more promising results than low level fusion. Mid level fusion
improved the correct classification percentages of the training set samples of the three
classes more than low level fusion. In the mid level fusion case, the percentages of
correct classification of the training sets were 85.7, 100, and 68.4%, whereas for low
level fusion these rates were 81.2, 94.1, and 55.5% for Casaliva, Leccino and Frantoio
classes, respectively.
For the test samples, Leccino and Casaliva class samples had higher percentages of
correct classification, 90.0 and 92.3 % respectively, where percent correct classification
for Frantoio samples is decreasing from 88.89 % in the low level fusion case to 75 % in
the case of mid level fusion. In conclusion, the fusion of mid- and near-infrared (MIR
and NIR) measurements improved the sensitivity and specificity of the classification
when compared to classification models built separately on each technique.
References
[1] Di Natale, C., Paolesse, R., Macagnano, A. Mantini, A., D’Amica, A., Legin, A.
Lvova, L., Rudnitskaya, A. & Vlasov, Y. (2000). Electronic nose and electronic tongue
integration for improved classification of clinical and food samples. Sensors and
Actuators B, 64, 15-21.
[2] Casale, M., Sinelli, N., Oliveri, P., Di Egidio, V. & Lanteri, S. (2010).
Chemometrical strategies for feature selection and data compression applied to NIR and
MIR spectra of extra virgin olive oils for cultivar identification. Talanta, 80, 1832-
1837.
215
Page 217
PLS DETERMINATION OF PHYSICOCHEMICAL
PARAMETERS IN INSULATING OIL USING NIR,
FLUORESCENCE AND NMR SPECTROSCOPIC
FUSED DATA
Mariana da S. Godinhoa, Francisco F. Gambarra Netoa, Luciano Morais Liãoa,
Marcelo M. de Senab, Anselmo E. de Oliveiraa, Romà Taulerc
aUniversidade Federal de Goiás, Goiânia, Brazil
bDepartamento de Química, UFMG- ICEx , Belo Horizonte , Brazil cDepartment of Environmental Chemistry, IDAEA-CSIC, Barcelona, Spain
[email protected]
Transformers are components of great importance for the transmission and distribution of
electrical energy. These devices have an insulation system, which consists of Kraft paper
immersed in insulating mineral oil. Kraft paper is composed of cellulose,
hemicelluloses and lignin. Cellulose degrades slowly with the ageing of the
transformer and the polymer chains break down, releasing degradation products into
the oil. Cellulose degradation processes involve breaking of glycosidic bonds that hold together
the glucose rings. During the decomposition reaction of cellulose chains, water and furanic
compounds, such as 5-methyl-2-furfural, 2-acetylfuran, 5-hydroxymethyl-2-furfural, furfuryl
alcohol, and 2-furfural, are generated. These compounds change the oil physicochemical
properties, such as color and interfacial tension. The interfacial tension is one of the most
important parameters used for evaluating the degradation of the insulation system. It
corresponds to an indirect measurement of polar substances, such as the furanic compounds
and water, so the more the insulating system is degraded, the lower is the interfacial tension.
The oil color and its aspect are very important visual characteristics for the oil analysis.The
color parameter increases with increasing degradation of the insulation system and has a high
correlation with the interfacial tension.
This work presents a rapid and non-destructive method to determine the interfacial tension
and color parameters using the spectroscopic techniques FT-NIR, 1H NMR and Fluorescence
216
Page 218
combined with multivariate calibration methods. One hundred insulating oil samples were
obtained from CELG (Centrais Elétricas de Goiás S. A.), the electrical power company of the
State of Goiás, which is located in the center-west region of Brazil. These transformers
presented a wide variety of conditions, with their lifetimes varying from one to about thirty
years. Interfacial tension water/oil of these samples was measured by using a torsion Krüss
K8 tensiometer, according to Brazilian norm NBR 6234. The parameter color was measured
by using a colorimeter Lovibond, according to Brazilian norm NBR 14483. The NIR spectra
were obtained using a spectrometer Perkin Elmer 100N, with a reflectance accessory. Each
spectrum was measured in the range from 830 t o 2500 nm. While the fluorescence spectra
were obtained in a Varian Cary Eclipse Spectrofluorimeter, using a 10.00 mm quartz cuvette,
all the fluorescence spectral surfaces were obtained in the excitation range from 250 to 650nm
(10 nm steps) and in the emission range from 270 t o 700nm (2nm steps). Excitation
wavelengths were 350 and 550 nm was selected. 1H NMR spectra were recorded in a Bruker
Avance III spectrometer operating at 11.75 Tesla with a working frequency of 500.13 MHz
for 1H, using CDCl3 as solvent and TMS as internal standard and 64 scans. Data were treated
in Matlab version 7.12 using PLS Toolbox version 6.2. The NIR spectra were preprocessed
using base line correction and Multiple Scatering Correction (MSC) in the selected range
from 1330 to 1530 nm. 1H NMR spectra were preprocessed using base line correction,
Savitzky–Golay smoothing filter with a window width of 15 points, wavelet transform and
icoshift. Subsequently, the range from 7.5 to 6.4 ppm was selected.
PLS calibration models were generated in order to correlate the data set containing all the
spectra for the 100 mineral oil samples to their interfacial tensions and color values. Eighty
six samples were selected for the calibration set and the remaining 14 samples were used for
the prediction set. The best PLS model was obtained with mean centering data, using four
latent variables. The Table 1 shows the main characteristics of the PLS model for prediction
of interfacial tension and color properties. As a result, the predicted error obtained
by the proposed model is significantly lower than the one from the reference
method. Moreover, the spectroscopic techniques open some perspectives for the
quantification of furanic compounds.
Table 1. Results for the PLS models for determination of interfacial tension and color.
PLS Models RMSEC RMSEP Prediction Errors (%) r
Interfacial tension model 4.4 3.9 10.9 0.8435
Color model 0.3 0.3 18.9 0.9242
217
Page 219
The proposed method showed to be useful for the determination of the interfacial tension and
color in samples of the insulating mineral oils by the proposed spectroscopic
techniques or even better using the three combined techniques. The method suggested is
direct, rapid and non-destructive and does not generate chemical residues. Finally, this work
opens perspectives for possible implementing a non-invasive on-line assessment of the
conditions of transformer insulating systems.
218
Page 220
LOCAL CLASSIFICATION:
LOCALLY WEIGHTED – PLS-DA
Federico Marini, Marta Bevilacqua
Dept. of Chemistry, Univ. of Rome “La Sapienza”, P.le Aldo Moro 5, Rome, I-00185, Italy
[email protected] ; [email protected]
Classification problems occur ubiquitously in chemometrics, from traceability to process
monitoring, passing through metabolomics or image analysis. However, the development and
widespread availability of more and more efficient instrumental platforms resulted in a
corresponding increase in the complexity of the problems and tasks chemists are called to
solve. In the framework of pattern recognition, this consideration translates to the possibility
that many sources of variation, other than the class belonging, affect the instrumental signal,
resulting in a non-linear separability of the categories in the feature space. Whenever this
occurs, the use of non-linear classification methods constitutes an obvious answer to this
issue; however, involving an higher number of adjustable parameters, these kind of methods
usually have strict requirements in terms of the samples to variables ratio, and are more prone
to overfitting. One way of overcoming this limitations, which has already been extensively
used also for calibration problems, is to implement the non-linearity through the training of
locally linear classifiers [1].
Figure 1 – Example of a non-linear classification task in two dimensions (left) and its transformation to a piecewise linearly separable problem (right).
219
Page 221
In this study, the possibility of extending the Locally Weighted-PLS approach originally
proposed by Centner and Massart [2], to deal with non-linear classification problem was
thoroughly investigated. In this context, different weighting schemes (uniform weighting or
distance-based weighting) and different criteria for selecting the local training set (k nearest
neighbours, k-means clustering, identification of prototypes) were tested and compared.
Additionally, the possibility of using Euclidean or Mahalanobis distances, or other
dissimilarity measurements was also considered.
References
[1] Park J, Sklansky J, (1989) Automated design of multiple-class piecewise linear
classifiers. Journal of Classification, 6, 195-222.
[2] Centner V, Massart DL, (1998) Optimization in Locally Weighted Regression. Analytical
Chemistry, 70, 4206-4211.
220
Page 222
MULTIVARIATE NIR CALIBRATION STRATEGIES
USEFUL FOR QUALITY CONTROL OF
PHARMACEUTICAL FORMULATIONS
V. Cárdenas, M. Cordobés, M. Alcalà, M. Blanco
Applied Chemometrics Research Group, Chemistry Department (Analytical
Chemistry ), Faculty of Sciences , Universitat Autònoma de Barcelona, Spain
Near infrared spectroscopy (NIR) together with chemometrics data processing is
considered one of the fastest and most versatile analytical methods for the determination
of important parameters of pharmaceutical products in the final stage and throughout the
manufacturing process. In order to quantify the concentration of the active principal
ingredient (API) of two pharmaceutical formulations during different manufacturing
steps such as granulation, compacting and coating, two multivariate calibration models
have been constructed using partial least squares regression (PLS1). To obtain a
calibration model with a good predictive ability, it is necessary to add the variability
sources of the production samples to the calibration set. Therefore, two different
calibration strategies have been used: a) calculation and addition of the process
spectrum1, which is a virtual spectrum that incorporates the variability added by the
manufacturing process, to the calibration set. In this case, the difference between a
production tablet and a powder sample prepared in the laboratory with of same
composition to the calibration set, and in this sense a new spectra matrix containing the
all the process variability is obtained. b) The under and over dosage of industrial
granulates has been the second strategy used, in which a calibration set can be obtained
that contains the physical variability due to the granulation process and a broad
concentration range by the addition either of API or an excipient mixture (placebo). In
this sense, the samples are spanned in a certain concentration range that allows for the
quantification of the API in each industrial sample.
For both the powder laboratory samples and the under/over dosage samples, known
quantities of API and placebos have been weighed, spanned in an API concentration
range of ± 20% with respect to the nominal value present in the formulation. API
221
Page 223
nominal concentration value in each formulation is given as a) 9% (w/w), b) 10 mg/g
aprox.
To build up t he calibration model, four consecutive steps were followed: 1) spectral
pretreatment 2) Selection of the calibration set 3) construction of the calibration model
using the PLS1 regression algorithm and 4) the validation of the model.
The use of derivates combined with standard normal variate (SNV) has been the best
spectral pretreatment that, on the one hand, allowed the increase of the differential
between broad and overlapped bands characteristic of NIR, and on the other hand,
corrects the scatter effects due to heterogeneous particle size.
Principal component analysis was used for the calibration set which should contain the
maximum spectral variability and spanned in the all concentration range. Through
calculation of the model using PLS1 regression, the correlation between the analytical
signal and the concentration has been maximized and in this sense it has been possible
to build up a calibration model with a good predictive analysis.
For the validation of the model, two different sample sets have been used: laboratory
samples (powder or under/overdosage granulates mixtures) and industrial samples
(granulates, uncoated (core) and coated tables). These models corroborate their
usefulness in control quality processes for the pharmaceutical industry.
a) Model build up by calculation and addition of process spectra
Uncoated Coated
CALIBRATION PREDICTION CALIBRATION PREDICTION
Spectral pretreatment 2ª Der (S.G - 25points; 3º polynomial) + SNV
Spectral range (nm) (1000-1790) (1810 – 2500)
concentration range (% w/w) 6.9 - 10.3
Number of factors 4 4
Y- explained variance (%) 98.8 99.5
Type of sample Lab+SP_Cores Lab+SP_Cores Cores Lab+SP_Coated Lab+SP_Coated Coated
Number of samples 34 12 10 34 12 10
RSEC/RSEP (%) 1.26 1.96 3.74 0.78 1.22 3.93
RMSEC/RMSEP (% w/w) 0.10 0.17 0.10 0.06 0.11 0.10
Residual average -0.05 0.22 -0.04 -0.04
222
Page 224
a) Model build up under and overdosage of industrial granulates
CALIBRATION PREDICTION
Spectral pretreatment SNV+ 2ª Der (S.G - 25points; 3º polynomial)
Spectral range (nm) (1000-1749) (2051-2200)
concentration range(mg/g) 8.0 – 12.0
Number of factors 5
Y- explained variance (%) 99
Type of sample Under/overdosage samples.
Under/overdosage
samples.
Industrial
Granulates
Number of samples 15 15(CV) 57
RSEC/RSEP (%) 1.23 4.93 3.92
RMSEC/RMSEP (mg/g) 0.12 0.50 0.38
Residual average
-0.10 0.04
References
[1] Blanco M., Peguero A., Analysis of pharmaceuticals by NIR spectroscopy without a
references method, Trends in Analytical Chemistry, 29(10), 2010.
[2] Blanco Romía M., Alcalà Bernardez., NIR spectroscopy in pharmaceutical analysis:
off-line and at-line PAT applications. capitulo 14(463-486), Process Analytical
technology. Wiley 2da Edición, 2010.
223
Page 225
COMPARISON OF LIPIDIC PAINT BINDERS AGEING
UNDER DIFFERENT CONDITIONS BY RAMAN
SPECTROSCOPY AND CHEMOMETRICS
Natalia Navasa, Ana Dominguez-Vidal
b, Eloisa Manzano
a, José García-Atero
a,
Luis Fermín Capitán-Vallveya, María José Ayora-Cañada
b
aDept. Analytical Chemistry, Univ. Granada, Campus Fuentenueva, E-18071 Granada, Spain
bDept. Physical and Analytical Chemistry, Univ. Jaén, Campus Las Lagunillas, E-23071, Jaen, Spain
[email protected]
Among the different organic substances used y artists in the past, traditional paint binders of
lipid nature are represented by egg yolk in the tempera technique and drying or siccative oils
in the oil technique. The chemical composition of a painting is a complex heterogeneous
matrix changing over the course of time depending on factors like conservation conditions
such as changes in temperature and humidity and exposure to natural and artificial light
among others. The identification of the original substances and the characterization of the
degradation processes affecting the binders are important for restoration purposes. Here we
explore the capabilities of Raman spectroscopy in combination with chemometric techniques
for this purpose.
Samples of egg yolk and the most commonly employed drying oils, namely linseed, poppy
seed and walnut oils and mixtures of them were prepared and aged for six years under natural
ambient conditions. Replicates of these samples were artificially aged for 960 hours in a UV
accelerated test chamber. Particularly, irradiance was set at 765Wm−2
, and the maximum and
minimum temperatures of the samples were maintained between 30–35 ◦C and 15–20%
relative humidity. Figure 1 compares the Raman spectra of the pure binders aged naturally
during 6-7 years and the same binders subjected to artificial ageing.
224
Page 226
Figure 1 (a and b) show the Raman spectra of drying oils and egg mixtures
In all cases the most prominent bands are found in the C-H stretching region from 2840 to
2950 cm-1 and C-H bending region 1300-1450 cm-1. The broad bands in the region 1680-
1740 cm-1 are due to the overlapping of the C=O stretching of the ester and the different
carbonyl compounds formed by lipid oxidation. The spectral features are similar for all the
binders with natural ageing and the spectra differ in the relative intensities of the bands. In the
case of samples with additional artificial ageing it is remarkable the presence of several
distinct Raman bands in the spectra of pure poppy seed oil (1618, 1395, 1358, 1340 and 1209
cm-1). Although their origin is still not completely clear they could be assigned to the
formation of carboxylate salts.
Both Hierarchical cluster analysis (HCA) and Principal component analysis (PCA) were used
to explore the Raman spectra and the results were consistent. When studying natural aged
samples, a group can be defined for poppy seed oil samples whereas samples containing
walnut and linseed oil form another cluster. Egg samples were widespread in both groups.
PC1 with a 78.65 % of explained variance shows the same tendency that HCA. Furthermore,
samples containing egg always show negative values for PC2 (10.12%).
Artificially aged samples show a different behaviour in HCA caused by the grouping of
linseed and poppy seed oil pure samples separated from a group that can be also divided in
two subgroups: one containing egg samples and another with linseed oil mixtures and walnut
samples. PCA needs only two PCs to separate pure samples, while mixtures are more
complicated to separate.
In order to get a discriminant model to classify unknown samples according to the presence of
each drying oil, PLSDA was applied to both series of samples. Results were satisfactory for
artificially aged samples with sensitivity and specificity values for prediction always close to
225
Page 227
1.000 except for poppy seed oil samples. However the classification for natural aged samples
is worse and only egg yolk is well classified in all the samples.
Acknowledgment. This work has been financially supported by research groups FQM118 and
FQM 363 (funds from research project CTQ2009-09555)
References
Manzano E, García-Atero J, Dominguez-Vidal A, Ayora-Cañada MJ, Capitan-Vallvey, F,
Navas N, (2012). Discrimination of aged mixtures of lipidic paint binders by Raman
spectroscopy and chemometrics, Journal of Raman Spectroscopy, 43, 781-786.
226
Page 228
AD-HOC MASS CLUSTERING TO STUDY TEMPORAL
EVOLUTION OF MALDI-TOF-MS MAPPEPTIDE
FINGERPRINTING OF MONOCLONAL ANTIBODY
Natalia Navasa, Pablo Villacortab, Antonio Salmerón-Garcíac,David Peltaa,
Antonio Lariod, José Cabeza-Barrerae
aUniversity of Granada (Faculty of Sciences), Dept. of Analytical Chemistry,Avda.Fuente
Nueva s/n,Granada, 18071Spain. bUniversity of Granada, CITIC-UGR, Dept. of Comp. Science and A.I., C/Periodista Daniel
Saucedo Arandas/n, Granada, 18071 Spain cPharmacy Unit, Baza Hospital, Granada, 18800 Spain.
dCSIC (Consejo Superior Investigaciones Científicas), ProteomicUnit, Parasitology and
BiomedicineInstitute “Lopez Neira”, Parque Tecnológico Ciencias de la Salud, Avda. del
Conocimiento, s/n.18100 Armilla, Granada, 18005 Spain. eUniversity Hospital San Cecilio, Hospital Pharmacy Unit, Granada, E-18012. Spain
Email: [email protected]
Monoclonal antibodies (mAbs) represent the faster growing class of human therapeutics.
From a structural point of view they are tetrameric glycoproteins with high molecular weights
(150 kDa). They are composed by two identical heavy chains and two identical light chains
linked by a disulfide bond. A mong the different isotypes of mAbs, IgG1 is the most used
clinically due to its particular characteristics. Although IgG1 are relatively stable molecules,
they are subject to a variety of degradation reactions that can occur during manufacturing,
formulation, storage or when handled in hospital conditions. These modifications can
decrease the therapeutic activity of the mAbs. Therefore many efforts are being made to
detect and track these chemical changes. Among all analytical techniques used for mAbs
characterization, mass spectrometry based approaches have led these investigations supplying
information on amino acid sequences, higher order structures and conformations [1].
The objective of our study is to provide an algorithm to study the temporal evolution of
peptide mass fingerprinting (PMF) of mAb recorded by matrix-assisted laser
desorption/ionization time of flight mass spectrometry MALDI-TOF-MS. Previously, the
227
Page 229
mAb was trypsin digested.In this kind of PMF, a huge volume of MS data is often generated.
Each MS spectra consist of two large vectors corresponding to mass to charge ratio (m/z) and
intensity [2].
In our study, we obtain PMF at different days. Furthermore, on the same day, we obtain 5
different PMF, which we call replicates. The main problem when studying temporal peptide
evolution is the following: given two samples and that were obtained
respectively in replica j of day k and in replica j’ of day k’, can we determine whether they
correspond to the same peptide or not?
As it is well-known, experimental data of the mass of a given peptide are subject to random
errors when using PMF. The magnitude of the error depends on t he resolution of the
equipment, but it is expected that two mass measurements very close to each other actually
correspond to the same peptide. In this study, the idea is to group together peptide masses
with enough similarity, thus obtaining, for each peptide, a m ass interval that indicates the
mass range corresponding to the peptide. The initial assumptions are that i) measurement
errors are independent random variables with normal distribution and mass-dependent
variance, and ii) the maximum measurement error admitted for a given mass is a percentage
of the mass and enables us to distinguish between peptides. In order to determine the mass
range of each peptide, we present a novel constrained clustering algorithm for peptide masses,
in which the two assumptions mentioned before have been incorporated to the algorithm. The
number of intervals to construct (i.e., number of peptides present in the data) is also
determined by the algorithm as it is not known a priori.With these intervals, it is possible to
know if a sample obtained at any day corresponds to a given peptide of interest or not, by
checking whether the mass value falls inside the mass range of that peptide, which has been
calculated by our algorithm.This allows tracking the temporal evolution of the peptide’s
occurrence.
In order to check long term stability of a marketed mAb, namely rituximab (RTX) when
reconstituted and diluted in hospital conditions, peptides from complementarity determining
regions (CDR) were tracked by applying our algorithm with successful results.
References
[1] Beck A, Wagner-Rousset E, Ayoub D, Van Dorsselaer A, Sanglier-Cianférani S (2013)
228
Page 230
Characterization of Therapeutic Antibodies and Related Products.Analytical Chemistry, 85,
715−736.
[2] Yang C, He Z, Yu W (2009)Comparison of public peak detection algorithms for MALDI
mass spectrometry data analysis. BMC Bioinformatics, 10, 4.doi:10.1186/1471-2105-10-4
Acknowledgements: This work was supported by funds received by Projects
PI10/00201(Instituto de Salud Carlos III, Ministerio de Ciencia e Innovacion, S pain) and
TIN2011-27696-C02-01. We also thank to the Pharmacy Unit of the University Hospital San
Cecilio (Granada Spain) by kindly supplied all the RTX samples studied and FIBAO for all
the facilities during the development of this work.
229
Page 231
HIGH-THROUGHPUT DETERMINATION OF
CHYLOMICRON TRIGLYCERIDES CONTENT IN HUMAN
BLOOD BY NMR METABOLOMICS
Francesco Savorani, Søren B. Engelsen
University of Copenhagen, Faculty of Science, Dept. of Food Science,
Rolighedsvej 30, 1958 Frederiksberg C, Denmark
[email protected]
The lipid content of chylomicrons is a risk factor of cardiovascular diseases and a key
biomarker for the understanding of obesity. A high-throughput metabolomics determination
of chylomicrons in human blood serum is outlined here that overperforms the expensive and
time consuming “gold standard” analytical method based on density gradient
ultracentrifucation and colorimetric test kit. The new method, which uses a combination of
Nuclear Magnetic Resonance (NMR) analysis and chemometrics, enables extraordinarily fast,
inexpensive, and robust prediction of triacylglycerol (TAGs) content in chylomicrons. It is the
position and shape of the complex lipid methylene band that determines the chylomicron
TAG status [1]. The resulting method is a relatively simple iPLS [2] multivariate model that
facilitates parsimonious and accurate prediction of chylomicron lipids from NMR spectra of
blood plasma. The iPLS model predicts the chylomicron TAG content with a Pearson’s
correlation coefficient of 0.96 to density gradient ultracentrifugation data (see figure).
The presented method facilitates large scale clinical and nutritional trials with inclusion of
diagnostics of chylomicron status and thus creates new opportunities for research in lifestyle
diseases and obesity.
230
Page 232
iPLS plot indicating the best performing NMR spectral region in predicting chylomicron TAGs content
References
[1] Savorani F , Kristensen M , Larsen FH , Astrup A , Engelsen SB (2010). High throughput
prediction of chylomicron triglycerides in human plasma by nuclear magnetic resonance and
chemometrics. Nutrition & Metabolism, 7:43
[2] Nørgaard L, Saudland A, Wagner J, Nielsen JP, Munck L, Engelsen SB (2000) Interval
partial least squares regression (iPLS): A comparative chemometric study with an example
from the near infrared spectroscopy. Applied Spectroscopy, 54, 413-419
231
Page 233
FOURIER TRANSFORMATION – A PERFORMANCE TOOL
FOR THE CHROMATOGRAPHIC SIGNAL PROCESSING
Tamás L. Pap
University of Veszprém, Institute of Analytical Chemistry
8201 Veszprém, P.O.Box 158. Hungary, Email: [email protected]
In the field of chromatography there are many characteristics available (mean, variance,
autocorrelation function, autocovariance function, etc.) for describing signal-time functions,
but these can’t inform us about the frequencies and phases of the signal constituents. In reality
the useful signals are always accompanied by unexpected, disturbing signals, by so-called
noises. The quality of the analytical measurement (precision, detection limit, etc.) is curable
by decreasing the noise. A good method for noise decreasing is Fourier transformation [1, 2],
which can also be used for a subsequent improvement of an established signal, when the
frequencies of the signal and noise deviate properly from each other. One of the demanding
signal-smoothing method constitutes the curve fitting process, when curve is fitted to the
measured digitized signals using a least square method [3]. In this work variation of the
Fourier transform of a function due to peak shape changes was examined suitable for
describing chromatographic peaks. A mathematical process had been elaborated, during
which curve was fitted to the chromatographic peaks in frequency domain using a least square
method. After curve fitting applying inverse Fourier transformation, we get back symmetrical
chromatographic peaks. The process is presented at separation of phenol derivatives using real
chromatograms. This method is suitable when the calculation of Fourier transform of the
chromatogram is necessary because of other signal processing operations (noise filtering,
interpolation, curve resolution, etc.)
References
[1] Cooley, J.W., Tukey, J.W.(1965): An Algorithm for the Machine Calculation of Complex
Fourier Series, Math. Comput. 19, 297-301.
232
Page 234
[2] Felinger, A.: Data Analysis and Signal Processing in Chromatography. Elsevier,
Amsterdam, 1998, Chapt. 2.
[2] Felinger, A., Pap,T.L., Inczédy,J (1994): Talanta, 41 (7), 1119-1126.
233
Page 235
DETERMINATION OF PARACETAMOL AND IBUPROFEN
IN TABLETS AND URINE USING SPECTROMETRIC
DETERMINATION COUPLED WITH CHEMOMETRICS
A.S. Luna, Jéssica S.A.Pinho
Addresses: Rio de Janeiro State University, Analytical Chemistryt, São Francisco Xavier 524
Street, Rio de Janeiro, 20550-900, Brazil
[email protected]
Paracetamol (PAR) and Ibuprofen (IBU) (Fig. 1) are among the most consumed drugs in
world. PAR has an analgesic and antipyretic power similar to aspirin showing the advantage
of no irritating the gastrointestinal mucosa. IBU is a non-steroidal antiinflammatory drug that
also has analgesic and antipyretic power. Some pharmaceutical formulation has both
compounds (Sena et al, 2007).
Fig. 1: PAR and IBU structures
Many methods were used for individual determination of each one of these drugs in tablets
such as spectrophotometrics, chromatographics and potenciometrics for PAR or IBU. Official
methods for determination of both species are based on HPLC with UV detection (Sena et al,
2007). Chromatographic methods are recommended by American Pharmacopeia. Other
methods such as voltammetric or flow injection analysis can be used for accompaniment of
reaction mechanisms (Vieira; Lupetti; Filho, 2003). Simões et al (2006) proposed a method
for PAR determination in pharmaceutical formulations by using NIR spectroscopy coupled
with variable algorithm selection (SPA – Successive Projection Algorithm). However,
simultaneous determination of PAR and IBU is related in few articles. In one of them this
234
Page 236
determination is done using Nuclear Magnetic Ressonance (NMR), that is a expensive and not
entirely accessible by most of laboratories. In other article was used spectrophotometry and
multiple linear regression (MLR). For any of these methods was not estimated figures of
merit. The fact of PAR and IBU present overlap spectra in UV it is not possible to perform
direct and simultaneous determinations (Suarez et al, 2005).
Caused by that, the proposal of this paper is develop a spectrometric method using second
order calibration techniques to perform the PAR and IBU spectra deconvolution and
quantification of these species in tablets and urine and also determinates figures of merit for
them what is not performed yet. Some chemometric techniques will be employed to verify
which one of them will furnish the best results. These techniques are PARAFAC (Parallel
Factor Analysis), U – PLS (Unfolded Partial Least Squares Regression), N – PLS (N-way
Least Squares Regression), RBL (Residual Bilinearization). Preliminary tests were performed
in aqueous standard such as best value of pH (was set in 10 – due to avoid overlap of spectra
that is more evident in low pH values), the range of wavelength was set from 210 – 260 nm
(step of 2 nm) for excitation and a range from 270 – 400 nm (step of 2 nm) for emission and
the concentration range of samples (was fixed between 350 – 950 µg. L-1) and were obtained
good results. After fixed these parameters will be performed analysis in tablets containing
different amounts of two species and after that this study will be extended to urine samples
coupled with second order standard addition.
References
Sena MM, Freitas CB, Silva LC, Pérez CN, Paula YO (2007) Simultaneous spectrometric
determination of Paracetamol and Ibuprofen in pharmaceuticals formulations using
multivariate calibration. Química Nova, 30, 75-79
Suarez W.T, Vieira H.J, Fatibello-Filho O (2005) Determination of Paracetamol in
pharmaceuticals products employing a system of flow injection analysis with nitrous acid
generation. Eclética Química, 30, 21-28.
Simões SS, Sanches FAC, Araújo MCU, Pasquini C, Junior IMR, Rohwedder JJR (2006)
Determination of paracetamol in pharmaceutical tablets using NIR spectroscopy and variable
selection algorithm. 29ª Annual Metting of Brazilian Chemistry Society.
235
Page 237
SIMULTANEOUS DETERMINATION OF AFLATOXINS B2
AND G2 IN PEANUTS USING SPECTROFLUORIMETRY AND
MULTIVARIATE CALIBRATION.
A. S. Lunaa, I. C. A. Limaa, R. L. Alvesa,b, W. F. Rochac, J. Ferré.d, R. Martíd
aUniversidade do Estado do Rio de Janeiro, Rio de Janeiro, Brazil.
bFundação Oswaldo Cruz, Rio de Janeiro, Brazil. cInstituto Nacional de Metrologia, Qualidade e Tecnologia, Duque de Caxias, Brazil.
dUniversitat Rovira i Virgilli, Tarragona, Spain.
Email: [email protected]
Aflatoxins are secondary metabolites produced by fungi of the genus Aspergillus (A. flavus,
A. parasiticus and A. nomius) present in foods such as peanuts, corn and wheat. Exhibit
carcinogenic, mutagenic, teratogenic, and immunosuppressive [1].
The objective of this study is to compare chemometric tools for multivariate calibration of
second order (PARAFAC, and N-PLS/RBL U-PLS/RBL) [2] the simultaneous determination
of aflatoxins B2 and G2 present in peanut samples with post-column derivatization
immunoaffinity analyzed by spectrofluorimetry. The sample extraction was performed with of
70% methanol v/v. The extract is filtered, diluted in water and applied to an affinity column
containing monoclonal antibody specific for aflatoxin B2 and G2. Aflatoxins are isolated,
purified, and concentrated in the column. The removal of the antibodies was done with
methanol. The next step was to obtain the excitation-emission spectra of the samples by
spectrofluorimetry and multivariate models through comparison of the figures of merit. A
comparison of models for each aflatoxin, was performed by exactitude, expressed through the
values of RMSEP. Furthermore, we compared the values of limit of detection and
quantitation, sensitivity and the analytical sensitivity of a randomly chosen sample (in this
case containing 20 ng mL-1 each aflatoxin).
The proposed methodology was adequate for the simultaneous determination of aflatoxins B2
and G2 for all three chemometric models studied (PARAFAC, and N-PLS/RBL U-PLS/RBL),
whose RMSEPs were 0.375, 2.247 and 2.027 for aflatoxin B2 and 1.012, 3.145 and 3.492, for
aflatoxin G2, respectively. Despite the PARAFAC model presenting the lowest RMSEP for
236
Page 238
both aflatoxins, the application of the test F (Fcrit: 3,316) indicates no difference between the
three methods for the quantification of both aflatoxin B2 (Fcalc: 0.028) and aflatoxin G2
(Fcalc: 0.356). The limits of detection and quantification were below the maximum tolerated
(LMT) 20 micrograms / kg for the sum of aflatoxins, according to the legislation (RDC. 274)
[3].
.
A. S. Luna thanks ProCiência Programm/UERJ by a research grant, FAPERJ and CNPQ for
financial support.
I. C. A. Lima thanks FAPERJ for the scholarship.
References
[1] Oliveira, C. A. F.; Germano, P. M. L. (1997) Aflatoxins in foodstuffs: current concepts on
mechanisms of toxicity and its involvement in the etiology of hepatocellular carcinoma.
Revista de Saúde Pública, 31, n. 4, 417 – 424.
[2] Olivieri, A. C.; Wu, H.L; Yu, R.Q. (2007) MVC2: A MATLAB graphical interface
toolbox for second-order multivariate calibration, Chemometrics and Intelligent Laboratory
Systems, 96, 246 – 251.
[3] Brasil. (2002) Resolução RDC n.º 274.
237
Page 239
THE USE OF PROFICIENCY TESTING TO DETERMINE
REPEATABILITY AND REPRODUCIBILITY OF NATURAL
GAS COMPOSITION BY CHROMATOGRAPHY
Werickson F.C. Rocha, Claudia Cipriano Ribeiro, Cristiane Rodrigues Augusto,
Andreia de Lima Fioravante, Valnei Smarçaro da Cunha , Mariana Coutinho Brum
National Institute of Metrology, Quality and Technology (Inmetro), Directorate of Industrial
and Scientific Metrology, Chemical Metrology Division, 25250-020,
Xerém,Duque de Caxias, RJ,
E-mai:l ([email protected] )
Interlaboratory proficiency testing presents itself as a valuable tool for laboratories to
demonstrate their competence and seek mutual recognition, therefore adapting their
technological infrastructure to international standards, overcoming technical barriers and
increasing their integration in foreign trade [1-3]. Therefore, the participation of public and
private laboratories in proficiency testing programs is important to ensure the reliability of
analytical results provided by these laboratories.
Natural gas is a highly traded and valuable commodity. and is sold to consumers based on its
heating value, that can be calculated by the determination of the molar fraction of each natural
gas component present in the mixture. The most widely used instrument for measuring the
composition of natural gas is the gas chromatograph (GC) equipped with thermal conductivity
(TCD) and flame-ionization detectors (FID) described in the standard test methods such as
ISO 6974-3, ASTM D 1945 and NBR 14903 [4-6].
The objective of this work was the performance evaluation of the participating laboratories by
different statistical methods and the determination of the repeatability and the reproducibility
precision parameters [7] for all components measured in natural gas mixture using gas
chromatography technique .
Twenty-seven laboratories distributed in nine Brazilian states participated in this collaborative
program to determine the components present in natural gas synthetic mixture. Two cylinders
containing gas mixtures of known composition were used in this program. Initially, the
cylinders were stored in the Inmetro’s Laboratory of Gas Analysis (Labag) at laboratory
238
Page 240
climate conditions (20 ± 2) ° C . Each participating laboratory received only one cylinder,
properly identified, with a pressure regulator. The composition of the cylinders was analyzed
by Labag during the study which confirmed that the composition of the cylinders did not
change throughout this study. The analytical results submitted by the laboratories were
evaluated for outliers using the statistical criteria according to Cochran, Dixon and Grubbs
tests.
The performance evaluation was conducted by using the consensus values which were
obtained from the mean data of each natural gas component informed by all participants, after
the elimination of outliers. The performances of the laboratory were statistically evaluated
using Z-score, Hierarchical Cluster Analysis (HCA) and Principal Component Analysis
(PCA).
Afterwards, the calculations for repeatability and reproducibility values were performed by
using the results from laboratories that were considered satisfactory for each natural gas
component. The lowest values of standard deviation under repeatability and reproducibility
conditions were 0.02 % and 0.13 % fo r the methane component, respectively, that are in
agreement with the requirements reported in the ISO 6974-3 and ASTM D 1945.
Thus, it w as possible to determine the parameters estimation of repeatability and
reproducibility for the determination of the chemical composition of natural gas mixture by
gas chromatography, according to standardization documents, as well as determine the
performance of the participating laboratories for the proposed test.
References
[1] Miller WG (2009) Clinical Biochemistry, 42, 232-235.
[2] Ferrero C, Casaril M (2009) Measurement, 42, 1502-1509.
[3] Glavič-Cindro D, Korun M (2009) Applied Radiation and Isotopes, 67, 683-686.
[4] International Standard ISO 6974-3, Natural gas—determination of composition with
defined uncertainty by gas chromatography.
[5] ASTM Standard D1945, Standard Test Method for Analysis of Natural Gas by Gas
Chromatography, 2003.
[6] NBR 14903; Gás natural - Determinação da composição química por cromatografia em
fase gasosa, Rio de Janeiro, 2008
239
Page 241
[7] ISO 5725-2:1994, Accuracy (trueness and precision) of Measurement Methods and
Results. Part 3: Basic method for the determination of repeatability and reproducibility of a
standard measurement method, International Organization for Standardization, Geneva, 1998.
240
Page 242
MACHINE LEARNING CLASSIFICATION OF NEAT AND
BURNT IGNITABLE LIQUIDS FOR ARSON DETECTION
João Aires-de-Sousa,a Pedro A. S. Salgueiro,b,c Diogo A. R. S. Latino,a Rui P. Fartaria,a
Ricardo J. N. B. Silva,c Carlos M. F. S. Borgesc
aCQFB and REQUIMTE, Departamento de Química, Faculdade de Ciências e Tecnologia,
Universidade Nova de Lisboa, 2829-516 Caparica, Portugal;
bLaboratório de Polícia Científica da Polícia Judiciária, 1169-007 Lisboa, Portugal; cDepartamento de Química e Bioquímica, FCUL, Campo Grande, 1749-016 Lisboa,
Portugal
[email protected]
Ignitable liquids (ILs) are frequently used to promote and accelerate the development of fire
in arson cases. The chemical analysis of fire debris, usually by extraction followed by GC-MS
analysis, can detect the presence of ILs, or identify patterns of volatile compounds resulting
from their burning. This type of analysis can assist in the forensic investigation of a fire, to
determine its origin and cause. However, fire debris always contain complex mixtures of
volatile compounds, influenced by the burnt substrates in addition to possible ILs. The pattern
of compounds to be observed also depends on the extent of burning and the delay between
burning and sampling.
Chemometric methodologies have been applied to the pattern recognition of fire accelerants.
Hardy et. Al [1] classified samples of five ASTM classes of accelerants, exposed to different
types of wood or carpet, using PCA and SIMCA. For one type of carpet the effect of
evaporation was studied, as well as the ability to classify samples after matrix charring.
NicDaeid et. al.[2] [3] used principal component analysis (PCA), hierarchical cluster analysis
(HCA), and self organizing maps (SOM) to classify samples of neat and evaporated refill
lighter fluid samples from five different brands, and samples of neat/evaporated three medium
petroleum distillate products (white spirit, paint brush cleaner, and lamp oil) from different
brands. Baerncopf et. al.[4] classified samples of burnt carpet spiked with different ILs
(gasoline, diesel, ultra pure paraffin lamp oil, adhesive remover, torch fuel, paint thinner)
using PCA and Pearson product moment correlation (PPMC).
241
Page 243
Here we present the chemometrics exploration of a n ew data set with new fire
simulation/analytical procedures consisting of 41 s amples of six ILs (gasoline, diesel,
kerosene, white spirit, paint brush cleaner and charcoal starter) which were analysed neat,
after burning to various extent, and after different delays between burning and sampling.
Samples were extracted with activated charcoal strips (ACS) and analysed by GC-MS
following the method previously published.[5] For each GC/MS data file, the total ion
chromatogram (TIC) was divided into 412 equal time intervals and the TIC in each segment
was summed to represent a variable in the data matrix.
Classification of samples was accomplished by decision trees, random forests, and self
organizing maps, according to IL, gasoline brand, and burning extent. A functional tree could
correctly classify 93% of the samples according to the six types of ILs in 10-fold cross-
validation experiments. Correct classification of gasolines according to octane number was
observed, as well as some ability to identify gasoline brands. The investigation of a larger
data set will also be presented, including samples of simulated fire debris with different types
of substrates.
References
[1] Tan B, Hardy JK, Snavely RE (2000) Accelerant classification by gas chromatography /
mass spectrometry and multivariate pattern recognition. Anal. Chim. Acta, 422, 37–46.
[2] Mat Desa WNS, NicDaeid N, Ismail D, Savage K (2010) Application of unsupervised
chemometric analysis and self-organizing feature map (SOFM) for the classification of lighter
fuels. Anal. Chem., 82, 6395–6400.
[3] Mat Desa WNS, Ismail D, NicDaeid N (2011) Classification and source determination of
medium petroleum distillates by chemometric and artificial neural networks: a self organizing
feature approach. Anal. Chem., 83, 7745–7754.
[4] Baerncopf JM, McGuffin VL, Smith RW (2011) Association of ignitable liquid residues
to neat ignitable liquids in the presence of matrix interferences using chemometric
procedures. J. Forensic Sci., 56, 70-81.
[5] Salgueiro PAS, Borges CMF, Bettencourt da Silva RJN (2012) Valid internal standard
technique for arson detection based on gas chromatography-mass spectrometry. J.
Chromatography A, 1257, 189–194.
242
Page 244
A WAVELET-BASED PROCEDURE TO DETECT SHARP
PEAKS IN LASER PHOTOACOUSTIC SPECTRA OF GAS
MIXTURES
Alessandro Ulrici a,b, Marco Calderisi a,b, Renato Seeber b,c
aDipartimento di Scienze della Vita, Università di Modena e Reggio Emilia, Padiglione Besta,
Via Amendola 2, 42122 Reggio Emilia;
b Consorzio INSTM, Via G. Giusti 9, 50121 Firenze, Italy; c Dipartimento di Scienze
Chimiche e Geologiche, Università di Modena e Reggio Emilia, Via G.Campi 183, 41125
Modena
[email protected]
In the last decade there was a market growth of chemical agent and toxic materials sensor-
devices, based on num erous detection techniques for several substances and related to
different scenarios and applications, which are able to screen and identify specific molecules
even at very low concentration at laboratory or in controlled environment. However, a
portable system which would be simple to use, sensitive, compact, and capable of providing
screening over a large number of compounds and discriminate them with low probability of
false alarms with short response time scale is still demanded. In this context, the use of an
External Cavity-Quantum Cascade Laser Photo Acoustic Sensor (EC-QCLPAS) [1] operating
in the mid-IR spectral region seems very promising, since it offers a high sensitivity in a wide
spectral range. However, in order to achieve also a high specificity for the detection of the
target molecules, the EC-QCLPAS spectra must be properly preprocessed to cancel out the
contribution of those signal regions where the sensor output shows a low reproducibility. In
particular, the preprocessing procedure must be focused at discarding the signal portions
containing sharp intense peaks of small interfering chemical components, since their
contribution to the final mixtures spectra is highly irreproducible. At the same time, however,
utmost attention must be paid to include all the neighboring regions, which could potentially
bring useful information for the identification of the target molecules. The problem due to
sharp peaks of small molecules, such as H2O and CO2, arises since in these spectral regions
the measurement accuracy is heavily affected by the instrument precision in repositioning,
243
Page 245
which is rather low when compared to the extremely narrow bandwidth. For this reason, an
algorithm [2] was developed ad-hoc in order to detect the extent, intensity and position of the
sharp peaks deriving from all the small molecules included in a d ataset of simulated gas
mixtures spectra, and to discard all the corresponding spectral regions in an interval equal to
the error in repositioning. The implemented approach makes use of a graphical interface
based on the Fast Wavelet Transform (FWT) [3] to separate the high frequency content of the
spectrum, corresponding to the sharp peaks, from the smooth variation due to the presence of
large absorption bands and signal background. In order to quantify the position and the
intensity of the sharp peaks, a sharpness function is then calculated using the approximations
and the detail vectors. This function reflects how intense, for each single wavenumber, the
sharp variations are with respect to the neighboring parts of the signal, i.e. with respect to the
smooth variations, and weights this ratio by the corresponding molar absorptivity and by the
maximum possible concentration of each considered molecular species. The overall sharpness
function is then calculated as the mean of the sharpness functions of all the molecules
generating sharp peaks, thus representing the positions and intensities of all the sharp peaks
that can be present in the final mixtures. Finally, all the wavenumber values where the
sharpness function assumes values higher than a fixed threshold are discarded, together with
all the wavenumbers whose distance from these ones is lower than the estimated error in
repositioning.
References
[1] J. Uotila ; J. Lehtinen ; T. Kuusela ; S. Sinisalo ; G. Maisons, et al., Drug precursor vapor
phase sensing by cantilever enhanced photoacoustic spectroscopy and quantum cascade laser,
Proc. SPIE 8545, 85450I (2012).
[2] A. Ulrici, R. Seeber, M Calderisi, G Foca, J. Uotila, M. Carras, A.M. Fiorello, A feature
selection strategy for the analysis of spectra from a photoacoustic sensing system, Proc. SPIE
8545, 85450K (2012).
[3] Walczak, B. (ed.), Wavelets in Chemistry, Elsevier, Amsterdam (2000).
244