60
Beazley Insurance dac | Solvency and Financial Condition Report 2017

Beazley Insurance dac | Solvency and Financial Condition Report 2017

www.beazley.comBeazley Insurance dac Solvency and Financial Condition Report 2017
Beazley Insurance dac reinsuresand provides capital to support theunderwriting activities of BeazleyUnderwriting Limited in the Lloyd’s market. The company alsowrites non-life insurance throughits European branch network.
Contents1 Summary
2 A. Business and performance2 A.1 Business
4 A.2 Underwriting performance
6 A.3 Investment performance
7 A.4 Performance of other activities
7 A.5 Any other information
8 B. System of governance8 B.1 General information on the system of governance
11 B.2 Fit and proper requirements
11 B.3 Risk management system including ORSA
16 B.4 Internal control system
17 B.5 Internal audit function
18 B.6 Actuarial function
20 B.7 Outsourcing
20 B.8 Any other information
21 C. Risk profile21 C.1 Underwriting risk
23 C.2 Market risk
26 C.3 Credit risk
27 C.4 Liquidity risk
28 C.5 Operational risk
29 C.6 Other material risks
29 C.7 Any other information
31 D. Valuation for solvency purposes 31 D.1 Assets
33 D.2 Technical provisions
36 D.3 Other liabilities
36 D.4 Alternative methods for valuation
36 D.5 Any other information
37 E. Capital management37 E.1 Own funds
38 E.2 Solvency Capital Requirement and Minimum Capital Requirement
40 E.3 Use of the duration-based equity risk-submodule in the calculation of the Solvency Capital Requirement
40 E.4 Differences between the standard formula and any internal model
40 E.5 Non-compliance with the MCR and non-compliance with the SCR
40 E.6 Any other information
41 Appendix: Quantitative reporting

www.beazley.com Solvency and Financial Condition Report 2017 Beazley Insurance dac 01
Summary
The EU-wide regulatory regime for insurance and reinsurance companies, known as Solvency II, came into force with effect from 1 January 2016, requiring new reporting and public disclosure of information. This document is the second version of the Solvency and Financial Condition Report (SFCR) that is required to be published annually by Beazley Insurance dac (formerly Beazley Re dac (BIdac or the company)).
The report covers the business and performance of the company, its system of governance, risk profile, valuation for solvency purposes and capital management and has been approved by the board of directors.
In July 2017 the company received authorisation from the Central Bank of Ireland (CBI) to convert from a reinsurance company into a non-life insurance company permitted to transact business throughout the European Union. To that end the company was renamed Beazley Insurance dac. Subsequently the company established a branch network in the United Kingdom, France, Germany and Spain and operates across Europe and the UK on a freedom of services basis. The initial focus will be on specialty lines business. The company underwrote its first policies for European banks in the fourth quarter of 2017.
The company also continues to act as an intra-group reinsurer and provides capital to support the underwriting activities of its sister company, Beazley Underwriting Limited (BUL). BUL is a Lloyd’s of London corporate member. It participates in the Lloyd’s insurance market on a limited liability basis through syndicates 2623, 3622 and 3623. The company has an aggregate excess of loss reinsurance agreement with BUL. Under the terms of this agreement the company reinsures and indemnifies BUL in respect of all losses up to 75% of the declared result of BUL’s participation in syndicates 2623 and 3623. In the event that the declared result is a loss, the extent of the reinsurance is limited to the loss not exceeding 75% of the Funds at Lloyd’s less an excess of £2m.
In 2017 and going forwards the Solvency II technical provisions are now being calculated in line with a literal interpretation of the Solvency II regulation that considers the contract cash flows, particularly in relation to the aggregate excess of loss reinsurance agreement with BUL. The cash flows represent the premium (provided the declared result of BUL is a profit) or claim (in the case of a loss) paid in respect of BUL’s declared result and the fees for providing capital to support BUL’s reinsured underwriting at Lloyd’s. There were no other material changes during the year.
BIdac holds a level of capital over and above its regulatory requirements. As at 31 December 2017, total own funds were $1,601.3m, compared to the Solvency Capital Requirement of $650.4m. The amount of surplus capital held is considered on an ongoing basis in light of the current regulatory framework, opportunities for growth and a desire to maximise returns for the shareholder.

www.beazley.com02 Beazley Insurance dac Solvency and Financial Condition Report 2017
A. Business and performance
A.1 BusinessBeazley Insurance dac (BIdac or the company) is a company incorporated in Ireland.
The address of the registered office is: 2 Northwood Avenue Santry Dublin D09 X5N9 Ireland
The supervisor of BIdac and the Beazley group (the group) is the Central Bank of Ireland (CBI) and can be contacted at: Central Bank of Ireland PO Box 559 New Wapping Street, North Wall Quay, Dublin 1 Ireland
The independent auditor of the company is: KPMG 1 Harbourmaster Place IFSC Dublin D01 F6F5 Ireland
BIdac is a wholly owned subsidiary of Beazley Ireland Holdings plc, which is in turn wholly owned by Beazley plc.
The group operates across Lloyd’s of London, the US and Europe through a variety of legal entities and structures. The main entities within the legal entity structure are demonstrated in the diagram at the bottom of this page.
In July 2017 the company received authorisation from the CBI to convert from a reinsurance company into a non-life insurance company permitted to transact business throughout the European Union. To that end the company was renamed Beazley Insurance dac. Subsequently the company established a branch network in the United Kingdom, France, Germany and Spain and operates across Europe and the UK on a freedom of services basis. The initial focus will be on specialty lines business. The company underwrote its first policies for European banks in the fourth quarter of 2017.
The company also continues to act as an intra-group reinsurer and provides capital to support the underwriting activities of its sister company, Beazley Underwriting Limited (BUL). BUL is a Lloyd’s of London corporate member. It participates in the Lloyd’s insurance market on a limited liability basis through syndicates 2623, 3622 and 3623. The company has an aggregate excess of loss reinsurance agreement with BUL. Under the terms of this agreement the company reinsures and indemnifies BUL in respect of all losses up to 75% of the declared result of BUL’s participation in syndicates 2623 and 3623. In the event that the declared result is a loss, the extent of the reinsurance is limited to the loss not exceeding 75% of the Funds at Lloyd’s less an excess of £2m.
Beazley Insurance dac Beazley Group Ltd
Beazley Underwriting Ltd(Corporate member)
Beazley Furlonge Ltd(Managing agency)
Capital
Capital
Reinsurancecontract Beazley USA
Beazley Ireland Holdings plc
Third party capital providers
Quota share
Management
Quota share and surplus treaties
BeazleyUSA
Services,Inc.
(servicecompany)
BeazleyInsuranceCompany,
Inc.(admittedinsurancecompany;A rated)
Syndicate 2623
Syndicate 623
Syndicate 3622
Syndicate 6107
Syndicate 3623
Beazley plc
Syndicate 6050
Syndicate 5623** Syndicate 5623 is supported by both Beazley capital and third party capital.
Quota share

www.beazley.com Solvency and Financial Condition Report 2017 Beazley Insurance dac 03
A.1 Business continuedIn 2017, the company’s business consisted of four operating divisions. The following table provides a breakdown of net premiums written by division. During 2017 the life, accident and health division and political risks & contingency division were combined to form the political, accident & contingency division.
During 2017, as part of the company’s conversion from a reinsurance company to a non-life insurance company, the business underwritten by BUL through syndicate 3622 was removed from the aggregate excess of loss agreement between BIdac and BUL.
2017 2016
Marine 12% 12%Political, accident & contingency 8% 11%Property 23% 23%Specialty lines 57% 54%
The table below provides an analysis of the geographical breakdown of written premiums.
2017
%2016
%
US 64% 63%Europe 15% 14%Other 21% 23%Total 100% 100%
Premiums, claims and expenses by country, as disclosed in the appendix, presents the company’s business as being sourced from the UK. The business written in the year is predominantly sourced through the company’s excess of loss agreement with BUL (UK), with a small amount of business also sourced through the company’s newly established UK branch.
The value of insurance was brought home to millions of people in 2017 and Beazley’s claims teams responded swiftly, as they did in the wake of comparably severe events in 2011.
Natural catastrophes shine a spotlight on the claims paying ability of insurers, and particularly the speed with which funds can be dispatched to those in need. However, the less high profile work of claims teams who focus on other lines of business plays an equally important role. Beazley is often able to distinguish itself by the quality of the claims service provided for third party risks as well as first party risks: for many businesses a lawsuit can be just as damaging as a hurricane.
BIdac has a track record of premium growth, even in challenging markets, and in 2017 we delivered the high single digit growth we are targeting, with gross premiums written increasing 6% to $1,411.6m (2016: $1,333.6m). Profitable growth has proved steadily harder for insurers to achieve in recent years as premium rates for short tail, catastrophe exposed business have declined, but 2017’s catastrophe events have arrested these declines and – in the lines of business most directly affected – reversed them. Beazley is accordingly well placed for stronger growth in 2018.
Innovation is the lifeblood of a specialist insurer, which must stay ahead of the inevitable commoditisation that affects insurance products as much as any other products over time. Beazley has had notable successes in launching products that are entirely new to world markets, but innovation also consists of bringing products developed in one market to others. This approach has informed the thinking behind the geographic expansion of our specialty lines division, which began in earnest in 2017. The team identified an opportunity to offer products that are market-leading in the US – such as our cyber, management liability and medical malpractice policies – to clients in Europe, Asia and Latin America.
Another building block for future growth was put in place in July, when we received authorisation from the CBI to convert the company (previously a reinsurance company) into a non-life insurance company permitted to transact business throughout the European Union.
Looking forward, our business model should prove well adapted to the more favorable market conditions now prevailing. Beazley underwriters have shown patience and discipline through a difficult period during which the supply of capital in many parts of our market significantly outstripped demand, resulting in steadily falling prices. The expertise and dedication of our underwriters will be a necessary but not sufficient condition for profitable growth. We are also looking to our technology and operations teams to enhance our underwriters’ productivity and ensure that they have the data they need to make well informed decisions. Also, as in 2017, we will continue to rely heavily on the preparedness of our claims teams to redeem the promises we make to our policyholders. We are also enthusiastic about our first full year operating as an insurance company with branches in the UK and continental Europe.
While market conditions may improve across some of our product lines in 2018, Beazley’s core underwriting philosophy remains stable. Our underwriting approach of focusing on a diversified portfolio of risks remains a key component of our strategy and we are confident that we are well placed as we move into 2018.

www.beazley.com04 Beazley Insurance dac Solvency and Financial Condition Report 2017
A. Business and performance continued
A.2 Underwriting performanceData in the table below presents the GAAP underwriting performance by Solvency II line of business
2017
Incomeprotection
$m
Marine,aviation
andtransport
$m
Fire andother
damage to property
$m
GeneralLiability
$m
Credit and
suretyship$m
Miscellaneous financial loss
$mHealth
$mCasualty
$mProperty
$m
Other lifeinsurance
$m
Lifereinsurance
$mTotal $m
Net premiums written 26.1 174.1 243.6 778.6 35.9 26.3 22.5 18.5 92.4 (6.0) (0.6) 1,411.4Net earned premiums 32.0 169.2 237.6 709.1 27.5 25.1 21.3 18.5 93.7 – – 1,334.0Net claims incurred (21.0) (91.7) (185.5) (353.2) (28.5) (11.0) (11.3) 1.5 (68.6) – – (769.3)Expenses incurred (12.4) (77.7) (115.0) (292.1) (13.9) (8.5) (13.7) (9.4) (38.8) – – (581.5)Underwriting performance (1.4) (0.2) (62.9) 63.8 (14.9) 5.6 (3.7) 10.6 (13.7) – – (16.8)
2016
Incomeprotection
$m
Marine,aviation
andtransport
$m
Fire andother
damage to property
$m
GeneralLiability
$m
Credit and
suretyship$m
Miscellaneous financial loss
$mHealth
$mCasualty
$mProperty
$m
Other lifeinsurance
$m
Lifereinsurance
$mTotal $m
Net premiums written 37.5 164.9 231.0 702.7 29.9 21.5 19.5 11.1 98.6 15.5 1.4 1,333.6Net earned premiums 36.3 166.4 237.9 627.2 31.0 22.0 19.8 12.6 96.9 15.8 1.7 1,267.6Net claims incurred (25.6) (73.2) (91.7) (344.6) (11.2) (10.1) (7.2) 0.5 (27.1) (13.4) 0.1 (603.5)Expenses incurred (23.0) (78.0) (112.4) (243.0) (14.0) (13.9) (7.9) (8.4) (37.0) (5.2) (1.2) (544.0)Underwriting performance (12.3) 15.2 33.8 39.6 5.8 (2.0) 4.7 4.7 32.8 (2.8) 0.6 120.1
Geographical breakdownFrom a Solvency II perspective, the GAAP gross written premiums of $1,411.6m (2016: $1,333.6m) are all classified as originating from the United Kingdom (2016: United Kingdom). Profit before tax in the year was $95.8m (2016: $179.2m).

www.beazley.com Solvency and Financial Condition Report 2017 Beazley Insurance dac 05
A.2 Underwriting performance continuedGAAP segmental analysis
31 December 2017Marine
$m
Political, accident &
contingency$m
Property$m
Specialty lines
$m
Total reportable segments
$mUnallocated
$mTotal
$m
Segment resultsGross premiums written 174.1 113.3 326.1 798.1 1,411.6 – 1,411.6Net earned premiums 169.2 119.0 320.1 725.7 1,334.0 – 1,334.0Net investment income 13.3 8.1 25.6 79.8 126.8 – 126.8Revenue 182.5 127.1 345.7 805.5 1,460.8 – 1,460.8Net insurance claims (92.2) (61.9) (262.1) (355.0) (771.2) – (771.2)Net operating expenses (76.6) (59.3) (141.7) (296.1) (573.7) – (573.7)Foreign exchange loss – – – – – (5.2) (5.2)Finance costs – – – – – (14.9) (14.9)Expenses (168.8) (121.2) (403.8) (651.1) (1,344.9) (20.1) (1,365.0)Profit on ordinary activities before tax 13.7 5.9 (58.1) 154.4 115.9 (20.1) 95.8
31 December 2016Marine
$m
Political, accident &
contingency$m
Property$m
Specialty lines
$m
Total reportable segments
$mUnallocated
$mTotal
$m
Segment resultsGross premiums written 164.9 145.1 313.4 710.2 1,333.6 – 1,333.6Net earned premiums 166.4 148.6 316.6 636.0 1,267.6 – 1,267.6Net investment income 14.1 9.4 32.5 72.7 128.7 – 128.7Revenue 180.5 158.0 349.1 708.7 1,396.3 – 1,396.3Net insurance claims (73.8) (68.8) (117.0) (352.4) (612.0) – (612.0)Net operating expenses (77.5) (67.3) (143.3) (241.5) (529.6) – (529.6)Foreign exchange loss – – – – – (75.5) (75.5)Expenses (151.3) (136.1) (260.3) (593.9) (1,141.6) (75.5) (1,217.1)Profit on ordinary activities before tax 29.2 21.9 88.8 114.8 254.7 (75.5) 179.2
Continued decline in rates, particularly for energy business, took a toll on the marine division’s results in 2017, with reserve releases from previous years also down.
The political risks and contingency division performed well in 2017 in markets that continued to be competitive for both political and terrorism risks. They also experienced event cancellation losses as a result of the natural catastrophes that occurred in 2017. The division was also impacted by the closure of Beazley’s Australian underwriting operations.
Beazley’s property division results were directly impacted by the catastrophe events in 2017.
Beazley’s specialty lines division continued to grow strongly in 2017, writing gross premiums of $798.1m (2016: $710.2m). As in recent years, the main engine of growth was the US, where Beazley has had a local presence for over a decade and demand for our specialist products has been strong. During 2017, BIdac also bound its first direct insurance risks through our specialty lines division, contributing $0.6m to the gross premiums written during the year.

www.beazley.com06 Beazley Insurance dac Solvency and Financial Condition Report 2017
A. Business and performance continued
A.3 Investment performanceSummary of investment return
Investment return2017
$m2016
$m
Share of Lloyd’s syndicates investment income 80.3 66.1Income derived from financial assets 33.4 12.2Income from intercompany financing arrangements 19.0 17.3Investment income 132.7 95.6Fair value gain on derivative – 41.4
132.7 137.0Investment expenses and charges (5.9) (8.3)Total 126.8 128.7
Income derived from financial assets represents the return on BIdac surplus and FAL assets and it is the detail of these assets that is shown below.
Summary of investment return in respect of investment assets only 2017 2016
% $m % $m
Income from Funds at Lloyd’s – 33.4 – 12.2Fair value gain on derivative – 1.1 – 1.0Investment expenses and charges – (1.4) – (1.3)Total 2.6 33.1 1.2 11.9
Income and expenses by asset class excluding derivatives ($m)
2017Fixed
interest
Capital growth
EquityHedge funds
Total $m
Income 21.1 10.1 2.2 33.4Expenses (1.1) (0.1) (0.2) (1.4)
2016
Capital growthFixed
interest EquityHedge funds
Total $m
Income 9.8 0.2 2.2 12.2Expenses (1.2) – (0.1) (1.3)
Expense allocations by asset class are estimates.

www.beazley.com Solvency and Financial Condition Report 2017 Beazley Insurance dac 07
A.3 Investment performance continuedBreakdown of total return on investment assets (%)
2017Fixed
interest
Capital growth
EquityHedge funds Total %
Total $m
Total return 1.8 21.0 4.9 12.3 2.6 33.1
2016Fixed
interest
Capital growth
EquityHedge funds Total %
Total $m
Total return 1.3 5.0 3.9 3.6 1.2 11.9
Investment assets produced a total return of 2.6% in 2017 against a return of 1.2% in 2016. The higher return was driven by the strong performance of the capital growth assets, with equities generating particularly strong returns. Fixed income assets performed well as credit spreads narrowed throughout the year. A pro-active approach to duration management limited the impact of rising yields.
There were no gains and losses recognised directly in equity (2016: nil) and there are currently no investments in structured securities and no plans to add exposure during 2018.
A.4 Performance of other activitiesBIdac has no material income or expenses other than the income and expenses included within the segmental in A.2 and A.3.
A.5 Any other informationThere are no material leasing arrangements in place (2016: nil).

www.beazley.com08 Beazley Insurance dac Solvency and Financial Condition Report 2017
B. System of governance
B.1 General information on the system of governanceThe Beazley Insurance dac (BIdac or the company) board has a majority of independent non-executive directors. The chairman is an independent non-executive director.
The board retains ultimate authority for all strategic issues and management decisions of BIdac including effective, prudent and ethical oversight as well as setting the company strategy and ensuring that risk and compliance are properly managed. The board may delegate its powers for review and research purposes within specific terms of reference to committees and working groups. The committees and working groups act in an advisory capacity to the board.
The BIdac board has formed the following sub committees:• audit committee; and• risk and compliance committee.
These committees have the power to carry out activities on behalf of the board to the extent of the authority delegated to them by the board, as set out in their terms of reference.
The board has also established a number of executive committees or groups:• reinsurance underwriting working group;• insurance underwriting group;• regulatory review committee;• operations group; and• branch manager committee.
The general manager has responsibility for operations, compliance and performance which includes the smooth running of the business and effective function of the day-to-day operations of BIdac and for any changes thereto.
The key functions of risk management, actuarial, internal audit and compliance are all supported by the Beazley group functions under the terms of an intragroup service agreement between BIdac and Beazley Management Limited (BML). BIdac has a head of compliance, head of actuarial function and chief risk officer as approved by the Central Bank of Ireland (CBI).
A review of the systems of governance is carried out annually and the 2017 review concluded that no actions were required. As part of the conversion to writing direct business a number of new executive committees were set up as outlined above.
Remuneration policy and practicesThe board has adopted a remuneration policy which is overseen and reviewed by the Beazley plc remuneration committee.
The main aim of the policy is to ensure that management and staff are remunerated fairly and in such a manner as to facilitate the recruitment, retention and motivation of suitably qualified personnel.
Elements of remuneration
Base salary
Benefits• Benefits may include private medical insurance,
travel insurance, and company car or monthly car allowance
Pension • Defined contribution pension plan or cash equivalent
Annual bonusDeferral into shares • Discretionary annual bonus from an incentive
pool generated by reference to ROE and awarded based on individual performanceDeferral into underwriting
Long term incentive plan • Three and five year LTIP time horizons• Performance against long term NAVps targets
Shareholding guidelines • LTIP awards may be forfeited if shareholding guidelines are not met
Fixed remuneration Variable remuneration

www.beazley.com Solvency and Financial Condition Report 2017 Beazley Insurance dac 09
B.1 General information on the system of governance continuedBeazley believes that:• performance-related remuneration is an essential motivation to management and staff and should be structured to ensure
that executives’ interests are aligned with those of shareholders;• individual rewards should reflect the group objectives and be dependent on the profitability of the group but should
be appropriately balanced against risk considerations;• the structure of packages should support meritocracy, an important part of Beazley’s culture;• reward potentials should be market-competitive; and• executives’ pay should include an element of downside risk.
Beazley’s policy is to maintain a suitable balance between fixed and variable remuneration which will vary depending on an individual’s role and seniority.
Independent non-executive directors’ fees comprise payment of an annual basic fee and additional fees to reflect specific responsibilities, where applicable. No independent non-executive director participates in the group’s incentive arrangements or pension plan.
The following tables set out the additional incentive arrangements for staff within the organisation other than executive directors of Beazley plc:
Element Objective Summary
Profit related pay plan To align underwriters’ reward with the profitability of their account.
Profit on the relevant underwriting account as measured at three years and later.
Support bonus plan To align staff bonuses with individual performance and achievement of objectives.
Participation is limited to staff members not on the group executive or in receipt of profit related pay bonus. The support bonus pool may be enhanced by a contribution from the enterprise bonus pool.
Retention shares To retain key staff. Used in certain circumstances. Full vesting dependent on continued employment over six years.
The remuneration committee regularly reviews remuneration governance in the context of Solvency II remuneration guidance, other corporate governance developments and institutional shareholders’ guidance. The group chief risk officer reports annually to the remuneration committee on risk and remuneration as part of the regular agenda. The committee believes the group is adopting an approach which is consistent with, and takes account of, the risk profile of the group.
All employees of BIdac may participate in a defined contribution pension plan, which is non-contributory, and are offered benefits such as private medical insurance and permanent health insurance. Beazley also operates an Irish Revenue-approved SAYE scheme for the benefit of Irish-based employees of the group.
The performance criteria on which variable components of remuneration are based are as follows:
Incentive plan Performance measures Why performances measures were chosen and target is set
Annual bonus plan Profit and ROE, risk adjustment, individual performance.
• The committee believes the approach to the determination of bonuses creates alignment to shareholders’ interests and ensures that bonuses are affordable, while the ROE targets increase the performance gearing and the risk adjustment is consistent with and promotes effective risk management.
• The committee reviews the bonus pool framework each year to ensure that it remains appropriate and targets are set taking into account the prevailing environment, interest rates and expected investment returns, headcount and any other relevant factors.
• A key principle of the process is that the committee exercises its judgement in determining individual awards taking into account the individual’s contribution and performance.

www.beazley.com10 Beazley Insurance dac Solvency and Financial Condition Report 2017
B. System of governance continued
Incentive plan Performance measures Why performances measures were chosen and target is set
Profit related pay (PRP) To align the interests of the group and the individual through aligning underwriters to the long-term profitability of their portfolio. Profit related pay is awarded irrespective of the results of the group.
• Underwriters that have significant influence over a portfolio are offered this arrangement. There is no automatic eligibility.
• This bonus is awarded as cash and is based on the performance of the individual’s account as measured by the results following the Q3 peer review in the third year. Under the profit related plan payments are aligned with the timing of profits achieved on the account. For long-tail accounts this may be in excess of six years. If the account deteriorates then payouts are ‘clawed back’ through adjustments to future payments.
• Targets are set through the business planning process and reviewed by a committee formed of executive committee members including the chief risk officer and functional specialists including group actuary and head of talent management.
• From 2012 onwards any new profit related pay plans may be at risk of forfeiture or reduction if, in the opinion of the remuneration committee, there has been a serious regulatory breach by the underwriter concerned, including but not limited to the group’s compliance, bribery, conflicts of interest or conduct risk policies.
Deferred share plan Award of nil cost share awards. Generally awarded as a deferred element of the annual bonus.
• This is a discretionary award. • Vesting is dependent on continued employment for three years.• An element of all bonuses (including those from the variable incentive pool),
apart from PRP, may be awarded in deferred shares.• Awards from this plan may also be awarded with performance conditions
in special circumstances, for example, recruitment.Long term incentive plan
Award of shares to align the senior employees to the out-performance of the group by setting stretching performance targets over the longer-term growth in net asset value per share (NAVps) over three years and five years.
• Creates alignment to one of Beazley’s key performance indicators. • The committee reviews the NAVps targets periodically to ensure they
remain appropriate with reference to the internal business plan, the external environment and market practice.
• In the event that NAVps were to become unsuitable as a performance measure in the opinion of the committee (for example due to a change in accounting standards) the committee would substitute a measure which followed broadly similar principles.
Investment in underwriting
The plan mirrors investment in an underwriting syndicate.
• The Beazley staff underwriting plan provides for participants to contribute personal capital to Beazley syndicates. Selected staff are invited to participate through bonus deferral with an element of cash incentives ‘at risk’ as capital commitments.
Malus To include provisions that would enable the company to recover sums paid or withhold payment of any sum in circumstances when it would be appropriate to do so.
• Malus provisions apply to the LTIP and deferred shares whereby the committee has the discretion to reduce or withhold an award in certain circumstances.
During 2017 one senior individual was granted an award of deferred shares with performance conditions relating to the performance of SL international from 2017-2019 inclusive.
B.1 General information on the system of governance continued

www.beazley.com Solvency and Financial Condition Report 2017 Beazley Insurance dac 11
B.2 Fit and proper requirementsOur approach is to ensure that all key functions are identified with prescribed responsibilities allocated and that persons who effectively run the undertaking or have other key functions, and are important to the sound and prudential management of the undertaking, fulfil the following requirements:• their professional qualifications, knowledge and experience
are adequate to enable sound and prudent management (fit);• they are of good repute and integrity (proper); and• they currently meet and annually subscribe to continue
to meet all relevant supervisory standards.
Beazley group’s policy is that CBI pre-approved controlled functions (PCFs) and controlled functions (CFs) must meet the fitness and probity standards as required by the CBI, and in that regard we will ensure compliance with the provisions of Solvency II, to which the CBI regime is aligned.
BIdac seeks to ensure that members of the BIdac governance bodies, all PCFs and CFs (collectively – ‘approved persons’) possess sufficient professional qualifications, knowledge and experience in the relevant areas of the business to give adequate assurance that they are collectively able to provide a sound and prudent management of the company. The assessment of whether a person is ‘fit’ shall take account of the respective duties allocated to that person and, where relevant, the insurance, financial, accounting, actuarial and management skills of the person. In the case of members of the board, the assessment shall take account of the respective duties allocated to individual members to ensure appropriate diversity of qualification, knowledge and relevant experience to ensure that the business is managed and overseen in a professional manner.
Additionally our policy is to assess the fitness of approved persons against the key competencies required by the CBI, namely:• conduct to be competent and capable – a person shall
have the qualifications, experience, competence and capacity to the relevant function;
• conduct to be honest, ethical and to act with integrity – a person must be able to demonstrate that his or her ability to perform the relevant function is not adversely affected to a material degree; and
• financial soundness – a person shall manage his or her affairs in a sound and prudent manner.
Our policy is to apply this approach to both external and internal appointments. We then tailor individual development plans, including mentoring as appropriate, for the appointee to ensure that they are able to fulfil their obligations in their approved person roles.
B.3 Risk management system including the own risk and solvency assessmentRisk management strategyThe BIdac risk committee provides oversight of the risk management framework and reports to the BIdac board. BIdac’s risk management sits within and is in accordance with the group’s overall risk management framework.
Clear roles, responsibilities and accountabilities are in place for the management of risks and controls, and all employees and BML staff working on behalf of the company are aware of the role they play in all aspects of the risk management process, from identifying sources of risk to their part in the control environment. The impact of each risk is recorded in the risk register on a 1:10 likelihood of that risk manifesting in the next 12 months. A risk owner has been assigned responsibility for each risk, and it is the responsibility of that individual to periodically assess the impact of the risk and to ensure appropriate risk mitigation procedures are in place. External factors facing the business and the internal controls in place are routinely reassessed and changes are made when necessary. On an annual basis, the board agrees the risk appetite for each risk event and this is documented in the risk management framework document. The residual financial impact is managed in a number of ways, including:• mitigating the impact of the risk through the application
of controls;• transferring or sharing risk through outsourcing and
purchasing insurance and reinsurance; and• tolerating risk in line with the risk appetite.
In addition, the following risk management principles have been adopted:• risk management is a part of the wider governance
environment;• techniques employed are fit for purpose and proportionate
to the business;• risk management is a core capability for all employees;• risk management is embedded in day-to-day activities;• there is a culture of risk awareness, in which risks are
identified, assessed and managed;• risk management processes are robust and supported
by verifiable management information; and• risk management information and reporting is timely, clear,
accurate and appropriately escalated.

www.beazley.com12 Beazley Insurance dac Solvency and Financial Condition Report 2017
B. System of governance continued
B.3 Risk management system including the own risk and solvency assessment continuedRisk management frameworkBeazley has adopted the ‘three lines of defence’ framework: namely business risk management, the risk management function and the internal audit function. Within business risk management, there are two defined risk and control roles: risk owner and control reporter. Each risk event is owned by the risk owner who is a senior member of staff. Risk owners, supported by the risk management team, formally perform a risk assessment twice a year, including an assessment of heightened and emerging risks.
Business risk managementRisk ownership
– Identifies risk– Assesses risk– Mitigates risk– Monitors risk– Records status– Remediates when required
Risk managementRisk oversight
– Are risks being identified?– Are controls operating effectively?– Are controls being signed off?– Reports to committees and board
Internal auditRisk assurance
– Independently tests control design– Independently tests control operation– Reports to committees and board
The risk management framework comprises a number of risk management components, which when added together describe how risk is managed on a day to day basis. The framework includes a risk register that captures the risk universe (55 risk events grouped into eight risk categories: insurance, market, credit, liquidity, operational, regulatory and legal, group and strategic), the group risk appetite set by the Beazley plc board and cascaded to BIdac and other subsidiaries, and the control environment that is operated by the business to remain within the risk appetite. The following diagram illustrates the components of the risk management framework.
Risk register Control assessment (monthly)
Consolidated assurance report (quarterly)
Report to committees and boards
Risk incidents reporting (monthly)
Risk appetite(annual)
Risk assessment(biannual)
Stress and scenario framework(annual)
Risk profiles(ad hoc)
Strategic and emerging risk(annual)
Control performance aggregation (monthly)
Key risk indicators(quarterly)Internal model Control validation
(monthly)
In summary, the board identifies risk, assesses risk and approves risk appetite. The business then implements a control environment which describes how the business should operate to stay within risk appetite. Risk management then reports to the board on how well the business is operating using a consolidated assurance report. For each risk, the consolidated assurance report brings together a view of how successfully the business is managing risk, qualitative commentary from the assurance functions and whether there have been any events that we can learn from (risk incidents). Finally, the framework is continually improved, through the consideration of stress and scenario testing, themed reviews using risk profiles and an assessment of strategic and emerging risks.
A suite of risk management reports are provided to the boards and committees to assist senior management and board members to discharge their oversight and decision making responsibilities. The risk reports include the risk appetite statement, the consolidated assurance report, risk profiles, stress and scenario testing, reverse stress testing, an emerging and strategic report, a report to the remuneration committee and the Own Risk and Solvency Assessment (ORSA) report.
The internal audit function considers the risk management framework in the development of its audit universe to determine its annual risk-based audit plan. The plan is based on, among other inputs, the inherent and residual risk scores as captured in the risk register. Finally, a feedback loop operates, with recommendations from the internal audit reviews being assessed by the business and the risk management function for inclusion in the risk register as appropriate.

www.beazley.com Solvency and Financial Condition Report 2017 Beazley Insurance dac 13
B.3 Risk management system including the own risk and solvency assessment continued Own risk and solvency assessmentThe Solvency II directive indicates that the ORSA is ‘the entirety of the processes and procedures employed to identify, assess, monitor, manage, and report the short and long term risks a company faces or may face and to determine the own funds necessary to ensure that the undertaking’s overall solvency needs are met at all times’.
In other words, the ORSA is the consolidation of a collection of processes resulting in the production of a quarterly report to provide risk committees and boards with sufficient information to enable an assessment of the short term and long term risks faced by the entity and the capital required to support these risks.
The majority of these underlying processes have existed at Beazley for some time and so an important role of the ORSA is to ensure that the timing of these processes are coordinated in order to provide the appropriate management information in a timely manner.
Beazley’s interpretation is that there are three parts to the ORSA deliverables:• ORSA governance;• ORSA processes: coordination of a number of underlying processes; and• ORSA reports: summary of the findings from these processes.
ORSA governanceThe risk management function is responsible for the coordination of the ORSA process and the production of the ORSA report.
The ORSA process is run regularly on a quarterly basis (unless the risk profile significantly changes, see below). As the underlying processes are not all updated on a quarterly basis, we will use the latest version of each. The timeframes and interactions between the underlying processes over a typical year are set out below.
The risk committee will oversee an ad hoc ORSA outside this regular reporting period when there has been a material change to the risk profile or the environment within which BIdac is operating. The triggers for such an ad hoc ORSA are:• major internal model changes as per the model change policy;• new business plan is submitted to the CBI; and• any other changes deemed by the board to be significant.
Subsidiary Boards (BICI, BFL, BIdac)
Beazley PLC Board and Committees
Board risk committees (BICI, BFL, BIdac)
Pillar I Pillar II Pillar III
Oversight Committee
Working Group
Risk and Regulatory committee Audit Committee
Internal Model Group (IMG) N/A Regulatory review Committee
Committee and board oversightAn ORSA report is produced after the completion of each ORSA process for review. The BIdac ORSA is reviewed by the risk committee on a quarterly basis. In addition to providing challenge from a non executive perspective, this review also forms part of the quality assurance process. The ORSA is then presented to the board for consideration and approval.
On an annual basis, a more detailed year end ORSA is produced for submission to the CBI. This regulatory ORSA combines the contents of the quarterly ORSAs reviewed by the board. In addition, it contains any other supporting information requested by the CBI such as policies and supplementary evidence. An assessment is made against the regulatory guidance prior to submission to regulators to ensure that the ORSA meets the relevant regulatory requirements.

www.beazley.com14 Beazley Insurance dac Solvency and Financial Condition Report 2017
B. System of governance continued
B.3 Risk management system including the own risk and solvency assessment continuedThe risk committee and board evidence the consideration of the ORSA by way of minutes to demonstrate the discussion, decision making and actions taken as a result of the ORSA.
The ORSA is subject to an independent review by internal audit as part of their risk based audit.
Relationship between the internal model and the ORSA The internal model is an important input into the ORSA. The ORSA uses the same internal model and basis as that used to estimate the Solvency Capital Requirement (SCR) and so there is no difference in the recognition and valuation bases. Any limitations of the internal model relevant to the ORSA will be discussed in the regulatory ORSA.
A single Group ORSA has been performed. Beazley uses an internal model to calculate the SCR. The purpose of the internal model is to lower all financially quantifiable risks. Any risks not covered by the internal model are considered in the ORSA report.
ORSA processThe underlying processes that make up Beazley group’s ORSA process are summarised in the table below. BIdac’s ORSA is included within this overall process and incorporates all of these elements.
Process Process owner / oversight committee
Group strategyBi annual strategy and performance group meetingsAnnual board strategy away dayMonthly monitoring of the strategic initiatives by the executive committee
Chief executiveExecutive committee
Risk appetiteApprove risk appetite statementsApprove annual risk appetite levels for Beazley Insurance Company Inc. (BICI)Approve annual risk appetite levels for Beazley Furlonge Limited (BFL)Approve annual risk appetite levels for BIdac
Chief risk officerBoards
Risk assessment – currentRisk profileConsolidated assurance report:• control performance and comments from assurance function;• comparison of residual risk score with risk appetite; and• risk incident log entries.Assessment of key risk indicatorsExposure managementChanges to risk profile
Chief risk officerRisk and regulatory committee
Risk assessment – futureBi annual risk assessment with risk ownersAnnual review of strategic and emerging risksRisk profiles
Chief risk officerRisk and regulatory committee
Stress and scenario testingStress testingScenario testingReverse stress testing
Chief risk officerRisk and regulatory committee
One year business planChallenge process overseen by underwriting committee Formal report produced by underwriting committee
Chief underwriting officerUnderwriting committee
Regulatory capital assessmentParameterised from one year business planAnalysis of change and capital requirement agreed with regulators
Chief risk officerRisk and regulatory committee
Economic capital assessmentCapital required to achieve and maintain rating agency ratingsCapital fungibilityEstablish dividends in line with dividend strategy
Finance directorExecutive committee
Five year business planBi annual update of the five year planConsideration of a number of scenarios based on macro economic trendsAssessment of capital requirements under each scenarioIdentification of capital and dividend stress points
Chief underwriting officerExecutive committee

www.beazley.com Solvency and Financial Condition Report 2017 Beazley Insurance dac 15
B.3 Risk management system including the own risk and solvency assessment continuedThe current timetabling of the underlying processes throughout a typical year is illustrated below. The shaded months indicate when the ORSA process occurs and the report is provided to the risk and regulatory committee for onwards reporting to committee and boards.
Each of the four regular ORSA processes has been aligned with the timing of the cascade of reporting to the risk committees, subsidiary boards and the Beazley plc board. An ORSA report will be produced after the completion of each ORSA process to address the required confirmation statements, set out the key themes arising from the underlying processes and summarise any action being proposed.
Timetabling during a typical year
Underlying business processes
Strategy
One year business plan
Regulatory capital assessmentRisk assessment (current)Risk assessment (future)
Five year business plan
Economic capital assessmentCapital fungibility assessment
Jan Feb Mar Apr May Jun Jul Aug Sep Oct Nov Dec
The linkages between the underlying processes are illustrated below. Each process will take the most up to date information from other processes.
Linkages between underlying processes
Business profile
Five year planOne year plan
Risk assessment ( future)
Stress testingStress testing
Risk assessment (current)
Strateg y
Regulatory capital Economic capital
Capital strateg y

www.beazley.com16 Beazley Insurance dac Solvency and Financial Condition Report 2017
B. System of governance continued
B.4 Internal control systemBeazley’s internal control system includes administrative and accounting procedures, an internal control framework, appropriate reporting arrangements at all levels of the business and a compliance function. It is designed to:• secure compliance with applicable laws, regulations and
administrative processes, the effectiveness and efficiency of operations in view of the business objectives and the availability and reliability of financial and non-financial information;
• ensure that adequate and orderly records of the business and internal organisation are maintained; and
• create a strong control environment with control activities that are adequately aligned to the risks of the business and the group’s processes.
The effectiveness of the internal control system is monitored regularly to ensure that it remains relevant, effective and appropriate.
Beazley operates a three lines of defence framework and the actuarial function and the three assurance functions of compliance, risk management and internal audit are defined as ‘required’ functions under the SII framework. Each function is structured so that it is free from influences which may compromise its ability to undertake its duties in an objective, fair and independent manner and in the case of the internal audit function in a fully independent manner.
The board receives assurance that the business is operating how it expects from the following required functions:• the actuarial function provides assurance that the reserves
held on the balance sheet are appropriate;• the compliance function provides assurance that Beazley is
operating within the relevant legal and regulatory framework.• the risk management function provides assurance that the
business is operating within risk appetite; and• the internal audit function provides assurance that the
whole internal control framework (including the activities of the other functions set out above) is designed and operating effectively.
Compliance functionThe BIdac board of directors is ultimately responsible for oversight of the company’s compliance with its regulatory requirements. The board has set a residual minimal risk appetite for regulatory breaches and sanctions. The board is committed to ensuring that the company adopts a compliant culture that is cascaded throughout the organisation. Directors, senior management and staff are all expected to comply with these high standards of ethical business conduct.
The company has formally appointed its own head of compliance reporting to the Beazley global head of compliance and the BIdac risk and compliance committee. The BIdac head of compliance is responsible for the oversight of compliance risk, the formulation and delivery of the annual compliance plan.
In accordance with the terms of the management services agreement between BIdac and BML, compliance support is also provided to BIdac through the group compliance function where appropriate. Where necessary additional compliance resource is appointed on a contract basis.
The compliance function’s two overarching activities, advisory and monitoring, fit within the three lines of defence as follows. • Advisory (first line of defence) – assessing the potential
impact of changes in the legal and regulatory environment to the company. Advising the business on the proper application of upcoming and existing regulatory requirements in relation to both, business as usual, and project activities. Amending policies and procedures accordingly and providing corresponding training where necessary.
• Monitoring (second line of defence) – monitoring provides assurance that the company’s regulatory policies and procedures are being adhered to, which in turn ensures the business operates within established external regulatory requirements.
The function’s other key activities are summarised below:
Regulatory relationships: The company seeks to maintain positive and transparent relationships with the CBI and host state regulators where BIdac conducts Freedom of Establishment and Freedom of Services business.
Authorisations, licences and permissions: The function is responsible for obtaining the necessary authorisations, licences and permissions for the company.
Group policies – The function supports a defined suite of the group’s policies and makes amendments, where necessary, in order to ensure relevant policies meet BIdac’s requirements. The polices include as follows:• financial crime – This policy is owned by the compliance
function, which is responsible for setting and disseminating the policy and its control framework. Compliance also conducts second line of defence activities as enumerated in the policy.
• sanctions – This policy is owned by the group head of compliance and the function is primarily responsible for 1) advising on appropriate preventative controls, 2) monitoring that the controls are being implemented by the proper business functions and 3) to perform enhanced due diligence when required by the policy.
• anti-fraud – This policy is owned by the group head of compliance and the function is primarily responsible for 1) maintaining and communicating this policy, 2) delivering mandatory anti-fraud training and 3) monitoring the application of the policy when alerted to a potential fraud.

www.beazley.com Solvency and Financial Condition Report 2017 Beazley Insurance dac 17
B.4 Internal control system continuedReporting: The function provides regular reports to the BIdac board, board committees and other committees in the governance framework. The reports typically either facilitate oversight of the function’s activities or provide updates on internal and external regulatory matters.
Regulatory returns: There are a number of regulatory returns that have to be submitted to the CBI. The function plays a key role to ensure that such reports are filed with the CBI in a timely fashion.
Regulatory breaches: The function is responsible for reporting regulatory breaches both within the internal governance framework and externally as required.
Product development: The function provides regulatory and legal assistance during the launching of new products or expansion of current products. Assistance is usually through researching relevant laws and regulations and providing advice to ensure products are developed in line with the company’s regulatory risk appetite.
Complaints – The responsibility for ensuring that complaints are handled appropriately and in accordance with Beazley’s complaints handling policy ultimately rests with the relevant regulated board. The complaints team which is part of the operations function is responsible for the complaints policy. The compliance function assists with complaints activity for example by reviewing responses to complaints and by monitoring the effectiveness of the complaints handling process.
B.5 Internal audit functionBeazley has established an internal audit function, the purpose of which is to provide independent and objective assessments of the design and operating effectiveness of the system of internal controls covering the integrity of financial statements and reports, compliance with laws, regulations, and corporate policies and the effective management of risks faced by Beazley in executing its strategic and tactical operating plans.
The internal audit function reports to the BIdac audit committee.
The internal audit teamThe internal audit function has a head count of nine staff including the head of internal audit. The majority of the team, including the head of internal audit, is based in Beazley’s London office. Three members of staff are based in the group’s Farmington office in Connecticut, USA. In addition to its headcount the internal audit function has an additional budget which it uses to supplement its team with subject-matter expertise.
Co-sourcingThe internal audit function is supported by a co-sourcing arrangement with professional service providers to supplement the audit team with expertise where required to complete the internal audit plan.
Internal audit universe and planThe internal audit function has developed an audit ‘universe’ for BIdac. This universe represents the potential range of business areas and topics – known as ‘audit entities’ – that internal audit reviews. The universe includes business activities undertaken for BIdac by the group. Using a risk based methodology, these audit entities are prioritised with a view to ensuring that the most material or highest risk audit entities are audited most frequently. The frequency with which audit entities are reviewed is also considered in light of regulatory or other external requirements. The internal audit strategy is to review all of the audit entities at least once on a rolling four year basis.
The audit universe – and the resulting annual audit plan – is reviewed and approved annually by the Beazley plc audit and risk and the BIdac audit committee. The group plan consists of dedicated BIdac audits and group-wide audits which cover business activity undertaken by the group on BIdac’s behalf. Typically audit plans consist of between 15-25 individual internal audit reviews a year and cover topics which include: underwriting, operational, IT and finance operations; governance; risk management and compliance; and projects and programmes.
BIdac audit committee receives information on all audits and findings of relevance to BIdac, in addition to the specific BIdac audits.
Management actions and verification workAn established part of the internal audit process includes undertaking work to verify that management has adequately completed their audit actions.
Internal audit then performs verification work on a risk-based approach. To date, where verification work has been undertaken it has been very rare for the internal audit function to identify issues with the actions management have confirmed they would implement. Some examples of verification include but are not limited to:• reviewing documentation; • re-performing the control; and • reviewing updated documentation.
Any overdue audit actions are reported to the various committees as part of ongoing reporting.

www.beazley.com18 Beazley Insurance dac Solvency and Financial Condition Report 2017
B. System of governance continued
B.5 Internal audit function continuedIndependence and objectivityBeazley’s plc audit and risk committee undertake the formal oversight of the internal audit function’s independence and objectivity is maintained in a number of ways:• the head of internal audit reports to a non-executive director
(the chair of the plc audit and risk committee), and for operational matters to the chief executive officer;
• the BIdac audit committee annually reviews and approves an internal audit charter that sets out the roles and responsibilities of the head of internal audit and the internal audit function. The internal audit function is not mandated to undertake any form of business activity and its remit is restricted to assurance and consultation work;
• the internal audit plan is approved by the Beazley plc audit and risk committee and BIdac audit Committee (non-executive committee);
• the head of internal audit rotates staff between audit assignments to ensure objectivity and independence; and
• the head of internal audit must provide annual representations to the committee on the ongoing independence and objectivity of the internal audit function.
B.6 Actuarial functionBIdac has a head of actuarial function. Actuarial services are provided under the management services agreement with BML by the group function located in London. The actuarial function provides professional actuarial advice to BIdac in a range of areas, including business planning, pricing support and reserving.
The actuaries that comprise the actuarial function are fellows/students of the Institute of Actuaries (or equivalent) and operate under the standards set out by the Institute of Actuaries and the Board for Actuarial Standards (or equivalent).
The head of actuarial function is a member of the group underwriting committee and this involvement forms the basis of reporting to the BIdac reinsurance underwriting working group.
The head of actuarial function is responsible for producing an annual actuarial opinion on technical provisions to be submitted to the CBI in accordance with the Solvency II annual quantitative reporting templates. In addition, the head of actuarial function must present an actuarial report on technical provisions, at least in summary form, to the board at the same time as the actuarial opinion on technical provisions and in full within two months of that date.
In addition the head of actuarial function role must provide: • an opinion on the underwriting policy; and• a contribution to the risk management system (including
the opinion on the ORSA).
Board interactionThe group actuary and the actuarial function have a number of interactions with the board and its various committees. Examples of this include (but are not limited to):• the peer review committee, delegated from the underwriting
committee, carries out detailed review of reserves. Here, the members of the actuarial function present details of their reserving output as well as that from the underwriting teams;
• the group actuary is a member of the underwriting committee and the BIdac reinsurance underwriting working group, and presents to those committees on a number of areas including pricing, rate change and reserving (including summary output from the peer review committee);
• the group actuary (or members of the actuarial function) presents summary output from the peer review committee to the BFL audit committee, BIdac audit committee and Beazley plc audit and risk committee;
• the group actuary (or members of the actuarial function) presents the BFL audit committee with results of the technical provision valuation;
• the group actuary (or members of the actuarial function) presents the BFL, BIdac and Beazley plc audit committees with the actuarial function report;
• the group actuary has Knowledge Requirements of An internal Model (KRAM) meeting with both executive and non-executive directors. These are one to one meetings, used to discuss various outputs from the actuarial function. This is in addition to committee presentation, and enables greater detailing and questioning. These meetings occur with a number of relevant directors, and are scheduled once or twice a year;
• the group actuary has regular one on one catch ups with the Beazley plc chief executive officer, chief financial officer, chief underwriting officer and chair of the audit committee when required; and
• the group actuary is a member of the strategy and performance group which includes all members of the executive committee as well as certain other senior management.

www.beazley.com Solvency and Financial Condition Report 2017 Beazley Insurance dac 19
B.6 Actuarial function continuedInteraction with other key functionsThe actuarial function at Beazley interacts with key functions as summarised below:
Function Relationship
Underwriting teams The actuarial function provides support and challenge during the business planning process, support on pricing of risks and development of pricing tools and analyses in support of reinsurance purchase and optimisation.
Claims teams The actuarial function interacts with claims managers throughout the quarterly claims reserving process and particularly during the pre peer reviews where individual assessments are reviewed.
Risk management The actuarial function reviews the initial reserve risk ranges from the internal model and adjusts the range in specific cases where it is not deemed appropriate.
The risk function provides the actuarial function with internal model output and assumptions for use in the calculation of the bad debt and risk margin components of the technical provisions.
The actuarial function provides the chief risk officer with reserve surplus and reserve strength metrics for reference in the ORSA and is involved in a number of other areas of the ORSA.
Talent management Support the training and development needs of the actuarial function such that a professional staff can be maintained with sufficient skills, experience and professional qualifications to meet the requirements of the actuarial function.
Data management The actuarial function is a key consumer of data at Beazley and that data is managed by the data management team. The data management team and various business system owners ensure that the actuarial function has the internal data necessary to discharge its responsibilities. The key data inputs for the actuarial function are the gross and net triangles produced on a monthly basis.
The head of actuarial function is the business system owner for ResQ, the reserving software.
Finance The actuarial function and finance function work closely together, particularly during the valuation of insurance liabilities on an underwriting year, GAAP or Solvency II basis. The finance function provides the expense provision valuation for technical provisions.
IT The actuarial function relies on IT for the maintenance of its hardware and software to agreed service levels, and for the delivery of agreed projects.
Underwriting and claims operations Ensure the data in the source systems is of the required quality.

www.beazley.com20 Beazley Insurance dac Solvency and Financial Condition Report 2017
B.7 OutsourcingAlthough activities may be transferred to an outsourced provider, the responsibility, including regulatory responsibility is not. BIdac remains fully responsible for meeting all of its obligations when outsourcing functions or activities.
Outsourcing of critical or important functions or activities shall not be undertaken in such a way as to lead to any of the following:• materially impairing the quality of the system of governance
of the undertaking concerned;• unduly increasing the operational risk;• impairing the ability of the supervisory authorities to monitor
the compliance of the undertaking with its obligations; and• undermining continuous and satisfactory service to policy
holders.
The board of BIdac is responsible for ensuring that the outsourcing policy and the outsourcing arrangements themselves comply with the relevant regulations for ensuring that due skill, care and diligence is exercised when entering into, managing or terminating any arrangement for the outsourcing to a service provider of critical, important or material functions or activities.
Beazley requires service providers to cooperate with the relevant supervisory authorities in connection with the outsourced function or activity. Beazley staff, auditors and the relevant supervisory authorities have effective access to data related to the outsourced functions or activities and, where appropriate, the supervisory authorities have effective access to the business premises of the service provider and must be able to exercise those rights of access.
BIdac has entered into a management services agreement with BML, a UK company, in relation to certain services that are provided centrally.
The services covered by the agreement relate to:• information technology;• talent management;• commercial management and facilities;• actuarial;• internal audit;• risk management;• compliance;• finance; • underwriting;• claims;• ceded reinsurance;• marketing, brand and communications;• company secretariat;• corporate development;• operations; and• legal services.
The services provided by BML are closely monitored by the BIdac operations group. The agreement is reviewed annually and, where material, changes are brought to the board for consideration and approval.
The operations group submits a report to the BIdac board on the performance of the services to BIdac for each board meeting.
BIdac has also entered a delegated authority underwriting agreement with Beazley Solutions Limited for the provision of underwriting and claims services.
B.8 Any other informationThere is no other material information to report.
B. System of governance continued

www.beazley.com Solvency and Financial Condition Report 2017 Beazley Insurance dac 21
C. Risk profile
The company, in conjunction with the group, has identified the risks arising from its activities and has established policies and procedures to manage these items in accordance with its risk appetite. Beazley Insurance dac (BIdac or the company) is exposed to risks both directly and, through its reinsurance contracts with Beazley Underwriting Limited (BUL). The group categorises its risks into eight areas: insurance, strategic, market, operational, credit, regulatory and legal, liquidity and group risk. The sections below outline the group’s risk appetite and explain how it defines and manages each category of risk.
The risk management framework described in section B3 includes the ongoing assessment of these risks and of the continued effectiveness of risk mitigation techniques.
The stress and scenario framework is an important element of the risk management framework. The stress and scenario framework is applied to a range of business processes to assist management understand the vulnerabilities within the business model. This approach encourages management’s involvement in risk oversight by using real life scenarios to provide qualitative and quantitative information on what risks might look like under stressed conditions and encourages a forward looking view of risk.
In addition, as a validation tool the stress and scenario framework tests:• assumptions, particularly where data is sparse;• assumed correlations between assumptions;• the availability of resources and what action might be
required under stressed situations;• whether controls perform as expected under stressed
situations; and• the effect of changes in the operating environment
(e.g. external events).
There are three elements to the framework:
Stress testing involves looking at the impact on the business model of changing a single factor.
Scenario testing involves the impact on the business model of simulating or changing a series of factors within the operating environment.
Reverse stress testing involves considering scenarios that are most likely to render the current business model to become unviable.
C.1 Underwriting riskThe company assumes insurance risk through its reinsurance contract with BUL and through the direct insurance it writes in Europe and the UK. The four key components of insurance risk are underwriting, reinsurance, claims management and reserving. Each element is considered below.
a) Underwriting riskUnderwriting risk comprises three categories; attritional claims, large claims and catastrophe events. In addition, all classes of business are impacted by a key driver of risk, market cycle risk, which is the risk that business is written without full knowledge as to the adequacy of rates, terms and conditions.
The group’s underwriting strategy is to seek a diverse and balanced portfolio of risks in order to limit the variability of outcomes. This is achieved by accepting a spread of business over time, segmented between different products, geographies and sizes.
The annual business plans for each underwriting team reflect the group’s underwriting strategy, and set out the classes of business, the territories and the industry sectors in which business is to be written. These plans are approved by the board and monitored by the underwriting committee.
Our underwriters calculate premiums for risks written based on a range of criteria tailored specifically to each individual risk. These factors include but are not limited to the financial exposure, loss history, risk characteristics, limits, deductibles, terms and conditions and acquisition expenses.
The group also recognises that insurance events are, by their nature, random, and the actual number and size of events during any one year may vary from those estimated using established statistical techniques.
To address this, the group sets out the exposure that it is prepared to accept in certain territories to a range of events such as natural catastrophes and specific scenarios which may result in large industry losses. This is monitored through regular calculation of realistic disaster scenarios (RDS). The aggregate position is monitored at the time of underwriting a risk, and reports are regularly produced to highlight the key aggregations to which the group is exposed.

www.beazley.com22 Beazley Insurance dac Solvency and Financial Condition Report 2017
C.1 Underwriting risk continuedThe group uses a number of modelling tools to monitor its exposures against the agreed risk appetite set and to simulate catastrophe losses in order to measure the effectiveness of its reinsurance programmes. Stress and scenario tests are also run using these models. The range of scenarios considered includes natural catastrophe, cyber, marine, liability, political, terrorism and war events.
One of the largest types of event exposure relates to natural catastrophe events such as windstorm or earthquake. Where possible the group measures geographic accumulations and uses its knowledge of the business, historical loss behaviour and commercial catastrophe modelling software to assess the expected range of losses at different return periods. Upon application of the reinsurance coverage purchased, the key gross and net exposures are calculated on the basis of extreme events at a range of return periods.
The group’s catastrophe risk appetite is set by the Beazley plc board and the business plans of each team are determined within these parameters. The Beazley plc board may adjust these limits over time as conditions change. In 2017 the group operated to a catastrophe risk appetite for a probabilistic 1-in-250 years US event of $278.0m (2016: $309.0m) net of reinsurance.
The group also has exposure to man-made claim aggregations, such as those arising from terrorism and data breach events. Beazley chooses to underwrite data breach insurance within the specialty lines division using our team of specialist underwriters, claims managers and data breach services managers. Other than for data breach, Beazley’s preference is to exclude cyber exposure where possible.
To manage the potential exposure, the Beazley plc board has established a risk budget for the aggregation of data breach related claims which is monitored by reference to the largest of the RDSs that have been developed internally. These scenarios have been peer reviewed by an external technical expert and include the failure of a data aggregator, the failure of a shared hardware or software platform, the failure of a cloud provider and a ransomware event. Whilst it is not possible to be precise, as there is sparse data on actual aggregated events, these severe scenarios are expected to be very infrequent. The largest RDS is currently lower than the exposure to the Lloyd’s prescribed natural catastrophe events listed above for the group as at 31 December 2017. However, the cost of these scenarios will increase as Beazley continues to grow its data breach product. The clash reinsurance programme that protects the specialty lines account would partially mitigate the cost of most, but not all, data breach catastrophes.
The RDSs monitor both data breach and property damage related cyber exposure. Given Beazley’s risk profile, the quantum from the data breach scenarios is larger than any of the cyber property damage related scenarios.
To manage underwriting exposures, the group has developed limits of authority and business plans which are binding upon all staff authorised to underwrite and are specific to underwriters, classes of business and industry.
These authority limits are enforced through a comprehensive sign-off process for underwriting transactions including dual sign-off for all line underwriters and peer review for all risks exceeding individual underwriters’ authority limits. Exception reports are also run regularly to monitor compliance.
All underwriters also have a right to refuse renewal or change the terms and conditions of insurance contracts upon renewal.
Rate monitoring details, including limits, deductibles, exposures, terms and conditions and risk characteristics are also captured and the results are combined to monitor the rating environment for each class of business.
A proportion of the group’s insurance risks are transacted by third parties under delegated underwriting authorities. Each third party is thoroughly vetted by our coverholder approval group before it can bind risks, and is subject to rigorous monitoring to maintain underwriting quality and confirm ongoing compliance with contractual guidelines.
b) Reinsurance risk BIdac participates in the group reinsurance program for direct business it writes in Europe and the UK. It is further exposed if any of the group’s reinsurers fail to meet their commitments. Reinsurance risk to the group arises where reinsurance contracts put in place to reduce gross insurance risk do not perform as anticipated, result in coverage disputes or prove inadequate in terms of the vertical or horizontal limits purchased. Failure of a reinsurer to pay a valid claim is considered a credit risk.
The group’s reinsurance programmes complement the underwriting team business plans and seek to protect group capital from an adverse volume or volatility of claims on both a per risk and per event basis. In some cases the group deems it more economic to hold capital than purchase reinsurance. These decisions are regularly reviewed as an integral part of the business planning and performance monitoring process.
The reinsurance security committee examines and approves all reinsurers to ensure that they possess suitable security. The group’s ceded reinsurance team ensures that these guidelines are followed, undertakes the administration of reinsurance contracts and monitors and instigates our responses to any erosion of the reinsurance programmes.
C. Risk profile continued

www.beazley.com Solvency and Financial Condition Report 2017 Beazley Insurance dac 23
C.1 Underwriting risk continuedc) Claims management risk Claims management risk may arise within the group in the event of inaccurate or incomplete case reserves and claims settlements, poor service quality or excessive claims handling costs. These risks may damage the Beazley brand and undermine its ability to win and retain business, or incur punitive damages. These risks can occur at any stage of the claims life cycle.
The group’s claims teams are focused on delivering quality, reliability and speed of service to both internal and external clients. Their aim is to adjust and process claims in a fair, efficient and timely manner, in accordance with the policy’s terms and conditions, the regulatory environment, and the business’s broader interests. Prompt and accurate case reserves are set for all known claims liabilities, including provisions for expenses.
d) Reserving and ultimate reserves riskReserving and ultimate reserves risk occurs within the group where established insurance liabilities are insufficient through inaccurate forecasting, or where there is inadequate allowance for expenses and reinsurance bad debts in provisions.
To manage reserving and ultimate reserves risk, our actuarial team uses a range of recognised techniques to project gross premiums written, monitor claims development patterns and stress-test ultimate insurance liability balances. An external independent actuary also performs an annual review to produce a statement of actuarial opinion for reporting entities within the group.
The objective of BIdac’s reserving policy is to produce accurate and reliable estimates that are consistent over time and across classes of business. The estimates of gross premiums written and claims prepared by the actuarial department are used through a formal quarterly peer review process to independently test the integrity of the estimates produced by the underwriting teams for each class of business, based on the reserves of the underlying syndicates.
C.2 Market riskMarket risk arises where the value of assets and liabilities changes as a result of movements in foreign exchange rates, interest rates and market prices. Efficient management of market risk is key to the investment of group assets. Appropriate levels of investment risk are determined by limiting the proportion of forecast group earnings which could be at risk from lower than expected investment returns, using a 1 in 10 confidence level as a practical measure of such risk. In 2017, this permitted variance from the forecast investment return was set at $99.0m. For 2018, the permitted variance will be $124.0m. Investment strategy is developed to be consistent with this limit and investment risk is monitored on an ongoing basis, using outputs from our internal model.
Changes in interest rates also impact the present values of estimated group liabilities, which are used for solvency and capital calculations. Our investment strategy reflects the nature of our liabilities, and the combined market risk of investment assets and estimated liabilities is monitored and managed within specified limits.
Beazley’s investment risk controls combine to ensure that Beazley ‘only invest in assets and instruments the risks of which we can properly identify, measure, monitor, manage and control and appropriately take into account in the assessment of our overall solvency needs’ as required by the Solvency II prudent person principle. In particular:• some investment activities are outsourced to expert
managers and advisors, as appropriate, but the Beazley Investments team retains responsibility for, oversees, monitors and assesses all investments of the group;
• investment parameters specify detailed quantitative restrictions for all mandates;
• the governance structure ensures that all material changes to strategy are reviewed and approved at board level;
• unusual or complex investments have separate requirements for valuation, risk modelling and governance review;
• the Beazley internal model provides a comprehensive view of asset risk for the purpose of managing Beazley’s investments;
• derivatives use is strictly limited and monitored;• investment key risk indicators are independently
monitored and reported;• combined financial risks of assets and liabilities are
a key element of our risk management; and• liquidity risk is actively monitored and managed.
a) Foreign exchange riskThe functional currency of BIdac is the US dollar. Therefore, the foreign exchange risk is that the company is exposed to fluctuations in exchange rates for non-dollar denominated transactions and net assets. However foreign exchange risk is actively managed as described below.
The company is exposed to changes in the value of assets and liabilities due to movements in foreign exchange rates. The company deals in four main currencies US dollars, UK sterling, Canadian dollars and Euro. Transactions in all non dollar currencies are converted to US dollars on initial recognition and revalued at the reporting date.
In 2017, the company managed its foreign exchange risk by periodically assessing its non dollar exposures and hedging these to a tolerable level while targeting net assets to be predominantly US dollar denominated. On a forward looking basis an assessment is made of expected future exposure development and appropriate currency trades put in place to reduce risk.

www.beazley.com24 Beazley Insurance dac Solvency and Financial Condition Report 2017
C. Risk profile continued
C.2 Market risk continuedThe following table summarises the carrying value of GAAP total assets and total liabilities categorised by currency:
31 December 2017UK £
$mCAD $
$mEUR €
$mSubtotal
$mUS $
$mTotal
$m
Total assets 524.4 175.0 243.1 942.5 3,291.7 4,234.2Total liabilities (312.4) (174.2) (214.7) (701.3) (2,412.1) (3,113.4)Net assets 212.0 0.8 28.4 241.2 879.6 1,120.8
31 December 2016UK £
$mCAD $
$mEUR €
$mSubtotal
$mUS $
$mTotal
$m
Total assets 736.8 190.7 174.0 1,101.5 2,999.7 4,101.2Total liabilities (488.0) (196.0) (235.8) (919.8) (2,065.1) (2,984.9)Net assets 248.8 (5.3) (61.8) 181.7 934.6 1,116.3
As part of this hedging strategy, exchange rate derivatives were used to rebalance currency exposure across the company.On a forward looking basis an assessment is made of expected future exposure development and appropriate currency tradesput in place to reduce risk. The company’s assets are matched by currency to the principal underlying currencies of its insuranceliabilities. This helps mitigate the risk that the company’s assets required to cover its insurance liabilities are not materiallyaffected by any future movements in exchange rates.
Sensitivity analysisFluctuations in the company’s trading currencies against the US dollar would result in a change to profit after tax and net asset value. The table below gives an indication of the impact on profit after tax and net assets of a percentage change in the relative strength of the US dollar against the value of sterling, the Canadian dollar and the euro, simultaneously. The analysis is based on the net asset position at the balance sheet date, and the assumption that the impact of foreign exchange on non-monetary items will be nil and is presented net of exchange rate derivatives.
Impact on profit after tax for the year ended Impact on net assets
Change in exchange rate of sterling, Canadian dollar and euro relative to US dollar2017
$m2016
$m2017
$m2016
$m
Dollar weakens 30% against other currencies 63.3 47.7 63.3 47.7Dollar weakens 20% against other currencies 42.2 31.8 42.2 31.8Dollar weakens 10% against other currencies 21.1 15.9 21.1 15.9Dollar strengthens 10% against other currencies (21.1) (15.9) (21.1) (15.9)Dollar strengthens 20% against other currencies (42.2) (31.8) (42.2) (31.8)Dollar strengthens 30% against other currencies (63.3) (47.7) (63.3) (47.7)
b) Interest rate riskSome of the company’s financial instruments, including financial investments, are exposed to movements in market interest rates.
The company manages interest rate risk by primarily investing in short duration financial investments. The board of BIdac monitors the duration of these assets on a regular basis.
The following table shows the average duration at the reporting date of the financial instruments that are exposed to movements in market interest rates. Duration is a commonly used measure of volatility and we believe gives a better indication than maturity of the likely sensitivity of our portfolio to changes in interest rates.

www.beazley.com Solvency and Financial Condition Report 2017 Beazley Insurance dac 25
C.2 Market risk continuedDuration31 December 2017
<1 yr$m
1-2 yrs$m
2-3 yrs$m
3-4 yrs$m
4-5 yrs$m
5-10 yrs$m
>10 yrs$m
Total$m
Fixed and floating rate securities 412.1 259.1 200.3 120.5 107.5 – – 1,099.5Cash and cash equivalents 23.1 – – – – – – 23.1Derivative financial instruments 4.6 – – – – – – 4.6Borrowings – – – – – (248.5) – (248.5)Total 439.8 259.1 200.3 120.5 107.5 (248.5) – 878.7
31 December 2016<1 yr
$m1-2 yrs
$m2-3 yrs
$m3-4 yrs
$m4-5 yrs
$m5-10 yrs
$m>10 yrs
$mTotal
$m
Fixed and floating rate debt securities 456.9 186.2 248.8 166.9 115.0 18.6 1,192.4Cash and cash equivalents 25.8 – – – – – – 25.8Derivative financial instruments 1.1 – – – – – – 1.1Borrowings – – – – – (248.3) – (248.3)Total 483.8 186.2 248.8 166.9 115.0 (229.7) – 971.0
In November 2016, the company issued $250m of subordinated tier 2 notes due in 2026. Annual interest, at a fixed rate of5.875%, is payable in May and November each year.
Sensitivity analysisThe company holds financial assets and liabilities that are exposed to interest rate risk. Changes in interest yields, with all other variables constant, would result in changes in the capital value of debt securities and a change in value of borrowings and derivative financial instruments. This would affect reported profits and net assets as indicated in the table below:
Impact on profit after income tax for the year Impact on net assets
2017$m
2016$m
2017$m
2016$m
Shift in yield (basis points)150 basis point increase (7.8) (8.6) (7.8) (8.6)100 basis point increase (5.2) (5.7) (5.2) (5.7)50 basis point increase (2.6) (2.9) (2.6) (2.9)50 basis point decrease 2.6 2.9 2.6 2.9100 basis point decrease 5.2 5.7 5.2 5.7
c) Price riskDebt securities and equities that are recognised on the balance sheet at their fair value are susceptible to losses due to adverse changes in prices. This is referred to as price risk.
Investments are made in debt securities and equities depending on the company’s appetite for risk. These investments are well diversified with high quality, liquid securities. The board has established comprehensive guidelines with setting out maximum investment limits, diversification across industries and concentrations in any one industry or company.
Listed investments are recognised on the balance sheet at quoted bid price. If the market for the investment is not considered to be active, then the company establishes fair value using valuation techniques. This includes using recent arm’s length market transactions, reference to current fair value of other investments that are substantially the same, discounted cash flow models and other valuation techniques that are commonly used by market participants.

www.beazley.com26 Beazley Insurance dac Solvency and Financial Condition Report 2017
C. Risk profile continued
C.2 Market risk continuedd) Investment riskManaging investment risk is central to the operation and development of our investment strategy. Our internal model includes an asset risk module, which uses an economic scenario generator (ESG) to simulate multiple simulations of financial conditions, to support stochastic analysis of investment risk. We use internal model outputs to assess the value at risk of our investments, at different confidence levels, including ‘1 in 200’, which reflects Solvency II modelling requirements, and ‘1 in 10’, identifying a level of investment losses which are more likely to occur in practice. Risk is typically considered to a 12 month horizon. It is assessed for investments in isolation and also in conjunction with net present value of our insurance liabilities, to help us monitor and manage market risk across both sides of the balance sheet.
Our investment strategy is developed by reference to an investment risk budget, set annually by the board as part of the overall risk budgeting framework of the business. The internal model is used to monitor compliance with the budget. It is important to note that stochastic risk modelling is not a precise discipline. Our ESG outputs are regularly validated against actual market conditions, but we also use a number of other, qualitative, measures to support the monitoring and management of investment risk. These include stress testing, as well as selective historic and prospective scenario analysis.
C.3 Credit riskCredit risk arises where counterparties fail to meet their financial obligations in full as they fall due. The primary sources of credit risk for the company are:• investments – whereby issuer default results in the company losing all or part of the value of a financial instrument and
derivative financial instrument; • amounts receivable under the reinsurance contracts – whereby counterparties fail to pass on premiums due under the
reinsurance contracts. The main credit risk exposure facing the company arises by virtue of the reinsurance contract in place with its sister company, BUL and the underlying risk facing that company;
• amounts receivable from reinsurers – whereby a reinsurer fails to pay a valid claim. The company participates in the group reinsurance program to provide cover for the direct insurance it writes within Europe and the UK; and
• accounts receivable – whereby the company fails to receive insurance premiums due from clients or brokers in relations to the direct insurance it writes within Europe and the UK.
The company is also exposed to any credit risks affecting the profitability of the underlying syndicates covered by the aggregate excess of loss reinsurance agreement with BUL.
The company’s core business is to accept significant insurance risk and the appetite for other risks is low. This protects the company’s capital from erosion so that it can meet its insurance liabilities.
To assist in the understanding of credit risks, A.M. Best, Moody’s and Standard & Poor’s (S&P) ratings are used. These ratings have been categorised below as used for Lloyd’s reporting:
A.M. Best Moody’s S&P
Tier 1 A++ to A- Aaa to A3 AAA to A-Tier 2 B++ to B- Baa1 to Ba3 BBB+ to BB-Tier 3 C++ to C- B1 to Caa B+ to CCCTier 4 D, E, F, S Ca to C R, (U,S) 3
The following tables summarise the company’s concentrations of credit risk:
31 December 2017Tier 1
$mTier 2
$mTier 3
$mTier 4
$mUnrated
$mTotal
$m
Financial assets at fair value– fixed and floating rate debt securities 826.1 273.4 – – – 1,099.5– equity linked funds – – – – 80.9 80.9– hedge funds – – – – 48.9 48.9– derivative financial instruments – – – – 5.0 5.0Cash and cash equivalents 23.1 – – – – 23.1Accrued interest 4.3 – – – – 4.3Amounts due from group companies – – – – 2,729.7 2,729.7Total 853.5 273.4 – – 2,864.5 3,991.4

www.beazley.com Solvency and Financial Condition Report 2017 Beazley Insurance dac 27
C.3 Credit risk continued
31 December 2016Tier 1
$mTier 2
$mTier 3
$mTier 4
$mUnrated
$mTotal
$m
Financial assets at fair value– fixed and floating rate debt securities 865.4 327.0 – – – 1,192.4– equity linked funds – – – – 38.3 38.3– hedge funds – – – – 46.4 46.4– derivative financial instruments – – – – 1.1 1.1Cash and cash equivalents 25.8 – – – – 25.8Accrued interest 1.6 – – – – 1.6Amounts due from group companies – – – – 2,588.3 2,588.3Total 892.8 327.0 – – 2,674.1 3,893.9
The carrying amount of financial assets at the reporting date represents the maximum credit exposure.
At 31 December 2017, the company held no financial assets that were past due or impaired, either for the current year under review or on a cumulative basis.
C.4 Liquidity riskLiquidity risk arises where cash may not be available to pay obligations when due at a reasonable cost.
The company’s approach is to manage its liquidity position so that it can reasonably survive a significant individual or market loss event. This means that the company maintains sufficient liquid assets, or assets that can be converted into liquid assets at short notice and without any significant capital loss, to meet expected cash flow requirements. These liquid funds are regularly monitored using cash flow forecasting to ensure that surplus funds are invested to achieve a higher rate of return.
The following is an analysis by business segment of the estimated timing of the net cash flows based on the net claims liabilities balance held at 31 December 2017 and 31 December 2016:
31 December 2017
Within1 year
$m1-3 years
$m3-5 years
$m
Greater than5 years
$mTotal
$m
Weightedaverage termto settlement
(years)
Marine 75.7 67.2 20.1 15.4 178.4 2.0Political, accident & contingency 40.5 29.6 6.4 7.8 84.3 2.3Property 155.2 126.5 37.8 39.8 359.3 2.2Specialty lines 392.9 516.9 260.9 330.1 1,500.8 3.4Net claims liabilities 664.3 740.2 325.2 393.1 2,122.8
31 December 2016
Within1 year
$m1-3 years
$m3-5 years
$m
Greater than5 years
$mTotal
$m
Weightedaverage termto settlement
(years)
Marine 73.8 60.1 17.1 12.8 163.8 1.9Political, accident & contingency 47.4 24.9 6.2 9.4 87.9 2.2Property 121.4 98.1 27.5 21.9 268.9 1.8Specialty lines 298.1 488.5 291.7 347.7 1,426.0 3.5Net claims liabilities 540.7 671.6 342.5 391.8 1.946.6

www.beazley.com28 Beazley Insurance dac Solvency and Financial Condition Report 2017
C. Risk profile continued
C.4 Liquidity risk continuedThe next two tables summarise the carrying amount at reporting date of financial instruments analysed by maturity date.
Maturity31 December 2017
<1 yr$m
1-2 yrs$m
2-3 yrs$m
3-4 yrs$m
4-5 yrs $m
5-10 yrs$m
>10 yrs$m
Total$m
Fixed and floating rate debt securities 207.0 338.7 249.1 173.2 105.2 26.3 – 1,099.5Cash and cash equivalents 23.1 – – – – – – 23.1Derivative financial instruments 4.6 – – – – – – 4.6Borrowings – – – – – (248.5) – (248.5)Total 234.7 338.7 249.1 173.2 105.2 (222.2) – 878.7
31 December 2016<1 yr
$m1-2 yrs
$m2-3 yrs
$m3-4 yrs
$m4-5 yrs
$m5-10 yrs
$m>10 yrs
$mTotal
$m
Fixed and floating rate debt securities 235.4 238.5 313.6 195.2 191.1 18.6 – 1,192.4Cash and cash equivalents 25.8 – – – – – – 25.8Derivative financial instruments 1.1 – – – – – – 1.1Borrowings – – – – – (248.3) – (248.3)Total 262.3 238.5 313.6 195.2 191.1 (229.7) – 971.0
In November 2016 the company issued $250.0m of subordinated tier 2 notes due in 2026. Annual interest, at a fixed rate of 5.875%, is payable in May and November of each year.
The total amount of the expected profit included in future premiums (EPIFP) at 31 December 2017 was $518.0m (2016: $61.3m).
C.5 Operational riskOperational risk arises from the risk of losses due to inadequate or failed internal processes, people, systems, service providers or external events.
There are a number of business activities for which the company uses the services of a sister group company, such as underwriting, actuarial and information technology. The company actively manages operational risks and minimises them where appropriate. This is achieved by implementing and communicating guidelines to staff and other third parties. The company also regularly monitors the performance of its controls and adherence to these guidelines through the risk management reporting process.
Key components of the company’s operational control environment include:• modelling of operational risk exposure and scenario testing;• management review of activities;• documentation of policies and procedures;• preventative and detective controls within key processes;• contingency planning; and• other systems controls.

www.beazley.com Solvency and Financial Condition Report 2017 Beazley Insurance dac 29
C.6 Other material risksStrategic riskThis is the risk that the company’s strategy is inappropriate or that the company is unable to implement its strategy. Where events supersede the company’s strategic plan this is escalated at the earliest opportunity through the company’s monitoring tools and governance structure.
Regulatory and legal riskRegulatory and legal risk is the risk arising from not complying with regulatory and legal requirements. The operations of the company are subject to legal and regulatory requirements within the jurisdiction in which it operates and the company’s compliance function is responsible for ensuring that these requirements are adhered to.
Group riskGroup risks are losses or failure experienced in one Beazley entity triggering secondary losses in another Beazley entity. These risks can have a range of causes including:• intra-group reinsurance arrangements, credit facilities,
guarantees, debt and equity cross-holdings that trigger or are revalued as a result of the experience of an individual entity; and
• pooled reinsurance contracts where exhaustion of available cover could lead to greater than anticipated loss for the entity.
BIdac provides capital held at Lloyd’s (Funds at Lloyd’s) through its aggregate excess of loss contract and lends the remainder to BUL through a credit facility agreement. The risk associated with the credit facility agreement represents the most material group risk in the BIdac model.
C.7 Any other informationInternal model governanceBeazley operates a three lines of defence process throughout the business. As with any other process in Beazley this approach is applied to the internal model. An overview of the three lines of defence for the internal model is set out below.
First line of defence: capital modelling team with controls including;• formal governance through committees;• governance through the ‘knowledge requirements of an
internal model’ (KRAM) process; and• in team testing process.
Second line of defence: risk management with controls including;• control monitoring and reporting.
Third line of defence: internal audit with controls including; • conducting annual reviews of the validation framework
and process.
Further to the three lines of defence, the fourth element to the internal model governance framework is the independent validation (out of team testing) of the internal model that is performed annually.
Features of Beazley’s governance include:• incorporation into the existing governance structure with
clear accountability;• overlap of members on the various committees;• the KRAM process i.e. executive and non-executive director
training programme for the internal model;• transparency of internal model limitations;• internal model control mechanisms; and• use of external review.

www.beazley.com30 Beazley Insurance dac Solvency and Financial Condition Report 2017
C. Risk profile continued
C.7 Any other information continuedStress and scenario testingPurposeThe stress and scenario framework is performed as part of business processes to assist senior management understand the vulnerabilities within the business model. This approach encourages management’s involvement in risk oversight by using real life scenarios to provide qualitative and quantitative information on what risks might look like under stressed conditions and encourages a forward looking view of risk. In addition, as a validation tool the stress and scenario framework:• tests assumptions, particularly where data is sparse;• tests assumed correlations between assumptions;• tests the availability of resources and what action might be
required under stressed situations;• tests whether controls perform as expected under stressed
situations; and• considers the effect of changes in the operating environment
(e.g external events).
ScopeBeazley’s stress and scenario framework covers the following three tests:• stress testing involves looking at the impact on the business
model of changing a single factor;• scenario testing involves the impact on the business model
of simulating or changing a series of factors within the operating environment; and
• reverse stress testing involves considering scenarios that are most likely to render the current business model to become unviable.
The framework consists of a four step process, namely:• identify and design;• estimation;• senior management input and challenge; and• management action and feedback loop.
Identify and design (step one)The risk management team identifies potential assumptions and scenarios for testing within each of the following business processes:• one year business planning;• five year business planning;• risk assessment and risk appetite;• emerging and strategic risk;• capital assessment;• realistic disaster scenarios;• asset portfolio;• liquidity risk;• disaster recovery and business continuity planning; and• corporate transactions such as acquisitions.
Estimation (step two)Once scenarios are defined, the risk management team facilitate the estimation of the stress test or scenario. In summary, the following steps are performed:• identify data and where necessary cleanse or adjust data
onto a consistent basis;• validate data;• where there is insufficient data apply expert judgement
and document this in line with the expert judgement policy;• run the stress test or scenario test and quantify impact;• review results for reasonableness and validate against
available data; and• iterate this process as required.
Senior management input and challenge (step three)Following the completion of step two, the risk management team then meet with the relevant executive and non-executive directors (for example risk owners or as set out in the KRAM) and present the analysis performed and associated results for further discussion. This is an important step in the stress and scenario testing process as it:• helps inform the senior management team at a detailed level
of the key sensitivities and vulnerabilities for Beazley; and• makes uses of the directors’ experience to sense check the
analysis and results.
It is expected that further iteration is required following discussion which in turn is summarised.
Management action and feedback loop (step four)The results of the stress test and scenario planning exercises are reported to the relevant first line of defence group committees (the underwriting, investment, operations and executive committees) as part of the business process and the second line of defence committee (the risk and regulatory committee) within the ORSA. The ORSA is then reported to the relevant subsidiary board and the Beazley plc board, usually through their risk committees. It is expected that the discussion at these forums will facilitate further management input and challenge and will give rise to management actions which are captured by the minutes and actioned by the relevant individual. Where relevant, this may include informing other business processes of the results of certain tests.

www.beazley.com Solvency and Financial Condition Report 2017 Beazley Insurance dac 31
D. Valuation for solvency purposes
Basis of presentation In addition to writing direct insurance in the UK and Europe, Beazley Insurance dac (BIdac or the company) reinsures Beazley Underwriting Limited (BUL), providing aggregate excess of loss cover for syndicates 2623 and 3623 within scope of the contract. The premium payable under the contract is defined relative to the profit/loss of those syndicates, with BIdac taking a 75% economic interest in the syndicates’ results subject to relevant profit commissions, a £2m deductible for any loss and a loss limit defined in relation to Funds at Lloyd’s (FAL).
In its Irish GAAP financial statements, BIdac has accounted for the results of the reinsurance contract on a look through basis recognising 75% of each component of the syndicate results. As such the BIdac accounts have reflected 75% of the syndicate net premiums and 75% of the syndicate net claims and have presented the underlying substance of the insurance activity that gave rise to the profit or loss on the aggregate excess of loss reinsurance contract.
In 2016, the Solvency II technical provisions on the BIdac Solvency II balance sheet were presented on a basis consistent with the GAAP look through methodology, recognising 75% of the syndicate net technical provisions which are based on the syndicate cash flows. This application of the look through basis of preparation for Solvency II technical provisions represented an area where judgement had been applied. It had been determined that the adoption of this approach more wholly captured the insurance activities of the company. This basis of presentation was consistent with the GAAP look through methodology and provided information that was suitably comparable.
In 2017 and going forwards the Solvency II technical provisions will be calculated in accordance with a literal interpretation of the relevant Solvency II regulations. The regulations require the valuation of the contracted cash flows, which in relation to the aggregate member level excess of loss reinsurance agreement with syndicates 2623 and 3623 is usually a premium representing the net profit of the underlying business (a single claim cash flow occurs if the outcome of the underlying business is a loss).
The impact of this interpretation is a significant decrease in the company’s technical provisions as these now become the projected result of the syndicates within scope rather than the best estimate of the underlying claims cash flows of the syndicates (see D.2 Technical provisions section for further details). This reduction in the technical provisions is broadly matched by a decrease in assets in the form of insurance receivables as the underlying premium cash flows received by the syndicates to meet claims are not recognised either.
The solvency position of BIdac (see section E) is largely unaffected as this is simply a different representation of the same economic activity.
D.1 Assets2017
Solvency II$m
2017GAAP
$mDifference
$m
Insurance and intermediaries receivables – 2,728.0 (2,728.0)Deferred acquisition costs – 234.2 (234.2)Financial assets – investments 1,238.6 1,234.3 4.3Other assets 1.0 4.3 (3.3)Reinsurance recoverables (1.9) 0.2 (2.1)Deferred tax asset 0.4 – 0.4Fixed assets – 0.2 (0.2)Cash and cash equivalents 23.1 23.1 –Receivables (trade, not insurance) 9.9 9.9 –Total assets 1,271.1 4,234.2 (2,963.1)
Differences between valuation for solvency purposes and financial statements
Deferred acquisition costsDeferred acquisition costs comprise brokerage, premium levy and staff-related costs of the underwriters acquiring new business and renewing existing contracts. Deferred acquisition costs are excluded from the valuation of assets for solvency purposes and there are no deferred acquisition costs relating to the reinsurance arrangement.
Insurance and intermediaries receivablesInter-group balances related to the insurance contracts due to BIdac from BUL are included on the GAAP balance sheet in this caption. These consist of the following components:• BIdac’s share of accumulated profit generated within the
syndicates that has not yet been distributed from the syndicates to BUL and therefore from BUL to BIdac;
• BIdac’s share of the syndicate assets supporting the claims reserves;
• FAL fees payable from BUL to BIdac up to the reporting date; • Profit commission payable from BIdac to BUL; and• BIdac’s share of the syndicate future premiums.
The debtor balances in respect of assets supporting claims reserves and the company’s share of the syndicate future premiums are recognised as a direct consequence of the look-through approach undertaken in the preparation of the BIdac financial statements. Therefore they are eliminated when preparing the Solvency II balance sheet on a cash-flow basis. The accumulated profit, FAL fees, future premiums and profit commissions that relate to future cashflows are implicitly included within the Solvency II technical provisions.

www.beazley.com32 Beazley Insurance dac Solvency and Financial Condition Report 2017
D.1 Assets continuedIn addition, this balance also includes debtors arising on direct insurance operations. On a Solvency II basis, the future premium cashflows that are not overdue are recognised within the technical provisions. At 31 December 2017 there are no overdue premiums arising on the direct insurance obligations.
Fixed AssetsCapitalised leasehold improvements that are valued on the GAAP balance sheet at amortised cost are deemed to have no economic value on a Solvency II basis.
Financial assets – investmentsOn the GAAP balance sheet, financial assets are valued using a valuation hierarchy that reflects the significance of the inputs used in making the measurements. The fair value hierarchy has the following levels:• Level 1 – valuations based on quoted prices in active
markets for identical instruments. An active market is a market in which transactions for the instrument occur with sufficient frequency and volume on an ongoing basis such that quoted prices reflect prices at which an orderly transaction would take place between market participants at the measurement date. Included within level 1 are bonds and treasury bills of government and government agencies which are measured based on quoted prices in active markets. Assets are valued using the bid price.
• Level 2 – valuations based on quoted prices in markets that are not active, or based on pricing models for which significant inputs can be corroborated by observable market data (e.g. interest rates, exchange rates). Included within level 2 are government bonds and treasury bills which are not actively traded, corporate bonds, asset backed securities and mortgage-backed securities.
• Level 3 – valuations based on inputs that are unobservable or for which there is limited market activity against which to measure fair value.
The Solvency II valuation of financial assets is consistent with the GAAP valuation, except for accrued interest which is reclassified from other assets into financial assets.
Cash and cash equivalentsOn the GAAP balance sheet, cash and cash equivalents consist of cash held at bank, cash in hand, deposits held at call with banks, and other short term highly liquid investments that are readily convertible to known amounts of cash and which are subject to an insignificant risk of changes in value. These investments have less than three months maturity from the date of acquisition. The Solvency II valuation and recognition of cash and cash equivalents is consistent with that used for the GAAP balance sheet.
Receivables (trade, not insurance)Receivables mainly comprise of corporation tax recoverable from the tax authority and non-insurance related inter-group balances. These are measured at fair value on both the GAAP and Solvency II balance sheet.
Other assetsOn the GAAP balance sheet, other assets are comprised principally of accrued interest. This is reclassified into the underlying investments on the Solvency II balance sheet. The residual other assets on the Solvency II balance sheet are composed of unsettled balances due from BUL. This is the net of amounts due from BUL to BIdac with respect to FAL fees and amounts due from BIdac to BUL with respect to profit commissions under the terms of expired member level aggregate excess of loss reinsurance arrangements.
Reinsurance recoverablesThe GAAP balance sheet presents the reinsurer’s share of unearned technical provisions and claims outstanding relating to reinsurance of direct business. On a Solvency II basis, this balance presents the net of cash inflows with respect to recoveries on direct business bound at the reporting date and cash outflows with respect to premiums payable on outwards reinsurance arrangements in respect of direct business that has been allocated to BIdac. From a Solvency II perspective, the outflows exceed the inflows resulting in a negative asset because the outflows are based on premiums payable that cover the full subsequent reporting period whereas the inflows are based on the direct business that started writing in the last month of the reporting period and bound but not incepted business that is expected to be written in the first month after the reporting period.
Deferred tax assetSolvency II recognition and valuation with respect to deferred taxes is consistent with the GAAP balance sheet (IAS 12). As a result of the adjustments from GAAP to Solvency II, in particular with respect to the reinsurance recoverables on the direct business, a deferred tax decrease in Solvency II net assets is generated and hence a deferred tax asset is recognised on a Solvency II basis. This deferred tax asset is not offset against the deferred tax liability as it relates to the business written in branches which are subject to a different tax jurisdiction to the company.
D. Valuation for solvency purposes continued

www.beazley.com Solvency and Financial Condition Report 2017 Beazley Insurance dac 33
D.2 Technical provisions Undiscounted Discounted
Solvency II line of businessAll amounts $m
Net technical provisions
ex. risk marginRisk
margin
Net technical provisions inc.
risk margin
Net technical provisions
ex. risk margin Risk margin
Net technical provisions inc.
risk margin
Non proportional casualty reinsurance (512.9) 89.4 (423.5) (507.3) 87.7 (419.6)General liability insurance 1.8 0.3 2.1 1.7 0.3 2.0Total (511.1) 89.7 (421.4) (505.6) 88.0 (417.6)
Given the nature of the underlying business, the approach used to estimate the technical provisions for the non proportional casualty reinsurance business differs from that used for the general liability insurance business.
The technical provisions shown for non proportional casualty reinsurance relate to the BIdac aggregate excess of loss reinsurance protection of BUL. The general liability insurance technical provisions relate to the direct insurance business which BIdac commenced writing in 2017.
Non proportional casualty reinsuranceOverview of reinsurance contractThe approach used to estimate the technical provisions is based on the structure and expected cashflows under the reinsurance contracts. The company enters into a reinsurance contract with BUL covering a year of account for syndicates 2623 and 3623. The potential cashflows in summary are as follows:• premium – 75% of any profit made by the syndicates
reinsured;• liability – 75% of any loss made by the syndicates reinsured
(subject to a maximum of 75% of the FAL and £2m excess);• fees – BUL pays BIdac a fee as BIdac provides 75% FAL
for the syndicates covered under the reinsurance contract. The fee payable is 1% of the first £200m of FAL and 3% of the remainder of FAL; and
• profit commission – 15% and is payable by BIdac to BUL on any premiums received under the contract.
Bases, methods and main assumptions used for valuation for solvency purposesThe bases, methods and main assumptions used for valuation for solvency purposes are as follows:
The expected profit/loss of the underlying BUL business reinsured forms the largest component of the technical provisions. The expected profit/loss is the total of the following:• the current view of the profit/loss of each year of account
based on held loss ratios and incurred expenses;• the reserve releases expected between the current view
of profitability and when the final syndicate result is declared;• expected investment income; and• expenses are expected to be incurred until the year of
account closes.
Whilst the initial view of profitability is assessed at the end of the first calendar year for the business that has been reinsured, the reserve releases and expected future investment income are derived from the assumptions used in the Beazley long term business plan.
The provisions for profit commissions and fees have been calculated in line with the terms of the reinsurance contract.
Allowance has also been made for events not in data and a risk margin:• the events not in data allowance is based on the load
included in the underlying syndicates reinsured and this is calculated using the truncated lognormal distribution, as per Lloyd’s guidelines; and
• the risk margin is based on the SCR output from the BIdac internal model – this is projected forward and discounted using yield curves prescribed by EIOPA, with the discounted cost of capital being calculated by multiplying the discounted SCR figures by the prescribed cost of capital rate of 6% and then summing up the resulting discounted cost of capital amounts.
Unincepted business is defined as policies that have not yet incepted, but to which Beazley is legally obliged at the valuation date. The 2018 reinsurance contract between BIdac and BUL which incepts on 1 January 2018 has been included within the technical provisions as it was signed in early December 2017.

www.beazley.com34 Beazley Insurance dac Solvency and Financial Condition Report 2017
D. Valuation for solvency purposes continued
D.2 Technical provisions continuedThe technical provisions estimated have been split between the claims and premium provisions based on whether or not the profit/loss for each reinsurance contract is known at the valuation date – the technical provisions arising for those contracts for which the actual profit is as yet unknown have been allocated to the premium provision, with the provisions for those contracts where the profit/loss has been finalised being included within the claims provision.
Future cash flows are projected using payment patterns, allocated into the required currencies and discounted using the latest available EIOPA yield curves for the relevant currencies.
Key uncertaintiesAt a macro level, the key areas of downside risk in the estimated profit/loss figures of the underlying BUL business being reinsured are that:• claims experience in the specialty lines division could be
worse than expected because of adverse claim frequency and/or severity or the systemic inadequacy of premium rates; or that
• catastrophe claims experience is materially worse than expected; and
• investment returns may be materially different to the returns estimated.
Changes in methodology/assumptions since the previous reporting periodAt the previous valuation, the approach used to estimate technical provisions was based on a substance over form and look through to the underlying syndicate cash flows.
The approach has since been revised, to reflect the aggregate excess of loss nature of the reinsurance contract written by BIdac, together with the cash flows expected on this contract rather than the underlying cash flows.
GAAP reserves vs technical provisionsThe main differences between the GAAP and Solvency II technical provisions for the non proportional casualty reinsurance business written in BIdac are as follows:• the GAAP reserves have been estimated based on substance
over form using a look through approach i.e. they are 75% of the net technical provisions for syndicates 2623 and 3623 whereas the Solvency II technical provisions consider the overall net cashflows expected under the reinsurance contract;
• the GAAP reserves only consider the performance of business earned up to and including the valuation date whereas the Solvency II technical provisions allow for both the earned and unearned portions of the business written;
• within Solvency II technical provisions, there is an explicit allowance for premiums and claims on bound but unincepted contracts which are not recognised within the GAAP reserves. As a result, the 2018 reinsurance contract between BIdac and BUL which incepts on 1 January 2018 has been included within the Solvency II technical provisions as it was signed in early December 2017;
• the Solvency II technical provisions include an allowance for the expected investment income on the underlying business being reinsured whereas the GAAP reserves do not; and
• the Solvency II technical provisions recognise expected future reserve releases on the underlying business reinsured up to and including the finalisation of the 2018 reinsurance contract whereas the GAAP reserves only recognise reserve releases known as at the valuation date.
The total BIdac GAAP reserves are $2,860.3m on a net of reinsurance basis, and $2,859.9m of these reserves are for the non proportional casualty reinsurance business. The Solvency II net technical provisions (including the risk margin) for the non proportional casualty reinsurance business amount to $(419.6)m on a discounted basis.
The difference in the reserving approach also impacts the receivables shown on the balance sheet. The $2,728m insurance receivables due from BUL to BIdac on a GAAP basis is eliminated when preparing the Solvency II basis balance sheet on a cash-flow basis. This is described in more detail in section D.1.
General liability insuranceBIdac began writing non-life insurance business during 2017 and all the policies written in this period were general liability insurance coverages.
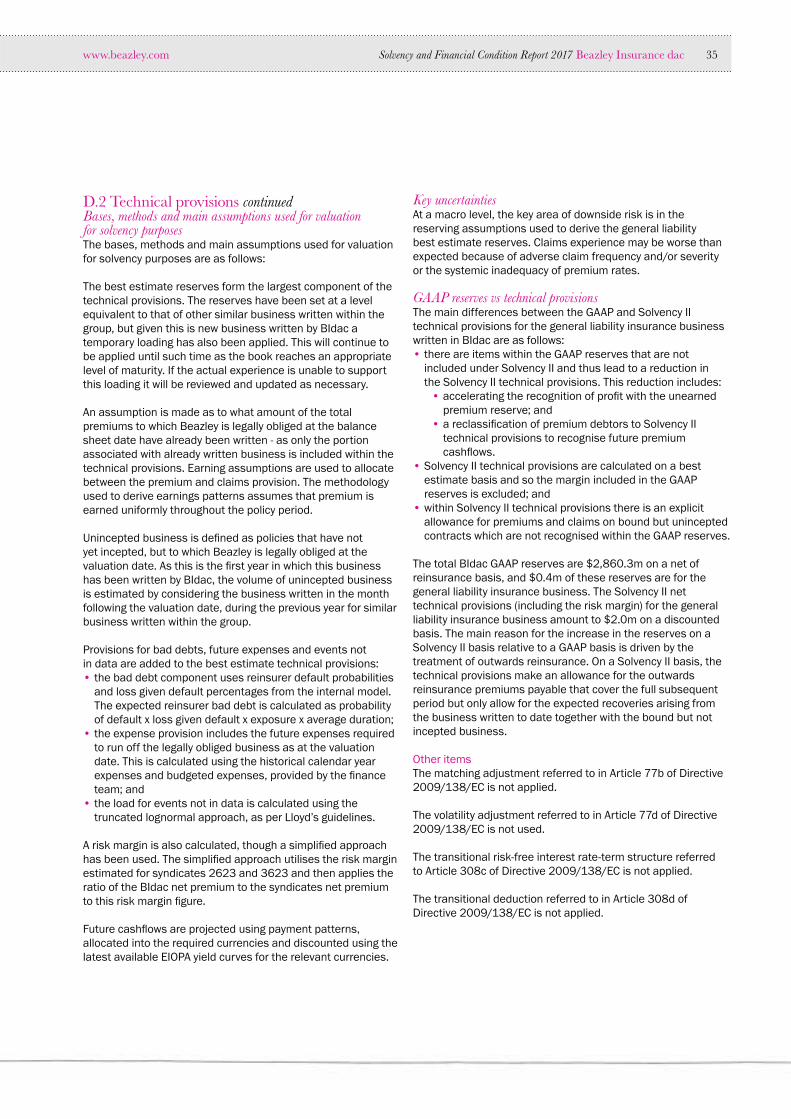
www.beazley.com Solvency and Financial Condition Report 2017 Beazley Insurance dac 35
D.2 Technical provisions continuedBases, methods and main assumptions used for valuation for solvency purposesThe bases, methods and main assumptions used for valuation for solvency purposes are as follows:
The best estimate reserves form the largest component of the technical provisions. The reserves have been set at a level equivalent to that of other similar business written within the group, but given this is new business written by BIdac a temporary loading has also been applied. This will continue to be applied until such time as the book reaches an appropriate level of maturity. If the actual experience is unable to support this loading it will be reviewed and updated as necessary.
An assumption is made as to what amount of the total premiums to which Beazley is legally obliged at the balance sheet date have already been written - as only the portion associated with already written business is included within the technical provisions. Earning assumptions are used to allocate between the premium and claims provision. The methodology used to derive earnings patterns assumes that premium is earned uniformly throughout the policy period.
Unincepted business is defined as policies that have not yet incepted, but to which Beazley is legally obliged at the valuation date. As this is the first year in which this business has been written by BIdac, the volume of unincepted business is estimated by considering the business written in the month following the valuation date, during the previous year for similar business written within the group.
Provisions for bad debts, future expenses and events not in data are added to the best estimate technical provisions:• the bad debt component uses reinsurer default probabilities
and loss given default percentages from the internal model. The expected reinsurer bad debt is calculated as probability of default x loss given default x exposure x average duration;
• the expense provision includes the future expenses required to run off the legally obliged business as at the valuation date. This is calculated using the historical calendar year expenses and budgeted expenses, provided by the finance team; and
• the load for events not in data is calculated using the truncated lognormal approach, as per Lloyd’s guidelines.
A risk margin is also calculated, though a simplified approach has been used. The simplified approach utilises the risk margin estimated for syndicates 2623 and 3623 and then applies the ratio of the BIdac net premium to the syndicates net premium to this risk margin figure.
Future cashflows are projected using payment patterns, allocated into the required currencies and discounted using the latest available EIOPA yield curves for the relevant currencies.
Key uncertaintiesAt a macro level, the key area of downside risk is in the reserving assumptions used to derive the general liability best estimate reserves. Claims experience may be worse than expected because of adverse claim frequency and/or severity or the systemic inadequacy of premium rates.
GAAP reserves vs technical provisionsThe main differences between the GAAP and Solvency II technical provisions for the general liability insurance business written in BIdac are as follows:• there are items within the GAAP reserves that are not
included under Solvency II and thus lead to a reduction in the Solvency II technical provisions. This reduction includes:
• accelerating the recognition of profit with the unearned premium reserve; and
• a reclassification of premium debtors to Solvency II technical provisions to recognise future premium cashflows.
• Solvency II technical provisions are calculated on a best estimate basis and so the margin included in the GAAP reserves is excluded; and
• within Solvency II technical provisions there is an explicit allowance for premiums and claims on bound but unincepted contracts which are not recognised within the GAAP reserves.
The total BIdac GAAP reserves are $2,860.3m on a net of reinsurance basis, and $0.4m of these reserves are for the general liability insurance business. The Solvency II net technical provisions (including the risk margin) for the general liability insurance business amount to $2.0m on a discounted basis. The main reason for the increase in the reserves on a Solvency II basis relative to a GAAP basis is driven by the treatment of outwards reinsurance. On a Solvency II basis, the technical provisions make an allowance for the outwards reinsurance premiums payable that cover the full subsequent period but only allow for the expected recoveries arising from the business written to date together with the bound but not incepted business. Other itemsThe matching adjustment referred to in Article 77b of Directive 2009/138/EC is not applied.
The volatility adjustment referred to in Article 77d of Directive 2009/138/EC is not used.
The transitional risk-free interest rate-term structure referred to Article 308c of Directive 2009/138/EC is not applied.
The transitional deduction referred to in Article 308d of Directive 2009/138/EC is not applied.

www.beazley.com36 Beazley Insurance dac Solvency and Financial Condition Report 2017
D. Valuation for solvency purposes continued
D.3 Other liabilities2017
Solvency II$m
2017GAAP
$mDifference
$m
Deferred tax liabilities 37.7 – 37.7Subordinated liabilities in basic own funds 265.4 248.5 16.9Reinsurance payables – 0.2 (0.2)Payables (trade, not insurance) 0.6 0.6 –Derivatives 0.4 0.4 –Any other Liabilities 3.1 3.1 –Total liabilities 307.2 252.8 54.4
Deferred tax liabilitiesSolvency II recognition and valuation with respect to deferred taxes is consistent with the GAAP balance sheet (IAS 12). As a result of the adjustments from GAAP to Solvency II, an increase in Solvency II net assets is generated for the company and hence a deferred tax liability is recognised on a Solvency II basis. This deferred tax liability is not offset against the deferred tax asset as it relates to the company which is subject to a different tax jurisdiction to its branches.
Other payables and liabilitiesOther payables comprise of salaries and other accruals.
Subordinated liabilitiesThe subordinated liabilities, which are listed on the London stock exchange, are shown in the GAAP financial statements valued at fair value at the date of issue less transaction costs. The subordinated liabilities are valued at fair value based on quoted market price under Solvency II.
DerivativesDerivatives are initially recognised at fair value on the date on which a derivative contract is entered into and are subsequently re-measured at their fair value. Fair values are obtained from quoted market prices in active markets, recent market transactions, and valuation techniques which include discounted cash flow models. All derivatives are carried as assets when fair value is positive and as liabilities when fair value is negative.
Reinsurance payablesAs part of BIdac’s participation in the Beazley group reinsurance programme covering general liability insurance, amounts relating to reinsurance payables are allocated to BIdac. This amount due is recorded in the GAAP balance sheet as reinsurance payables. Under Solvency II, this amount is reclassified into the technical provisions as it constitutes a future cashflow.
D.4 Alternative methods for valuationBIdac does not use any alternative methods of valuation in its valuation of assets or liabilities.
D.5 Any other informationThere is no other material information to report.

www.beazley.com Solvency and Financial Condition Report 2017 Beazley Insurance dac 37
E. Capital management
E.1 Own fundsBeazley Insurance dac’s (BIdac or the company) capital strategy is to:• invest its capital to generate an appropriate level of return;• maintain sufficient solvency cover;• support other Beazley group businesses; and• pay dividends to its shareholder.
Whilst not formalised, the company retains a significant amount of the group capital and pays dividends to support the payment of the group dividend. Since inception the company has always been well capitalised and the capital base has grown with earnings from the reinsurance contract with Beazley Underwriting Limited (BUL). The amount of dividend paid is determined by the solvency of the company and the requirements of the group. The group generally pays a dividend twice a year in February and August.
BIdac holds a level of capital over and above its regulatory requirements. The amount of surplus capital held is considered on an ongoing basis in light of the current regulatory framework, opportunities for growth and a desire to maximise returns for its shareholder. Available capital and capital requirements are projected as part of the five year business plan, which is in turn considered as part of the ORSA process.
The following table sets out BIdac’s sources of funds on a Solvency II basis:
Tier 1$m
Tier 2$m
Tier 3$m
Total$m
Basic own funds Ordinary share capital – – – –Reconciliation reserve 799.2 – – 799.2Subordinated liabilities – 265.4 – 265.4Deferred tax assets – – 0.4 0.4Capital contribution 536.3 536.3Total basic own funds after deductions 1,335.5 265.4 0.4 1,601.3Ancillary own funds – – – –Total available own funds to meet the SCR 1,335.5 265.4 0.4 1,601.3Total eligible own funds to meet the SCR 1,335.5 265.4 0.4 1,601.3Total eligible own funds to meet the MCR 1,335.5 32.5 – 1,368.0SCR 650.4Ratio of Eligible own funds to SCR 246%
Tier 1 basic own fundsBIdac has issued one share with a nominal value of €1 (2016: €1).
A capital contribution of $536.3m was approved as tier 1 own funds by the Central Bank of Ireland (CBI) on 15 December 2015.
The reconciliation reserve at 31 December 2017 was $799.2m (2016 $865.4m). The variance represents the change in the excess of assets over liabilities in the period. The reconciliation reserve can be considered as Solvency II retained earnings net of dividends.
Tier 1 own funds are eligible in full to meet both the Solvency Capital Requirement (SCR) and Minimum Capital Requirement (MCR).
2017$m
2016Pro-forma*
$m
2016As reported
$m
Ordinary share capital – – –Capital contribution 536.3 536.3 536.3Reconciliation reserve 799.2 849.6 865.4
1,335.5 1,385.9 1,401.7
The reconciliation reserve is calculated as follows:
2017$m
2016Pro-forma*
$m
2016As reported
$m
Reconciliation reserveExcess of assets over liabilities 1,383.5 1,469.8 1,485.5Foreseeable dividends (47.6) (83.8) (83.8)Other basic own funds (536.7) (536.3) (536.3)
799.2 849.7 865.4
Tier 2 basic own funds
2017$m
2016Pro-forma*
$m
2016As reported
$m
Tier 2 subordinated debt (2026) – issued in 2016 265.4 253.3 253.3
265.4 253.3 253.3
In November 2016, the company issued $250m of subordinated tier 2 notes due in 2026, the net proceeds of which are being used along with our retained earnings to support the future growth plans of the group. This debt is listed on the London stock exchange and is valued at fair value based on quoted market price.
As at 31 December 2017, the tier 2 own funds were eligible in full to meet the SCR. $32.5m was eligible to meet the MCR, being 20% of the MCR as at that date.
* The prior year amounts have been represented to reflect the impact of the change to the contracted cashflows basis. This information is disclosed to aid comparability against the 2017 amounts. The represented amounts are outside of the scope of external audit.

www.beazley.com38 Beazley Insurance dac Solvency and Financial Condition Report 2017
E.1 Own funds continuedReconciliation of GAAP net assets to Solvency II net assetsThe table below presents the changes in net assets from the GAAP balance sheet to the Solvency II balance sheet.
$m
GAAP net assets 1,120.9Elimination of leasehold improvements (0.2)Revaluation of subordinated debt to market value (16.9)Elimination of GAAP technical provisions (net of reinsurance and deferred acquisition costs) 2,626.1Elimination of inter-group debtors relating to future technical cashflows (2,726.5)Replacement of Solvency II technical provisions 417.5Recognition of net deferred tax on Solvency II adjustments arising (37.4)Solvency II net assets 1,383.5
The inter-group balances due to BIdac from BUL are included on the GAAP balance sheet. These consist of the following components:• BIdac’s share of accumulated profit generated within the
syndicates that has not yet been distributed from the syndicates to BUL and therefore from BUL to BIdac;
• BIdac’s share of the syndicate assets supporting the claims reserves;
• FAL fees payable from BUL to BIdac up to the reporting date;• Profit commission payable from BIdac to BUL; and• BIdac’s share of the syndicate future premiums.
The debtor balances in respect of assets supporting claims reserves and the company’s share of the syndicate future premium are recognised as a direct consequence of the look-through approach undertaken in the preparation of the BIdac financial statements. Therefore they are eliminated when preparing the Solvency II balance sheet on a cash-flow basis. The accumulated profit, FAL fees, future premiums and profit commissions that relate to future cashflows are implicitly included within the Solvency II technical provisions.
There are no basic own-fund items subject to the transitional arrangements referred to in Articles 308b(9) and 308b(10) of Directive 2009/138/EC and there are no ancillary own funds items.
E.2 Solvency Capital Requirement and Minimum Capital RequirementThe SCR and MCR for BIdac are as follows:
2017$m
2016$m
Solvency Capital Requirement 650.4 679.2Minimum Capital Requirement 162.6 305.6
The SCR is subject to CBI review. The MCR is calculated based on net of reinsurance technical provisions at the year end and written premiums in the twelve months to that date.
BIdac uses an internal model to calculate its SCR. The model is designed to produce output on the required basis, namely the capital required to meet a 1 in 200 adverse loss on the Solvency II balance sheet over a one-year time horizon.
The table below shows the SCR split by risk category.
ModelInsurance
riskMarket
riskOperational
riskCredit
risk
2018 SCR 70% 17% 11% 2%2017 SCR 73% 15% 10% 2%
BIdac also monitors its capital against a Strategic Solvency Target (SST) which has been set at the capital required to meet a 1 in 500 adverse loss on the Solvency II balance sheet over a one-year time horizon. BIdac must notify the CBI when the available capital falls below the SST. As at 31 December 2017, the SST was $771.2m (2016: $809.9m).
E. Capital management continued

www.beazley.com Solvency and Financial Condition Report 2017 Beazley Insurance dac 39
E.2 Solvency Capital Requirement and Minimum Capital Requirement continuedUse of the internal modelBeazley’s internal model is regularly used across the group in a number of management processes as well as to input into a range of ad-hoc analysis that is presented to the business to support decision making e.g. reinsurance analysis.
Regular uses include:• capital setting: the internal model is used to calculate the
capital for each entity quarterly. The calculated capital is split by major risk i.e. insurance, market, credit, liquidity, operational and group risk;
• business planning including capital allocation: the internal model is used in the business planning process to allocate capital between divisions. This, when combined with the plan profit, allows management to compare the performance of the different business lines on a risk adjusted basis;
• business planning – catastrophe loss ratios: the internal model is used to calculate catastrophe loss ratios and reinsurance recoveries included in the plan;
• business planning – investment income: the internal model is used to calculate the investment income assumptions in the plan;
• business planning – portfolio optimisation;• business planning – reinsurance review;• long term plan: the capital projections and stress scenarios in
the long term plan are developed using internal model output;• reserving: the internal model is used to allow the actuarial
team to develop the reserve strength indicators which are used to communicate the level of prudence in the reserves;
• exposure management: the catastrophe model component of the internal model is used to monitor catastrophe risk against appetite and natural catastrophe risk model output for capital modelling;
• investment management: the asset risk component of the internal model is used to monitor investment risk and investment risk output for capital modelling;
• reinsurance credit risk: credit risk output for capital modelling;
• ORSA: 1-in-10 output to calculate key risk indicators to determine whether the syndicates are operating within risk appetite.
Scope of the internal model The scope of the internal model includes all material risks faced by Beazley split by division. No important risks are excluded from the internal model. The material risks currently included in the internal model are:• premium risk;• catastrophe risk (both natural and man-made);• reserving risk;• market (or asset) risk;• operational risk (including regulatory and legal risk);• credit risk;• group risk; and• liquidity risk
Methods used in the internal model The internal model estimates the probability distribution forecast using a structured quantitative process that makes use of methods that are: in line with good actuarial and statistical practice; subject to regular independent challenge; and appropriate to the analysis and risk profile in question. These methods use parameters that are estimated using all relevant internally available data; appropriate externally sourced industry data; data embedded in external models that have been prepared by experts; judgements based on appropriately qualified and challenged experts, and distributions which are statistically consistent with the historic data relating to the frequency and severity of loss.
Beazley uses a full internal model to calculate the SCR. The SCR is calculated by the internal model in accordance with the specifications of Article 101 of Directive 2009/138/EC; specifically that it is taken from the 99.5th percentile value at risk over a 1-year time horizon, taken directly from the probability distribution output generated by the calculation kernel and covers insurance (underwriting and reserving), asset (market), credit, and operational and group risk.
Data used in the internal modelModel inputs are made up of two key components:• inputs to model stand-alone risk which requires: – exposure data. For example the number of policies
of a given size and type; and – risk assumptions. For example setting out the range
of claim sizes for a given policy. These assumptions are based on relevant historic experience.
• input to aggregate the risk: – risk is aggregated using a ‘risk drivers’ approach where
the assumptions are set based on historic experience for each driver.
On-going appropriateness is ensured through the capital team’s in-team testing process which includes:• quarterly internal model data input testing which includes
a reconciliation of key data items; and• annual data quality testing which includes testing of data
quality standards (materiality, accuracy, completeness and appropriateness) for the internal model inputs.

www.beazley.com40 Beazley Insurance dac Solvency and Financial Condition Report 2017
E. Capital management continued
E.3 Use of the duration-based equity risk sub-module in the calculation of the Solvency Capital RequirementNot applicable.
E.4 Differences between the standard formula and any internal model usedThe internal model uses a modular structure comprising of a number of free-standing modules each addressing a risk category within scope of the internal model (see section E.2). A distribution is generated from each module. The modules are aggregated using a “risk drivers” approach in an overall module that calculates model output. Given the risk profile of Beazley (roughly an equal split of medium-tailed and short-tailed exposures) the most important risk driver is the market cycle which impacts all classes of business and all underwriting years. Driver variables for some risk modules are based upon the output results from other modules. For example, in the credit risk module, the probability of default for reinsurers is increased when the size of the modelled catastrophe exceeds a defined level.
The main differences in the methodologies and underlying assumptions used in the standard formula (SF) and in the internal model (IM) by risk module are as follows:• greater premium and reserve risk is assumed for the
IM reflecting the underlying economic risks while the SF assumptions are applied to the technical provisions;
• Catastrophe risk assumptions are lower in the IM reflecting the detailed modelling of the portfolio;
• IM market risk is greater than the SF due to greater interest rate and credit spread risk assumptions as well as making allowance for the full economic risk within the underlying asset portfolio;
• Greater credit and operational risk is assumed for the IM than for the SF;
• The IM assumes greater diversification between risk categories than that assumed in the SF with the driver of risk assumptions reflecting the risk profile; and
• IM explicitly includes profit offsetting the risk.
The risks covered in the IM are in line with those covered in the SF; however some risks, for example court inflation, are explicitly rather than implicitly modelled.
E.5 Non-compliance with the Minimum Capital Requirement and non-compliance with the Solvency Capital RequirementThere have been no material changes or instances of non-compliance with the SCR or MCR over the reporting period, nor is there a foreseeable risk of non-compliance which is considered in the ORSA report where a confirmation statement of continued compliance (for regulatory capital requirements and regulatory requirements for technical provisions) is made.
E.6 Any other informationThere is no other material information to report.

www.beazley.com Solvency and Financial Condition Report 2017 Beazley Insurance dac 41
The following quantitative reporting templates are appended to this report.
S.02.01.02 – Balance sheetS.05.01.02 – Premiums, claims and expenses by line
of businessS.05.02.01 – Premiums, claims and expenses by countryS.17.01.02 – Non-life technical provisionsS.19.01.21 – Claims trianglesS.23.01.01 – Own fundsS.25.03.21 – Solvency Capital Requirement calculated
using a full internal modelS.28.01.01 – Minimum capital requirement
All monetary amounts are in thousands of US dollars. Please note that totals may differ from the sum of component parts due to rounding. For improved presentation, some blank columns in the quantitative reporting templates have been omitted. All items disclosed are consistent with the quantitative reporting submitted privately to the Central Bank of Ireland.
Appendix: Quantitative reporting

www.beazley.com42 Beazley Insurance dac Solvency and Financial Condition Report 2017
S.02.01.02 – Balance sheetSolvency II
value
C0010
AssetsIntangible assets R0030 Deferred tax assets R0040 379 Pension benefit surplus R0050 Property, plant & equipment held for own use R0060 Investments (other than assets held for index-linked and unit-linked contracts) R0070 1,238,617 Property (other than for own use) R0080 Holdings in related undertakings, including participations R0090 Equities R0100 Equities – listed R0110 Equities – unlisted R0120 Bonds R0130 1,103,791 Government Bonds R0140 378,486 Corporate Bonds R0150 725,305 Structured notes R0160 Collateralised securities R0170 Collective Investments Undertakings R0180 129,796 Derivatives R0190 5,030 Deposits other than cash equivalents R0200 Other investments R0210 Assets held for index-linked and unit-linked contracts R0220 Loans and mortgages R0230 Loans on policies R0240 Loans and mortgages to individuals R0250 Other loans and mortgages R0260 Reinsurance recoverables from: R0270 (1,942) Non-life and health similar to non-life R0280 (1,942) Non-life excluding health R0290 (1,942) Health similar to non-life R0300 Life and health similar to life, excluding health and index-linked and unit-linked R0310 Health similar to life R0320 Life excluding health and index-linked and unit-linked R0330 Life index-linked and unit-linked R0340 Deposits to cedants R0350 Insurance and intermediaries receivables R0360 21 Reinsurance receivables R0370 Receivables (trade, not insurance) R0380 9,916 Own shares (held directly) R0390 Amounts due in respect of own fund items or initial fund called up but not yet paid in R0400 Cash and cash equivalents R0410 23,053 Any other assets, not elsewhere shown R0420 1,035 Total assets R0500 1,271,080
Appendix: Quantitative reporting continued

www.beazley.com Solvency and Financial Condition Report 2017 Beazley Insurance dac 43
S.02.01.02 – Balance sheetSolvency II
value
C0010
LiabilitiesTechnical provisions – non-life R0510 (419,616) Technical provisions – non-life (excluding health) R0520 (419,616) TP calculated as a whole R0530 Best estimate R0540 (507,534) Risk margin R0550 87,919 Technical provisions – health (similar to non-life) R0560 TP calculated as a whole R0570 Best estimate R0580 Risk margin R0590 TP – life (excluding index-linked and unit-linked) R0600 Technical provisions – health (similar to life) R0610 TP calculated as a whole R0620 Best estimate R0630 Risk margin R0640 TP – life (excluding health and index-linked and unit-linked) R0650 TP calculated as a whole R0660 Best estimate R0670 Risk margin R0680 TP – index-linked and unit-linked R0690 TP calculated as a whole R0700 Best estimate R0710 Risk margin R0720 Contingent liabilities R0740 Provisions other than technical provisions R0750 Pension benefit obligations R0760 Deposits from reinsurers R0770 Deferred tax liabilities R0780 37,738Derivatives R0790 411 Debts owed to credit institutions R0800 Debts owed to credit institutions resident domestically ER0801 Debts owed to credit institutions resident in the euro area other than domestic ER0802 Debts owed to credit institutions resident in rest of the world ER0803 Financial liabilities other than debts owed to credit institutions R0810 debts owed to non-credit institutions ER0811 debts owed to non-credit institutions resident domestically ER0812 debts owed to non-credit institutions resident in the euro area other than domestic ER0813 debts owed to non-credit institutions resident in rest of the world ER0814 other financial liabilities (debt securities issued) ER0815 Insurance & intermediaries payables R0820 Reinsurance payables R0830 Payables (trade, not insurance) R0840 576 Subordinated liabilities R0850 265,412 Subordinated liabilities not in BOF R0860 Subordinated liabilities in BOF R0870 265,412 Any other liabilities, not elsewhere shown R0880 3,086 Total liabilities R0900 (112,394)
Excess of assets over liabilities R1000 1,383,474
Excess of assets over liabilities minus Subordinated Liabilities in BOF 1,648,885

Appendix: Quantitative reporting continued
www.beazley.com44 Beazley plc Solvency and Financial Condition Report 2017
S.05.01.02 – Premiums, claims and expenses by line of business
Line of Business for: non-life insurance and reinsurance obligations (direct business and accepted proportional reinsurance)
Line of Business for: accepted non-proportional reinsurance
Total
Income protection insurance
Marine, aviation and
transport insurance
Fire and other damage
to property insurance
General liability
insurance
Credit and suretyship insurance
Miscellaneous financial loss Health Casualty Property
C0020 C0060 C0070 C0080 C0090 C0120 C0130 C0140 C0160 C0200
Premiums written Gross – Direct Business R0110 601 601 Gross – Proportional reinsurance accepted R0120 26,183 174,056 243,584 778,178 35,854 26,259 1,284,113 Gross – Non-proportional reinsurance accepted R0130 22,462 18,498 92,422 133,381 Reinsurers’ share R0140 216 216 Net R0200 26,183 174,056 243,584 778,562 35,854 26,259 22,462 18,498 92,422 1,417,879Premiums earned Gross – Direct Business R0210 120 120 Gross – Proportional reinsurance accepted R0220 32,040 169,179 237,556 709,040 27,510 25,144 1,200,470 Gross – Non-proportional reinsurance accepted R0230 21,325 18,518 93,658 133,501 Reinsurers’ share R0240 52 52 Net R0300 32,040 169,179 237,556 709,109 27,510 25,144 21,325 18,518 93,658 1,334,039Claims incurred Gross – Direct Business R0310 72 72 Gross – Proportional reinsurance accepted R0320 20,961 91,734 185,528 353,203 28,458 10,992 690,874 Gross – Non-proportional reinsurance accepted R0330 11,314 (1,540) 68,635 78,410 Reinsurers’ share R0340 42 42 Net R0400 20,961 91,734 185,528 353,232 28,458 10,992 11,314 (1,540) 68,635 769,314
Changes in other technical provisionGross – Direct business R0410 0 Gross – Proportional reinsurance accepted R0420 0 Gross – Non-proportional reinsurance accepted R0430 0 Reinsurers’ share R0440 0 Net R0500 0

www.beazley.com Solvency and Financial Condition Report 2017 Beazley plc 45
S.05.01.02 – Premiums, claims and expenses by line of business
Line of Business for: non-life insurance and reinsurance obligations (direct business and accepted proportional reinsurance)
Line of Business for: accepted non-proportional reinsurance
Total
Income protection insurance
Marine, aviation and
transport insurance
Fire and other damage
to property insurance
General liability
insurance
Credit and suretyship insurance
Miscellaneous financial loss Health Casualty Property
C0020 C0060 C0070 C0080 C0090 C0120 C0130 C0140 C0160 C0200
Expenses incurred R0550 12,431 77,703 114,997 292,096 13,883 8,539 13,741 9,380 38,798 581,568
Other expenses R1200 Total expenses R1300 581,568
The following columns, which are blank, have been omitted for improved presentation:
COO10 Medical expense insurance C0030 Workers’ compensation insurance C0040 Motor vehicle liability insurance C0050 Other motor insurance C0100 Legal expenses insurance C0110 Assistance C0150 Marine, aviation, transport

www.beazley.com46 Beazley Insurance dac Solvency and Financial Condition Report 2017
S.05.01.02 – Premiums, claims and expenses by line of businessLine of
Business for: life
insurance obligations
Life reinsurance obligations
Other life insurance
Life reinsurance Total
C0240 C0280 C0300
Premiums written Gross R1410 (5,924) (529) (6,453) Reinsurers’ share R1420 0 Net R1500 (5,924) (529) (6,453)Premiums earned Gross R1510 0 Reinsurers’ share R1520 0 Net R1600 0Claims incurred Gross R1610 43 16 59 Reinsurers’ share R1620 0 Net R1700 43 16 59Changes in other technical provisions Gross R1710 0 Reinsurers’ share R1720 0 Net R1800 0Expenses incurred R1900 (43) (16) (59)Other expenses R2500 Total expenses R2600 (59)
The following columns, which are blank, have been omitted for improved presentation:C0210 Health insuranceC0220 Insurance with profit participationC0230 Index-linked and unit-linked insuranceC0250 Annuities stemming from non-life insurance contracts and relating to health insurance obligationsC0260 Annuities stemming from non-life insurance contracts and relating to insurance obligations other than health insurance obligationsC0270 Health reinsurance
Appendix: Quantitative reporting continued

www.beazley.com Solvency and Financial Condition Report 2017 Beazley Insurance dac 47
S.05.02.01 – Premiums, claims and expenses by countryHome Country – non-life obligations
Home Country
Top 5 countries (by amount
of gross premiums
written) non-life
obligationsTotal Top 5 and home country
C0010 C0020 C0070
IrelandUnited
Kingdom
R0010 C0080 C0090 C0140
Premium writtenGross – Direct Business R0110 601 601Gross – Proportional reinsurance accepted R0120 1,284,113 1,284,113Gross – Non-proportional reinsurance accepted R0130 133,381 133,381Reinsurers’ share R0140 216 216Net R0200 1,417,879 1,417,879Premium earned Gross – Direct Business R0210 120 120Gross – Proportional reinsurance accepted R0220 1,200,470 1,200,470Gross – Non-proportional reinsurance accepted R0230 133,501 133,501Reinsurers’ share R0240 52 52Net R0300 1,334,039 1,334,039Claims incurred Gross – Direct Business R0310 72 72Gross – Proportional reinsurance accepted R0320 690,874 690,874Gross – Non-proportional reinsurance accepted R0330 78,410 78,410Reinsurers’ share R0340 42 42Net R0400 769,314 769,314Changes in other technical provisions Gross – Direct Business R0410 0Gross – Proportional reinsurance accepted R0420 0Gross – Non-proportional reinsurance accepted R0430 0Reinsurers’ share R0440 0Net R0500 0Expenses incurred R0550 581,568 581,568Other expenses R1200 Total expenses R1300 581,568
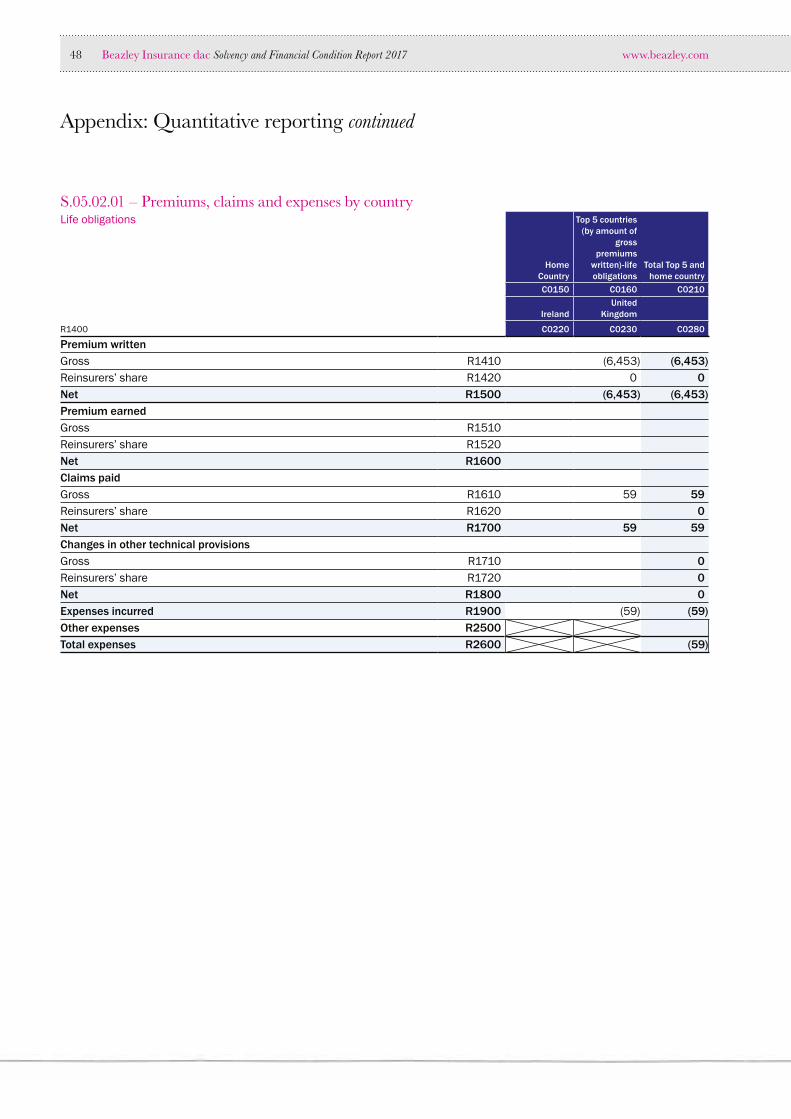
www.beazley.com48 Beazley Insurance dac Solvency and Financial Condition Report 2017
Appendix: Quantitative reporting continued
S.05.02.01 – Premiums, claims and expenses by countryLife obligations
Home Country
Top 5 countries (by amount of
gross premiums
written)-life obligations
Total Top 5 and home country
C0150 C0160 C0210
IrelandUnited
Kingdom
R1400 C0220 C0230 C0280
Premium written Gross R1410 (6,453) (6,453)Reinsurers’ share R1420 0 0Net R1500 (6,453) (6,453)Premium earned Gross R1510 Reinsurers’ share R1520 Net R1600 Claims paid Gross R1610 59 59Reinsurers’ share R1620 0Net R1700 59 59Changes in other technical provisions Gross R1710 0Reinsurers’ share R1720 0Net R1800 0Expenses incurred R1900 (59) (59)Other expenses R2500 Total expenses R2600 (59)

www.beazley.com Solvency and Financial Condition Report 2017 Beazley Insurance dac 49
S.17.01.02 – Non-life technical provisionsDirect business and accepted
proportional reinsuranceAccepted non-proportional
reinsurance:
Total non-life
obligations
Income protection insurance
Marine, aviation
and transport
insurance
Fire and other
damage to property
insurance
General liability
insurance
Credit and suretyship insurance
Miscellaneous financial
loss
Non-proportional
health reinsurance
Non-proportional
casualty reinsurance
Non-proportional
property reinsurance
C0030 C0070 C0080 C0090 C0100 C0130 C0140 C0150 C0170 C0180
Technical provisions calculated as a whole R0010 0Total Recoverables from reinsurance/SPV and Finite Re after the adjustment for expected losses due to counterparty default associated to TP as a whole R0050 0Technical Provisions calculated as a sum of BE and RM Best estimate Premium provisions Gross – Total R0060 (208) (302,139) (302,346)Total recoverable from reinsurance/SPV and Finite Re after the adjustment for expected losses due to counterparty default R0140 (1,906) (1,906)Net Best Estimate of Premium Provisions R0150 1,698 (302,139) (300,440)Claims provisions Gross – Total R0160 (14) (205,175) (205,188)Total recoverable from reinsurance/SPV and Finite Re after the adjustment for expected losses due to counterparty default R0240 (36) (36)Net Best Estimate of Claims Provisions R0250 22 (205,175) (205,152)Total Best estimate – gross R0260 (221) (507,313) (507,534)Total Best estimate – net R0270 1,721 (507,313) (505,592)Risk margin R0280 266 87,653 87,919

www.beazley.com50 Beazley Insurance dac Solvency and Financial Condition Report 2017
Appendix: Quantitative reporting continued
S.17.01.02 – Non-life technical provisionsDirect business and accepted
proportional reinsurance Accepted non-proportional reinsurance:
Total non-life obligations
Income protection insurance
Marine, aviation
and transport
insurance
Fire and other
damage to property insurance
General liability
insurance
Credit and suretyship insurance
Miscellaneous financial loss
Non-proportional
health reinsurance
Non-proportional
casualtyreinsurance
Non-proportional
property reinsurance
C0030 C0070 C0080 C0090 C0100 C0130 C0140 C0150 C0170 C0180
Amount of the transitional on Technical Provisions TP as a whole R0290 0Best estimate R0300 0Risk margin R0310 0Technical Provisions Technical provisions – total R0320 44 (419,660) (419,616)Recoverable from reinsurance contract/SPV and Finite Re after the adjustment for expected losses due to counterparty default – total R0330 (1,942) (1,942)Technical provisions minus recoverables from reinsurance/SPV and Finite Re-total R0340 1,987 (419,660) (417,674)
The following columns, which are blank, have been omitted for improved presentation:C0020 Medical expense insurance C0110 Legal expenses insuranceC0040 Workers’ compensation insurance C0120 AssistanceC0050 Motor vehicle liability insurance C0160 Non-proportional marine, aviation and transport reinsuranceC0060 Other motor insurance

www.beazley.com Solvency and Financial Condition Report 2017 Beazley plc 51
S.19.01.21 – Claims triangles
Accident year/ Underwriting year Z0020 Underwriting year
Gross Claims Paid (non-cumulative)(absolute amount)
Development year
Year 0
1
2 3
4 5 6 7 8 9 10 & +
In current year
Sum of years (cumulative)
C0010 C0020 C0030 C0040 C0050 C0060 C0070 C0080 C0090 C0100 C0110 C0170 C0180
Prior R0100 – R0100 – –N-9 R0160 – – – – – – – – – – R0160 – –N-8 R0170 – – – – – – – – – R0170 – –N-7 R0180 – – – – – – – – R0180 – –N-6 R0190 – – – – – – – R0190 – –N-5 R0200 – – – – – – R0200 – –N-4 R0210 – – – – – R0210 – –N-3 R0220 – – – – R0220 – –N-2 R0230 – – – R0230 – –N-1 R0240 – – R0240 – –N R0250 – R0250 – – Total R0260 – –

Appendix: Quantitative reporting continued
www.beazley.com52 Beazley plc Solvency and Financial Condition Report 2017
Gross undiscounted Best Estimate Claims Provisions (absolute amount)
Development year
Year 0 1 2 3 4 5 6 7 8 9 10 & +
Year end (discounted
data)
C0200 C0210 C0220 C0230 C0240 C0250 C0260 C0270 C0280 C0290 C0300 C0360
Prior R0100 R0100N-9 R0160 R0160N-8 R0170 R0170N-7 R0180 R0180N-6 R0190 R0190N-5 R0200 R0200N-4 R0210 R0210N-3 R0220 (153,313) R0220N-2 R0230 (82,275) (205,528) R0230 (205,175)N-1 R0240 49,428 R0240N R0250 (13) R0250 (14)
Total R0260 (205,188)
S.19.01.21 – Claims triangles

www.beazley.com Solvency and Financial Condition Report 2017 Beazley Insurance dac 53
S.23.01.01 – Own funds
TotalTier 1 –
unrestricted Tier 2 Tier 3
C0010 C0020 C0040 C0050
Basic own funds before deduction for participations in other financial sector as foreseen in article 68 of Delegated Regulation (EU) 2015/35 Ordinary share capital (gross of own shares) R0010 0 0 Share premium account related to ordinary share capital R0030 Initial funds, members’ contributions or the equivalent
basic own – fund item for mutual and mutual-type undertakings R0040
Subordinated mutual member accounts R0050 Surplus funds R0070 Preference shares R0090 Share premium account related to preference shares R0110 Reconciliation reserve R0130 799,214 799,214 Subordinated liabilities R0140 265,412 265,412 An amount equal to the value of net deferred tax assets R0160 379 379 Other own fund items approved by the supervisory
authority as basic own funds not specified above R0180 536,317 536,317 Own funds from the financial statements that should not be represented by the reconciliation reserve and do not meet the criteria to be classified as Solvency II own funds Own funds from the financial statements that should not
be represented by the reconciliation reserve and do not meet the criteria to be classified as Solvency II own funds R0220
Deductions Deductions for participations in financial and credit institutions R0230 Total basic own funds after deductions R0290 1,601,322 1,335,532 265,412 379
Ancillary own funds Unpaid and uncalled ordinary share capital callable on demand R0300 Unpaid and uncalled initial funds, members’ contributions
or the equivalent basic own fund item for mutual and mutual – type undertakings, callable on demand R0310
Unpaid and uncalled preference shares callable on demand R0320 A legally binding commitment to subscribe and pay for
subordinated liabilities on demand R0330 Letters of credit and guarantees under Article 96(2) of the
Directive 2009/138/EC R0340 Letters of credit and guarantees other than under Article
96(2) of the Directive 2009/138/EC R0350 Supplementary members calls under first subparagraph
of Article 96(3) of the Directive 2009/138/EC R0360 Supplementary members calls – other than under
first subparagraph of Article 96(3) of the Directive 2009/138/EC R0370
Other ancillary own funds R0390 Total ancillary own R0400

www.beazley.com54 Beazley Insurance dac Solvency and Financial Condition Report 2017
Appendix: Quantitative reporting continued
S.23.01.01 – Own funds
TotalTier 1 –
unrestricted Tier 2 Tier 3
C0010 C0020 C0040 C0050
Available and eligible own funds Total available own funds to meet the SCR R0500 1,601,322 1,335,532 265,412 379Total available own funds to meet the MCR R0510 1,600,943 1,335,532 265,412Total eligible own funds to meet the SCR R0540 1,601,322 1,335,532 265,412 379Total eligible own funds to meet the MCR R0550 1,368,049 1,335,532 32,518SCR R0580 650,350 MCR R0600 162,588 Ratio of Eligible own funds to SCR R0620 246.22% Ratio of Eligible own funds to MCR R0640 841.42%
C0060
Reconciliation reserve Excess of assets over liabilities R0700 1,383,474 Own shares (held directly and indirectly) R0710 Foreseeable dividends, distributions and charges R0720 47,563 Other basic own fund items R0730 536,696 Adjustment for restricted own fund items in respect of matching
adjustment portfolios and ring fenced funds R0740 Reconciliation reserve R0760 799,214Expected profits Expected profits included in future premiums (EPIFP) – Life Business R0770 Expected profits included in future premiums (EPIFP) – Non-life business R0780 518,014
Total Expected profits included in future premiums (EPIFP) R0790 518,014
The following columns, which are blank, have been omitted for improved presentation:C0030 Tier 1 restricted

www.beazley.com Solvency and Financial Condition Report 2017 Beazley Insurance dac 55
S.25.03.21 – Solvency Capital Requirement calculated using a full internal model
Calculation of Solvency Capital Requirement C0100
Total undiversified components R0110 1,330,739Diversification R0060 (680,388)Capital requirement for business operated in accordance with Art. 4 of Directive 2003/41/EC R0160 Solvency capital requirement excluding capital add-on R0200 650,350Capital add-ons already set R0210 Solvency capital requirement R0220 650,350Other information on SCR Amount/estimate of the overall loss-absorbing capacity of technical provisions R0300 Amount/estimate of the overall loss-absorbing capacity of deferred taxes R0310 Total amount of Notional Solvency Capital Requirements for remaining part R0410 Total amount of Notional Solvency Capital Requirements for ring fenced funds R0420 Total amount of Notional Solvency Capital Requirement for matching adjustment portfolios R0430 Diversification effects due to RFF nSCR aggregation for article 304 R0440 Net future discretionary benefits R0460
Unique number of component Components descriptionCalculation of the
Solvency Capital Requirement
Consideration of the future management actions regarding
technical provisions and/or deferred taxes C0010 C0020 C0030 C0060
RES01 Reserve risk 440,3054 – No embedded consideration
of future management actions.
PRM01 Premium risk 285,3924 – No embedded consideration
of future management actions.
MKT01 Market risk 318,8164 – No embedded consideration
of future management actions.
OPL01 Operational risk 217,6644 – No embedded consideration
of future management actions.
CRT01 Credit risk 68,5634 – No embedded consideration
of future management actions.

www.beazley.com56 Beazley Insurance dac Solvency and Financial Condition Report 2017
Appendix: Quantitative reporting continued
S.28.01.01 – Minimum capital requirementLinear formula component for non-life insurance and reinsurance obligations
Non-life activities
MCR calculation non-life
Net (of reinsurance/SPV) best estimate and TP calculated as a whole
Net (of reinsurance) written premiums in the
last 12 months
Linear formula component for non-life insurance andreinsurance obligations –
MCR calculation
C0020 C0030
Medical expense insurance and proportional reinsurance R0020 Income protection insurance and proportional reinsurance R0030Workers’ compensation insurance and proportional reinsurance R0040 Motor vehicle liability insurance and proportional reinsurance R0050 Other motor insurance and proportional reinsurance R0060 Marine, aviation and transport insurance and proportional reinsurance R0070Fire and other damage to property insurance and proportional reinsurance R0080General liability insurance and proportional reinsurance R0090 1,721 177Credit and suretyship insurance and proportional reinsurance R0100 Legal expenses insurance and proportional reinsurance R0110 Assistance and proportional reinsurance R0120 Miscellaneous financial loss insurance and proportional reinsurance R0130Non-proportional health reinsurance R0140Non-proportional casualty reinsurance R0150 153,684 24,436Non-proportional marine, aviation and transport reinsurance R0160 Non-proportional property reinsurance R0170

www.beazley.com Solvency and Financial Condition Report 2017 Beazley Insurance dac 57
S.28.01.01 – Minimum capital requirementLinear formula component for life insurance and reinsurance obligations
Life activities
MCR calculation Life
Net (of reinsurance/SPV) best estimate and
TP calculated as a wholeNet (of reinsurance/SPV)
total capital at risk
Linear formula component for life insurance and
reinsurance obligations – MCR calculation
C0050 C0060
Obligations with profit participation – guaranteed benefits R0210 Obligations with profit participation – future discretionary benefits R0220 Index-linked and unit-linked insurance obligations R0230 Other life (re)insurance and health (re)insurance obligations R0240 Total capital at risk for all life (re)insurance obligations R0250
MCR componentsNon-life activities Life activities
C0010 C0040 Total
MCRNL Result R0010 24,613 24,613MCRL Result R0200 Overall MCR calculation C0070
Linear MCR R0300 24,613SCR R0310 650,350MCR cap R0320 45.00% 292,658MCR floor R0330 25.00% 162,588Combined MCR R0340 162,588Absolute floor of the MCR R0350 4,141
C0070
Minimum Capital Requirement R0400 162,588

beautifully designed insurance
Beazley Insurance dac
2 Northwood AvenueSantryDublinD09 X5N9Ireland
Phone: +353 (0)1 854 4700Email: [email protected]
www.beazley.com


