BiofuelsGS-2: Analytical Techniques in Combustion 1 Bed agglomeration in a 12 MW th CFB boiler when co-firing wood chips and straw pellets Frida Claesson, Patrycja Piotrowska, Oskar Karlström, Johan Lindholm INTRODUCTION Nowadays, thermal conversion of biomass is becoming more and more important. For large-scale biomass combustion, fluidized beds are considered to be one of the most important facilities [1]. Many of the problems in fluidized beds are related to ash composition. One such problem is bed agglomeration which increases the risk of de- fluidization and might cause unplanned shut-downs. Over the years, bed agglomeration has been thoroughly studied [2-6]. One of the reasons for bed agglomeration is alkali metals in the fuels. Alkali metals are also known to cause fouling and corrosion in the boiler [7, 8]. To increase the knowledge about how to reduce alkali-related problems in circulating fluidized bed (CFB) boilers, several tests with ammonium sulfate injections have been performed [7, 9]. In this work, bed agglomeration was investigated when co-firing different biomass fuels in a 12 MW th CFB boiler at Chalmers University of Technology. The boiler was run for two days. During the first day wood chips and straw pellets were co-fired. During the second day the same fuels were co-fired with an addition of ammonium sulfate (later referred to as day 1 and day 2). Bed material and cyclone leg samples were collected and analyzed by means of Scanning Electron Microscope with an Energy Dispersive X-ray analyzer (SEM/EDX). The SEM/EDX results were compared with chemical fractionation results of the co-fired fuels. METHOD EXPERIMENTAL SETUP Co-combustion tests with wood chips and straw pellets were performed in a 12 MW th CFB boiler at Chalmers University of Technology. Figure 1 shows the schematic diagram of the boiler. The combustion chamber (1) has a cross section of 2.25 m 2 and a height of 13.6 m. The co-fired fuels were mixed before being fed through the fuel chute (2). During the tests, the boiler was operated at 6.0 MW th , which resulted in a superficial flue gas velocity at the top of the riser of about 5.0 m/s and a circulation of material via the primary cyclone (3) and particle return leg (4) back to the boiler. The flue gas temperature was about 830 ºC when entering the convection pass (9) and the fly ashes were separated in the secondary cyclone (10) and in the bag house filter (11), where the temperature dropped to about 150 ºC. Liquid ammonium sulfate was added in the inlet of the primary cyclone (28).
Transcript
BiofuelsGS-2: Analytical Techniques in Combustion
1
Bed agglomeration in a 12 MWth CFB boiler when co-firing wood chips and straw pellets
Frida Claesson, Patrycja Piotrowska, Oskar Karlström, Johan Lindholm
INTRODUCTION Nowadays, thermal conversion of biomass is becoming more and more important. For large-scale biomass combustion, fluidized beds are considered to be one of the most important facilities [1]. Many of the problems in fluidized beds are related to ash composition. One such problem is bed agglomeration which increases the risk of de-fluidization and might cause unplanned shut-downs. Over the years, bed agglomeration has been thoroughly studied [2-6]. One of the reasons for bed agglomeration is alkali metals in the fuels. Alkali metals are also known to cause fouling and corrosion in the boiler [7, 8]. To increase the knowledge about how to reduce alkali-related problems in circulating fluidized bed (CFB) boilers, several tests with ammonium sulfate injections have been performed [7, 9]. In this work, bed agglomeration was investigated when co-firing different biomass fuels in a 12 MWth CFB boiler at Chalmers University of Technology. The boiler was run for two days. During the first day wood chips and straw pellets were co-fired. During the second day the same fuels were co-fired with an addition of ammonium sulfate (later referred to as day 1 and day 2). Bed material and cyclone leg samples were collected and analyzed by means of Scanning Electron Microscope with an Energy Dispersive X-ray analyzer (SEM/EDX). The SEM/EDX results were compared with chemical fractionation results of the co-fired fuels. METHOD EXPERIMENTAL SETUP Co-combustion tests with wood chips and straw pellets were performed in a 12 MWth CFB boiler at Chalmers University of Technology. Figure 1 shows the schematic diagram of the boiler. The combustion chamber (1) has a cross section of 2.25 m2 and a height of 13.6 m. The co-fired fuels were mixed before being fed through the fuel chute (2). During the tests, the boiler was operated at 6.0 MWth, which resulted in a superficial flue gas velocity at the top of the riser of about 5.0 m/s and a circulation of material via the primary cyclone (3) and particle return leg (4) back to the boiler. The flue gas temperature was about 830 ºC when entering the convection pass (9) and the fly ashes were separated in the secondary cyclone (10) and in the bag house filter (11), where the temperature dropped to about 150 ºC. Liquid ammonium sulfate was added in the inlet of the primary cyclone (28).
BiofuelsGS-2: Analytical Techniques in Combustion
2
Figure 1. The 12-MWth CFB boiler at Chalmers University of Technology. (1) combustion chamber; (2) fuel feed chute; (3) air plenum; (4) secondary air inlet at 2.1m; (5) secondary air inletat 3.7m; (6) secondary air inlet at 5.4m; (7) secondary air inlet into cyclone exit duct; (8) cycloneexit duct (9) hot primary cyclone; (10) particle return leg; (11) particle seal; (12) particle cooler;(13) measurement hole cr1; (14) measurement hole cr2; (15) measurement hole after convection pass; (16) cold secondary cyclone; (17) bag house filter; lime bin; (18) gas-extraction probe for emission monitoring; (19) flue gas fan; (20) sand bin; (21) lime bin; (22) hydrated lime bin; (23) fuel bunkers; (25) air fan; (26) flue gas recirculation fan; (27) IACM instrument; (28) ammonium sulfate injection point.
BiofuelsGS-2: Analytical Techniques in Combustion
3
Wood chips and straw pellets were co-fired in the CFB boiler for two days. Table 1 shows the flows of the fuels and the ash-forming matter. The flows were kept constant during both days. During the second day ammonium sulfate was added into the combustion process. Bed material samples and cyclone leg samples were collected for analysis during both days. CHEMICAL FRACTIONATION The chemical fractionation method [10-13] used in this project is presented in Figure 2. The method is a multi-step leaching which gives a selective extraction of inorganic compounds based on the solubility of the bonds in the fuel. The leaching is divided into three steps: water, ammonium acetate, and hydrochloric acid. From each step in the fractionation procedure a leachate sample is analyzed. The solid residue from the fractionation is analyzed as well as the untreated fuel. The main ash-forming elements found in the water fraction are alkali chlorides, sulfates and carbonates. The ammonium acetate fraction contains ion-exchangeable organically associated elements. The acid fraction consists of earth alkaline sulfates and carbonates. The remaining solid residue mainly consists of insoluble silicates.
Table 1. Flows of fuels and main ash components during co-firing tests Unit Wood
chips Straw pellets
Fuel in kg/h ds 979 273 Ash in kg/h 4 10 S in g/h 98 253 Cl in g/h 98 491 K in g/h 492 1544 Na in g/h 28 81 Al in g/h 35 86 Si in g/h 144 2055 Fe in g/h 77 61 Ca in g/h 928 700 Mg in g/h 151 286 Pin g/h 78 238
BiofuelsGS-2: Analytical Techniques in Combustion
4
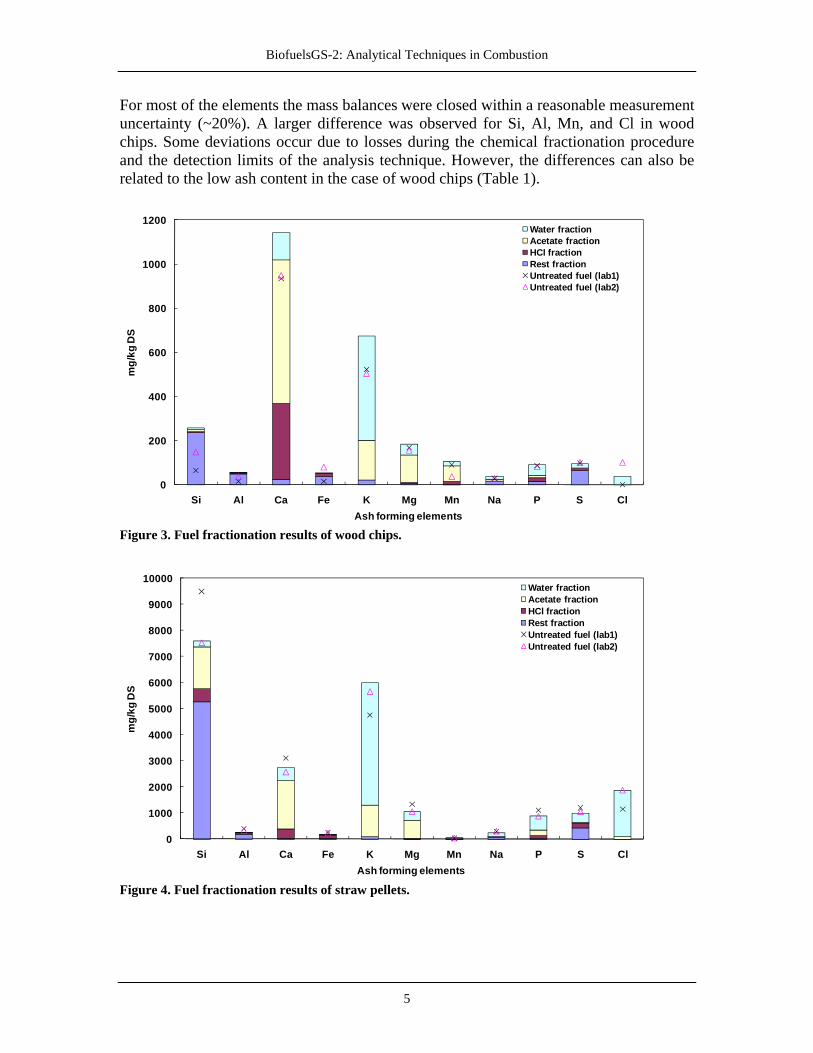
Figure 2. A schematic view of the used chemical fractionation method [7]. BED MATERIAL AND CYCLONE LEG SAMPLES ANALYSIS The samples taken from the boiler were analyzed with SEM/EDX. SEM-pictures were used to analyze particle cross-sections. Their chemical compositions were studied with EDX. Carbon was excluded from the analysis due to the sample preparation. Samples were analyzed with the SEM/EDX software (NSS 2.2 by Thermo Scientific) with three different methods: overall area, line, and phase analysis. The overall area analysis gives an overview and also the main composition of the whole area, in this case at 30x magnification. The line and phase analysis were performed on the pictures taken at higher magnification (500x and 1000x) in order to study details of the coatings and agglomerates. The line analysis tool provides information about the chemical composition along a chosen line in the SEM-picture. The phase analysis tool identifies areas of the SEM-picture where the chemical composition within the area is similar. RESULTS AND DISCUSSION FUEL CHARACTERIZATION Figure 3 and Figure 4 show the chemical analysis, both chemical fractionation and untreated fuel analysis, of the wood chips and the straw pellets. The untreated fuels were analyzed in two different laboratories for comparison. In both fuels, Cl can only be found in the water soluble fractions. Most of the Ca, K, Mg and P are detected in the water and the acetate fractions. However, Mn was also present in the previously mentioned fractions of the wood chips. Another clear difference is that ~20% of the Si is found in the acetate fraction of the straw pellets.
BiofuelsGS-2: Analytical Techniques in Combustion
5
For most of the elements the mass balances were closed within a reasonable measurement uncertainty (~20%). A larger difference was observed for Si, Al, Mn, and Cl in wood chips. Some deviations occur due to losses during the chemical fractionation procedure and the detection limits of the analysis technique. However, the differences can also be related to the low ash content in the case of wood chips (Table 1).
0
200
400
600
800
1000
1200
Si Al Ca Fe K Mg Mn Na P S Cl
mg/
kg D
S
Ash forming elements
Water fractionAcetate fractionHCl fractionRest fractionUntreated fuel (lab1)Untreated fuel (lab2)
Figure 3. Fuel fractionation results of wood chips.
0
1000
2000
3000
4000
5000
6000
7000
8000
9000
10000
Si Al Ca Fe K Mg Mn Na P S Cl
mg/
kg D
S
Ash forming elements
Water fractionAcetate fractionHCl fractionRest fractionUntreated fuel (lab1)Untreated fuel (lab2)
Figure 4. Fuel fractionation results of straw pellets.
BiofuelsGS-2: Analytical Techniques in Combustion
6
BED AGGLOMERATION ANALYSIS OVERALL COMPOSITION SEM-pictures of bed material from both days are shown in Figure 5. The left picture shows separate coated particles, whilst the right picture shows bed agglomeration, which makes the results in Figure 6 somewhat incomparable. The EDX-analysis of the areas marked by the orange squares in Figure 5 are presented in Figure 6. SEM-pictures and quantification results of the circulating bed material are presented in Figure 7 and Figure 8. The color difference in the SEM-pictures can not be directly related to the changes in the process conditions between the days.
Figure 5. Bed material sample 30x magnification. Left: day 1; right: day 2.
0
1
2
3
4
5
Na2O MgO Al2O3 K2O CaO Fe2O3
Wt‐%
Day 1 ‐without additives Day 2 ‐ Ammonium sulfate injection
9.14
Figure 6. Overall area SEM/EDX analysis of the bed material sample. SiO2 was excluded from the graphs, since it mainly comes from the bed material. Elements are shown as oxides.
BiofuelsGS-2: Analytical Techniques in Combustion
7
BED MATERIAL Figure 9 shows the phase analysis of the SEM-picture from day 1. Five clear phases of a similar chemical composition can be distinguished: epoxy, Si-core and three different coating layers. As can be seen from the figure, the layer closest to the silica core is rich in K. Next to the K-rich layer, a thin Ca-rich layer is observed. The outermost layer of the particle coating consists of main ash forming elements entering with the fuels as shown in Table 1 (Si, Ca, K, Mg and P). Due to the sample preparation, an additional layer of epoxy is seen in Figure 9. In the left picture in Figure 9 an arrow is drawn from the silica core to the epoxy layer. A line analysis along the arrow is performed by the SEM software and the results are shown in Figure 10. As can be seen in the figure, the concentration of Si and K decreases as Ca
0
1
2
3
4
5
MgO Al2O3 K2O CaO MnO Fe2O3
Wt‐%
Day 1 ‐without additives Day 2 ‐ Ammonium sulfate injection
Figure 8. Overall area SEM/EDX analysis of cyclone leg sample. SiO2 was excluded from the graphs, since it mainly comes from the bed material. Elements are shown as oxides.
Figure 7. Cyclone leg sample 30x magnification, Left: day 1; right: day 2.
BiofuelsGS-2: Analytical Techniques in Combustion
8
increases, corresponding to the phase analysis in the outermost layers (Figure 9). To the right of the Ca-peak concentrations of the ash-forming elements Mg, P and K increase. Phase analysis shown in Figure 11 of bed material particle from day 2 shows similar results as discussed for Figure 9 (day 1). This indicates that the addition of ammonium sulfate did not affect the composition, neither the order, of the particle coating layers.
Figure 9. Left: SEM analysis of bed material particle from day 1, 1000x magnification. Right: phase analysis of the SEM picture. Red area corresponds to sand particles, yellow to epoxy area, violet to potassium-rich area, blue to calcium-rich area, green to ash area.
Figure 10. SEM/EDX line analysis of the bed material particle from day 1 along the arrow in Figure 9.
BiofuelsGS-2: Analytical Techniques in Combustion
9
As for the sample from day 1, line analysis was performed for the bed material particle sample from day 2 as seen in Figure 12. Similar results show a temporary increase of Ca when moving from the particle core outwards. Again, the covering layer corresponds to the ash composition. For both days, in the K-rich layer the K concentration is about 15 wt-% (35 wt-% Si), and the peak concentration of Ca in the Ca-rich layer is about 25 wt-%.
Figure 11. Left: SEM analysis of bed material particle from day 2, 1000x magnification. Right: phase analysis of the SEM picture. Red area corresponds to sand particles, yellow to epoxy area, violet to potassium-rich area, blue to calcium-rich area, green to ash area.
Figure 12. SEM/EDX line analysis of the bed material particle from day 2 along the arrow in Figure 11.
BiofuelsGS-2: Analytical Techniques in Combustion
10
CIRCULATING BED MATERIAL Figure 13 and Figure 15 show SEM-picture of circulating bed material particles from day 1 and day 2, respectively. No significant changes can be observed, compared with the bed material particles discussed above. The same can be stated for the line analyses results shown in Figure 14 and Figure 16. However, the Ca concentration is higher the ash layer than in the bed material particles.
Figure 13. Left: SEM analysis of circulating bed material particle from day 1, 1000x magnification. Right: phase analysis of the SEM picture. Red area corresponds to sand particles, yellow to epoxy area, violet to potassium-rich area, blue to calcium-rich area, green to ash area.
Figure 14. SEM/EDX line analysis of the circulating bed material particle from day 1 along the arrow in Figure 13.
BiofuelsGS-2: Analytical Techniques in Combustion
11
BED AGGLOMERATION To illustrate bed agglomeration, Figure 17 shows two bed material particles “glued” together. Layers of different composition are marked with separate colors using the phase analysis. Here, the large adhesive area connecting the particles most probably consists of molten silicates. Figure 18 supports the theory of the composition of the “glue”. The area also contains the ash layer seen in the phase analyses of the particles above (Figure 9, Figure 11, Figure 13, and Figure 15).
Figure 16. SEM/EDX line analysis of circulating bed material particle from day 2 along the arrow in Figure 15.
Figure 15. Left: SEM analysis of circulating bed material particle from day 2, 1000x magnification. Right: phase analysis of the SEM picture. Red area corresponds to sand particles, yellow to epoxy area, violet to potassium-rich area, blue to calcium-rich area, green to ash area.
BiofuelsGS-2: Analytical Techniques in Combustion
12
CONCLUSIONS Wood chips and straw pellets were co-fired in a 12 MWth CFB boiler for two days. The samples of bed material and circulating bed material were collected and analyzed with SEM/EDX. During the second day, liquid ammonium sulfate was injected into the boiler in the primary cyclone inlet in order to reduce the formation of alkali metal chlorides. The SEM examinations of the samples showed that a coating with a thickness of around 30 µm was formed around the bed material particles and the circulating bed particles. The coating consisted of several layers. The layers closest to the silica core were rich in
Figure 17. Left: SEM analysis of agglomerated bed material particles from day 1, 500x magnification. Right: phase analysis of the SEM picture. Red area corresponds to sand particles, yellow to epoxy area, violet to potassium-rich area, blue to calcium-rich area, pink to silicate molten phase.
Figure 18. SEM/EDX line analysis of the agglomerated bed material particles from day 1 along the arrow in Figure 17.
BiofuelsGS-2: Analytical Techniques in Combustion
13
potassium and silica, indicating a formation of potassium silicates. On the top of the potassium-rich layer a calcium-rich layer was found. The outermost layer showed a composition consisting of elements similar to those in the fuel ash. The SEM results were compared with fuel fractionation results. The elements found in the water and acetate fractions seem to be found in the outermost layer of the coated sand particles. In the coatings, no significant differences were found between the bed material particles and the circulating bed particles. Furthermore, no influence of ammonium sulfate addition on bed agglomeration was observed. Agglomerates could be found in the bed samples indicating that bed material agglomeration took place in the boiler during the tests. SEM/EDX analysis of their cross-sections showed that potassium silicates acted as the adhesive agent. REFERENCES [1] Hupa, M; “Current status and challenges within fluidized bed combustion” N. Syred and A. Khalatov
(eds.), Advanced Combustion and Aerothermal Technologies, (2007) 87-101 [2] Olofsson, G., Ye, Z., Bjerle, I., Andersson, A; “Bed agglomeration problems in fluidized bed-biomass
combustion” Ind. Eng. Chem. Res. 41 (2002) 2888-2894 [3] Tiainen, M., Daavitsainen, J., Laitinen, R.S; “The role of amorphous material in ash on the
agglomeration problems in FB boilers. A powder XRD and SEM-EDS Study” Energy Fuels 16 (2002) 871-877
[4] Scala, F., Chirone, R; “Characterization and early detection of bed agglomeration during the fluidized bed combustion of olive husk” Energy Fuels 20 (2006) 120-132
[5] Visser, H.J.M., van Lith, S.C., Kiel, J.H.A; “Biomass ash-bed material interactions leading to agglomeration in FBC” J. Energy Res. Technol. 130 (2008)
[6] Bartels, M., Lin W., Nijenhuis J., Kapteijn F., van Ommen J.R; ”Agglomeration in fluidized beds at high temperatures: Mechanisms, detection and prevention” Prog. Energy Combust. Sci. 34 (2008) 633– 666
[7] Petterson, A., Åhmand, L-E., Steenari, B-M; “Chemical fractionation for the characterization of fly ashes from co-combustion of biofuels using different methods for alkali reduction” Fuel 88 (2009) 1758-1772
[8] Davidsson, K.O., Åmand, L-E., Steenari, B-M., Elled, A-L., Eskilsson, D., Leckner, B; “Countermeasures against alkali related problems during combustion of biomass in circulating fluidized bed boilers” Chem. Eng. Sci. 63 (2008) 5314-5329
[9] Broström, M., Kassman, H., Helgesson, A., Berg, M., Andersson, C., Backman, R., Nordin, A; “Sulfation of corrosive alkali chlorides by ammonium sulphate in a biomass fired CFB boiler” Fuel Process. Technol. 88 (2007) 1171-1177
[10] Benson, S.A, Holm, P.L; “Comparison of Inorganic Consitutents in Three Low-Rank Coals” Ind. Chem. Prod. Res. Dev. 24 (1985) 145-149
[11] Miles, T., Miles, Jr T., Baxter, L.L., Bryers, R., Jenkis, B., Oden, L; “Boiler deposits from firing biomass fuels” Biomass Bioenergy 10 (1996) 125-138
[12] Baxter, L.L., Miles, T., Miles, Jr T., Jenkis, B., Milne, T., Dayton, D., Bryers, R., Oden, L; “The behaviour of inorganic material in biomass-fired power boilers: field and laboratory experiments” Fuel Process. Technol. 54 (1998) 47-78
[13] Zevenhoven-Onderwater, M; “Ash-forming Matter in Biomass Fuels” PhD thesis. Department of Chemical Engineering, Åbo Akademi University, Finland, 2001 ISBN 952-12-0813-9