123


Bedford Borough Council
ANNUAL MONITORING REPORT
2009/10
(December 2010)


1
Contents Page 1 Executive Summary 3 2 Introduction 10 Part 1 3 Local Development Scheme 13 Part 2 4 Contextual Indicators 18 5 Core Output Indicators 21 6 Local Output Indicators 44 7 Significant Effects Indicators 81 Part 3 8 Future Monitoring 82 Glossary 84 Appendix A Progress against Local Development
Scheme Milestones
87 Appendix B Contextual Indicators 88 Appendix C National, Regional and Local Targets 103 Appendix D Use Classes Order 110 Appendix E 5 Year Housing Supply 111

2

3
1. Executive Summary 1.1 The purpose of the Annual Monitoring Report (AMR) is to set out how
the Borough Council’s planning policies are performing. This is the sixth Annual Monitoring Report the Council has produced.
1.2 This sixth AMR sets out how the documents that have been adopted as
part of the Bedford Development Framework (BDF) have performed in the period 1st April 2009 to 31st March 2010 (the monitoring period). The documents that have been adopted to date are: • Core Strategy and Rural Issues Plan Development Plan Document
(DPD) • Bedford Town Centre Area Action Plan DPD • Statement of Community Involvement • Land North of Bromham Road Design Guide Supplementary
Planning Document (SPD) • Community Safety Design Guide SPD • Shopfronts and Advertisements in Conservation Areas SPD • Climate Change and Pollution SPD • A Strategy for Bedford High Street SPD • West of Kempston Design Guide SPD • Great Denham (formerly Biddenham Loop) Design Guide SPD
1.3 The AMR also monitors those policies in the Local Plan (2002) that have not been superseded by BDF documents.
1.4 On 1st April 2009 Bedford Borough Council became a Unitary Authority. The Council is now solely responsible for all planning issues within the borough, including inheriting the previous County Council’s 4(4) status, meaning we are now a statutory consultee on regional spatial issues). The Council also became a Minerals and Waste Planning Authority on 1st April 2009. This is provided as a shared service with Central Bedfordshire and performance on minerals and waste issues is recorded in a separate Annual Monitoring Report.
1.5 The current economic climate has continued to have an effect on the
development industry, which is reflected in the figures reported in this AMR. Surveys have once again been carried out to provide an update on the state of the housing and employment land supply in the borough.
1.6 In the monitoring period, the Council achieved success in exceeding
the government targets for determining minor planning applications, however a 53% achievement for determining major planning applications narrowly missed the 60% target.
1.7 Consultations took place in order to progress the Allocations and Designations Plan. Following the ‘call for sites’ consultation in July 2008, a further consultation was carried out in May 2009, providing the

4
opportunity for those who had submitted sites previously to provide further information so that the sites could be assessed accordingly.
1.8 Work progressed on a Draft Allocations and Designations Plan in
preparation for consultation in May 2010 (after the monitoring period). The purposes of the consultation was to provide the opportunity for the public and other interested parties to comment on the content, policies and principles emerging from the Plan.
1.9 On 14th September 2007 the Council received a Direction from the
Secretary of State which stated that the majority of the 2002 Local Plan policies were to be saved. Some policies were not saved as they were not in line with or duplicated current national or regional policy. The full list of saved policies can be viewed at the Council’s web site www.bedford.gov.uk/planning.
1.10 In this AMR, the indicators show that the Council is making good
progress on a number of fronts. In particular: • The Core Strategy and Rural Issues Plan and the saved policies
from the Local Plan puts in place a framework for the sustainable development of the Borough. The housing allocations in the Local Plan provide a land supply which goes far beyond the plan’s original end date of 2006 and progress is being made on the Allocations and Designations Plan so land will be allocated for future development in the borough to 2021.
• The Town Centre Area Action Plan provides a vision for the town centre area including regeneration and development in key areas.
• A range of housing needs is being met through the provision of affordable housing, bringing empty homes back into use and new mobility housing.
• Progress has been made towards addressing the Borough’s transport infrastructure needs.
The Local Development Scheme
1.11 Within the monitoring period:
• Progress has been made on the Issues and Options stage of the Allocations and Designations Plan with a draft plan being produced for public consultation (May 2010 – outside the monitoring period).
• A draft Strategy for Bedford High Street was produced for public consultation in February 2010 to support the bid for lottery funding to regenerate Bedford’s High Street.
• The Land West of Kempston and Great Denham (formerly Biddenham Loop) Design Guides were adopted during the monitoring period.

5
Contextual Indicators 1.12 The contextual indicators provide information that constitutes a profile
of the Borough as it is in the monitoring period, but also provide information that can be monitored each year so a trend can be identified.
1.13 Contextual indicators have been collected to highlight the key
characteristics and issues in the Borough. The contextual indicators are listed in Appendix B. The indicators show the following trends from the monitoring period: • Population has increased by over 2000 according to the mid-year
estimates, continuing the general trend over the last few years. • Average semi-detached house prices have fallen by over £15,500.
This can be attributed to the continuing global economic situation. • The number of businesses in the Borough decreased slightly,
possibly as a result of the continuing economic downturn. • The total number of jobs in the Borough has increased, with all of
this gain being in part time opportunities. • Crime levels have increased slightly from last year but remain
comparable with the national average. • The number of residents with qualifications has generally increased
from last year. • Educational attainment at GCSE level is increasing • Unemployment has decreased since last year, but is still higher
than in 2006/07. • The number of people claiming job seekers allowance for more than
12 months has increased again this year. • The proportion of household waste being recycled is increasing. • Land designated as Local Nature Reserves has increased
significantly this year with the designation of Harrold-Odell Country Park.
It should be noted that figures from the Annual Population Survey are based upon a sample of the population and should be treated as guidelines only. Employment 1.14 Indicators BD1 to BD4 highlight the current employment situation
across the borough. They show the following trends: • The completion of employment floorspace has risen this year from
9,608sqm in 2008/9 to 16,268sqm 2009/10 (see table under indicator BD3, p22), a 68% increase. However in terms of hectares completed this represents only a 0.61ha gain, the lowest since records began in 1996. Loss of employment land to other non-employment uses has stayed roughly the same at 5.74ha (16,268 – 10,525) compared with 5,58ha last reporting year.
• This is the second year that the recording of B1 completions has been split into B1(a), B1(b), and B1(c). The greatest completion of B1 floorspace this reporting year has been in the B1(a) category at

6
5,904sqm. 2,071sqm were completed in the ‘unknown B1’ category and 2,500sqm lost from the B1(b) category. No B1(c) space was completed.
• 85.9% of employment completions in 2009/10 were on previously developed land compared with 30.89% in 2008/9 reporting year. This is a significant increase. Employment completions on PDL were highest for B2 uses at 100%.
• The Council continues to assess the suitability of sites for allocation to meet the quantitative and qualitative employment land requirements to 2021. During May-July 2010 (after the end of this reporting period) a consultation took place to gauge, inter alia, opinion on several potential employment allocations (see emerging Allocations and Designations DPD).
• There has been no completion of A1 floorspace in the town centre this year and a net loss. There has however been a net gain of A2 use. No B1(a) or D2 floorspace was completed in the reporting period in the town centre area.
• Despite a number of A1 completions borough-wide, overall there has been a net loss of A1 floorspace. A2, B1a and D2 uses have all experienced a net gain in the Local Authority Area.
Housing 1.15 Within the monitoring period:
• 466 dwellings were completed in the Borough during the monitoring period.
• The housing supply position remains strong with potential for 11,032 dwellings in the 10 year period from 2011/12 for the whole borough however, delivery will depend upon the recovery rate of the current economic down-turn in the Housing Market over the next few years.
• 3765 dwellings have been completed in the Growth Area since 2001. To enable the MKSM Strategy requirement to be met, 1174 dwellings will need to be completed per annum in the forthcoming 10 year period (this does not include the current year). The trajectory shows the potential for the delivery of 10,661 units in this period.
• 1250 dwellings have been completed in the remainder of the borough (Rural Policy Area). 71 dwellings are projected to be completed in the current year. Once these dwelling are complete the target will be exceeded by 21 units.
• The delivery of housing will depend upon the housing market, particularly with regards to recovering from the current economic down-turn, and the provision of infrastructure by developers.
• The target of 60% of completions on previously developed land has not been achieved. This is due to a number of allocated green field sites commencing. A downturn in the market for flats has led to sites for this type of accommodation not being progressed. Many of these sites are on previously developed land, which has led to a decrease in completions in this category.

7
• During the monitoring year there were 253 new affordable housing completions (H5, p30) which were achieved through the planning process. An extra 31 were acquired through Open Market Homebuy and a further 10 were acquired through change of tenure.
Environmental Quality 1.16 Within the monitoring period:
• No planning permissions have been granted contrary to Environment Agency advice.
• There has been a net loss of 2.76ha of County Wildlife Sites this year.
• Harrold-Odell Country Park was designated a Local Nature Reserve, increasing the number of hectares designated from last year to 114.58ha.
• Due to the amount of renewable energy installations that do not require planning permission and the absence of meaningful data on generation, no significant information can be collected in relation to renewable energy generation.
Local Output Indicators 1.17 Within the monitoring period:
• Local parking standards need to be updated. The Saved Policy BE35 target of 70 car spaces per hectare has been exceeded, with total density of spaces per hectare at 83.33.
• Progress is being made towards the targets in indicators L3 (level of transport infrastructure), L8 (waste recycling), L21 (air quality management), and L26 (mobility housing completions).
• The targets in indicators L2 (car parking standards), L4 (proportion of development in Growth Area and Rural Policy Area), L10 (% of households in urban area within 400m of bus service), L22 (empty homes bought back into use), and L23 (housing density) have been met.
• Provision of housing continues to be focused in the Growth Area. • 86% of households in the urban area are within 400 metres of a
quarter hourly bus service – a 21% increase compared with last year.
• Figures are comparable with last year in the proportion of new dwellings within 30 minutes public transport time of core services. However there has been a 17% decrease in new dwellings within 30 minutes public transport time of a middle school. There has also been a 6% decrease in new dwellings within 30 minutes of a lower school. There has however been a 15% increase in the number of new dwellings within 30 minutes public transport times of a hospital and a 6% increase within 30 minutes of a GP.
• Only 29.4% of Sites of Special Scientific Interest are in favourable condition and 23.9% are recovering, comparable with last year.

8
• The amount of woodland coverage is increasing with 8 hectares planted within the forest of Marston Vale. A further 5 hectares of new native woodland were planted as part of the ongoing creation of Bedford River Valley Park and 2ha were planted as part of a private woodland scheme.
• Footfall in the town centre remained comparable to last year. • A new Buildings at Risk survey was completed in 2009/10 showing
a large increase in listed buildings at risk in the borough. • A new Air Quality Management Area (AQMA) was declared in the
town centre on 6 November 2009, absorbing the two previous AQMAs. Following the opening of the Great Barford Bypass and the closure of Stewartby Brickworks, the 2 related AQMAs were revoked, leaving the one operational AQMA in the town centre, which the updated and screening assessment completed in April 2009 concluded as covering all areas of measured exceedence for NO2.
• The Project Management Protocol is being implemented to aid the delivery of quality developments.
• The Council has granted planning permission for 125 mobility homes this year and 39 others were built.
• The number of empty homes brought back into use exceeded the target of 105 by 42, 105 is the target for 2010/11.
• A greater percentage of employment floorspace completions occurred in the Growth Area however the only land developed was in the Rural Policy Area. With a drop in the land supply, provision for employment land falls evenly across the Growth Area and Rural Policy area. New allocations and designations of further employment land is being considered as part of the Allocations and Designations Plan process.
• The average density target for dwellings per hectare on developments over 10 dwellings has been exceeded.
• New housing sites have achieved 29.8% affordable housing provision.
• No barriers to planning services have been identified in relation to any disability, ethnicity or gender issues.
• The proportion of household waste being recycled has increased to 38.3% and 37% of municipal waste in the Borough was recycled.
• Total number of crimes recorded in the monitoring period is 11,956, an increase of 345 on last year.
• The adopted Supplementary Planning Documents are successfully fulfilling their objectives.
1.18 Overall, the contextual, core and local output indicators show the
following should be considered for future monitoring: • Dwelling completions need to rise to an average 1174 per year in
the Growth Area over the next 10 years (the average 2001-2009/10 has been 418 per year)
9
• Local parking standards need to be updated. The Saved Policy BE35 target of 70 car spaces per hectare has been exceeded, with total density of spaces per hectare at 83.33
• Consideration is being given to the allocation of additional strategic employment sites in the Growth Area through the Allocations and Designations Plan process
• Local open space standards are being addressed as part of the Allocations and Designations Plan process, based on the evidence in the Bedford Open Space Study.
1.19 Some of the information for the National Indicators that relate to
Planning is demonstrated through a number of Core and Local Output Indicators. The relevant National Indicator number can be found in brackets next to the Core Output Indicator that demonstrates the information needed. Due to the fact that some of the National Indicators are not reported through Core Output Indicators, the information can be found in the list below, along with where information for the rest of the National Indicators relating to Planning can be found: • NI 154 – Core Indicator H2(b) • NI 155 – Core Indicator H5 • NI 156 is not reported through any core output indicator in the AMR.
The average figure for the number of households living in Temporary Accommodation over the monitoring period was 35, with 38 people living in temporary accommodation as of March 2010. A target of 45 is in place for the 2010-11 period.
• NI 159 – Core Indicator H2(c) • NI 170 – 106Ha (3.23%) previously developed land and buildings
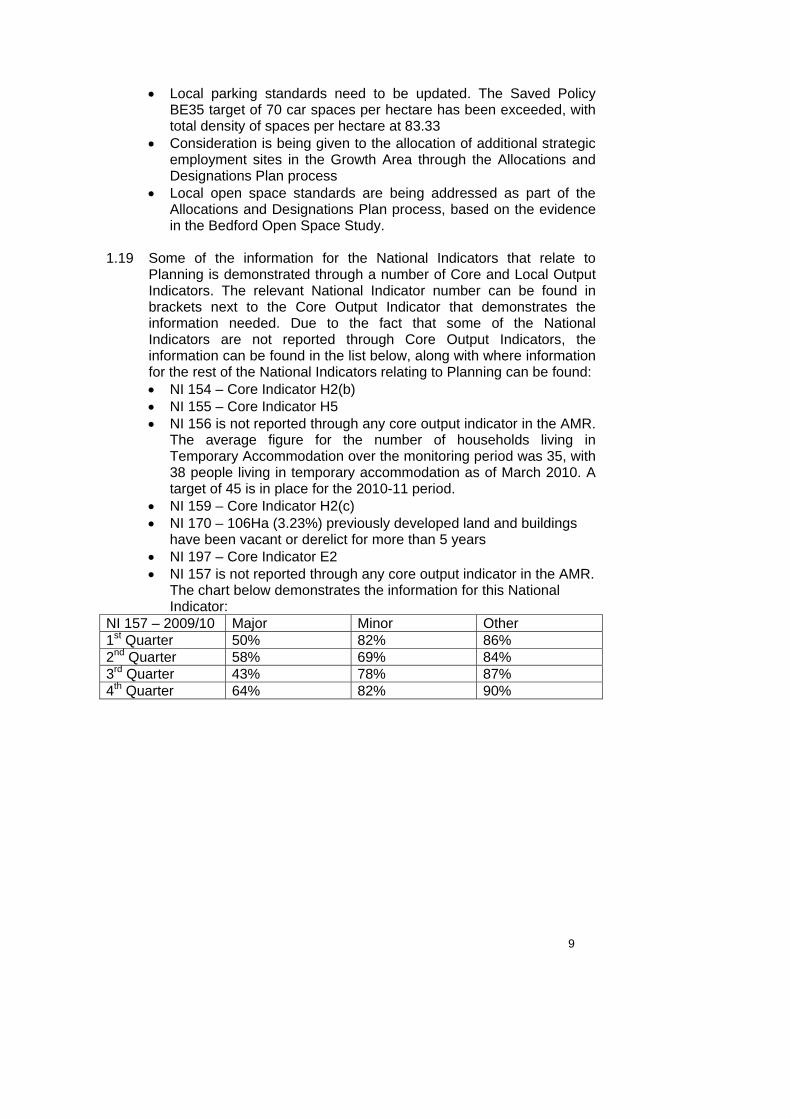
have been vacant or derelict for more than 5 years • NI 197 – Core Indicator E2 • NI 157 is not reported through any core output indicator in the AMR.
The chart below demonstrates the information for this National Indicator:
NI 157 – 2009/10 Major Minor Other 1st Quarter 50% 82% 86% 2nd Quarter 58% 69% 84% 3rd Quarter 43% 78% 87% 4th Quarter 64% 82% 90%

10
2. Introduction 2.1 The purpose of this report is to set out the monitoring framework for the
Bedford Development Framework and the saved policies of the Local Plan 2002.
2.2 Annual Monitoring Reports will be published each December, to cover
the previous financial year (April to March). Each AMR will cover the following topics:
• The Local Development Scheme (LDS) – An assessment of whether the Council has met the timetable for producing planning documents.
• Contextual Indicators – A set of indicators providing information about the Borough as it is today.
• Core Output Indicators – A set of indicators covering business development and town centres, housing, biodiversity and renewable energy. The indicators are the same for each local authority and will allow for the performance of local authorities to be compared. For the 2007/08 monitoring period, Core Output Indicators were revised, replacing previous Indicators with a new set. This will be the third year this new set are used.
• Local Output Indicators – A set of indicators chosen by the Borough Council to measure whether the objectives and targets in the Local Plan and Bedford Development Framework are being achieved.
• Significant Effects Indicators – A set of indicators chosen to assess whether the predicted significant effect of local policy upon the economy, society and the environment, is occurring as forecast.
• Future Monitoring – How the AMR will be updated and improved in the future.
2.3 During the monitoring period, the East of England Plan (2008) was
in force. The regional targets referred to in this Annual Monitoring Report are contained with that Plan.
2.4 The Bedford Development Framework is a set of documents, each with
their own objectives and policies. During the monitoring period (1st April 2009 to 31st March 2010), consultation took place on a draft strategy for Bedford High Street. Following this the document was adopted as a Supplementary Planning Document (SPD) in July 2010 (outside the monitoring period). Work progressed on the Allocations and Designations Plan, with assessment taking place on the sites submitted through the ‘call for sites’ consultation, which took place in the previous monitoring period. A draft Allocations and Designations Plan was produced and went out to consultation in May 2010 (outside the monitoring period) in accordance with the Local Development Scheme timetable.

11
2.5 Whilst the Bedford Development Framework is being produced, saved policies in the adopted Local Plan are still used to determine planning applications. Therefore, this monitoring report monitors both the adopted Local Plan as well as the adopted documents of the Bedford Development Framework.
2.6 This report is structured into the following sections.
Part 1 This section is concerned with progress targets, i.e. progress against the timetable to produce the documents for the Bedford Development Framework. • Local Development Scheme - Summary of progress in producing
the documents for the Bedford Development Framework and an introduction to the revised Local Development Scheme for the period 2007-13
Part 2 This section is concerned with policy targets and includes four types of indicators; contextual, core output, local output and significant effects. Using different types of indicators enables the report to monitor short, medium and long-term trends as well as both national trends and targets and local circumstances. Thus, the report will provide a comprehensive basis upon which to monitor the implementation of policy. • Contextual indicators – baseline information, which describes the
social, environmental and economic background of the Borough against which policy operates. A full list of contextual indicators can be found at Appendix B.
• Core Output Indicators – information collected by each local authority in England to assess the performance of policies. These were revised in 2007/08, with this being the second year of their use
• Local Output Indicators – information relating to progress against the aims of the Bedford Development Framework and the Local Plan, to assess the performance of policies.
• Significant Effects Indicators – these indicators are used to assess the significant social, environmental and economic effects of adopted policies. Includes a discussion of how these indicators will be developed and included in future reports.
Part 3 • Future monitoring – a discussion of how subsequent Annual
Monitoring Reports will be structured and how the monitoring framework will be developed
2.7 Many policies and targets that influence the borough cover two distinct
areas, namely the Growth Area (Bedford, Kempston and the Northern Marston Vale) and the Rural Policy Area (all other areas).

12
2.8 For this reason, some indicators provide information for the Borough as a whole, whilst some indicators provide information for the Growth Area and the Rural Policy Area individually.

13
PART 1 3. Local Development Scheme 3.1 The purpose of this section is to set out the progress made on the
documents the Council is producing for the Bedford Development Framework. Each document has a timetable, which is set out in the Local Development Scheme (LDS). The first Local Development Scheme came into effect in April 2005 and covered the 3-year period January 2005 to December 2007. The LDS has been updated twice since then, the first update being in September 2007 and the latest occurring in the monitoring period, December 2009. The LDS sets out the timetable for the production of DPDs to 2013.
3.2 The current LDS included an update on the Council’s adopted Local
Development Documents, those that are currently being worked on and proposed future documents (see table below). It also included a revised delivery timetable.
The Bedford Development Framework 3.3 The following table explains the relationship between the documents in
the Bedford Development Framework (BDF) and their relationship to the adopted Local Plan.
Document Proposed
date for adoption
Relationship to BDF and Local Plan
Statement of Community Involvement
Adopted May 2006
All BDF documents produced will have to accord with the consultation arrangements and procedures it sets out.
Core Strategy and Rural Issues Plan DPD
Adopted April 2008
This document sets out the strategic policy for the Borough and each subsequent document in the BDF will accord with its policies. The document replaces certain policies in the Local Plan (see para. 3.13).
Town Centre Area Action Plan DPD
Adopted October 2008
This document conforms to the Core Strategy and Rural Issues Plan DPD and provides detailed policy guidance for the regeneration of the distinctive county town of Bedford. It replaces certain policies in the Local Plan (see para 3.14).
Bedfordshire Community Safety Design Guide SPD
Adopted November 2005
The document conforms to and supplements Policy BE45 of the adopted Local Plan.

14
Document Proposed date for adoption
Relationship to BDF and Local Plan
Shopfronts and Adverts in Conservation Areas Design Guide SPD
Adopted November 2005
The document conforms to and supplements policies BE16 and TC4 of the adopted Local Plan.
Land North of Bromham Road Biddenham Design guide SPD
Adopted November 2005
The document conforms to and supplements Policy H8 of the adopted Local Plan.
Allocations and Designations DPD
July 2012 The preparation of this DPD began in 2007. It will identify development sites to meet the growth targets in the Core Strategy and Rural Issues Plan and also make specific designations. It will replace many saved policies of the Local Plan. Details are included in the LDS.
Development Management Policies DPD
Sept 2014 The preparation of this DPD will begin in 2012 and will replace many saved development management policies of the Local Plan. Details are included in the LDS.
Climate Change SPD Adopted December 2008
This document supplements adopted policy CP26 of the Core Strategy and Rural Issues Plan.
Great Denham (formerly Biddenham Loop) Design Guide and Code SPD
Adopted Jan 2010
The document conforms to and supplements policy H6 of the adopted Local Plan
West of Kempston Design Guide and Code SPD
Adopted Jan 2010
The document conforms to and supplements policy H7 of the adopted Local Plan
A Strategy for Bedford High Street
July 2010 (outside the monitoring period)
The document conforms to and supplements policy TC8 of the adopted Town Centre Area Action Plan
Progress on the Bedford Development Framework 3.4 The production of each Development Plan Document (DPD) in the
Local Development Scheme (LDS) has a timetable, which includes key milestones, i.e. key stages in the production of the document. The key milestones are monitored in this report.
3.5 The Gantt chart at Appendix A show the key milestones for each
Development Plan Document (DPD), as set out in the Local Development Scheme (LDS), and the actual progress that has been made towards achieving those milestones within the monitoring period.

15
Development Plan Documents (DPD) 3.6 Both the Core Strategy and Rural Issues Plan and the Bedford Town
Centre Area Action Plan were adopted in the previous monitoring period, superseding many policies in the Local Plan.
3.7 A summary of the key milestones reached for the current Allocations
and Designations DPD is given below. Allocations and designations Plan DPD Milestone LDS Target Target achieved Issues and Options January 2008 Yes Site Assessment Methodology
N/A May 2008
‘Call for sites’ July 2008 Yes SPA methodology N/A July 2008
3.8 The first consultation on the Issues and Options stage of the
Allocations and Designations Plan took place in April 2008. A ‘call for sites’ was issued in July 2008, inviting submission of sites for consideration as development allocations. Ongoing assessment of these sites is taking place again the published site assessment methodology. A draft Plan was produced in preparation for public consultation in May 2010 (outside the monitoring period). The results of this consultation will be assessed during 2010 to inform the production of the pre-submission draft Spring 2011.
Supplementary Planning Documents 3.9 There are currently three SPDs in the Local Development Scheme.
The Great Denham (formerly Biddenham Loop) and West of Kempston Design Guide SPDs were adopted in January 2010. Consultation took place on a draft Strategy for Bedford High Street in February 2010.
3.10 Under a change to the Town and Country Planning Regulations, there
is no longer a requirement to include Supplementary Documents in the Local Development Scheme.
The ‘Saved’ Local Plan Policies 3.11 When the Planning and Compulsory Purchase Act came into force on
27th September 2004, all policies in the adopted Bedford Borough Local Plan 2002 were ‘saved’ for three years automatically. This was to ensure that whilst new policies were evolving as part of the Bedford Development Framework, there remained local policies in force to be used to determine planning applications.

16
3.12 The ‘saved’ policies were saved initially for three years i.e. until 27th September 2007. In March 2007 the Council requested that the Government continued to ‘save’ many of its Local Plan policies beyond this date. It is the intention that these will eventually be replaced by policies in the new Development Plan Documents as these are produced. On 14th September 2007 the Council received a Direction from the Secretary of State which stated that the majority of the Local Plan policies were to be saved. Some policies were not saved as they were not in line with or duplicated current national or regional policy. Others were deleted because they related to specific sites that had been developed. The deleted policies were:
• S8 Supplementary Planning Guidance • NE1 Sites of Special Scientific Interest • NE2 Species protected by law • NE5 Tree Preservation Orders • NE15 River Protection Area • NE25 Pollution • NE26 Agricultural land quality • NE27 Wildlife habitats v agricultural land • NE28 Land Contamination • NE29 Uncertain consequences of proposals • BE10 Review of Conservation Areas • BE12 Plans, drawings and cross sections • BE14 Premature demolition • BE17 Retaining listed buildings • BE33 Gateways • H4 Land at Ford End Road • H15 Land off Northampton Road, Bromham • H16 Bromham Hospital • H17 Clapham Folly • H19 Land at Yelnow Lane, Sharnbrook • H20 Land south-east of Sharnbrook Upper School • H21 Land between A6 and Luton Road, Wilstead • H22 Land off the Meadway, Harrold • H35 Gypsy Sites • H36 Winter quarters for travelling show people • E3 Land west of Elstow Bypass • E7 Land at Marsh Leys Farm • SH1 Regional shopping centres • TC2 Grant aid
3.13 When the Core Strategy and Rural Issues Plan was adopted on 16th
April 2008, some of the remaining policies of the Local Plan were superseded. The deleted Local Plan policies were: • S1 Urban Priority • S4 South West Bedford Strategic Corridor • S5 Marston Vale

17
• S6 Settlement Policy Areas • S7 Rural Settlement Hierarchy • S9 Facilities in tandem with development • NE14 Area of Great Landscape Value • BE6 Renewable Energy • H1 Provision of housing land • H30 Local needs housing in rural areas • H31 The provision of affordable housing • H32 The mix and range of housing type and size • E1 Provision of employment land • E12 Loss of employment land • SH2 Shopping development in the town centre • T1 Strategic road network
3.14 When the Town Centre Area Action Plan was adopted on the 8th
October 2008, more policies of the Local Plan were superseded. The deleted policies were: • SH3 Primary shopping frontage • SH4 Pilgrim Square • TC1 Protecting architectural and historic features • TC3 Environmental improvements • TC4 Shopfronts and advertisements • TC5 Riverside enhancements • TC6 Secondary shopping frontages • TC7 Living over the shop • TC9 Office use in Primary Shopping Area • TC10 Town centre amenity The partially deleted policies were: • S2 Opportunity sites • BE1 Mixed uses • BE2 Mixed uses in opportunity sites • T2 Local transportation network improvements • T13 Pedestrian Routes
The full list of saved policies can be viewed at the Council’s web site http://www.bedford.gov.uk/environment_and_planning/planning_town_and_country/planning_policy/local_plan.aspx
Local Development Orders 3.15 A Local Development Order may be made by a planning authority in
order to extend permitted rights for certain forms of development, with regard to a relevant local development document. The Borough Council has not found the need to make any Local Development Orders in the monitoring period.

18
ONS mid year population estimates and Bedfordshire population model 2010
PART 2
4. Contextual Indicators 4.1 Contextual indicators provide information that constitutes a profile of
the Borough as it is in the monitoring period. The purpose of contextual indicators is to enhance the understanding of the Borough to inform the development of spatial policies.
4.2 All the contextual indicators are listed in Appendix B. Contextual
indicators have been chosen to highlight the key characteristics and issues in the Borough. The following paragraphs provide a profile of the Borough, taken from the information collected for the contextual indicators.
Population 4.3 According to the 2009 mid-year
population estimate, the Borough has a total population of 158,000 people, a rise of over 10,000 since the 2001 census. Of this population, the largest single group is within the age band 40-49 as opposed to 30-39 in 2001. Approximately 7% of the population is aged 75 or over. The population of the Borough is increasing, with more births than deaths in recent years. The Borough has a mixed ethnic profile, being nearly 87% white and nearly 8% Asian or Asian British.
Housing and the built environment 4.4 According to the 2010 Bedfordshire population model projection, the
Borough has a total of nearly 65,000 households with an average household size of 2.39 people. Owner occupation and private renting accounted for nearly 83% of properties in the monitoring period, consistent with last year. The majority of dwellings in the Borough are semi-detached. The average price of a semi-detached dwelling (according to the Land Registry website) at the end of the monitoring period was £156,281 (a fall of £15,680 compared with the same period last year).
19
Economy 4.5 There are a total of 97,900 people of working age in the Borough.
Almost 83,000 people in the Borough are economically active (an increase of 2,900 from 2008/09). The Borough employs nearly 71,000 people, over 68% of which are full-time jobs. In 2009, an average employee working in the Borough earned approximately £23,427 per year. ‘Elementary occupations’ (see glossary) is the single largest category of employment overtaking ‘managerial and senior official occupations’ from last year. The number of VAT registered businesses in the borough is just under 5,500, a decrease of 140 on last year. The majority of these businesses employ less than 4 people.
Social/Health 4.6 No additional data on Super Output Areas is available since the last
AMR. Relative deprivation levels in the Borough as a whole were largely constant over the period 2004-2007 when compared to national levels. Super Output Areas in Castle, Cauldwell and Harpur wards are among the 10% most deprived areas in England, and Super Output Areas in Castle, Cauldwell, Goldington, Kingsbrook and Kempston North wards are among the 20% most deprived nationally. (Source: Bedford Borough Council)
4.7 As of April 2010, over 4,150 are claiming job seekers allowance, an
increase of 78 from April 2009, although the majority of these have been claiming for less than six months. The number of people claiming job seekers allowance for between 6 and 12 months and more than 12 months has also increased. (Source: ONS)
4.8 Crime levels in the Borough are at 46 offences per 1000 population
(comparable with 45 in the previous year and the national average of 45 this year). (Source: Bedford Borough Council)
4.9 Average life expectancy in the Borough is 78.58 years for men and
82.13 years for women. Both are higher than the national average. (Source: ONS)
Education 4.10 Over 30% of the Borough’s population are qualified to NVQ level 4 or
above – an increase on last year - and less than 12% have no qualifications. The schools in the Borough show varied levels of attainment by students in terms of GCSE grades. Attainment levels vary between schools from 100% of pupils who gain 5 or more grades at A* to C to a low of 55%. This is greater than the number of pupils who gain 5 or more graded at A* to C including English and Maths, which varies between 97% and 20%.

20
Transport and Spatial Connectivity 4.11 The majority of people in the Borough travel to work by car. A high
percentage of people travel to work by foot (nearly 10%) and almost 5% of people cycle. The majority of residents (64%) either work from home or travel less than 5 kilometres to work. The majority of residents (71%) both live and work in the Borough. There has been no new information since the 2001 census.
Environment 4.12 The Borough contains over 166 hectares of land designated as Sites of
Special Scientific Interest (SSSI). The percentage of land in favourable condition remains consistent with last year. Of the land in unfavourable condition, almost 40 hectares is recovering, consistent with the last reporting year. In the monitoring period the Borough recycled, composted and reused over 38% of household waste. This is a percentage increase of over 6% on last year.

21
5. Core Output Indicators 5.1 The purpose of core output indicators is to assess the progress of
current policy in the achievement of targets. Core output indicators are the same in every local authority in England. Thus, the performance of the policies can be monitored and compared with other local authorities. The core output indicators shown below have been taken from the Regional Spatial Strategy and Local Development Framework Core Output Indicators Update 2/2008, published in July 2008. This update states:
This revised set replaces the Core Output Indicators for Regional Planning (March 2005), Local Development Framework Core Output Indicators Update 1/2005 (October 2005) and Table 4.4 and Annex B of the Local Development Framework Monitoring: A Good Practice Guide (March 2005)
5.2 Some indicators have targets. All the targets that are relevant to
Bedford Borough are listed in Appendix C, and are reproduced against the relevant indicators.
Business Development and Town Centres Indicator BD1: Total amount of additional employment floorspace – by type Regional Target: To ensure that sufficient sites are provided to cater for all relevant business sectors and clusters in order to meet the needs of the local economy as identified in employment land reviews (Policy E1 of the East of England Plan states an indicative target for net growth in jobs of 27,000 in Bedford/Mid Beds) Amount and type of completed employment floorspace (gross and net) (m2) by type B1 (a), (b), (c), B2 and B8 Data for this indicator is categorised by employment type. Additional categories are also included in the table, to cover those circumstances where planning permissions do not fall into the categories specified in the target. Indicator BD2: Total amount of employment floorspace on previously developed land – by type Regional Target: To achieve the overall regional target of 60% housing and employment development on previously developed land Amount and type of completed employment floorspace (gross) coming forward on PDL (m2 and %) by type B1 (a), (b), (c), B2 and B8 Data for this indicator is categorised by employment type. Additional categories are also included in the table, to cover those circumstances where planning permissions do not fall into the categories specified in the target.

22
Indicator BD3: Employment land available – by type Target: n/a Amount and type of employment land available (allocated sites, sites with planning permission that are not allocated) (hectares) by type B1 (a), (b), (c), B2 and B8 Data for this indicator is categorised by employment type. Additional categories are also included in the table, to cover those circumstances where planning permissions do not fall into the categories specified in the target.
B1a B1b B1c B1
unknown Total
B1 B2 B1/2 B1/8 B8 B2/8 B1/2/8 Total Emp completions BD1
Gross sq m 5904 0 0 2071 7975 2006 0 462 1750 0 4075 16268
by floorspace sq m
Net sq m 5904 -2500 0 2071 5475 1088 0 462 -575 0 4075 10525
Emp completions BD2
Gross sq m 5904 0 0 1529 7433 2006 0 462 0 0 4075 13976
on PDL sq m %PDL 100% 73.83% 93.20% 100% 100% 100% 85.91% Emp land supply Ha BD3
Has (net) 0.15 5.80 0 14.00 19.95 0.99 17.80 1.22 1.93 0.17 19.77 61.83
5.3 For a definition of ‘town centre uses’, please refer to the glossary at the
end of the document. Indicator BD4: Total amount of floorspace for ‘town centre uses’ Regional Target: To ensure that sufficient sites are provided to cater for all relevant business sectors and clusters in order to meet the needs of the local economy as identified in employment land reviews (Policy E1 of the East of England Plan states an indicative target for net growth in jobs of 27,000 in Bedford/Mid Beds) Amount of completed floorspace (gross and net) for town centre uses within (i) the Town Centre and (ii) the Local Authority Area A1, A2, Bl (a) and D2. For A1, the sqm of net tradable floorspace of the total gross internal floorspace should be provided. BD4 A1 A2 B1a D2 Total
Gross (sqm)
0 244 0 0 244 (i) Town Centre
Net (sqm)
-615 133 0 0 -482
Gross (sqm)
128 424 5904 1010 7466 (ii) Local Authority Area Net
(sqm) -3056 313 5904 1010 4171

23
Housing Indicator H1: Plan period and housing targets Start of
plan period
End of plan period
Total housing required Source of plan target
H1 (a) April 2001 March 2021
19,500 in the MKSM Strategy area (Bedford, Kempston and the Northern Marston Vale) which includes part of Mid Bedfordshire local authority. MKSM SRS Policy BLP1 states 16,270 in Bedford Borough and 3,230 in Mid Bedfordshire.
East of England Plan (May 2008) MKSM Sub-Regional Strategy (March 2005)
H1 (b) April 2001 March 2021
1,300 in the rest of Bedford Borough – known as the Rural Policy Area in the adopted Core Strategy and Rural Issues Plan.
East of England Plan (May 2008)
Indicator H2: (a) Net additional dwellings – in previous years (b) Net additional dwellings – for the reporting year (NI 154) (c) Net addition dwellings – in future years (NI 159) (d) Managed delivery target Regional Target: Milton Keynes South Midlands Sub-Regional Strategy (MKSM Strategy) requirement of 16,270 dwellings in the Growth Area of the Borough 2001-2021. East of England Plan requirement of 1,300 dwellings in the remainder of the Borough outside the Growth Area. Milton Keynes South Midlands Sub- Regional Strategy Requirement. The Council is currently preparing an Allocations and Designations DPD and in 2009 undertook research into the deliverability of Growth Area sites in the current housing market. Developers and landowners were asked a range of questions about the delivery of their sites in the current housing market. In addition interviews were held with representatives of the key strategic sites. This research was published as a background paper to the Allocations and Designations Plan ‘flexibility allowance for housing provision in the growth area’. A further survey has been undertaken this year to update the developers assessments of the performance of their individual sites. Whilst the delivery estimates contained in the responses were slightly less ambitious than the previous year the assessments remain generally very positive for the next five years. The anticipated delivery over the remainder of the plan period as a whole however, is lower than the previous year and shows a deficit of 1083
24
dwellings in relation to the East of England Plan target. This reflects the impact of the economic downturn on a number of schemes particularly those proposed for the town centre. A summary of the responses submitted by developers is shown in graph A (i). Detail regarding the sites forecast to be completed in the Growth Area in the period 1st April 2010 to 31st March 2015 is set out in appendix E. Graph A (i) shows the aggregated totals of developers’ aspirations for their individual sites. As was the case previously, in focussing purely on their own sites developers did not take in to account the impact of competing sites coming forward at the same time. In reality completion rates will almost certainly not reach the levels shown in the early years of the remaining plan period due to market saturation. With this in mind estimates for future housing delivery need to be tempered in order to take account of market capacity factors which will effectively cap completion rates and produce a smoother curve to the trajectory. Although there are a range of factors which will affect the rate of housing delivery; what is clear is that the growth area has sufficient housing supply to deliver a 5 year supply of housing should market conditions permit. Graph A (ii) shows the same overall level of completions in the period to 2021 but is ‘tempered’ so that completions in the period 2010/11 -2015/16 are shown at 80% of the values submitted by developers with the effect that completion rates over the remainder of the plan period rise to compensate. This alternative scenario shows that a reduction of as much as 20% from the developer’s estimate would also deliver a 5 year supply. 3765 dwellings have been completed in the period 2001-2009/10. To enable the Milton Keynes South Midlands strategy requirement to be met dwelling completions will need to increase to 1174 dwellings per annum in the Growth Area for the 10 years following 2010/11. Achieving the 1174 completions per annum shown in table A(ii) will depend on the housing market and the ability of developers to deliver that development. East of England Plan Requirement The dwelling requirement for the period 2001-2021 for the rest of the Borough (the area not in the Growth Area, known as the Rural Policy Area) is contained within the East of England Plan. The East of England Plan was finalised in May 2008 with a requirement for 1,300 dwellings to be completed. In the first 9 years of the plan period 1250 dwellings have been completed. A further 71 dwellings are forecast to be completed in the current year taking the number of completions to 1321, 21 in excess of the target. (See graph B)

Indicator H2 - Growth Area as illustrated in Graph A(ii)
2001 02/03 03/04 04/05 05/06 06/07 07/08
08/09
09/10 Rep
10/11 Cur
11/12 1
12/13 2
13/14 3
14/15 4
15/16 5
16/17 17/18 18/19 19/20 20/21
H2a Growth Area
557 327 556 312 285 396 552 366
H2b Growth Area
414
H2c a) net additions Growth Area
762 1363 1245 1245 1115 872 964 964 964 964 964
b) hectares Growth Area
26.41 26.23 26.94 23.45 18.56
c) target Growth Area
1174 1174 1174 1174 1174
H2d Managed Delivery Target
1137 1174 1153 1142 1127 1129 1181 1235 1325 1506 2047 -

26
Graph A(i)

27
Graph A(ii)

28
Indicator H2 - Rural Policy Area
2001 02/03 03/04 04/05 05/06 06/07 07/08
08/09
09/1Rep
10/11 Cur
11/12 1
12/13 2
13/14 3
14/15 4
15/16 5
16/17 17/18 18/19 19/20 20/21
H2a Rural Policy Area
174 99 240 324 181 60 79 41
H2b Rural Policy Area
52
H2c a) net additions Rural Policy Area
71 65 40 31 25 35 35 35 35 35 35
b) hectares Rural Policy Area
3.8 2.0 1.15 1.0 1.0
c) target Rural Policy Area
0 0 0 0 0
H2d Managed Delivery Target
5 0 0 0 0 0 0 0 0 0 0

29
Graph B
30
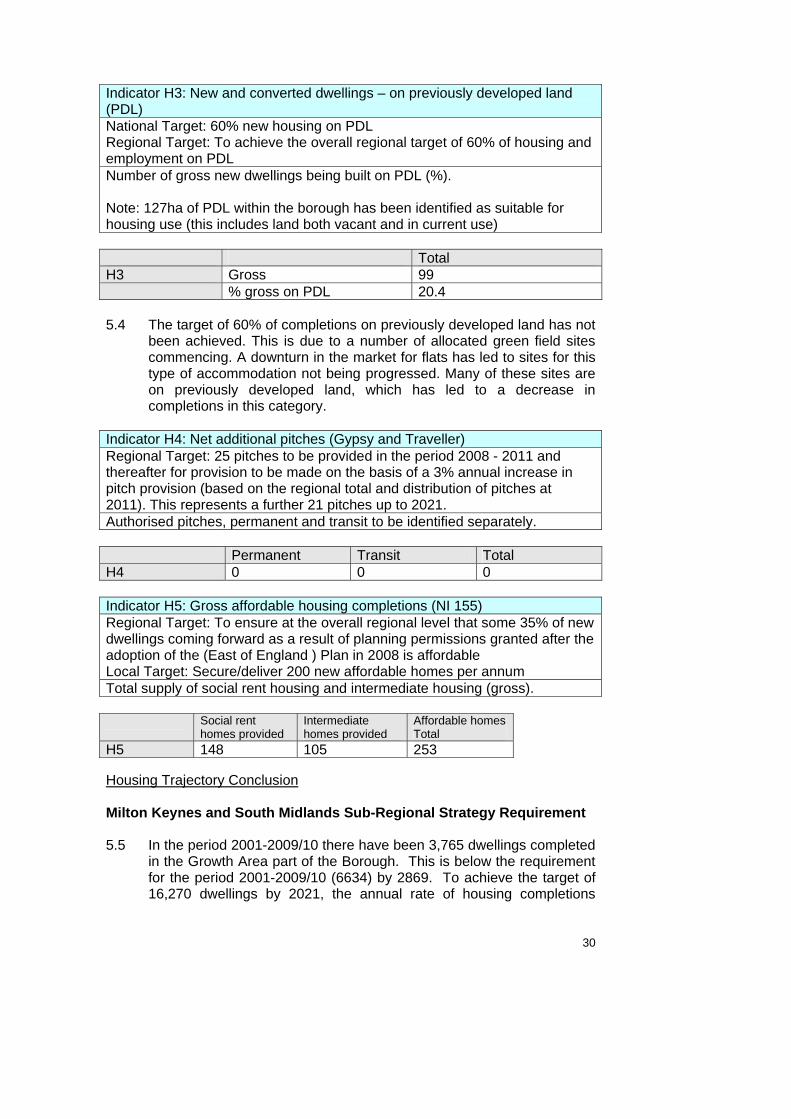
Indicator H3: New and converted dwellings – on previously developed land (PDL) National Target: 60% new housing on PDL Regional Target: To achieve the overall regional target of 60% of housing and employment on PDL Number of gross new dwellings being built on PDL (%). Note: 127ha of PDL within the borough has been identified as suitable for housing use (this includes land both vacant and in current use) Total H3 Gross 99 % gross on PDL 20.4 5.4 The target of 60% of completions on previously developed land has not
been achieved. This is due to a number of allocated green field sites commencing. A downturn in the market for flats has led to sites for this type of accommodation not being progressed. Many of these sites are on previously developed land, which has led to a decrease in completions in this category.
Indicator H4: Net additional pitches (Gypsy and Traveller) Regional Target: 25 pitches to be provided in the period 2008 - 2011 and thereafter for provision to be made on the basis of a 3% annual increase in pitch provision (based on the regional total and distribution of pitches at 2011). This represents a further 21 pitches up to 2021. Authorised pitches, permanent and transit to be identified separately. Permanent Transit Total H4 0 0 0 Indicator H5: Gross affordable housing completions (NI 155) Regional Target: To ensure at the overall regional level that some 35% of new dwellings coming forward as a result of planning permissions granted after the adoption of the (East of England ) Plan in 2008 is affordable Local Target: Secure/deliver 200 new affordable homes per annum Total supply of social rent housing and intermediate housing (gross). Social rent
homes provided Intermediate homes provided
Affordable homes Total
H5 148 105 253 Housing Trajectory Conclusion Milton Keynes and South Midlands Sub-Regional Strategy Requirement 5.5 In the period 2001-2009/10 there have been 3,765 dwellings completed
in the Growth Area part of the Borough. This is below the requirement for the period 2001-2009/10 (6634) by 2869. To achieve the target of 16,270 dwellings by 2021, the annual rate of housing completions

31
would need to increase to 1174 dwellings per annum over the next 10 years (assuming 762 completions in the current year). Achieving this rate of development will depend on the rate of recovery in housing market conditions. The Council has granted planning permissions providing a substantial supply of as yet unimplemented housing schemes. Any constraints on delivery will be market rather than supply driven as although the number of dwellings forecast to be delivered does not meet the target at 2021 the research undertaken in 2009 concluded that increasing the supply of housing sites is likely to have little impact on the number of houses which can be delivered by 2021.
5.6 Table A(ii) can be used to assess potential supply over the next five
years. Subject to market conditions there is potential for the delivery of 5840 dwellings which equates to 5.0 years of supply.
5.7 The following table is provided for information, and shows the progress
on each of the Local Plan allocated sites up to 31/03/2010 (including updates in the final column where progress has been made between this date and the publication of the AMR.)
Site (Policy) Site
capacity as stated in Local Plan
Completions at 31/3/10
Outstanding at 31/03/2010
Current progress on development (as at 31/03/2010) (Progress post March 2010 is given in italics)
Britannia Iron Works (H2)
180 311 411 Phase A 107 dwellings completed 2004/05. Phase C 260 dwellings, 24 completed 2006/7,106 completed 2007/8, 74 completed 2008/09. 56 under construction. Phase E resolution to grant permission for 255 dwellings (subject to S106) granted in November 2007. Phase F 100 dwellings. No planning permission
Austin Canons Kempston (H3)
25 24 24 24 dwellings completed 2003/04. Permission granted for a further 24 dwellings.
College Street (H5)
20 56 0 56 dwellings. 20 completed in 2003/04, 36 completed 2007/8.
Biddenham Loop (H6)
1450 341 1408 249 dwellings completed in 2003. Outline planning permission for 1500 dwellings, granted 2006/07. Reserved matters for 377 dwellings approved total. Site under construction. Reserved matters for 67 dwellings approved. Reserved matters application

32
Site (Policy) Site capacity as stated in Local Plan
Completions at 31/3/10
Outstanding at 31/03/2010
Current progress on development (as at 31/03/2010) (Progress post March 2010 is given in italics)
for 72 dwellings pending consideration.
Land west of Kempston (H7)
730 1250 Outline planning permission granted in 2006/07. Reserved matters for 209 dwellings approved. Site under construction. Reserved matter for 194 dwellings approved
Land north of Bromham Road (H8)
900 1200 Resolution to grant outline planning permission for 1200 dwellings subject to S106.
Shortstown (east and west of A600) (H9)
170 + 260
251 1525 251 completions. Outline permission granted on appeal for 970 dwellings. Reserved matters for 309 dwellings approved in 2007/8. Outline permission for 555 dwellings granted in February 2010. Site under construction. Reserved matters submitted for 478 dwellings under consideration
North of Brickhill (H10A)
400 322 178 500 dwellings (revised capacity). Reserved matters approved for 499 dwellings of which 88 were completed in 2006/07, 108 in 2007/8 and 45 in 2008/09. 81 completed in 2009/10
North of Norse Road (H10B)
200 231 18 250 dwellings (revised capacity). 53 completed 2006/7, 140 completed in 2007/8 and 32 completed in 2008/09. 6 completed in 2009/10.
Cannons Close Wootton (H23)
9 9 0 Permission for 9 dwellings. 9 dwellings completed 2007/8.
Land south of Fields Road Wootton (H11)
340 500 Resolution to grant planning permission for 500 dwellings subject to S106. Highways Agency scheme for A421 affects proposals, (target date for completion 2010/11). Design Guide to be prepared.
Land north of Fields Road Wootton (H12)
450 584 Resolution to grant planning permission for 550 dwellings subject to S106. Design Guide to be prepared. Highways Agency scheme for A421 affects proposals,

33
Site (Policy) Site capacity as stated in Local Plan
Completions at 31/3/10
Outstanding at 31/03/2010
Current progress on development (as at 31/03/2010) (Progress post March 2010 is given in italics)
(target date for completion 2010/11). Outline planning permission for 34 dwellings was granted in March 2010. Site under construction
Stewartby (H13) 330 610 Outline planning permission for 610 dwellings was granted in August 2009 Design Guide in preparation. Highways Agency scheme for A421 affects proposals
Wixams (H14) 2250 198 2052 Outline planning permission for 2250 dwellings. Reserved matters for 783 dwellings. Site under construction. 8 dwellings completed in 2008/09. 190 dwellings completed in 2009/10. Total of 250 completed at end of Sept 2010
1743 9760 TOTALS: 7,714
11503
East of England Plan Requirement Rural Policy Area 5.8 In the period 2001-2009/10 the Borough has completed 1,250
dwellings in the Rural Policy Area. This is above the requirement for the 2001-2009/10 period (585) by 665. If the 71 dwellings forecast for 20010/11 are completed the recommended East of England Plan target of 1,300 dwellings by 2021 will have been exceeded by 21 dwellings
5.9 Appendix E provides a summary of potential supply over the next five
years. Subject to market conditions there is potential for the delivery of 196 dwellings
5.10 The table below demonstrates that the majority of Local Plan allocated
sites in the Rural Policy Area have been completed in the first nine years of the East of England Plan period. As such, during the rest of the plan period, completions are more likely to be on windfall sites rather than allocated sites. The Council may however, make allocations to meet any proven local needs.
Site (Policy) Site
capacity as stated in Local Plan
Completions at 31/03/10
Outstanding at 31/03/10
Current progress on development (as at 31/03/2010) (Progress post March 2010 is given in italics)

34
Site (Policy) Site capacity as stated in Local Plan
Completions at 31/03/10
Outstanding at 31/03/10
Current progress on development (as at 31/03/2010) (Progress post March 2010 is given in italics)
Land at Northampton Road Bromham (H15)
45 68
68 dwellings. Site completed 2005/06.
Bromham Hospital (H16)
65 65 65 dwellings. Site completed 2001.
Clapham Folly (H17)
170 262 5 262 dwellings. Site completed 2005/06. Planning permission for a further 5 dwellings granted in 2006/7.
New Road Great Barford (H18)
25 31 27 Planning permission 58 dwellings. 31 dwellings completed 2009/10
Yelnow Lane Sharnbrook (H19)
25 47 47 dwellings. Site completed 2005/06.
Clay Piece Sharnbrook (H20)
45 86 86 dwellings. Site completed 2004/05.
Luton Road Wilstead (H21)
50 92 92 dwellings. Site completed 2004/05.
Meadway Harrold (H22)
50 62 62 dwellings. Site completed 2005/06.
Cople Road Cardington (H23)
5 2 3 Permission for 5 dwellings. 2 dwellings completed 2009/10.
West End Lane Elstow (H23)
3 3 Permission for 3 dwellings.
Pavenham Road Oakley (H23)
14 37 37 dwellings. 13 complete by 2005/06, Final 24 dwellings completed in 2006/7.
Sandye Lane Swineshead (H23)
2 2 No progress.
Keysoe Road Riseley (H23)
4 2 2 2 completed in 2001. Permission granted for 2 dwellings in 2008/09
School Lane Roxton (H23)
5 8 8 dwellings. Site completed 2003/04.
Village Green Spring Lane Stagsden (H23)
6 6 No progress.
Newton Road Turvey (H23)
14 16 16 dwellings. Site completed 2000.
Old Pond House Upper Dean (H23)
2 2 No progress.
Church Lane Wymington (H23)
15 5 21 dwellings (but loss of 16 flats). Site completed 2001.
Cotton End (H23) 25 23 17 complete by 2005/06, final 6 dwellings completed in 2006/7.
Bedford Road 5 5 0 6 dwellings. Loss of 1

35
Site (Policy) Site capacity as stated in Local Plan
Completions at 31/03/10
Outstanding at 31/03/10
Current progress on development (as at 31/03/2010) (Progress post March 2010 is given in italics)
Willington (H23) dwelling. 2 complete 2006/7. 3 complete in 2007/8.
811 50 TOTALS: 575 861

36
Graph C
Graph D
37
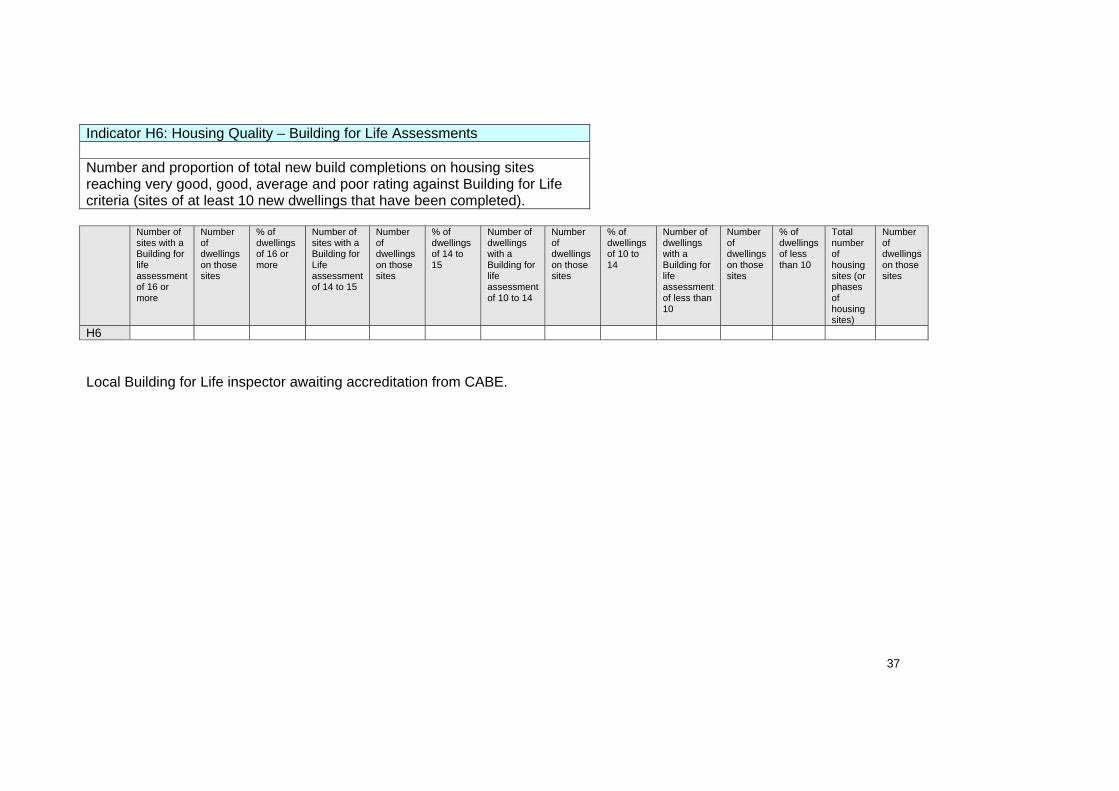
Indicator H6: Housing Quality – Building for Life Assessments Number and proportion of total new build completions on housing sites reaching very good, good, average and poor rating against Building for Life criteria (sites of at least 10 new dwellings that have been completed). Number of
sites with a Building for life assessment of 16 or more
Number of dwellings on those sites
% of dwellings of 16 or more
Number of sites with a Building for Life assessment of 14 to 15
Number of dwellings on those sites
% of dwellings of 14 to 15
Number of dwellings with a Building for life assessment of 10 to 14
Number of dwellings on those sites
% of dwellings of 10 to 14
Number of dwellings with a Building for life assessment of less than 10
Number of dwellings on those sites
% of dwellings of less than 10
Total number of housing sites (or phases of housing sites)
Number of dwellings on those sites
H6 Local Building for Life inspector awaiting accreditation from CABE.

38
Environmental Quality Indicator E1: Number of planning permissions granted contrary to Environment Agency advice on flooding and water quality grounds Regional Target: Decrease the amount of development occurring in floodplains, other areas at risk of flooding and where development would increase the risk of flooding elsewhere Flooding Quality Total E1 0 0 0 In the monitoring period there were no planning permissions granted contrary to the advice of the Environment Agency. Indicator E2: Change in areas of biodiversity importance (NI197) Regional Target: To maintain, restore and create habitats by 2010 in accordance with the East of England priority habitat targets set out in Appendix B of the East of England Plan Local Target: Biodiversity Action Plan targets The Borough does not contain any internationally designated areas and there are no designated sites of regional or sub-regional significance. There are no Biodiversity Action Plan priorities or targets for the Bedfordshire Claylands in Appendix B of the East of England Plan. The following is a list of priority habitats that are present in the Borough (the list includes national priority habitats and those identified as local priorities by the Bedfordshire and Luton Biodiversity Forum): Habitats:
Hedgerows Arable field margins Coastal and floodplain grazing marsh Eutrophic standing waters Lowland calcareous grassland Lowland Meadows Lowland wood pasture and parkland Reedbeds Lowland mixed deciduous woodland Wet woodland Ponds Traditional Orchards
The Borough does contain several Sites of Special Scientific Interest (SSSI). SSSI: Biddenham Pit (0.43ha) Felmersham Gravel Pits (21.52ha) Hanger Wood (23.94ha) Odell Great Wood (85.95ha) Swineshead Wood (21.86ha) Stevington Marsh (7.62ha) Tilwick Meadow (2.57ha) Yelden Meadows (2.84ha) TOTAL – 166.73ha The following Local Nature Reserves are of local significance and are statutorily protected.

39
Local Nature Reserves: Bromham Lake (10.86ha) Brickhill Allotments/Park Wood (5.2ha) Browns Wood (6.04ha) Fenlake Meadows (19.14ha) Harrold-Odell Country Park (59.38ha) Hill Rise (0.86ha) Mowsbury Hill (2.76ha) Putnoe Wood (10.34ha) TOTAL – 114.58ha (Source: Bedford Borough Council, www.bedsbionet.org.uk) The Borough also contains county wildlife sites (CWS), these are listed below. These sites are of local importance and are not statutorily protected. County Wildlife Sites: Astey Wood (8.82ha) Austin Cannons Meadow (6.74ha) Barwick Wood (6.14ha) Biddenham Pit (also SSSI) (0.42ha) Birchfield Farm Meadows (2.70ha) Bolnhurst Churchyard (0.57ha) Bowels Wood (8.43ha) Bromham Lake (also LNR) (10.82ha) Bromham Park (4.45ha) Bromham Water Meadows (35.49ha) Brownage and Louse Acre Woods (19.51ha) Brown’s Wood (also LNR) (6.03ha) Bushmead Big Wood (29.17ha) Bushmead (13.13ha) Bushmead Meadows (4.42ha) Carltonhall Wood (1.12ha) Castle Dairy Farm Meadows (3.18ha) Chapel End Meadows, Wilstead (1.72ha) Chellington Hill Farm (1.99ha) Claphampark Wood (12.59ha) Cleat Hill (0.52ha) Cockle Spinney (2.50ha) Colworth Thicket (17.30ha) Cople Pits (8.22ha) Dungee Wood and Odell Plantation (39.26ha) Elstow Pit (31.99ha) Exeter Wood (49.67ha) Felmersham Gravel Pits (also SSSI) (21.57ha) Felmersham Marshy Meadow (2.05ha) Fenlake Meadows (also LNR)
Mill Rise, Turvey (4.77ha) Milton Ernest Pits (2.98ha) Molliver’s Wood (2.84ha) Mowsbury Hill (2.76ha) New Wood (7.32ha) Newton Gorse (6.21ha) Newton Gorse Green Lane (3.58ha) Newton Park Grassland (4.04ha) Northwood Lane Meadows (2.05ha) Nun Wood (17.90ha) Odell Great Wood (106.99ha) Palaceyard Wood (8.71ha) Park Wood (67.19ha) Pavenham Meadow (2.24ha) Penn and Worley’s Woods (51.63ha) Pippin Wood (4.74ha) Priory Country Park (66.16ha) Priory Park Railway (12.34ha) Putnoe Wood (10.31ha) Radwell Pits (113.57ha) Ransom’s Wood (2.11ha) Round Wood, Sharnbrook (10.85ha) Salem Thrift (7.53ha) Sandye Lane (5.68ha) Sharnbrook Castle Close (8.52ha) Sharnbrook Summit (19.19ha) Spanoak Wood and Tilbrook Bushes (17.45ha) Spencer’s Wood (3.97ha) St. John’s Station (2.24ha) St. Macute’s Wood (7.76ha) Stevington Marsh (10.48ha) Stevington Meadow (4.18ha) Swineshead Wood (34.42ha) Temple Wood (9.82ha) Templegrove Spinney (1.72ha)

40
(21.31ha) Forty Acre Woods (27.77ha) Forty Foot Lane (West) (2.24ha) Forty Foot Lane (4.55ha) Foster Hill Road Cemetery (14.62ha) Francroft Wood (10.91ha) Freer’s Wood (3.85ha) Galsey Wood (49.22ha) Great and Little Early Groves (15.65ha) Great and Little Woods, Ravensden (13.26ha) Great Barford House Grassland (1.89ha) Great Hayes Wood (42.59ha) Great Oaks Wood (16.70ha) Halsey Wood (29.70ha) Hanger Wood and Oxleys (27.27ha) Harrold Country Park (58.53ha) Harrold Lake (13.38ha) High Farm Meadow (2.22ha) Hinwick Roman Road (5.73ha) Hobbs-Green Wood (1.70ha) Holywell March (0.56ha) Honeydon Road Verge (1.02ha) Hook and Home Woods (4.39ha) Hooked Lane Meadows (1.12ha) How Wood (2.23ha) Judge’s Spinney (1.82ha) Kangaroo Meadow (0.49ha) Kempston Hardwick Pit (86.58ha) Kempston West End (0.46ha) Kempston Wood (16.31ha) Keysoepark Wood (13.61ha) Knapwell Bank (2.2ha) Lady Wood (9.49) Lambert’s Spinney (2.11) Little Barford (29.39) Little Catsey Wood (4.62ha) Manor Wood (4.77ha) Melchbourne Park (28.60ha) Melchbourne Woods (67.93)
The Slipe (5.37ha) Thurleigh Cutting (6.25ha) Tilwick Meadow (also SSSI) (2.55ha) Tilwick Wood (4.36ha) Turvey – Bromham Disused Railway (18.71ha) Twin Wood (13.92ha) West Wood (82.70ha) Wilden Road Verges (3.33ha) Willington Moat (5.10ha) Wilstead Meadows (6.12ha) Wilstead Wood (67.23ha) Wootton Wood (50.43ha) Wyboston Pits (104.18ha) Wymington Meadow (1.48ha) Yarl’s Wood (7.19ha) Yelden Field (4.94ha) Yelden Meadows (2.83ha) Yelnow Lane (6.84ha) Begwary Brook Pits (also in Mid Bedfordshire) (15.80ha) Coronation Pit (also in Mid Bedfordshire) (96.59ha) Great Barford Gravel Pits (also in Mid Bedfordshire) (12.81ha) Keyse’s Spinney (also in Mid Bedfordshire) (6.06ha) Old Warden Disused Railway (also in Mid Bedfordshire) (28.06ha) River Great Ouse (also in Mid Bedfordshire) (208.34ha) Rookery Clay Pit (also in Mid Bedfordshire) (153.12ha) Sheerhatch Wood (also in Mid Bedfordshire) (71.05ha)
Regionally Important Geomorphological Sites (RIGS) are designated at: Bromham Bridge RIGS (0.15ha) Quest Pit RIGS (8.6ha, 91.45 total) Loss Addition Total E2 4.96 2.2 -2.76

41
5.11 Both Coxfield Farm (2ha) and Hammerhill Farm Meadow (1.30ha) were both deselected in the monitoring period, due to the grassland interest on both sites being lost. Cople Pits received a reduction of 0.14ha due to a part of the site being recognised as garden land and Sharnbrook Castle Close received a 1.49ha reduction following part of the site being developed. Pavenham Meadow received a 0.03ha reduction following a consolidation of the boundary. Knapwell Bank was recognised as a new County Wildlife Site with an area of 2.2ha.
5.12 NI197 states that as of March 2010, positive conservation management
by the Wildlife Trust is being achieved on 63 out of 124 County Wildlife Sites (excluding SSSIs and LNRs), which equates to 50.8%. This is an increase of 10 sites on 2009. (Source: Wildlife Trust BCNP)
5.13 Harrold-Odell Country Park was designated as a Local Nature
Reserve, increasing the total to 114.58ha.
42
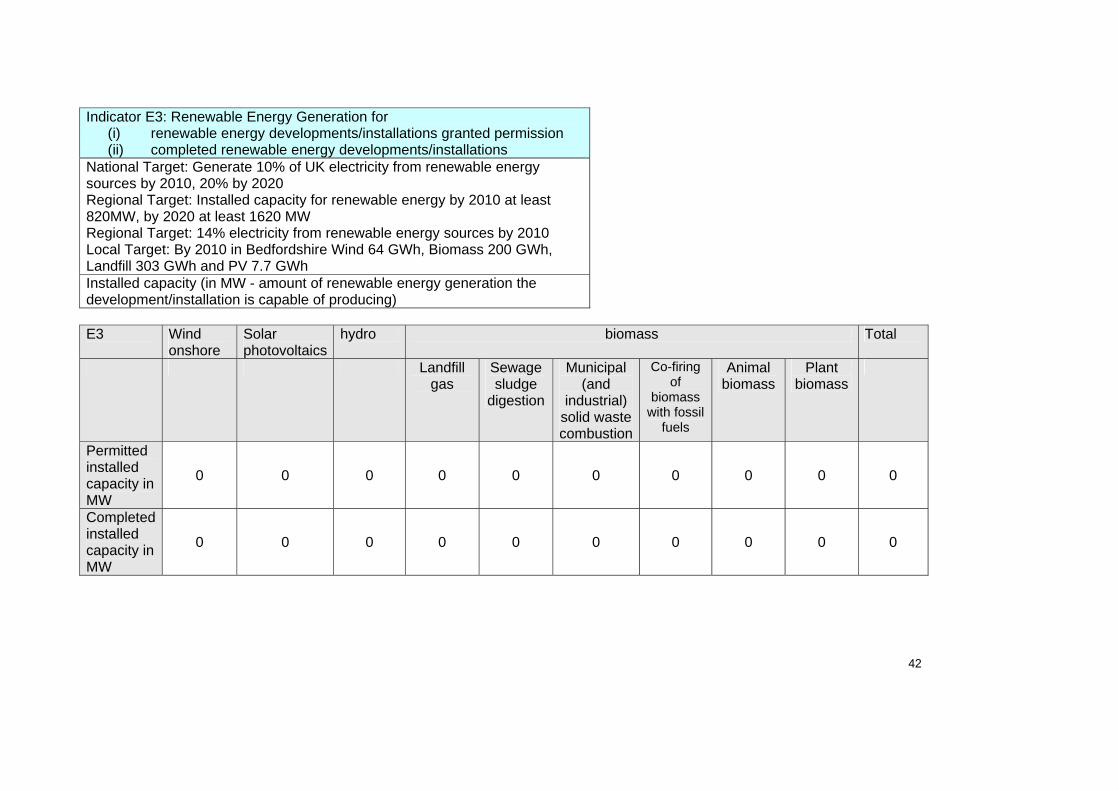
Indicator E3: Renewable Energy Generation for (i) renewable energy developments/installations granted permission (ii) completed renewable energy developments/installations
National Target: Generate 10% of UK electricity from renewable energy sources by 2010, 20% by 2020 Regional Target: Installed capacity for renewable energy by 2010 at least 820MW, by 2020 at least 1620 MW Regional Target: 14% electricity from renewable energy sources by 2010 Local Target: By 2010 in Bedfordshire Wind 64 GWh, Biomass 200 GWh, Landfill 303 GWh and PV 7.7 GWh Installed capacity (in MW - amount of renewable energy generation the development/installation is capable of producing) E3 Wind
onshore Solar photovoltaics
hydro biomass Total
Landfill gas
Sewage sludge
digestion
Municipal (and
industrial) solid waste combustion
Co-firing of
biomass with fossil
fuels
Animal biomass
Plant biomass
Permitted installed capacity in MW
0 0 0 0 0 0 0 0 0 0
Completed installed capacity in MW
0 0 0 0 0 0 0 0 0 0

43
5.14 Indicator E3 does not include renewable energy installations that were not the subject of a planning application, either because they were permitted development or they were required as a condition of planning permission. Neither is it totally comprehensive because many applications provide no information regarding manufacturer or capacity. As such, no meaningful data is available for this indicator.

44
6. Local Output Indicators 6.1 The purpose of local output indicators is to measure whether the
objectives of the adopted documents within the Bedford Development Framework and the saved policies of the Local Plan are being achieved.
6.2 In this report, the local output indicators have been chosen to measure
the objectives of the Bedford Development Framework and current ‘saved’ policies in the Local Plan. The choice of local output indicators reflects the availability and quality of existing data sources and their relevance to the local area.
6.3 Local output indicators monitor local issues and circumstances. The indicators will be developed over time, to reflect changing policy and the availability of resources. Local output indicators will be used to examine medium-term trends. The combination of core and local output indicators will ensure a robust assessment of policy implementation.
6.4 Some indicators have targets. All the targets that are relevant to
Bedford Borough are listed in Appendix C, and reproduced against the relevant indicators.
Local Plan Indicators 6.5 The following indicators have been chosen as they are considered to
be an appropriate measure of whether the overall aims of the Local Plan are being met. The aims of the Borough’s development strategy are set out in paragraph 2.18 of the 2002 Local Plan.
6.6 The following indicators also relate to aims set out in the Core Strategy and Rural Issues Plan and the Town Centre Area Action Plan. A full list of aims as set out in the Core Strategy and Rural Issues Plan and the Town Centre Area Action Plan can be viewed at Appendix C along with the indicators in the AMR that monitor them.
Indicator L2: On sites of over 10 dwellings, those granted planning permission in the monitoring period, which meet car parking standards Local Target: Car parking density of up to 70 car spaces per hectare in residential developments Progress: PPS3 states that planning authorities should ‘develop residential parking policies’. In addition the Manual for Streets, published in 2007, contains national guidance on the efficiency of different types of parking arrangements. The document does not provide a guideline figure of parking spaces per dwelling, a method previously used in PPG3. The table below shows planning permissions granted in the monitoring period.

45
The table shows that in the monitoring period parking provision was 1.29 per dwelling, compared with 1.86 from last year. With visitor spaces taken into account, the parking provision was slightly higher at 1.42 compared with 2.00 from last year. Local Plan saved Policy BE35 states that car parking in new residential development should be at a density of up to 70 car spaces per hectare. The table below shows that a total density of 83.33 spaces per hectare was achieved (this figure includes visitor spaces). This target pre-dates the publication of the national guidance on housing densities and the Manual for Streets (which does not include a target). It is anticipated that new parking standards will replace the target in policy BE35 in due course. (Source: Bedford Borough Council) Table for Indicator L2
New Planning Permissions 2009/10
Site Area (ha)
Gross dwellings
Car spaces
for gross dwgs
Spaces per
dwelling
Visitor spaces
Total spaces
for whole site (inc.
visitor spaces)
Spaces per
dwelling for
whole site (inc visitor
spaces)
Spaces per
hectare
Bedford Urban Area Sites
0800129MAF r/o 120 Goldington Road
0.52 28 36 1.28 10 46 1.64 88.46
0701569MAF
r/o The Harrows, 115 High Rd, Cotton End 0.24 24 18 1.50 0 18 1.50 45.00
0900902FUL Grosvenor Court, The Avenue
0.28 22 26 1.18 2 28 1.27 100.00
0803409MAF St Leonard's Court, 68 Ampthill Road
0.20 17
18 1.06 0 18 1.06 90.00
0901330MAR Wixams Village One, H2a
0.39 14 28 2.00 3 31 2.21 79.48
0902461MAR Wixams Village One, G3 (CP8)
0.20 15 20 1.33 2 22 1.47 110.00
0902510MAR Wixams Village One, J2a (CP8)
0.45 14 27 1.93 0 27 1.93 60.00
TOTALS 2.28 134 173 190
Total site spaces per hectare (190 ÷ 2.28) 83.33 spaces per hectare Total spaces per dwelling (190 ÷ 134) 1.42 spaces per dwelling
Spaces per dwelling (173 ÷ 134) 1.29 spaces per dwelling
46
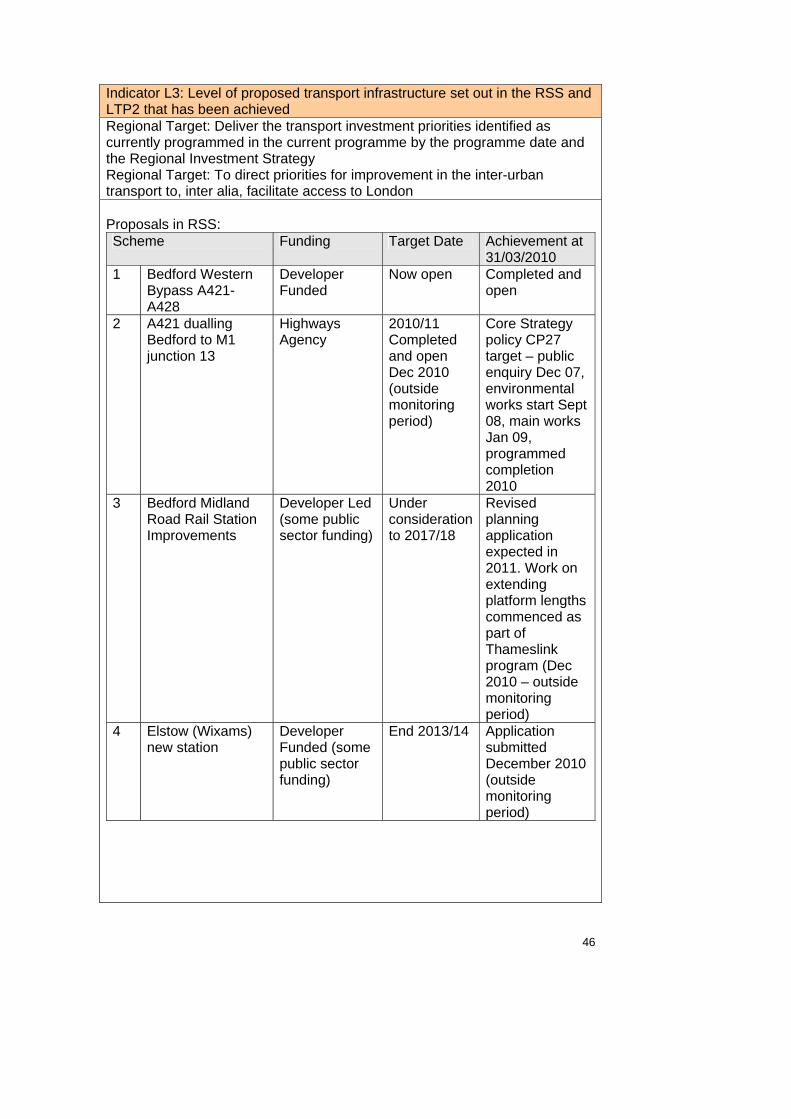
Indicator L3: Level of proposed transport infrastructure set out in the RSS and LTP2 that has been achieved Regional Target: Deliver the transport investment priorities identified as currently programmed in the current programme by the programme date and the Regional Investment Strategy Regional Target: To direct priorities for improvement in the inter-urban transport to, inter alia, facilitate access to London Proposals in RSS: Scheme Funding Target Date Achievement at
31/03/2010 1 Bedford Western
Bypass A421-A428
Developer Funded
Now open Completed and open
2 A421 dualling Bedford to M1 junction 13
Highways Agency
2010/11 Completed and open Dec 2010 (outside monitoring period)
Core Strategy policy CP27 target – public enquiry Dec 07, environmental works start Sept 08, main works Jan 09, programmed completion 2010
3 Bedford Midland Road Rail Station Improvements
Developer Led (some public sector funding)
Under consideration to 2017/18
Revised planning application expected in 2011. Work on extending platform lengths commenced as part of Thameslink program (Dec 2010 – outside monitoring period)
4 Elstow (Wixams) new station
Developer Funded (some public sector funding)
End 2013/14 Application submitted December 2010 (outside monitoring period)

47
Programmed Schemes in Local Transport Plan 2006/07 – 2010/11: Scheme Project Lead Target Date Achievement at
31/03/2010 1 A421
Improvements Bedford to M1
Highways Agency
Finish 2010/11
See RSS achievement above (2)
2 A6 Wixams Re-Alignment
Developer Led (some public sector funding)
Complete Complete
3 Bedford Western Bypass A421-A428
Council and English Partnerships led (with subsequent Developer Contributions)
Autumn/ Winter 2009
See RSS achievement above (1) (completed Dec 2009)
4 Bedford Western Bypass A428-A6
Some public sector funding
Finish 2012/13 with high risk. Alternative funding mechanisms being explored
Resolution to grant planning permission subject to signing S106 agreement. Detailed design now underway (late 2010)
5 East-West Rail Oxford/Aylesbury to Bedford
East West Rail Consortium
East West Rail Consortium scheme under consideration.
Consultants appointed to develop operating and business case for the western section
6 Wixams Station Developer Led (some public sector funding)
Under consideration to 2013/14
See RSS achievements above
7 Bedford Town Centre Improvements including River Bridge
Bedford Borough Council
Under consideration to 2014/15 (now 2021)
Transportation Study to be commissioned to support possible major transport scheme bid (LTP3)
8 Bedford Midland Road Rail Station Improvements
Developer Led (some public sector funding)
Under consideration to 2017/18
See RSS achievements above (3)
9 Park and Ride (Biddenham/Great
Bedford Borough
N/A Great Denham Section 106

48
Denham and Clapham)
Council signed, Land North of Bromham Road not signed. Great Denham – Land transfer to Council completed. Clapham – No planning permission has yet been granted
(Source: Local Transport Plan, RSS and Bedford Borough Council) Indicator L4: Proportion of completed development within the Growth Area and Rural Policy Area Regional Target: To concentrate the majority of development in or adjacent to the Key Service Centres for Development and Change Progress: Housing development: completions Growth Area 414 net dwellings (88.8% of total net dwellings) Rural Policy Area 52 net dwellings (11.2% of total net dwellings) Housing supply (outstanding planning permissions): Growth Area 8,392 dwellings (97.5% of total supply) Rural Policy Area 218 dwellings (2.5% of total supply) Housing supply (outstanding planning permissions and resolutions to grant subject to s106) Growth Area 8392+2681=11,073 dwellings (97.9% of total supply) Rural Policy Area 218+11=229 dwellings (2.1% of total supply) Housing development in the monitoring period has been more prevalent in the Growth Area than the Rural Policy Area. Outstanding planning consents for housing clearly show that the focus for future development is in the Growth Area. Thus it can be expected that the target will continue to be met in the future. Employment Development: completions Growth Area 0 hectares net Rural Policy Area 0.61 hectares net 9204 sq.m floorspace completions in Growth Area (net) 1321 sq.m floorspace completions in Rural Policy Area (net) Employment land supply (outstanding planning permissions):

49
Growth Area 30.87 hectares net (49.9% of total supply) Rural Policy Area 30.96 hectares net (50.1% of total supply) There has been an increase in net floorspace completions in the Growth Area this year compared with last year, contributing to an overall increase in completions across the borough. Whilst there has been no employment land gain in the Growth Area, the majority of floorspace completions are focussed here. This can be attributed to additional floorspace being created on a site at Stewartby already designated as employment land (therefore no ‘land’ gain). The only land completion in the monitoring period came in the Rural Policy Area however this only accounts for 12.5% of the floorspace completions. Compared with last year, there has been a decrease of land completions in the Rural Policy Area. Looking at the employment land supply position there has been a net loss of 11.35ha in the Growth Area. This can be attributed to a new permission for residential use superseding a previous application for employment on land near the Cardington sheds at Shortstown. This results in an overall loss in employment land supply of 11.96ha and a slight shift in its distribution, with 50.1% of available supply now in the Rural Policy Area. New allocations and designations of further employment land are being considered as part of the Allocations and Designations Plan and will continue to support the Council’s strategy of focussing employment development in Bedford, Kempston and the northern Marston Vale. (Source: Bedford Borough Council) Indicator L5: Percentage of land in nationally important wildlife sites (Sites of Special Scientific Interest) which are in favourable condition National Target: Bringing into favourable or recovering condition by 2010 95% of all nationally important wildlife sites Progress: Land designated SSSI – 166.73 hectares SSSI in: Favourable condition – 49.07ha (29.4%) Recovering – 39.88ha (23.9%) Unfavourable – 77.78ha (46.7%) Of the land in unfavourable condition, 39.88 hectares are recovering. This is consistent with the last reporting year. 77.78 hectares are declining, including the land at Odell Great Wood. The Council is aware that management operations have since been

50
undertaken on the unfavourable declining units at Odell Great Wood and Stevington Marsh in order to address the ecological issues at these SSSI (outside of the monitoring period). Following this, Natural England records that 98.5% of SSSI area has been brought into PSA target condition as of October 2010. (Source: Natural England September 2010) Table for Indicator L5: SSSI site Main habitat Size (hectares) Condition Biddenham Pit Earth heritage 0.13 + 0.30 100% favourable Felmersham Gravel Pits
Standing open water and canals
21.52 100% unfavourable recovering
Hanger Wood Broadleaved, mixed and yew woodland-lowland
21.31 + 2.63 100% favourable
Odell Great Wood Broadleaved, mixed and yew woodland-lowland
18.72 + 13.68 + 31.49 + 22.06
84% unfavourable declining 16% unfavourable recovering
Stevington Marsh Neutral grassland-lowland
4.68 + 2.94 61% unfavourable recovering 39% unfavourable declining
Swineshead Wood Broadleaved, mixed and yew woodland-lowland
9.01 + 12.85 100% favourable
Tilwick Meadow Neutral grassland-lowland
2.57 100% unfavourable declining
Yelden Meadows Neutral grassland-lowland
2.84 100% favourable
Indicator L6: Increase in areas of woodland in the Growth Area Draft Regional Target: Increase woodland cover in Forest of the Marston Vale Community Forest to 30% by 2030 Progress: In the monitoring period (2009/10) a further 8ha of new community woodland was planted at Rectory Wood, Cranfield, this being the penultimate phase of the overall 70ha woodland creation project. This site lies outside the administrative area of Bedford Borough, but the activity still delivers against the Local Indicator regarding securing the 30% target for tree cover within the Forest of Marston Vale. A total of 12,500 native trees and shrubs were planted, of which around 7,000 were planted through a series of public, school and corporate events involving around 650 people. Within Bedford Borough an additional area of 5ha of new native woodland was created by the Marston Vale Trust at the Grange Estate, at Willington, as part of the ongoing creation of Bedford River Valley Park. A total of 10,000 native trees and shrubs were planted, with some 2,500 planted through public, school and corporate events involving around 120 people.

51
When combined with a 2ha private farm woodland scheme delivered with advice and support from the Marston Vale Trust, this brings the total area of woodland delivered within the monitoring period 2009/10 to 15 hectares. (Source: Forest of Marston Vale) Indicator L7: Listed buildings at risk Target: n/a Progress: 2010 – 39 entries on the national at risk register 2009 – 1 entry on the national at risk register Priority B (Cardington Air Shed No. 1 grade II*) 2008 – 1 entry on the national at risk register Priority B (Cardington Air Shed No. 1 grade II*) 2007 – 1 entry on the national at risk register (Cardington Air Shed No. 1 grade II*) 2006 – 1 entry on the national at risk register (Cardington Air Shed No. 1 grade II*) 2005 – 2 entries on the national at risk register (records grades I and II* only) 2004 – 24 entries on the local at risk register 2000 – 33 entries on the local at risk register Land adjacent to the Air Shed No.1 now benefits from a resolution to grant planning permission for residential development. Provisions in the S106 agreement will secure refurbishment of Shed No.1 in conjunction with this development. 2010 has seen a marked increase in the number of entries in the borough on the national buildings at risk register. This can be attributed to the fact that a new survey was completed for the 2009/10 period. The previous survey was completed in 2001. Buildings at Risk by Parish Grade BEDFORD 19 AND 21 HIGH STREET II BEDFORD HOSPITAL (MAIN SOUTH BLOCK) KIMBOLTON ROAD II BUILDINGS OCCUPIED BY COUNTY ARCHITECT'S DEPARTMENT SAINT PAUL'S SQUARE II GOLDINGTON HALL II SKETCHLEY DYE WORKS 80A HIGH STREET II BOLNHURST AND KEYSOE BURYFIELDS FARMHOUSE II BROMHAM SCHOOL HOUSE BROMHAM HALL II CARDINGTON CARDINGTON NUMBER 1 SHED AT RAF CARDINGTON HIGH ROAD II* CARLTON AND CHELLINGTON FISHERS FARM BARN EDENS LANE II MONUMENT TO SIR ROBERT DARLING, 1 1/2 METRES FROM S.E. CORNER OF CHANCEL, ST NICHOLAS CHURCH II

52
KEMPSTON THREEWAYS FARMHOUSE WEST END ROAD II KEMPSTON RURAL MEADOW FARMHOUSE WEST END ROAD II KNOTTING AND SOULDROP BARNS AT STRAWBERRY HILL FARM II LITTLE BARFORD BARN NORTH OF FARMHOUSE, LOWER FARM II MILTON ERNEST DOVECOTE AT MILTON ERNEST HALL BEDFORD ROAD II PODINGTON 4 HINWICK VILLAGE II GATEPIERS TO DRIVE ENTRANCE, HINWICK HALL II RAVENSDEN TILWICK FARMHOUSE KIMBOLTON ROAD II RENHOLD ICE HOUSE TO HOWBURY HALL ST NEOTS ROAD II GARDEN WALL TO HOWBURY HALL ST NEOTS ROAD II GREAT DAIRY FARMHOUSE ST NEOTS ROAD II RISELEY GRANARY AT RISELEY LODGE FARM NORTH EAST OF HOUSE BOWERS LANE II ROXTON CHAWSTON LODGE II ROXTON DOVECOTE AT FORTY FARM GREAT NORTH ROAD II FORTY FARMHOUSE GREAT NORTH ROAD II SHARNBROOK FORMER FARMHOUSE AT HILL FARM MILL ROAD II MAGNIAC MAUSOLEUM ST PETER'S CHURCHYARD CHURCH LANE II STAPLOE DOVECOTE AT NUMBER 49 WOODHOUSE LANE II STEWARTBY TWO KILNS AND FOUR CHIMNEYS AT THE STEWARTBY BRICKWORKS II SWINESHEAD CLOSE COTTAGE 1 AND 2 HIGH STREET II THURLEIGH EASTERN BARN AT RUTTERS FARM OLD MILTON ROAD II NORTHERN BARN AT RUTTERS FARM OLD MILTON ROAD II CHURCHYARD CROSS NEAR SOUTH DOOR OF CHURCH HIGH STREET II* TURVEY GREAT OAKS FARMHOUSE BEDFORD ROAD II WILDEN MANOR FARMHOUSE HIGH STREET II WILLINGTON GARDEN WALL AT MANOR FARM CHURCH END II WILSHAMSTEAD GRANARY AT MANOR FARM COTTON END ROAD II

53
CAWNE CLOSE 34 BEDFORD ROAD II WOOTTON 157 BEDFORD ROAD II (Source: Bedford Borough Council) Indicator L8: Household and commercial waste recycling Regional Target: Recycle/recover 50% of municipal waste by 2010 and 70% by 2015 Regional Target: Recycle/recover 72% of commercial and industrial waste by 2010 and 75% by 2015 Regional Target: Eliminate the land filling of untreated municipal and commercial waste by 2021 Regional Target: reduce waste arisings per head and reduce overall waste growth to 1% pa by 2010 and 0.5% pa by 2020 Local Target: Recycle, reuse or compost 40% of waste generated 09/10 Progress: Household Waste: 2009/10 – Total waste 73,049t (27,974t sent for recycling, composting, reuse = 38.3% of waste). The Borough Council now has 5 additional Recycling Advisers who are currently engaged in introducing an adapted recycling scheme to all flats within the Borough. They have also commenced work on identifying low performing recycling areas which will be the focus of much of their work over the next two years. Plans to extend the range of materials recyclable at the kerbside are ongoing and an update of the Council’s bring bank facilities is about to commence to encourage more waste to be recycled. The Council now operates a HWRC at Barkers Lane which currently recycles over 80% of waste taken. Commercial and Municipal Waste: 2009/10 – Bedford Borough Council – municipal waste arisings = 81,852t (43,496t land filled, 7,541t incineration with EfW, 30,418t recycled/composted) Residual waste arisings per head in the Borough are stated as 285.29kg (2009/10 PI’s). This is down by 16.18kg since 2008/09. (Sources: Bedford Borough Council, DEFRA Municipal Waste Management Statistics 2009/10)

54
% of total yearly waste recycled and composted
05
1015202530354045
2006/07 2007/08 2008/09 2009/10
Year
% o
f yea
rly
tota
l
% of total yearly waste
Indicator L9: Percentage of affordable houses secured on sites of 15 or more dwellings Regional Target: To ensure that some 35% of new dwellings coming forward as a result of planning permissions granted after the adoption of the Plan in 2008 is affordable Local Target: On sites of 15 units or over and in villages having a population of less than 3,000 on sites of 3 dwellings or more the Council will expect the provision of 30% affordable housing (CP8 Core Strategy and Rural Issues Plan) Progress: 389 affordable were dwellings were procured on relevant sites totalling 1304 dwellings. This amounts to 29.8% of housing provision. (Source: Bedford Borough Council) Indicator L10: % of households in the urban area within 400m of a quarter hourly bus service Target: To increase the proportion of households with public transport access to core services Progress: 86% of households in the urban area are within 400 metres walking distance of a bus service with a quarter-hourly bus service. This is a percentage increase of 21% from the previous year. (Source: Bedford Borough Council) Indicator L11: Rural households within 13 minutes walk of an hourly bus service Target: To increase the proportion of households with public transport access to core services Progress: 71% of rural households are within 13 minutes walking distance of an hourly

55
bus service. This demonstrates a generally consistent percentage level of households in the rural area that are within 13 minutes walk of an hourly bus service. (Source: Bedford Borough Council) Indicator L12: Number of participants in higher education Target: n/a At the 1st April 2010 the University of Bedfordshire had 20494 instances of student registration. List of campuses: Bedford Campus Luton Campus Putteridge Bury Campus Buckinghamshire Campus (hospital education) Butterfield Park campus (hospital education) Alexander Sports Centre Based on the location of their chosen course of study, student registration numbers can be broken down into: Taught at one of the main University Campuses: 14720 Taught Overseas: 2035 Taught at a Partnership*: 3739 Of those 14,720 registrations taught on campus, 3532 are noted as being at the Bedford Campus. *Partnerships include FE colleges such as Bedford, Grantham, Milton Keynes etc. Also larger institutes such as the National Childbirth Trust and the British School of Osteopathy. The population can also be viewed by their fee status and domicile information. Please note this isn't based on the location of study (as above), so an Overseas student as categorised below may be taught overseas or at a partnership or on campus. Overseas students: 5793 Channel Isles: 7 EU: 1208 Local**: 7424 Other UK: 6062 ** Local students defined by given Home Postcode - not by location of study. (Source: University of Bedfordshire 2010)

56
Indicator L13: Self employment rates Target: n/a Progress: The data from NOMIS is based on small samples which lead to significant annual fluctuations in estimated totals for relatively small area like Bedford Borough. It is therefore considered better to use estimates based on small area data moderated by wider area trends. The source for this is Oxford Economics’ East of England Forecasting Model. The results from the latest (Spring 2010) run of the model area as follows: Year Self-Employed 2010 11,000 2009 11,200 2008 10,700 2007 10,800 2006 10,700 2005 10,400 2004 10,400 2003 9,700 2002 9,300 2001 9,100
(Source: Oxford Economics’ East of England Forecasting Model) Indicator L14: Numbers of jobs created in the Borough Regional Target: Indicative target of 27,000 net growth in jobs Bedford/Mid Beds 2001-21 (16,000 Bedford Borough, 11,000 Mid Beds) Regional Target: Reduce the need to commute to work and ensure a greater supply and demand balance at sub-regional level Progress:
Year Total Jobs Annual Growth Cumulative Growth (from
2001) 2010 80,200 -600 +6,100 2009 80,800 -700 +6,700 2008 81,500 +1300 +7,400 2007 80,200 -200 +6,100 2006 80,400 -1,000 +6,300 2005 81,400 +3,000 +7,300 2004 78,400 +2,700 +4,300 2003 75,700 +2,600 +1,600 2002 73,100 -1,000 -1,000 2001 74,100
According to the above data, a trend can be established of increased job growth in the borough. Since 2001, over 6,000 more people have been employed within the borough, although the latest information demonstrates a

57
decrease Over the last two years. This may be attributed to the current economic climate. This year, the figures include those that are self employed. In previous years, this has not been the case. The source of the information has also changed, with a more consistent outcome. (Source: Bedford Borough Council,Oxford Economics’ East of England Forecasting Model) Indicator L15: Percentage of vacant units within the primary shopping area of Bedford town centre Target: n/a Progress: 10% vacant units in 2009/10 This is 0.8% lower than in 2008/09 (Source: Bedford Town Centre Company) Indicator L16: Amount of new residential development within 30 minutes public transport time of: a GP, hospital, primary school, secondary school, areas of employment and a major retail centre(s) Regional Target: Increase the proportion of households with public transport access to core services Progress: The information has been collected from the sources below and processed using Accession Software. Access to each of the key service areas and to the bus network has been based upon typical time periods when demand for the service is likely to be greatest: GP/Hospital – 7am to 12pm weekday School – 7am to 9am weekday (travel to school hours) Areas of Employment – 7am to 10am weekday (commuting to work hours) Major Retail Centres – 9am to 12pm weekday The results were as follows: 96% of the new dwellings were within 30 minutes public transport time of a GP surgery 88% of the new dwellings were within 30 minutes public transport time of a hospital 94% of the new dwellings were within 30 minutes public transport time of a lower school 76% of the new dwellings were within 30 minutes public transport time of a middle school 78% of the new dwellings were within 30 minutes public transport time of an upper school 73% of the new dwellings were within 30 minutes public transport time of an

58
area of employment 78% of the development sites were within 30 minutes public transport time of a major retail destination (Sources: Bedford Borough Council)
Data for the above indicator was taken from a report compiled by Bedford Borough Council using the following sources: Data Source New residential development New housing completed in the
monitoring period GP/Hospital locations GP Surgeries – A list was compiled
from the NHS website (www.nhs.uk) and from information by DfT on Transport Statistics website. Hospitals within Bedfordshire were extracted from DfT supplied lists of NHS hospitals in the UK.
Schools locations Obtained from Sustainable School Travel Team
Major Retail Centres Sites in the Local Development Framework and local knowledge
Areas of employment A spreadsheet of main employment areas was supplied by Bedford Borough Council
Indicator L17: Traffic levels in the town centre Regional Target: To increase the number and proportion of journeys made by public transport and walking, cycling and other non-motorised transport Progress:
Comment [g1]: Trend data forthcoming

59
Categories 2001 2005 2009
Pedestrians 4772 4606 5325 Cyclists 1157 989 1066 Motor Cyclists 287 249 319 ALL CARS 31666 32626 31929Large Goods Vehicles 3379 3966 2609 Other Goods Vehicles 2096 1324 1662 Public Service Vehicles 394 460 532 Other Buses 360 227 321 TOTAL (incl. Pedestrians) 44111 44447 43763
Figures are collected from each cordon point indicated on the above map. An aggregate is calculated and is represented above for each different mode of transport category. (Source: Bedford Borough Council) Indicator L18: Footfall levels in the town centre Target: n/a Progress: Average footfall per week: 2005/06 – 117,000 2006/07 – 119,000 (attributed to the opening of Primark store) April 2007 – Jan 2008 – 119,000 From February 2008, electronic counters were introduced. February – March 2008 – 173,000 2008/09 – 174,000 2009/10 – 174,500 The footfall levels demonstrate a slight rise in the town centre compared with last year. (Source: Bedford Town Centre Company) Indicator L19: Securing local standards for open space provision National Target: Local Authorities must set robust local space standards Progress: The Bedford Open Space Study (PPG17 Study) has been published to support the Allocations and Designations DPD. The draft DPD was out for consultation in May-July 2010 and includes local open space standards. The implementation of local standards will be monitored by assessing planning

60
permissions granted. Further review work has been done on the Council’s Greenspace Strategy and the final 2010 revision will give additional detail on the quality of open spaces in the Borough and opportunities for improvement both in qualitative and quantitative terms. (Source: Bedford Borough Council) Indicator L20: Amount and % of total open space managed to green flag award standards Regional Target: To maintain and increase the region’s network of green infrastructure Progress: The total area of publicly accessible open space is 844ha. Informal Green Space 145 ha Natural Green Space 507 ha Parks and Gardens 166 ha Recreation Grounds 26 ha The total area of eligible space owned by the Borough Council is 572 hectares. Priory Country Park (100ha), Harrold Odell Country Park (59ha), Bedford Park (25ha) and Addison Howard Park (13.5 ha) have been given Green Flag awards. Of the Borough Council owned eligible space (572ha), approximately 34.5% of public greenspace has a Green Flag award. This has not changed since last year. (Source: Bedford Borough Council) Indicator L21: Designated air quality management areas National Target: Meet national air quality targets for 13 different pollutants Local Target: Monitor air quality against national targets for NO2 and SO2 in the relevant AQMAs Under the provisions of the Environment Act 1995 Part IV Section 83(1) a new Air Quality Management Area (AQMA) for nitrogen dioxide (NO2) was declared in Bedford town’s centre on 6th November 2009. The new AQMA encompassed AQMA 2 (Prebend Street and AQMA 3 High Street) as well as other areas of measured exceedance. The order also revoked AQMA 1 for sulphur dioxide (SO2) following the closure of Stewartby brickworks in February 2008 and AQMA 4 for NO2 in Great Barford following the opening of the Great Barford bypass in August 2006 Kings College London has been commissioned to produce a Further Assessment which will be submitted to Defra in November 2010.The Further Assessment will characterise the source of the pollution so as to enable

61
effective targeting within the Action Plan. The Action Plan will be revised to detail the measure the Council and its stakeholders are taking to improve air quality within the town centre AQMA. Two continuous monitoring stations have been installed on Prebend Street and Lurke Street measuring NO2. The monitoring stations provide continuous accurate data to inform modelling and future work carried out within the Borough. In April 2009, the Council commenced its 4th round of review and assessment with the completion of an Updating and Screening Assessment (USA). The USA concluded that AQMA 5 encompassed all areas of measured exceedence for NO2. For all of the other pollutants it was concluded that there is no significant risk of the national objectives being exceeded within the Borough. A Progress Report will be the next step of the review and assessment in April 2010. The second phase of the Bedford’s Western bypass is now completed. It is expected to reduce through-traffic within Bedford town centre and therefore reduce excess NO2 within the town centre AQMA (Number 5). (Source: Bedford Borough Council) Indicator L22: Number of empty homes brought back into use Local Target: 105 empty homes per annum to habitable standards and ready for occupation Progress: In the monitoring period, 147 empty homes were brought back into use. The target of 105 homes brought back into use for 2009/10 has been exceeded.
(Source: Bedford Borough Council)
Empty homes brought back into use
127113
183
147
45
7595 105
0
50
100
150
200
2006/7 2007/8 2008/9 2009/10
Year
Num
ber
achievedtarget

62
Indicator L23: Percentage of new dwellings completed at
i) less than 30 dwellings per hectare (dph) ii) between 30 and 50 dph iii) above 50 dph
National Target: Minimum density requirement of 30 dwellings per hectare (within reporting period) Regional Target: housing development no less than 30 dwellings per hectare Progress: The following information is for dwellings on sites of more than 10 dwellings.
i) 18.5% less than 30 dph ii) 47.8% between 30 and 50 dph iii) 33.7% above 50 dph
In total, housing developments on sites of over 10 dwellings have an average density of 38.1 dwellings per hectare. The average density figure clearly shows that the density target has been achieved on sites of more than 10 dwellings. (Source: Bedford Borough Council) Indicator L24: Completion/enhancement of cycle routes in the Borough Local Target: N/A Progress: Works designed in 2008/09 for completion 2009/10: Union Street: design of on-carriageway cycle lanes, to be implemented in summer 2009 as part of resurfacing - COMPLETED A428 (east of Bedford): Design of Pegasus Crossing of A428 (east of Norse Road) as part of Bedford Green Wheel – First phase of construction completed 2009/10; final phase will be completed during 2010/11 A603 (by Priory Business Park): Design of Toucan Crossing of A603 (west of A421 roundabout) to provide improved access to Priory Business Park and as part of Bedford Green Wheel - COMPLETED Goldington Road: Design of extension to westbound cycle lane from Rothsay Gardens to St. Peters Street – Not completed, programmed for 2010/11 (Note: as of 27/09/10) Schemes designed in 2009/10 for construction 2010/11 Design Contra-flow cycle lane in Dame Alice Street (Harpur Street to High Street) – problems with organising roadspace, so will be constructed 2011/12

63
Raised crossing points on Williamson & Wyatt Rd Kempston tying into existing cycle routes (due for construction October 2010) Hastingsbury cycle route refresh – this is an upgrade of the existing cycle path out through Kempston. It should be implemented Mar/Apr Goldington Rd – A scheme to convert the southern footway to shared use from Polhill Ave along to the Toucan crossing outside Tesco’s – due to be implemented Mar/Apr Clapham Rd – Designs only – review prevision for cyclists around this roundabout – it is hoped this scheme will be developed further next year. Fenlake to Town Centre – Designs only – investigate the possibility of a cycle route along this section. (Source: Bedfordshire Highways, Bedford Borough Council) Indicator L25: Mode of transport to work Regional Target: To increase the number and proportion of journeys made by public transport and walking, cycling and other non-motorised transport Local Target: 15% increase in bus patronage on local buses Progress: In 2001, the main mode of transport to work was by car (60%). A total of 4.39% of people chose to travel to work by bus, minibus or coach. 4.57% of people travelled by bicycle. The above information represents a baseline situation against which future levels of bus and car usage can be monitored. (Source: Census 2001 – this remains the most up to date information available) Indicator L26: Amount of mobility housing completed each year Target: 10% of new housing should be mobility housing Progress: 39 mobility houses were completed in the monitoring period. This equates to 8.1% of the total gross completions, up on the 6.1% in the previous year. (Source: Bedford Borough Council) Indicator L27: Planning permissions granted with conditions relating to good access provision for disabled people Target: 10% of new housing should be mobility housing Progress: The Local Plan requires good access provision for disabled people in all new developments (policies BE48 and BE49). This is achieved through negotiation

64
with developers and conditions applied to planning approvals. In the monitoring period 6 planning permissions were granted which used the above policies in the conditions of the planning permission. A total of 121 mobility units were secured, this equates to 9.9% of dwellings on the sites. 37 mobility units were completed during 2009/10 on 8 sites (gross = 469), which equates to 7.9% of the total completions. In addition, 2 mobility units not secured by condition were completed on a site, equating to 14.3% of the total number of dwellings on the site. 1 new planning permission, were granted in the monitoring period which included provision for 4 mobility units without a condition, which equates to 18.2% of the permission. In summary, the Council has granted planning permission for 125 mobility units in total and 39 mobility units were completed. (Source: Bedford Borough Council) Indicator L28: Barriers to Council services for the Black and Minority Ethnic or disabled community Target: n/a Progress: The Council continues to implement a programme of Equality Impact Assessments of Planning Services. The specific services which have been assessed are:
• Pre-application Advice • Reception Desk Services • The ‘Right to Speak’ at Planning Committee • Access Improvement Grants • Neighbourhood notification procedures
As a result of these Assessments: • Monitoring procedures have been streamlined to give improved data • Bedford Diversity Network and Bedford Access Group have been
consulted on planning application publication procedures • The format of information given in leaflets and letters is continually
reviewed These initiatives give service users the opportunity to state whether they feel disadvantaged in relation to any disability, ethnicity or gender issues. Results have not revealed any barriers faced by these community groups. (Source: Bedford Borough Council) 6. 7 The following table indicates whether the aims of the Local Plan are
being achieved, by summarising what the local output indicators have shown. The table includes any actions the indicators have suggested should be taken.

65
Aim of Local Plan Conclusion from indicators and proposed actions
Indicators Aim monitored in
1: To move towards more sustainable forms of development
• Progress has been made in the delivery of transport infrastructure
• Housing development and supply is concentrated in the Growth Area
• Employment supply is distributed evenly across the Growth Area and Rural Policy Area. New allocations and designations of employment land are being considered as part of the Allocations and Designations Plan process.
ACTIONS: • Local car parking
standards should be updated
• Consideration continues to be given to the allocation of employment in the Growth Area for qualitative reasons through the Allocations and Designations Plan process.
L2, L3, L4
2: Protect and enhance the existing built and natural environment and the landscape
• 29.4% of SSSI sites are in favourable condition with a further 23.9% recovering
• The amount of woodland coverage is increasing with 8 hectares planted within the forest of Marston Vale. A further 5 hectares of new native woodland were planted as part of the ongoing creation of Bedford River Valley Park and 2ha were planted as part of a private woodland scheme.
• There is a significant increase in buildings at risk in the borough due to an updated survey for 09/10
L5, L6, L7, L8

66
Aim of Local Plan Conclusion from indicators and proposed actions
Indicators Aim monitored in
• Household waste recycling has increased to 38.3%, with 37% of municipal waste recycled in the Borough
3: To meet the needs of the Borough’s residents
• 29.8% affordable housing has been secured on those sites of 25 or more dwellings that have been granted planning permission.
• 86% of houses in the Urban Area are within 400m of a quarter hourly bus service and 71% of houses in the Rural area are within a 13 minute walk of an hourly bus service
L9, L10, L11
4: To maintain and enhance the economic and social well-being of the Borough
• Self-employment rates have decreased since last year by 2.5% of the economically active workforce
• The number of people employed in the borough has decreased by 600 compared with the same period last year
L12, L13, L14
5: To protect and enhance Bedford’s role within the sub-region
• Vacant units in the town centre have decreased to 10% - 0.8% lower than last year.
• Footfall in the town centre remains consistent with last year
• Traffic levels in the town centre have remained generally consistent for the last few years. A drop can be seen in the number of LGVs passing through the inner cordon this year.
L15, L16, L17, L18
6: To improve the quality of life for the Borough’s residents
• The Air Quality Action Plan was developed in 2007 introducing schemes and measure to reduce pollution. It is a working
L19, L20, L21

67
Aim of Local Plan Conclusion from indicators and proposed actions
Indicators Aim monitored in
document that will be continually reviewed and updated. A report is due in November 2010 (outside monitoring period) which will characterise the source of pollution and enable effective targeting in the Action Plan.
• Bedford Open Space Study will support the Allocations and Designations DPD which will include local open space standards
7: To improve the quality of new development within the Borough
• Project Management Protocol is being implemented for major development sites
• Empty homes have been brought back into use in excess of the local target
• A draft Strategy for Bedford High Street was consulted on in February to support a bid to regenerate Bedford’s High Street
L22, L23
8: To improve communications and movement in and out of the Borough
• Existing cycle ways have been improved.
L24, L25
9: To promote equal opportunities
• Mobility Housing has been secured and is currently 8.1% of gross completions
• The Council granted planning permission for 125 mobility units in the monitoring period and 39 were completed
• No barriers to planning services have been identified in relation to any disability, ethnicity or gender issues
• A programme of comprehensive Equality Impact Assessments has
L26, L27, L28

68
Aim of Local Plan Conclusion from indicators and proposed actions
Indicators Aim monitored in
continued to be implemented for the planning service.
6. 8 The purpose of the following indicators is to evaluate the progress
towards the objectives of the adopted Supplementary Planning Documents and the adopted Statement of Community Involvement.
Indicator L29 6. 9 The following table of indicators are specific to the Land North of
Bromham Road Design Guide, identified in the SPD adopted in November 2006.
SPD objective Site-specific
associated targets Site-specific Indicators
Progress
Local identity and character
Whether design guide standards have been met by the approved Reserved Matters application
a) % of design guide standards met by Reserved Matters approved application
b) Density achieved on site
Achieving a mixed and balanced community
Achieve PPG3 density requirements Achieve 1200-1290 dwellings 30% affordable housing
c) Number of dwellings achieved Affordable housing achieved
Priority to pedestrians, cyclists and public transport
Encourage use of renewable energy
d) Renewable energy projects on site
e) Open space achieved on site
Protecting and enhancing the natural environment
Increase open space available to the public Contribute to BAP targets
f) Impacts on BAP habitats and species on site
Ensuring energy efficiency
Achieve BREEAM/Ecohome standard
g) Number of dwellings that achieve BREEAM/Ecohome standard
Community safety
Contribute to lowering crime levels (2004/05 105.0)
h) Number of recorded crimes per 1000 population
The Section 106 agreement has not yet been signed on the outline planning application and thus a reserved matters application has not been permitted. No monitoring can thus be undertaken for the period 2009/10.

69
Environmental standards
Achieve BREEAM/Ecohome standard
i) Number of homes on site built to BREEAM/Ecohome standard
Privacy Whether privacy standards have been met by the approved Reserved Matters application
j) % of privacy standards met by Reserved Matters approved application
6.10 No conclusions can be drawn from the indicators as a Reserved
Matters application has not been determined. Indicator L30 6.11 The following table of indicators is specific to Great Denham (formerly
Biddenham Loop) Design Guide and West of Kempston Design Guide. Objective Indicator Great Denham West of
Kempston To make best and most efficient use of land
Density of residential development (dwellings per hectare)
28 dwellings per hectare on reserved matters application approvals
34 dwellings per hectare on reserved matters application approvals
Number of renewable energy schemes
Data unavailable
No development completed in monitoring period
To encourage energy efficiency, sustainable drainage, waste minimisation and provision of renewable energy within the area
Number of homes and buildings built to Ecohomes/ BREEAM standards
Data unavailable
No development completed in monitoring period
To ensure a well-connected and accessible development
Creation of new vehicular and pedestrian routes into the development
Data unavailable
No development completed in monitoring period
To create an attractive development of local distinctiveness and character
Number of Reserved Matters Applications approved
2 new reserved matters applications for a total of 70 dwellings
2 new reserved matters applications for 209 dwellings
To value and protect the
Creation of integrated network of open space
Development not yet carried
No development
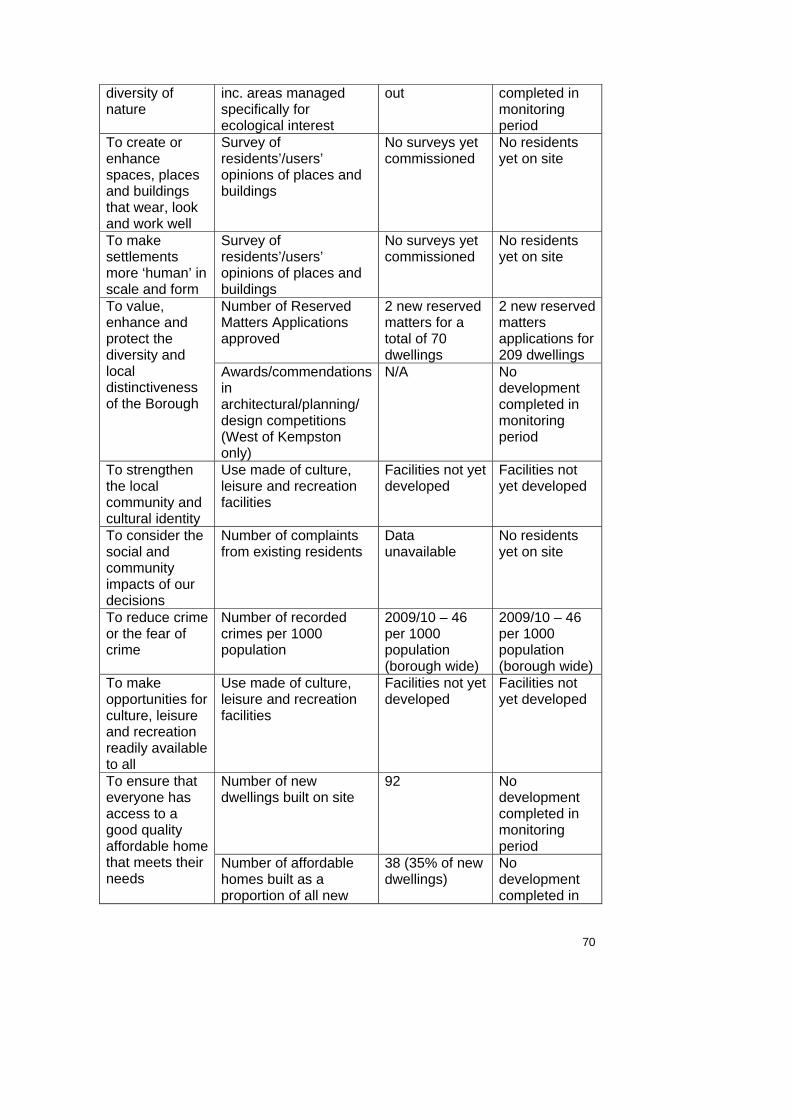
70
diversity of nature
inc. areas managed specifically for ecological interest
out completed in monitoring period
To create or enhance spaces, places and buildings that wear, look and work well
Survey of residents’/users’ opinions of places and buildings
No surveys yet commissioned
No residents yet on site
To make settlements more ‘human’ in scale and form
Survey of residents’/users’ opinions of places and buildings
No surveys yet commissioned
No residents yet on site
Number of Reserved Matters Applications approved
2 new reserved matters for a total of 70 dwellings
2 new reserved matters applications for 209 dwellings
To value, enhance and protect the diversity and local distinctiveness of the Borough
Awards/commendations in architectural/planning/ design competitions (West of Kempston only)
N/A No development completed in monitoring period
To strengthen the local community and cultural identity
Use made of culture, leisure and recreation facilities
Facilities not yet developed
Facilities not yet developed
To consider the social and community impacts of our decisions
Number of complaints from existing residents
Data unavailable
No residents yet on site
To reduce crime or the fear of crime
Number of recorded crimes per 1000 population
2009/10 – 46 per 1000 population (borough wide)
2009/10 – 46 per 1000 population (borough wide)
To make opportunities for culture, leisure and recreation readily available to all
Use made of culture, leisure and recreation facilities
Facilities not yet developed
Facilities not yet developed
Number of new dwellings built on site
92 No development completed in monitoring period
To ensure that everyone has access to a good quality affordable home that meets their needs
Number of affordable homes built as a proportion of all new
38 (35% of new dwellings)
No development completed in

71
dwellings monitoring period
To create a vibrant local economy
Number of jobs created by the development
Data unavailable
Data unavailable
Indicator L31
6.12 The following indicators were identified in the Community Safety
Design Guide SPD adopted in November 2006. SPD objectives Associated
targets Indicators Progress
To assist in planning out crime within existing and new developments
Lower recorded crime levels
a) Borough crime levels
Total number of recorded crimes: 07/08 = 13,279 08/09 = 11,611 09/10 = 11,956 An increase of 345 Recorded crime rate comparator offences per 1000 population: 07/08 = 52 08/09 = 45 09/10 = 46
To help ensure that all parties work effectively in partnership at both the strategic and local level
Use of SPD in planning decisions
b) Number of planning permissions in which SPD conditions are used
20 decisions stated policy BE45 in the decision
Every opportunity is taken to create sustainable new communities
Decrease fear of crime in Borough
c) Fear of crime levels
Fear of crime levels –According to the Place Tracker Survey undertaken by the Borough Consultation Team 2009/10, when asked the question ‘How safe or unsafe do you feel when outside in the borough after dark?’ 36.4% of respondents (out of 955) said they felt safe.
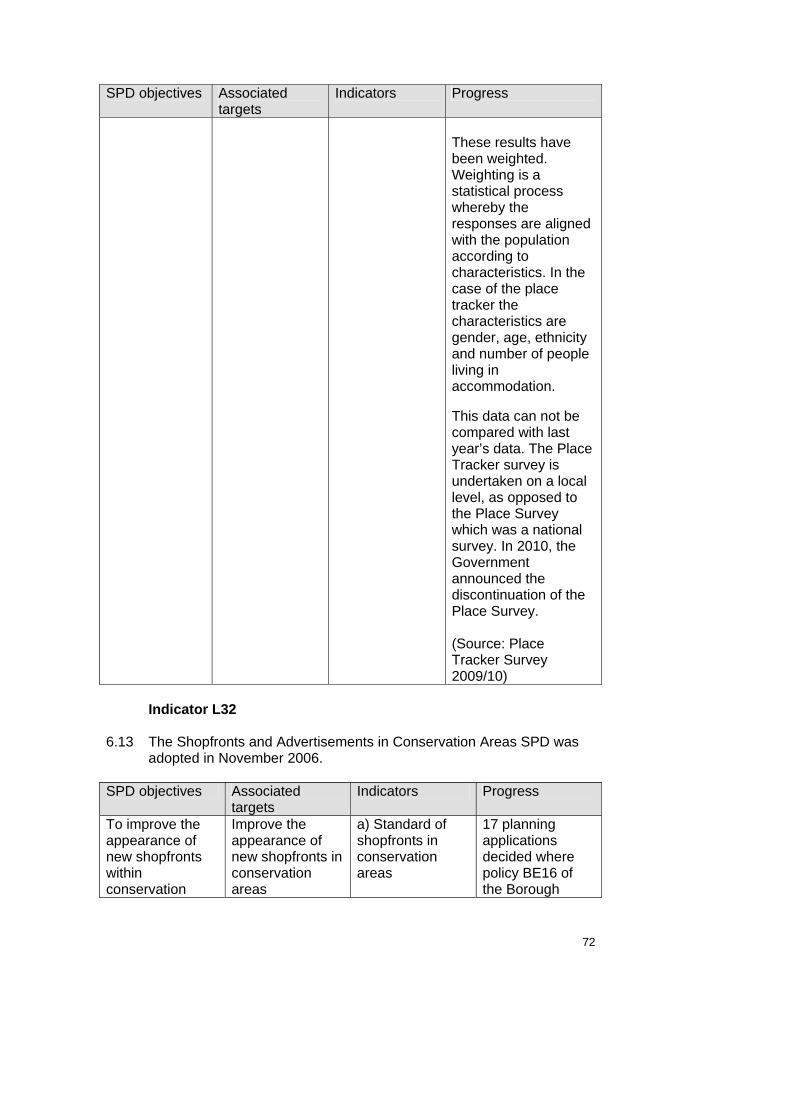
72
SPD objectives Associated targets
Indicators Progress
These results have been weighted. Weighting is a statistical process whereby the responses are aligned with the population according to characteristics. In the case of the place tracker the characteristics are gender, age, ethnicity and number of people living in accommodation. This data can not be compared with last year’s data. The Place Tracker survey is undertaken on a local level, as opposed to the Place Survey which was a national survey. In 2010, the Government announced the discontinuation of the Place Survey. (Source: Place Tracker Survey 2009/10)
Indicator L32
6.13 The Shopfronts and Advertisements in Conservation Areas SPD was
adopted in November 2006. SPD objectives Associated
targets Indicators Progress
To improve the appearance of new shopfronts within conservation
Improve the appearance of new shopfronts in conservation areas
a) Standard of shopfronts in conservation areas
17 planning applications decided where policy BE16 of the Borough

73
SPD objectives Associated targets
Indicators Progress
areas, where they are introduced into historic areas or old buildings
Local Plan was used, 10 approved 3 refused and 4 split decisions, approving that part of the application that does not conflict with the policy and refusing that part which does. The SPD was referred to in 16 of the above 17 applications
Encourage a higher standard of shopfronts on newer buildings
Improve standard of shopfronts on newer buildings
b) Standard of shopfronts on new buildings
No new retail units were completed in the Bedford conservation area in the monitoring period.
New advertisements should respect the character and style of the building and the area in question, in terms of design, materials and location.
Improve advertisements in terms of respecting local character, design, materials and location
c) Standard of new advertisements
30 planning advertisement applications decided where SPD is used, 18 approved, 6 refused and 6 split decisions, with approval granted to parts of the application deemed appropriate and refusal recommended for those parts deemed not appropriate.
6.14 The above information shows that the SPD is being used to negotiate
with developers on applications for shopfronts and adverts. Of the 16 applications that were submitted where the SPD was referred to, 3 were refused consent with a further 4 received a split decision.

74
Inappropriate developments are being refused where proposals are not in compliance with the adopted SPD. Indicator L33
6.15 The SCI was adopted in May 2006. The monitoring of the SCI will focus upon how effective the document is in community engagement in planning activities. The relevant indicators and targets are set out below.
Aim Target Indicator Progress Community engagement practices in accordance with the SCI
100% of adopted DPDs and SPDs produced in accordance with the SCI.
a) % of adopted DPDs and SPDs produced in accordance with SCI
No DPDs or SPDs were adopted in the monitoring period. Consultation took place on a draft Strategy for Bedford High Street in February 2010 and in accordance with the SCI.
More pre-application discussions
Pre-application discussions with ‘enquiries’ planning officer increasing
b) Number of pre-application discussions with ‘enquiries’ planning officer
Phone enquiries 2641 (2624 in 2008/09, an increase of 17) Desk enquiries 920 (992 in 2008/09, a decrease of 72 Preapp enquiries 164
Effective consultation in relation to planning documents
Questionnaire to random respondents regarding effectiveness of the SCI following adoption of a DPD
c) % of people happy with consultation on a DPD following adoption of that DPD
During the monitoring period, consultation occurred on a draft of the Strategy for Bedford High Street. A ‘further information’ consultation also took place in May 2009, requesting additional information on sites submitted as part of the previous year’s ‘call for sites’ on the Allocations and Designations Plan. Planning workshops were held to provide information to local councils and Members on the

75
Aim Target Indicator Progress progress of the Allocations and Designations Plan. A survey of attendees after demonstrated that when asked the question ‘Overall, how would you rate the workshop?’ 68% responded with ‘4’ or ‘5’ (where 5 is highest and 1 is lowest).
Pre-application consultation
Increase pre-application consultation by applicants of ‘major’ schemes
d) % of major schemes undertaking pre-application consultation
There have been 806 preapp enquiries – no distinction is made at the preapp stage on if any resulting application will be major or minor
Reaching ‘hard to reach’ groups
Increase the involvement of hard to reach groups in planning policy consultations
e) % response rates from hard to reach groups
No surveys were undertaken in the monitoring period.
Effective consultation in relation to planning applications
Annual questionnaire to parish councils and random respondents regarding effectiveness of the consultation on planning applications
f) % of people happy with consultation on planning applications
No surveys were completed in the monitoring period.

76
Indicator L34
6.16 The Core Strategy and Rural Issues Plan was adopted in April 2008. Data below reports on those indicators in the Plan that are not reported on through existing Local Indicators.
Aim Target Indicator Progress
To increase the number of jobs created in the Rural Policy Area
Jobs created in the Rural Policy Area
People employed in RPA: Year Employees
(Annual Business Survey)
Self Employed (43%* x
EEFM Self Employed
Totals)
Total Jobs
2008 14,900 4,600 19,5002007 14,100 4,600 19,0002006 14,600 4,600 19,2002005 14,600 4,500 19,1002004 13,200 4,500 17,1002003 12,400 4,200 16,6002002 13,000 4,000 17,0002001 12,600 3,900 16,500
To decrease proportion of development in Rural Policy Area outside Key Service Centres
Proportion of development in the Rural Policy Area outside of Key Service Centres
Housing – 17 completions (net) = 32.7% of housing completions in the RPA outside key service centres. Employment – 1,321 sq.m, 0.61ha (net) = 100% of employment gain in the RPA outside key service centres.
Encourage key rural communities to become more sustainable places to live and work
To maintain services in the Rural Policy Area
Level of services in the Rural Policy Area
Indicator L11 shows that 71% of rural households are within a 13 minute walk of an hourly bus service. There has been a small net gain of employment space in the RPA and all leisure (D2) completions were in the RPA this year. (Indicator BD4)
Provide a mechanism for the delivery of infrastructure in tandem with new development
To provide additional/improved infrastructure, amenities or facilities where development would create additional need for services
Completed infrastructure schemes secured from planning permission legal agreements
Finance received 09/10 Highways and Public Transport - £81,197 Education - £952,996 Green Infrastructure - £324,035 Information on money spent in the monitoring period is in the table below.
Protect and enhance the
To highlight the Borough’s rich
Income from tourism as a
Total Tourism Value for 2008 is calculated at £220,180,000 based upon Economic Impact

77
Aim Target Indicator Progress Borough’s built, cultural and community assets and the character of settlements and foster the development of the Borough as a destination for heritage and cultural tourism
heritage and cultural assets as a place of interest and a destination for tourism
% of total GDP
of Tourism Report 2008.
Involve the community in the decisions about the planning of the borough so they can influence and shape such decisions
Ensure opportunities for members of the community to be involved in the planning and plan-making processes
Number of respondents to planning consultations
A draft Strategy for Bedford High Street was consulted on in February 2010. 110 responses were received from those directly consulted. A further 569 responses were received from the Citizens Panel Winter 2009 survey, which contained questions on the High Street.
S106 money spent in the monitoring period Contribution type Money spent Project used towards Education £134,000 Sharnbrook Upper
School Science lab £200,000 Wixams village 1 lower
school £40,000 Margaret Beaufort
Middle school IT facilities
£56,680 Lincroft Middle school, staff room extension etc.
£430,680.00
Transport /misc.
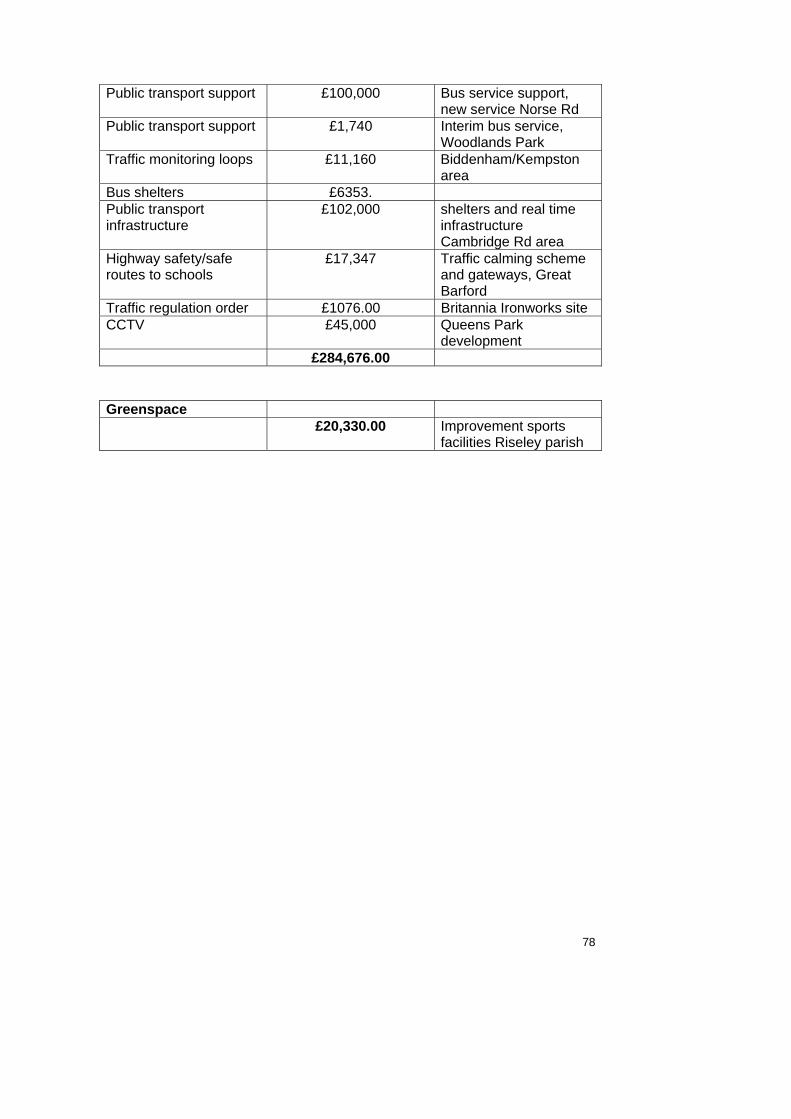
78
Public transport support £100,000 Bus service support, new service Norse Rd
Public transport support £1,740 Interim bus service, Woodlands Park
Traffic monitoring loops £11,160 Biddenham/Kempston area
Bus shelters £6353. Public transport infrastructure
£102,000 shelters and real time infrastructure Cambridge Rd area
Highway safety/safe routes to schools
£17,347 Traffic calming scheme and gateways, Great Barford
Traffic regulation order £1076.00 Britannia Ironworks site CCTV £45,000 Queens Park
development £284,676.00
Greenspace £20,330.00 Improvement sports
facilities Riseley parish

79
Indicator L35
6.17 The Town Centre Area Action Plan was adopted in October 2008. Data below reports on those indicators in the Plan that are not reported on through existing Local Indicators.
Aim Target Indicator Progress
To help mitigate any effect of increased demand on the road network following development of the town centre
Junction improvements completed
No junction improvements have been completed in the monitoring period.
To reduce town centre congestion and improve accessibility to the town centre.
Number of river crossings delivered
No river crossings were delivered in the monitoring period
To improve access to the town centre through the provision of new public transport interchanges, new highway infrastructure, public transport priority, when feasible, the use of park and ride facilities for pedestrians, cyclists, taxis and private hire vehicles. Where and when highway capacity can be increased, priority should be given to modes other than private cars.
To provide further Park & Ride facilities to reduce town centre traffic congestion and encourage greater use of public transport. To contribute to greener/ more sustainable methods of transport.
Park & Ride facilities operational
Elstow Park and Ride service has been operational since November 2005. The provision of Park and Ride facilities are to be reviewed as part of the review of the Local Transport Plan.
To achieve a significant growth in town centre living in order to enhance the vitality and viability of the centre
To increase housing completions within the town centre area, providing a mix and range of housing types, tenures and sizes
No. of housing units completed in the Plan area
15 completed
To ensure that To provide Level of No infrastructure

80
new development and other partner agencies contribute to the delivery of the Council’s strategy for the town centre as a whole, including the provision of infrastructure.
sufficient levels of affordable housing, landscaping, highway and public transport improvements to account for the impact of development in the town centre and the wider area.
infrastructure improvements secured by means of condition/ S106 agreements or town centre/Plan area sites
improvements were secured through S106 or other conditions relating to the town centre in the monitoring period.

81
7. Significant Effects Indicators 7.1 The purpose of significant effects indicators is to assess the effects of
policy implementation on sustainability. The monitoring of ‘significant environmental effects of the implementation of each plan’ is a requirement of the Environmental Assessment of Plans and Programmes Regulations 2004. In addition to the assessment of environmental effects, the overall sustainability of policies i.e. their environmental, social and economic impact, is assessed during the production of each policy document. This is called the Sustainability Appraisal. As each document is produced, the Sustainability Appraisal develops objectives, targets and indicators for how the policies will be monitored within the Annual Monitoring Report. These indicators enable a comparison to be made between the predicted effects of the policies and their actual effects measured during the plan’s implementation.
7.2 Significant Effects Indicators will be derived from the Sustainability
Appraisals. The objectives of the Sustainability Appraisal will have indicators, and will be monitored. In addition, indicators will also be identified where a sustainability appraisal has predicted: • Significant sustainability effects that may give rise to irreversible
damage, with a view to identifying trends before such damage is caused; or
• Significant effects where there was uncertainty in the SA and where monitoring would enable preventative or mitigation measures to be taken.
7.3 The significant effects indicators will cover all the plans that form the
Bedford Development Framework, not each different document individually. Also, monitoring can cover all plans that are covered by the Environmental Assessment of Plans and Programmes Regulations 2004 (such as the Housing Strategy), and their monitoring can be included in the AMR.
7.4 The level of information required for the indicators will depend upon the
characteristics and level of detail of the plan and the forecasted effects.

82
PART 3
8. Future Monitoring 8.1 For this and future reports to be successful in their monitoring, the
indicators chosen should provide sufficient information to assess policy implementation and its significant effects, having regard to available resources. This is the key to the development of the indicators.
8.2 A review of the Contextual Indicators last year saw the vast majority
saved to provide an overview of the borough as it is in the monitoring period. However, one indicator was removed (number of unfit dwellings) due to the information for this indicator no longer being available.
8.3 Output indicators will be reviewed on a regular basis. Indicators will,
where possible, reflect the reporting period 1st April to 31st March. Where a target or indicator is not quantifiable, qualitative information will be used.
8.4 The significant effects indicators will be updated every time a
Sustainability Appraisal is published following the adoption of a document in the Bedford Development Framework. The Final Sustainability Appraisal will also set out how the predicted significant effects of the policies in the DPD will be monitored using the significant effects indicators. The indicators will be used to assess whether the predicted sustainability effects were accurate, whether the policies are contributing to the achievement of the sustainability objectives and targets and whether mitigation measures are successful. Adverse effects will be noted in the annual monitoring report and remedial action proposed if necessary.
8.5 Monitoring arrangements for Development Plan Documents (DPD) are
only finalised once a document is adopted. As such, no monitoring of a Development Plan Document can be done until it is adopted. The Council will involve stakeholders in the development of indicators and targets during the production of the DPD. This will ensure community involvement in the development of the monitoring framework.
8.6 It is recognised that the objectives and targets set out in the Bedford
Development Framework (BDF) and the Sustainability Appraisals will only be achieved as a result of a complex interaction between different policies, circumstances and delivery agents. Also, the policies in the BDF and the process of producing the documents may also influence other policy makers and delivery agents. In such circumstances, qualitative information (surveys, focus groups etc) will be useful.
8.7 Over the medium term (3-5 years) analysis can begin of the output
indicators to examine patterns and directions of change (i.e. trend analysis). Over the longer term (5-10 years) trend analysis can be

83
developed to assess the extent to which baseline indicators, established at the beginning of the production of the Bedford Development Framework, have changed. Also, comparison will be made between the trends in contextual indicators and changes in the other indicators. This will assess the degree to which policy implementation is helping achieve wider policy goals such as the creation of sustainable communities.
8.8 Benchmarking will be used to compare performance with other
authorities. In the Milton Keynes and South Midlands Sub-Regional Strategy area, other authorities within the sub-area will be used as benchmarking authorities. Other authorities with similar characteristics (such as other authorities with both an urban and rural population) will also be relevant benchmarks.
8.9 Indicator bundles may also be used for specific topic themes, such as
housing, the environment or employment, to give a profile of the Borough and provide baseline information for individual documents. For example, for a housing allocations development plan document, all housing indicators would be collated to provide a summary of housing information and progress against relevant targets.
8.10 The Borough’s AMR will be a useful source of information for the
Borough Council itself, other local agencies and the regional planning body. The Council will develop links with the monitoring of the Borough’s Community Plan to ensure the sharing of information and efficient use of resources.
8.11 The report has highlighted the need for further information to be
included in the next AMR. The following is a list of those additions identified:
• Continue to refine the collection of B1 information to reflect the B1(a), B1(b) and B1(c) split.
• Continue to consider how improvements can be made to the way information is collected to show the effectiveness of consultation and how ‘hard to reach groups’ are engaged in the planning process.
8.12 Future monitoring will be done on an annual basis and reported on in
future annual monitoring reports. Contextual indicators will be updated as information becomes available, in particular, further information will be sought for the distinct policy areas of the Growth Area and the Rural Policy Area. Output indicators and significant effects indicators will be updated as and when Local Development Documents are adopted and Sustainability Appraisals completed.
8.13 Future annual monitoring reports will examine patterns and trends in
the indicators. This will assess the degree to which policy and sustainability objectives are being achieved.

84
Glossary Term Explanation Adoption Statement Statement produced by the Borough
Council when a document is adopted which sets out how the sustainability appraisal and consultation influenced the preparation of the document.
AMR Annual Monitoring Report. Bedford Development Framework A collection of documents that contain
the spatial planning policies for the Borough. The documents will replace the policies in the Local Plan.
Contextual Indicators Set of indicators that show the social, economic and environmental circumstances that exist within the Borough.
Core Output Indicators Set of indicators that are used to measure the implementation of planning policies. The indicators are the same for each Local Authority.
Commencement of Production When the production of a document begins.
Development Plan Document (DPD) Spatial planning documents that are subject to independent examination and form part of the development plan for the Borough (along with the Regional Spatial Strategy).
Examination Examination of a submitted document by an independent inspector to consider whether the document in ‘sound’.
Elementary Occupations Unskilled and/or routine occupations Growth Area Bedford, Kempston and the northern
Marston Vale portion of Bedford Borough.
Government Office for the Eastern Region
Regional Government Office to which the Annual Monitoring Report is submitted by December 31st each year.
Housing Trajectory A graph that shows the past and anticipated supply of housing over the life-span of a Development Plan Document.
Local Development Scheme Sets out the programme for preparing documents that will be included in the Bedford Development Framework.
Local Development Orders A Local Development Order is made by a planning authority in order to
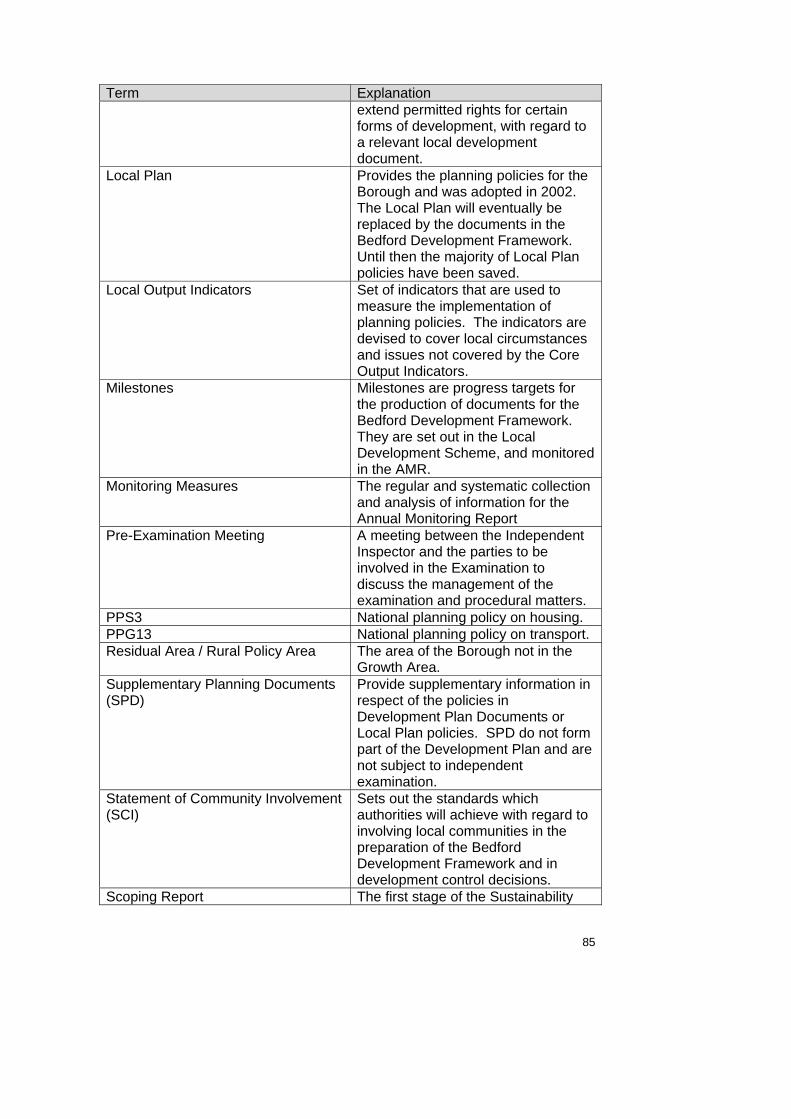
85
Term Explanation extend permitted rights for certain forms of development, with regard to a relevant local development document.
Local Plan Provides the planning policies for the Borough and was adopted in 2002. The Local Plan will eventually be replaced by the documents in the Bedford Development Framework. Until then the majority of Local Plan policies have been saved.
Local Output Indicators Set of indicators that are used to measure the implementation of planning policies. The indicators are devised to cover local circumstances and issues not covered by the Core Output Indicators.
Milestones Milestones are progress targets for the production of documents for the Bedford Development Framework. They are set out in the Local Development Scheme, and monitored in the AMR.
Monitoring Measures The regular and systematic collection and analysis of information for the Annual Monitoring Report
Pre-Examination Meeting A meeting between the Independent Inspector and the parties to be involved in the Examination to discuss the management of the examination and procedural matters.
PPS3 National planning policy on housing. PPG13 National planning policy on transport. Residual Area / Rural Policy Area The area of the Borough not in the
Growth Area. Supplementary Planning Documents (SPD)
Provide supplementary information in respect of the policies in Development Plan Documents or Local Plan policies. SPD do not form part of the Development Plan and are not subject to independent examination.
Statement of Community Involvement (SCI)
Sets out the standards which authorities will achieve with regard to involving local communities in the preparation of the Bedford Development Framework and in development control decisions.
Scoping Report The first stage of the Sustainability

86
Term Explanation Appraisal.
Section 106 Agreement (s106) Section 106 Agreements are legal agreements that secure community infrastructure to meet the needs of residents in new developments and/or to mitigate the impact of new developments upon existing community facilities.
Sustainability Appraisal Tool for appraising policies to ensure they reflect sustainable development objectives (i.e. social, environmental and economic factors) and required to be undertaken for Development Plan Document and in certain cases Supplementary Planning Documents.
Significant Effects Indicators Set of indicators linked to the sustainability appraisal objectives and indicators, used to monitor the significant effects of the implementation of policy.
Strategic Environmental Assessment Regulations
Requires the environmental assessment of certain plans and programmes including those in the field of planning and land use.
Submission of Development Plan Document
The point at which a Development Plan Document is submitted to the Secretary of State and published for public consultation for six weeks.
Super Output Areas (SOA) SOAs were introduced in 2004 as a new geography for the collection of small area statistics (such as indices of deprivation). Due to ward sizes and populations varying to large degrees, SOAs were created to provide greater consistencies in size and boundary stability for comparison purposes.
Town Centre Uses Refers to land uses classified as A1 (shops), A2 (Financial and Professional Services), B1 (a) (Offices, other than a use within Class A2) and D2 (Assembly and leisure).
Use Classes Order A list of land-use classes. Each land-use (e.g. housing, retail, employment etc) falls within a ‘class’, either A, B, C, D or sui generis.

87
Appendix A: Progress against Local Development Scheme Milestones

88
Appendix B: Contextual Indicators
Indicator Output Comment Unit Time Frame Source Population Characteristics Con1 Population Total population 158,000
up 2,300 from 2008
Count Mid 2009 estimate
Bedford Borough Council
0-4 9,800 Up 200 from 2008
Count Mid 2009 estimate
Bedford Borough Council
5-9 9,100 Down 100 from 2008
Count Mid 2009 estimate
Bedford Borough Council
10-14 10,000 Down 100 from 2008
Count Mid 2009 estimate
Bedford Borough Council
15-19 10,200 Up 100 from 2008
Count Mid 2009 estimate
Bedford Borough Council
20-24 9,600 Up 100 from 2008
Count Mid 2009 estimate
Bedford Borough Council
25-29 10,000 Up 400 from 2008
Count Mid 2009 estimate
Bedford Borough Council
30-34 10,300 Up 200 from 2008
Count Mid 2009 estimate
Bedford Borough Council
35-39 11,800 Up 100 from 2008
Count Mid 2009 estimate
Bedford Borough Council
40-44 12,600 Up 100 from 2008
Count Mid 2009 estimate
Bedford Borough Council
45-49 11,800 Up 400 from 2008
Count Mid 2009 estimate
Bedford Borough Council
50-54 10,000 Up 300 from 2008
Count Mid 2009 estimate
Bedford Borough Council
Con2 Age Structure
55-59 9,100 Down 100 from 2008
Count Mid 2009 estimate
Bedford Borough Council

89
Indicator Output Comment Unit Time Frame Source 60-64 9,200 Up 300 from
2008 Count Mid 2009
estimate Bedford Borough Council
65-69 6,700 Up 200 from 2008
Count Mid 2009 estimate
Bedford Borough Council
70-74 5,900 Up 100 from 2008
Count Mid 2009 estimate
Bedford Borough Council
75-79 4,700 Down 100 from 2008
Count Mid 2009 estimate
Bedford Borough Council
80-84 3,700 Up 100 from 2008
Count Mid 2009 estimate
Bedford Borough Council
85-89 2,300 Same as 2008 Count Mid 2009 estimate
Bedford Borough Council
90 and over 1,100 Same as 2008 Count Mid 2009 estimate
Bedford Borough Council
Con3 Births Live births 2,162
up 52 from 2008
Count 2009 ONS
Con4 Deaths 1,333
Down 265 from 2008/09
Count 2009 ONS
Con5 Migration Total migration in/out of Borough
+200 down 100 from 2005/06
Count 2005/06 ONS
White 86.98 % 2001 Census 2001 Mixed 1.97 % 2001 Census 2001 Asian or Asian British 7.74 % 2001 Census 2001 Black or Black British 2.60 % 2001 Census 2001
Con6 Ethnicity
Chinese or other ethnic group
0.70 % 2001 Census 2001
Housing and built environment Con7 Number of households
Total number of households 64,600 Down 900 from 2007
Count 2010 estimate
BBC Population Estimates and

90
Indicator Output Comment Unit Time Frame Source Forecasts 2010
Con8 Average household size
2.39 Persons 2006 BCC Population Estimates and Forecasts 2009
Con9 Local Authority dwelling stock
Large scale voluntary transfer stock
7,500 Count (approximately)
December 2005
BPHA
Total stock 65,820 Up 985 from April 200
Count April 2009 ONS
Owner occupied and private rented
54,532 Up 882 from April 2008
Count April 2009 ONS
Local Authority Stock 0 Same as April 2008
Count April 2009 ONS
RSL Stock 10,828 Down 103 from April 2008
Count April 2009 ONS
Con10 Dwelling tenure
Other public sector 460 Same as April 2008
Count April 2009 ONS
Detached 27.66 % 2001 Census 2001 Semi-detached 32.65 % 2001 Census 2001 Terrace 22.62 % 2001 Census 2001 Purpose built block of flats or tenement
10.33 % 2001 Census 2001
Part of a converted or shared house (inc. bedsits)
4.97 % 2001 Census 2001
In commercial building 0.83 % 2001 Census 2001
Con11 Household type
Caravan or other mobile or temporary structure
0.93 % 2001 Census 2001
Detached 287,859 £ April 09-March 10
Land Registry website
Con12 Average house price
Semi-detached 156,281 £ April 09-March 10
Land Registry website

91
Indicator Output Comment Unit Time Frame Source Terraced 125,031 £ April 09-
March 10 Land Registry website
Flat/maisonette 79,896 £ April 09-March 10
Land Registry website
Economy Con13 Working age people
Population of working age (16-64 men and 16-59 women)
97,900 Up 300 from 2008
Count 2009 ONS mid year estimate on Nomis
Con14 Economic activity rates
Economically active persons
82,800
Up 2,900 from 2008/09
Count April 2009 – March 2010
Annual Population Survey 2009/10
Con15 VAT registered businesses by number of persons employed
0-4 persons employed 4,215 Down 125 from 2009
Count March 10 Counts of VAT based enterprises by employment size band Mar 10 (UK Business Activity, Size and Location 2010 publication)

92
Indicator Output Comment Unit Time Frame Source 5-9 persons employed 660 Down 5 from
2009 Count March 10 Counts of VAT
based enterprises by employment size band Mar 10 (UK Business Activity, Size and Location 2010 publication)
10-19 persons employed 315 Same as 2009 Count March 10 Counts of VAT based enterprises by employment size band Mar 10 (UK Business Activity, Size and Location 2010 publication)

93
Indicator Output Comment Unit Time Frame Source 20+ persons employed 265 Down 10 from
2009 Count March 10 Counts of VAT
based enterprises by employment size band Mar 10 (UK Business Activity, Size and Location 2010 publication)
Total 5,455 Down 140 from 2009
Count March 2010 Counts of VAT based enterprises by employment size band Mar 10 (UK Business Activity, Size and Location 2010 publication)
Con16 Enterprise Births Deaths and Survivals
Births of new enterprises 690 Down 20 from 2007
Count 2008 ONS – Business Demography, Enterprise Births, Deaths and Survivals 2008

94
Indicator Output Comment Unit Time Frame Source Deaths of enterprises 555 Down 5 from
2007 Count 2008 ONS – Business
Demography, Enterprise Births, Deaths and Survivals 2008
Count of active enterprises 6330 Up 345 from 2007
Count 2008 ONS – Business Demography, Enterprise Births, Deaths and Survivals 2008
70,800
Up 1,300 from 2007
Count 2008
Full time 48,100
Down 200 from 2007
Count 2008
Con17 Total employee jobs
Part time 22,700
Up 1,500 from 2007
Count 2008
Nomis – Annual Business Inquiry Employee Analysis
Managers and senior officials
12,800 Down 200 from 2008/09
Count April 2009 – March 2010
Annual Population Survey 2009/10
Professional occupations 11,400 Up 300 from 2008/09
Count April 2009 – March 2010
Annual Population Survey 2009/10
Associate professional and technical
9,800 Up 1,400 from 2008/09
Count April 2009 – March 2010
Annual Population Survey 2009/10
Con18 Employment by occupation
Administrative and secretarial
7,300 Up 500 from 2008/09
Count April 2009 – March 2010
Annual Population Survey 2009/10

95
Indicator Output Comment Unit Time Frame Source Skilled trade occupations 6,100 Down 1,800
from 2008/09 Count April 2009 –
March 2010 Annual Population Survey 2009/10
Personal service occupations
5,100 Up 100 from 2008/09
Count April 2009 – March 2010
Annual Population Survey 2009/10
Sales and customer service occupations
6,500 Down 3,500 from 2008/09
Count April 2009 – March 2010
Annual Population Survey 2009/10
Process plant and machine operatives
5,400 Up 2,400 from 2008/09
Count April 2009 – March 2010
Annual Population Survey 2009/10
Elementary occupations 13,600 Up 4,800 from 2008/09
Count April 2009 – March 2010
Annual Population Survey 2009/10
Manufacturing 8.0 Down 0.9% since 2007
% 2008 Nomis
Construction 6.0 Up 0.4% since 2007
% 2008 Nomis
Distribution, hotels and restaurants
25.4 Up 1.9% since 2007
% 2008 Nomis
Transport and Communications
6.1 Up 0.4 since 2007
% 2008 Nomis
Finance, IT and other business
18.0 Down 1.3% since 2007
% 2008 Nomis
Public Administration, education and health
31.6 Down 0.2% since 2007
% 2008 Nomis
Other Services 4.0 Down 0.3% since 2007
% 2008 Nomis
Con19 Employment by sector of total employee jobs
Tourism related 5.8 Same as 2007 % 2008 Nomis
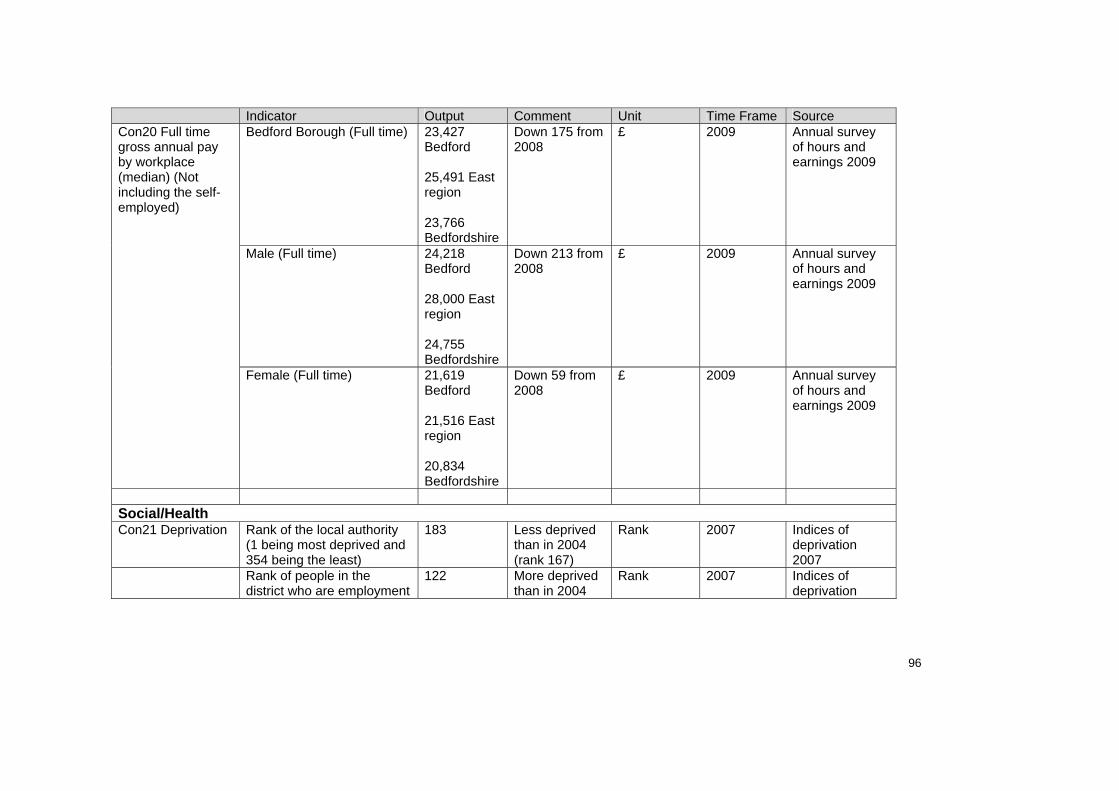
96
Indicator Output Comment Unit Time Frame Source Bedford Borough (Full time) 23,427
Bedford 25,491 East region 23,766 Bedfordshire
Down 175 from 2008
£ 2009
Annual survey of hours and earnings 2009
Male (Full time) 24,218 Bedford 28,000 East region 24,755 Bedfordshire
Down 213 from 2008
£ 2009
Annual survey of hours and earnings 2009
Con20 Full time gross annual pay by workplace (median) (Not including the self-employed)
Female (Full time) 21,619 Bedford 21,516 East region 20,834 Bedfordshire
Down 59 from 2008
£ 2009
Annual survey of hours and earnings 2009
Social/Health Con21 Deprivation
Rank of the local authority (1 being most deprived and 354 being the least)
183 Less deprived than in 2004 (rank 167)
Rank 2007 Indices of deprivation 2007
Rank of people in the district who are employment
122 More deprived than in 2004
Rank 2007 Indices of deprivation

97
Indicator Output Comment Unit Time Frame Source deprived (1 being most deprived and 354 being the least)
(rank 131) 2007
Rank of the number of people in the district who are income deprived (1 being most deprived and 354 being the least)
107 More deprived in 2007 than in 2004 (rank 112)
Rank 2007 Indices of deprivation 2007
Super Output Areas (SOA) amongst the top 10% most deprived in the country (1=most deprived)
Castle (ID 471) – 1618 Harpur (ID 502) – 2205 Cauldwell (ID 477) - 2593
Ranks in 2004: Cauldwell – 2109 Castle – 2185 Kingsbrook – 2946 Harpur - 2009
Rank out of 32482
2007 Indices of Deprivation for Super Output Areas 2007 (Beds C.C.)
Number of unemployed people
4,700 Down 1,800 from 2008/09
Count April 2009 – March 2010
Annual Population survey 2009/10
Con22 Unemployment
% unemployed 5.8 Down 2.6% from 2008/09
% April 2009 – March 2010
Annual Population survey 2009/10
Number of claimants 4,166 (3,725)
Up 78 from April 2009
Count April 2010 (Aug 2010)
ONS Claimant Count
Duration of claim – up to 6 months
2,615 (2,405)
Down 510 from April 2009
Count April 2010 (Aug 2010)
ONS Claimant Count
Con23 Job Seekers Allowance claimants
Duration of claim – over 6 up to 12 months
885 (735)
Up 245 from April 2009
Count April 2010 (Aug 2010)
ONS Claimant Count

98
Indicator Output Comment Unit Time Frame Source Duration of claim – over 12 months
655 (580)
Up 345 from April 2009
Count April 2010 (Aug 2010)
ONS Claimant Count
Recorded crime rate comparator offences per 1000 population
46 Up 1 from 08/09 National average is 45
Offences per 1000 population
2009/10 Home Office Crime Statistics
Con24 Crime
Domestic burglaries per 1000 population
6 Up 1 from 08/09 National average is 5
Offences per 1000 population
2009/10 Home Office Crime Statistics
Males 78.58 (England 77.93)
Up 0.18 from 2005-7
Years Jan 06-Dec 08
ONS Con25 Life expectancy at birth
Females 82.13 (England 82.02)
Up 0.13 from 2005-7
Years Jan 06-Dec 08
ONS
Education
No Qualifications 11.6 Down 0.2 from 2008
% Jan-Dec 09 Annual population survey 2009
Con26 Qualifications by working age
Other Qualifications 11.1 Down 3.6 from 2008
% Jan-Dec 09 Annual population survey 2009

99
Indicator Output Comment Unit Time Frame Source NVQ1 and above 77.3 Up 3.8 from
2008 % Jan-Dec 09 Annual
population survey 2009
NVQ2 and above 64.3 Up 5.5 from 2008
% Jan-Dec 09 Annual population survey 2009
NVQ3 and above 47.9 Up 4.8 from 2008
% Jan-Dec 09 Annual population survey 2009
NVQ4 and above 30.5 Up 4.3 from 2008
% Jan-Dec 09 Annual population survey 2009
Bedford High School 99 (97) Up 3 from 2008 % 2009 DCSF Achievement and Attainment Tables
Bedford Modern 100 (-) Same as 2008 % 2009 DCSF Achievement and Attainment Tables
Bedford School 100 (87) Up 1 from 2008 % 2009 DCSF Achievement and Attainment Tables
Con27 People achieving 5 or more GCSEs at grades A* to C by school (brackets show 5 grades A* to C inc English and Maths)
Biddenham Upper School 55 (37) Down 2 from 2008
% 2009 DCSF Achievement and Attainment Tables

100
Indicator Output Comment Unit Time Frame Source Dame Alice Harpur School 98 (97) Down 1 from
2008 % 2009 DCSF
Achievement and Attainment Tables
Hastingsbury Upper School and Business and Enterprise College
55 (39) Up 13 from 2008
% 2009 DCSF Achievement and Attainment Tables
John Bunyan Upper School 72 (20) Up 37 from 2008
% 2009 DCSF Achievement and Attainment Tables
Mark Rutherford Upper School
69 (49) Up 8 from 2008 % 2009 DCSF Achievement and Attainment Tables
Rushmoor School 89 (69) Down 3 from 2008
% 2009 DCSF Achievement and Attainment Tables
Sharnbrook Upper School 84 (70) Up 3 from 2008 % 2009 DCSF Achievement and Attainment Tables
St Andrew’s School 100 (78) Up 23 from 2008
% 2009 DCSF Achievement and Attainment Tables

101
Indicator Output Comment Unit Time Frame Source St Thomas More Catholic School
67 (46) Up 1 from 2008 % 2009 DCSF Achievement and Attainment Tables
Wootton Upper School 78 (60) Down 8 from 2008
% 2009 DCSF Achievement and Attainment Tables
Transport/Spatial connectivity
Underground, metro, light rail, tram
0.12 % 2001 Census 2001
Train 3.89 % 2001 Census 2001 Bus, mini bus, coach 4.39 % 2001 Census 2001 Motorcycle, scooter, moped 0.83 % 2001 Census 2001 Driving a car or van 60.37 % 2001 Census 2001 Passenger in a car or van 5.94 % 2001 Census 2001 Taxi or minicab 0.33 % 2001 Census 2001 Bicycle 4.57 % 2001 Census 2001 On foot 9.64 % 2001 Census 2001
Con28 Mode of travel to work
Other 0.46 % 2001 Census 2001 Works from home 9,571 Count 2001 Census 2001 Less than 2km 15,545 Count 2001 Census 2001 2-5km 16,889 Count 2001 Census 2001 5-10km 8,343 Count 2001 Census 2001 10-20km 9,504 Count 2001 Census 2001 20-30km 4,297 Count 2001 Census 2001 30-40km 1,353 Count 2001 Census 2001 40-60km 1,084 Count 2001 Census 2001
Con29 Distance to work by residents
60km and over 1,836 Count 2001 Census 2001
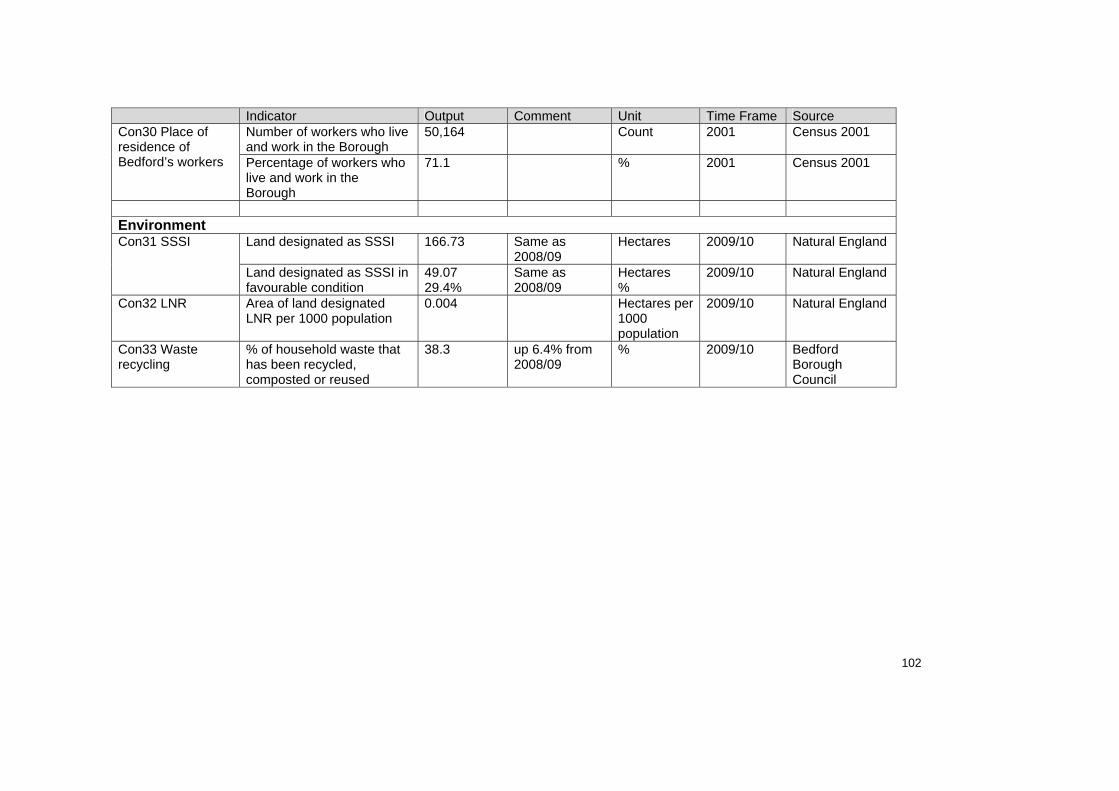
102
Indicator Output Comment Unit Time Frame Source Number of workers who live and work in the Borough
50,164 Count 2001 Census 2001 Con30 Place of residence of Bedford’s workers Percentage of workers who
live and work in the Borough
71.1 % 2001 Census 2001
Environment
Land designated as SSSI 166.73 Same as 2008/09
Hectares 2009/10 Natural England Con31 SSSI
Land designated as SSSI in favourable condition
49.07 29.4%
Same as 2008/09
Hectares %
2009/10 Natural England
Con32 LNR Area of land designated LNR per 1000 population
0.004 Hectares per 1000 population
2009/10 Natural England
Con33 Waste recycling
% of household waste that has been recycled, composted or reused
38.3 up 6.4% from 2008/09
% 2009/10 Bedford Borough Council

103
Appendix C: National, Regional and Local Targets Where the target
is from Target Indicator that will
monitor the target National PPS3 (Nov 2006) 60% of new housing should be
provided on previously developed land
Core Output Indicator H3
PPS3 (Nov 2006) Minimum density of 30 dwellings per hectare
Local Output Indicator 23
PPG13 (March 2001)
Maximum car parking standards No Indicator
PPG17 (July 2002) Local Authorities must set robust local space standards
Local Output Indicator 19
PPS22 (Aug 2004) Generate 10% of UK electricity from renewable energy sources by 2010, 20% by 2020
Core Output Indicator E3
Air Quality Strategy for England (July 2007)
National objectives and targets for 13 different pollutants
Local Output Indicator 21
DEFRA Public Service Agreement
Bring into favourable condition by 2010 95% of all nationally important wildlife sites
Local Output Indicator 5
Regional RSS Implementation and Monitoring Framework (July 2008)
To concentrate the majority of development in or adjacent to the Key Centres for Development and Change (Bedford, Kempston and the northern Marston Vale)
Local Output Indicator 4
RSS Implementation and Monitoring Framework (July 2008)
To increase the number and proportion of journeys made by public transport and walking, cycling and other non motorised transport
Local Output Indicators 17 & 25
RSS Implementation and Monitoring Framework (July 2008)
To increase the proportion of the region’s freight movement carried on rail
No indicator
RSS Implementation and Monitoring Framework (July 2008)
Reduce CO2 emissions below 1990 levels by at least 26% by 2020 and at least 60% by 2050 in line with national targets
No indicator
RSS Implementation and Monitoring Framework (July 2008)
10% (minimum) of energy consumed in new development from renewable sources
No indicator
RSS Implementation and Monitoring Framework (July 2008)
Installed capacity for renewable energy by 2010 at least 820 megawatts, by 2020 at least 1620 megawatts
Core Output Indicator E3
RSS Implementation and Monitoring Framework (July
Decrease the amount of development occurring in floodplains, other areas of risk
Core Output Indicator E1

104
Where the target is from
Target Indicator that will monitor the target
2008) from flooding and areas where development would increase the risk of flooding elsewhere
RSS Implementation and Monitoring Framework (July 2008)
Policy H1 target: 19,500 dwellings April 2001-March 2021 in the Growth Area (includes Mid Bedfordshire) and 1300 in the rest of Bedford Borough
Core Output Indicator H1
RSS Implementation and Monitoring Framework (July 2008)
To ensure that some 35% of new dwellings coming forward as a result of planning permissions granted after adoption of the Plan in 2008 is affordable.
Core Output Indicator H5 Local Output Indicator 9
RSS Implementation and Monitoring Framework (July 2008
Gypsy and traveller pitch provision targets to be determined by single issue review.
Core Output Indicator H4
RSS Implementation and Monitoring Framework (July 2008
To ensure that sufficient sites are provided to cater for all relevant business sectors and clusters in order to meet the needs of the local economy as identified in employment land reviews. (Policy E1 states an indicative target for net growth in jobs of 27,000 in Bedford/Mid Beds)
Core Output Indicator BD1 Core Output Indicator BD4 Local Output Indicator 14
RSS Implementation and Monitoring Framework (July 2008
Reduce the need to commute to work and ensure a greater labour supply and demand balance at sub-regional level
Local Output Indicator 14 Contextual Indicator 15
RSS Implementation and Monitoring Framework (July 2008
To direct priorities for improvements in inter-urban transport to, inter alia, facilitate access to London
Local Output Indicator 3
RSS Implementation and Monitoring Framework (July 2008)
To deliver the transport investment priorities identified as currently programmed in: The current programme by the programmed date, the Regional Investment Strategy
Local Output Indicator 3
RSS Implementation and Monitoring Framework (July 2008)
To improve journey reliability and safety
No indicator
RSS Implementation and Monitoring Framework (July 2008)
To increase the proportion of households with public transport access to core services
Local Output Indicators 10, 11 & 17
RSS Implementation and Monitoring Framework (July
Housing development no less than 30 dwellings per hectare
Local Output Indicator 23

105
Where the target is from
Target Indicator that will monitor the target
2008) RSS Implementation and Monitoring Framework (July 2008)
Increase woodland cover in particular in Thames Chase, Watling Chase and Forest of Marston Vale Community Forests by 30% by 2030
Local Output Indicator 6
RSS Implementation and Monitoring Framework (July 2008)
To achieve the overall regional target of 60% of housing and employment development on previously developed land
Core Output Indicator BD2 Core Output Indicator H3
RSS Implementation and Monitoring Framework (July 2008)
To maintain, restore and create habitats by 2010 in accordance with the East of England priority habitat targets set out in appendix B of the East of England Plan.
Core Output Indicator E2
RSS Implementation and Monitoring Framework (July 2008)
To maintain and increase the region’s network of green infrastructure
Core Output Indicator E1 & E2 Local Output Indicator 20
RSS Implementation and Monitoring Framework (July 2008)
Per capita day water consumption target to be defined to achieve savings of at least 25% in water use 2006-21 in new development and at least 8% in existing development (to be monitored against a domestic consumption target of 105 litres per head per day)
No indicator
RSS Implementation and Monitoring Framework (July 2008)
To reduce the level of waste imports by 2021 as indicated in Policy WM3
No indicator
RSS Implementation and Monitoring Framework (July 2008)
To plan for the quantity of waste arising shown in Policy WM4
No indicator
RSS Implementation and Monitoring Framework (July 2008)
Recycle/recover 50% of municipal waste by 2010 and 70% by 2015. Recycle/recover 72% of commercial and industrial waste by 2010 and 75% by 2015. Eliminate the land filling of untreated municipal and commercial waste in the region by 2021.
Local Output Indicator 8
RSS Implementation and Monitoring Framework (July 2008)
Reduce waste arising per head and reduce overall waste growth to 1% pa by 2010 and 0.5% pa by 2020.
Local Output Indicator 8
MKSM 16,270 dwellings in the Growth Area in the period 2001-21
Core Output Indicator H1

106
Where the target is from
Target Indicator that will monitor the target
A Sustainable Framework for the East of England
14% of electricity from renewable energy sources by 2010
Core Output Indicator E3
Local The Bedfordshire Authorities Municipal Waste Management Strategy
Improve recycling performance to meet government targets
Local Output Indicator 8
Renewable Energy Policy and Practice Guidance for Bedfordshire 2002
Targets for 2010: Wind 64 GWh Biomass 200 GWh Landfill 303 GWh PV 7.7 GWh
Core Output Indicator E3
Local Transport Plan 2006/07-2010-11
Complete 95% of the strategic network of cycle routes by 2010/11
Local Output Indicator 24
Local Transport Plan 2006/07-2010-11
15% increase in bus patronage on local buses
Local Output Indicator 25
Housing Strategy 2004-7
Secure/deliver 200 new affordable homes per annum
Core Output Indicator H5
Housing Strategy 2004-7
30 empty homes per annum to habitable standards and ready for occupation
Local Output Indicator 22
Air Quality in Bedford Borough 2007 Final Report
Monitor air quality against national targets for NO2 and SO2 in the relevant 4 AQMAs.
Local Output Indicator 21
Bedfordshire and Luton Biodiversity Action Plan 2001
Various targets Core Output Indicator E2
Mobility Housing Planning Guidance (September 2002)
10% of new housing should be mobility housing
Local Output Indicator 26 and 27
Local Plan Car parking density of up to 70 car spaces per hectare in residential developments
Local Output Indicator 2
Core Strategy and Rural Issues Plan
Deliver the planned growth in Bedford, Kempston and Northern Marston Vale to achieve a step change in the borough’s role in the region
Core Output Indicator H2 & H4 Local Output Indicator L4 & L14
Core Strategy and Rural Issues Plan
Ensure future development is based upon sustainable development principles
Local Output Indicator L4
Core Strategy and Rural Issues Plan
Provide guidance on where future growth should occur (in the period up to 2021)
Local Output Indicator L4
Core Strategy and Rural Issues Plan
Provide quality housing to meet current and future needs of all sectors of the community
Core Output Indicator H2, H4 & H5
Core Strategy and Foster significant employment Core Output Indicator BD3
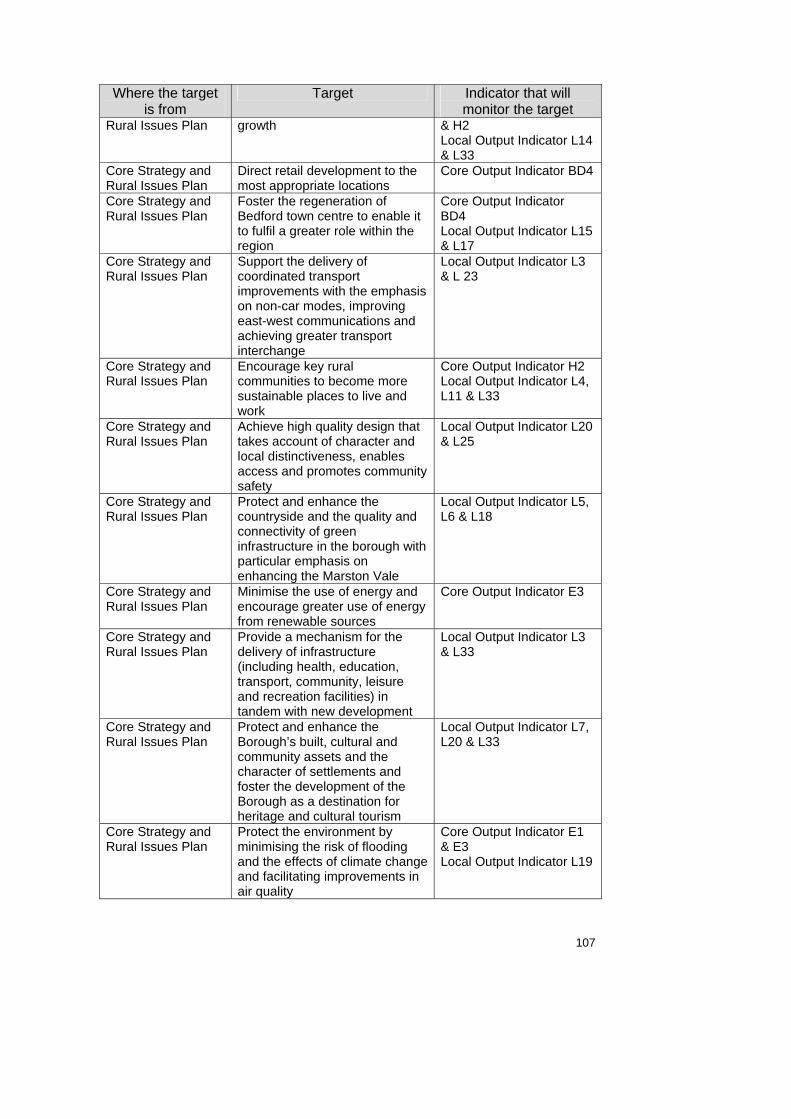
107
Where the target is from
Target Indicator that will monitor the target
Rural Issues Plan growth & H2 Local Output Indicator L14 & L33
Core Strategy and Rural Issues Plan
Direct retail development to the most appropriate locations
Core Output Indicator BD4
Core Strategy and Rural Issues Plan
Foster the regeneration of Bedford town centre to enable it to fulfil a greater role within the region
Core Output Indicator BD4 Local Output Indicator L15 & L17
Core Strategy and Rural Issues Plan
Support the delivery of coordinated transport improvements with the emphasis on non-car modes, improving east-west communications and achieving greater transport interchange
Local Output Indicator L3 & L 23
Core Strategy and Rural Issues Plan
Encourage key rural communities to become more sustainable places to live and work
Core Output Indicator H2 Local Output Indicator L4, L11 & L33
Core Strategy and Rural Issues Plan
Achieve high quality design that takes account of character and local distinctiveness, enables access and promotes community safety
Local Output Indicator L20 & L25
Core Strategy and Rural Issues Plan
Protect and enhance the countryside and the quality and connectivity of green infrastructure in the borough with particular emphasis on enhancing the Marston Vale
Local Output Indicator L5, L6 & L18
Core Strategy and Rural Issues Plan
Minimise the use of energy and encourage greater use of energy from renewable sources
Core Output Indicator E3
Core Strategy and Rural Issues Plan
Provide a mechanism for the delivery of infrastructure (including health, education, transport, community, leisure and recreation facilities) in tandem with new development
Local Output Indicator L3 & L33
Core Strategy and Rural Issues Plan
Protect and enhance the Borough’s built, cultural and community assets and the character of settlements and foster the development of the Borough as a destination for heritage and cultural tourism
Local Output Indicator L7, L20 & L33
Core Strategy and Rural Issues Plan
Protect the environment by minimising the risk of flooding and the effects of climate change and facilitating improvements in air quality
Core Output Indicator E1 & E3 Local Output Indicator L19

108
Where the target is from
Target Indicator that will monitor the target
Core Strategy and Rural Issues Plan
Involve the community in the decisions about the planning of the borough so they can influence and shape such decisions
Local Output Indicator L33
Town Centre Area Action Plan
To provide a framework for the regeneration of the town centre
Core Output Indicator BD4
Town Centre Area Action Plan
To sustain and enhance the vitality and viability of the town centre as a whole whilst promoting reinvestment in the existing retail centre including the High Street
Core Output Indicator BD4
Town Centre Area Action Plan
To create a more diverse and vital mix of uses including a major increase in the town’s retail offer
Core Output Indicator BD4
Town Centre Area Action Plan
To achieve the successful integration of new development with the existing town centre
Core Output Indicator BD4
Town Centre Area Action Plan
To strengthen the economy of the town centre and its role as an employment, administrative and educational centre
Core Output Indicator BD3, BD3 & BD4
Town Centre Area Action Plan
To improve access to the town centre through the provision of new public transport interchanges, new highway infrastructure, public transport priority when feasible, the use of park and ride facilities and improved facilities for pedestrians, cyclists, taxis and private hire vehicles. Where and when highway capacity can be increased, priority whould be given to modes other than private cars
Local Output Indicator L2, L17, L24, & L34
Town Centre Area Action Plan
To improve the number and quality of the connections within the town centre, and between the centre and the river and railway station
Local Output Indicator L17, L24 & L34
Town Centre Area Action Plan
To achieve a significant growth in town centre living in order to enhance the vitality and viability of the centre
Local Output Indicator L34
Town Centre Area Action Plan
To provide affordable housing in a managed town centre reflecting the needs of the community with the aim of securing a mixed and balanced
Core Output Indicator H5

109
Where the target is from
Target Indicator that will monitor the target
town centre community Town Centre Area Action Plan
To protect, promote and enhance Bedford’s natural and built heritage, cultural attractions and role as a tourist destination as an integral part of the strategy to regenerate the town centre
Local Output Indicator L20
Town Centre Area Action Plan
To achieve high quality urban design with high quality materials and finishes
Local Output Indicator L20
Town Centre Area Action Plan
To create a town centre which is safe, attractive and in which people will want to live, shop, work and spend their leisure time
Local Output Indicator L20
Town Centre Area Action Plan
To achieve high quality public realm improvements including provision for management and maintenance
Local Output Indicator L19 & L20
Town Centre Area Action Plan
To ensure that new development and other partner agencies contribute to the delivery of the Council’s strategy for the town centre as a whole, including the provision of infrastructure
Local Output Indicator L34

110
Appendix D: Use Classes Order 2006 Use Class Use/Description of development A1 Shops Retail sale of goods to the public – Shops, Post Offices, Travel
Agencies and Ticket Agencies, Hairdressers, Funeral Director and Undertakers, Domestic Hire Shops, Dry Cleaners, Sandwich Bars – Sandwiches or other cold food purchased and consumed off the premises, Internet Cafes
A2 Financial and Professional Services
Financial Services – Banks, Building Societies and Bureau de Change, Professional Services (Other than Health and Medical Services) – Estate agents and Employment Agencies. Other Services – Betting Shops, Principally where services are provided to visiting members of the public.
A3 Restaurants and Cafes
Restaurants and Cafes – Use for the sale of food for consumption on the premises. Excludes Internet Cafes.
A4 Drinking Establishments
Use as a Public House, Wine Bar or other Drinking Establishment.
A5 Hot Food Takeaway
Use for the sale of hot food for consumption on the premises.
B1 Business (a) Offices other than in a use within Class A2 (b) Research and Development – Laboratories, Studios (c) Light Industry
B2 General Industrial General Industry (Other than classified as in B1). B8 Storage and
Distribution Storage or Distribution Centres – Wholesale Warehouses, Distribution Centres and Repositories.
C1 Hotels Hotels, Boarding Houses and Guest Houses. Development falls within this class if ‘no significant element of care is provided’.
C2 Residential Institutions
Hospitals, Nursing Homes, Residential Education and Training Centres. Use for the provision of residential accommodation and care to people in need of care.
C3 Dwelling houses Dwellings for individuals, families or not more than six people living together as a single household. Not more than six people living together includes – students or young people sharing a dwelling and small group homes for disabled or handicapped people living together in the community.
D1 Non-Residential Institutions
Medical and Health Centres – Clinics and Health Centres, Crèche, Day Nursery, Day Centres and Consulting Rooms (not attached to the Consultants or Doctors house), Museums, Public Libraries, Art Galleries, Exhibition Halls, Non-residential Education and Training Centres, Places of Worship, Religious Instruction and Church Halls.
D2 Assembly and Leisure
Cinemas, Dance and Concert Halls, Sports Halls, Swimming Baths, Skating rinks, Gymnasiums, Bingo Halls and Casinos, Other Indoor and Outdoor Sports and Leisure Uses, not involving motorised vehicles or firearms.
Sui Generis For example: Retail Warehouse Clubs, Amusement Arcades, Launderettes, Petrol Filling Stations, Taxi Businesses, Car/Vehicle Hire Businesses and the Selling and Displaying of Motor Vehicles, Nightclubs, Theatres, Hostels, Builders Yards, Garden Centres.
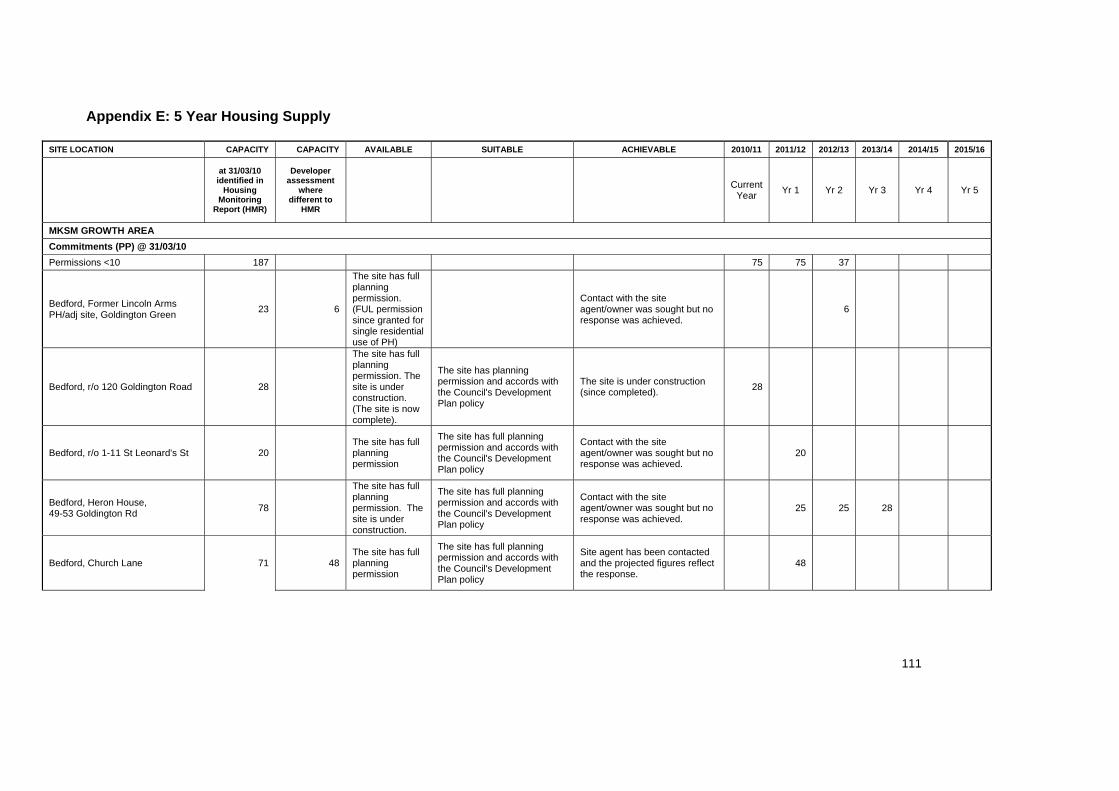
111
Appendix E: 5 Year Housing Supply
SITE LOCATION CAPACITY CAPACITY AVAILABLE SUITABLE ACHIEVABLE 2010/11 2011/12 2012/13 2013/14 2014/15 2015/16
at 31/03/10 identified in
Housing Monitoring
Report (HMR)
Developer assessment
where different to
HMR
Current Year Yr 1 Yr 2 Yr 3 Yr 4 Yr 5
MKSM GROWTH AREA Commitments (PP) @ 31/03/10 Permissions <10 187 75 75 37
Bedford, Former Lincoln Arms PH/adj site, Goldington Green 23 6
The site has full planning permission. (FUL permission since granted for single residential use of PH)
Contact with the site agent/owner was sought but no response was achieved.
6
Bedford, r/o 120 Goldington Road 28
The site has full planning permission. The site is under construction. (The site is now complete).
The site has planning permission and accords with the Council's Development Plan policy
The site is under construction (since completed). 28
Bedford, r/o 1-11 St Leonard's St 20 The site has full planning permission
The site has full planning permission and accords with the Council's Development Plan policy
Contact with the site agent/owner was sought but no response was achieved.
20
Bedford, Heron House, 49-53 Goldington Rd 78
The site has full planning permission. The site is under construction.
The site has full planning permission and accords with the Council's Development Plan policy
Contact with the site agent/owner was sought but no response was achieved.
25 25 28
Bedford, Church Lane 71 48 The site has full planning permission
The site has full planning permission and accords with the Council's Development Plan policy
Site agent has been contacted and the projected figures reflect the response.
48

112
Bedford, r/o 29-45 St Cuthbert's St 14 The site has full planning permission.
The site has planning permission and accords with the Council's Development Plan policy
Contact with the site agent/owner was sought but no response was achieved.
14
Kempston, r/o Harriers Way 13 19
The site has outline planning permission (FUL permission for 19 dws since granted on appeal)
The site has planning permission and accords with the Council's Development Plan policy
Site agent has been contacted and the projected figures reflect the response.
6 13
Elstow, Land off Abbeyfields 12 The site has full planning permission.
The site has planning permission and accords with the Council's Development Plan policy
Contact with the site agent/owner was sought but no response was achieved.
12
Elstow, land off Romsey Way 36 28
The site has outline planning permission. (REM since granted for 28 dws)
The site has planning permission and accords with the Council's Development Plan policy
Site agent has been contacted and the projected figures reflect the response.
28
Renhold, Norse Road III 321
The site has full planning permission. (The site is under construction)
The site has full planning permission and accords with the Council's Development Plan policy
Contact with the site agent/owner was sought but no response was achieved.
60 40 40 40 40
Eastcotts, Shortstown, r/o Sheds 425 400
The site has outline planning permission. (REM for 371 pending consideration)
The site has planning permission and accords with the Council's Development Plan policy
Site agent has been contacted and the projected figures reflect the response.
75 100 100 125
Stewartby, Hostel site, Ampthill Road 80
The site has outline planning permission.
The site has planning permission and accords with the Council's Development Plan policy
Site agent has been contacted and the projected figures reflect the response.
30 50
LP sites with PP @31/03/10

113
Bedford, Britannia Works, Phase C 56
The site is allocated underpolicy H2 of the LP and has full planning permission. The site is under construction.
The site has full planning permission and accords with the Council's Development Plan policy
Site agent has been contacted and the projected figures reflect the response.
56
Kempston Mill, Mill Lane 46
The site has full planning permission. The site is under construction.
The site has full planning permission and accords with the Council's Development Plan policy
Contact with the site agent/owner was sought but no response was achieved.
18 12 16
Kempston, Austin Canons, Phase 2 24
The site is allocated underpolicy H3 of the LP and has full planning permission.
The site has full planning permission and accords with the Council's Development Plan policy
Site agent has been contacted and the projected figures reflect the response.
24
Great Denham / Biddenham Loop 1408 1464
The site is allocated underpolicy H6of the LP and has outline and reserved matters planning permission. The site is under construction.
The site has full planning permission and accords with the Council's Development Plan policy
Site agent has been contacted and the projected figures reflect the response.
145 225 230 175 192 192
Land west of Kempston 1250 1205
The site is allocated underpolicy H7 of the LP and has outline and reserved matters planning permission. The site is under construction.
The site has full planning permission and accords with the Council's Development Plan policy
Site agent has been contacted and the projected figures reflect the response.
42 154 258 260 202 46

114
Land at Shortstown 970
The site is allocated underpolicy H9 of the LP and has outline and reserved matters planning permission. The site is under construction.
The site has full planning permission and accords with the Council's Development Plan policy
Site agent has been contacted and the projected figures reflect the response.
65 100 100 100 100 100
Land at Shortstown (Frontier) 130 107
The site is allocated underpolicy H9 of the LP. The site has outline planning permission. (REM for 107 pending consideration).
The site has planning permission and accords with the Council's Development Plan policy
Site agent has been contacted and the projected figures reflect the response.
80 27
North of Norse Road 18
The site is allocated under policy H10b of the LP and has full planning permission. The site is under construction.
The site has full planning permission and accords with the Council's Development Plan policy
Site agent has been contacted and the projected figures reflect the response.
8 10
North of Brickhill 178
The site is allocated underpolicy H10a of the LP and has full planning permission. The site is under construction.
The site has full planning permission and accords with the Council's Development Plan policy
Contact with the site agent/owner was sought but no response was achieved.
75 70 33
Wixams 2051
The site is allocated underpolicy H14 of the LP and has outline and reserved matters planning
The site has full planning permission and accords with the Council's Development Plan policy
Site agent has been contacted and the projected figures reflect the response.
210 193 151 200 200 200

115
permission. The site is under construction.
Land at Stewartby 610
The site is allocated underpolicy H13 of the LP. The site has outline planning permission.
The site has planning permission and accords with the Council's Development Plan policy
Site agent has been contacted and the projected figures reflect the response.
60 100 100 100
Wootton, Fields Road North 34 34
The site is allocated underpolicy H12 of the LP. The site has outline planning permission. (REM since granted for 34 dws)
The site has planning permission and accords with the Council's Development Plan policy
Site agent has been contacted and the projected figures reflect the response.
34
LDF TCAAP sites with PP @31/03/10
Bedford, BT Tower 153 107
The site has full planning permission. The site is under construction.
The site has full planning permission and accords with the Council's Development Plan policy
Site agent has been contacted and the projected figures reflect the response.
51 56 46
LP sites with resolution to grant PP (s106) @31/03/10
Bedford, Britannia Works, Phase E 255
The site is allocated underpolicy H2 of the LP. Full planning permission granted subject to S106. (An appeal has since been dismissed)
The site is allocated in the LP and is in a location which will contribute to the creation of sustainable mixed communities
Site agent has been contacted and the projected figures reflect the response.
90 78 87

116
Land north of Bromham Rd, Biddenham 1200
The site is allocated underpolicy H8 of the LP. Outline planning permission granted subject to S106.
The site has planning permission subject to S106 and accords with the Council's Development Plan policy
Site agent has been contacted and the projected figures reflect the response.
50 100 200 200 156
Wootton, Fields Road North 550
The site is allocated underpolicy H12 of the LP. Outline planning permission granted subject to S106.
The site has planning permission subject to S106 and accords with the Council's Development Plan policy
Contact with the site agent/owner was sought but no response was achieved.
60 60 60 60
Wootton, Fields Road South 500
The site is allocated underpolicy H11 of the LP. Outline planning permission granted subject to S106.
The site has planning permission subject to S106 and accords with the Council's Development Plan policy
Site agent has been contacted and the projected figures reflect the response.
40 50 50
LDF TCAAP sites with resolution to grant PP (s106) @31/03/10 0 Other sites with resolution to grant PP (s106) @31/03/10 Small site (net) 9 9
Wilstead, North End Farm/Seasons Car Park, Bedford Rd
39
The site has outline planning permission subject to S106
The site has planning permission subject to S106 and accords with the Council's Development Plan policy
Site agent has been contacted and the projected figures reflect the response.
19 20
LP sites without PP @31/03/10
H2 Britannia Works, Phase F 100 105
The site is allocated underpolicy H2 of the LP.
The site is allocated in the LP and is in a location which will contribute to the creation of sustainable mixed communities
Site agent has been contacted and the projected figures reflect the response.
80 25
LDF TCAAP sites without PP @31/03/10
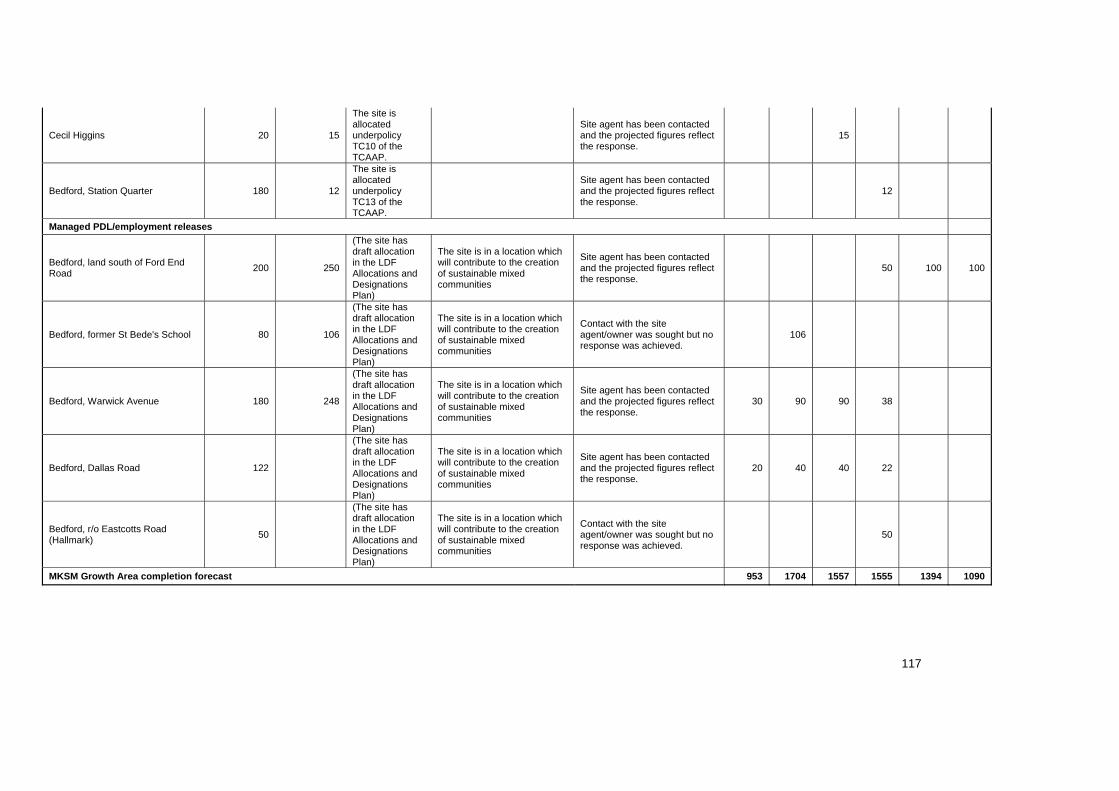
117
Cecil Higgins 20 15
The site is allocated underpolicy TC10 of the TCAAP.
Site agent has been contacted and the projected figures reflect the response.
15
Bedford, Station Quarter 180 12
The site is allocated underpolicy TC13 of the TCAAP.
Site agent has been contacted and the projected figures reflect the response.
12
Managed PDL/employment releases
Bedford, land south of Ford End Road 200 250
(The site has draft allocation in the LDF Allocations and Designations Plan)
The site is in a location which will contribute to the creation of sustainable mixed communities
Site agent has been contacted and the projected figures reflect the response.
50 100 100
Bedford, former St Bede's School 80 106
(The site has draft allocation in the LDF Allocations and Designations Plan)
The site is in a location which will contribute to the creation of sustainable mixed communities
Contact with the site agent/owner was sought but no response was achieved.
106
Bedford, Warwick Avenue 180 248
(The site has draft allocation in the LDF Allocations and Designations Plan)
The site is in a location which will contribute to the creation of sustainable mixed communities
Site agent has been contacted and the projected figures reflect the response.
30 90 90 38
Bedford, Dallas Road 122
(The site has draft allocation in the LDF Allocations and Designations Plan)
The site is in a location which will contribute to the creation of sustainable mixed communities
Site agent has been contacted and the projected figures reflect the response.
20 40 40 22
Bedford, r/o Eastcotts Road (Hallmark) 50
(The site has draft allocation in the LDF Allocations and Designations Plan)
The site is in a location which will contribute to the creation of sustainable mixed communities
Contact with the site agent/owner was sought but no response was achieved.
50
MKSM Growth Area completion forecast 953 1704 1557 1555 1394 1090
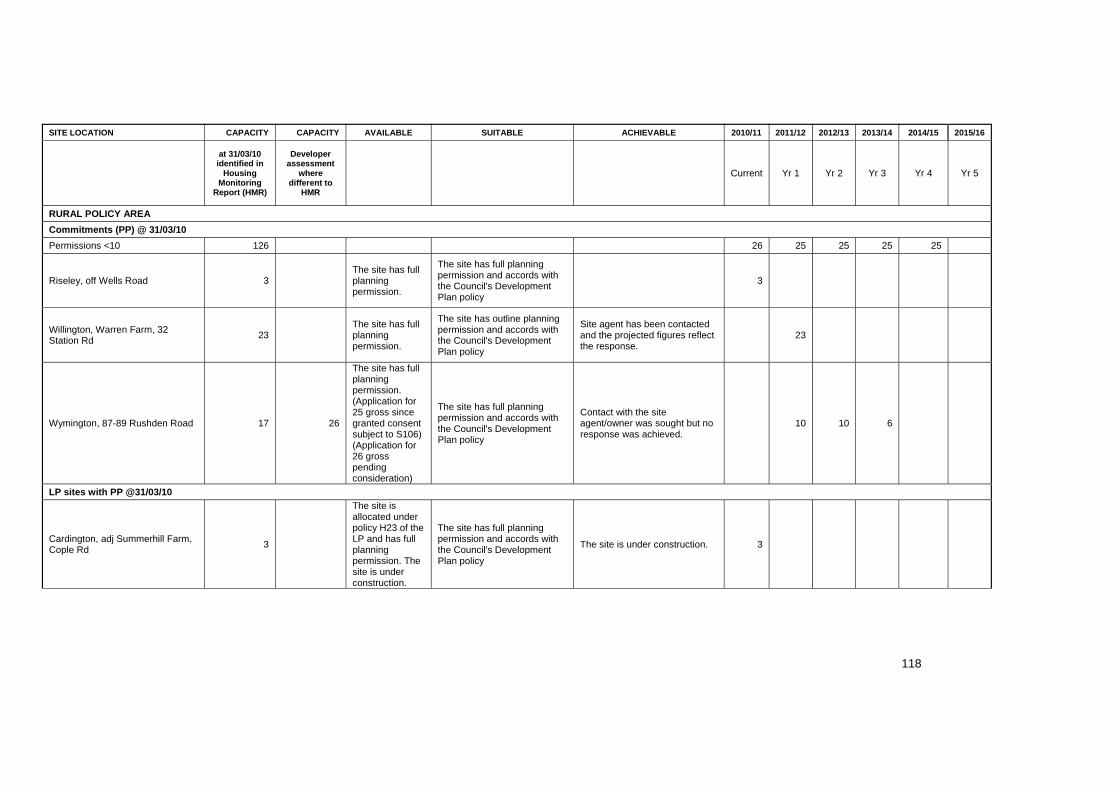
118
SITE LOCATION CAPACITY CAPACITY AVAILABLE SUITABLE ACHIEVABLE 2010/11 2011/12 2012/13 2013/14 2014/15 2015/16
at 31/03/10 identified in
Housing Monitoring
Report (HMR)
Developer assessment
where different to
HMR
Current Yr 1 Yr 2 Yr 3 Yr 4 Yr 5
RURAL POLICY AREA Commitments (PP) @ 31/03/10 Permissions <10 126 26 25 25 25 25
Riseley, off Wells Road 3 The site has full planning permission.
The site has full planning permission and accords with the Council's Development Plan policy
3
Willington, Warren Farm, 32 Station Rd 23
The site has full planning permission.
The site has outline planning permission and accords with the Council's Development Plan policy
Site agent has been contacted and the projected figures reflect the response.
23
Wymington, 87-89 Rushden Road 17 26
The site has full planning permission. (Application for 25 gross since granted consent subject to S106) (Application for 26 gross pending consideration)
The site has full planning permission and accords with the Council's Development Plan policy
Contact with the site agent/owner was sought but no response was achieved.
10 10 6
LP sites with PP @31/03/10
Cardington, adj Summerhill Farm, Cople Rd 3
The site is allocated under policy H23 of the LP and has full planning permission. The site is under construction.
The site has full planning permission and accords with the Council's Development Plan policy
The site is under construction. 3

119
Clapham Folly, The Glebe 5
The site is allocated under policy H17 of the LP and has full planning permission
The site has full planning permission and accords with the Council's Development Plan policy
Contact with the site agent/owner was sought but no response was achieved.
5
Great Barford, College Farm,High St 27
The site is allocated under policy H18 of the LP and has full planning permission. The site is under construction
The site has full planning permission and accords with the Council's Development Plan policy
Contact with the site agent/owner was sought but no response was achieved.
27
Riseley, Keysoe Road 2
The site is allocated under policy H23 of the LP and has full planning permission.
The site has full planning permission and accords with the Council's Development Plan policy
2
Eastcotts, r/o115 High Rd, Cotton End 12
The site has full planning permission. The site is under construction (since completed)
The site has full planning permission and accords with the Council's Development Plan policy
Site agent has been contacted and the projected figures reflect the response.
12
LP sites with resolution to grant PP (s106) @31/03/10 Small site (net) 5 5 Windfall 35
Rural Policy Area completion forecast 71 65 40 31 25 35
Boroughwide completion forecast 2001-2009/10 5015 1024 1769 1597 1586 1419 1125
Borough
5 year supply
7496